electronics Article Radar-Based Hand Gesture Recognition Using Spiking Neural Networks Ing Jyh Tsang 1, *, Federico Corradi 2 , Manolis Sifalakis 2 , Werner Van Leekwijck 1 and Steven Latré 1 Citation: Tsang, I.J.; Corradi, F.; Sifalakis, M.; Van Leekwijck, W.; Latré, S. Radar-Based Hand Gesture Recognition Using Spiking Neural Networks. Electronics 2021, 10, 1405. https://doi.org/10.3390/electronics 10121405 Academic Editor: Flavio Canavero Received: 30 April 2021 Accepted: 9 June 2021 Published: 11 June 2021 Publisher’s Note: MDPI stays neutral with regard to jurisdictional claims in published maps and institutional affil- iations. Copyright: © 2021 by the authors. Licensee MDPI, Basel, Switzerland. This article is an open access article distributed under the terms and conditions of the Creative Commons Attribution (CC BY) license (https:// creativecommons.org/licenses/by/ 4.0/). 1 IDLab-Department of Computer Science, University of Antwerp-IMEC, Sint-Pietersvliet 7, 2000 Antwerp, Belgium; [email protected] (W.V.L.); [email protected] (S.L.) 2 IMEC Nederland, Holst Centre High Tech Campus 31, 5656 AE Eindhoven, The Netherlands; [email protected] (F.C.); [email protected] (M.S.) * Correspondence: [email protected] Abstract: We propose a spiking neural network (SNN) approach for radar-based hand gesture recognition (HGR), using frequency modulated continuous wave (FMCW) millimeter-wave radar. After pre-processing the range-Doppler or micro-Doppler radar signal, we use a signal-to-spike conversion scheme that encodes radar Doppler maps into spike trains. The spike trains are fed into a spiking recurrent neural network, a liquid state machine (LSM). The readout spike signal from the SNN is then used as input for different classifiers for comparison, including logistic regression, random forest, and support vector machine (SVM). Using liquid state machines of less than 1000 neurons, we achieve better than state-of-the-art results on two publicly available reference datasets, reaching over 98% accuracy on 10-fold cross-validation for both data sets. Keywords: radar; liquid state machine; spiking neural network; hand gesture recognition 1. Introduction Hand gesture recognition has been an active field of research due to the quest to provide a better, more efficient, and intuitive mechanism for human–computer interaction (HCI). Many different sensor modalities have been used to address this challenge, such as radar [1–3], cameras [4,5], dynamic vision sensors (DVS) [6–9], or electromyography (EMG) systems [10,11]. Moreover, several different machine learning techniques have been proposed to address HGR, such as a convolutional neural network (CNN) [12], long short-term memory (LSTM) [12,13], and spiking neural networks [8,11]. While advancement in image recognition systems makes frame-based cameras propi- tious for HGR, it has disadvantages, such as the need for proper illumination conditions, camera position, and additional image processing tasks such as segmentation to isolate the gestures from the background scene. Alternatively, event-based cameras, i.e., DVS, are designed as a neuromorphic event-based vision system and a natural fit to be used with SNNs [6–9]. However, they remain a relatively costly device. Therefore, we have focused on a radar sensor as it is cost-effective, and its form factor has been miniaturized to the point of fitting in smartphones, wristbands, or headphone devices [12,14]. Moreover, the radar signal is robust against adverse weather or illumination conditions, and it offers a better privacy-preserving system than vision sensors [15]. This paper focuses on radar-based hand gesture recognition systems using spiking neural networks, and we use the Soli [12] and Dop-NET [2,16] as reference datasets, which both are based on FMCW millimeter-wave radar. Moreover, in particular, we used a liquid state machine, a type of reservoir computer capable of universal approximation [17,18], and we used different readout maps [19], or detectors [20] to compare and perform the classification tasks. In summary, the contributions of this paper include: Electronics 2021, 10, 1405. https://doi.org/10.3390/electronics10121405 https://www.mdpi.com/journal/electronics

Welcome message from author
This document is posted to help you gain knowledge. Please leave a comment to let me know what you think about it! Share it to your friends and learn new things together.
Transcript
electronics
Article
Radar-Based Hand Gesture Recognition Using SpikingNeural Networks
Ing Jyh Tsang 1,*, Federico Corradi 2 , Manolis Sifalakis 2 , Werner Van Leekwijck 1 and Steven Latré 1
�����������������
Citation: Tsang, I.J.; Corradi, F.;
Sifalakis, M.; Van Leekwijck, W.;
Latré, S. Radar-Based Hand Gesture
Recognition Using Spiking Neural
Networks. Electronics 2021, 10, 1405.
https://doi.org/10.3390/electronics
10121405
Academic Editor: Flavio Canavero
Received: 30 April 2021
Accepted: 9 June 2021
Published: 11 June 2021
Publisher’s Note: MDPI stays neutral
with regard to jurisdictional claims in
published maps and institutional affil-
iations.
Copyright: © 2021 by the authors.
Licensee MDPI, Basel, Switzerland.
This article is an open access article
distributed under the terms and
conditions of the Creative Commons
Attribution (CC BY) license (https://
creativecommons.org/licenses/by/
4.0/).
1 IDLab-Department of Computer Science, University of Antwerp-IMEC, Sint-Pietersvliet 7,2000 Antwerp, Belgium; [email protected] (W.V.L.); [email protected] (S.L.)
2 IMEC Nederland, Holst Centre High Tech Campus 31, 5656 AE Eindhoven, The Netherlands;[email protected] (F.C.); [email protected] (M.S.)
* Correspondence: [email protected]
Abstract: We propose a spiking neural network (SNN) approach for radar-based hand gesturerecognition (HGR), using frequency modulated continuous wave (FMCW) millimeter-wave radar.After pre-processing the range-Doppler or micro-Doppler radar signal, we use a signal-to-spikeconversion scheme that encodes radar Doppler maps into spike trains. The spike trains are fedinto a spiking recurrent neural network, a liquid state machine (LSM). The readout spike signalfrom the SNN is then used as input for different classifiers for comparison, including logisticregression, random forest, and support vector machine (SVM). Using liquid state machines of lessthan 1000 neurons, we achieve better than state-of-the-art results on two publicly available referencedatasets, reaching over 98% accuracy on 10-fold cross-validation for both data sets.
Keywords: radar; liquid state machine; spiking neural network; hand gesture recognition
1. Introduction
Hand gesture recognition has been an active field of research due to the quest toprovide a better, more efficient, and intuitive mechanism for human–computer interaction(HCI). Many different sensor modalities have been used to address this challenge, suchas radar [1–3], cameras [4,5], dynamic vision sensors (DVS) [6–9], or electromyography(EMG) systems [10,11]. Moreover, several different machine learning techniques havebeen proposed to address HGR, such as a convolutional neural network (CNN) [12], longshort-term memory (LSTM) [12,13], and spiking neural networks [8,11].
While advancement in image recognition systems makes frame-based cameras propi-tious for HGR, it has disadvantages, such as the need for proper illumination conditions,camera position, and additional image processing tasks such as segmentation to isolatethe gestures from the background scene. Alternatively, event-based cameras, i.e., DVS,are designed as a neuromorphic event-based vision system and a natural fit to be usedwith SNNs [6–9]. However, they remain a relatively costly device. Therefore, we havefocused on a radar sensor as it is cost-effective, and its form factor has been miniaturizedto the point of fitting in smartphones, wristbands, or headphone devices [12,14]. Moreover,the radar signal is robust against adverse weather or illumination conditions, and it offersa better privacy-preserving system than vision sensors [15].
This paper focuses on radar-based hand gesture recognition systems using spikingneural networks, and we use the Soli [12] and Dop-NET [2,16] as reference datasets, whichboth are based on FMCW millimeter-wave radar. Moreover, in particular, we used a liquidstate machine, a type of reservoir computer capable of universal approximation [17,18],and we used different readout maps [19], or detectors [20] to compare and perform theclassification tasks.
In summary, the contributions of this paper include:
Electronics 2021, 10, 1405. https://doi.org/10.3390/electronics10121405 https://www.mdpi.com/journal/electronics
Electronics 2021, 10, 1405 2 of 20
1. We introduce a novel radar signal to spike representation, which, when used as inputto a liquid state machine with a classifier, achieves better than state-of-the-art resultsfor a radar-based HGR system.
2. We present a much simpler processing pipeline for gesture recognition than moststate-of-the-art neural-network solutions, with a small footprint in terms of neuronsand synapses, thus with great potential for energy efficiency. It is based on LSM,in which training is performed only at the readout layer, simplifying the overalllearning procedure and allowing easy personalization.
3. We conduct performance analysis of our approach, making extensive simulations todemonstrate how the size, input signal, and classifiers affect the system’s overall capability.
2. Datasets, Spike Encodings, and Network Configuration
This section gives an overview of the radar-based hand gesture recognition pipeline.First, Section 2.1 provides some background in radar systems. In particular, we detail theFMCW pipeline and how range-Doppler or micro-Doppler data are obtained from this typeof system. Moreover, Figure 1 depicts the process starting from the datasets, mapping thesections to the relevant steps of the pipeline. Sections 2.2 and 2.3 detail the used datasets.We describe the pre-processing and the neural encoding scheme to convert the radar signalto spike sequences required for the SNN in Section 2.4. Furthermore, Section 2.5 details theLSM architecture, the timing, and parameterization and explores two alternative ways theinput spike representation can be encoded and used in conjunction with the LSM. Finally,it discusses possible optimizations of the system.
Figure 1. Pipeline of the radar-based hand gesture recognition system, from the dataset to the endclassification, indicating the respective sections that detail each of the steps. The SNN and Classifierdiagram is detailed in Section 2.5.
2.1. Radar System
Radar systems exploit electromagnetic waves to detect and locate objects in theenvironment. A minimal radar system consists of a transmitter, a receiver, and signaland data processing modules. While there are many different types of radar systems,Shahzad et al. [21] identifies two types generally used for HGR, i.e., Pulsed and Continuous-Wave radars. We focus on FMCW systems [22,23], as these can be made with cheapsolid-state transmitters and can measure the range and radial velocity of the targets (hands-gestures). Both Soli and Dop-NET datasets are obtained using this radar technology.Figure 2 details the block diagram of an FMCW radar system, showing a basic radar systemwith one transmitter and one receiver and data processing modules after the ADC block.In FMCW, the transmit signal is a sinusoid whose frequency is swept linearly from a startfrequency fc to a maximum frequency fa, following a positive slope γ and duration ofTc, which determines a chirp. The linear frequency modulation (LFM) can have differ-ent waveforms, such as triangular, segmented linear, or sawtooth. Figure 3 shows thesimplest and most often used sawtooth function, which consists of a series of chirps over
Electronics 2021, 10, 1405 3 of 20
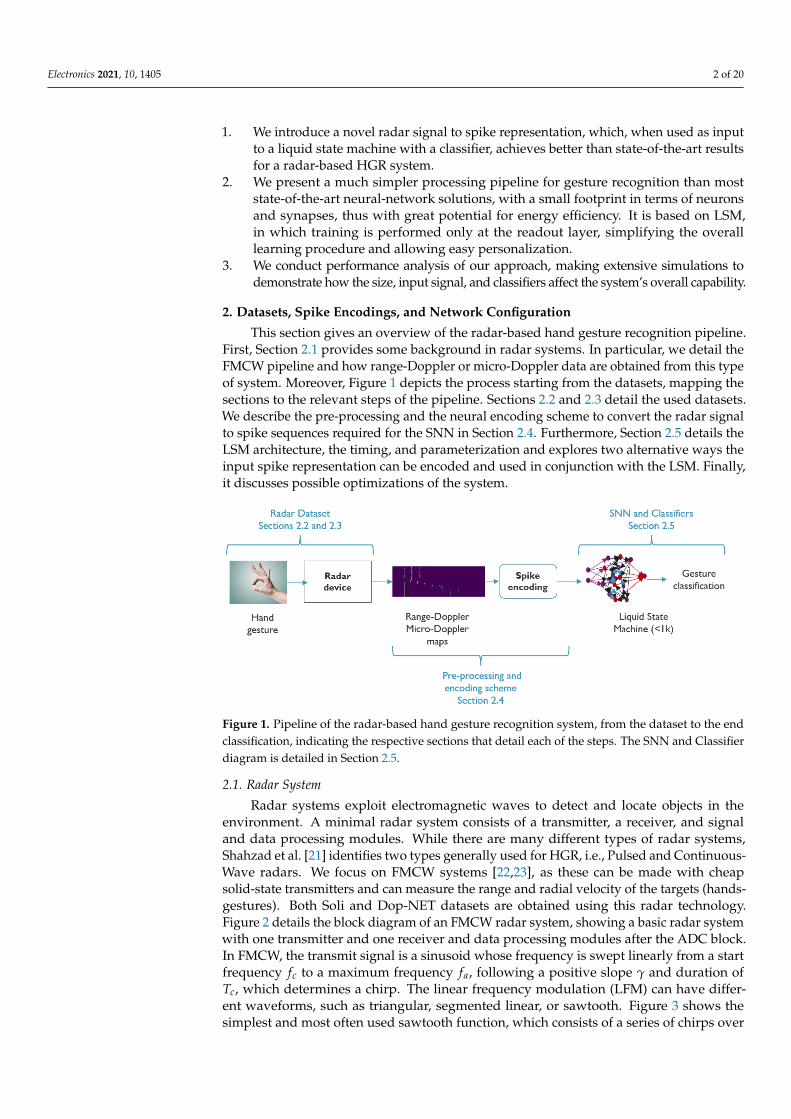
time. The difference between the transmitted and reflected signal from the output of thein-phase mixer, also known as the beat frequency fb or intermediate frequency (IF), is anew signal that can be measured to determine the distance, velocity, or angle of arrival ofreflected objects.
Figure 2. Radar block diagram: basic FMCW radar system with one transmitter and one receiver,depicting the typical linear sawtooth waveform and data processing modules after the ADC block.
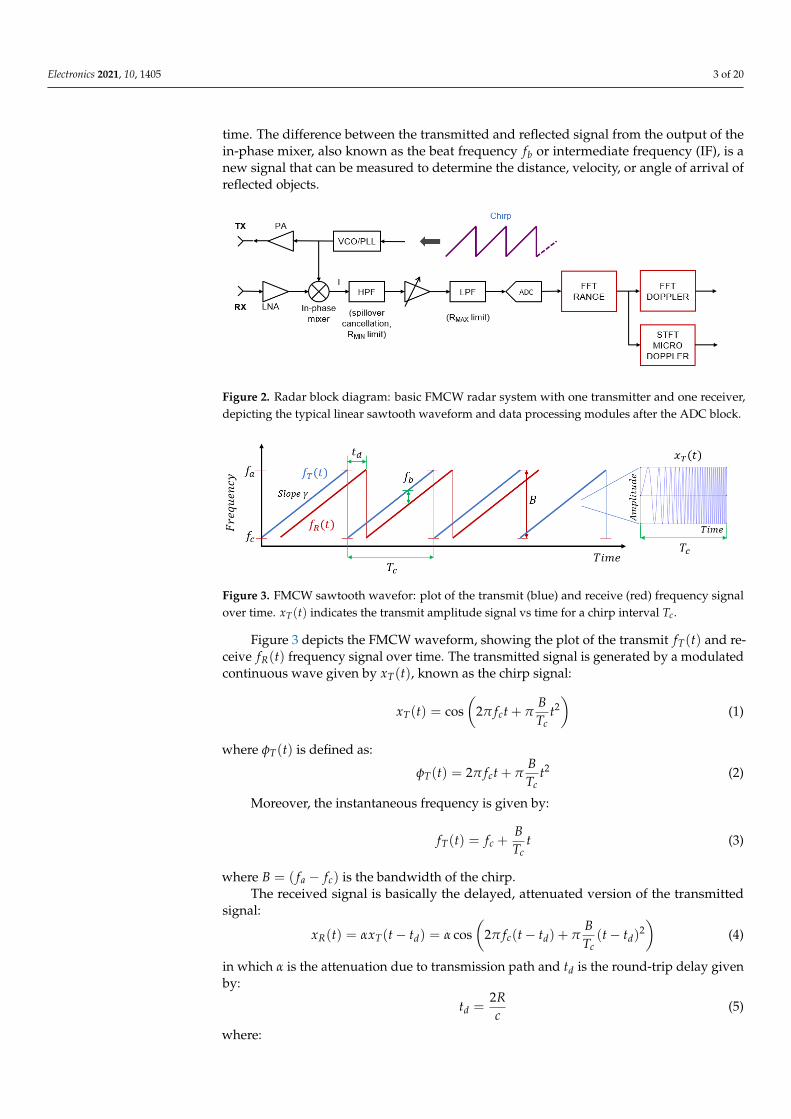
Figure 3. FMCW sawtooth wavefor: plot of the transmit (blue) and receive (red) frequency signalover time. xT(t) indicates the transmit amplitude signal vs time for a chirp interval Tc.
Figure 3 depicts the FMCW waveform, showing the plot of the transmit fT(t) and re-ceive fR(t) frequency signal over time. The transmitted signal is generated by a modulatedcontinuous wave given by xT(t), known as the chirp signal:
xT(t) = cos(
2π fct + πBTc
t2)
(1)
where φT(t) is defined as:
φT(t) = 2π fct + πBTc
t2 (2)
Moreover, the instantaneous frequency is given by:
fT(t) = fc +BTc
t (3)
where B = ( fa − fc) is the bandwidth of the chirp.The received signal is basically the delayed, attenuated version of the transmitted
signal:
xR(t) = αxT(t − td) = α cos(
2π fc(t − td) + πBTc
(t − td)2)
(4)
in which α is the attenuation due to transmission path and td is the round-trip delay givenby:
td =2Rc
(5)
where:
Electronics 2021, 10, 1405 4 of 20
R = range or distance to the objectc = speed of light
Finally, the IF signal after the mixer is a product of the receive and the transmit signalsand can be calculated by:
y(t) = xR(t)xT(t) = α cos (φT(t − td)) cos (φT(t)) (6)
y(t) =α
2[cos (φT(t − td)− φT(t)) + cos (φT(t − td) + φT(t))] (7)
where it can be shown that the IF signal is proportional to the round-trip delay:
y(t) ∝ 2π
(BTc
td
)t (8)
and the IF frequency is given by:
fb =
(2Rc
)(BTc
)(9)
After the ADC block, the IF signal is used for object detection, distance (range),and Doppler estimation, typically done by taking fast Fourier transforms (FFTs).
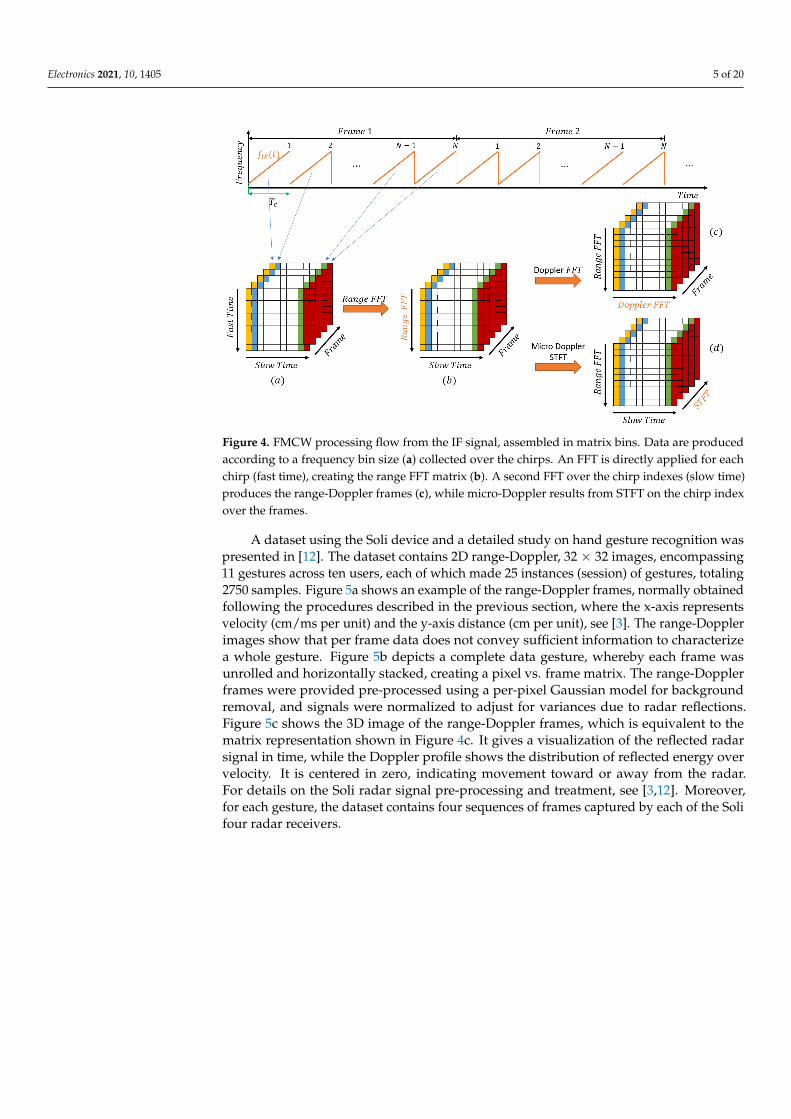
Figure 4 details the pipeline from the ADC block IF signal to the derivation of therange-Doppler or micro-Doppler frames [24]. The IF signal, which follows the typicalsawtooth waveform, is composed of chirps, where a frame is defined as a collection ofN chirps. For each chirp, data are collected according to a frequency bin size, Figure 4a.In general, an FFT is directly applied for each chirp (fast time), whereas the range bins arestored in the range FFT matrix, Figure 4b. Data from N chirps compose a frame. The range-Doppler frame is created when a second FFT is applied over the chirp indexes (slow time)on all the range FFT bins, Figure 4c. The Doppler profile is centered at zero, correspondingto no movement, whereas positive or negative values indicate motion towards or awayfrom the radar receiver. Micro-Doppler is obtained using a short-time Fourier transform(STFT) on a chirp index over the frames, Figure 4d. The STFT resolution is determinedby a window size, which gives a trade-off between the time resolution and the frequencyresolution. In general, instead of applying the STFT on a specific chirp index, the indexthat has the highest value is used for each frame, focusing on the object and creating themicro-Doppler over time spectrogram.
2.2. Soli Dataset
The Google Soli project introduced a novel 60 GHz FMCW millimeter-waveradar [3,12,25,26] to create a radar-based sensor optimized for human–computer interac-tion. The purpose was to develop a sensor for micro-interactions for mobile and wearablecomputing. A complete end-to-end system was developed, from hardware and softwareplatforms to a machine learning framework, up to the productization by integrating intothe Pixel 4 smartphones [27]. Soli is not present in the subsequent releases of the Pixelsmartphones. However, Google has recently introduced the second generation Nest Hub,using the Soli radar sensor for sleep tracking [28]. The Soli radar IC is a compact chip,which includes two transmit and four receive antenna elements [12].
Electronics 2021, 10, 1405 5 of 20
Figure 4. FMCW processing flow from the IF signal, assembled in matrix bins. Data are producedaccording to a frequency bin size (a) collected over the chirps. An FFT is directly applied for eachchirp (fast time), creating the range FFT matrix (b). A second FFT over the chirp indexes (slow time)produces the range-Doppler frames (c), while micro-Doppler results from STFT on the chirp indexover the frames.
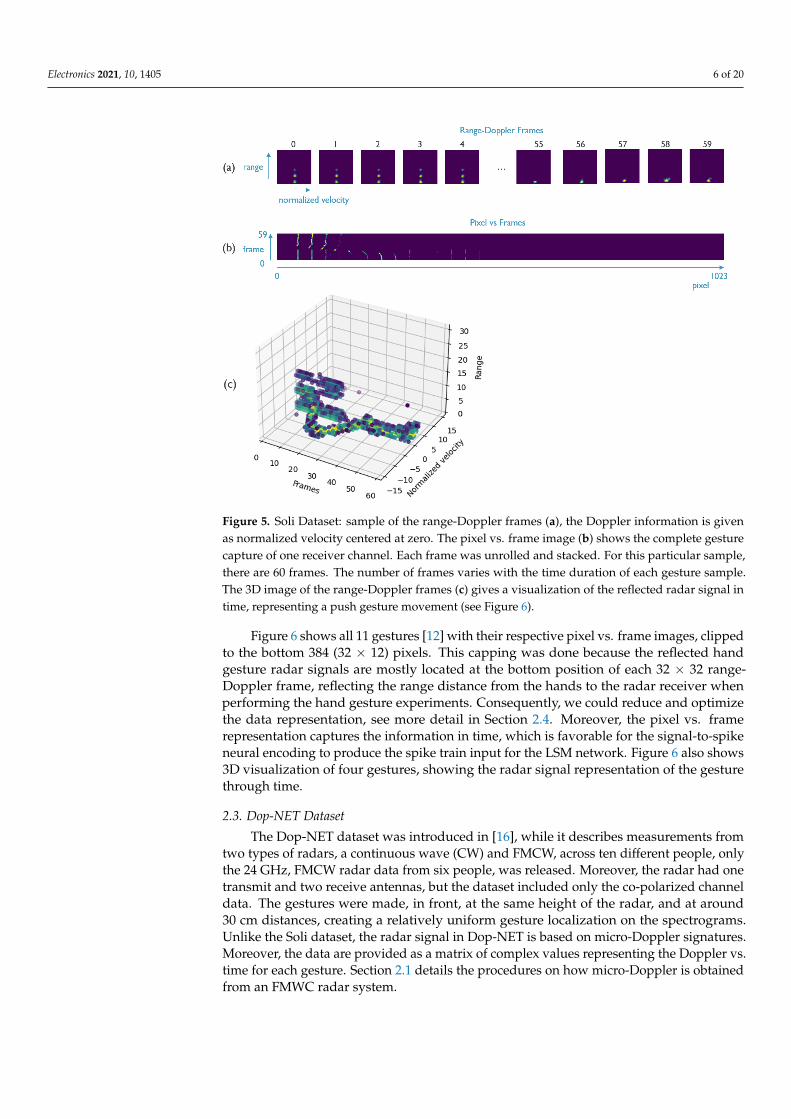
A dataset using the Soli device and a detailed study on hand gesture recognition waspresented in [12]. The dataset contains 2D range-Doppler, 32 × 32 images, encompassing11 gestures across ten users, each of which made 25 instances (session) of gestures, totaling2750 samples. Figure 5a shows an example of the range-Doppler frames, normally obtainedfollowing the procedures described in the previous section, where the x-axis representsvelocity (cm/ms per unit) and the y-axis distance (cm per unit), see [3]. The range-Dopplerimages show that per frame data does not convey sufficient information to characterizea whole gesture. Figure 5b depicts a complete data gesture, whereby each frame wasunrolled and horizontally stacked, creating a pixel vs. frame matrix. The range-Dopplerframes were provided pre-processed using a per-pixel Gaussian model for backgroundremoval, and signals were normalized to adjust for variances due to radar reflections.Figure 5c shows the 3D image of the range-Doppler frames, which is equivalent to thematrix representation shown in Figure 4c. It gives a visualization of the reflected radarsignal in time, while the Doppler profile shows the distribution of reflected energy overvelocity. It is centered in zero, indicating movement toward or away from the radar.For details on the Soli radar signal pre-processing and treatment, see [3,12]. Moreover,for each gesture, the dataset contains four sequences of frames captured by each of the Solifour radar receivers.
Electronics 2021, 10, 1405 6 of 20
Figure 5. Soli Dataset: sample of the range-Doppler frames (a), the Doppler information is givenas normalized velocity centered at zero. The pixel vs. frame image (b) shows the complete gesturecapture of one receiver channel. Each frame was unrolled and stacked. For this particular sample,there are 60 frames. The number of frames varies with the time duration of each gesture sample.The 3D image of the range-Doppler frames (c) gives a visualization of the reflected radar signal intime, representing a push gesture movement (see Figure 6).
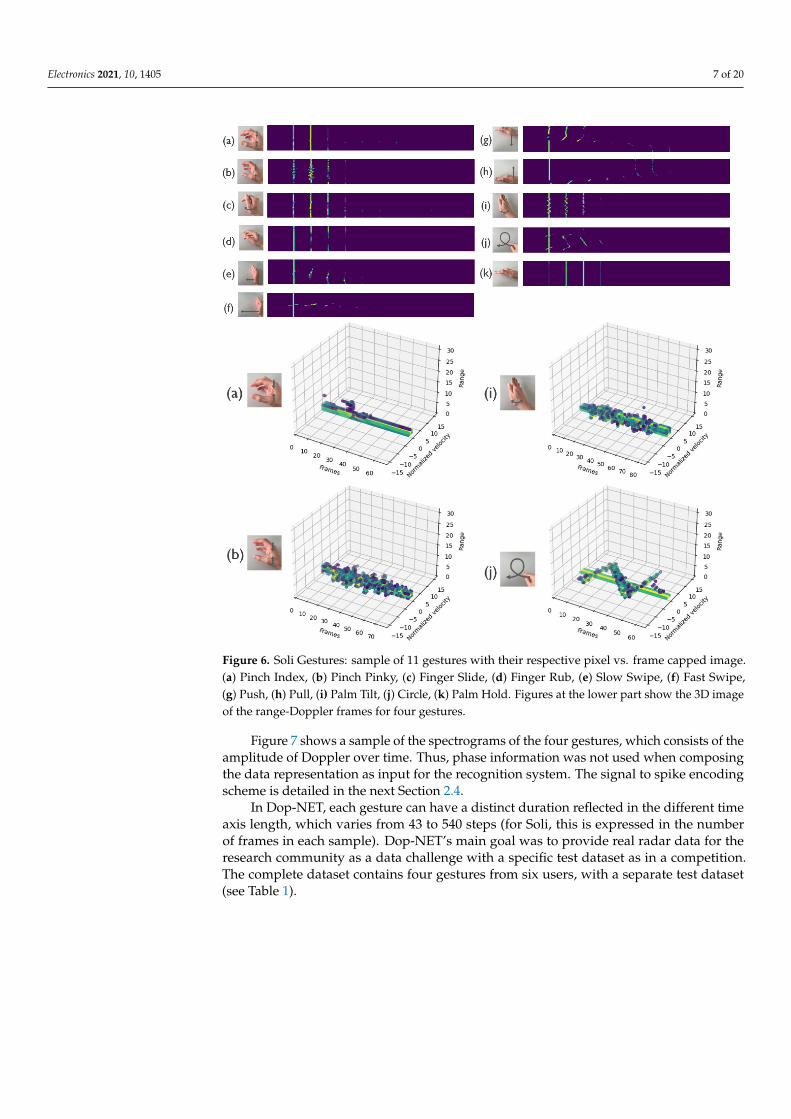
Figure 6 shows all 11 gestures [12] with their respective pixel vs. frame images, clippedto the bottom 384 (32 × 12) pixels. This capping was done because the reflected handgesture radar signals are mostly located at the bottom position of each 32 × 32 range-Doppler frame, reflecting the range distance from the hands to the radar receiver whenperforming the hand gesture experiments. Consequently, we could reduce and optimizethe data representation, see more detail in Section 2.4. Moreover, the pixel vs. framerepresentation captures the information in time, which is favorable for the signal-to-spikeneural encoding to produce the spike train input for the LSM network. Figure 6 also shows3D visualization of four gestures, showing the radar signal representation of the gesturethrough time.
2.3. Dop-NET Dataset
The Dop-NET dataset was introduced in [16], while it describes measurements fromtwo types of radars, a continuous wave (CW) and FMCW, across ten different people, onlythe 24 GHz, FMCW radar data from six people, was released. Moreover, the radar had onetransmit and two receive antennas, but the dataset included only the co-polarized channeldata. The gestures were made, in front, at the same height of the radar, and at around30 cm distances, creating a relatively uniform gesture localization on the spectrograms.Unlike the Soli dataset, the radar signal in Dop-NET is based on micro-Doppler signatures.Moreover, the data are provided as a matrix of complex values representing the Doppler vs.time for each gesture. Section 2.1 details the procedures on how micro-Doppler is obtainedfrom an FMWC radar system.
Electronics 2021, 10, 1405 7 of 20
Figure 6. Soli Gestures: sample of 11 gestures with their respective pixel vs. frame capped image.(a) Pinch Index, (b) Pinch Pinky, (c) Finger Slide, (d) Finger Rub, (e) Slow Swipe, (f) Fast Swipe,(g) Push, (h) Pull, (i) Palm Tilt, (j) Circle, (k) Palm Hold. Figures at the lower part show the 3D imageof the range-Doppler frames for four gestures.
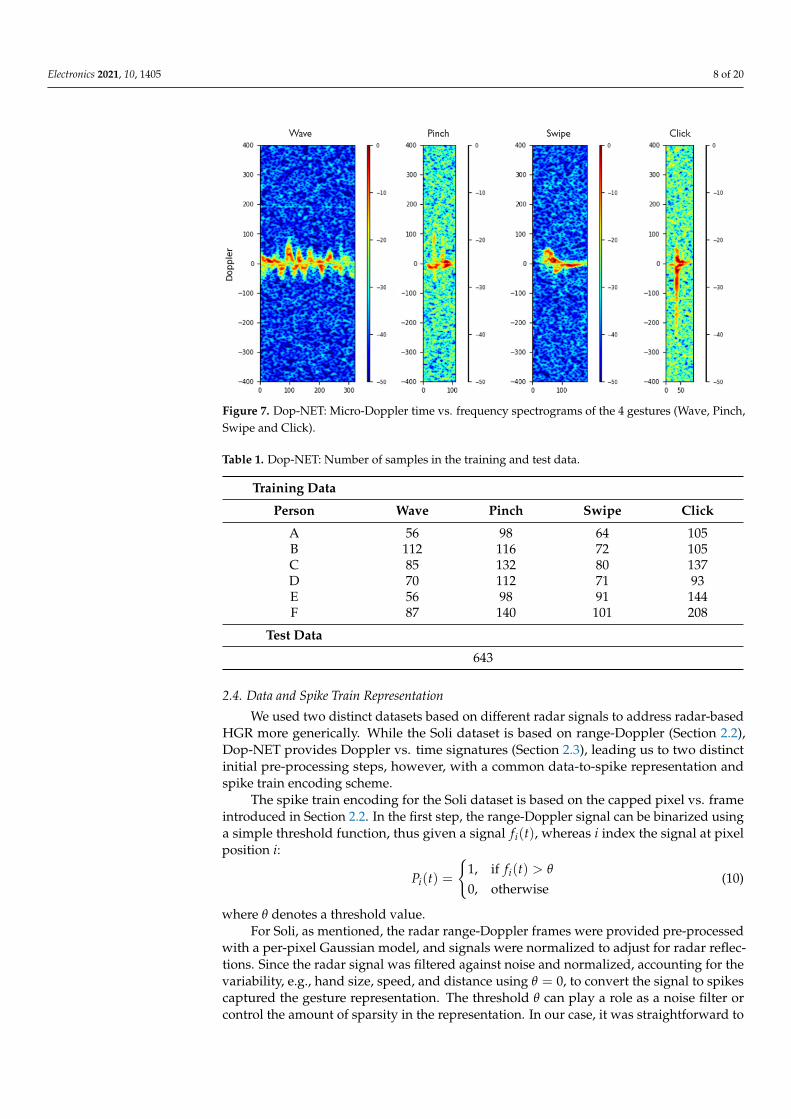
Figure 7 shows a sample of the spectrograms of the four gestures, which consists of theamplitude of Doppler over time. Thus, phase information was not used when composingthe data representation as input for the recognition system. The signal to spike encodingscheme is detailed in the next Section 2.4.
In Dop-NET, each gesture can have a distinct duration reflected in the different timeaxis length, which varies from 43 to 540 steps (for Soli, this is expressed in the numberof frames in each sample). Dop-NET’s main goal was to provide real radar data for theresearch community as a data challenge with a specific test dataset as in a competition.The complete dataset contains four gestures from six users, with a separate test dataset(see Table 1).
Electronics 2021, 10, 1405 8 of 20
Figure 7. Dop-NET: Micro-Doppler time vs. frequency spectrograms of the 4 gestures (Wave, Pinch,Swipe and Click).
Table 1. Dop-NET: Number of samples in the training and test data.
Training Data
Person Wave Pinch Swipe Click
A 56 98 64 105B 112 116 72 105C 85 132 80 137D 70 112 71 93E 56 98 91 144F 87 140 101 208
Test Data
643
2.4. Data and Spike Train Representation
We used two distinct datasets based on different radar signals to address radar-basedHGR more generically. While the Soli dataset is based on range-Doppler (Section 2.2),Dop-NET provides Doppler vs. time signatures (Section 2.3), leading us to two distinctinitial pre-processing steps, however, with a common data-to-spike representation andspike train encoding scheme.
The spike train encoding for the Soli dataset is based on the capped pixel vs. frameintroduced in Section 2.2. In the first step, the range-Doppler signal can be binarized usinga simple threshold function, thus given a signal fi(t), whereas i index the signal at pixelposition i:
Pi(t) =
{1, if fi(t) > θ
0, otherwise(10)
where θ denotes a threshold value.For Soli, as mentioned, the radar range-Doppler frames were provided pre-processed
with a per-pixel Gaussian model, and signals were normalized to adjust for radar reflec-tions. Since the radar signal was filtered against noise and normalized, accounting for thevariability, e.g., hand size, speed, and distance using θ = 0, to convert the signal to spikescaptured the gesture representation. The threshold θ can play a role as a noise filter orcontrol the amount of sparsity in the representation. In our case, it was straightforward to
Electronics 2021, 10, 1405 9 of 20
transform the radar signal in time to a set of spike trains representing the gesture and usedas input into the LSM.
For each sample the spike train from pixel position i is given by a vector: siTt0
where t0is the initial spike train time and T is the final time, and si(t0), si(t0 + 1), si(t0 + 2),. . . , si(T)are the individual spike events. From the binarized frames, each spike at frame n istranslated to a time si(t), relative to the length of the particular gesture, see Section 2.5.
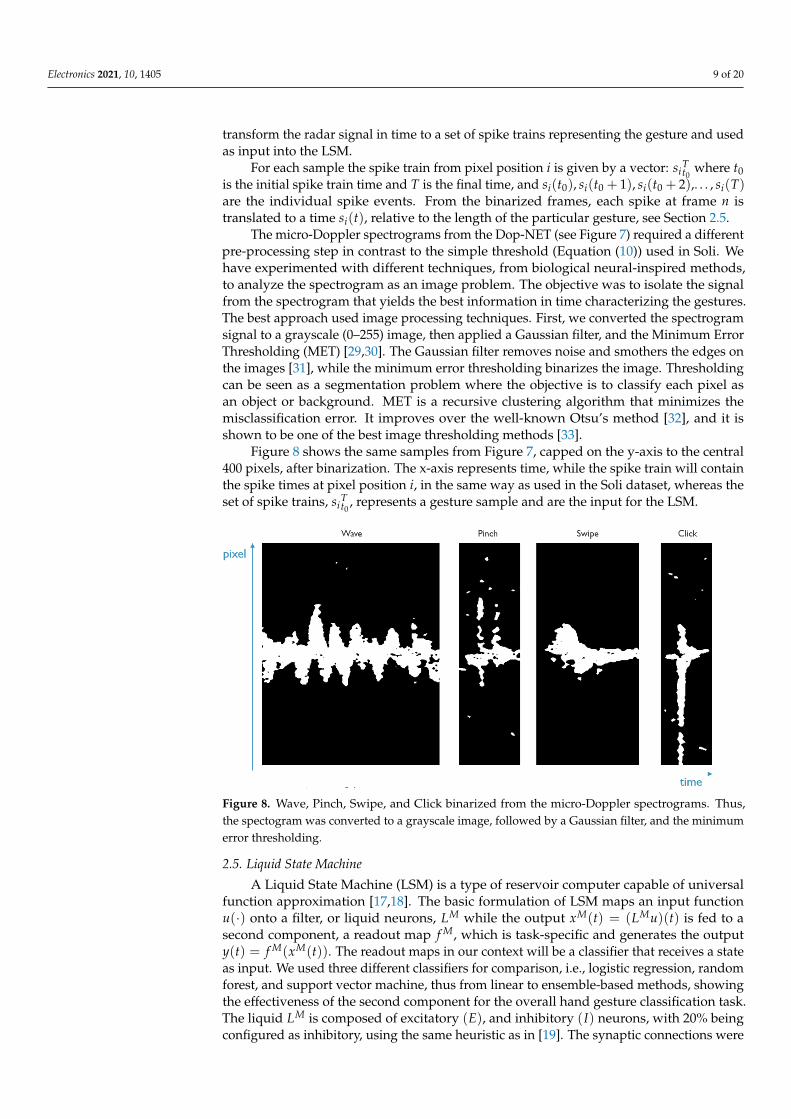
The micro-Doppler spectrograms from the Dop-NET (see Figure 7) required a differentpre-processing step in contrast to the simple threshold (Equation (10)) used in Soli. Wehave experimented with different techniques, from biological neural-inspired methods,to analyze the spectrogram as an image problem. The objective was to isolate the signalfrom the spectrogram that yields the best information in time characterizing the gestures.The best approach used image processing techniques. First, we converted the spectrogramsignal to a grayscale (0–255) image, then applied a Gaussian filter, and the Minimum ErrorThresholding (MET) [29,30]. The Gaussian filter removes noise and smothers the edges onthe images [31], while the minimum error thresholding binarizes the image. Thresholdingcan be seen as a segmentation problem where the objective is to classify each pixel asan object or background. MET is a recursive clustering algorithm that minimizes themisclassification error. It improves over the well-known Otsu’s method [32], and it isshown to be one of the best image thresholding methods [33].
Figure 8 shows the same samples from Figure 7, capped on the y-axis to the central400 pixels, after binarization. The x-axis represents time, while the spike train will containthe spike times at pixel position i, in the same way as used in the Soli dataset, whereas theset of spike trains, si
Tt0
, represents a gesture sample and are the input for the LSM.
Figure 8. Wave, Pinch, Swipe, and Click binarized from the micro-Doppler spectrograms. Thus,the spectogram was converted to a grayscale image, followed by a Gaussian filter, and the minimumerror thresholding.
2.5. Liquid State Machine
A Liquid State Machine (LSM) is a type of reservoir computer capable of universalfunction approximation [17,18]. The basic formulation of LSM maps an input functionu(·) onto a filter, or liquid neurons, LM while the output xM(t) = (LMu)(t) is fed to asecond component, a readout map f M, which is task-specific and generates the outputy(t) = f M(xM(t)). The readout maps in our context will be a classifier that receives a stateas input. We used three different classifiers for comparison, i.e., logistic regression, randomforest, and support vector machine, thus from linear to ensemble-based methods, showingthe effectiveness of the second component for the overall hand gesture classification task.The liquid LM is composed of excitatory (E), and inhibitory (I) neurons, with 20% beingconfigured as inhibitory, using the same heuristic as in [19]. The synaptic connections were
Electronics 2021, 10, 1405 10 of 20
randomly assigned, creating a sparse network with the following ratios EE = 2, EI = 2,IE = 1, and I I = 1, where EE denotes the number of synapses connecting excitatory (E)to excitatory (E) neurons, EI excitatory (E) to inhibitory (I) and so on. These ratios willensure that the connection density is not very high, as some spiking network tends to bechaotic with high connection density [18].
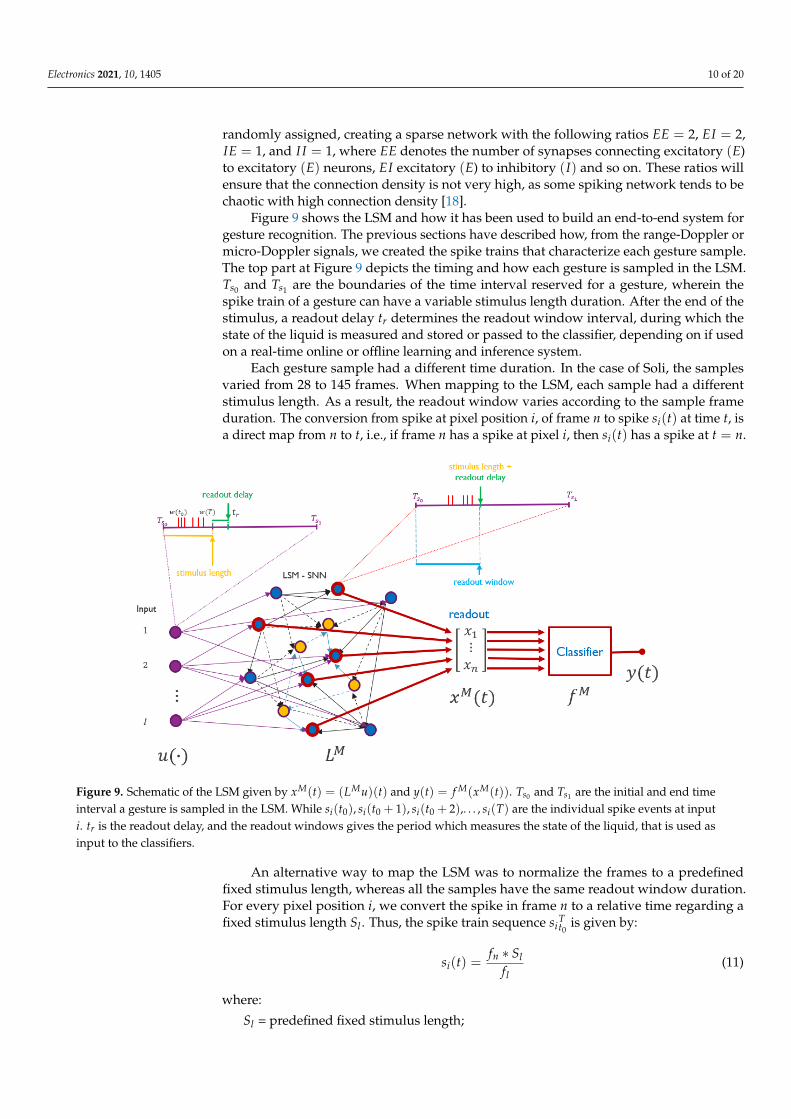
Figure 9 shows the LSM and how it has been used to build an end-to-end system forgesture recognition. The previous sections have described how, from the range-Doppler ormicro-Doppler signals, we created the spike trains that characterize each gesture sample.The top part at Figure 9 depicts the timing and how each gesture is sampled in the LSM.Ts0 and Ts1 are the boundaries of the time interval reserved for a gesture, wherein thespike train of a gesture can have a variable stimulus length duration. After the end of thestimulus, a readout delay tr determines the readout window interval, during which thestate of the liquid is measured and stored or passed to the classifier, depending on if usedon a real-time online or offline learning and inference system.
Each gesture sample had a different time duration. In the case of Soli, the samplesvaried from 28 to 145 frames. When mapping to the LSM, each sample had a differentstimulus length. As a result, the readout window varies according to the sample frameduration. The conversion from spike at pixel position i, of frame n to spike si(t) at time t, isa direct map from n to t, i.e., if frame n has a spike at pixel i, then si(t) has a spike at t = n.
Figure 9. Schematic of the LSM given by xM(t) = (LMu)(t) and y(t) = f M(xM(t)). Ts0 and Ts1 are the initial and end timeinterval a gesture is sampled in the LSM. While si(t0), si(t0 + 1), si(t0 + 2),. . . , si(T) are the individual spike events at inputi. tr is the readout delay, and the readout windows gives the period which measures the state of the liquid, that is used asinput to the classifiers.
An alternative way to map the LSM was to normalize the frames to a predefinedfixed stimulus length, whereas all the samples have the same readout window duration.For every pixel position i, we convert the spike in frame n to a relative time regarding afixed stimulus length Sl . Thus, the spike train sequence si
Tt0
is given by:
si(t) =fn ∗ Sl
fl(11)
where:
Sl = predefined fixed stimulus length;
Electronics 2021, 10, 1405 11 of 20
fn = frame number, n that contains a spike;fl = length of the particular sample in number of frames.
Section 3 shows that this normalization results in about 0.5% to 2% better accuracythan treating the gesture signals as a real-time flow of events. In constructing the LSM,we focus on achieving the most compact and simpler to implement network withoutsacrificing high accuracy results. Each pixel i will produce a spike train as an input tothe LSM, and each input is randomly connected to Cinp excitatory neurons. Moreover, allexcitatory neurons are used for readout. For the neuron unit, we used a leaky integrate-and-fire neuron model with exponential postsynaptic currents with the associated synapticmodel, based on [34]. However, while we tested synaptic models incorporating plasticity,a straightforward static synapse with a limited range of weight values was sufficient toachieve high accuracy results on Soli and Dop-NET datasets.
3. Experiments and Results
This section shows the results of applying the proposed signal to spike neural encodingand LSM architecture previously described in Section 2 to the Soli and Dop-NET datasets. Each of the datasets was evaluated separately, with their corresponding gesture sets,i.e., 11 gestures for soli and four gestures in Dop-NET. Besides specific tests described inthe benchmark papers, we analyze three cases:
• K-fold cross-validation: partitioning the complete data set in complementary k-subsetsusing k-1 subsets for training and one subset for testing, repeat k time for cross-validation.
• Leave-one-subject-out cross-validation: training the system on all but one participantand testing the remaining participant. It indicates how well a pre-trained system onseveral users would perform for unknown users.
• Leave-one-session-out cross-validation: training the system for a particular user only,using all but one of the user’s sessions to train, and testing on the remaining one. Itindicates how well the system could be used on a personal device trained for just oneparticular user.
Furthermore, we examine how the different parameters contribute to the spikingneural network and the overall classification results. For the simulations, we explore theimpact of the size of the network and the input stream u(·) on the accuracy results of thesystem. While testing on LSM with varying numbers of neurons, we kept the ratio ofexcitatory and inhibitory neurons and the synaptic connectivity as described in Section 2.5.Moreover, each input signal i is connected to Cinp neurons, which determines the amount ofsignal transmitted to the liquid. Generally, the external stimuli are sent to a fixed percentageof the neurons, always chosen to be excitatory [20]. However, we vary Cinp, modifying thisratio to determine its impact on the network.
Using three different classifiers for comparison, we aimed to keep the parametrizationof the classifiers as common and straightforward as possible, which were applicable forboth datasets. We used a logistic regression model with a regularization configuration ofC = 1, using L2 penalty, and allowed 5000 iterations for convergence. For random forest,we parametrized the ensemble to grow to 200 trees and used entropy as a metric for featureimportance evaluation, i.e., quality of the decision split. Finally, for SVM, we used a radialbasis function kernel with L2 penalty and a high C = 128 value parameter, aiming for abetter training set classification. In other words, it considered points closer to the line ofseparation between the classes. Alternatively, having a weaker penalty (lower C) causedhigher misclassification. The C parameter here is defined as in scikit-learn [35], whereasthe strength of the regularization is inversely proportional to C.
Electronics 2021, 10, 1405 12 of 20
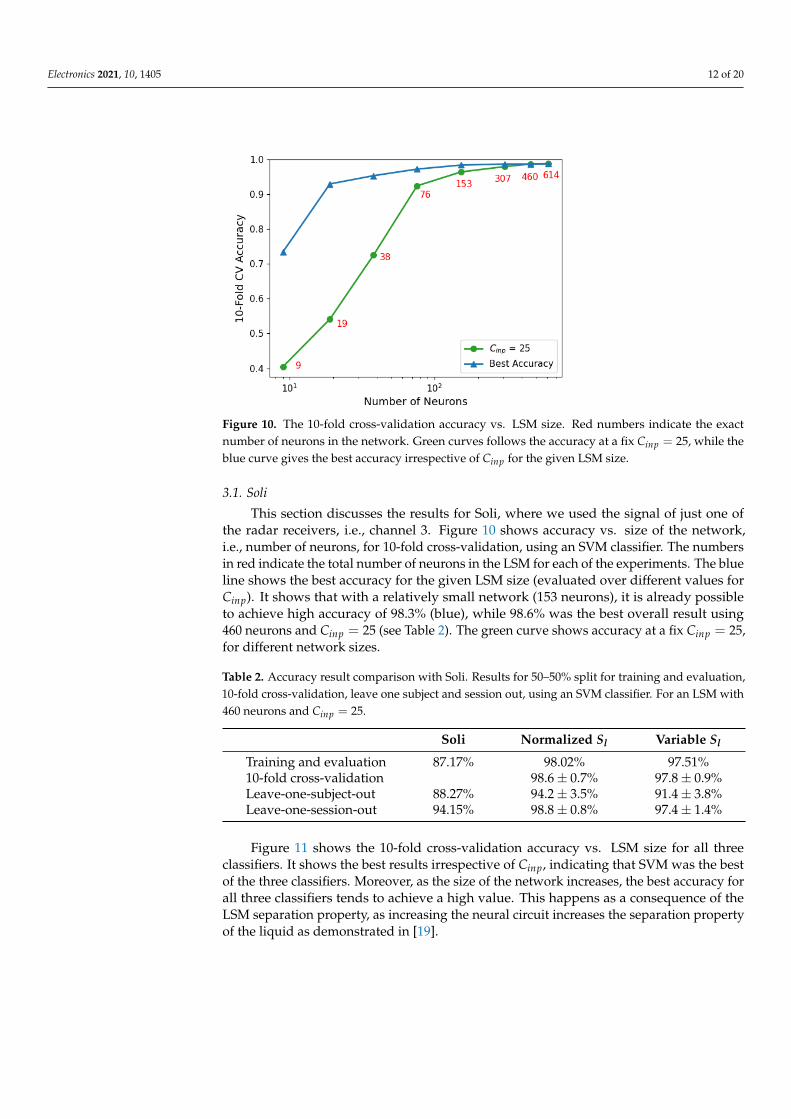
Figure 10. The 10-fold cross-validation accuracy vs. LSM size. Red numbers indicate the exactnumber of neurons in the network. Green curves follows the accuracy at a fix Cinp = 25, while theblue curve gives the best accuracy irrespective of Cinp for the given LSM size.
3.1. Soli
This section discusses the results for Soli, where we used the signal of just one ofthe radar receivers, i.e., channel 3. Figure 10 shows accuracy vs. size of the network,i.e., number of neurons, for 10-fold cross-validation, using an SVM classifier. The numbersin red indicate the total number of neurons in the LSM for each of the experiments. The blueline shows the best accuracy for the given LSM size (evaluated over different values forCinp). It shows that with a relatively small network (153 neurons), it is already possibleto achieve high accuracy of 98.3% (blue), while 98.6% was the best overall result using460 neurons and Cinp = 25 (see Table 2). The green curve shows accuracy at a fix Cinp = 25,for different network sizes.
Table 2. Accuracy result comparison with Soli. Results for 50–50% split for training and evaluation,10-fold cross-validation, leave one subject and session out, using an SVM classifier. For an LSM with460 neurons and Cinp = 25.
Soli Normalized Sl Variable Sl
Training and evaluation 87.17% 98.02% 97.51%10-fold cross-validation 98.6 ± 0.7% 97.8 ± 0.9%Leave-one-subject-out 88.27% 94.2 ± 3.5% 91.4 ± 3.8%Leave-one-session-out 94.15% 98.8 ± 0.8% 97.4 ± 1.4%
Figure 11 shows the 10-fold cross-validation accuracy vs. LSM size for all threeclassifiers. It shows the best results irrespective of Cinp, indicating that SVM was the bestof the three classifiers. Moreover, as the size of the network increases, the best accuracy forall three classifiers tends to achieve a high value. This happens as a consequence of theLSM separation property, as increasing the neural circuit increases the separation propertyof the liquid as demonstrated in [19].
Electronics 2021, 10, 1405 13 of 20
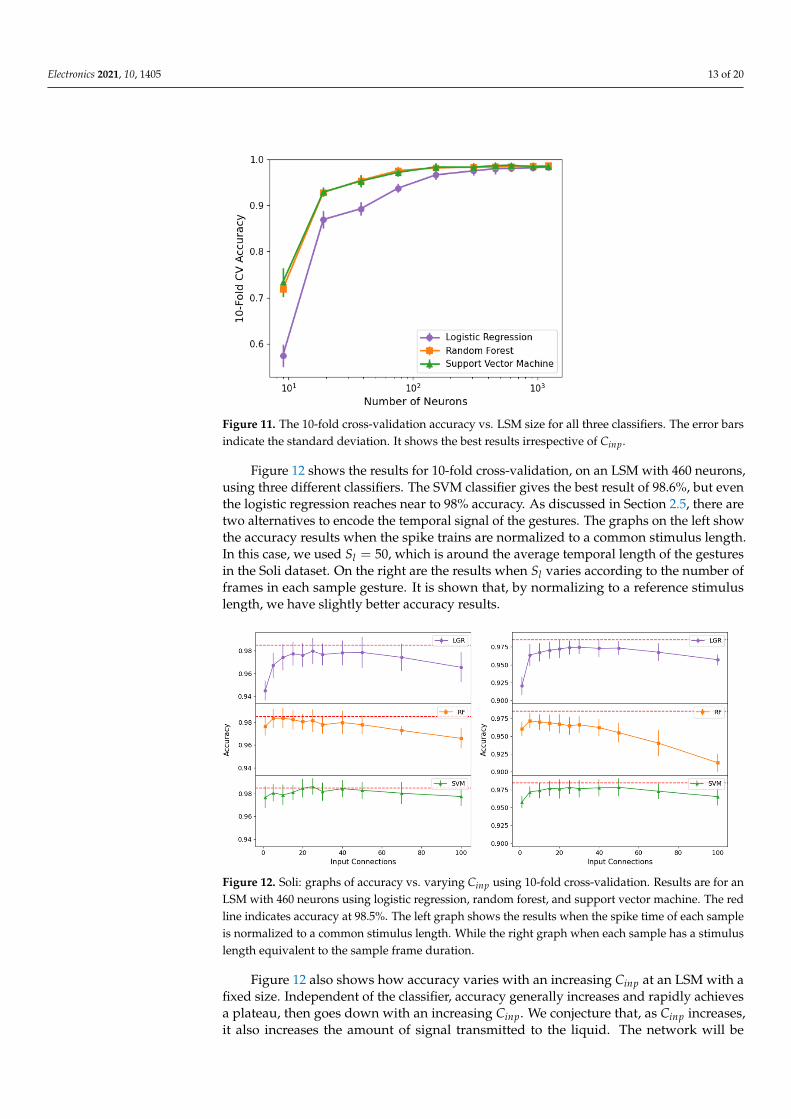
Figure 11. The 10-fold cross-validation accuracy vs. LSM size for all three classifiers. The error barsindicate the standard deviation. It shows the best results irrespective of Cinp.
Figure 12 shows the results for 10-fold cross-validation, on an LSM with 460 neurons,using three different classifiers. The SVM classifier gives the best result of 98.6%, but eventhe logistic regression reaches near to 98% accuracy. As discussed in Section 2.5, there aretwo alternatives to encode the temporal signal of the gestures. The graphs on the left showthe accuracy results when the spike trains are normalized to a common stimulus length.In this case, we used Sl = 50, which is around the average temporal length of the gesturesin the Soli dataset. On the right are the results when Sl varies according to the number offrames in each sample gesture. It is shown that, by normalizing to a reference stimuluslength, we have slightly better accuracy results.
Figure 12. Soli: graphs of accuracy vs. varying Cinp using 10-fold cross-validation. Results are for anLSM with 460 neurons using logistic regression, random forest, and support vector machine. The redline indicates accuracy at 98.5%. The left graph shows the results when the spike time of each sampleis normalized to a common stimulus length. While the right graph when each sample has a stimuluslength equivalent to the sample frame duration.
Figure 12 also shows how accuracy varies with an increasing Cinp at an LSM with afixed size. Independent of the classifier, accuracy generally increases and rapidly achievesa plateau, then goes down with an increasing Cinp. We conjecture that, as Cinp increases,it also increases the amount of signal transmitted to the liquid. The network will be
Electronics 2021, 10, 1405 14 of 20
dominated by the external stimuli, degrading the contribution from the recurrent networkand impacting the fading memory capability of the LSM, which is a fundamental propertyfor the universal computational power of the LSM [18,19]. As the size of the LSM increases,the plateau shifts, indicating that an optimal combination of LSM size and Cinp exist toachieve a high accuracy rate and minimal LSM size. Our objective was to achieve thesmallest and simple network that can achieve acceptable accuracy rates.
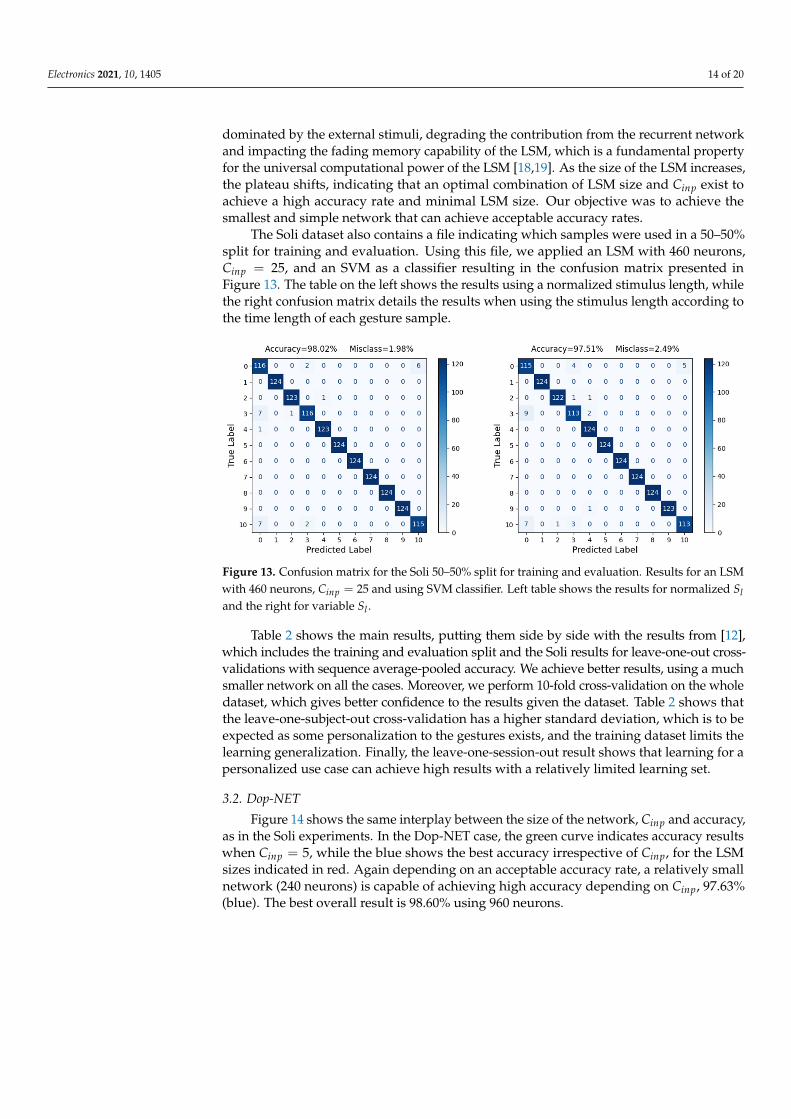
The Soli dataset also contains a file indicating which samples were used in a 50–50%split for training and evaluation. Using this file, we applied an LSM with 460 neurons,Cinp = 25, and an SVM as a classifier resulting in the confusion matrix presented inFigure 13. The table on the left shows the results using a normalized stimulus length, whilethe right confusion matrix details the results when using the stimulus length according tothe time length of each gesture sample.
Figure 13. Confusion matrix for the Soli 50–50% split for training and evaluation. Results for an LSMwith 460 neurons, Cinp = 25 and using SVM classifier. Left table shows the results for normalized Sland the right for variable Sl .
Table 2 shows the main results, putting them side by side with the results from [12],which includes the training and evaluation split and the Soli results for leave-one-out cross-validations with sequence average-pooled accuracy. We achieve better results, using a muchsmaller network on all the cases. Moreover, we perform 10-fold cross-validation on the wholedataset, which gives better confidence to the results given the dataset. Table 2 shows thatthe leave-one-subject-out cross-validation has a higher standard deviation, which is to beexpected as some personalization to the gestures exists, and the training dataset limits thelearning generalization. Finally, the leave-one-session-out result shows that learning for apersonalized use case can achieve high results with a relatively limited learning set.
3.2. Dop-NET
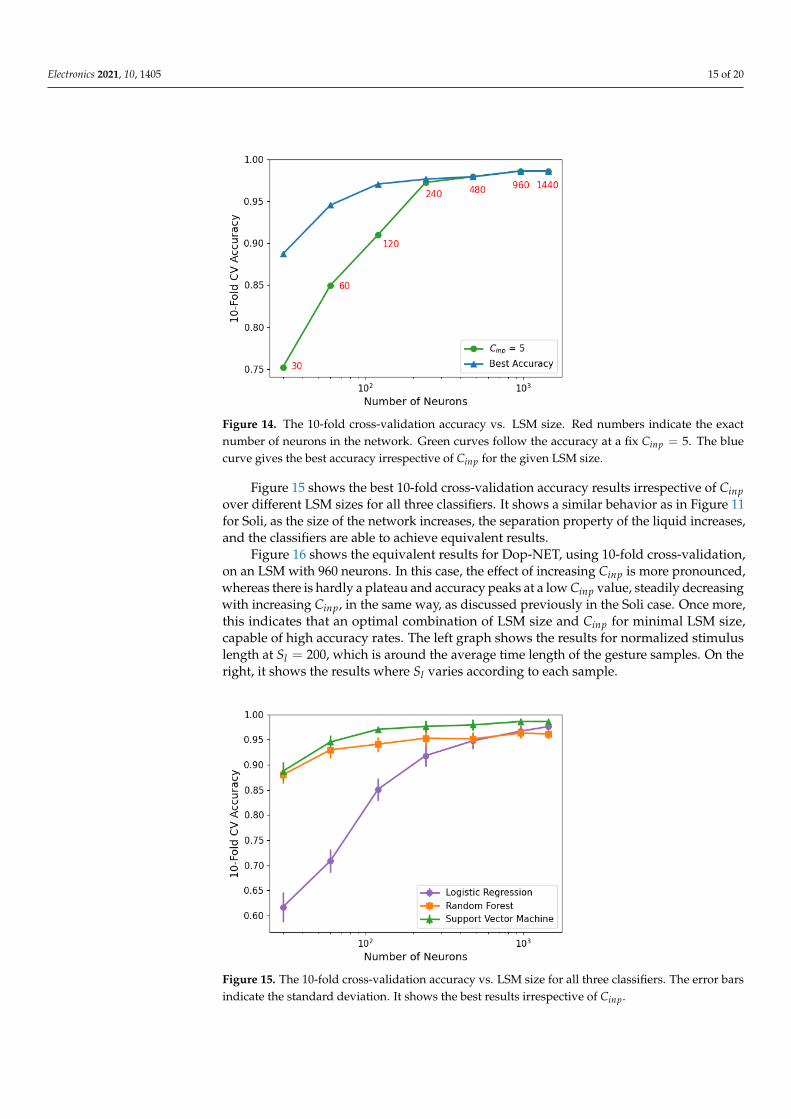
Figure 14 shows the same interplay between the size of the network, Cinp and accuracy,as in the Soli experiments. In the Dop-NET case, the green curve indicates accuracy resultswhen Cinp = 5, while the blue shows the best accuracy irrespective of Cinp, for the LSMsizes indicated in red. Again depending on an acceptable accuracy rate, a relatively smallnetwork (240 neurons) is capable of achieving high accuracy depending on Cinp, 97.63%(blue). The best overall result is 98.60% using 960 neurons.
Electronics 2021, 10, 1405 15 of 20
Figure 14. The 10-fold cross-validation accuracy vs. LSM size. Red numbers indicate the exactnumber of neurons in the network. Green curves follow the accuracy at a fix Cinp = 5. The bluecurve gives the best accuracy irrespective of Cinp for the given LSM size.
Figure 15 shows the best 10-fold cross-validation accuracy results irrespective of Cinpover different LSM sizes for all three classifiers. It shows a similar behavior as in Figure 11for Soli, as the size of the network increases, the separation property of the liquid increases,and the classifiers are able to achieve equivalent results.
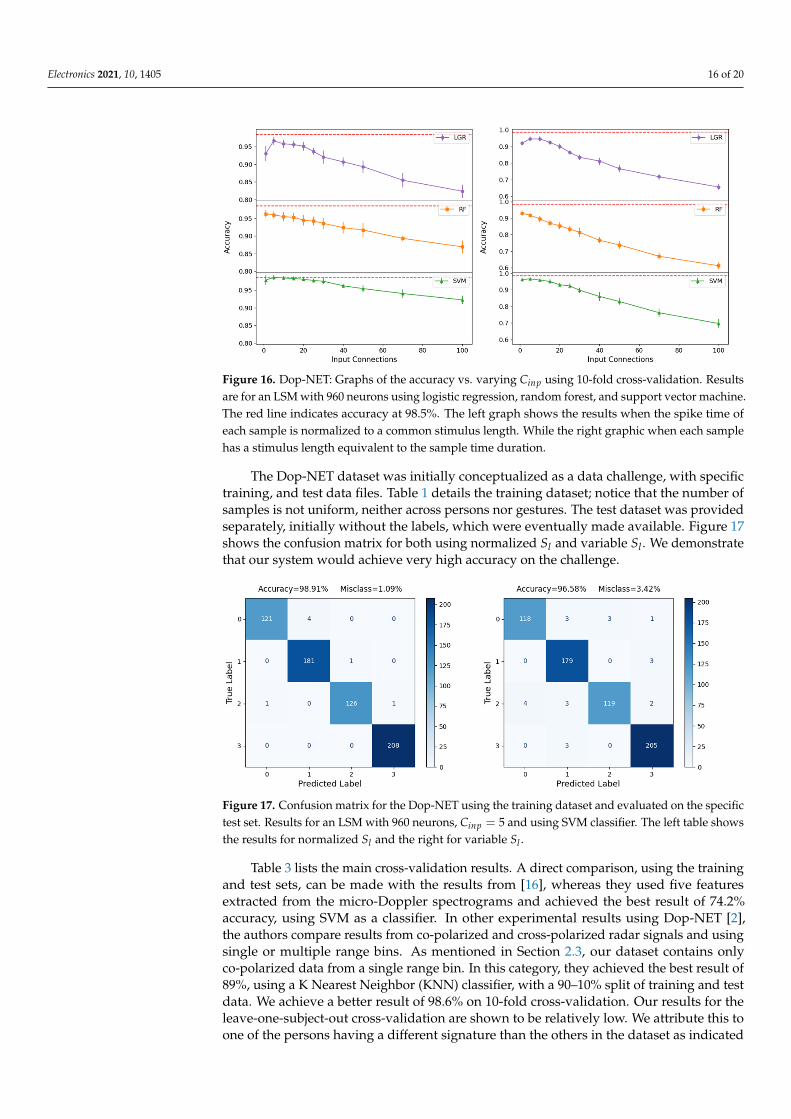
Figure 16 shows the equivalent results for Dop-NET, using 10-fold cross-validation,on an LSM with 960 neurons. In this case, the effect of increasing Cinp is more pronounced,whereas there is hardly a plateau and accuracy peaks at a low Cinp value, steadily decreasingwith increasing Cinp, in the same way, as discussed previously in the Soli case. Once more,this indicates that an optimal combination of LSM size and Cinp for minimal LSM size,capable of high accuracy rates. The left graph shows the results for normalized stimuluslength at Sl = 200, which is around the average time length of the gesture samples. On theright, it shows the results where Sl varies according to each sample.
Figure 15. The 10-fold cross-validation accuracy vs. LSM size for all three classifiers. The error barsindicate the standard deviation. It shows the best results irrespective of Cinp.
Electronics 2021, 10, 1405 16 of 20
Figure 16. Dop-NET: Graphs of the accuracy vs. varying Cinp using 10-fold cross-validation. Resultsare for an LSM with 960 neurons using logistic regression, random forest, and support vector machine.The red line indicates accuracy at 98.5%. The left graph shows the results when the spike time ofeach sample is normalized to a common stimulus length. While the right graphic when each samplehas a stimulus length equivalent to the sample time duration.
The Dop-NET dataset was initially conceptualized as a data challenge, with specifictraining, and test data files. Table 1 details the training dataset; notice that the number ofsamples is not uniform, neither across persons nor gestures. The test dataset was providedseparately, initially without the labels, which were eventually made available. Figure 17shows the confusion matrix for both using normalized Sl and variable Sl . We demonstratethat our system would achieve very high accuracy on the challenge.
Figure 17. Confusion matrix for the Dop-NET using the training dataset and evaluated on the specifictest set. Results for an LSM with 960 neurons, Cinp = 5 and using SVM classifier. The left table showsthe results for normalized Sl and the right for variable Sl .
Table 3 lists the main cross-validation results. A direct comparison, using the trainingand test sets, can be made with the results from [16], whereas they used five featuresextracted from the micro-Doppler spectrograms and achieved the best result of 74.2%accuracy, using SVM as a classifier. In other experimental results using Dop-NET [2],the authors compare results from co-polarized and cross-polarized radar signals and usingsingle or multiple range bins. As mentioned in Section 2.3, our dataset contains onlyco-polarized data from a single range bin. In this category, they achieved the best result of89%, using a K Nearest Neighbor (KNN) classifier, with a 90–10% split of training and testdata. We achieve a better result of 98.6% on 10-fold cross-validation. Our results for theleave-one-subject-out cross-validation are shown to be relatively low. We attribute this toone of the persons having a different signature than the others in the dataset as indicated
Electronics 2021, 10, 1405 17 of 20
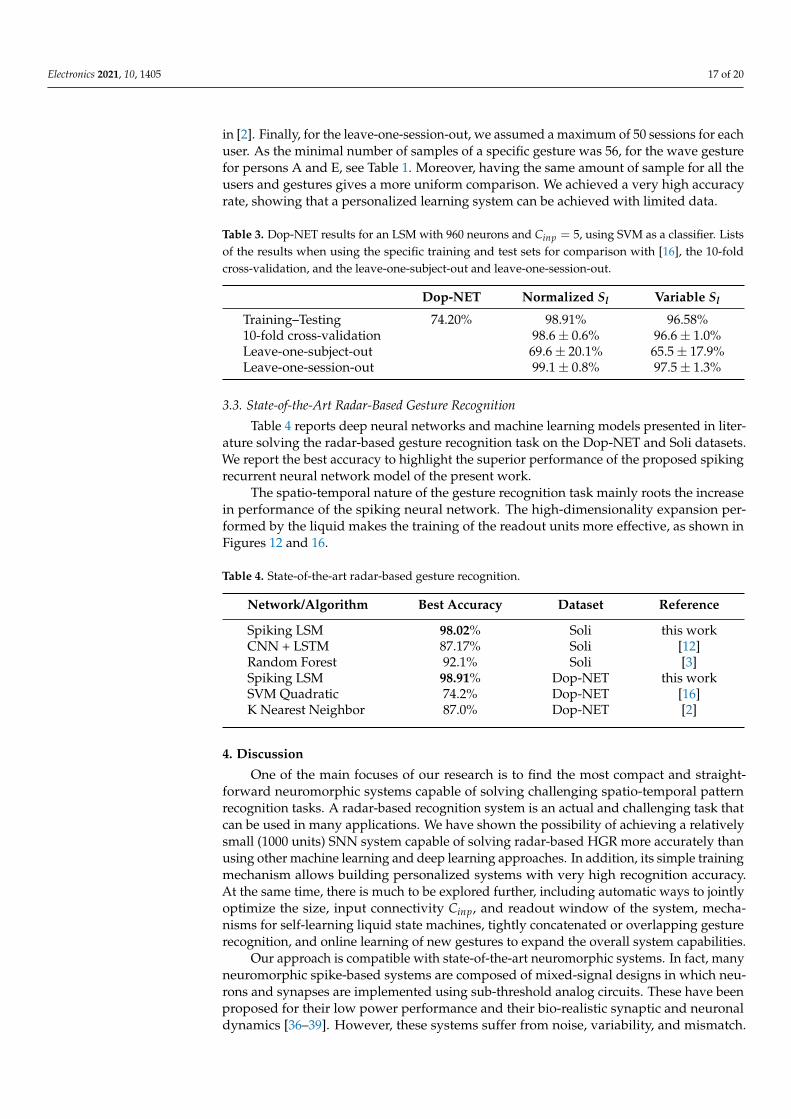
in [2]. Finally, for the leave-one-session-out, we assumed a maximum of 50 sessions for eachuser. As the minimal number of samples of a specific gesture was 56, for the wave gesturefor persons A and E, see Table 1. Moreover, having the same amount of sample for all theusers and gestures gives a more uniform comparison. We achieved a very high accuracyrate, showing that a personalized learning system can be achieved with limited data.
Table 3. Dop-NET results for an LSM with 960 neurons and Cinp = 5, using SVM as a classifier. Listsof the results when using the specific training and test sets for comparison with [16], the 10-foldcross-validation, and the leave-one-subject-out and leave-one-session-out.
Dop-NET Normalized Sl Variable Sl
Training–Testing 74.20% 98.91% 96.58%10-fold cross-validation 98.6 ± 0.6% 96.6 ± 1.0%Leave-one-subject-out 69.6 ± 20.1% 65.5 ± 17.9%Leave-one-session-out 99.1 ± 0.8% 97.5 ± 1.3%
3.3. State-of-the-Art Radar-Based Gesture Recognition
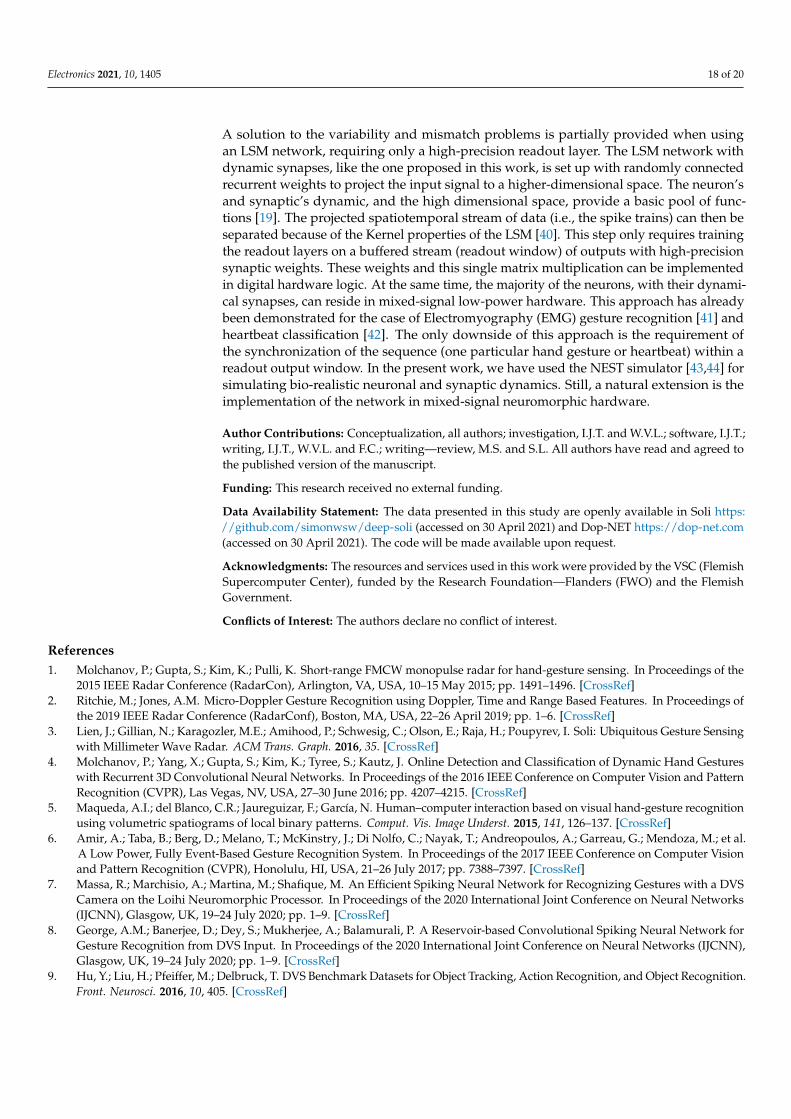
Table 4 reports deep neural networks and machine learning models presented in liter-ature solving the radar-based gesture recognition task on the Dop-NET and Soli datasets.We report the best accuracy to highlight the superior performance of the proposed spikingrecurrent neural network model of the present work.
The spatio-temporal nature of the gesture recognition task mainly roots the increasein performance of the spiking neural network. The high-dimensionality expansion per-formed by the liquid makes the training of the readout units more effective, as shown inFigures 12 and 16.
Table 4. State-of-the-art radar-based gesture recognition.
Network/Algorithm Best Accuracy Dataset Reference
Spiking LSM 98.02% Soli this workCNN + LSTM 87.17% Soli [12]Random Forest 92.1% Soli [3]Spiking LSM 98.91% Dop-NET this workSVM Quadratic 74.2% Dop-NET [16]K Nearest Neighbor 87.0% Dop-NET [2]
4. Discussion
One of the main focuses of our research is to find the most compact and straight-forward neuromorphic systems capable of solving challenging spatio-temporal patternrecognition tasks. A radar-based recognition system is an actual and challenging task thatcan be used in many applications. We have shown the possibility of achieving a relativelysmall (1000 units) SNN system capable of solving radar-based HGR more accurately thanusing other machine learning and deep learning approaches. In addition, its simple trainingmechanism allows building personalized systems with very high recognition accuracy.At the same time, there is much to be explored further, including automatic ways to jointlyoptimize the size, input connectivity Cinp, and readout window of the system, mecha-nisms for self-learning liquid state machines, tightly concatenated or overlapping gesturerecognition, and online learning of new gestures to expand the overall system capabilities.
Our approach is compatible with state-of-the-art neuromorphic systems. In fact, manyneuromorphic spike-based systems are composed of mixed-signal designs in which neu-rons and synapses are implemented using sub-threshold analog circuits. These have beenproposed for their low power performance and their bio-realistic synaptic and neuronaldynamics [36–39]. However, these systems suffer from noise, variability, and mismatch.
Electronics 2021, 10, 1405 18 of 20
A solution to the variability and mismatch problems is partially provided when usingan LSM network, requiring only a high-precision readout layer. The LSM network withdynamic synapses, like the one proposed in this work, is set up with randomly connectedrecurrent weights to project the input signal to a higher-dimensional space. The neuron’sand synaptic’s dynamic, and the high dimensional space, provide a basic pool of func-tions [19]. The projected spatiotemporal stream of data (i.e., the spike trains) can then beseparated because of the Kernel properties of the LSM [40]. This step only requires trainingthe readout layers on a buffered stream (readout window) of outputs with high-precisionsynaptic weights. These weights and this single matrix multiplication can be implementedin digital hardware logic. At the same time, the majority of the neurons, with their dynami-cal synapses, can reside in mixed-signal low-power hardware. This approach has alreadybeen demonstrated for the case of Electromyography (EMG) gesture recognition [41] andheartbeat classification [42]. The only downside of this approach is the requirement ofthe synchronization of the sequence (one particular hand gesture or heartbeat) within areadout output window. In the present work, we have used the NEST simulator [43,44] forsimulating bio-realistic neuronal and synaptic dynamics. Still, a natural extension is theimplementation of the network in mixed-signal neuromorphic hardware.
Author Contributions: Conceptualization, all authors; investigation, I.J.T. and W.V.L.; software, I.J.T.;writing, I.J.T., W.V.L. and F.C.; writing—review, M.S. and S.L. All authors have read and agreed tothe published version of the manuscript.
Funding: This research received no external funding.
Data Availability Statement: The data presented in this study are openly available in Soli https://github.com/simonwsw/deep-soli (accessed on 30 April 2021) and Dop-NET https://dop-net.com(accessed on 30 April 2021). The code will be made available upon request.
Acknowledgments: The resources and services used in this work were provided by the VSC (FlemishSupercomputer Center), funded by the Research Foundation—Flanders (FWO) and the FlemishGovernment.
Conflicts of Interest: The authors declare no conflict of interest.
References1. Molchanov, P.; Gupta, S.; Kim, K.; Pulli, K. Short-range FMCW monopulse radar for hand-gesture sensing. In Proceedings of the
2015 IEEE Radar Conference (RadarCon), Arlington, VA, USA, 10–15 May 2015; pp. 1491–1496. [CrossRef]2. Ritchie, M.; Jones, A.M. Micro-Doppler Gesture Recognition using Doppler, Time and Range Based Features. In Proceedings of
the 2019 IEEE Radar Conference (RadarConf), Boston, MA, USA, 22–26 April 2019; pp. 1–6. [CrossRef]3. Lien, J.; Gillian, N.; Karagozler, M.E.; Amihood, P.; Schwesig, C.; Olson, E.; Raja, H.; Poupyrev, I. Soli: Ubiquitous Gesture Sensing
with Millimeter Wave Radar. ACM Trans. Graph. 2016, 35. [CrossRef]4. Molchanov, P.; Yang, X.; Gupta, S.; Kim, K.; Tyree, S.; Kautz, J. Online Detection and Classification of Dynamic Hand Gestures
with Recurrent 3D Convolutional Neural Networks. In Proceedings of the 2016 IEEE Conference on Computer Vision and PatternRecognition (CVPR), Las Vegas, NV, USA, 27–30 June 2016; pp. 4207–4215. [CrossRef]
5. Maqueda, A.I.; del Blanco, C.R.; Jaureguizar, F.; García, N. Human–computer interaction based on visual hand-gesture recognitionusing volumetric spatiograms of local binary patterns. Comput. Vis. Image Underst. 2015, 141, 126–137. [CrossRef]
6. Amir, A.; Taba, B.; Berg, D.; Melano, T.; McKinstry, J.; Di Nolfo, C.; Nayak, T.; Andreopoulos, A.; Garreau, G.; Mendoza, M.; et al.A Low Power, Fully Event-Based Gesture Recognition System. In Proceedings of the 2017 IEEE Conference on Computer Visionand Pattern Recognition (CVPR), Honolulu, HI, USA, 21–26 July 2017; pp. 7388–7397. [CrossRef]
7. Massa, R.; Marchisio, A.; Martina, M.; Shafique, M. An Efficient Spiking Neural Network for Recognizing Gestures with a DVSCamera on the Loihi Neuromorphic Processor. In Proceedings of the 2020 International Joint Conference on Neural Networks(IJCNN), Glasgow, UK, 19–24 July 2020; pp. 1–9. [CrossRef]
8. George, A.M.; Banerjee, D.; Dey, S.; Mukherjee, A.; Balamurali, P. A Reservoir-based Convolutional Spiking Neural Network forGesture Recognition from DVS Input. In Proceedings of the 2020 International Joint Conference on Neural Networks (IJCNN),Glasgow, UK, 19–24 July 2020; pp. 1–9. [CrossRef]
9. Hu, Y.; Liu, H.; Pfeiffer, M.; Delbruck, T. DVS Benchmark Datasets for Object Tracking, Action Recognition, and Object Recognition.Front. Neurosci. 2016, 10, 405. [CrossRef]
Electronics 2021, 10, 1405 19 of 20
10. Moin, A.; Zhou, A.; Rahimi, A.; Menon, A.; Benatti, S.; Alexandrov, G.; Tamakloe, S.; Ting, J.; Yamamoto, N.; Khan, Y.; et al. Awearable biosensing system with in-sensor adaptive machine learning for hand gesture recognition. Nat. Electron. 2021, 4, 54–63.[CrossRef]
11. Cheng, L.; Liu, Y.; Hou, Z.G.; Tan, M.; Du, D.; Fei, M. A Rapid Spiking Neural Network Approach With an Application on HandGesture Recognition. IEEE Trans. Cogn. Dev. Syst. 2021, 13, 151–161. [CrossRef]
12. Wang, S.; Song, J.; Lien, J.; Poupyrev, I.; Hilliges, O. Interacting with Soli: Exploring Fine-Grained Dynamic Gesture Recognitionin the Radio-Frequency Spectrum. In Proceedings of the 29th Annual Symposium on User Interface Software and Technology,Tokyo, Japan, 16–19 October 2016; Association for Computing Machinery: New York, NY, USA, 2016; pp. 851–860. [CrossRef]
13. Min, Y.; Zhang, Y.; Chai, X.; Chen, X. An Efficient PointLSTM for Point Clouds Based Gesture Recognition. In Proceedings ofthe 2020 IEEE/CVF Conference on Computer Vision and Pattern Recognition (CVPR), Seattle, WA, USA, 13–19 June 2020; pp.5760–5769. [CrossRef]
14. Samuelsson, A. How to Build Advanced Hand Gestures Using Radar and TinyML. tinyML Talks. 2020. Available online:https://youtu.be/-XhbvlWcymY (accessed on 30 April 2021).
15. Ahuja, K.; Jiang, Y.; Goel, M.; Harrison, C. Vid2Doppler: Synthesizing Doppler Radar Data from Videos for Training Privacy-Preserving Activity Recognition. In Proceedings of the 2021 CHI Conference on Human Factors in Computing Systems,Yokohama, Japan, 8–13 May 2021; Association for Computing Machinery: New York, NY, USA, 2021. [CrossRef]
16. Ritchie, M.; Capraru, R.; Fioranelli, F. Dop-NET: A micro-Doppler radar data challenge. Electron. Lett. 2020, 56, 568–570.[CrossRef]
17. Maass, W.; Sontag, E.D. Neural Systems as Nonlinear Filters. Neural Comput. 2000, 12, 1743–1772. [CrossRef] [PubMed]18. Maass, W.; Markram, H. On the computational power of circuits of spiking neurons. J. Comput. Syst. Sci. 2004, 69, 593–616.
[CrossRef]19. Maass, W.; Natschläger, T.; Markram, H. Real-Time Computing Without Stable States: A New Framework for Neural Computation
Based on Perturbations. Neural Comput. 2002, 14, 2531–2560. [CrossRef] [PubMed]20. Hazan, H.; Manevitz, L.M. Topological constraints and robustness in liquid state machines. Expert Syst. Appl. 2012, 39, 1597–1606.
[CrossRef]21. Ahmed, S.; Kallu, K.D.; Ahmed, S.; Cho, S.H. Hand Gestures Recognition Using Radar Sensors for Human-Computer-Interaction:
A Review. Remote Sens. 2021, 13, 527. [CrossRef]22. Jankiraman, M. FMCW Radar Design; Artech House: Boston, MA, USA, 2018.23. Gurbuz, S. Deep Neural Network Design for Radar Applications; The Institution of Engineering and Technology: Stevenage, UK, 2020.24. Fioranelli, H.F.; Griffiths, M.R.; Balleri, A. Micro-Doppler Radar and Its Applications; The Institution of Engineering and Technology:
Stevenage, UK, 2020.25. Nasr, I.; Jungmaier, R.; Baheti, A.; Noppeney, D.; Bal, J.S.; Wojnowski, M.; Karagozler, E.; Raja, H.; Lien, J.; Poupyrev, I.; et al. A
Highly Integrated 60 GHz 6-Channel Transceiver With Antenna in Package for Smart Sensing and Short-Range Communications.IEEE J. Solid-State Circuits 2016, 51, 2066–2076. [CrossRef]
26. Gu, C.; Lien, J. A Two-Tone Radar Sensor for Concurrent Detection of Absolute Distance and Relative Movement for GestureSensing. IEEE Sens. Lett. 2017, 1, 1–4. [CrossRef]
27. Wiggers, K. Google Unveils Pixel 4 and Pixel 4 XL with Gesture Recognition and Dual Rear Cameras. VentureBeat. 2019. Availableonline: https://venturebeat.com/2019/10/15/google-unveils-the-pixel-4-and-pixel-4-xl-with-gesture-recognition-and-dual-rear-cameras (accessed on 30 April 2021).
28. Seifert, D. Google Nest Hub (2nd-Gen) Review: Sleep on It. The Verge. 2021. Available online: https://www.theverge.com/22357214/google-nest-hub-2nd-gen-2021-assistant-smart-display-review (accessed on 30 April 2021).
29. Kittler, J.; Illingworth, J. Minimum error thresholding. Pattern Recognit. 1986, 19, 41–47. [CrossRef]30. Kittler, J.; Illingworth, J. On threshold selection using clustering criteria. IEEE Trans. Syst. Man Cybern. 1985, SMC-15, 652–655.
[CrossRef]31. Gonzalez, R.C.; Woods, R.E. Digital Image Processing; Pearson: New York, NY, USA, 2018.32. Otsu, N. A Threshold Selection Method from Gray-Level Histograms. IEEE Trans. Syst. Man Cybern. 1979, 9, 62–66. [CrossRef]33. Sezgin, M.; Sankur, B. Survey over image thresholding techniques and quantitative performance evaluation. J. Electron. Imaging
2004, 13, 146–165. [CrossRef]34. Tsodyks, T.; Uziel, A.; Markram, H. t Synchrony Generation in Recurrent Networks with Frequency-Dependent Synapses.
J. Neurosci. 2000, 20, RC50. [CrossRef]35. Pedregosa, F.; Varoquaux, G.; Gramfort, A.; Michel, V.; Thirion, B.; Grisel, O.; Blondel, M.; Prettenhofer, P.; Weiss, R.; Dubourg, V.;
et al. Scikit-learn: Machine Learning in Python. J. Mach. Learn. Res. 2011, 12, 2825–2830.36. Benjamin, B.V.; Gao, P.; McQuinn, E.; Choudhary, S.; Chandrasekaran, A.R.; Bussat, J.M.; Alvarez-Icaza, R.; Arthur, J.V.;
Merolla, P.A.; Boahen, K. Neurogrid: A mixed-analog-digital multichip system for large-scale neural simulations. Proc. IEEE2014, 102, 699–716. [CrossRef]
37. Neckar, A.; Fok, S.; Benjamin, B.V.; Stewart, T.C.; Oza, N.N.; Voelker, A.R.; Eliasmith, C.; Manohar, R.; Boahen, K. Braindrop: Amixed-signal neuromorphic architecture with a dynamical systems-based programming model. Proc. IEEE 2018, 107, 144–164.[CrossRef]
Electronics 2021, 10, 1405 20 of 20
38. Qiao, N.; Mostafa, H.; Corradi, F.; Osswald, M.; Stefanini, F.; Sumislawska, D.; Indiveri, G. A reconfigurable on-line learningspiking neuromorphic processor comprising 256 neurons and 128K synapses. Front. Neurosci. 2015, 9, 141. [CrossRef]
39. Meier, K. A mixed-signal universal neuromorphic computing system. In Proceedings of the 2015 IEEE International ElectronDevices Meeting (IEDM), Washington, DC, USA, 7–9 December 2015; pp. 4–6.
40. Maass, W. Liquid state machines: Motivation, theory, and applications. In Computability in Context: Computation and Logic in theReal World; Imperial College Press (ICP): London, UK, July 2011; pp. 275–296.
41. Donati, E.; Payvand, M.; Risi, N.; Krause, R.; Burelo, K.; Indiveri, G.; Dalgaty, T.; Vianello, E. Processing EMG signals usingreservoir computing on an event-based neuromorphic system. In Proceedings of the 2018 IEEE Biomedical Circuits and SystemsConference (BioCAS), Cleveland, OH, USA, 17–19 October 2018; pp. 1–4.
42. Corradi, F.; Pande, S.; Stuijt, J.; Qiao, N.; Schaafsma, S.; Indiveri, G.; Catthoor, F. ECG-based Heartbeat Classification inNeuromorphic Hardware. In Proceedings of the 2019 International Joint Conference on Neural Networks (IJCNN), Budapest,Hungary, 14–19 July 2019; pp. 1–8. [CrossRef]
43. Gewaltig, M.O.; Diesmann, M. NEST (NEural Simulation Tool). Scholarpedia 2007, 2, 1430. [CrossRef]44. Fardet, T.; Vennemo, S.B.; Mitchell, J.; Mørk, H.; Graber, S.; Hahne, J.; Spreizer, S.; Deepu, R.; Trensch, G.; Weidel, P.; et al.
NEST 2.20.1; Zenodo CERN: Genève, Switzerland, 2020.
Related Documents