Racial and Ethnic Differences in Pension Wealth December 2001 Abstract It is well established that black and Hispanic workers accumulate less wealth for retirement than white workers. Earlier studies find that the shortfall in wealth among the minority workers cannot be entirely accounted for by their lower earnings. This study provides evidence on whether racial and ethnic differences in private pension coverage and benefit levels contribute to the wealth differentials. Using data from the Current Population Survey, Survey of Consumer Finances and the Health and Retirement Survey, several consistent findings emerge. First, most of the racial and ethnic differences in pension benefit levels are accounted for by differences in worker characteristics. Second, among workers who are covered by a private pension, racial and ethnic differences in pension asset accumulation are quite small. Finally, exclusion of pension wealth has only a small effect on the comparison of average levels of wealth across racial and ethnic groups, but has a substantial effect for comparisons at the bottom of the wealth distribution. Overall, the findings suggest that, holding worker characteristics constant, minority and majority workers accumulate very similar levels of wealth. Also, the accumulation of pension assets is a particularly important source of retirement wealth for those at the low end of wealth distribution. William E. Even David A. Macpherson Department of Economics Department of Economics Miami University Florida State University Oxford, OH 45056 Tallahassee, Florida 32306 email: [email protected] email: [email protected] 513-529-2865 850-644-3586

Welcome message from author
This document is posted to help you gain knowledge. Please leave a comment to let me know what you think about it! Share it to your friends and learn new things together.
Transcript

Racial and Ethnic Differences in Pension Wealth
December 2001
Abstract
It is well established that black and Hispanic workers accumulate less wealth for retirement thanwhite workers. Earlier studies find that the shortfall in wealth among the minority workerscannot be entirely accounted for by their lower earnings. This study provides evidence onwhether racial and ethnic differences in private pension coverage and benefit levels contribute tothe wealth differentials. Using data from the Current Population Survey, Survey of ConsumerFinances and the Health and Retirement Survey, several consistent findings emerge. First, mostof the racial and ethnic differences in pension benefit levels are accounted for by differences inworker characteristics. Second, among workers who are covered by a private pension, racial andethnic differences in pension asset accumulation are quite small. Finally, exclusion of pensionwealth has only a small effect on the comparison of average levels of wealth across racial andethnic groups, but has a substantial effect for comparisons at the bottom of the wealthdistribution. Overall, the findings suggest that, holding worker characteristics constant, minorityand majority workers accumulate very similar levels of wealth. Also, the accumulation ofpension assets is a particularly important source of retirement wealth for those at the low end ofwealth distribution.
William E. Even David A. MacphersonDepartment of Economics Department of EconomicsMiami University Florida State UniversityOxford, OH 45056 Tallahassee, Florida 32306email: [email protected] email: [email protected] 850-644-3586
1. Introduction.
Black and Hispanic Americans earn less and have less wealth than white Americans. Lower
earnings in the black and Hispanic population are an obvious explanation for their lower wealth.
However, several studies document that the gap in wealth is far larger than the gap in earnings. For
example, Oliver and Shapiro (1995) report that among dual earner married couples, black households
earn 77 percent of white households but have only 19 percent of white households’ net financial assets.
Menchik and Jianakoplos (1997) report that black household income averages 63 percent of white
household income, but black households average only 10 to 25 percent of the wealth held by whites. 1
While Hispanic households average 70 percent of white household income, 2 Smith (1995) reports that
Hispanic households have only 30 percent of white household wealth. Moreover, Blau and Graham
(1990) report that as much as three-quarters of the wealth gap between blacks and whites cannot be
explained by differences in income and other demographic factors.
The reasons that blacks and Hispanics accumulate less wealth relative to income are not well
understood. Some hypotheses that have been proposed include: (1) differences in inheritances and /or the
desire to leave a bequest; (2) differences in life-expectancies; (3) differences in labor market uncertainty
that lead to different investment decisions and rates of return; and ( 4) differential access to housing and
loan markets that can affect the ability to build home equity.3
One issue that has received little attention in the literature is how the accumulation of pension
wealth differs between blacks, Hispanics and whites. Given that blacks and Hispanics acquire less
wealth than whites, it is interesting to ask whether they acquire less pension wealth. Unfortunately, most
of the aforementioned studies ignore pension and Social Security wealth. One exception is Smith
(1995), who argues that ignoring Social Security and private pension wealth has “an enormous impact on
1
3 These hypotheses are mentioned by Blau and Graham (1990), Smith (1995), or Menchik and Jianakoplos (1997). 2 This ratio was derived from the 1996 Statistical Abstract of the United States .
1 Other studies that find that the earnings gap is less than the wealth gap include Blau and Graham (1990), Oliverand Shapiro (1989), and Snyder (1989).
racial and ethnic disparities ... As the wealth concept is expanded these disparities narrow.” 4 Adding
Social Security and private pension wealth increases the black/white ratio of mean wealth from .27 to .46
and the Hispanic/white ratio from .35 to .43. If only pension wealth is added to net worth, the
black/white ratio of mean wealth increases to .37 and the Hispanic/white ratio decreases to .32.
The purpose of this study is to determine the extent of racial and ethnic differences in pension
wealth and the reasons for these differences. In section 2, we show that black and Hispanic retirees
received substantially less income from pensions than white retirees in the mid-1990s. The link between
pension coverage rates and income to prior labor market experience is investigated in section 3. This
section also shows that most of the differences in pension coverage and benefit accumulation can be
accounted for by differences in labor market characteristics. In section 4, we examine the impact of
private pensions on racial and ethnic differences in total wealth.
2. Pension Income Among the Elderly.
To provide some background on the extent of racial and ethnic differences in pension coverage
and generosity among past generations of workers, we turn first to the September 1994 Current
Population Survey (CPS). The September 1994 CPS data are used because of the supplemental questions
asked regarding whether people were ever covered by an employer pension in the past, and the amount of
pension income currently being received. The sample is restricted to people aged 55 and over who were
previously employed but not in the labor force at the time of the survey. Summary statistics are provided
in table 1. The table reports the percentage of people that are currently receiving benefits from an
employer pension. These statistics understate the fraction of people that were covered by a pension for at
least two reasons: First, a worker may have received a pre-retirement lump sum distribution from a
pension and not be currently receiving benefits. Second, a worker may have a balance in a defined
contribution plan that was not annuitized. In the case of defined contribution plans, the CPS measures
benefits only if the account balance was annuitized.
2
4 Smith (1995), p. S179.

The results indicate that, among people over age 55 and out of the labor force, 33.5 percent of
whites are receiving benefits, 26.1 percent of blacks, and 18.6 percent of Hispanics. 5 When the measure
of pension coverage is broadened to include people that report coverage by a pension plan at any time in
the past, coverage rates grow to 45.9 percent among whites, 37.1 percent among blacks, and 27.0 percent
among Hispanics.
Since later sections of the paper discover that public sector employment contributes to racial and
ethnic differences in pension coverage, table 1 also provides statistics by public sector employment
status.6 Blacks are more likely and Hispanics less likely than whites to be employed in the public sector .
Among those whose longest job was in the public sector, there is no statistically significant difference (at
the .10 level) between whites and blacks, or whites and Hispanics in terms of their pension coverage.
This result holds true whether coverage is measured by current receipt of pension income or coverage at
any time in the past. The differences are, however, statistically significant in the private sector.
Table 2 lists the average annual benefit among people receiving a pension. These results indicate
no statistically significant difference in annual benefits, though the small sample sizes for blacks and
Hispanics generate rather imprecise estimates of the mean benefit level. When the analysis is done
separately by public sector employment status, blacks are found to have significantly lower benefits than
whites only among public sector employees. There is no statistically significant difference between
Hispanic and white benefits in either the public or private sector.
The above analysis reveals that, among elderly people with prior labor force experience that are
currently out of the labor force, pension coverage is significantly lower among blacks and Hispan ics than
whites. However, given that a previously employed person is covered by a pension, differences in
benefit levels across the racial and ethnic groupings are difficult to discern in the September 1994 CPS
3
6 A person is classified as a public sector employee if his or her "longest job" was in the public sector.
5 The definition of Hispanic we employ includes only white Hispanics. Black Hispanics are defined as blacks.Asians and American Indians are excluded from the sample.

data. The small sample sizes for the minority groups, however, cast some doubt on the precision of the
estimates.
3. Comparisons of Pension Income at Retirement.
This section provides a comparison of expected pension benefits at retirement across racial and
ethnic groups. The analysis relies on Wave I of the Health and Retirement Survey (HRS) and the 1992
Survey of Consumer Finances (SCF). Wave I of the HRS was started in 1992 and surveyed persons born
between 1931 and 1941 about their health, retirement and economic status.7 The survey included 12,652
people in 7,702 households. Our analysis restricts attention to “age-eligible” respondents ( i.e. those
born between 1931 and 1941) who worked more than 1000 hours in the past year, whose wage rate
equals or exceeds the minimum wage of $4.25, are not self-employed, and who can be classified as either
white, black, or Hispanic. This results in a sample of 4,458 individuals. For the analysis on pension
benefits, restricting the sample to those covered by a pension, currently or in the past and eliminating
those with missing information on the necessary pension questions reduces the sample to 2,338
individuals.
The 1992 SCF provided detailed information on the financial status of U.S. households. The
entire sample includes responses from 6,470 persons in 3,906 households , of which 1,450 households are
an oversample of wealthier households. The SCF imputes values for missing data. To capture the
underlying variance associated with the imputed values, each observation is repeated 5 times in the data
set to reflect the underlying variance in imputed values.8 Following the recommendation of Montalto
and Sung (1996), all 5 observations are employed in our analysis. The resulting sample consists of
32,350 observations. Our analysis is restricted to individuals between the ages of 21 and 55 working
more than 1000 hours per year, whose wage rate equals or exceeds the minimum wage of $4.25, are not
4
8 That is, for example, if income is imputed for an individual, the value of income will take on 5 different valuesfor that person to reflect the variance in the estimate of income. If income is not imputed for an individual, it willtake the same value for that person 5 times.
7 The text describing the data and benefit calculations borrows heavily from our earlier study, Even andMacpherson (1998).
self-employed, and who can be classified as either white, black, or Hispanic. This results in a sample of
9,863 observations.9 For the analysis on pension benefits, restricting the sample to those covered by a
pension, currently or in the past, and eliminating those with missing information on the necessary
pension questions reduces the sample to 6,032 individuals.
Pension Coverage.
Table 3 reports descriptive pension statistics from the HRS and SCF.10 In comparison to the
September 1994 CPS data examined earlier, coverage rates are higher for each racial and ethnic group in
both the HRS and SCF. There are at least two plausible explanations for this. First, the HRS and SCF
worker cohorts were born later than the CPS cohorts of people over age 55 who were out of the labor
force. As a consequence, the CPS cohorts were in the labor market in earlier years when pension
coverage was lower. Second, coverage by a defined contribution plan is missed in the CPS data unless
it is converted into some form of annuity. In the HRS and SCF data, anyone with an account balance in
a defined contribution plan is counted as covered.
The percentage of workers covered by a pension with their current employer is higher in the HRS
than in the SCF for each racial and ethnic group. Part of the reason for this is that the HRS contains
only workers in the 51-61 age group whereas the SCF contains workers between the ages of 21 and 55.
Since pension coverage generally rises with worker age, the inclusion of younger workers in the SCF
should result in a lower coverage rate.
Table 3 also presents statistics for a broader measure of pension coverage -- whether a person is
either currently covered by a pension or expects to receive benefits from a past pension. While these
coverage statistics are substantially higher than those based on current coverage alone, the pattern of
differences in coverage across racial/ethnic groups is similar.
5
10 Since the HRS and SCF both over-sample some groups, all statistics and regressions rely upon the sampleweights provided in the surveys.
9 Notice that the sample size of 9,863 includes many individuals five times. However, since some of the variablesthat we delete on may be imputed (e.g. if the wage rate is less than $4.25), some individuals will not appear fivetimes. The imputed value for a given variable may cause the observation to be excluded in some cases but not inothers.

While the level of pension coverage differs across the HRS and SCF, several patterns persist and
are worth noting. First, coverage rates are lowest among Hispanics and highest among whites. Second,
as is true for the population as a whole, coverage is higher for men than women among whites. However,
in the Hispanic population, women have higher pension coverage than men. In the black population,
coverage is higher for men than women in the HRS, but the reverse is true in the SCF.
Pension Benefits.
A comparison of pension saving across racial and ethnic groups requires a common measure
across different types of pensions. To achieve this, we compute the annuity value of each pension type
for a retirement at age 65. For defined benefit plans, this requires that the benefit formula be applied to
a forecast of earnings and years of service at age 65. For defined contribution plans, account balances
are projected for a retirement at age 65 and then an annuity factor is applied to convert the balance into a
single life annuity. The methods employed are identical to those in Even and Macpherson (1998). The
data appendix provides a summary of the methodology and assumptions.
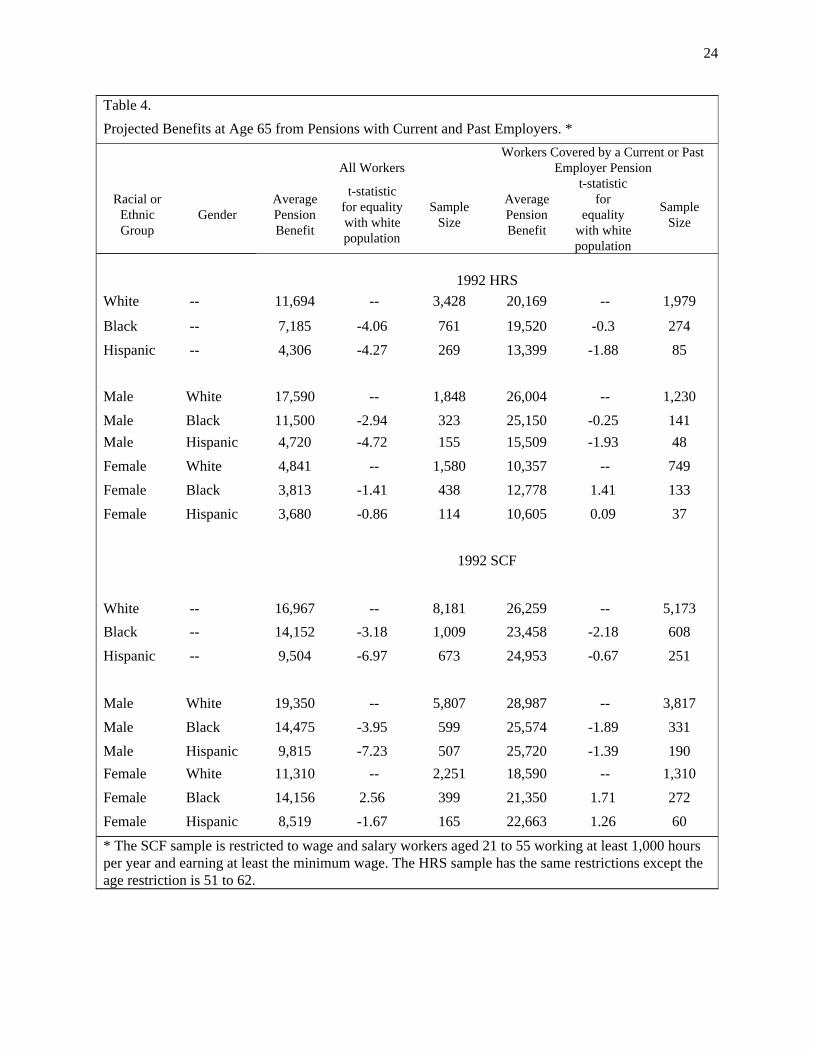
A list of mean benefit levels is presented in table 4 by sex and race/ethnicity. Benefits from
both past and present employers are summed and the results are presented for both the HRS and SCF.
Without restricting the sample to workers expecting a pension from a current or past employer, blacks
and Hispanics expect substantially less than whites in pension benefits. In the HRS data, whites expect
an age 65 retirement benefit averaging $11,694; blacks expect $7,185; and Hispanics expect only $4,306.
In the SCF data, the corresponding statistics are $16,967; $14,152, and $9,504. In both data sets, the
shortfall in black and Hispanic benefits relative to that of whites is statistically significant at the .05
level. However, when the analysis is done separately by sex, the shortfall for blacks and Hispanics is
statistically significant at the .05 level only for men in both data sets. In fact, black females have
expected benefits that are significantly higher than white women in the SCF data.
When the analysis is restricted to workers covered by a pension, a different picture emerges.
Among men, blacks and Hispanics expect lower pension benefits than whites but the differences are not
6

statistically significant at the .05 level. Among women, mean benefits are consistently lowest among
whites in the two data sets but the differences are not statistically significant.
The major conclusions to be drawn from the above analysis are (i) in the population as a whole,
blacks and Hispanics expect lower levels of pension benefits; (ii) the shortfall in black and Hispanic
pension benefits relative to whites is largely a male phenomenon; and (iii) given that a pension benefit is
expected, blacks and Hispanics expect pension benefits that are comparable to those expected by whites.
The fact that expected pension benefits among workers expecting a pension are similar across
racial and ethnic groups is somewhat surprising given that blacks and Hispanics have lower earnings on
average. This might suggest that blacks and Hispanics devote a larger share of their earnings to pension
saving. To determine whether this is the case, we control for the effect of labor market experience and
earnings history and pension accumulation.
To examine how pension accumulation compares across racial and ethnic groups, focus is placed
on workers currently covered by a pension plan and the features of the plan. Pension coverage from past
employers is not considered because too little is known about the provisions of past plans in the HRS and
SCF data to calculate a pension saving rate. In table 5, estimates of average pension benefits are
presented for workers currently covered by a pension. Since these estimates exclude benefits from
pensions with prior employers, the mean benefit levels are slightly lower than those presented in table 4.
Nevertheless, excluding benefits from past pensions has little effect on the patterns observed earlier.
Mean pension benefits are highest among whites and lowest among Hispanics; racial and ethnic
differences are more pronounced among men than women; and racial and ethnic differences in expected
pension benefits are relatively modest among workers covered by a pension.
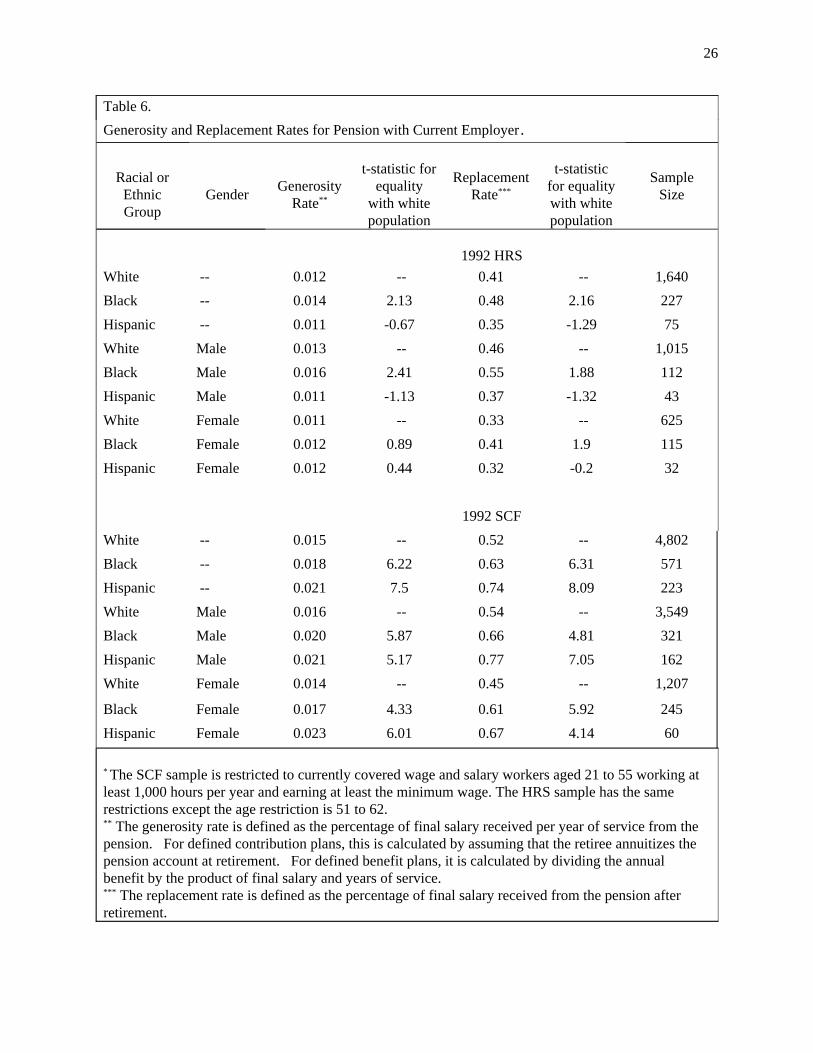
To provide some indication of the fraction of income replaced and the level of pension saving,
two additional pension statistics are presented in table 6. First, the replacement rate represents the age 65
pension annuity as a percentage of projected income at age 65. Second, the generosity rate represents
the percentage of age 65 income replaced per year of service with the employer. The generosity rate is
7

frequently included as part of a defined benefit formula. For defined contribution plans, the higher is the
saving rate, the higher the implied generosity rate. A comparison of replacement rates removes the
effect of salaries on pension benefits. That is, for example, if two workers are in identical defined
benefit or defined contribution plans but one worker has twice the income of the other, her benefit will be
twice as high but her replacement rate will be identical. A comparison of generosity rates helps control
for the effect of both salaries and years of service on benefits.
The evidence on replacement rates in both the HRS and SCF indicates that, for both men and
women, blacks have higher replacement rates than whites. The evidence on Hispanics in the two data
sets is mixed, however. In the HRS, there is no statistically significant difference in replacement rates
between Hispanics and whites for either men or women. In the SCF, replacement rates are higher for
Hispanics than whites for both men and women.
The range of replacement rates is generally higher in the SCF than the HRS. This could indicate
that the pensions held by younger workers are more generous since the SCF represents a younger sample
of people. Alternatively, it might indicate that the assumptions used to forecast benefits are too
optimistic in terms of how the future will affect retirement benefits. For example, since the forecasts
assume no employee turnover and no expenditure of pension savings prior to retirement, the forecast of
benefits may be too high. The consequences of this will be greater in the SCF since it has younger
workers.
Another possible explanation for differences in replacement rates could be differential time with
the employer at the time of the survey. To control for the effect of years of service on the measure of
pension saving, generosity rates (i.e. the replacement rate divided by years of service) are compared. In
both the HRS and SCF, black men accumulate a larger fraction of salary per year of service than white
men. Among Hispanic men, the results differ between the HRS and SCF. In the HRS, there is no
significant difference between the generosity of white and Hispanic men. In the SCF, Hispanic men have
significantly higher generosity rates. The HRS and SCF results on generosity rates also differ for
8

women. In the HRS, black and Hispanic women have generosity rates that are not significantly different
than that of white women. In the SCF, black and Hispanic women have significantly higher generosity
rates. The different results across data sets could reflect the fact that the SCF sample is younger than the
HRS sample.
Given that black men and women have higher pension generosity rates than their white
counterparts, it is natural to ask why this is the case. In an attempt to provide an understanding of the
source of the differential, a model of generosity rates was estimated to allow for a decomposition of the
racial difference in generosity rates. Included in the list of explanatory variables for generosity rates
were the worker’s industry, occupation, firm and plant size, union status, income, experience, education
age, and the type of plan (i.e. defined benefit, defined contribution, or both). The regression model for
generosity rates had statistically significant explanatory power but could explain only a small fraction of
the variation in generosity rates across workers. 11 Moreover, use of the regression coefficients for white
men or women to perform a decomposition of racial and ethnic differences in generosity rates revealed
that virtually none of the gap in generosity rates can be explained .
Since the explanatory variables available in the data sets cannot explain the higher pension
generosity rates of blacks, it is worth speculating as to what excluded variables might be responsible.
One obvious omission is whether the pension is a private or public pension plan. To a certain degree,
this will be accounted for by the industry controls in the model but these are by no means perfect.
Another possibility is that, in the pensions where workers are given control over the decision of how
much to save, blacks may choose to save a larger fraction than whites. This is consistent with evidence
found in other work (Even and Macpherson 1998) where, ceteris paribus, black men are found to
contribute more to 401(k) plans than white men.
9
11 The statistical significance of the regressions was based on an F-test of the null hypothesis that all coefficients inthe regression, with the exception of that on the intercept, were equal to zero. For white men and women, the F-testsrejected the null at the .001 significance level. The conclusion that only a small fraction of the variation ingenerosity rates can be accounted for by the explanatory variables is based on the fact that the adjusted R-squared inthe regression equations ranged between .06 and .18.
4. Pension and Racial Differences Wealth.
The evidence presented in the previous section suggests that, controlling for worker
characteristics, blacks and Hispanics are as likely as whites to have a pension. Also, among workers with
a pension, blacks actually save a larger fraction of their salaries. While pension income is an important
source of retirement income, it is important to consider all the wealth that has been accumulated to
measure differences in the standard of living beyond retirement.
In this section, we report on racial and ethnic differences in wealth using the SCF and HRS data.
Wealth in both data sets is the sum of all financial assets ( stocks, bonds, home equity, checking and
saving accounts balances) less non-mortgage debt. We also generate an estimate of pension wealth at the
worker’s current age. For defined contribution plans, pension wealth includes the account balance for
pensions with current and past employers. For defined benefit plans, pension wealth includes the present
value of the annuity that is promised if the worker was to retire at age 65 but terminate employment
today. For this calculation, we compute the present value of the defined benefit annuity based on years
of service at the worker’s current age but use the estimate of the workers’ real earnings at retirement.
Using estimates of real earnings at retirement (instead of current earnings) assumes that workers
accumulate pension savings in a defined benefit plan according to an “ implicit contract model” instead of
a “legal liability” model. Among others, Ippolito (1985) provides evidence that the legal theory of
pension accumulations in defined benefit plans is not consistent with the manner in which defined benefit
plans affect earnings profiles.12 Since it is difficult to divide financial assets between spouses in
married households, all the net worth calculations for couples pool financial and pension assets of the
partners.
10
12 The annuity factors and interest rates necessary for estimating the present value of the annuity are identical tothose described in the data appendix.
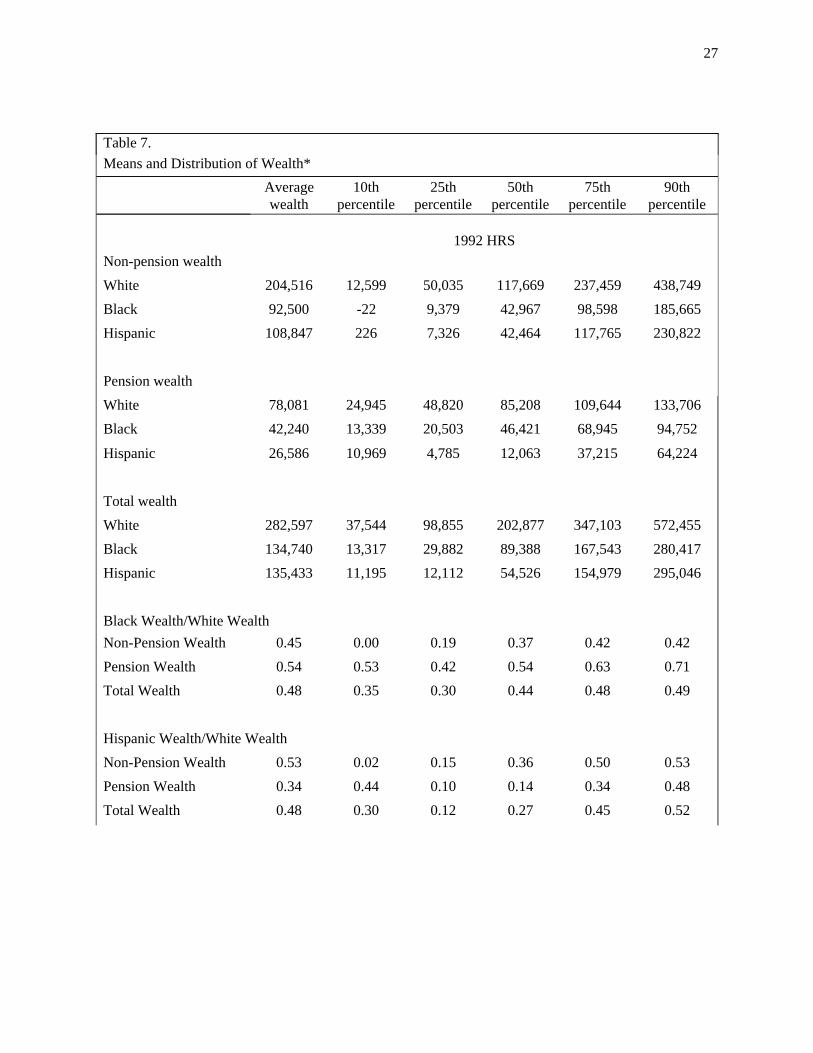
Table 7 provides a summary of wealth with and without pensions by racial and ethnic groups.
To provide some indication of the distribution of wealth, we also report “decile means” for non-pension
wealth, pension wealth, and total wealth.13 By construction, the decile means of the parts (non-pension
wealth and pension wealth) sum to the whole (total wealth) .
Several patterns stand out in the data. First, total wealth of blacks and Hispanics is substantially
lower than that of whites in both the HRS and SCF. In the HRS, the mean of total wealth is $134,740
among blacks, $135,433 among Hispanics and $282,597 among whites. Thus, among workers
approaching retirement (i.e. 51-61 year olds) whites have accumulated nearly twice as much in total
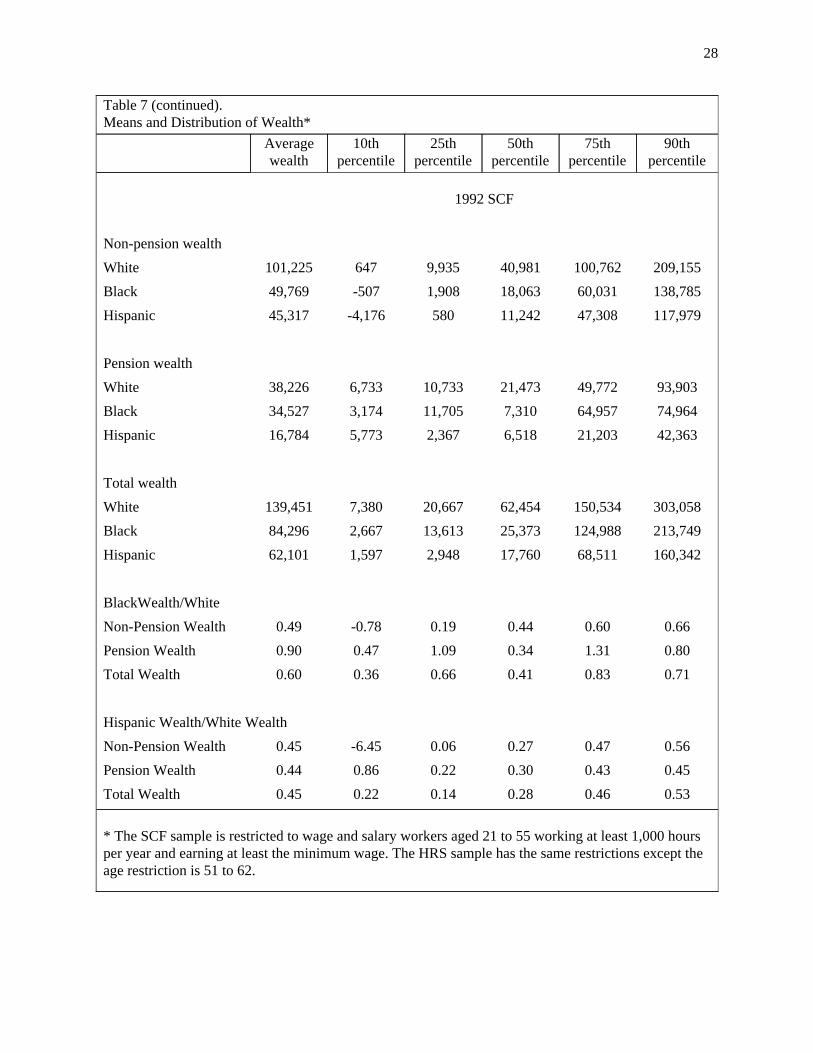
wealth as blacks and Hispanics. The mean level of total wealth in the SCF among whites, blacks, and
Hispanics are respectively $139,451; $84,296; and $62,101. As in the older HRS sample, total wealth of
blacks and Hispanics is approximately one half of that for whites. Given that the SCF sample consists of
workers of younger workers than the HRS, the lower level of wealth in the SCF sample is not surprising.
The black-white wealth ratios we find in the HRS and SCF are substantially higher than those
found in earlier studies. For example, Menchik and Jianakoplos (1997) reports that, in the 1989 Survey
of Consumer Finances, the black-white ratio of non-pension household wealth is .23. Smith (1995) uses
the 1992 HRS and finds a black-white ratio of non-pension household wealth of .27. Both of these
estimates are substantially lower than reported here. The most significant difference between our study
and these is that we restrict our analysis to people who work 1000 or more hours per year and earn a
wage of at least $4.25 per hour. The aforementioned studies do not exclude households on the basis of
employment status. Since the black population has a larger fraction of people that are unemployed or out
of the labor force, our analysis excludes a larger fraction of people with low levels of income (and
11
13 To compute a “decile mean”, we first rank people according to their total wealth. We then take all workerswithin 5% (plus or minus) of the relevant percentile of interest. The means of the variables of interest (non-pensionwealth, pension wealth, and total wealth) are then computed for this sub-group. For example, to compute the decilemean at the 25th percentile, we take all workers that have total wealth that ranks them between the 20th and 30thpercentile. For this sub-group, means are calculated for each of the wealth measures.

wealth) in the black population.14 The reason we exclude the part-time and non-employed population is
that we are interested primarily in the role of pensions on the wealth distribution.
To examine how pension saving affects the distribution of wealth, wealth ratios are computed
with and without pension wealth included. When pension wealth is added to the wealth measure, the
black-white ratio of mean wealth rises from .45 to .48 in the HRS and from .49 to .60 in the SCF. For
the Hispanic-white comparison, adding pension wealth decreases the wealth ratio in the HRS from .53 to
.48 but has not effect on the ratio in the SCF.
While the addition of pension wealth has relatively modest effects on the ratio of black and
Hispanic wealth at the mean, the effects differ substantially across the wealth distribution. For all the
racial and ethnic groups, pension wealth is a larger fraction of total wealth at the lower end of the wealth
distribution. Moreover, at the lower end of the wealth distribution, black and Hispanic workers have a
larger fraction of wealth in pension assets than whites. As a consequence, the addition of pension wealth
has a greater effect on black and Hispanic wealth relative to whites among households at the lower end of
the wealth distribution.
The large racial and ethnic differences in wealth accumulation could be the result of different
earnings, age, or other factors that might influence saving behavior. To examine why wealth
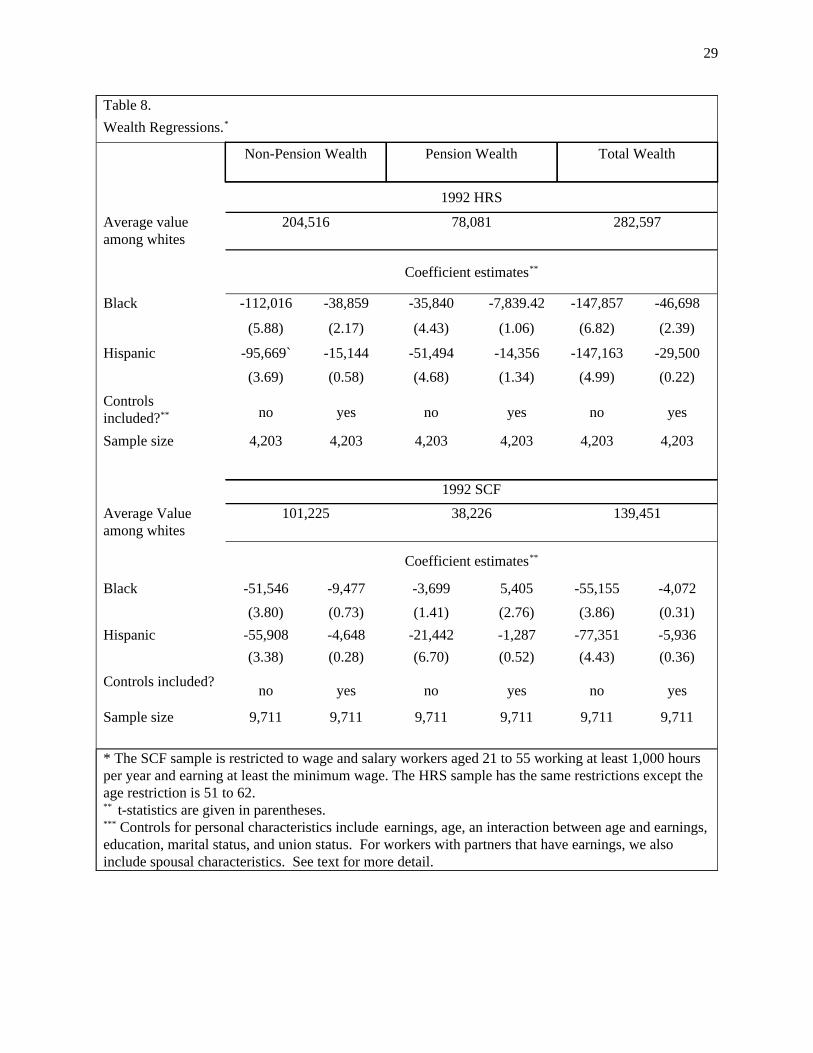
accumulation among blacks and Hispanics are lower, a regression approach is followed. Table 8 presents
the results of wealth regressions for blacks, whites, and Hispanics pooled. Dummy variables are included
to indicate whether a person is black or Hispanic. The model is estimated with and without controls for
characteristics that might influence wealth accumulation. The additional controls in the regression
include earnings and its square, age and its square, an interaction between age and earnings, education,
marital status, and union status. For workers with partners that have earnings, we also include spousal
earnings and its square (set equal to zero for single workers and for spouses that are self-employed), a
12
14 In 1996, the employment-population ratio for the population over age 16 was 64.1 among whites and 57.4 amongblacks. The unemployment rates for the civilian non-institutionalized population were 4.7 percent among whites and11.1 percent among blacks.

dummy variable indicating whether a person has a spouse that is self-employed, the spouse’s years of
education and its square, and the spouses earnings interacted with age. For single workers, all the
spousal variables are set equal to zero.
For each of the three wealth measures (non-pension, pension, and total wealth), we report the
results of a regression of the wealth measures on a black and Hispanic dummy with and without controls
for household characteristics. The results from the HRS regressions with only the black and Hispanic
dummies match the results on average levels of wealth found in the table 7. The coefficients on racial
and ethnic dummies indicate the size of the racial or ethnic gap relative to the white reference group.
Including the control variables substantially reduces the size of the coefficients on the black and Hispanic
dummies. For example, in the non-pension wealth equation, the coefficient on the black dummy
variable drops from -112,016 to -38,859 when controls for household characteristics are included. The
coefficient on the Hispanic dummy drops from -95,669 to -15,144. Consequently, approximately 65
percent of the shortfall in black non-pension wealth relative to whites can be accounted for by the
controls included in the regression. For Hispanics, approximately 85 percent of shortfall can be
explained.
When total (pension plus non-pension) wealth is considered, the results are quite similar.
Approximately 70 percent of the black-white gap in total wealth is accounted for by differences in
household characteristics; approximately 80 percent of the Hispanic-white gap can be explained.
After controlling for worker characteristics, pension wealth has relatively little effect on racial
and ethnic differences in average wealth. Given the regression coefficients and assuming average
characteristics, blacks are estimated to have 81 percent as much non-pension wealth as whites, and 83
percent as much total wealth; Hispanics are estimated to have 93 percent as much non-pension wealth as
whites, and 90 percent as much total wealth. However, in the case of Hispanics, the shortfall in
non-pension wealth and total wealth relative to whites is statistically insignificant after controlling for
household characteristics.
13

5. Summary and Conclusions.
Several studies establish that blacks and Hispanics have less wealth than whites. This study
examined the extent to which pensions contribute to differential wealth accumulation. In our analysis of
the September 1994 CPS, we demonstrated that, among people out of the labor force over age 55, blacks
and Hispanics are substantially less likely to have pension coverage than whites. However, among those
receiving a pension, expected benefits among black and Hispanic workers are quite similar to whites.
The lack of information on prior labor market history in the CPS data, however, preclude an investigation
of the source of these patterns.
Using data from the 1992 Survey of Consumer Finances (SCF) and the 1992 Health and
Retirement Survey (HRS), we examine prospects for racial and ethnic differences in pension wealth
among people working in 1992. The HRS and SCF are similar in that they both provide extensive
information on pension plans and other financial assets. The major difference is that the HRS focuses on
workers approaching retirement (aged 51-62). Our subsample of the SCF included workers between the
ages of 21 and 55.
The analysis of the HRS and SCF revealed that blacks and Hispanics expect substantially less in
pension benefits than whites in the male, but not the female, population. However, when the analysis is
In the SCF data, the absolute gap in wealth is much smaller than in the HRS data. This is
expected given the younger ages of the workers and the smaller amounts of wealth accumulated. In the
SCF, blacks and Hispanics have a statistically significant shortfall in non-pension and total wealth
relative to whites. However, after controlling for household characteristics, there is no statistically
significant shortfall for blacks or Hispanics. Thus, in the younger sample, while there are substantial
racial and ethnic differences in wealth accumulation, the differences can be entirely accounted for by a
small number of observed household characteristics.
14
restricted to workers expecting a pension benefit, benefits among black and Hispanic workers are quite
similar to those among white workers. This is similar to the result found in the September 1994 CPS for
retired people. We also find some evidence that, when covered by a pension, black and Hispanic men
and women accumulate a larger fraction of their salary in pensions, holding worker characteristics
constant.
Finally, this study examined the importance of including pension saving in calculating racial and
ethnic differences in wealth. Comparing mean levels of wealth (including pension wealth), blacks and
Hispanics have approximately one-half as much wealth as whites. The inclusion of pension wealth has
little effect on the average wealth position of the minority groups relative to whites. However,
examination of wealth differentials at different points of the wealth distribution reveals that pensions
reduce the black-white and Hispanic-white wealth gap primarily at the bottom end of the wealth
distribution. This reflects the fact that the fraction of wealth held in pensions is largest among low
wealth households and this pattern is more pronounced in the black and Hispanic populations.
While Hispanics and blacks accumulate substantially less wealth than whites, our study finds that
differences in earnings, education, spousal earnings, and other measures of household characteristics can
account for virtually all of the racial and ethnic differences in wealth accumulation. Moreover, this result
holds whether pension wealth is included or excluded from the measure of total wealth. Thus, the
evidence suggests that differences in average wealth are neither amplified or dampened by racial or
ethnic differences in pension saving.
What conclusions can be drawn from our study? First, while blacks and Hispanics accumulate
substantially less wealth than whites, our results suggest that the majority of the differential can be
accounted for by their lower earnings and other personal characteristics. One need not rely on racial or
ethnic differences in attitudes about saving, life expectancy, or family structure to explain the majority of
the difference in wealth accumulation. It should be emphasized, however, that our results apply to the
15
working population only. To the extent that blacks and Hispanics are less likely to be employed and this
reduces wealth accumulation, this conclusion might not apply.
A second conclusion to be drawn is that pension saving does not appear to amplify or dampen
mean differences in the accumulation of pension wealth. However, the impact of pension saving varies
across the wealth distribution. In particular, since there are more black and Hispanic workers in the
lower tail of the income distribution where wealth accumulation is very low, pension saving could have
a substantial effect on the wealth positions of the minority groups. Our evidence suggested that 51-61
year old blacks and Hispanics in at the tenth percentile of their group-specific wealth distribution had
less than $300 of non-pension wealth. For whites, the tenth percentile had over $12,000 of non-pension
wealth. The most meager pension plan would substantially improve the relative wealth position of blacks
and Hispanics at the lower end of wealth distribution.
16

References
Blau, Francine D. and Graham, John W. “Black-White Differences in Wealth and Asset Composition” Quarterly Journal of Economics 105 (May 1990): 321-39.
Employee Benefit Research Institute, EBRI Databook on Employee Benefits, 4th edition, 1997.
Even, William E., and Macpherson, David A. “The Impact of Rising 401(k) Pension Coverage on FuturePension Income.* Report submitted to Pension and Welfare Benefits Administration, U.S.Department of Labor, 1998.
Ippolito, Richard A. “The Labor Contract and True Economic Pension Liabilities,” American EconomicReview 75 (December 1985): 1031-43.
Menchik, Paul L. and Jianakoplos, Nancy Ammon. “Black-White Wealth Inequality: Is Inheritance theReason?” Economic Inquiry 35 (April 1997): 428-42.
Montalto, Catherine P., and Sung, Jaimie. “Multiple Imputation in the 1992 Survey of ConsumerFinances,” Financial Counseling and Planning 7 (1996): 133-146.
Oliver, Melvin L. and Shapiro, Thomas M. Black Wealth/White Wealth: A New Perspective on RacialInequality, New York: Routledge, 1995
Smith, James P. “Racial and Ethnic Differences in Wealth in the Health and Retirement Study.” Journalof Human Resources 30 (Suppl. 1995): S158-83.
Snyder, Donald C. “A Data Base with Income and Assets of New Retirees by Race and HispanicOrigin.” Review of Black Political Economy 17 (Spring 1989): 73-81.
Society of Actuaries Group Annuity Valuation Task Force, “1994 Group Annuity Mortality Tables and1994 Group Reserving Table,” Transactions of the Society of Actuaries 107 (1996): 865-913.
17

Data Appendix: Estimation of Retirement Benefits in the HRS and SCF.
In the Health and Retirement Survey (HRS) and the Survey of Consumer Finances (SCF),
information is provided on pension coverage from current and past jobs. For current jobs, both data sets
indicate the type of plan(s) that the worker has, the number of years in the plan, and other information
that we use to forecast future retirement income at age 65.
In the case of DB plans, workers are asked when they expect to retire and the benefits they will
receive at retirement. Benefits may be reported as either a percentage of final pay or as an absolute
amount. To estimate what benefits are to be received at age 65, the following steps are taken. First, we
project earnings at retirement by assuming a 1.1 percent annual growth rate in real wages. To translate
this into a benefit at age 65, a “generosity factor” (the percentage of final pay replaced per year of
service) is computed by dividing expected benefits at retirement by the product of years in plan and
salary at retirement.15 Benefits for an age 65 retirement are calculated as the product of the age 65 value
of forecast earnings, number of years of service at 65, and the generosity factor.
For DC plans, information is provided on the current balance in the plan and the amount that the
employer and employee contribute. To project the balance in the pension plan at age 65 in 1992 dollars,
the current balance is compounded forward with real interest rates to age 65. The real interest rate is
assumed to be equal to the yield on indexed Treasury bills in February 1998 (3.7 percent). Between
1992 and the year that the worker reaches age 65, it is assumed that both employer and employee
contributions remain at the same percentage of pay and that real salary growth continues at 1.1 percent.
All workers are assumed to live to age 65 with certainty. Benefits from DC plans are converted
into a single life annuity by applying annuity factors to the projected DC balance at age 65. In the case
of benefits that a worker expects to receive from prior pension plans, both the HRS and SCF indicate the
18
15 Our methodology assumes that people report expected benefits in 1992 dollars.
type of pension (i.e. DB or DC). However, when a lump sum was received or a person is currently
receiving a benefit, only the HRS provides information on the type of pension. In both cases, it is
possible to tell whether a person received a lump sum distribution at some point in the past, is currently
receiving benefits, or expects to receive benefits in the future. In the HRS, workers receiving lump sums
indicate whether they saved or spent it. Only those balances that were saved are counted as benefits
from past pensions. Unfortunately, in the SCF, no such information is available. To adjust for this,
estimates of the percentage of workers that save lump sum distributions by age of receipt, provided by
EBRI (1997), are used to randomly assign workers into categories indicating whether they saved their
lump sum distributions. 16 For those with a lump sum that was saved, an equivalent age 65 annuity is
computed as follows: (1) the lump sum is compounded forward to 1992 assuming historical interest
rates;17 (2) the 1992 balance is compounded forward from 1992 to the year the person reaches age 65
using an assumed real interest rate of 3.7 percent (the rate on indexed Treasury bills); (3) the lump sum
is converted into an annuity at age 65.18 The annuity calculation assumes constant nominal payments and
uses an assumed nominal interest rate beyond 1992 equal to that on 10 year Treasury bills in 1992 (7.0
percent) and the mortality table for group annuitants provided by the Society of Actuaries. 19 Using these
assumptions, we estimate that a $100 payment at age 65 would buy a life annuity of $9.63 per year. 20
19
20 It is worth noting that we ignore differences between DB and DC plans in terms of survivor or disability benefits. In DC plans, the survivor has the right to the account balance. In DB plans, the survivor benefit is generallyspecified according to some formula tied to the worker’s years of service and final salary.
19 The source of the mortality rates is Society of Actuaries Group Annuity Valuation Task Force (1996), Table 13.The group annuitant mortality tables provide gender specific mortality rates. We compute an average mortality rateby taking a weighted average of the gender specific mortality rates where the weights represent the predicted fractionof the population of a given gender based on their mortality experience assuming each sex is half of the population atage 65.
18 When a worker receives cost-of-living adjustments, the real interest rate is used to compute the annuity rate.Otherwise, nominal rates are used.
17 Interest rates prior to 1992 (the survey dates in HRS and SCF) are assumed equal to the rates observed onone-year U.S. Treasury bills plus .28 percent. We added .28 percent to the one year treasury rate to allow for thefact that returns on pension contributions will likely reflect interest rates on a longer term investment. The .28percent per year is one-half of the average premium that 5 year bonds paid relative to one year bonds between 1953and 1992.
16 Using table 17.3 of EBRI (1997), we estimated the percentage of workers that used all of their lump sum foreither (i) tax qualified saving; (ii) non-tax qualified saving; or (iii) a mix of the two. This is a conservative estimateof the percentage of lump sums saved. The fraction of lump sums saved, by age group, are: 8.3 percent for 16-20year olds; 21.7 for 21-30 year olds; 35 for 31-40 year olds; 40.2 for 41-50 year olds; 56.8 for 51-60 year olds; 57.6for 61-64 year olds; and 21.4 for those 65 and over.
Separate calculations are required for pension benefits that workers have already received or expect to
receive from a past job. For workers that report they are currently receiving benefits, we calculate the
age 65 equivalent annuity as follows: First, we compute the present value (in 1992 dollars) of benefits
received between the starting age and 65. Second, we compute the lump sum cost of a life annuity
starting at age 65 equal to the annual benefit paid by the pension. These two parts are added and then
converted into an age 65 life annuity. When the benefits are indexed for inflation, appropriate
adjustments are made to reflect the growth in nominal benefits over time. 21
For workers that expect a future benefit, it may be either a lump sum or an annual benefit. For
annual benefits that start before age 65, we estimate the expected present value of the annuity assuming
the person lives with certainty to age 65 and has survivor probabilities given by the group annuitant
mortality tables beyond age 65. For a person that expects to receive benefits starting after age 65, we
estimate the expected present value of the annuity (again accounting for survival probabilities beyond age
65) and discount back to age 65. When cost-of-living adjustments are expected with future benefits,
appropriate adjustments are made in evaluation of the annuity.
20
21 Inflation prior to 1992 is measured by historical movements in the Consumer Price Index. Inflation beyond1992 is assumed equal to 2.7 percent which equals the difference between the nominal yield on 10 year bonds andthe real yield on indexed Treasury bills in 1998. When evaluating an annuity that is indexed for inflation, the realinterest rate is used instead of the nominal rate.
* Data source is September 1994 Current Population Survey.
301-6.7224.3-5.3416.3 --0Hispanic702-5.6432.8-5.420.9 --0Black
8,552 --43.7 --30.6 --0WhitePrivate sector employees
170.6876.5-0.3658.8 --100Hispanic
123-1.5561.8-1.6655.3 --100Black823 --68.8 --63.1 --100White
Public sector employees318-6.6627.0-5.5718.62.1494.7Hispanic825-4.8837.1-4.3526.1-5.8385.1Black
9,375 --45.9 --33.5 --91.2White
SampleSize
t-statisticfor equalitywith whitepopulation
% ever coveredby a pension.
t-statistic forequality with
whitepopulation
% receiving pensionbenefits
t-statistic forequality
with whitepopulation
% whose longestjob was in private
sectorRacial or Ethnic Group.
Pension Recipiency Rates for Persons 55 and Older who are not in the Labor Force*Table 1
21
* Data source is September 1994 Current Population Survey.
380.89$10,401 --0Hispanic113-0.49$8,052 --0Black
2,017 --$8,629 --0White9-0.28$17,084 --100Hispanic47-2.69$12,278 --100Black390 --$18,591 --100White
Public sector employees
470.73$11,680-0.5483.0Hispanic160-0.87$9,293-4.3168.4Black
2,407 --$10,244 --83.5White
Sample Sizet-statistic for equalitywith white population
Average PensionBenefit
t-statistic for equalitywith white population
% whose longest jobwas in private sector
Racial or Ethnic Group.
Benefits on Main Pension Plan for Persons 55 and Older Receiving Pension Benefits*Table 2
22

Note: The SCF sample is restricted to wage and salary workers aged 21 to 55 working at least 1,000 hours per year and earning at least theminimum wage. The HRS sample has the same restrictions except the age restriction is 51 to 62.
15518766.744.363.541.2FemaleHispanic32341072.967.265.260.8FemaleBlack
1,8502,30074.261.666.057.4FemaleWhite11452763.440.652.735.0MaleHispanic43865680.460.471.658.6MaleBlack
1,5805,92688.167.277.062.6MaleWhite
26971564.741.657.036.6 --Hispanic7611,07776.262.868.059.3 --Black
3,4308,34981.765.271.960.7 --White
1992 HRS1992 SCF1992 HRS1992 SCF1992 HRS1992 SCFGenderRace/EthnicSample Size
% Covered by Pension witheither Current or Past Employer
% Covered by Pension withCurrent Employer
Pension Coverage Rates from Current and Past Employers.Table 3.
23
* The SCF sample is restricted to wage and salary workers aged 21 to 55 working at least 1,000 hoursper year and earning at least the minimum wage. The HRS sample has the same restrictions except theage restriction is 51 to 62.
601.2622,663165-1.678,519HispanicFemale2721.7121,3503992.5614,156BlackFemale
1,310 --18,5902,251 --11,310WhiteFemale190-1.3925,720507-7.239,815HispanicMale331-1.8925,574599-3.9514,475BlackMale
3,817 --28,9875,807 --19,350WhiteMale
251-0.6724,953673-6.979,504 --Hispanic608-2.1823,4581,009-3.1814,152 --Black
5,173 --26,2598,181 --16,967 --White
1992 SCF
370.0910,605114-0.863,680HispanicFemale1331.4112,778438-1.413,813BlackFemale749 --10,3571,580 --4,841WhiteFemale48-1.9315,509155-4.724,720HispanicMale
141-0.2525,150323-2.9411,500BlackMale1,230 --26,0041,848 --17,590WhiteMale
85-1.8813,399269-4.274,306 --Hispanic274-0.319,520761-4.067,185 --Black
1,979 --20,1693,428 --11,694 --White1992 HRS
SampleSize
t-statisticfor
equalitywith whitepopulation
AveragePensionBenefit
SampleSize
t-statisticfor equalitywith whitepopulation
AveragePensionBenefit
GenderRacial or
EthnicGroup
Workers Covered by a Current or PastEmployer PensionAll Workers
Projected Benefits at Age 65 from Pensions with Current and Past Employers. *Table 4.
24

Note: The SCF sample is restricted to wage and salary workers aged 21 to 55 working at least 1,000hours per year and earning at least the minimum wage. The HRS sample has the same restrictionsexcept the age restriction is 51 to 62.
601.222,663165-1.298,519HispanicFemale2452.3822,8133992.7813,626BlackFemale
1,207 --18,7802,251 --10,615WhiteFemale1620.0630,005507-6.799,680HispanicMale321-2.0825,981599-3.5714,185BlackMale
3,549 --29,8475,807 --18,538WhiteMale
2230.527,993673-6.449,401 --Hispanic571-1.9324,3621,009-2.7813,770 --Black
4,802 --26,9408,181 --16,200 --White
1992 SCF
32-0.389,970114-0.953,099HispanicFemale1151.0713,200438-1.293,432BlackFemale
625 --11,1731,580 --4,339WhiteFemale43-1.8414,679155-4.024,061HispanicMale
112-1.0520,820323-3.317,754BlackMale1,015 --24,4401,850 --13,689WhiteMale
75-1.9312,669269-3.753,678 --Hispanic227-1.0317,225761-4.185,328 --Black
1,639 --19,4953,430 --9,367 --White
1992 HRS
SampleSize
t-statisticfor equalitywith whitepopulation
AveragePensionBenefit
SampleSize
t-statisticfor equalitywith whitepopulation
AveragePensionBenefit
Workers Covered by a CurrentEmployer PensionAll Workers
GenderRacial or
Ethnic Group
Projected Benefits at Age 65 from Pensions with Current Employers. *
Table 5.
25
* The SCF sample is restricted to currently covered wage and salary workers aged 21 to 55 working atleast 1,000 hours per year and earning at least the minimum wage. The HRS sample has the samerestrictions except the age restriction is 51 to 62. ** The generosity rate is defined as the percentage of final salary received per year of service from thepension. For defined contribution plans, this is calculated by assuming that the retiree annuitizes thepension account at retirement. For defined benefit plans, it is calculated by dividing the annualbenefit by the product of final salary and years of service.*** The replacement rate is defined as the percentage of final salary received from the pension afterretirement.
604.140.676.010.023FemaleHispanic2455.920.614.330.017FemaleBlack
1,207 --0.45 --0.014FemaleWhite1627.050.775.170.021MaleHispanic3214.810.665.870.020MaleBlack
3,549 --0.54 --0.016MaleWhite2238.090.747.50.021 --Hispanic5716.310.636.220.018 --Black
4,802 --0.52 --0.015 --White1992 SCF
32-0.20.320.440.012FemaleHispanic1151.90.410.890.012FemaleBlack625 --0.33 --0.011FemaleWhite43-1.320.37-1.130.011MaleHispanic
1121.880.552.410.016MaleBlack1,015 --0.46 --0.013MaleWhite
75-1.290.35-0.670.011 --Hispanic2272.160.482.130.014 --Black
1,640 --0.41 --0.012 --White1992 HRS
SampleSize
t-statisticfor equalitywith whitepopulation
ReplacementRate***
t-statistic forequality
with whitepopulation
GenerosityRate**Gender
Racial orEthnicGroup
Generosity and Replacement Rates for Pension with Current Employer.Table 6.
26
0.520.450.270.120.300.48Total Wealth0.480.340.140.100.440.34Pension Wealth0.530.500.360.150.020.53Non-Pension Wealth
Hispanic Wealth/White Wealth
0.490.480.440.300.350.48Total Wealth0.710.630.540.420.530.54Pension Wealth0.420.420.370.190.000.45Non-Pension Wealth
Black Wealth/White Wealth
295,046154,97954,52612,11211,195135,433Hispanic280,417167,54389,38829,88213,317134,740Black572,455347,103202,87798,85537,544282,597White
Total wealth
64,22437,21512,0634,78510,96926,586Hispanic
94,75268,94546,42120,50313,33942,240Black133,706109,64485,20848,82024,94578,081White
Pension wealth
230,822117,76542,4647,326226108,847Hispanic185,66598,59842,9679,379-2292,500Black438,749237,459117,66950,03512,599204,516White
Non-pension wealth1992 HRS
90thpercentile
75thpercentile
50thpercentile
25thpercentile
10thpercentile
Averagewealth
Means and Distribution of Wealth*Table 7.
27
* The SCF sample is restricted to wage and salary workers aged 21 to 55 working at least 1,000 hoursper year and earning at least the minimum wage. The HRS sample has the same restrictions except theage restriction is 51 to 62.
0.530.460.280.140.220.45Total Wealth0.450.430.300.220.860.44Pension Wealth0.560.470.270.06-6.450.45Non-Pension Wealth
Hispanic Wealth/White Wealth
0.710.830.410.660.360.60Total Wealth0.801.310.341.090.470.90Pension Wealth0.660.600.440.19-0.780.49Non-Pension Wealth
BlackWealth/White
160,34268,51117,7602,9481,59762,101Hispanic213,749124,98825,37313,6132,66784,296Black303,058150,53462,45420,6677,380139,451White
Total wealth
42,36321,2036,5182,3675,77316,784Hispanic74,96464,9577,31011,7053,17434,527Black93,90349,77221,47310,7336,73338,226White
Pension wealth
117,97947,30811,242580-4,17645,317Hispanic138,78560,03118,0631,908-50749,769Black209,155100,76240,9819,935647101,225White
Non-pension wealth
1992 SCF
90thpercentile
75thpercentile
50thpercentile
25thpercentile
10thpercentile
Averagewealth
Table 7 (continued). Means and Distribution of Wealth*
28
* The SCF sample is restricted to wage and salary workers aged 21 to 55 working at least 1,000 hoursper year and earning at least the minimum wage. The HRS sample has the same restrictions except theage restriction is 51 to 62. ** t-statistics are given in parentheses. *** Controls for personal characteristics include earnings, age, an interaction between age and earnings,education, marital status, and union status. For workers with partners that have earnings, we alsoinclude spousal characteristics. See text for more detail.
9,7119,7119,7119,7119,7119,711Sample size
yesnoyesnoyesnoControls included?
(0.36)(4.43)(0.52)(6.70)(0.28)(3.38)-5,936-77,351-1,287-21,442-4,648-55,908Hispanic(0.31)(3.86)(2.76)(1.41)(0.73)(3.80)-4,072-55,1555,405-3,699-9,477-51,546Black
Coefficient estimates**
139,45138,226101,225Average Valueamong whites
1992 SCF
4,2034,2034,2034,2034,2034,203Sample size
yesnoyesnoyesnoControlsincluded?**
(0.22)(4.99)(1.34)(4.68)(0.58)(3.69)-29,500-147,163-14,356-51,494-15,144-95,669`Hispanic
(2.39)(6.82)(1.06)(4.43)(2.17)(5.88)
-46,698-147,857-7,839.42-35,840-38,859-112,016Black
Coefficient estimates**
282,59778,081204,516Average valueamong whites
1992 HRS
Total WealthPension WealthNon-Pension Wealth
Wealth Regressions.*
Table 8.
29
Related Documents