REGINA P. BRANTON University of North Texas ERIN C. CASSESE West Virginia University BRADFORD S. JONES University of California, Davis Race, Ethnicity, and U.S. House Incumbent Evaluations This article considers evaluations of U.S. House incumbents under conditions of racial/ethnic congruence and incongruence. We consider whether different racial groups have ordered preferences among nondescriptive alternatives. We pose two theoretical models of descriptive representation and test them using pooled National Election Study data. After controlling for the propensity to recall the Member of Congress, we find the extent of favoritism towards descriptive representatives varies across groups, as does the preference ordering among representatives of different racial and ethnic identification. No evidence of race-based judgment is uncovered among African Americans, while Latinos and Whites demonstrate preferences based on race and ethnicity. Introduction The concept of descriptive representation—the idea that a represen- tative possesses an essential attribute linking her to a group whose members also possess the attribute—has received considerable scholarly attention. Research in this area, highlighted by the important works of Canon (1999), Lublin (1997) and others, has focused both on the electoral success of minority candidates and the implications of greater minority representation. There is some evidence that the mere presence of descriptive representation—independent of policy-based indicators of performance—affects constituents in meaningful ways. Americans repre- sented by a member of their own racial or ethnic group report more positive attitudes towards the political system, higher levels of political engagement, and, in some cases, participate more in political life (Banducci, Donovan, and Karp 2004; Bobo and Gilliam 1990; Gay 2002). These findings suggest descriptive representation contributes to ingroup favoritism and a minority empowerment effect—though the scope of these effects and the conditions under which they emerge is subject to debate. LEGISLATIVE STUDIES QUARTERLY, XXXVII, 4, November 2012 465 DOI: 10.1111/j.1939-9162.2012.00058.x © 2012 The Comparative Legislative Research Center of The University of Iowa

Welcome message from author
This document is posted to help you gain knowledge. Please leave a comment to let me know what you think about it! Share it to your friends and learn new things together.
Transcript

REGINA P. BRANTONUniversity of North Texas
ERIN C. CASSESEWest Virginia UniversityBRADFORD S. JONES
University of California, Davis
Race, Ethnicity, andU.S. House Incumbent Evaluations
This article considers evaluations of U.S. House incumbents under conditions ofracial/ethnic congruence and incongruence. We consider whether different racial groupshave ordered preferences among nondescriptive alternatives. We pose two theoreticalmodels of descriptive representation and test them using pooled National Election Studydata. After controlling for the propensity to recall the Member of Congress, we find theextent of favoritism towards descriptive representatives varies across groups, as does thepreference ordering among representatives of different racial and ethnic identification.No evidence of race-based judgment is uncovered among African Americans, whileLatinos and Whites demonstrate preferences based on race and ethnicity.
Introduction
The concept of descriptive representation—the idea that a represen-tative possesses an essential attribute linking her to a group whosemembers also possess the attribute—has received considerable scholarlyattention. Research in this area, highlighted by the important works ofCanon (1999), Lublin (1997) and others, has focused both on the electoralsuccess of minority candidates and the implications of greater minorityrepresentation. There is some evidence that the mere presence ofdescriptive representation—independent of policy-based indicators ofperformance—affects constituents in meaningful ways.Americans repre-sented by a member of their own racial or ethnic group report morepositive attitudes towards the political system, higher levels of politicalengagement, and, in some cases, participate more in political life(Banducci, Donovan, and Karp 2004; Bobo and Gilliam 1990; Gay 2002).These findings suggest descriptive representation contributes to ingroupfavoritism and a minority empowerment effect—though the scope of theseeffects and the conditions under which they emerge is subject to debate.
bs_bs_banner
LEGISLATIVE STUDIES QUARTERLY, XXXVII, 4, November 2012 465DOI: 10.1111/j.1939-9162.2012.00058.x© 2012 The Comparative Legislative Research Center of The University of Iowa
In this article, we examine the identity politics surrounding U.S.House incumbent evaluations. The racial and ethnic dimension of thesejudgments has taken on increasing importance as the U.S. populationhas become more diverse. Electoral arrangements, particularly single-member districts, constrain descriptive representation such that somegroups are invariably represented by a member of another group. Weconsider how individuals not only evaluate politicians sharing a commonracial/ethnic identity, but also politicians with a different identity. Weargue that an essential connection between the representative and therepresented will contribute to an ingroup bias based on constituentassumptions that shared group membership corresponds to sharedinterests. Thus, the descriptive cue is a rational shortcut used to inferinformation about the legislator that may otherwise be costly to obtain(Bianco 1994; Segura and Bowler 2005).
What if an individual is not represented by a member of her ownracial or ethnic group? Do whites prefer to be represented by a blacklegislator more than a Latino legislator (or vice versa)? Do Latino con-stituents more favorably evaluate an African American representativethan a white representative? Or will individuals be indifferent amongnondescriptive options, favoring their own group and that group alone?Given a common minority status and greater ideological proximity, onemight expect African Americans (Latinos) to prefer representationby a Latino (African American) legislator to representation by a whitelegislator. Alternatively, work on the “black-brown divide” suggestscompetition and animosity among minority groups will contribute tounfavorable ratings of Latino representatives by blacks and black repre-sentatives by Latinos.
Our analysis suggests race-based judgments of House incumbentsvary in interesting and consequential ways. The ability to recall the nameof one’s member of congress (henceforth MC), willingness to evaluatethe MC, and the favorability of the evaluation all point to group-basedperceptual biases. Controlling for the propensity to recognize and evalu-ate one’s own MC, we find that an MC’s race/ethnicity influences evalu-ations made by white and Latino respondents. African Americans’evaluations, alternatively, are not race based. These results afford insightinto the dynamics of representation in the U.S. House and point tocomplex processes that cannot be explained by ingroup favoritism alone.
Dyadic Descriptive Representation
The original conceptualization of descriptive representation con-sidered whether the composition of a governing body on the whole
466 Regina P. Branton, Erin C. Cassese, and Bradford S. Jones
represented the characteristics of the governed (Pitkin 1967). Weissberg(1978) distinguished between collective representation and dyadic rep-resentation, which is concerned with how well a specific legislator rep-resents his or her constituents. Dyadic representation takes on particularimportance given the way institutional context constrains descriptiverepresentation in the United States: legislators are elected from single-member districts by plurality voting. As there is only one representativeper district, descriptive representation is limited to the essential attribute(race/ethnicity) of that one legislator.
Much of the work relating descriptive representation to publicopinion and behavior focuses on dyadic representation. For instance,Bobo and Gilliam (1990) found the presence of a black mayor corre-sponded to higher levels of attention to politics, political efficacy, andpolitical participation among blacks. They attributed this to a minorityempowerment effect, a set of psychological benefits stemming from thepresence of group members in positions of authority. There is also someevidence that individuals are inclined to view their descriptive represen-tative in a more favorable light. Several works find black respondents rateblack elected officials more favorably than white respondents (e.g.,Banducci, Donovan, and Karp 2004; Howell and Perry 2000; Tate 2001).Alternatively, Gay (2002) finds no significant difference in black evalu-ations of black and white MCs. However, whites rate black MCs lessfavorably than white MCs.
Though this literature focuses on differences between white andAfrican American evaluations of white and African American MCs, thereis some evidence that Latinos are likewise affected by descriptive repre-sentation. For instance, Pantoja and Segura (2002) find that the presence ofLatinos in the state assembly, state senate, or U.S. House reduced politicalalienation among Latinos in Texas and California. Barreto, Segura, andWoods (2004; Barreto 2007) report a link between representation and thepolitical mobilization of Latinos, consistent with Bobo and Gilliam’s(1990) work on minority empowerment among African Americans.
Limitations of Existing Research
While this literature suggests descriptive representation has impor-tant attitudinal/behavioral implications for both minorities and whites, itsuffers from a few limitations. First, the time-period covered by many ofthese studies does not extend much past the mid-1990s.1 The 1992redistricting period introduced several majority-minority districts result-ing in large gains in minority representation (Banducci, Donovan, andKarp 2004; Endersby and Menifeld 2000). This study builds on existing
U.S. House Incumbents 467
work by extending the time frame well past the 1992 redistrictingperiod—to 2008. This allows us to incorporate more information aboutAfrican American MCs and particularly Latino MCs, as the number ofLatino MCs increased substantially in recent years: from 11 in 1990 to 24in 2008.
Second, the methodological approach used to examine MC evalu-ations fails to consider the contingent nature of evaluations on incumbentrecall and willingness to evaluate. Banducci, Donovan, and Karp (2004)examine the importance of MC recall and find that black respondentswere more likely to recall the name of black MCs than white MCs.However, the authors treat recall as a separate issue from evaluation. Thisis problematic given only respondents who recall or recognize the nameof their MC are asked to evaluate her. In order to more fully assess therelationship between respondent race/ethnicity and MC race/ethnicity onincumbent evaluations, we use an approach that accounts for the selec-tion bias posed by failing to recall one’s incumbent and refusing toevaluate one’s incumbent.
Finally, existing research tends to treat descriptive representation asa binary concept: black or white, ingroup or outgroup. It fails to accountfor the country’s growing diversity. In the past few decades, the Latinopopulation has dramatically increased. The 2010 Census indicatesLatinos comprise 16% of the population, surpassing African Americansas the largest minority group. Not only has the Latino populationincreased, but the number of Latino elected officials has likewiseincreased. Historically, outgroup representation may have largely beencharacterized as African Americans represented by a white MC or whitesrepresented by a black MC. Given the growing Latino population andgrowing number of Latino MCs, many Latinos are represented by non-Latino MCs, while an increasing number of whites and blacks are rep-resented by Latino MCs. Thus, it is important to extend the focus toinclude Latinos.
Beyond the Binary
The following model offers a binary conceptualization of represen-tation, which depicts the idea that motivates extant research on this topic.We have a White and Black legislator. The White legislator has theessential racial attribute that is important to white constituents, group GW.
Similarly, the Black legislator possesses the essential racial attribute thatis important to black constituents, GB. Given the dyadic structure ofrepresentation, a purely descriptive representation “model” wouldpredict:
468 Regina P. Branton, Erin C. Cassese, and Bradford S. Jones
White P Black
Black P WhiteW
B
∀∀
G
GW
B
[1]
This is a simplification—there is no evidence that all group membersalways demonstrate an ingroup bias. Nonetheless, it illustrates the binarypreference relation stemming from the principle of descriptive represen-tation. In terms of candidate evaluations, individuals from GW would ratea White MC more highly; individuals from GB would rate a Black MCmore highly. This is the premise motivating most of the extant work ondyadic descriptive representation (e.g., Gay 2002). Given the growth ofthe Latino population, this binary relation does not reflect many realisticsettings in American politics. As such, we include a third candidate,Latino MC, who has the essential ethnic attribute that is important toLatino constituents, GL. A “model” of purely descriptive representationwould now predict:
Black P White I Latino
Latino P Black I White
White P Black
B B
L L
W
∀∀
G
GB
L
II LatinoW ∀ GW
[2]
where I denotes an indifference relation. We posit an indifference relationunder the assumption that if the preferred candidate—the one possessingthe essential racial/ethnic attribute—is not the legislator, group memberswill not, on the grounds of descriptive attributes, have a basis to preferone outgroup over the other. This is a stark rendering of ingroup, out-group differences: you’re either with us or against us.
In the absence of a descriptive MC, are individuals truly indifferent,or is there a “next best choice” in racial terms? This question speaks tothe ways in which the expanding heterogeneity of the population,coupled with the growing number of Latino MCs, has rendered tradi-tional “binary” notions of descriptive representation (i.e., Model [1]) lessuseful than in previous periods. It is more common for sizable popula-tions of one racial/ethnic group to have an MC of a different racial/ethnicgroup. Given these dynamics, it is important to consider how individualsfrom one racial/ethnic group distinguish between MCs of other racial/ethnic groups.
Among white Americans, for whom race features prominently inMC evaluations (Gay 2002), we expect the historical legacy of racialtension to result in lower ratings for black MCs than for Latino MCs.
U.S. House Incumbents 469
Expectations for the preference orderings of Latinos and African Ameri-cans are less clear. Research on the “black-brown divide” suggests com-petition over scarce resources, including political offices, has driven awedge between black and Latino communities (Hero and Clarke 2003;McClain and Stewart 2002; Meier et al. 2004). This animosity stemmingfrom intergroup conflict might cause group members to prefer represen-tation by white MCs over representation from the other minority group.
The shared interests perspective, by contrast, suggests AfricanAmericans and Latinos are natural political allies, motivated by thebroader goal of minority incorporation (see Kaufmann 2003). Giventheir common minority status and overlapping political agendas, eitherminority group may prefer to be represented by an MC of the otherminority group rather than by a white MC (Kaufmann 2004). Dovi(2002) provides some additional theoretical justification for this claim.She distinguishes between “preferable” descriptive representation and“standard” descriptive representation, which is defined by a shared essen-tial characteristic. Preferable descriptive representation is determined bythe presence of “strong mutual relationships” between groups. To theextent that minority groups have these mutual relationships, representa-tion by a member of another minority group might prove to be a minorityconstituent’s “second best choice.”
The ideological proximity of Latino and African American MCssupports this idea of preferable descriptive representation. Constituentsoften use minority racial/ethnic identity as a proxy for liberalism(Kanthak and Morton 2008; McDermott 1998). For minority constitu-ents, the closer proximity of another minority group MC may reflectcommon political interests and contribute to a preference for a non-descriptive minority MC over a white MC. Constituent perceptions ofminority MCs’ liberalism have some basis in fact. Consider Poole andRosenthal’s (1996) DW-NOMINATE scores of MCs serving in the 97ththrough 110th Congresses.2 Table 1 presents the median and averagenominate score (along with the interquartile range [iqr] and standarddeviation).
The top panel of Table 1 demonstrates ideological differencesbetween racial/ethnic minority MCs and white MCs. Black MCs are themost liberal of this group with a median NOMINATE score of .53, whilewhite MCs are the most conservative with a median NOMINATE scoreof -.02. Latino MCs fall in between with a median score of .37, but areideologically closer to black MCs than white MCs. Given that there areonly a handful of black or Latino Republican MCs (4 and 6, respectively)serving between the 97th and 110th Congresses, a better comparison ofideological placement is among Democratic MCs, presented in the
470 Regina P. Branton, Erin C. Cassese, and Bradford S. Jones
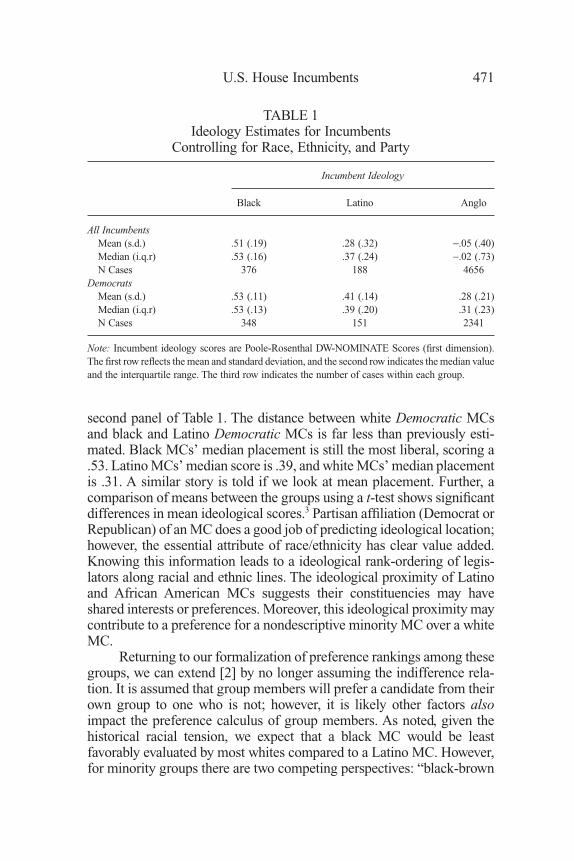
second panel of Table 1. The distance between white Democratic MCsand black and Latino Democratic MCs is far less than previously esti-mated. Black MCs’ median placement is still the most liberal, scoring a.53. Latino MCs’ median score is .39, and white MCs’ median placementis .31. A similar story is told if we look at mean placement. Further, acomparison of means between the groups using a t-test shows significantdifferences in mean ideological scores.3 Partisan affiliation (Democrat orRepublican) of an MC does a good job of predicting ideological location;however, the essential attribute of race/ethnicity has clear value added.Knowing this information leads to a ideological rank-ordering of legis-lators along racial and ethnic lines. The ideological proximity of Latinoand African American MCs suggests their constituencies may haveshared interests or preferences. Moreover, this ideological proximity maycontribute to a preference for a nondescriptive minority MC over a whiteMC.
Returning to our formalization of preference rankings among thesegroups, we can extend [2] by no longer assuming the indifference rela-tion. It is assumed that group members will prefer a candidate from theirown group to one who is not; however, it is likely other factors alsoimpact the preference calculus of group members. As noted, given thehistorical racial tension, we expect that a black MC would be leastfavorably evaluated by most whites compared to a Latino MC. However,for minority groups there are two competing perspectives: “black-brown
TABLE 1Ideology Estimates for Incumbents
Controlling for Race, Ethnicity, and Party
Incumbent Ideology
Black Latino Anglo
All IncumbentsMean (s.d.) .51 (.19) .28 (.32) -.05 (.40)Median (i.q.r) .53 (.16) .37 (.24) -.02 (.73)N Cases 376 188 4656
DemocratsMean (s.d.) .53 (.11) .41 (.14) .28 (.21)Median (i.q.r) .53 (.13) .39 (.20) .31 (.23)N Cases 348 151 2341
Note: Incumbent ideology scores are Poole-Rosenthal DW-NOMINATE Scores (first dimension).The first row reflects the mean and standard deviation, and the second row indicates the median valueand the interquartile range. The third row indicates the number of cases within each group.
U.S. House Incumbents 471
divide” and “shared interests.” This leads to two sets of preferencesorderings, [3] and [4]:
Black P White P Latino
Latino P White P Black
White P Latin
B B
L L
W
∀∀
G
GB
L
oo P BlackW ∀ GW
[3]
Black P Latino P White
Latino P Black P White
White P Latin
B B
L L
W
∀∀
G
GB
L
oo P BlackW ∀ GW
[4]
Models [3] and [4] reflect a clear ingroup preference, but there areimportant distinctions among outgroup MCs. Model [3] reflects the“black-brown divide” such that we might expect a black MC to be lessfavorably evaluated by most Latinos when compared to a white MC anda Latino MC to be less favorably evaluated by most African Americanswhen compared to a white MC. Alternatively, Model [4] reflects “sharedinterest” perspective, where we might expect that a white MC would beless favorably evaluated by most Latinos compared to a black MC and awhite MC would be less favorably rated by most African Americanscompared to a Latino MC.
Data and Analysis
To examine evaluations of MCs as a function of the race/ethnicityof the respondent and the race of the MC, we utilize National ElectionStudies (hereafter, NES) survey data from 1982 through 2008.4 Thesedata include a survey item querying individuals about their MC, as wellas an item that identifies the congressional district in which eachrespondent resides. This survey data is then merged with data on eachincumbent. The incumbent data consist of the Poole-RosenthalDW-NOMINATE score (first dimension), the race/ethnicity of theincumbent, and the number of terms served by the incumbent in the U.S.House.
The dependent variable is the NES feeling thermometer toward aDemocratic MC.5 The measure ranges between 0 and 100, where highervalues reflect more positive affect toward the incumbent.6 There are toofew African American respondents represented by a Latino MC in thedata set to reliably estimate quantities of interest. As such, the analysis is
472 Regina P. Branton, Erin C. Cassese, and Bradford S. Jones
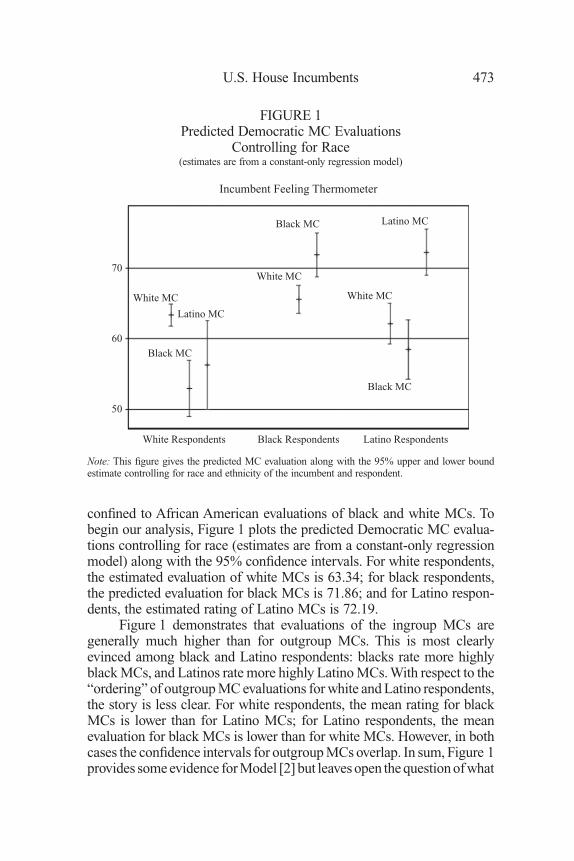
confined to African American evaluations of black and white MCs. Tobegin our analysis, Figure 1 plots the predicted Democratic MC evalua-tions controlling for race (estimates are from a constant-only regressionmodel) along with the 95% confidence intervals. For white respondents,the estimated evaluation of white MCs is 63.34; for black respondents,the predicted evaluation for black MCs is 71.86; and for Latino respon-dents, the estimated rating of Latino MCs is 72.19.
Figure 1 demonstrates that evaluations of the ingroup MCs aregenerally much higher than for outgroup MCs. This is most clearlyevinced among black and Latino respondents: blacks rate more highlyblack MCs, and Latinos rate more highly Latino MCs. With respect to the“ordering” of outgroup MC evaluations for white and Latino respondents,the story is less clear. For white respondents, the mean rating for blackMCs is lower than for Latino MCs; for Latino respondents, the meanevaluation for black MCs is lower than for white MCs. However, in bothcases the confidence intervals for outgroup MCs overlap. In sum, Figure 1provides some evidence for Model [2] but leaves open the question of what
FIGURE 1Predicted Democratic MC Evaluations
Controlling for Race(estimates are from a constant-only regression model)
White Respondents Black Respondents Latino Respondents
Incumbent Feeling Thermometer
70
60
50
White MC
Latino MC
Black MC
Black MC
White MC
Latino MCBlack MC
White MC
Note: This figure gives the predicted MC evaluation along with the 95% upper and lower boundestimate controlling for race and ethnicity of the incumbent and respondent.
U.S. House Incumbents 473
factors account for variation in MC evaluations. Nevertheless, one take-away from Figure 1 is that a stark portrayal of MC evaluations as beingsolely driven by descriptive ties does not seem to hold.
In modeling MC evaluations, we estimate separate models forwhite respondents, black respondents, and Latino respondents. In thesemodels (i.e., on the right-hand side), we control for the race/ethnicity ofthe MC. We chose to estimate separate models for each group becausethis approach allows us to examine differences in MC evaluations withineach racial/ethnic group. One complication with these data is missingdata on the response variable, that is, the incumbent feeling thermometer.In asking for their ratings of the MC, respondents are first asked if they“recognize” the MC’s name. If not, the item is not asked, and we havemissing data for this respondent. If the respondent recognizes the MC’sname, he/she is then asked to rate the MC on the 101-point feelingthermometer. If the respondent refuses to rate, we also obtain missingdata for the respondent. These two survey probes yield a considerableamount of missing data; approximately 18% (1,811 respondents) did notrender an evaluation of their MC.7
Moreover, the distribution of missing data varies across racial/ethnic groups. Fifteen percent of white respondents did not evaluate theirMC, while 24% of black respondents and 23% of Latino respondents didnot evaluate their MC. Furthermore, missing data is less likely to occurwhen the MC and respondent are of the same racial/ethnic group thancompared to when the race/ethnicity of the respondent and MC differ.For example, 14% of white respondents did not evaluate their whiteincumbent, while 18% of white respondents did not evaluate their blackincumbent, and 26% of white respondents did not evaluate their Latinorepresentative. Among black respondents, 17% did not evaluate theirblack incumbent, while 28% did not evaluate their white incumbent.Among Latino respondents, 15% did not evaluate their Latino incum-bent, while 30% did not evaluate their white incumbent, and 34% did notevaluate their black incumbent.
The patterns of nonresponse suggest respondents are more likely torate an MC of their own race/ethnicity as opposed to outgroup MCs.Therefore we are faced with a set of MC evaluations observed for anonrandom sample of respondents. If unaccounted for, the parameterestimates will be biased, and the error terms will be correlated with theindependent variables (Heckman 1979). This may lead to erroneousconclusions regarding the influence of race/ethnicity on MC evaluations.To address the dual nature of the selection process, we implement aHeckman “style” approach. The usual Heckman selection modelemploys a probit “selection” equation modeling whether or not the
474 Regina P. Branton, Erin C. Cassese, and Bradford S. Jones
sample element is in the outcome model and then from the probit com-putes the inverse mills ratio (IMR).8 The IMR is then included as apredictor in an outcome model, usually treated as a “correction” forselection bias.9 Because we have two modes of selection, we estimateseparate probits for: (1) “not recognizing” (scored “1”) versus “recog-nizing and/or rating” (scored “0”) and (2) “recognizing but not rating”(scored “1”) versus “rating” the MC (scored “0”). For each model, theIMR is computed and treated as a predictor variable in our outcomemodels.10 As we will show, there are some systematic factors that predictthe pattern of missing data.
As noted we have three sets of models: the two selection modelsand the outcome model. The selection models and the outcome modelinclude two main covariates of interest: race/ethnicity of the incumbentand strength of partisanship. Dichotomous variables are used to denotethe respondents’ and MCs’ race/ethnicity (white, black, or Latino). Partyaffiliation is measured using the NES’ 7-point scale where -1 representsa strong Republican and 1 represents a strong Democrat. Because therelationship between covariates may be conditional, for example, therelationship between an individual’s partisan affiliation on the dependentvariable may be conditioned by the race of the respondent; therefore, wefirst estimated models allowing race, ideology, and partisanship indica-tors to have conditional relationships with Y. As outlined by Brambor,Clark, and Golder (2006), the magnitude and significance of an interac-tion cannot be determined based on the parameter estimate and standarderror presented in the results table. Thus, we estimated the marginaleffects and conditional standard errors (Brambor, Clark, and Golder2006).11 When the conditional effects did not hold, we estimated theunconditional model (i.e., models where insignificant interaction termswere omitted).12 This strategy is used for all of the models discussedbelow (selection and outcome models). To control for potential locationeffects, the selection and outcome models also include a district-levelcontrol variable: percent urban.
In addition to these variables, the selection models also include anindicator of MC tenure, which is measured by the number of years inoffice. The expectation is that as tenure increases, the probability of “notrecognizing” or “recognizing, but not rating” an incumbent shoulddecrease: tenure implies greater exposure. The models also include adichotomous measure indicating whether the congressional district inwhich a respondent resides has undergone redistricting. It is possiblerespondents residing in districts having undergone redistricting may notbe familiar with the MC and thus less likely to evaluate the MC. Addi-tionally, the models include three individual-level control variables:
U.S. House Incumbents 475

education, female, and age. Education ranges from 1 (less than a highschool degree) to 4 (college degree or more advanced degree). Female isa binary variable coded 1 if a respondent is a female (0 if male). Arespondent’s age is measured in years.
In addition to partisanship and race/ethnicity of the MC, theoutcome model includes respondent and incumbent ideology measures.MC ideology is measured using the DW-NOMINATE scores and isscaled to fall in the range -1 (maximally conservative) to 1 (maximallyliberal). The respondent’s ideology is scored using the NES’ 7-pointideology scale where -1 denotes an extreme conservative and 1 denotesan extreme liberal. Finally, the outcome model includes the inverse mill’sratio from both of the selection models: IMR 1 and IMR 2.
Table 2 gives the selection and outcome results for white, black,and Latino respondents. The first column gives the probit coefficients forthe likelihood of “not recognizing” the incumbent versus not rating/rating the incumbent. The second column gives the estimates for “notrating” the incumbent versus rating the incumbent. The response variablein these models is coded “1” if the respondent does not recognize or doesnot rate and “0” otherwise. Respondents who score a “0” over bothmodels are the respondents who end up in the outcome model, which isshown in the third column. The first panel of results is for white respon-dents; the second panel presents the results for black respondents; and thethird panel gives the results for Latino respondents. Below, we discuss thefindings for white, black, and Latino respondents, respectively, and thengive a deeper discussion of the results and their implications.
White Respondents
We begin by discussing the results for white respondents. Ingeneral, we find the pattern of missing data to be at least partially due toracial/ethnic characteristics of the MC. Consider respondents who claimto “not recognize” the MC. The results given in column 1 indicate whiterespondents are significantly more likely to not recognize (and thereforenot rate) Latino MCs in comparison to white MCs. Additionally, thisrelationship is conditioned on one’s partisan affiliation. Although thereported log-odds estimate of -.19 has a large standard error, the condi-tional effects are statistically significant. In general, respondents identi-fying with the Democratic party are more likely to recognize theirDemocratic MC compared to Republican and independent identifiers. Interms of the conditioning effect of MC race/ethnicity, the probability ofa white Republican not evaluating a white MC is about .09, while theprobability of not evaluating a Latino MC is about triple this, about .25.13
476 Regina P. Branton, Erin C. Cassese, and Bradford S. Jones
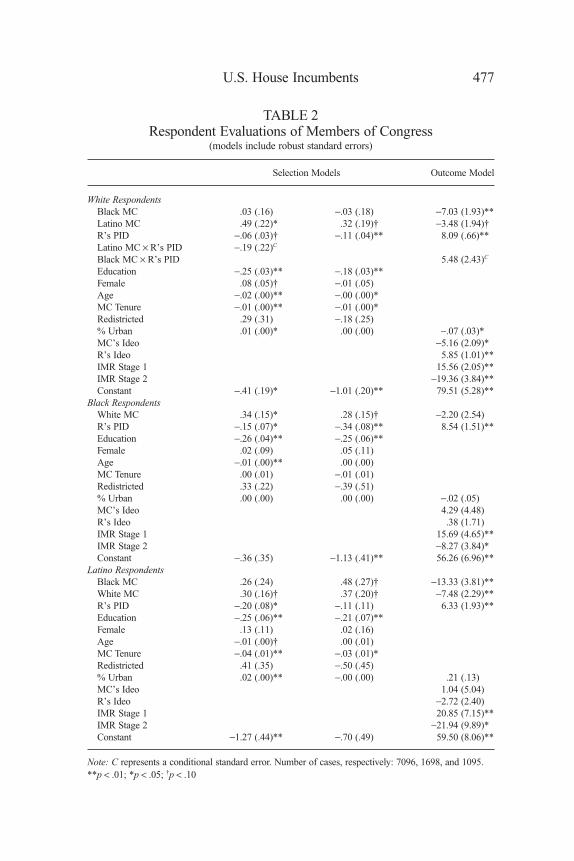
TABLE 2Respondent Evaluations of Members of Congress
(models include robust standard errors)
Selection Models Outcome Model
White RespondentsBlack MC .03 (.16) -.03 (.18) -7.03 (1.93)**Latino MC .49 (.22)* .32 (.19)† -3.48 (1.94)†R’s PID -.06 (.03)† -.11 (.04)** 8.09 (.66)**Latino MC ¥ R’s PID -.19 (.22)C
Black MC ¥ R’s PID 5.48 (2.43)C
Education -.25 (.03)** -.18 (.03)**Female .08 (.05)† -.01 (.05)Age -.02 (.00)** -.00 (.00)*MC Tenure -.01 (.00)** -.01 (.00)*Redistricted .29 (.31) -.18 (.25)% Urban .01 (.00)* .00 (.00) -.07 (.03)*MC’s Ideo -5.16 (2.09)*R’s Ideo 5.85 (1.01)**IMR Stage 1 15.56 (2.05)**IMR Stage 2 -19.36 (3.84)**Constant -.41 (.19)* -1.01 (.20)** 79.51 (5.28)**
Black RespondentsWhite MC .34 (.15)* .28 (.15)† -2.20 (2.54)R’s PID -.15 (.07)* -.34 (.08)** 8.54 (1.51)**Education -.26 (.04)** -.25 (.06)**Female .02 (.09) .05 (.11)Age -.01 (.00)** .00 (.00)MC Tenure .00 (.01) -.01 (.01)Redistricted .33 (.22) -.39 (.51)% Urban .00 (.00) .00 (.00) -.02 (.05)MC’s Ideo 4.29 (4.48)R’s Ideo .38 (1.71)IMR Stage 1 15.69 (4.65)**IMR Stage 2 -8.27 (3.84)*Constant -.36 (.35) -1.13 (.41)** 56.26 (6.96)**
Latino RespondentsBlack MC .26 (.24) .48 (.27)† -13.33 (3.81)**White MC .30 (.16)† .37 (.20)† -7.48 (2.29)**R’s PID -.20 (.08)* -.11 (.11) 6.33 (1.93)**Education -.25 (.06)** -.21 (.07)**Female .13 (.11) .02 (.16)Age -.01 (.00)† .00 (.01)MC Tenure -.04 (.01)** -.03 (.01)*Redistricted .41 (.35) -.50 (.45)% Urban .02 (.00)** -.00 (.00) .21 (.13)MC’s Ideo 1.04 (5.04)R’s Ideo -2.72 (2.40)IMR Stage 1 20.85 (7.15)**IMR Stage 2 -21.94 (9.89)*Constant -1.27 (.44)** -.70 (.49) 59.50 (8.06)**
Note: C represents a conditional standard error. Number of cases, respectively: 7096, 1698, and 1095.**p < .01; *p < .05; †p < .10
U.S. House Incumbents 477
Yet, there is no significant difference in the probability of not recognizinga white or Latino MC among white Democratic party identifiers. That is,the conditioning effect holds, but only for self-declared independents andRepublicans. With respect to black MCs, there is no significant differ-ence in the probability of not recognizing a white MC or black MCamong white respondents. There is no evidence of any conditioningeffect due to party affiliation with respect to black MCs. Finally, apartfrom racial/ethnic characteristics of the MC, time-in-office is negativelyrelated to nonrecognition of the MC: time served seems to increase thelikelihood of MC recognition. Predictably, age and education lower thelikelihood of nonrecognition of the MC. Finally, as the district-levelpercent urban measure increases the probability of a respondent notrecognizing their MC also increases.
Next, we consider the probit model giving the likelihood a whiterespondent will “recognize but not rate” the MC versus “recognizing andrating the MC.” The results suggest the likelihood of a white respondentrecognizing but not evaluating a Latino MC is significantly higher thanthe probability of recognizing but not evaluating a white MC (one-tailp-value .05). The results indicate that the probability of a white Demo-cratic respondent not evaluating a white MC is .04, while the probabilityof not evaluating a Latino MC is double this, about .08.14 Finally, we seeno discernible difference in the probability of a white respondent ratinga black versus white MC. As such, there is some evidence descriptive tiesmatter (in terms of offering vs. not offering an evaluation), but this effectis conditioned on the race of the MC. As expected, partisanship is nega-tively and significantly related to the likelihood of a respondent not ratingtheir MC: white Democrats are less likely of not rating than compared toindependents and Republicans. MC tenure is negatively related to thelikelihood of nonrating. Similarly age and education are negativelyrelated to the likelihood the respondent does not rate the MC.
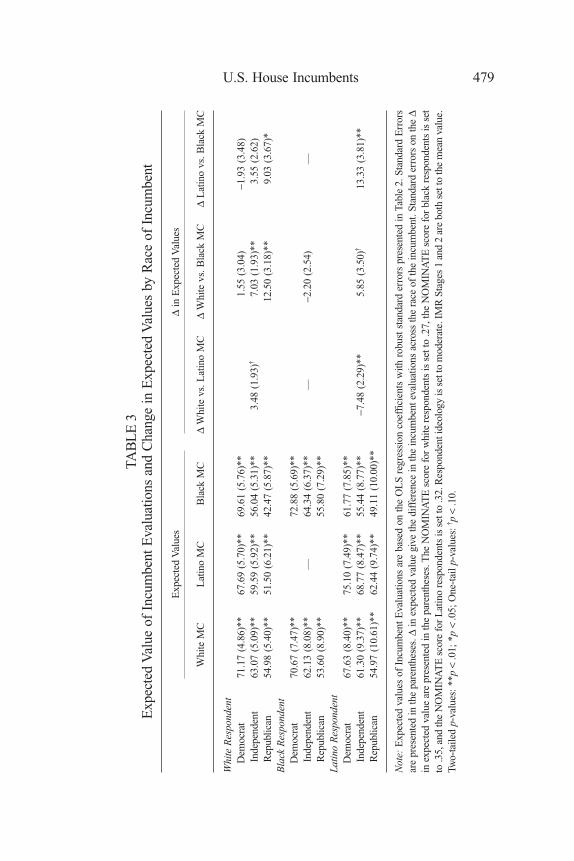
Now we turn to the model of MC evaluation for white respondents.In general, we find evidence that white respondents’ evaluations of theirMC vary as a function of the race/ethnicity of the MC. First, whiterespondents’ ratings of Latino MCs are significantly lower when com-pared to the baseline category of white MCs (two-tailed p-value .06).Second, white respondents rate white MCs significantly higher than blackMCs, but this relationship is conditioned on one’s partisan affiliation. Todemonstrate the nature of the relationship, we calculated point estimatesof white respondents’ evaluations of MCs as a function of the race orethnicity of the MC. These point estimates are presented in Table 3. In thediscussion that follows, we reference both the coefficients presented inTable 2 and the point estimates given in Table 3.
478 Regina P. Branton, Erin C. Cassese, and Bradford S. Jones
TAB
LE
3E
xpec
ted
Val
ueof
Incu
mbe
ntE
valu
atio
nsan
dC
hang
ein
Exp
ecte
dV
alue
sby
Rac
eof
Incu
mbe
nt
Exp
ecte
dV
alue
sD
inE
xpec
ted
Val
ues
Whi
teM
CL
atin
oM
CB
lack
MC
DW
hite
vs.L
atin
oM
CD
Whi
tevs
.Bla
ckM
CD
Lat
ino
vs.B
lack
MC
Whi
teR
espo
nden
tD
emoc
rat
71.1
7(4
.86)
**67
.69
(5.7
0)**
69.6
1(5
.76)
**1.
55(3
.04)
-1.9
3(3
.48)
Inde
pend
ent
63.0
7(5
.09)
**59
.59
(5.9
2)**
56.0
4(5
.31)
**3.
48(1
.93)
†7.
03(1
.93)
**3.
55(2
.62)
Rep
ublic
an54
.98
(5.4
0)**
51.5
0(6
.21)
**42
.47
(5.8
7)**
12.5
0(3
.18)
**9.
03(3
.67)
*B
lack
Res
pond
ent
Dem
ocra
t70
.67
(7.4
7)**
72.8
8(5
.69)
**In
depe
nden
t62
.13
(8.0
8)**
—64
.34
(6.3
7)**
—-2
.20
(2.5
4)—
Rep
ublic
an53
.60
(8.9
0)**
55.8
0(7
.29)
**La
tino
Res
pond
ent
Dem
ocra
t67
.63
(8.4
0)**
75.1
0(7
.49)
**61
.77
(7.8
5)**
Inde
pend
ent
61.3
0(9
.37)
**68
.77
(8.4
7)**
55.4
4(8
.77)
**-7
.48
(2.2
9)**
5.85
(3.5
0)†
13.3
3(3
.81)
**R
epub
lican
54.9
7(1
0.61
)**
62.4
4(9
.74)
**49
.11
(10.
00)*
*
Not
e:E
xpec
ted
valu
esof
Incu
mbe
ntE
valu
atio
nsar
eba
sed
onth
eO
LS
regr
essi
onco
effic
ient
sw
ithro
bust
stan
dard
erro
rspr
esen
ted
inTa
ble
2.St
anda
rdE
rror
sar
epr
esen
ted
inth
epa
rent
hese
s.D
inex
pect
edva
lue
give
the
diff
eren
cein
the
incu
mbe
ntev
alua
tions
acro
ssth
era
ceof
the
incu
mbe
nt.S
tand
ard
erro
rson
the
Din
expe
cted
valu
ear
epr
esen
ted
inth
epa
rent
hese
s.T
heN
OM
INA
TE
scor
efo
rw
hite
resp
onde
nts
isse
tto
.27,
the
NO
MIN
AT
Esc
ore
for
blac
kre
spon
dent
sis
set
to.3
5,an
dth
eN
OM
INA
TE
scor
efo
rL
atin
ore
spon
dent
sis
sett
o.3
2.R
espo
nden
tide
olog
yis
sett
om
oder
ate.
IMR
Stag
es1
and
2ar
ebo
thse
tto
the
mea
nva
lue.
Two-
taile
dp-
valu
es:*
*p<
.01;
*p<
.05;
One
-tai
lp-v
alue
s:† p
<.1
0.
U.S. House Incumbents 479

The results lend evidence to an ingroup preference: white respon-dents evaluate white MCs higher than minority MCs. White evaluationsof Latino MCs are on average about 3.5 points lower than their evalua-tions of white MCs. For example, the expected evaluation of a white MCfor a moderate Democrat is 71.17, while the expected evaluation for aLatino MC is about 67.69. Further, a subset of white respondents evalu-ate white MCs significantly more positively than black MCs. There is nosignificant difference in white Democrats’ evaluation of black and whiteMCs; however, there are significant differences in evaluations of blackand white MCs among independents and Republicans.15 For example,among white independents, evaluations of a black MC is about 7 pointslower than a white MC, while among Republicans the average evaluationof a black MC is about 13 points lower than for a white MC.
Further, the estimates lend some evidence of “ordering” in evalu-ations. Specifically, white non-Democrats evaluate black MCs signifi-cantly lower than Latino MCs. White independents’ evaluation of a blackMC is on average about 4 points lower than evaluations of a Latino MC(one-tail p-value .08),16 while among Republicans the difference is 9points. The theoretical model given in Model [3] seems consistent withthese results. The model also suggests that partisanship and ideology areassociated with MC evaluations. White Democrats offer more positiveevaluations of Democratic MCs than white non-Democrats, while liberalrespondents rate Democratic MCs more favorably than conservativerespondents. White respondent evaluations are also sensitive to MCideology: more liberal MCs tend to be less favorably evaluated thanmore conservative MCs.
Finally, the IMR coefficients suggest there is a significant selectioneffect: white respondents’ evaluations are not drawn from a randomsubset of all white respondents. More specifically, large IMR valuessuggest the selection hazard is associated with lower probabilities of“selecting out” of the outcome model, while smaller values suggest theselection hazard is associated with higher probabilities of “selecting out”of the outcome model.17 Therefore, a positive coefficient for the IMRimplies respondents with lower selection probabilities give higher ratingsand those with higher selection probabilities give lower ratings. As such,a positive IMR indicates that estimates of evaluations are positivelybiased, and a negative IMR indicates estimates of evaluations are nega-tively biased. For the first-stage model, the positive coefficient suggeststhe selection effect actually serves to lower MC ratings. On average, aone-unit increase on the first-stage IMR leads to about a 16-point higherevaluation of the MC. For the second-stage model, the estimatedIMR coefficient is negative implying those with the lowest selection
480 Regina P. Branton, Erin C. Cassese, and Bradford S. Jones
probabilities give lower MC ratings compared to respondents havinghigh-selection probabilities. Thus, on average, a one-unit increase on thesecond-stage IMR leads to a 19-point lower evaluation of the MC.
Black Respondents
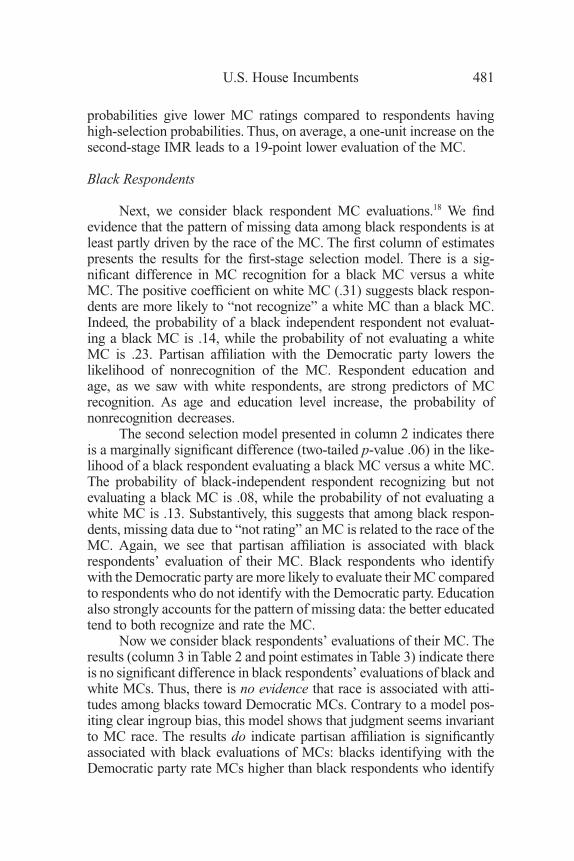
Next, we consider black respondent MC evaluations.18 We findevidence that the pattern of missing data among black respondents is atleast partly driven by the race of the MC. The first column of estimatespresents the results for the first-stage selection model. There is a sig-nificant difference in MC recognition for a black MC versus a whiteMC. The positive coefficient on white MC (.31) suggests black respon-dents are more likely to “not recognize” a white MC than a black MC.Indeed, the probability of a black independent respondent not evaluat-ing a black MC is .14, while the probability of not evaluating a whiteMC is .23. Partisan affiliation with the Democratic party lowers thelikelihood of nonrecognition of the MC. Respondent education andage, as we saw with white respondents, are strong predictors of MCrecognition. As age and education level increase, the probability ofnonrecognition decreases.
The second selection model presented in column 2 indicates thereis a marginally significant difference (two-tailed p-value .06) in the like-lihood of a black respondent evaluating a black MC versus a white MC.The probability of black-independent respondent recognizing but notevaluating a black MC is .08, while the probability of not evaluating awhite MC is .13. Substantively, this suggests that among black respon-dents, missing data due to “not rating” an MC is related to the race of theMC. Again, we see that partisan affiliation is associated with blackrespondents’ evaluation of their MC. Black respondents who identifywith the Democratic party are more likely to evaluate their MC comparedto respondents who do not identify with the Democratic party. Educationalso strongly accounts for the pattern of missing data: the better educatedtend to both recognize and rate the MC.
Now we consider black respondents’ evaluations of their MC. Theresults (column 3 in Table 2 and point estimates in Table 3) indicate thereis no significant difference in black respondents’ evaluations of black andwhite MCs. Thus, there is no evidence that race is associated with atti-tudes among blacks toward Democratic MCs. Contrary to a model pos-iting clear ingroup bias, this model shows that judgment seems invariantto MC race. The results do indicate partisan affiliation is significantlyassociated with black evaluations of MCs: blacks identifying with theDemocratic party rate MCs higher than black respondents who identify
U.S. House Incumbents 481
themselves as independent or Republican. In short, evaluations amongblack constituents are primarily driven by partisan attachment and notrace. The IMRs for the model are also significant, suggesting the mecha-nisms producing missing data are related to judgment. The signs on theIMRs are similar to those found for white respondents’ evaluations andthus the general interpretation of them is similar.
Latino Respondents
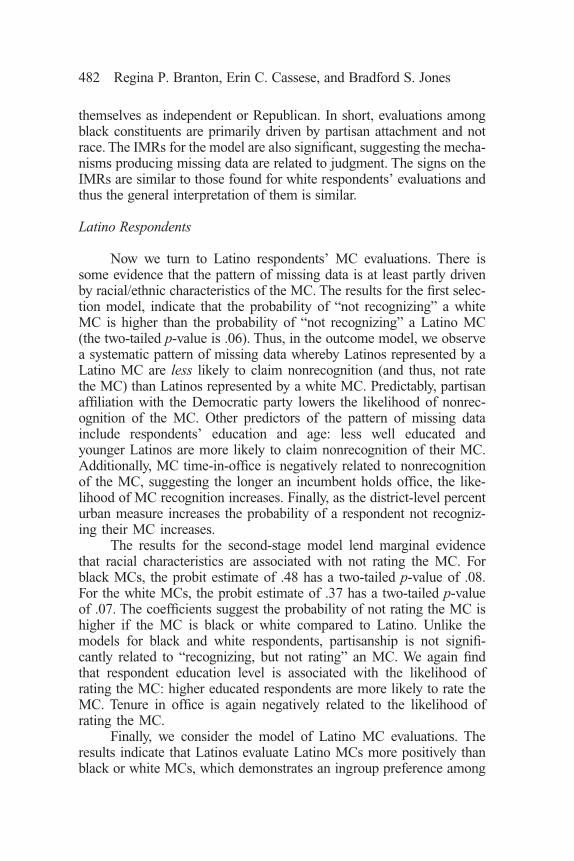
Now we turn to Latino respondents’ MC evaluations. There issome evidence that the pattern of missing data is at least partly drivenby racial/ethnic characteristics of the MC. The results for the first selec-tion model, indicate that the probability of “not recognizing” a whiteMC is higher than the probability of “not recognizing” a Latino MC(the two-tailed p-value is .06). Thus, in the outcome model, we observea systematic pattern of missing data whereby Latinos represented by aLatino MC are less likely to claim nonrecognition (and thus, not ratethe MC) than Latinos represented by a white MC. Predictably, partisanaffiliation with the Democratic party lowers the likelihood of nonrec-ognition of the MC. Other predictors of the pattern of missing datainclude respondents’ education and age: less well educated andyounger Latinos are more likely to claim nonrecognition of their MC.Additionally, MC time-in-office is negatively related to nonrecognitionof the MC, suggesting the longer an incumbent holds office, the like-lihood of MC recognition increases. Finally, as the district-level percenturban measure increases the probability of a respondent not recogniz-ing their MC increases.
The results for the second-stage model lend marginal evidencethat racial characteristics are associated with not rating the MC. Forblack MCs, the probit estimate of .48 has a two-tailed p-value of .08.For the white MCs, the probit estimate of .37 has a two-tailed p-valueof .07. The coefficients suggest the probability of not rating the MC ishigher if the MC is black or white compared to Latino. Unlike themodels for black and white respondents, partisanship is not signifi-cantly related to “recognizing, but not rating” an MC. We again findthat respondent education level is associated with the likelihood ofrating the MC: higher educated respondents are more likely to rate theMC. Tenure in office is again negatively related to the likelihood ofrating the MC.
Finally, we consider the model of Latino MC evaluations. Theresults indicate that Latinos evaluate Latino MCs more positively thanblack or white MCs, which demonstrates an ingroup preference among
482 Regina P. Branton, Erin C. Cassese, and Bradford S. Jones
Latino respondents. Latinos average evaluation of a white MC is about7 points lower than the average rating of a Latino MC, while Latinoevaluations of black MCs is 13 points lower than for a Latino MC. Likethe results for white respondents, these results lend evidence of “order-ing” in MC evaluations. Specifically, Latino respondents evaluate blackMCs lower than white MCs. Indeed, Latino respondents on averageevaluate a white MC almost 6 points higher than a black MC. Thisresult is consistent with the theoretical model based on the “black-brown divide” given in [3]. Partisan affiliation is also associated withMC evaluations: Latinos who identify with the Democratic party offerhigher MC evaluations than compared to Latinos who identify with theRepublican party (or who claim to be independents). Finally, the esti-mated IMRs exhibit the pattern seen among both white and blackrespondents.
Utility of the Selection Bias Approach
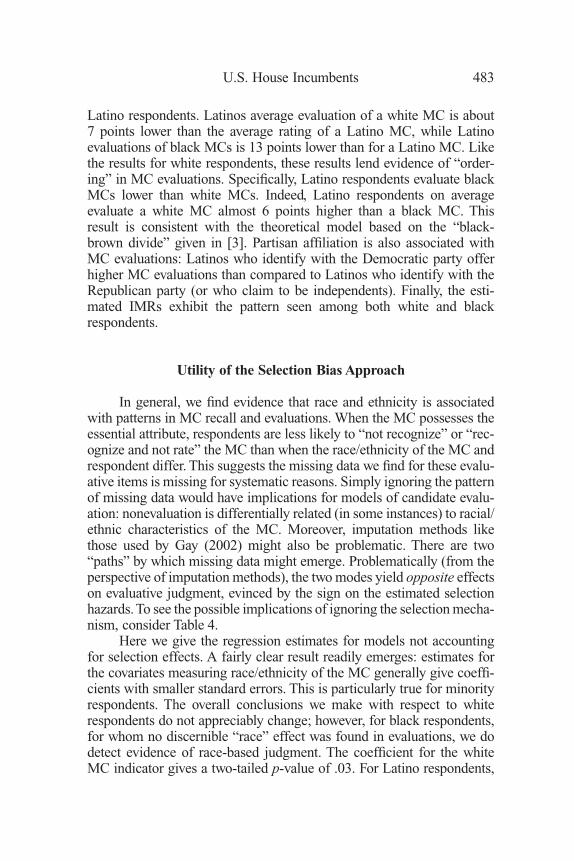
In general, we find evidence that race and ethnicity is associatedwith patterns in MC recall and evaluations. When the MC possesses theessential attribute, respondents are less likely to “not recognize” or “rec-ognize and not rate” the MC than when the race/ethnicity of the MC andrespondent differ. This suggests the missing data we find for these evalu-ative items is missing for systematic reasons. Simply ignoring the patternof missing data would have implications for models of candidate evalu-ation: nonevaluation is differentially related (in some instances) to racial/ethnic characteristics of the MC. Moreover, imputation methods likethose used by Gay (2002) might also be problematic. There are two“paths” by which missing data might emerge. Problematically (from theperspective of imputation methods), the two modes yield opposite effectson evaluative judgment, evinced by the sign on the estimated selectionhazards.To see the possible implications of ignoring the selection mecha-nism, consider Table 4.
Here we give the regression estimates for models not accountingfor selection effects. A fairly clear result readily emerges: estimates forthe covariates measuring race/ethnicity of the MC generally give coeffi-cients with smaller standard errors. This is particularly true for minorityrespondents. The overall conclusions we make with respect to whiterespondents do not appreciably change; however, for black respondents,for whom no discernible “race” effect was found in evaluations, we dodetect evidence of race-based judgment. The coefficient for the whiteMC indicator gives a two-tailed p-value of .03. For Latino respondents,
U.S. House Incumbents 483
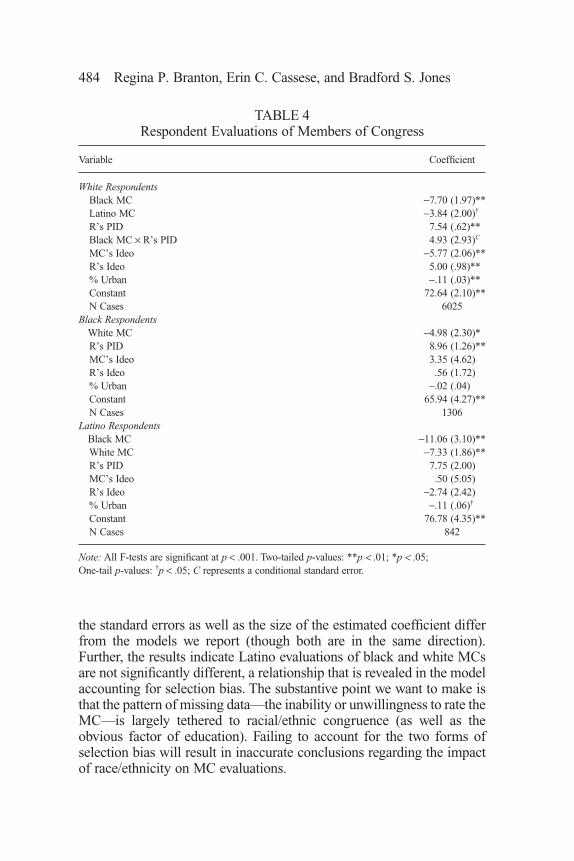
the standard errors as well as the size of the estimated coefficient differfrom the models we report (though both are in the same direction).Further, the results indicate Latino evaluations of black and white MCsare not significantly different, a relationship that is revealed in the modelaccounting for selection bias. The substantive point we want to make isthat the pattern of missing data—the inability or unwillingness to rate theMC—is largely tethered to racial/ethnic congruence (as well as theobvious factor of education). Failing to account for the two forms ofselection bias will result in inaccurate conclusions regarding the impactof race/ethnicity on MC evaluations.
TABLE 4Respondent Evaluations of Members of Congress
Variable Coefficient
White RespondentsBlack MC -7.70 (1.97)**Latino MC -3.84 (2.00)†
R’s PID 7.54 (.62)**Black MC ¥ R’s PID 4.93 (2.93)C
MC’s Ideo -5.77 (2.06)**R’s Ideo 5.00 (.98)**% Urban -.11 (.03)**Constant 72.64 (2.10)**N Cases 6025
Black RespondentsWhite MC -4.98 (2.30)*R’s PID 8.96 (1.26)**MC’s Ideo 3.35 (4.62)R’s Ideo .56 (1.72)% Urban -.02 (.04)Constant 65.94 (4.27)**N Cases 1306
Latino RespondentsBlack MC -11.06 (3.10)**White MC -7.33 (1.86)**R’s PID 7.75 (2.00)MC’s Ideo .50 (5.05)R’s Ideo -2.74 (2.42)% Urban -.11 (.06)†
Constant 76.78 (4.35)**N Cases 842
Note: All F-tests are significant at p < .001. Two-tailed p-values: **p < .01; *p < .05;One-tail p-values: †p < .05; C represents a conditional standard error.
484 Regina P. Branton, Erin C. Cassese, and Bradford S. Jones
Discussion
These results move us beyond a binary account of dyadicdescriptive representation and provide insight into the identity politicssurrounding House incumbent evaluations. Our selection bias approachprovides important insights here. When controlling for the propensity torecall an incumbent based on her race/ethnicity, two important findingsemerged. First, while African Americans were more likely to recall anAfrican American MC than a white MC, their evaluations of white andblack MCs were comparable. Second, both white and Latino constituentshave clear preferences among nondescriptive racial groups. On average,white Americans do evaluate white MCs most favorably but are signifi-cantly more favorable towards Latino MCs than black MCs. This patternis symmetrical to a certain extent, with Latino constituents more favor-ably evaluating white MCs than black MCs. Furthermore, this estimatedeffect holds even after accounting for MC ideology. That is, since blackand Latino MCs are associated with more liberal voting records, wespeculated that ideological extremity of these legislators from whiteconstituents might drive evaluations. It does not. Thus, controlling for therepresentative’s ideology does not diminish the impact of MCs’ race/ethnicity on white constituent evaluations. These results extend Gay’s(2001, 2002) work by demonstrating that race is not just a factor drivingwhite Americans’ opinions of their MCs, it also plays an important rolein Latino opinion.
Latino MC evaluations are consistent with the notion of a “black-brown divide”—that competition for political and economic resourcesamong minority groups has contributed to intergroup animosities. Ourfindings conflict with the shared interests hypothesis. The mutual minor-ity status and ideological proximity of black and Latinos do not seem toproduce a common ground or sense of linked fate. Contrary to Dovi’s(2002) conceptualization of “preferable descriptive representation,” theevidence does not support the idea that minority groups (specificallyLatinos) prefer nondescriptive minority representation over white repre-sentation. They suggest African American MCs are not the “next bestchoice” for Latinos. Unfortunately, we cannot draw conclusions aboutblack constituents’ attitudes towards Latino MCs, given the paucity ofdata available. As a result, it is unclear whether black constituents expe-rience the same kind of animosity towards Latino leadership or whetherthe animosity is more one-sided, as work by Kaufmann (2003) mightsuggest.
The racial dimension of MC evaluations will take on increasingimportance given the growing racial and ethnic heterogeneity of the
U.S. House Incumbents 485
population and the constraints on descriptive representation imposed bysingle-member electoral districts. Race and ethnicity are importantlenses through which representatives are judged. And while such labelshave heuristic value, the information conveyed by MC race and ethnicityvaries as a function of constituents’ race, ethnicity, and partisan identi-fication in meaningful ways. The story that emerges is more complexthan a simple essentialist account of dyadic representation, yet it suggeststhat one cannot discount the role of race and ethnicity in public judg-ments of political leaders.
Regina P. Branton <[email protected]> is Associate Professor ofPolitical Science, University of North Texas, Denton, TX 76201. Erin C.Cassese <[email protected]> is Assistant Professor ofPolitical Science, West Virginia University, Morgantown, WV 26506.Bradford S. Jones <[email protected]> is Professor of PoliticalScience, University of California-Davis, Davis, CA 95616.
NOTES
Branton gratefully acknowledges the support of the Dirksen Congressional Centerwhich provided funding for this research through a 2002 Congressional ResearchAward.
1. Rocha et al. (2010) use data up to 2006, but focus on collective and dyadicrepresentation.
2. Poole and Rosenthal’s (1996) NOMINATE score (first-dimension) is based onMCs’ voting record over all congressional roll calls. It is scaled such that positive scoresdenote a more liberal record, negative scores a more conservative record. The scale rangesfrom -1 to 1.
3. The t-test for blacks versus Latinos is -11.01; for Whites versus Latinos is-9.86; for Whites versus Blacks is -35.24. All tests are significant at any conventionallevel.
4. The ANES Time Series Study, which is the source of public opinion data usedin this study, was not conducted in 2006. As such, the analysis does not include data for2006.
5. Unfortunately, few districts were sampled in the NES with a black or LatinoRepublican MC (19 and 12, respectively) to justify statistical inference. Further thereare few black or Latino respondents in the data set that are represented by white Repub-lican MCs (423 and 286, respectively). Given the sparseness of data and the desire forcomparability across racial/ethnic groups, we restrict attention to only DemocraticMCs.
6. The incumbent feeling thermometer has an overall mean value of 64.96 andan overall median value of 60. Among white respondents, the mean value on the
486 Regina P. Branton, Erin C. Cassese, and Bradford S. Jones
incumbent feeling thermometer is 62.49 with a median value of 60; among blackrespondents, the mean is 65.56 and the median is 70; and among Latinos, the mean is64.55 and the median is 65.
7. Approximately, 11.6% of respondents did not rate their MC because they didnot recognize their MC. And, 6.4% of respondents recognized, but did not rate theirMC.
8. The IMR is given byφΦ
, where f is the probability density function and F
is the cumulative probability function for the standard normal.9. The inclusion of the IMR in the outcome model removes the part of the
error term that is correlated with the independent variables and replaces it with an errorterm that is uncorrelated with the independent variables (Achen 1986). Removing thissource of error eliminates the bias introduced by the selection process.
10. This approach allows us to separate the decision to evaluate an incumbentfrom the actual evaluation of an MC, which is key given that some of the factors thatinfluence MC evaluations also influence whether or not a respondent offers an evalu-ation of their incumbent—due to either not recognizing the MC or recognizing but notrating their MC. The two selection stages estimate the factors that affect whether arespondent does not recognize their MC or recognizes but does not evaluate their MC.The outcome model estimates the factors associated with respondents’ evaluation oftheir MC.
11. Figures illustrating the significance of the interaction terms have not beenincluded due to space constraints, but they are available upon request. The estimatespresented in the text are based on points along the range of the interaction that aresignificant.
12. In an effort to account for the distance between the ideology of the MC andthe respondent, we estimated a model including an interaction between MC’s Ideo andR’s Ideo. The interaction was universally nonsignificant and therefore omitted from themodels.
13. The 95% confidence intervals are respectively (.07, .11) and (.13, .38).14. The 95% confidence interval are (.03, .05) and (.03, .14), respectively.15. Estimates indicate there is a significant difference in white respondents’
evaluation of black and white MCs across a majority of the partisanship indicators: -1to .33. Thus, there is no difference in white evaluations of black and white MC amongrespondents who weakly and strongly identify with the Democratic party.
16. This reveals a modest difference in white independent respondents’ evalua-tions of black and Latino MCs; however, this estimate is based on a very conservativescenario where MC ideology is set to the average of the MC ideology score across allracial/ethnic groups. Using the average ideology score for black MCs and the averageideology score for Latino MCs, white-independent respondents’ rate Latino MCs 4.5points higher than black MCs with a two-tailed p-value of .08.
17. This is because in the selection models a “1” is associated with selecting out.18. Unlike the models for white respondents, neither the selection nor outcome
models for black nor Latino respondents include any statistical interactions. Using thetechnique outlined by Brambor, Clark, and Golder (2006), we determined that there areno statistically significant conditional relationships, suggesting the unconditional modelholds.
U.S. House Incumbents 487
REFERENCES
Achen, Christopher. 1986. The Statistical Analysis of Quasi-Experiments. Berkeley:University of California Press.
Banducci, Susan A., Todd Donovan, and Jeffrey A. Karp. 2004. “Minority Representa-tion, Empowerment and Participation.” Journal of Politics 66: 534–56.
Barreto, Matt. 2007. “Si se puede! Latino Candidates and the Mobilization of LatinoVoters.” American Political Science Review 101: 425–41.
Barreto, Matt, Gary Segura, and Nathan Woods. 2004. “The Mobilizing Effect ofMajority-Minority Districts on Latino Turnout.” American Political ScienceReview 98: 65–75.
Bianco, William T. 1994. Trust: Representatives and Constituents. Ann Arbor: Universityof Michigan Press.
Bobo, Lawrence, and Franklin D. Gilliam. 1990. “Race, Sociopolitical Participation, andBlack Empowerment.” American Political Science Review 84: 377–93.
Brambor, Thomas, William R. Clark, and Matt Golder. 2006. “Understanding InteractionModels: Improving Empirical Analyses.” Political Analysis 14: 63–82.
Canon, David. 1999. Race, Redistricting, and Representation: The UnintendedConsequences of Black Majority Districts. Chicago: University of Chicago Press.
Dovi, Suzanne. 2002. “Preferable Descriptive Representatives: Or Will Just Any Woman,Black, or Latino Do?” American Political Science Review 96: 745–54.
Endersby, James, and Charles E. Menifeld. 2000. “Representation, Ethnicity and Con-gress: Black and Hispanic Representatives and Constituencies.” In Black andMultiracial Politics inAmerica, ed. Yvette Alex-Assensoh and Lawrence J. Hanks.New York: New York University Press, 257–72.
Gay, Claudine. 2001. “The Effect of Black Congressional Representation on PoliticalParticipation.” American Political Science Review 95: 589–602.
Gay, Claudine. 2002. “Spirals of Trust? The Effect of Descriptive Representation on theRelationship between Citizens and Their Government.” American Journal ofPolitical Science 46: 717–33.
Heckman, James. 1979. “Sample Selection Bias as a Specification Error.” Econometrica47: 153–61.
Hero, Rodney, and Susan Clarke. 2003. “Latinos, Blacks, and Multiethnic Politics inDenver: Realigning Power and Influence in the Struggle for Equality.” In RacialPolitics in American Cities (3d ed.), ed. Rufus Browning, Dale Rogers Marshall,and David Tabb. New York: Longman, 309–28.
Howell, Susan E., and Huey L. Perry. 2000. “Black Mayors/White Mayors: ExplainingTheir Approval.” The Public Opinion Quarterly 68: 32–56.
Kaufmann, Karen. 2003. “Cracks in the Rainbow: Group Commonality as a Basis forLatino and African-American Political Coalitions.” Political Research Quarterly56: 199–210.
Kaufmann, Karen. 2004. The Urban Voter: Group Conflict and Mayoral Voting Behaviorin American Cities. Ann Arbor: University of Michigan Press.
Kanthak, Kristin, and Rebecca B. Morton. 2008. “Minding Payoffs and Cues: MeasuringVoter Accuracy in Evaluating Elected Officials.” University of Pittsburgh.Typescript.
488 Regina P. Branton, Erin C. Cassese, and Bradford S. Jones
Lublin, David. 1997. The Paradox of Representation: Racial Gerrymandering andMinority Interests in Congress. Princeton, NJ: Princeton University Press.
McClain, Paula, and Joseph Stewart. 2002. “Can We All Get Along?” Racial and EthnicMinorities in American Politics. Boulder, CO: Westview Press.
McDermott, Monika M. 1998. “Race and Gender Cues in Low-Information Elections.”Political Research Quarterly 51: 895–918.
Meier, Kenneth, Paula McClain, Robert Wrinkle, and J. L. Polinard. 2004. “Divided orTogether?: Conflict and Cooperation between African Americans and Latinos.”Political Research Quarterly 57: 399–409.
Pantoja, Adrian, and Gary Segura. 2002. “Does Ethnicity Matter? Descriptive Represen-tation in Legislatures and Political Alienation among Latinos.” Social ScienceQuarterly 84: 441–60.
Pitkin, Hannah. 1967. The Concept of Representation. Berkeley: University of CaliforniaPress.
Poole, Keith, and Howard Rosenthal. 1996. Congress: A Political-Economic History ofRoll Call Voting. New York: Oxford.
Rocha, Rene R., Caroline J. Tolbert, Daniel C. Bowen, and Christopher J. Clark. 2010.“Race and Turnout: Does Descriptive Representation in State LegislaturesIncrease Minority Voting?” Political Research Quarterly 63: 890–907.
Segura, Gary M., and Shaun Bowler. 2005. “Racial/Ethnic Group Attitudes towardEnvironmental Protection in California: Is “Environmentalism” Still a White Phe-nomenon?” Political Research Quarterly 58: 435–47.
Tate, Katherine. 2001. “The Political Representation of Blacks in Congress: Does RaceMatter?” Legislative Studies Quarterly 26: 623–38.
Weissberg, Robert. 1978. “Collective vs. Dyadic Representation in Congress.” AmericanPolitical Science Review 72: 535–47.
U.S. House Incumbents 489
Related Documents