RAC Cost of Motoring Index 2009

Welcome message from author
This document is posted to help you gain knowledge. Please leave a comment to let me know what you think about it! Share it to your friends and learn new things together.
Transcript
RAC Cost of Motoring Index 2009
| RAC Cost of Motoring Index 2009 |
Foreword
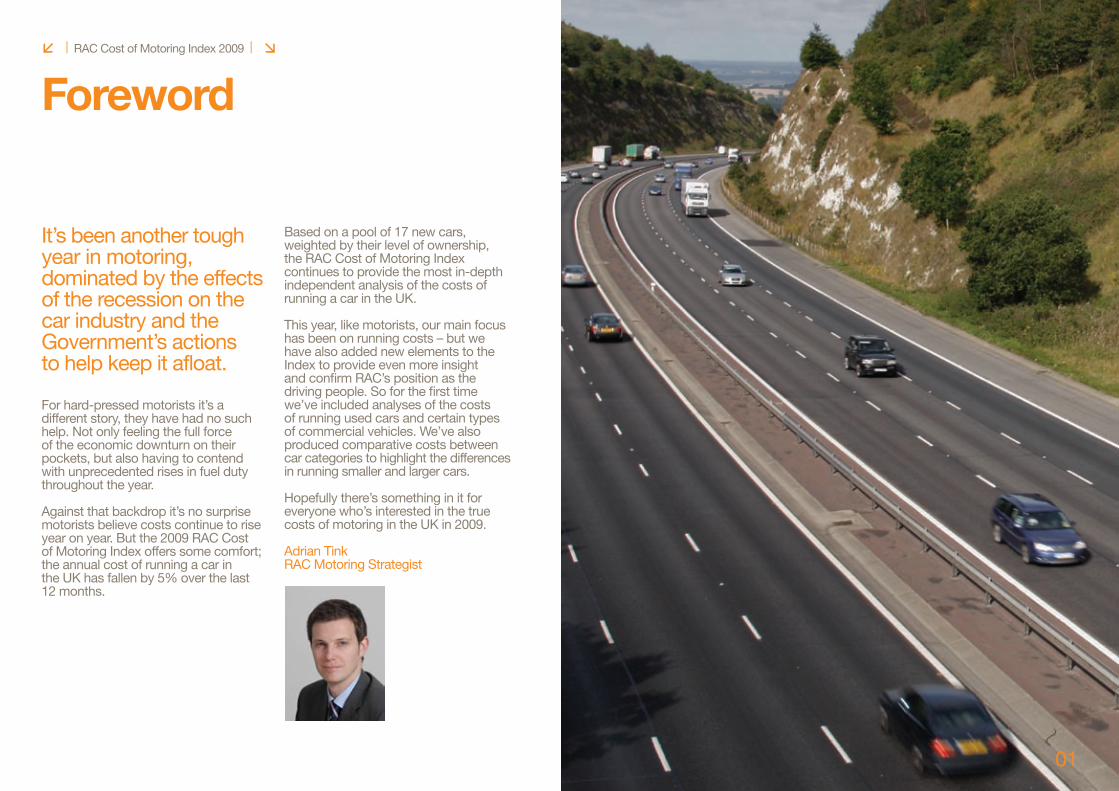
It’s been another tough year in motoring, dominated by the effects of the recession on the car industry and the Government’s actions to help keep it afloat.
For hard-pressed motorists it’s a different story, they have had no such help. Not only feeling the full force of the economic downturn on their pockets, but also having to contend with unprecedented rises in fuel duty throughout the year.
Against that backdrop it’s no surprise motorists believe costs continue to rise year on year. But the 2009 RAC Cost of Motoring Index offers some comfort; the annual cost of running a car in the UK has fallen by 5% over the last 12 months.
Based on a pool of 17 new cars, weighted by their level of ownership, the RAC Cost of Motoring Index continues to provide the most in-depth independent analysis of the costs of running a car in the UK.
This year, like motorists, our main focus has been on running costs – but we have also added new elements to the Index to provide even more insight and confirm RAC’s position as the driving people. So for the first time we’ve included analyses of the costs of running used cars and certain types of commercial vehicles. We’ve also produced comparative costs between car categories to highlight the differences in running smaller and larger cars.
Hopefully there’s something in it for everyone who’s interested in the true costs of motoring in the UK in 2009.
Adrian Tink RAC Motoring Strategist
01
1.0 The cost of motoring in 2009
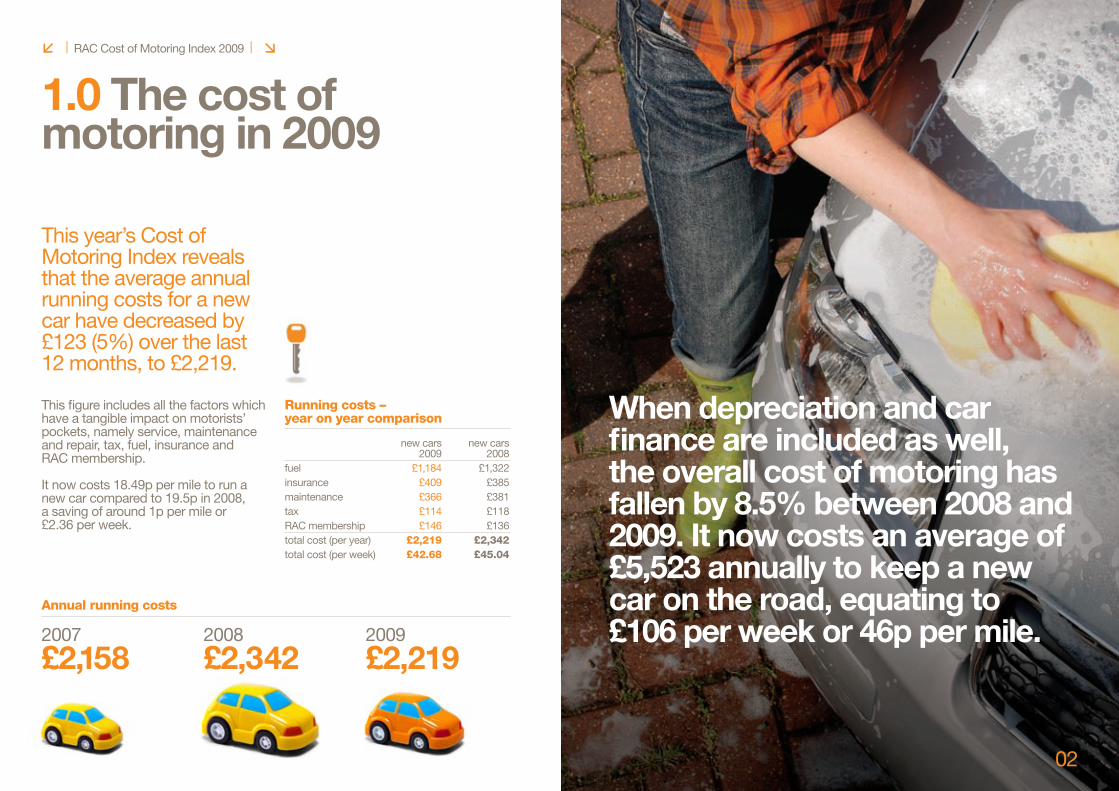
This year’s Cost of Motoring Index reveals that the average annual running costs for a new car have decreased by £123 (5%) over the last 12 months, to £2,219.
This figure includes all the factors which have a tangible impact on motorists’ pockets, namely service, maintenance and repair, tax, fuel, insurance and RAC membership.
It now costs 18.49p per mile to run a new car compared to 19.5p in 2008, a saving of around 1p per mile or £2.36 per week.
02
When depreciation and car finance are included as well, the overall cost of motoring has fallen by 8.5% between 2008 and 2009. It now costs an average of £5,523 annually to keep a new car on the road, equating to £106 per week or 46p per mile. 2007
£2,1582008
£2,3422009
£2,219
Annual running costs
Running costs – year on year comparison new cars new cars 2009 2008fuel £1,184 £1,322insurance £409 £385maintenance £366 £381tax £114 £118RAC membership £146 £136total cost (per year) £2,219 £2,342total cost (per week) £42.68 £45.04
RAC Brand Toolkit Phase 1 and 2Version 1.1
10.1 Iconography Examples
There is a distinct style to our icons and symbols. The simple pictogram treatment reflects what you may see on a car dashboard. A shadow adds a sense of 3D space.
They are particularly useful to enhance action points in text.
This initial set is available, and should be used as a reference point when creating additional versions.
If you do need to create new icons please check with the brand team in case there is something already available to use.
Please note that colour split changes depending on the background colour.
| RAC Cost of Motoring Index 2009 |
03
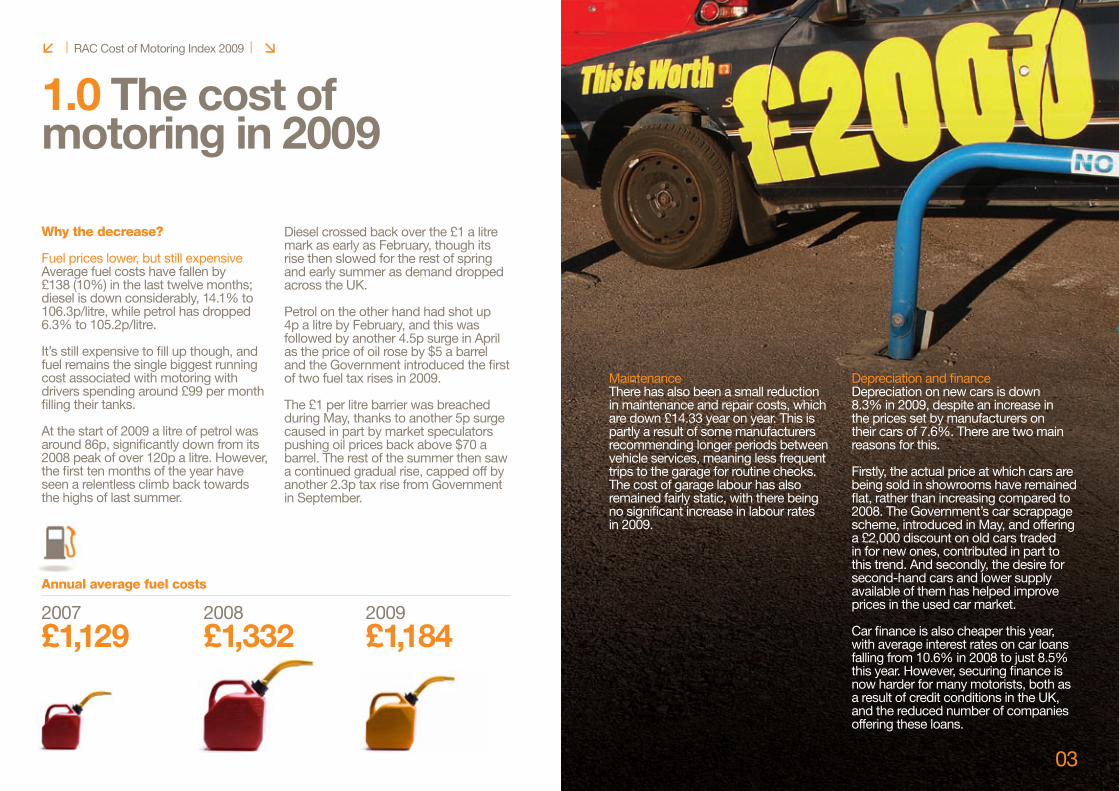
Why the decrease?
Fuel prices lower, but still expensiveAverage fuel costs have fallen by £138 (10%) in the last twelve months; diesel is down considerably, 14.1% to 106.3p/litre, while petrol has dropped 6.3% to 105.2p/litre.
It’s still expensive to fill up though, and fuel remains the single biggest running cost associated with motoring with drivers spending around £99 per month filling their tanks.
At the start of 2009 a litre of petrol was around 86p, significantly down from its 2008 peak of over 120p a litre. However, the first ten months of the year have seen a relentless climb back towards the highs of last summer.
Diesel crossed back over the £1 a litre mark as early as February, though its rise then slowed for the rest of spring and early summer as demand dropped across the UK.
Petrol on the other hand had shot up 4p a litre by February, and this was followed by another 4.5p surge in April as the price of oil rose by $5 a barrel and the Government introduced the first of two fuel tax rises in 2009.
The £1 per litre barrier was breached during May, thanks to another 5p surge caused in part by market speculators pushing oil prices back above $70 a barrel. The rest of the summer then saw a continued gradual rise, capped off by another 2.3p tax rise from Government in September.
MaintenanceThere has also been a small reduction in maintenance and repair costs, which are down £14.33 year on year. This is partly a result of some manufacturers recommending longer periods between vehicle services, meaning less frequent trips to the garage for routine checks. The cost of garage labour has also remained fairly static, with there being no significant increase in labour rates in 2009.
Depreciation and financeDepreciation on new cars is down 8.3% in 2009, despite an increase in the prices set by manufacturers on their cars of 7.6%. There are two main reasons for this.
Firstly, the actual price at which cars are being sold in showrooms have remained flat, rather than increasing compared to 2008. The Government’s car scrappage scheme, introduced in May, and offering a £2,000 discount on old cars traded in for new ones, contributed in part to this trend. And secondly, the desire for second-hand cars and lower supply available of them has helped improve prices in the used car market.
Car finance is also cheaper this year, with average interest rates on car loans falling from 10.6% in 2008 to just 8.5% this year. However, securing finance is now harder for many motorists, both as a result of credit conditions in the UK, and the reduced number of companies offering these loans.
1.0 The cost of motoring in 2009
RAC Brand Toolkit Phase 1 and 2Version 1.1
10.1 Iconography Examples
There is a distinct style to our icons and symbols. The simple pictogram treatment reflects what you may see on a car dashboard. A shadow adds a sense of 3D space.
They are particularly useful to enhance action points in text.
This initial set is available, and should be used as a reference point when creating additional versions.
If you do need to create new icons please check with the brand team in case there is something already available to use.
Please note that colour split changes depending on the background colour.
Annual average fuel costs
2007
£1,1292008
£1,3322009
£1,184
| RAC Cost of Motoring Index 2009 |
04
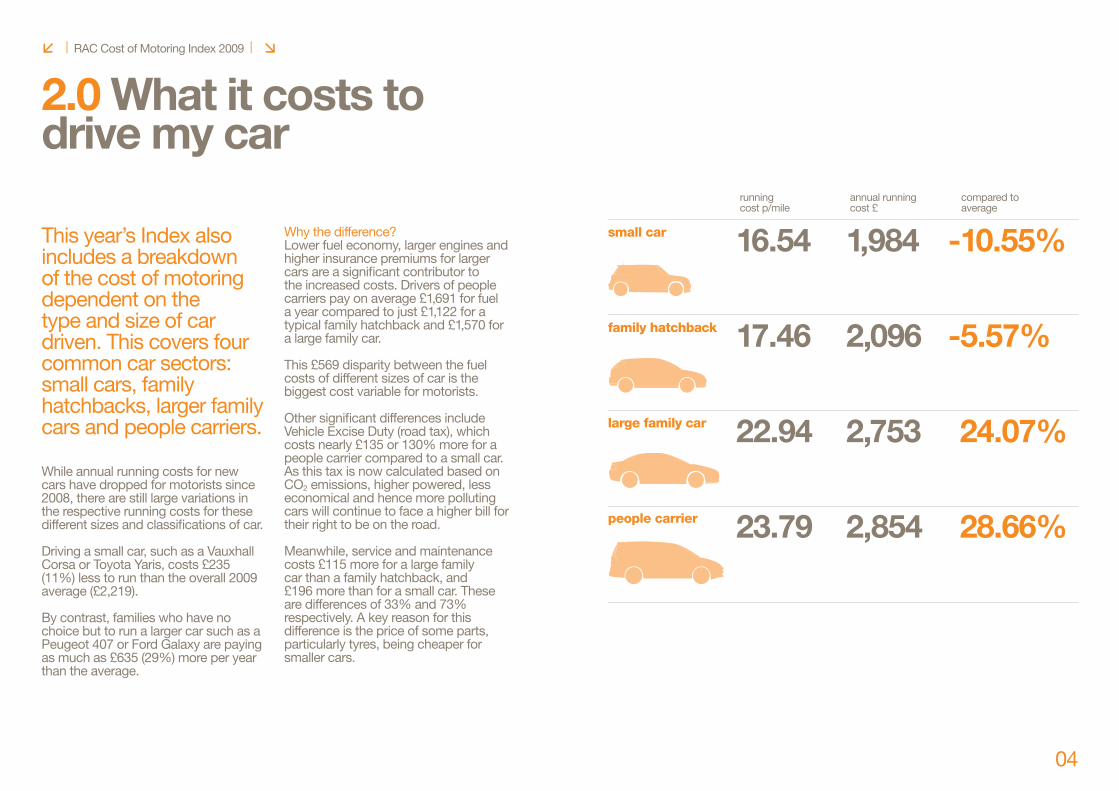
2.0 What it costs to drive my car
This year’s Index also includes a breakdown of the cost of motoring dependent on the type and size of car driven. This covers four common car sectors: small cars, family hatchbacks, larger family cars and people carriers.
While annual running costs for new cars have dropped for motorists since 2008, there are still large variations in the respective running costs for these different sizes and classifications of car.
Driving a small car, such as a Vauxhall Corsa or Toyota Yaris, costs £235 (11%) less to run than the overall 2009 average (£2,219).
By contrast, families who have no choice but to run a larger car such as a Peugeot 407 or Ford Galaxy are paying as much as £635 (29%) more per year than the average.
Why the difference?Lower fuel economy, larger engines and higher insurance premiums for larger cars are a significant contributor to the increased costs. Drivers of people carriers pay on average £1,691 for fuel a year compared to just £1,122 for a typical family hatchback and £1,570 for a large family car.
This £569 disparity between the fuel costs of different sizes of car is the biggest cost variable for motorists.
Other significant differences include Vehicle Excise Duty (road tax), which costs nearly £135 or 130% more for a people carrier compared to a small car. As this tax is now calculated based on CO2 emissions, higher powered, less economical and hence more polluting cars will continue to face a higher bill for their right to be on the road.
Meanwhile, service and maintenance costs £115 more for a large family car than a family hatchback, and £196 more than for a small car. These are differences of 33% and 73% respectively. A key reason for this difference is the price of some parts, particularly tyres, being cheaper for smaller cars.
small car
family hatchback
large family car
people carrier
running cost p/mile
annual running cost £
compared to average
16.54 1,984 -10.55%
17.46 2,096 -5.57%
22.94 2,753 24.07%
23.79 2,854 28.66%
| RAC Cost of Motoring Index 2009 |
05
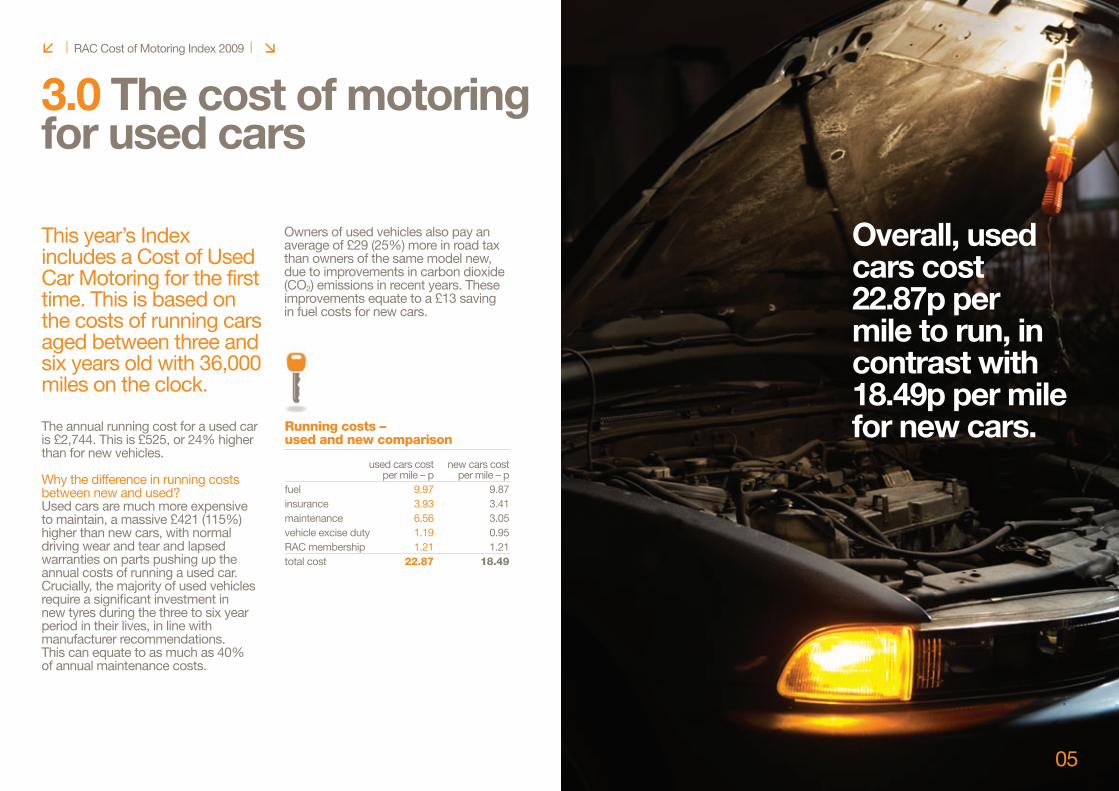
3.0 The cost of motoring for used cars
This year’s Index includes a Cost of Used Car Motoring for the first time. This is based on the costs of running cars aged between three and six years old with 36,000 miles on the clock.
The annual running cost for a used car is £2,744. This is £525, or 24% higher than for new vehicles.
Why the difference in running costs between new and used?Used cars are much more expensive to maintain, a massive £421 (115%) higher than new cars, with normal driving wear and tear and lapsed warranties on parts pushing up the annual costs of running a used car. Crucially, the majority of used vehicles require a significant investment in new tyres during the three to six year period in their lives, in line with manufacturer recommendations. This can equate to as much as 40% of annual maintenance costs.
Owners of used vehicles also pay an average of £29 (25%) more in road tax than owners of the same model new, due to improvements in carbon dioxide (CO2) emissions in recent years. These improvements equate to a £13 saving in fuel costs for new cars.
Running costs – used and new comparison used cars cost new cars cost per mile – p per mile – pfuel 9.97 9.87insurance 3.93 3.41maintenance 6.56 3.05vehicle excise duty 1.19 0.95RAC membership 1.21 1.21total cost 22.87 18.49
RAC Brand Toolkit Phase 1 and 2Version 1.1
10.1 Iconography Examples
There is a distinct style to our icons and symbols. The simple pictogram treatment reflects what you may see on a car dashboard. A shadow adds a sense of 3D space.
They are particularly useful to enhance action points in text.
This initial set is available, and should be used as a reference point when creating additional versions.
If you do need to create new icons please check with the brand team in case there is something already available to use.
Please note that colour split changes depending on the background colour.
Overall, used cars cost 22.87p per mile to run, in contrast with 18.49p per mile for new cars.
| RAC Cost of Motoring Index 2009 |

4.0 The cost of commercial motoring
For the first time this year, the Index has addressed the cost of commercial motoring.
Analysis of costs has been based on an assumption of 20,000 miles per year (examined over a three year period) in contrast with 12,000 miles per annum allocated for cars.
The average annual running costs for light commercial vehicles are £4,231 or 21.17 pence per mile. Running costs are broken down as follows:
There is significant variation in costs between the different models of light commercial vehicle on the road. Size equates directly with expense in this category of vehicle; a pick-up model will cost on average £2,241 more per year in running costs than a small van.
In the light commercial category, as with cars, fuel costs are the single biggest factor to impact upon motorists’ weekly budgets. An average van driver can expect to shell out £2,583 per year (or £215 per month) on diesel. Insurance premiums between the various categories do not vary significantly, with a gap of £182 in evidence between the high-top and small vans.
Running costs for commercial vehicles cost per mile cost per year p £fuel 12.92 2,583insurance 3.27 654SMR 3.32 663vehicle excise duty 0.92 185RAC membership 0.73 146total cost 21.17 4,231
RAC Brand Toolkit Phase 1 and 2Version 1.1
10.1 Iconography Examples
There is a distinct style to our icons and symbols. The simple pictogram treatment reflects what you may see on a car dashboard. A shadow adds a sense of 3D space.
They are particularly useful to enhance action points in text.
This initial set is available, and should be used as a reference point when creating additional versions.
If you do need to create new icons please check with the brand team in case there is something already available to use.
Please note that colour split changes depending on the background colour.
06
| RAC Cost of Motoring Index 2009 |
small van
medium van
large van
high top
pick-up
fuel cost 1488insurance 529maintenance 460tax 185RAC membership 146total 2,808 fuel cost 1916insurance 561service & maintenance 583tax 185RAC membership 146total 3,391 fuel cost 2795insurance 661service & maintenance 393tax 185RAC membership 146total 4,180 fuel cost 2876insurance 711service & maintenance 661tax 185RAC membership 146total 4,579 fuel cost 2997insurance 711service & maintenance 1010tax 185RAC membership 146total 5,049
07
5.0 Saving money on motoring
There are a number of ways motorists can cut down on their day-to-day running costs:
Drive smoothly and at an appropriate speed to save on fuel
Check the road ahead and anticipate traffic in order to avoid sharp braking and accelerating. This can save up to 30% on fuel costs. Stick to the speed limits too – slowing down by 10mph saves 40p on fuel for every 10 miles.
Maintain your car to make savings in the long run
Check the tyre pressures regularly – under-inflated tyres can increase fuel consumption by up to 2%. Rectify small defects on your car promptly, to prevent further deterioration. Also, keep the service history up to date as this will be invaluable if you want to sell the car. Finally, wash and wax the car regularly to prevent rust from developing on the bodywork.
Shop around and plan ahead
Use price comparison websites such as www.petrolprices.com to find the cheapest fuel where you live. Plan your route before you leave to avoid getting lost by using a site such as www.rac.co.uk/web/routeplanner. Also, tune into the local radio station for travel updates.
| RAC Cost of Motoring Index 2009 |
Think eco
Do you really need to use your car? If your journey is short, consider using alternative options such as walking, taking public transport, or riding a bicycle.
Plan ahead and share transport
Car pooling is a great way to be economical. Speak to your colleagues and friends to check if you’re travelling a similar route at the same time each day. It can also be a sociable way to travel.
Join a car club
If you drive less than 8,000 miles a year, joining a car club could save you considerable money. You pay to join a club then hire a car when you need one on a pay-as-you-go basis.
RAC Brand Toolkit Phase 1 and 2Version 1.1
10.1 Iconography Examples
There is a distinct style to our icons and symbols. The simple pictogram treatment reflects what you may see on a car dashboard. A shadow adds a sense of 3D space.
They are particularly useful to enhance action points in text.
This initial set is available, and should be used as a reference point when creating additional versions.
If you do need to create new icons please check with the brand team in case there is something already available to use.
Please note that colour split changes depending on the background colour.
08
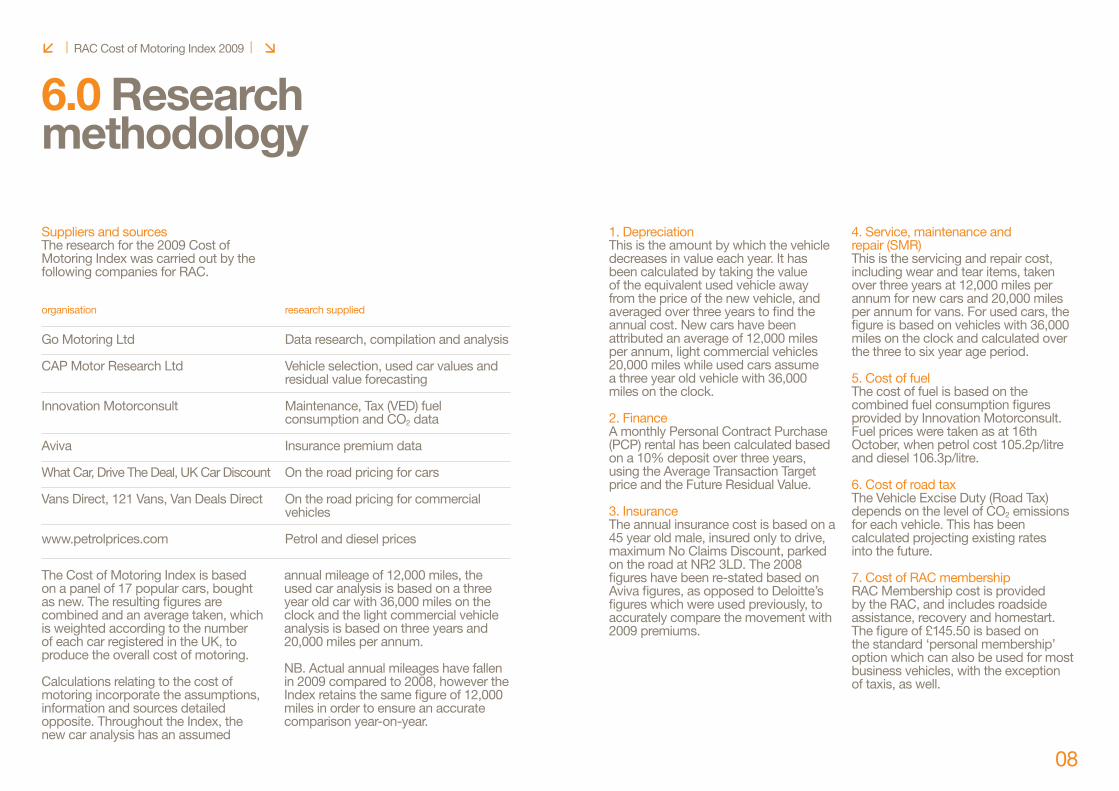
6.0 Research methodology
Suppliers and sources The research for the 2009 Cost of Motoring Index was carried out by the following companies for RAC.
organisation research supplied
Go Motoring Ltd Data research, compilation and analysis
CAP Motor Research Ltd Vehicle selection, used car values and residual value forecasting
Innovation Motorconsult Maintenance, Tax (VED) fuel consumption and CO2 data
Aviva Insurance premium data
What Car, Drive The Deal, UK Car Discount On the road pricing for cars
Vans Direct, 121 Vans, Van Deals Direct On the road pricing for commercial vehicles
www.petrolprices.com Petrol and diesel prices
1. DepreciationThis is the amount by which the vehicle decreases in value each year. It has been calculated by taking the value of the equivalent used vehicle away from the price of the new vehicle, and averaged over three years to find the annual cost. New cars have been attributed an average of 12,000 miles per annum, light commercial vehicles 20,000 miles while used cars assume a three year old vehicle with 36,000 miles on the clock.
2. FinanceA monthly Personal Contract Purchase (PCP) rental has been calculated based on a 10% deposit over three years, using the Average Transaction Target price and the Future Residual Value.
3. InsuranceThe annual insurance cost is based on a 45 year old male, insured only to drive, maximum No Claims Discount, parked on the road at NR2 3LD. The 2008 figures have been re-stated based on Aviva figures, as opposed to Deloitte’s figures which were used previously, to accurately compare the movement with 2009 premiums.
4. Service, maintenance and repair (SMR)This is the servicing and repair cost, including wear and tear items, taken over three years at 12,000 miles per annum for new cars and 20,000 miles per annum for vans. For used cars, the figure is based on vehicles with 36,000 miles on the clock and calculated over the three to six year age period.
5. Cost of fuelThe cost of fuel is based on the combined fuel consumption figures provided by Innovation Motorconsult. Fuel prices were taken as at 16th October, when petrol cost 105.2p/litre and diesel 106.3p/litre.
6. Cost of road taxThe Vehicle Excise Duty (Road Tax) depends on the level of CO2 emissions for each vehicle. This has been calculated projecting existing rates into the future.
7. Cost of RAC membershipRAC Membership cost is provided by the RAC, and includes roadside assistance, recovery and homestart. The figure of £145.50 is based on the standard ‘personal membership’ option which can also be used for most business vehicles, with the exception of taxis, as well.
| RAC Cost of Motoring Index 2009 |
The Cost of Motoring Index is based on a panel of 17 popular cars, bought as new. The resulting figures are combined and an average taken, which is weighted according to the number of each car registered in the UK, to produce the overall cost of motoring.
Calculations relating to the cost of motoring incorporate the assumptions, information and sources detailed opposite. Throughout the Index, the new car analysis has an assumed
annual mileage of 12,000 miles, the used car analysis is based on a three year old car with 36,000 miles on the clock and the light commercial vehicle analysis is based on three years and 20,000 miles per annum.
NB. Actual annual mileages have fallen in 2009 compared to 2008, however the Index retains the same figure of 12,000 miles in order to ensure an accurate comparison year-on-year.

With around seven million members, RAC is one of the UK’s most progressive motoring organisations, providing services for both private and business motorists. Whether it’s roadside assistance, insurance, vehicle inspections and checks, legal services or up-to-the-minute traffic and travel information – RAC is able to meet motorists’ needs.
RAC is committed to providing the very highest levels of service to its members and has been ranked first for customer satisfaction by J.D. Power and Associates’ UK Roadside Assistance Study for the last three years and the top named service organisation in the July 2009 UK Customer Satisfaction Index from the Institute of Customer Service.
Aviva bought RAC in May 2005. The acquisition brings together RAC’s powerful brand and customer base with the expertise and leading position in motor insurance of Aviva UK Insurance (formerly Norwich Union Insurance). Aviva is the UK’s largest insurer with a market share of around 15 per cent.
RAC is part of Aviva, the world’s fifth largest insurance group which operates in 28 countries.
RAC’s news releases and a selection of images are available from the internet press centre at www.rac.co.uk/press-centre
Media enquiriesAdrian TinkRAC Motoring StrategistTel: 01603 681 922Email: [email protected]
John Franklin Media Relations ManagerTel: 01603 680 795Email: [email protected]
CreditsIndex design: BisqitResearch: Go-Motoring
| RAC Cost of Motoring Index 2009 |
09
About RAC
09
Related Documents