Introduction to Dror Hollander Gil Ast Lab Sackler Medical School 29.4.12

Welcome message from author
This document is posted to help you gain knowledge. Please leave a comment to let me know what you think about it! Share it to your friends and learn new things together.
Transcript

Introduction to
Dror HollanderGil Ast LabSackler Medical School
29.4.12

Lecture Overview
What is R and why use it? Setting up R & RStudio for use Calculations, functions and variable classes File handling, plotting and graphic features Statistics Packages and writing functions
What is ?
“R is a freely available language and environment for statistical computing and graphics”
Much like & , but bette !

Why use ?
SPSS and Excel users are limited in their ability to change their environment. The way they approach a problem is constrained by how Excel & SPSS were programmed to approach it
The users have to pay money to use the software
R users can rely on functions that have been developed for them by statistical researchers or create their own
They don’t have to pay money to use them
Once experienced enough they are almost unlimited in their ability to change their environment

‘s Strengths
Data management & manipulation Statistics Graphics Programming language Active user community Free

Not very user friendly at start No commercial support Substantially slower than programming
languages (e.g. Perl, Java, C++)
‘s Weaknesses

Lecture Overview
What is R and why use it? Setting up R & RStudio for use Calculations, functions and variable classes File handling, plotting and graphic features Statistics Packages and writing functions

Installing
Go to R homepage: http://www.r-project.org/
Choose a server
And just follow the installation instructions…

Installing RStudio
“RStudio is a new integrated development environment (IDE) for R”
Install the “desktop edition” from this link: http://www.rstudio.org/download/

Using RStudio
Script editor
View help, plots & files;
manage packages
View variables in workspace and
history file
R console

Create your working directory Open a new R script file
Set Up Your Workspace

Lecture Overview
What is R and why use it? Setting up R & RStudio for use Calculations, functions and variable classes File handling plotting and graphic features Statistics Packages and writing functions

Operators take values (operands), operate on them, and produce a new value
Basic calculations (numeric operators): + , - , / , * , ^
Let’s try an example. Run this:(17*0.35)^(1/3)
Before you do…
- Basic Calculations
Script editor
R console
Click here / Ctrl+enter to run code in
RStudio
Use “#” to write comments
(script lines that are ignored when run)

All R operations are performed by functions
Calling a function:> function_name(x)
For example:> sqrt(9) [1] 3
Reading a function’s help file: > ?sqrt Also, when in doubt – Google it!
- Basic Functions
View help, plots & files;
manage packages
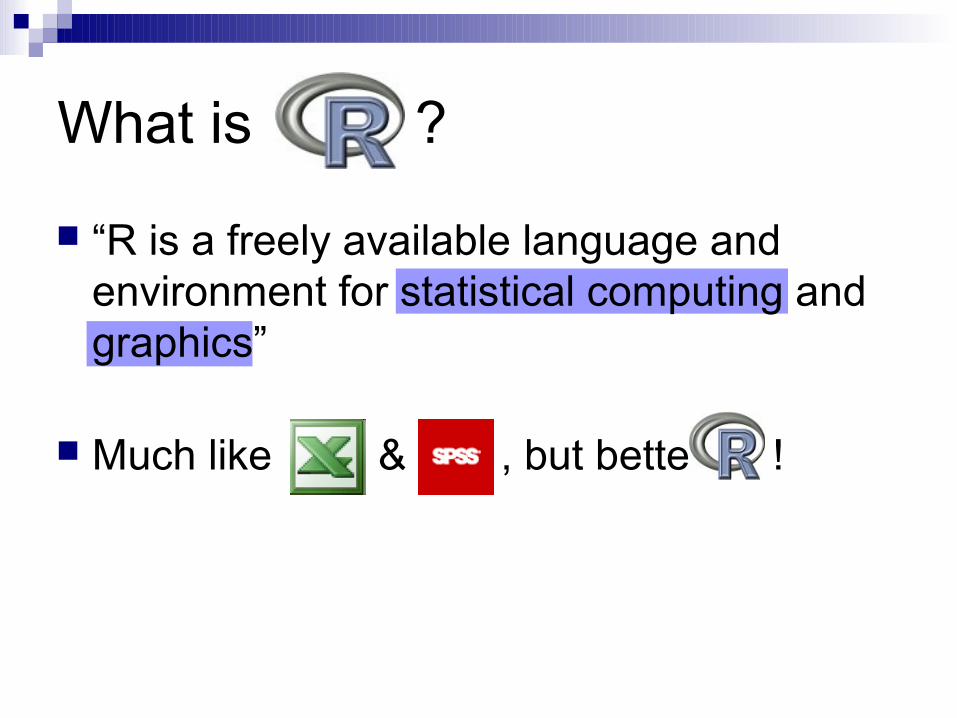
A variable is a symbolic name given to stored information
Variables are assigned using either ”=” or ”<-”
> x<-12.6 > x[1] 12.6
Variables

A vector is a list of values. A numeric vector is composed of numbers
It may be created:
Using the c() function (concatenate) :
x=c(3,7,9,11)> x[1] 3 7 9 11
Using the rep(what,how_many_times) function (replicate):
x=rep(10,3)
Using the “:” operator, signifiying a series of integers
x=4:15
Variables - Numeric Vectors

Character strings are always double quoted
Vectors made of character strings:> x=c("I","want","to","go","home") > x [1] "I" "want" "to" "go" "home"
Using rep():> rep("bye",2) [1] "bye" "bye"
Notice the difference using paste() (1 element):> paste("I","want","to","go","home")[1] "I want to go home"
Variables - Character Vectors

Logical; either FALSE or TRUE
> 5>3 [1] TRUE
> x=1:5> x[1] 1 2 3 4 5 > x<3 [1] TRUE TRUE FALSE FALSE FALSE
Variables - Boolean Vectors

RStudio – Workspace & History
Let’s review the ‘workspace’ and ‘history’ tabs in RStudioView variables in
workspace and history file

Our vector: x=c(100,101,102,103)
[] are used to access elements in x
Extract 2nd element in x> x[2][1] 101
Extract 3rd and 4th elements in x > x[3:4] # or x[c(3,4)][1] 102 103
Manipulation of Vectors

> x [1] 100 101 102 103
Add 1 to all elements in x:> x+1 [1] 101 102 103 104
Multiply all elements in x by 2:> x*2 [1] 200 202 204 206
Manipulation of Vectors – Cont.
More Operators
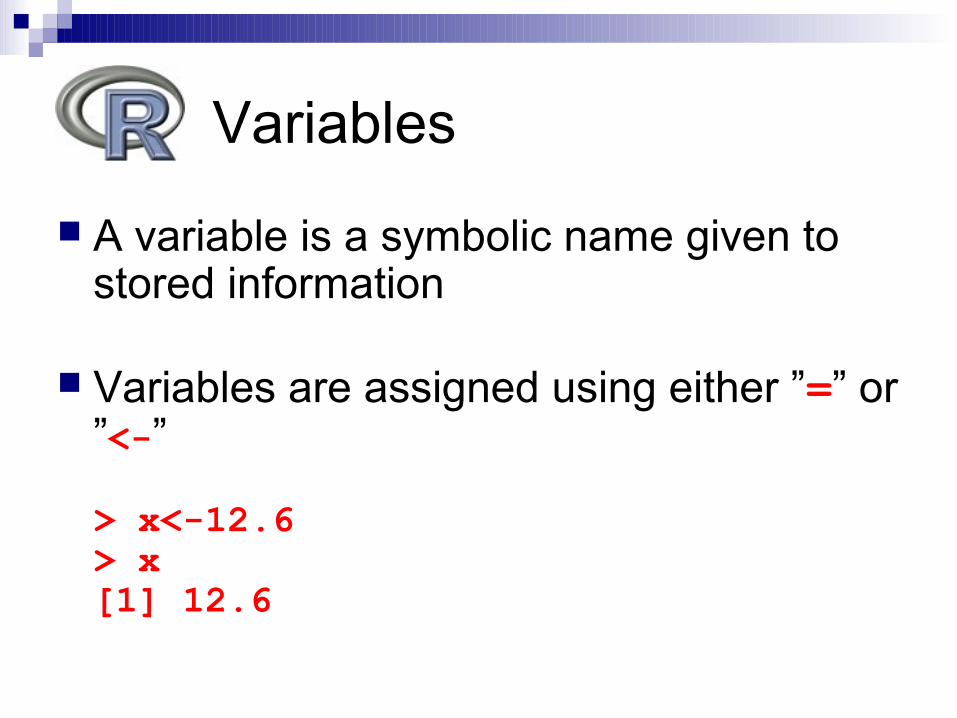
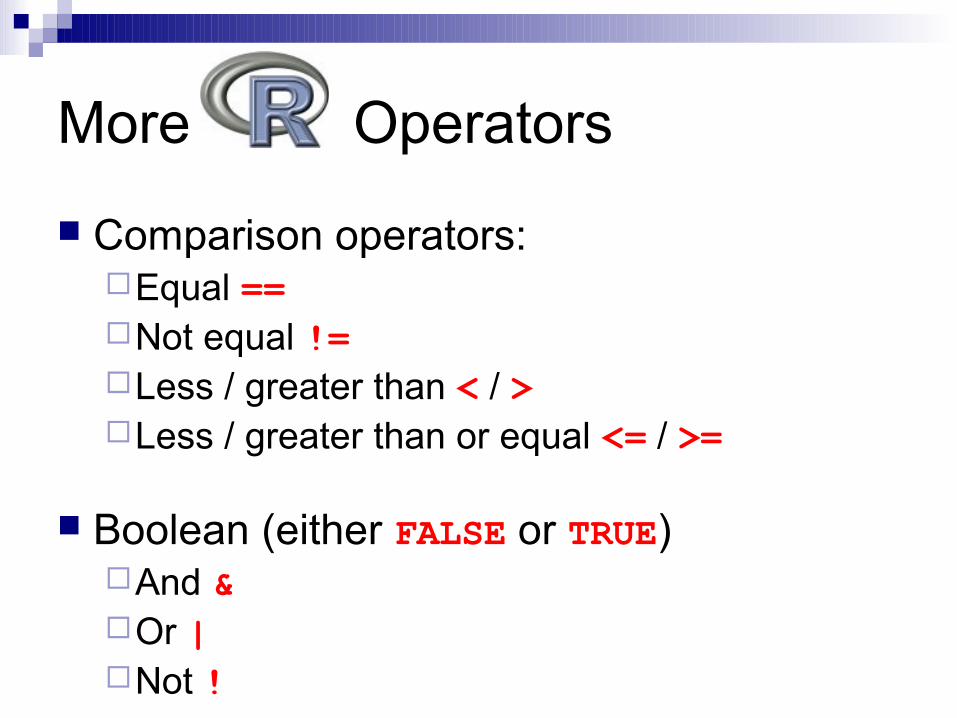
Comparison operators:Equal ==Not equal !=Less / greater than < / >Less / greater than or equal <= / >=
Boolean (either FALSE or TRUE)And &Or |Not !

Our vector: x=100:150
Elements of x higher than 145> x[x>145] [1] 146 147 148 149 150
Elements of x higher than 135 and lower than 140> x[ x>135 & x<140 ] [1] 136 137 138 139
Manipulation of Vectors – Cont.

Our vector: > x=c("I","want","to","go","home")
Elements of x that do not equal “want”:> x[x != "want"] [1] "I" "to" "go" "home"
Elements of x that equal “want” and “home”:> x[x %in% c("want","home")] [1] "want" "home"
Manipulation of Vectors – Cont.
Note: use “==” for 1 element and “%in%” for several elements

A data frame is simply a table
Each column may be of a different class (e.g. numeric, character, etc.)
The number of elements in each
row must be identical
Variables – Data Frames
age gender disease50 M TRUE43 M FALSE25 F TRUE18 M TRUE72 F FALSE65 M FALSE45 F TRUE
Accessing elements in data frame:x[row,column]The ‘age’ column:> x$age # or:> x[,”age”] # or: > x[,1]
All male rows:> x[x$gender==“M”,]

A matrix is a table of a different class
Each column must be of the same class (e.g. numeric, character, etc.)
The number of elements in each
row must be identical
Variables – Matrices
Accessing elements in matrices:x[row,column]The ‘Height’ column:> x[,”Height”] # or:
> x[,2] Note: you cannot use “$”> x$Weight

Exe cise
Construct the character vector ‘pplNames’ containing 5 names: “Srulik”, “Esti”, ”Shimshon”, “Shifra”, “Ezra”
Construct the numeric vector ‘ages’ that includes the following numbers: 21, 12 (twice), 35 (twice)
Use the data.frame() function to construct the ‘pplAges’ table out of ‘pplNames’ & ‘ages’
Retrieve the ‘pplAges’ rows with ‘ages’ values greater than 19

Lecture Overview
What is R and why use it? Setting up R & RStudio for use Calculations, functions and variable classes File handling, plotting and graphic features Statistics Packages and writing functions

For example: analysis of a gene expression file
Workflow:
Save file in workspace directory Read / load file to R Analyze the gene expression table
305 gene expression reads in 48 tissues (log10 values compared to a mixed tissue pool)
Values >0 over-expressed genes Values <0 under-expressed genes
File includes 306 rows X 49 columns
Wo king With a File

Read file to R
Use the read.table() function
Note: each function receives input (‘arguments’) and produces output (‘return value’)
The function returns a data frame
Run:> geneExprss = read.table(file = "geneExprss.txt", sep = "\t",header = T)
Check table:> dim(geneExprss) # table dimentions> geneExprss[1,] # 1st line
File Handling - ead File

Plotting - Pie Chart
What fraction of lung genes are over-expressed?
What about the under-expressed genes?
A pie chart can illustrate our findings
1
2
34
5
6
7
8 9
10

Using the pie() Function
Let’s regard values > 0.2 as over-expressed
Let’s regard values < (-0.2) as under-expressed
Let’s use Length() retrieves the number of elements in a vector
> up = length (geneExprss$Lung [geneExprss$Lung>0.2])
> down = length (geneExprss$Lung [geneExprss$Lung<(-0.2)])
> mid = length (geneExprss$Lung [geneExprss$Lung<=0.2 & geneExprss$Lung>=(-0.2)])
> pie (c(up,down,mid) ,labels = c("up","down","mid"))

Plotting - Scatter Plot
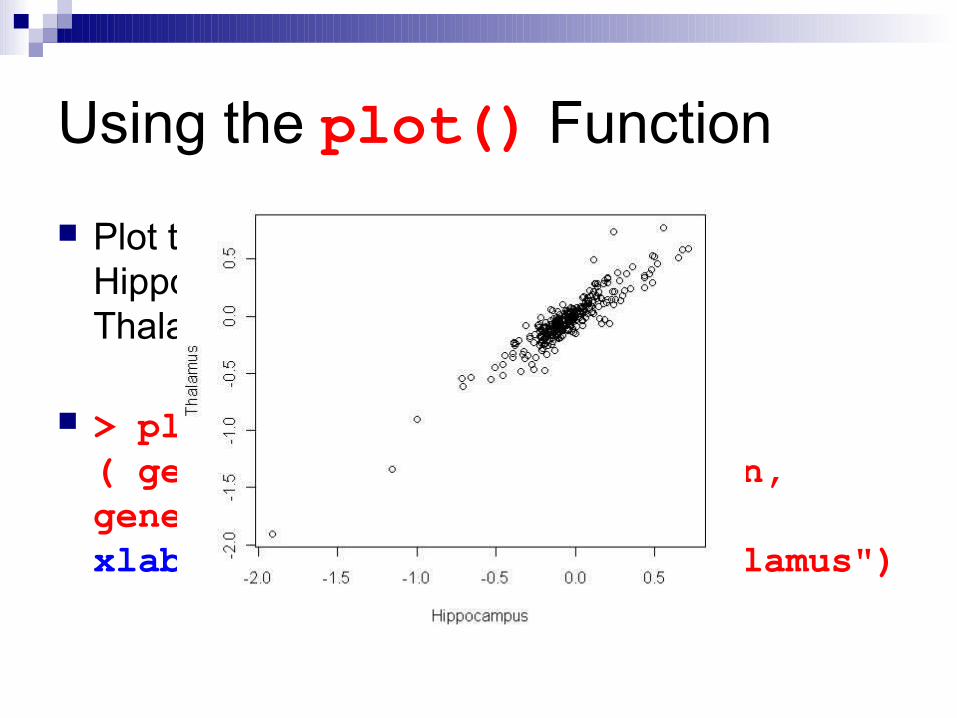
How similar is the gene expression profile of the Hippocampus (brain) to that of that of the Thalamus (brain)?
A scatter plot is ideal for the visualization of the correlation between two variables
Using the plot() Function
Plot the gene expression profile of Hippocampus.brain against that of Thalamus.brain
> plot ( geneExprss$Hippocampus.brain, geneExprss$Thalamus.brain, xlab="Hippocampus", ylab="Thalamus")
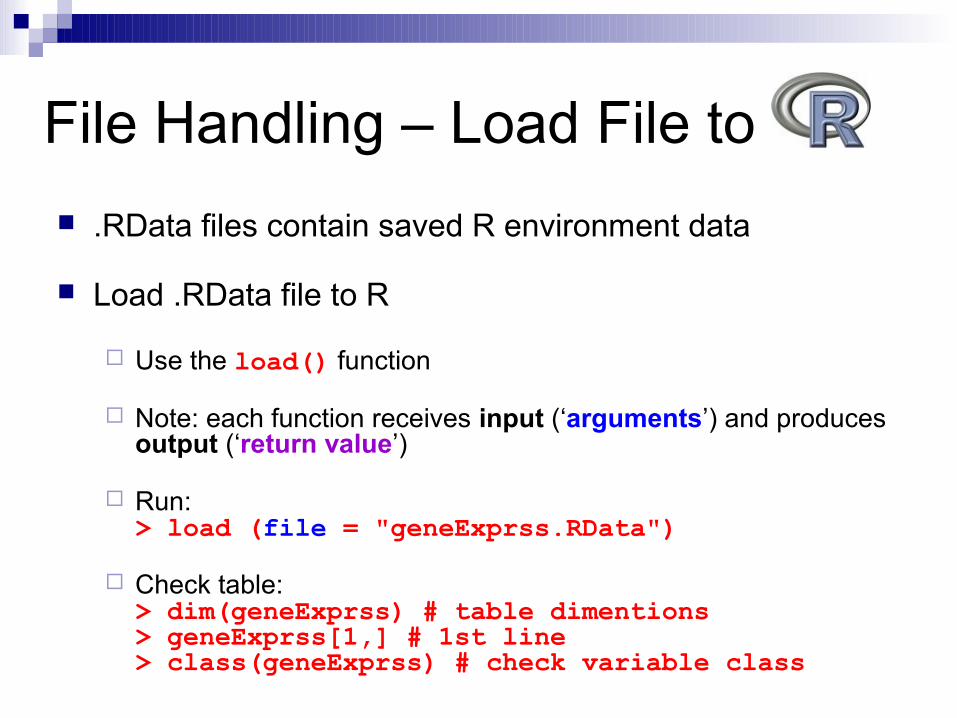
.RData files contain saved R environment data
Load .RData file to R
Use the load() function
Note: each function receives input (‘arguments’) and produces output (‘return value’)
Run:> load (file = "geneExprss.RData")
Check table:> dim(geneExprss) # table dimentions> geneExprss[1,] # 1st line> class(geneExprss) # check variable class
File Handling – Load File to

Plotting – Bar Plot
How does the expression profile of “NOVA1” differ across several tissues?
A bar plot can be used to compare two or more categories

Using the barplot() Function
Compare “NOVA1” expression in Spinalcord, Kidney, Heart and Skeletal.muscle by plotting a bar plot
Sort the data before plotting using the sort() function
barplot() works on a variable of a matrix class
> tissues = c ( "Spinalcord", "Kidney", "Skeletal.muscle", "Heart")> barplot ( sort ( geneExprss ["NOVA1",tissues] ) )

More Graphic Functions to Keep in Mind hist()
boxplot()
plotmeans()
scatterplot()
Exe cise
Use barplot() to compare “PTBP1” & “PTBP2” gene expression in “Hypothalamus.brain”
Use barplot() to compare “PTBP1” & “PTBP2” gene expression in “Lung”
What are the differences between the two plots indicative of?

Save Plot to File - RStudio
Create a .PNG file
Create a .PDF file
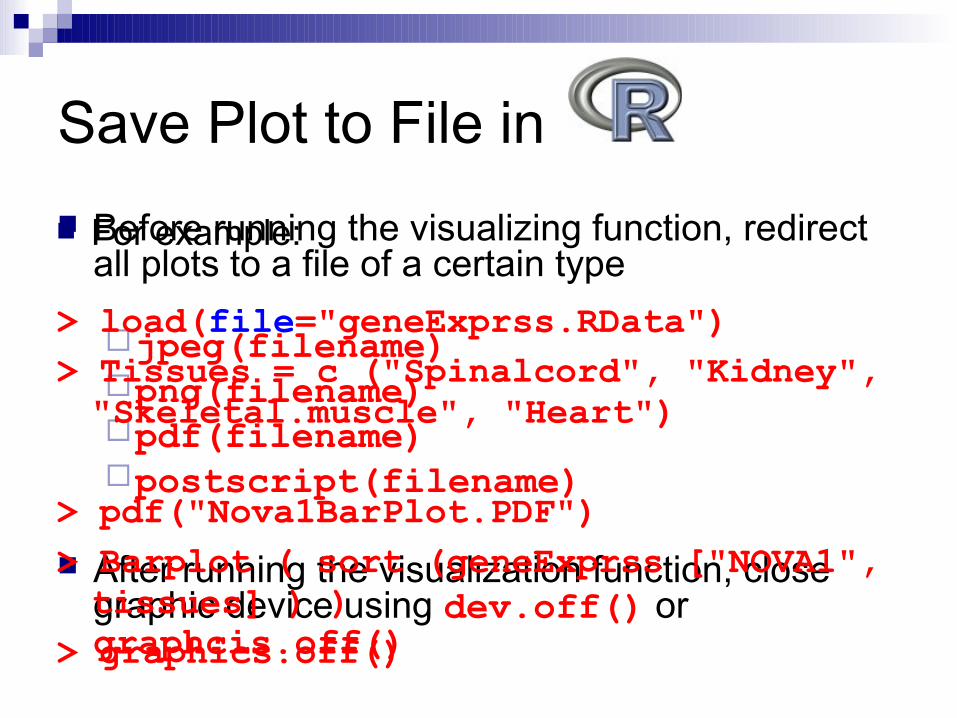
Before running the visualizing function, redirect all plots to a file of a certain type
jpeg(filename)png(filename)pdf(filename)postscript(filename)
After running the visualization function, close graphic device using dev.off() or graphcis.off()
Save Plot to File in
For example:
> load(file="geneExprss.RData")> Tissues = c ("Spinalcord", "Kidney", "Skeletal.muscle", "Heart")
> pdf("Nova1BarPlot.PDF")> Barplot ( sort (geneExprss ["NOVA1", tissues] ) )
> graphics.off()

Lecture Overview
What is R and why use it? Setting up R & RStudio for use Calculations, functions and variable classes File handling, plotting and graphic features Statistics Packages and writing functions

Statistics – cor.test()
A few slides back we compared the expression profiles of the Hippocampus.brain and the Thalamus.brain
But is that correlation statistically significant?
R can help with this sort of question as well
To answer that specific question we’ll use the cor.test() function
> geneExprss = read.table (file = "geneExprss.txt", sep = "\t", header = T)
> cor.test ( geneExprss$Hippocampus.brain, geneExprss$Thalamus.brain, method = "pearson")
> cor.test ( geneExprss$Hippocampus.brain, geneExprss$Thalamus.brain, method = "spearman")

t.test() # Student t test
wilcox.test() # Mann-Whitney test
kruskal.test() # Kruskal-Wallis rank sum test
chisq.test() # chi squared test
cor.test() # pearson / spearman correlations
lm(), glm() # linear and generalized linear models
p.adjust() # adjustment of P-values for multiple testing (multiple testing correction) using FDR, bonferroni, etc.
Statistics – More Testing, FYI
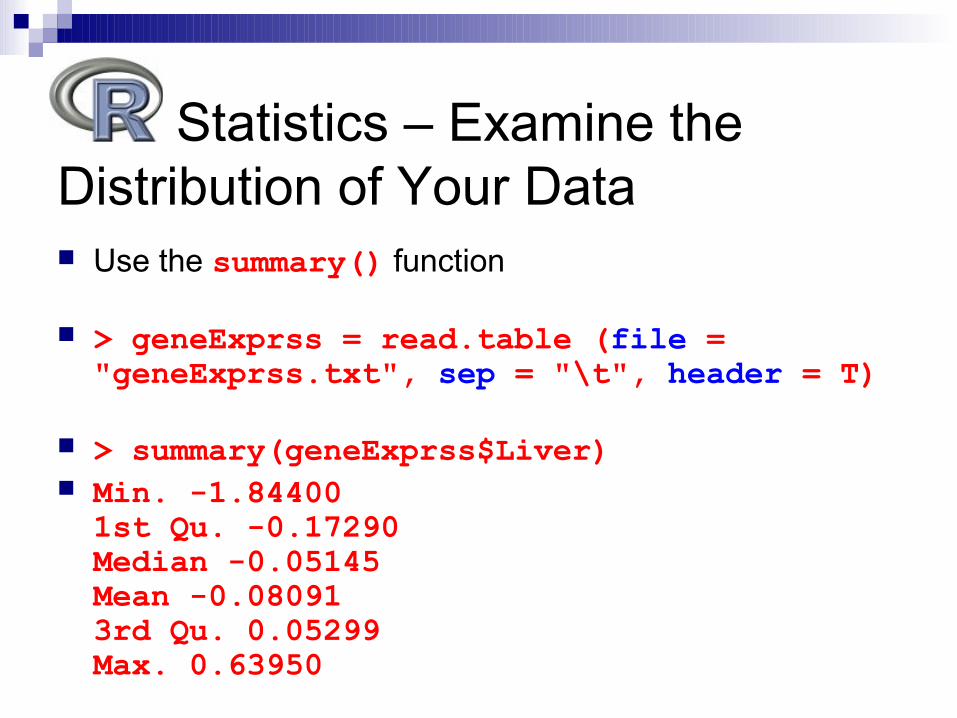
Use the summary() function
> geneExprss = read.table (file = "geneExprss.txt", sep = "\t", header = T)
> summary(geneExprss$Liver) Min. -1.844001st Qu. -0.17290 Median -0.05145 Mean -0.08091 3rd Qu. 0.05299 Max. 0.63950
Statistics – Examine the Distribution of Your Data
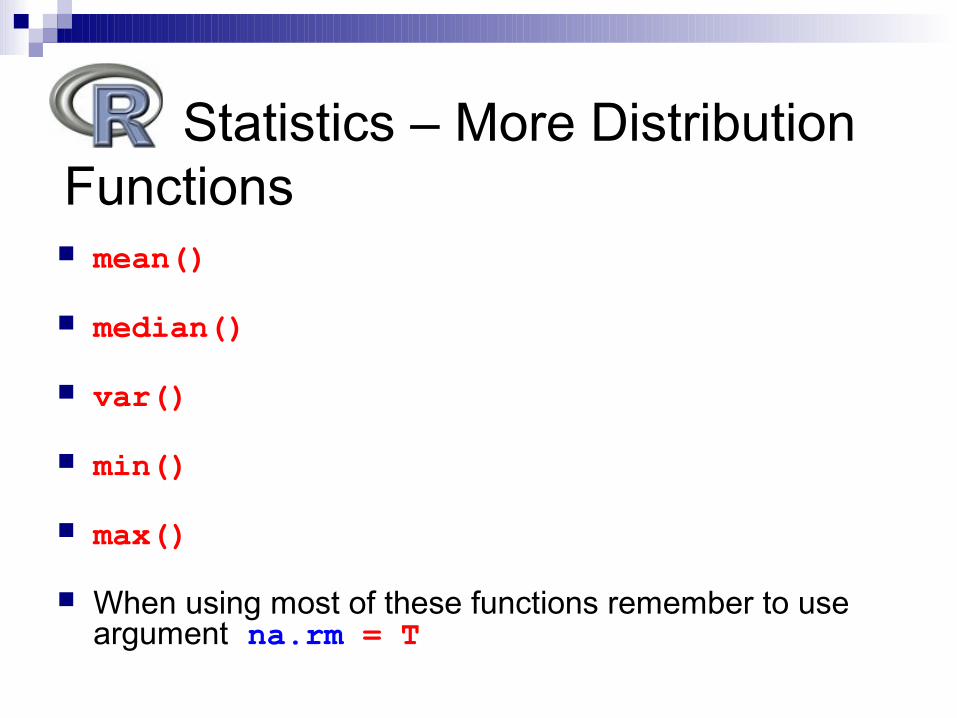
mean()
median()
var()
min()
max()
When using most of these functions remember to use argument na.rm = T
Statistics – More Distribution Functions

Lecture Overview
What is R and why use it? Setting up R & RStudio for use Calculations, functions and variable classes File handling, plotting and graphic features Statistics Packages and writing functions

All operations are performed by functions
All R functions are stored in packages
Base packages are installed along with R
Packages including additional functions can by downloaded by user
Functions can also be written by user
Functions & Packages

Install & Load Packages - RStudio
Check to load package

Install & Load Packages -
Use the functions:
Install.packages(package_name)
update.packages(package_name)
library(package_name) # Load a package

Reading the functions’ help file (> ?function_name) Run the help file examples
Use http://www.rseek.org/
Google what you’re looking for
Post on the R forum webpage
And most importantly – play with it, get the hang of it, and do NOT despair
Final Tips
R
Related Documents