KENYA November 2016 QUICKSIGHTS REPORT FOURTH ANNUAL FII TRACKER SURVEY Fieldwork completed in August 2016

Welcome message from author
This document is posted to help you gain knowledge. Please leave a comment to let me know what you think about it! Share it to your friends and learn new things together.
Transcript

KENYA
November 2016
QUICKSIGHTS REPORT
FOURTH ANNUAL FII TRACKER
SURVEYFieldwork completed in August 2016

Key definitions
Access to financial accounts – Access to a bank account or mobile
money account means a respondent can use bank/mobile money services
either via their own account or via an account of another person.
Active account holder – An individual who has a registered account and
has used it in the last 90 days.
Advanced DFS use – Advanced use of digital financial services includes
activities beyond basic cash-in/cash-out and person-to-person transfers
(e.g., savings, bill pay, investment, insurance).
Adults with DFS access – Adults (15+) who either own a DFS account
or have access to someone else’s account.
Below the poverty line – In this particular study, adults living on less
than $2.50 per day, as classified by the Grameen PPI.
Cooperative – Typically, a business or other professional organization
that is owned and run jointly by its members, who share profits or
benefits. Cooperatives can release some of the profits/funds as loans to
its members.
Credit-only nonbank financial institutions – Financial institutions
that only disburse loans to their customers.
Digital financial services (DFS) – Financial services provided through
an electronic platform (mobile phones, electronic cards, the internet).
Financial inclusion – Included individuals are those who have an
account with an institution that provides a full suite of financial services
and comes under some form of government regulation. Services include
savings, money transfers, insurance or investment. Institutions that only
offer loans to consumers, such as some MFIs, are not considered to be
full-service institutions.
Full-service nonbank financial institutions – Nonbank financial
institutions that offer their customers at least one of the following
services: savings, money transfers, insurance, or investment.
Grameen Progress out of Poverty Index (PPI) – A poverty
measurement tool from the Grameen Foundation wherein a set of
country-specific questions are used to compute the likelihood that a
household is living below the poverty line.
Microfinance institution (MFI) – An organization that offers financial
services to low income populations. Almost all give loans to their
members, and many offer insurance, deposit and other services.
Mobile money (MM) – A service in which a mobile phone is used to
access financial services.
Nonbank financial institution (NBFI) – A financial organization that
is not formally licensed as a bank or a mobile money provider, but whose
activities are regulated, at least to some extent, by the central bank within
the country. Such financial institutions include microfinance institutions
(MFI), cooperatives, Post Office (Savings) Banks and savings and credit
cooperatives (SACCOs).
Post Office (Savings) Bank – A bank that offers savings and money
transfers and has branches at local post offices.
Savings and credit cooperative (SACCO) – A unique member-driven,
self-help group owned and managed by its members, who have a
common bond. Its main purpose is to build up funds through regular
contributions by each member, with the aim of providing affordable
credit and collective investments for its members.
Urban/rural – Urban and rural persons are defined according to their
residence in urban or rural areas as prescribed by the national bureau of
statistics.
Value-added services - These are non-core financial services that go
beyond the standard services provided by financial institutions.
KENYA
2

Country context
KENYA
• Kenya continues to make deliberate efforts to increase the level of financial inclusion and strengthen confidence in the
financial sector.
– Despite having relatively advanced financial markets, Kenya has one of the highest returns-on-equity for banks in the African
continent. In August 2016, Kenyan president Uhuru Kenyatta signed new legislation intended to give more Kenyans access to
credit. The law sets an interest rate cap on loans at 4 points above the central bank’s lending rate, and sets interest rates on
savings deposits at a rate no lower than 4 points below the central bank’s lending rate. This bold step was taken despite
concerns from several top government officials that the legislation would damage access to credit.
– Since taking over as governor of the Central Bank of Kenya (KCB) in June 2015, Dr. Patrick Julius Njoroge’s tenure has been
marked by aggressive supervision of Kenya’s commercial banks. This oversight has resulted in the closure of three banks:
Imperial Bank, Dubai Bank and Chase Bank. Chase Bank was reopened but placed under receivership and is managed by the
KCB.
– Following the decrease in the interest rates on bank loans, SACCOs, which traditionally have offered loans at lower interest
rates than banks, also cut their interest rates in an effort to remain competitive and maintain their edge over banks.
– More NBFIs are obtaining licenses from the CBK to operate as banks. In June 2015, CARITAS Microfinance Bank became
the 12th microfinance bank to be licensed, offering a full range of services with a focus on the unbanked and underbanked.
(Source: http:caritas-mfb.co.ke/index.php/2015/06/15/caritas-microfinance-bank-licensed)
Source: InterMedia Kenya FII Tracker survey Wave 4 (N=3,000,15+), August 2016.
3

Country context
KENYA
• Financial service providers are finding innovative ways to expand mobile-enabled financial inclusion, including through two
different models: partnerships between banks and mobile network operators (MNOs), and banks that run a Mobile Virtual
Network Operator (MVNO), which allows them to offer all of their financial services through a mobile platform.
– Kenya Commercial Bank (KCB) M-PESA, a mobile-based banking product offered through a partnership with Safaricom, was
launched in March 2015. Among other services, KCB-M-PESA accounts give customers access to loans via their mobile
phones. Reports from the Central Bank of Kenya (CBK) and from the recent FII tracker survey, show the product has taken
off, and the number of accounts is growing rapidly.
– Equity Bank launched MVNO Equitel, registered under Finserve Africa, in July 2015. Initially, Equitel used a thin-SIM
technology that would have allowed the Equitel SIM to be placed on top of other providers’ SIM cards. Providers have
challenged this and, as of November 2016, the issue is under legal consideration. As a result, Equitel provides their own SIM
cards to their customers, which combine access to both banking and telecommunications services. This gives customers the
ability to take advantage of all banking services through a mobile network. Reports from the CBK and the recent FII surveys
show the service is currently seeing tremendous growth, and has now eclipsed players like Airtel, Orange Money and
Mobikash.
– Equity Bank is driven by the desire to ensure Kenyans have access to digital banking platforms. They partnered with software
giant Oracle to deploy a Bank 3.0 approach, featuring a number of digital products such as Eazzy Pay, Eazzy App, Eazzy
Loan, Eazzy bank account and Eazzy Chama.
– The most recent competitor to challenge M-PESA, currently the largest mobile money provider in Kenya, is mVisa,* which
launched a mobile-phone application to enable cashless transactions in Kenya. It is interoperable and not dependent on a bank
and not dependent on a mobile operator. Users of mVisa make payments by scanning a unique merchant Quick Response, or
QR, code using their smartphones.
Source: InterMedia Kenya FII Tracker survey Wave 4 (N=3,000,15+), August 2016.4
*mVisa is not covered in this survey because the product only came into the market in September 2016.
Notable statistics
KENYA
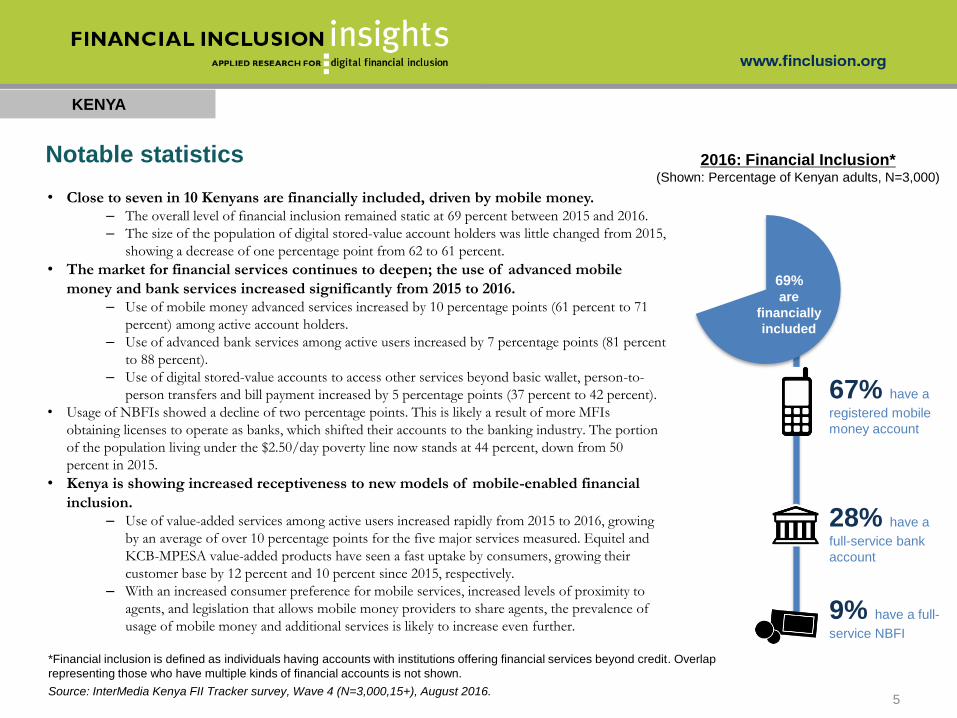
• Close to seven in 10 Kenyans are financially included, driven by mobile money. – The overall level of financial inclusion remained static at 69 percent between 2015 and 2016.
– The size of the population of digital stored-value account holders was little changed from 2015,
showing a decrease of one percentage point from 62 to 61 percent.
• The market for financial services continues to deepen; the use of advanced mobile
money and bank services increased significantly from 2015 to 2016. – Use of mobile money advanced services increased by 10 percentage points (61 percent to 71
percent) among active account holders.
– Use of advanced bank services among active users increased by 7 percentage points (81 percent
to 88 percent).
– Use of digital stored-value accounts to access other services beyond basic wallet, person-to-
person transfers and bill payment increased by 5 percentage points (37 percent to 42 percent).
• Usage of NBFIs showed a decline of two percentage points. This is likely a result of more MFIs
obtaining licenses to operate as banks, which shifted their accounts to the banking industry. The portion
of the population living under the $2.50/day poverty line now stands at 44 percent, down from 50
percent in 2015.
• Kenya is showing increased receptiveness to new models of mobile-enabled financial
inclusion. – Use of value-added services among active users increased rapidly from 2015 to 2016, growing
by an average of over 10 percentage points for the five major services measured. Equitel and
KCB-MPESA value-added products have seen a fast uptake by consumers, growing their
customer base by 12 percent and 10 percent since 2015, respectively.
– With an increased consumer preference for mobile services, increased levels of proximity to
agents, and legislation that allows mobile money providers to share agents, the prevalence of
usage of mobile money and additional services is likely to increase even further.
69%are
financially
included
9% have a full-
service NBFI
28% have a
full-service bank
account
67% have a
registered mobile
money account
2016: Financial Inclusion*(Shown: Percentage of Kenyan adults, N=3,000)
*Financial inclusion is defined as individuals having accounts with institutions offering financial services beyond credit. Overlap
representing those who have multiple kinds of financial accounts is not shown.
Source: InterMedia Kenya FII Tracker survey, Wave 4 (N=3,000,15+), August 2016.5

7
20
60
61
9
22
61
62
6
21
58
60
0
21
62
65
Nonbank financialinstitution
Bank
Mobile money
Any financial service
9
28
67
69
11
27
67
69
8
26
63
65
0
27
68
70
Nonbank financialinstitution
Bank
Mobile money
Any financial service
2013 (N=3,000) 2014 (N=2,995) 2015 (N=2,994) 2016 (N=3,000)
10
31
81
82
13
29
79
80
11
27
73
74
0
29
76
77
Nonbank financialinstitution
Bank
Mobile money
Any financial service
KENYA
At-a-glance: Financial inclusion is still driven by mobile money; NBFI usage
is giving way to bank usage as more NBFIs are licensed to operate as
banks
Access to financial accounts Registered financial service users
(Shown: Percentage of Kenyan adults for each year)
Active* financial service users
NBFIs were not included in 2013 survey. Types of account ownership are not mutually exclusive. *A registered account used in the last 90 days.
NANA NA
Source: InterMedia Kenya FII Tracker surveys Wave 1 (N=3,000, 15+), September-October 2013; Wave 2 (N=2,995, 15+), September 2014; Wave 3 (N=2,994,
15+), September 2015, Wave 4 (N=3,000,15+), August 2016. 6

FII Kenya Tracker survey details
KENYA
Survey Summary
• Annual, nationally representative survey (N=3,000) of Kenyan adults aged 15+
• Face-to-face interviews lasting, on average, 80 minutes
• Fourth survey (Wave 4) conducted from August 4-August 27, 2016
• Tracks trends and market developments in DFS by comparison with the information gathered in the first survey conducted in
2013, the second survey conducted in 2014, and the third survey in 2016
Data Collection
• Basic demographics and poverty measurement (Grameen Progress Out of Poverty Index*)
• Access/use of mobile devices
• Access/use of mobile money
• Access/use of formal financial services (e.g., bank accounts)
• Access/use of semi-formal and informal financial services (e.g., MFI, SACCO, cooperatives, self-help groups)
• Financial literacy and preparedness
• General financial behaviors
*Grameen Progress Out of Poverty Index was modified to exclude frying pans as they showed a sudden increase in numbers.
Source: InterMedia Kenya FII Tracker surveys Wave 4 (N=3,000,15+), August 2016.
7

Survey demographics
KENYA
Figures are weighted to reflect national census data demographics.
Source: InterMedia Kenya FII Tracker surveys Wave 4 (N=3,000,15+), August 2016.
.
% of survey % of survey
Gender Age
Male 49% 15-24 36%
Female 51% 25-34 26%
Geography 35-44 16%
Urban 36% 45-54 11%
Rural 64% 55+ 12%
Income Aptitude
Above the $2.50/day poverty line 56% Basic literacy 86%
Below the $2.50/day poverty line 44% Basic numeracy 98%
8
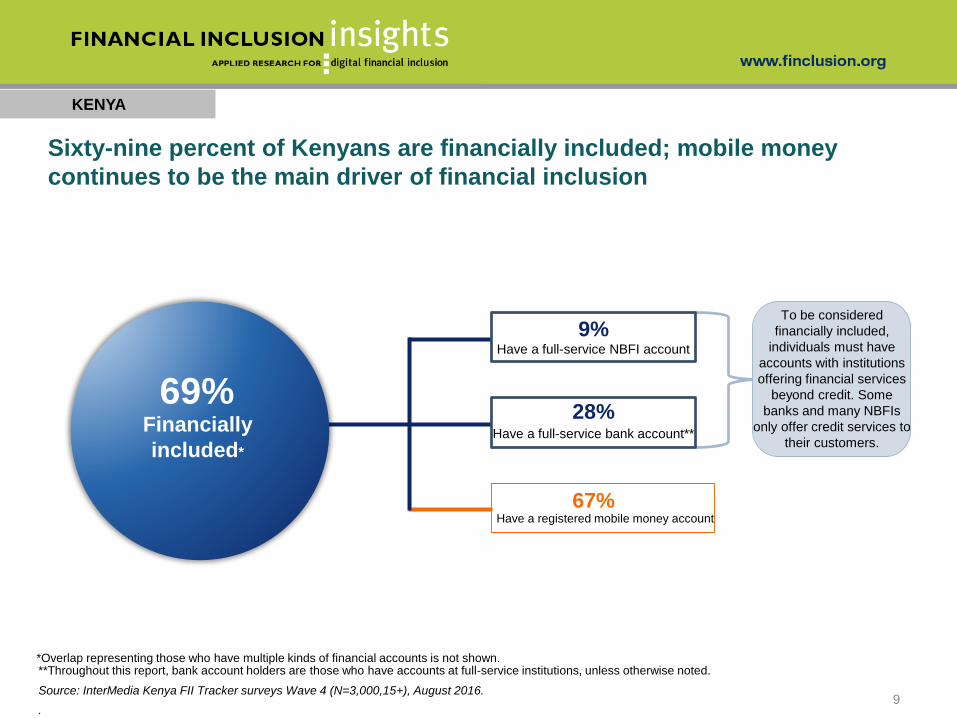
Sixty-nine percent of Kenyans are financially included; mobile money
continues to be the main driver of financial inclusion
KENYA
Have a full-service NBFI account
Have a full-service bank account**
Have a registered mobile money account
28%
9%
67%
To be considered
financially included,
individuals must have
accounts with institutions
offering financial services
beyond credit. Some
banks and many NBFIs
only offer credit services to
their customers.
*Overlap representing those who have multiple kinds of financial accounts is not shown.**Throughout this report, bank account holders are those who have accounts at full-service institutions, unless otherwise noted.
Source: InterMedia Kenya FII Tracker surveys Wave 4 (N=3,000,15+), August 2016.
.
69%Financially
included*
9

KENYA
Access to financial accounts(Shown: Percentage of Kenyan adults for each year)
Access to financial accounts increased marginally; NBFI account access
experienced a slight decrease
Types of accounts are not mutually exclusive.
NA
Source: InterMedia Kenya FII Tracker surveys Wave 1 (N=3,000, 15+), September-October 2013; Wave 2 (N=2,995, 15+), September 2014; Wave 3 (N=2,994,
15+), September 2015, Wave 4 (N=3,000,15+), August 2016. 10
10
31
81
82
13
29
79
80
11
27
73
74
29
76
77
Nonbank financial institution
Bank
Mobile money
Any financial service
2013 (N=3,000) 2014 (N=2,995) 2015 (N=2,994) 2016 (N=3,000)
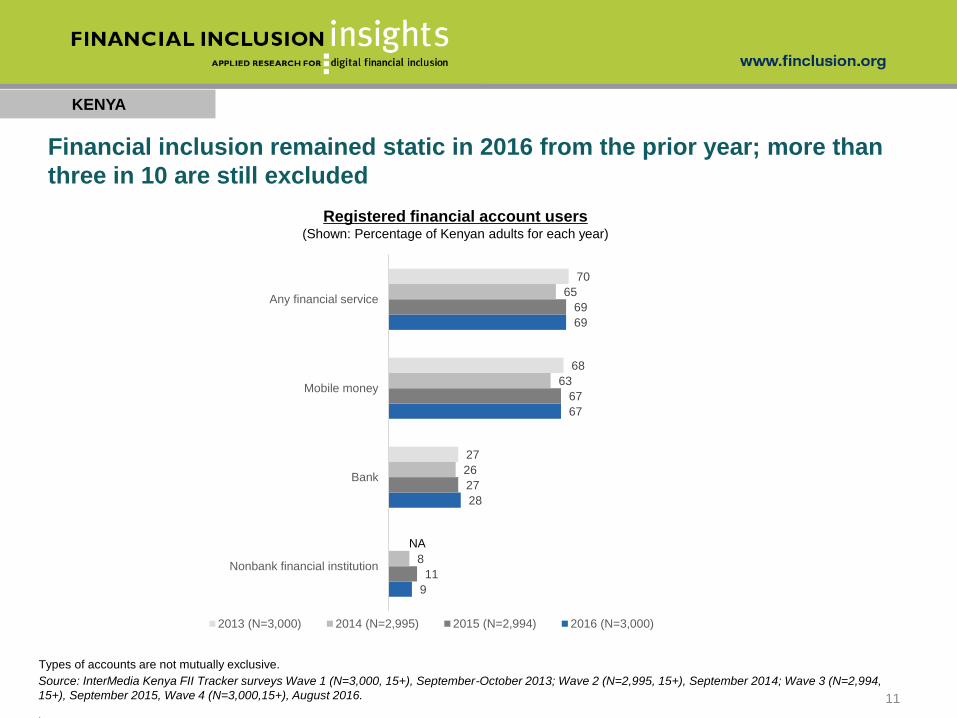
KENYA
Financial inclusion remained static in 2016 from the prior year; more than
three in 10 are still excluded
Registered financial account users(Shown: Percentage of Kenyan adults for each year)
Types of accounts are not mutually exclusive.
NA
Source: InterMedia Kenya FII Tracker surveys Wave 1 (N=3,000, 15+), September-October 2013; Wave 2 (N=2,995, 15+), September 2014; Wave 3 (N=2,994,
15+), September 2015, Wave 4 (N=3,000,15+), August 2016.
.
11
9
28
67
69
11
27
67
69
8
26
63
65
27
68
70
Nonbank financial institution
Bank
Mobile money
Any financial service
2013 (N=3,000) 2014 (N=2,995) 2015 (N=2,994) 2016 (N=3,000)

KENYA
Active use is highest among mobile money account holders, and fell
among bank and NBFI account holders
Active financial account holders(Shown: Percentage of Kenyan adults)
Types of accounts are not mutually exclusive.
Active financial account holders(Shown: Percentage of registered users for each type of account, by year)
Source: InterMedia Kenya FII Tracker surveys Wave 1 (N=3,000, 15+), September-October 2013; Wave 2 (N=2,995, 15+), September 2014; Wave 3 (N=2,994,
15+), September 2015, Wave 4 (N=3,000,15+), August 2016.
NA
12
7
20
60
61
9
22
61
62
6
21
58
60
21
62
65
Nonbank financial institution
Bank
Mobile money
Any financial service
2013 (N=3,000) 2014 (N=2,995) 2015 (N=2,994) 2016 (N=3,000)
75
70
89
89
81
80
91
91
78
82
91
91
79
92
92
2013 2014 2015 2016
Active bank use has
decreased most likely
due to increased mobile
money use
NBFI use decreased
due to the switch to
banks
N/A N/A

KENYA
Bank uses, by type(Shown: Percentage of active bank account holders)
Rapid increases in advanced usage of bank accounts, and especially
mobile money accounts, shows a deepening in financial account usage
Due to the changes in the questionnaire some data points may not be directly comparable across years. Obtaining airtime through mobile money is no
longer considered an advanced activity.
Mobile money uses, by type(Shown: Percentage of active mobile money account holders)
Source: InterMedia Kenya FII Tracker surveys Wave 1 (N=3,000, 15+), September-October 2013; Wave 2 (N=2,995, 15+), September 2014; Wave 3 (N=2,994,
15+), September 2015, Wave 4 (N=3,000,15+), August 2016. 13
46%
23%19%
11%
53%
77%81%
88%
2 0 1 3 ( N = 6 5 9 ) 2 0 1 4 ( N = 6 6 6 ) 2 0 1 5 ( N = 6 6 8 ) 2 0 1 6 ( N = 5 9 6 )
Basic activities only (CICO, account management, P2P)
At least one advanced activity
73%
59%
39%
28%27%
40%
61%
71%
2 0 1 3 ( N = 1 , 9 9 9 ) 2 0 1 4 ( N = 1 , 8 5 9 ) 2 0 1 5 ( N = 1 , 9 1 9 ) 2 0 1 6 ( N = 1 , 8 2 8 )
Basic activities only (CICO, account management, P2P)
At least one advanced activity

8
15
13
20
27
29
29
44
53
55
60
64
70
72
3
7
6
7
8
7
10
46
55
57
61
66
72
73
Below poverty line (n=1,324)
Rural (n=1,831)
Females (n=1,753)
Total population (N=3,000)
Males (n=1,247)
Urban (n=1,169)
Above poverty line (n=1,676)
Active bank account holders Active mobile money account holders Active NBFI account holders All active financial account holders
KENYA
Active usage is highest among consumers who are above the poverty line,
urban, and male, and lowest among female, rural and poor consumers
Types of accounts are not mutually exclusive.
Source: InterMedia Kenya FII Tracker surveys Wave 4 (N=3,000,15+), August 2016.
2016: Active account usage by demographic(Shown: Percentage of each subgroup)
Largest gap in
active
registered
financial
accounts
14
9%
gender
gap

Nearly three-quarters of Kenyans report they live within a kilometer of a
financial POS; access to mobile money agents is far more widespread vs.
SACCOS and MFIs
KENYA
15
Source: InterMedia Kenya FII Tracker survey Wave 4 (N=3,000,15+), August 2016.
2016: Proximity to points-of-service (POS) for financial institutions(Shown: Percentage of Kenyan adults, N=3,000)
72
62
40
3127
14 14
8 8
14
20 1924
11
27 27
1916
9 11
18
26
13
42 41
31 30
5 7
2319
50
16 18
4245
Any POS MM agent Retail store withan MM agent
Banking agent Informal group Bank branch ATM SACCO MFI
Less than 1 km from home 1-5 kms from home More than 5 kms from home Don't know
KENYA
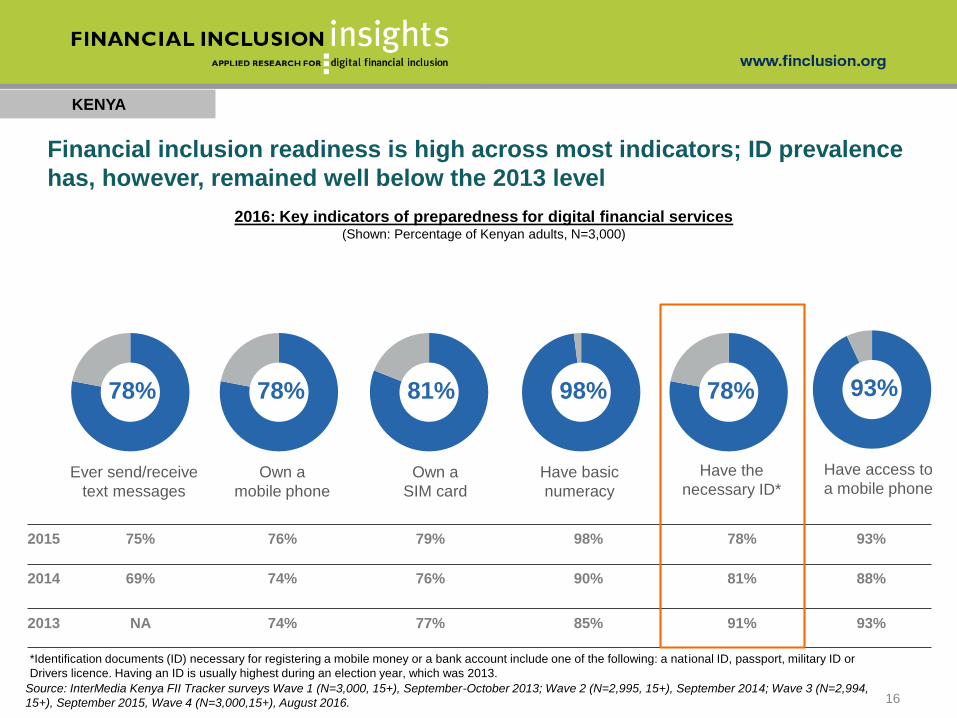
Financial inclusion readiness is high across most indicators; ID prevalence
has, however, remained well below the 2013 level
*Identification documents (ID) necessary for registering a mobile money or a bank account include one of the following: a national ID, passport, military ID or
Drivers licence. Having an ID is usually highest during an election year, which was 2013.
2016: Key indicators of preparedness for digital financial services (Shown: Percentage of Kenyan adults, N=3,000)
2015 75% 76% 79% 98% 78% 93%
2014 69% 74% 76% 90% 81% 88%
2013 NA 74% 77% 85% 91% 93%
93%
Have access to
a mobile phone
78%
Ever send/receive
text messages
98%
Have basic
numeracy
78%
Have the
necessary ID*
81%
Own a
SIM card
78%
Own a
mobile phone
Source: InterMedia Kenya FII Tracker surveys Wave 1 (N=3,000, 15+), September-October 2013; Wave 2 (N=2,995, 15+), September 2014; Wave 3 (N=2,994,
15+), September 2015, Wave 4 (N=3,000,15+), August 2016. 16

Conversion from awareness of mobile money providers* to mobile money use(Shown: Percentage of Kenyan adults for each year)
2014 (N=2,995) 2015 (N=2,994)
MM OTC use, 10%
MM registered users, 63%
MM OTC use, 13%
MM registered users, 67%
73% use
mobile
money
0.77
conversion
rate
79% use
mobile
money**
0.80
conversion
rate
*Aware of at least one mobile money provider **Percentages add to 79% and 81% due to rounding.
Source: InterMedia Kenya FII Tracker surveys Wave 2 (N=2,995, 15+), September 2014; Wave 3 (N=2,994, 15+), September 2015, Wave 4 (N=3,000,15+), August
2016.
KENYA
17
99%
aware
99%
aware
2016 (N=3,000)
0.84
conversion
rate
95%
aware
97%
aware
The rate of awareness of mobile money has peaked; conversion from
awareness to use continues to increase
MM OTC use, 16%
MM registered users, 67%
81% use
mobile
money**

KENYA
Nearly eight in 10 Kenyans own mobile phones and the majority are active
users of registered mobile money accounts; fewer have completed the
customer journey to monthly active use of advanced services
*Phone owners
2016: Distribution of Kenyan mobile phone owners at each major step in the customer
journey for mobile money, and conversion rate between steps(Shown: Percentage of Kenyan adults, N=3,000)
Source: InterMedia Kenya FII Tracker survey Wave 4 (N=3,000,15+), August 2016.18
78%
Mobile phone
ownership
31%63% 58% 54%71%
.57.93.92.89.91
.81
Advanced active
registered use
(30 days)*
Registration* Active
registered use
(90 days)*
Active
registered use
(30 days)*
Trial/access*
.53

KENYA
19
Little change in registered and active mobile money use was seen across
most demographics, except for a small decrease among those above the
poverty line
Demographic trends for active registered mobile money account use (Shown: Percentage of Kenyan adults who fall into each category*)
*Categories are not mutually exclusive.
Source: InterMedia Kenya FII Tracker surveys Wave 1 (N=3,000, 15+), September-October 2013; Wave 2 (N=2,995, 15+), September 2014; Wave 3 (N=2,994,
15+), September 2015, Wave 4 (N=3,000,15+), August 2016.
Demographic trends for all registered mobile money account use (Shown: Percentage of Kenyan adults who fall into each category*)
68 70 6779
62
80
5663 67
6074
57
79
48
67 7064
7562
80
5467 70
6475
62
77
55
Total population Males Females Urban Rural Above poverty line Below poverty line
2013 2014 2015 2016
62 65 60
75
55
75
5058 61
54
70
51
74
42
61 6457
70
55
75
4660 64
55
70
53
72
44
Total population Males Females Urban Rural Above poverty line Below poverty line
2013 2014 2015 2016

47
37
23
17
16
10
6
2
2
KENYA
Question allowed for multiple responses.
Source: InterMedia Kenya FII Tracker surveys Wave 3 (N=2,994, 15+), September 2015, Wave 4 (N=3,000,15+), August 2016.
Loan activity
Save/set aside money
Bill pay
Receive wages
Pay for goods/services at a store
Make mobile money transfer to other
financial institution
Insurance activity
2015 (n=1,919)
2016: Advanced mobile money (MM) account uses(Shown: Percentage of active mobile money account holders, n=1,828)
Due to the changes in the questionnaire some data points may not be directly comparable across years. Making mobile money to mobile money
transfers is not considered an advanced activity and transfer from MM to other institutions combines all institutions.
Seven in 10 active mobile money account holders use advanced services,
with the biggest gains in receiving wages, paying for bills, and paying for
goods and services
71%of active mobile
money account
holders have used at
least one advanced
mobile money
function
vs.
61% in 2015
and
40% in 2014
Receive G2P payments
Make transfers to/from informal group
41%
28%
N/A
12%
12%
9%
2%
2%
1%
20

KENYA
M-PESA is the provider of choice; almost all active mobile money users
report having used M-PESA; Equitel users are increasing rapidly
Active mobile money account holders can have accounts with more than one provider. Missing years are as included in the questionnaire
Source: InterMedia Kenya FII Tracker surveys Wave 1 (N=3,000, 15+), September-October 2013; Wave 2 (N=2,995, 15+), September 2014; Wave 3 (N=2,994, 15+),
September 2015, Wave 4 (N=3,000,15+), August 2016.
Active mobile-money provider account holdings (Shown: Percentage of active mobile-money account holders who report using selected providers, by year)
21
0.3
0
0.1
0.1
8
4
99
0.3
0.1
0.3
0.5
4
5
99
0.5
0.2
0.4
0.7
4
99
0.2
3
99
Orange Money
Tangaza Pesa
Mobicash
Yu Cash
Equitel
Airtel Money
Safaricom M-Pesa
2013 (n=1,999) 2014 (n=1,859) 2015 (n=1,919) 2016 (n=1,1828)

Question allowed for multiple responses.
Source: InterMedia Kenya FII Tracker surveys Wave 4 (N=3,000,15+), August 2016.
Person-to-person transfers continue to drive mobile money adoption and
continued use, along with cash-in, cash-out
2016:Top reasons active account holders
start to use mobile money (Shown: Percentage of active mobile money account holders, n=1828)
1
8
8
34
37
Somebody requested I open anaccount
I wanted a safe place tokeep/store money
I wanted to start saving with amobile money account
I had to send money to anotherperson
I had to receive money fromanother person
2016: Top uses of mobile money services
among active account holders(Shown: Percentage of active mobile money account holders, n=1828)
82
87
89
93
98
Buy airtime top-ups
Send money to another person
Deposit money
Receive money from another person
Withdraw money
KENYA
22

There is increased access to digital bank accounts through expanded
internet/mobile capabilities
Digital access among active bank account holders(Shown: Percentage of active bank account holders)
Digital bank account access and usage(Shown: Percentage of Kenyan adults)
Digital bank accounts are those that offer at least one of the following options: debit/ATM or credit cards,
internet or mobile access, or a digital money transfer capability.
Source: InterMedia Kenya FII Tracker surveys Wave 3 (N=2,994, 15+), September 2015, Wave 4 (N=3,000,15+), August 2016.
83
79
94
97
80
68
97
99
Can be accessed via internet and/ormobile
Can transfer money digitally
Offers debit/ATM or credit card
Digital bank account access
2015 (n=668) 2016 (n=596)
19
20
27
28
29
31
21
22
27
27
28
29
Active bank account holders,digital accounts
Active bank account holders,any accounts
Bank account holders, digitalaccounts
Bank account holders, anyaccounts
Access to a bank, digitalaccounts
Access to a bank, any accounts
2015 (N=2,994) 2016 (N=3,000)
KENYA
23

KENYA
Value-added services continued to rapidly expand their customer bases,
with new entrants Equitel and KCB-M-PESA showing impressive growth
Use of value-added services (Shown: Percentage of active mobile money account holders for each year)
Categories are not mutually exclusive. Services presented as to which year they were included in the survey.
Missing years are as included in the questionnaire
Source: InterMedia Kenya FII Tracker surveys Wave 1 (N=3,000, 15+), September-October 2013; Wave 2 (N=2,995, 15+), September 2014; Wave 3 (N=2,994,
15+), September 2015, Wave 4 (N=3,000,15+), August 2016.
M-Shwari
A savings account and credit provider
KCB M-PESA
A bank-MNO partnership that offers
mobile money services exclusively to M-
PESA customers.
Equitel
Savings account and credit provider,
and a mobile virtual network operator
offering additional telecom services.
Lipa na M-PESA
A merchant and bill payments tool.
Lipa Karo na M-PESA
A payment service for school fees.
M-KOPA
Mobile-money-based product for
acquiring solar electric systems
(Awareness of each service among the total
sample)
24
6
7
10
12
25
35
41
3
4
12
18
32
4
5
9
12
26
0.6
2
4
15
M-KOPA
Lipa Karo na M-PESA
KCB M-PESA
Equitel
Lipa na M-PESA Goods/Services
Lipa na M-PESA Bill pay
M-Shwari
2013 (n=1,999) 2014 (n=1,859) 2015 (n=1,919) 2016 (n=1,828)

59
44
42
24
10
6
5
Question allowed for multiple responses.
Source: Source: InterMedia Kenya FII Tracker surveys Wave 3 (N=2,994, 15+), September 2015, Wave 4 (N=3,000,15+), August 2016.
Insurance activity
Save/set aside money
Bill pay
Receive wages
Receive G2P
Loan activity
Transfer from bank to other
financial institution
2015 (n=668)
54%
38%
N/A%
5%
5%
33%
24%
2016: Advanced bank account uses(Shown: Percentage of active bank account holders, n=596)
Due to the changes in the questionnaire some data points may not be directly comparable across years. Initially it included Bank to bank transfers
Almost nine in 10 bank account holders are active account users; saving
and receiving wages are the top uses
88%of active bank
account holders
have used at least
one advanced
banking feature
vs.
81% in 2015
and
77% in 2014
KENYA
25

KENYA
All NBFIs* Full-service NBFIs
(Shown: Percentage of Kenyan adults for each year)
Credit-only NBFIs
.
Source: InterMedia Kenya FII Tracker surveys Wave 3 (N=2,994, 15+), September 2015, Wave 4 (N=3,000,15+), August 2016.
NBFI access increased one percentage point in 2016, registered use and
active use showed small decreases
26
8
10
16
10
13
15
8
10
14
Active registered use
Registered use
Access
7
9
11
9
11
13
6
8
11
Active registered use
Registered use
Access
2014 (N=2,995) 2015 (N=2,994) 2016 (N=3,000)
0.6
0.8
1
0.6
0.8
0.9
0.6
0.9
2
Active registered use
Registered use
Access
*FII did not measure NBFIs in 2013.
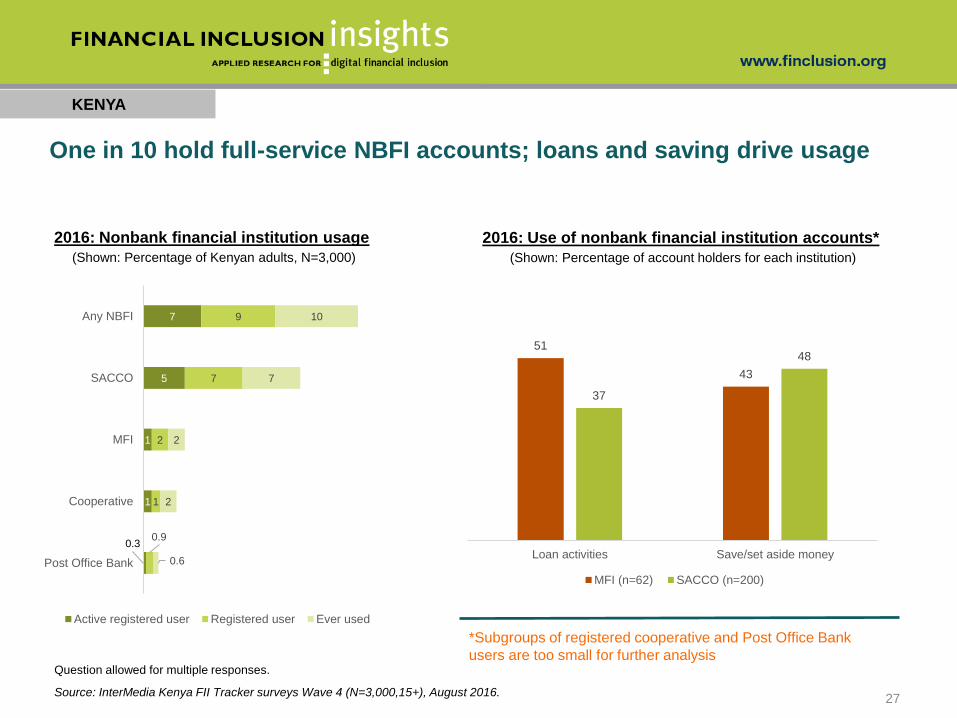
KENYA
One in 10 hold full-service NBFI accounts; loans and saving drive usage
2016: Nonbank financial institution usage
(Shown: Percentage of Kenyan adults, N=3,000)
Question allowed for multiple responses.
Source: InterMedia Kenya FII Tracker surveys Wave 4 (N=3,000,15+), August 2016.
*Subgroups of registered cooperative and Post Office Bank
users are too small for further analysis
0.3
1
1
5
7
0.9
1
2
7
9
0.6
2
2
7
10
Post Office Bank
Cooperative
MFI
SACCO
Any NBFI
Active registered user Registered user Ever used
2016: Use of nonbank financial institution accounts*
(Shown: Percentage of account holders for each institution)
51
43
37
48
Loan activities Save/set aside money
MFI (n=62) SACCO (n=200)
27

KENYA
Active use of advanced digital financial services increased among account
holders; account ownership decreased among poor adults and rural women
Digital stored-value accounts: accounts in which a monetary value is represented in a digital electronic format and can be retrieved/transferred by the account
owner remotely. For this particular study, DSVAs include a bank account or NBFI account with digital access (a card, online access or a mobile phone
application) and a mobile money account.
Source: InterMedia Kenya FII Tracker surveys Wave 2 (N=2,995, 15+), September 2014; Wave 3 (N=2,994, 15+), September 2015, Wave 4 (N=3,000,15+),
August 2016.
.
28
Main FSP Indicator
2014 2015 2016
Base Definition% % %
Base n Base n Base n
Adults (15+) who actively use digital stored-value accounts59% 62% 61%
All adults2,995 2,994 3,000
Poor adults (15+) who actively use digital stored-value accounts43% 48% 45% All poor
(income <$2.5/day)1,502 1,474 1,324
Poor women (15+) who actively use digital stored-value accounts39% 44% 42% All poor women
(income <$2.5/day)916 929 817
Rural women (15+ ) who actively use digital stored-value accounts 47% 54% 51%
All rural women1,068 1,105 1,061
Adults (15+) who actively use digital stored-value accounts and have accessed
at least one advanced financial service (beyond basic wallet & P2P)
31% 41% 46%All adults
2,995 2,994 3,000
Poor adults (15+) who actively use digital stored-value accounts and have
accessed at least one advanced financial service (beyond basic wallet & P2P)
17% 25% 27% All poor
(income <$2.5/day)1,502 1,474 1,324
Poor women (15+) who actively use digital stored-value accounts and have
accessed at least one advanced financial service (beyond basic wallet & P2P)
12% 20% 22% All poor women
(income <$2.5/day)916 929 817
Rural women (15+) who actively use digital stored-value accounts and have
accessed at least one advanced financial service (beyond basic wallet & P2P)
17% 29% 31%All rural women
1,068 1,105 1,061
For more information, contact:
David Musiime, FII Africa Lead [email protected]
Samuel Schueth, Director of Research [email protected]
Related Documents