Quick Question Page 1 Your Red Box Recorders system may look different to the one used in this document. © Red Box Recorders Limited 2017. All rights reserved. What’s in the Quantify Insight Categories Quantify Insight groups status information into six main areas: • My Red Box – review your assets – see “My Red Box” on page 3. • Recording Status – review devices and recording license utilisation – see “Recording Status” on page 3. • Health – critical system status – see “Health” on page 4. • Users – user replay license utilisation – see “Users” on page 6. • Storage – call storage utilisation – see ”Storage” on page 6. • Assure – device test results – see “Assure” on page 8. Each category and sub-category status indicator shows the current state: • Green Tick: All ok. • Orange Exclamation Mark: Current warning or previous (unsuppressed) warning. • Red X: Current alarm or previous (unsuppressed) alarm. In general, the sub-category graphs/charts show historical data. Alarm and Warning notifications highlight applicable breached limits within each category/sub-category, as well as “filtered” alarms and warnings. For a summary of all categories, sub-categories, graphs/charts, and reports, see “Site Map” on page 2.

Welcome message from author
This document is posted to help you gain knowledge. Please leave a comment to let me know what you think about it! Share it to your friends and learn new things together.
Transcript
Quick Question
Page 1
Your Red Box Recorders system may look different to the one used in this document.© Red Box Recorders Limited 2017. All rights reserved.
What’s in the Quantify Insight Categories
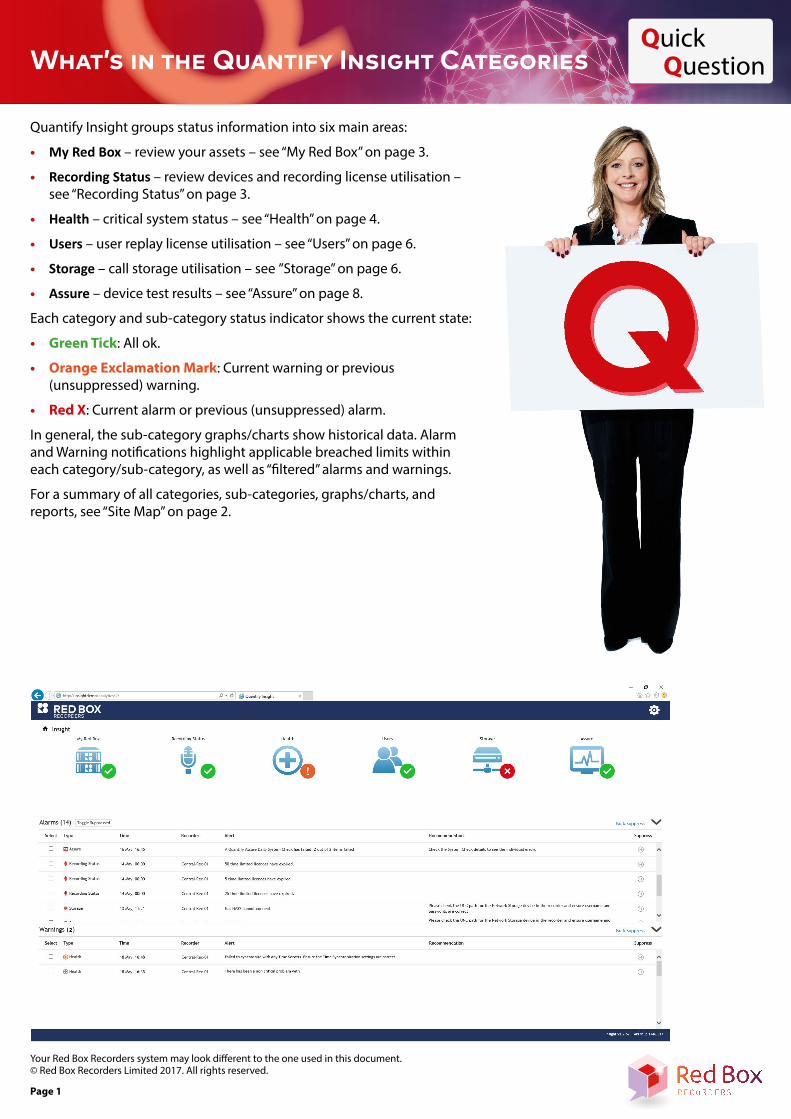
Quantify Insight groups status information into six main areas:
• My Red Box – review your assets – see “My Red Box” on page 3.
• Recording Status – review devices and recording license utilisation – see “Recording Status” on page 3.
• Health – critical system status – see “Health” on page 4.
• Users – user replay license utilisation – see “Users” on page 6.
• Storage – call storage utilisation – see ”Storage” on page 6.
• Assure – device test results – see “Assure” on page 8.
Each category and sub-category status indicator shows the current state:
• Green Tick: All ok.
• Orange Exclamation Mark: Current warning or previous (unsuppressed) warning.
• Red X: Current alarm or previous (unsuppressed) alarm.
In general, the sub-category graphs/charts show historical data. Alarm and Warning notifications highlight applicable breached limits within each category/sub-category, as well as “filtered” alarms and warnings.
For a summary of all categories, sub-categories, graphs/charts, and reports, see “Site Map” on page 2.

Page 2
© Red Box Recorders Limited 2017. All rights reserved.
Site MapHere’s a quick summary of all categories, sub-categories, graphs/charts, and reports - may save you a little time finding what you need.
Category Sub-Category Graph/Chart Report
My Red Box
Assets Asset properties. NA
Recording Status
Devices Detected vs Enabled
Bar Chart - Maximum number of detected, enabled, and disabled devices per day.
Page 1 - Bar chart data.Page 2 - Enabled status for each device.
Recording Licenses Bar Chart - Maximum number of record licenses used per day, plus number of rejected communications due to license breaches.
Page 1 - Bar chart data.Page 2 - License alarms and warnings.
Health
Recording Activity Timeline Activity - Recording status for each telephony integration.
Page 1 - Chart data.Page 2 - License alarms and warnings.
System Uptime Timeline Activity - Server status (recorders, media servers, IVDS servers).
Page 1 - Chart data.Page 2 - Server alarms and warnings.
Recorder Alarms Notification Tables - Recorder Alarms & Warnings list.
NA
Users
Replay Licenses Bar Chart - Maximum number of replay licenses used per day, plus number of rejected replay requests due to license breaches.
Page 1 - Bar chart data.Page 2 - License alarms and warnings.
Storage
NAS Oldest Call Bar Chart - Oldest call (communication) stored on the selected NAS.
Page 1 - Bar chart data, plus min/max call age range and NAS status.Page 2 - NAS alarms and warnings.
Callstore Bar Chart - Callstore capacity (days until full). Page 1 - Bar chart data, plus data not archived (MB), and available space (MB).Page 2 - Callstore alarms and warnings.
Network Storage Line Chart - Data transfer backlog and NAS utilisation.
Page 1 - Bar chart data.Page 2 - NAS connection alarms and warnings.
Assure
Daily System Check Results Tables - Test call results for All, Passed and Failed devices.
NA

Page 3
© Red Box Recorders Limited 2017. All rights reserved.
My Red BoxReview your recording system assets.
Assets
• Review your recorders and associated assets — go to Insight > My Red Box > Assets.
• Assets: Recorders, IVDS Servers, NAS Compression Servers, Media Servers, Bloomberg Broker, Screen Monitors.
• Details: Software, CPU, Memory, Network Adapter.
• Use the carousel to highlight an asset.
Recording StatusReview devices and recording licenses.
Devices Detected vs Enabled
• Compare detected, enabled, and disabled devices (enabled/disabled for recording) — go to Insight > Recording Status > Devices Detected vs Enabled.
• Quick way to check your recordable devices.
• Graph shows your total count of recordable devices and number of enabled and disabled devices. Be aware of the graph scales in order to do an effective comparison.
• Can highlight when devices are added but not enabled. For example, a new employee with a new phone, the device is detected/registered automatically, but for security and data protection reasons will not be enabled for recording.
• Can highlight malicious removal of devices from the recording list, or administrative errors.
Page 4
© Red Box Recorders Limited 2017. All rights reserved.
Recording Licenses
• Check recording license utilisation — go to Insight > Recording Status > Recording Licenses.
• Easy method of monitoring & managing recording licenses.
• Graph shows maximum concurrent recording licenses used during each day. Rejected recorded communications due to breached license limits are also highlighted.
• If license limits are breached regularly, you should purchase additional recording licenses — contact your reseller or Red Box Recorders. Recording licenses are applied dynamically and no recorder restart is required.
HealthCritical system status information.
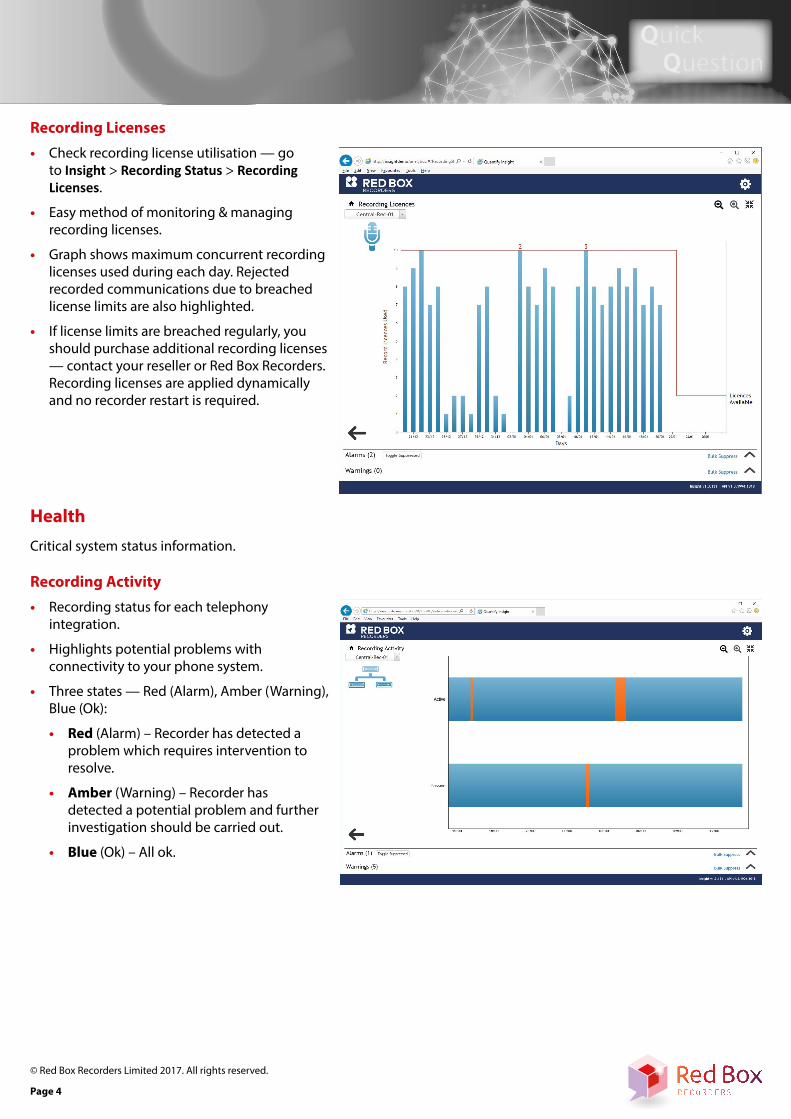
Recording Activity
• Recording status for each telephony integration.
• Highlights potential problems with connectivity to your phone system.
• Three states — Red (Alarm), Amber (Warning), Blue (Ok):
• Red (Alarm) – Recorder has detected a problem which requires intervention to resolve.
• Amber (Warning) – Recorder has detected a potential problem and further investigation should be carried out.
• Blue (Ok) – All ok.
Page 5
© Red Box Recorders Limited 2017. All rights reserved.
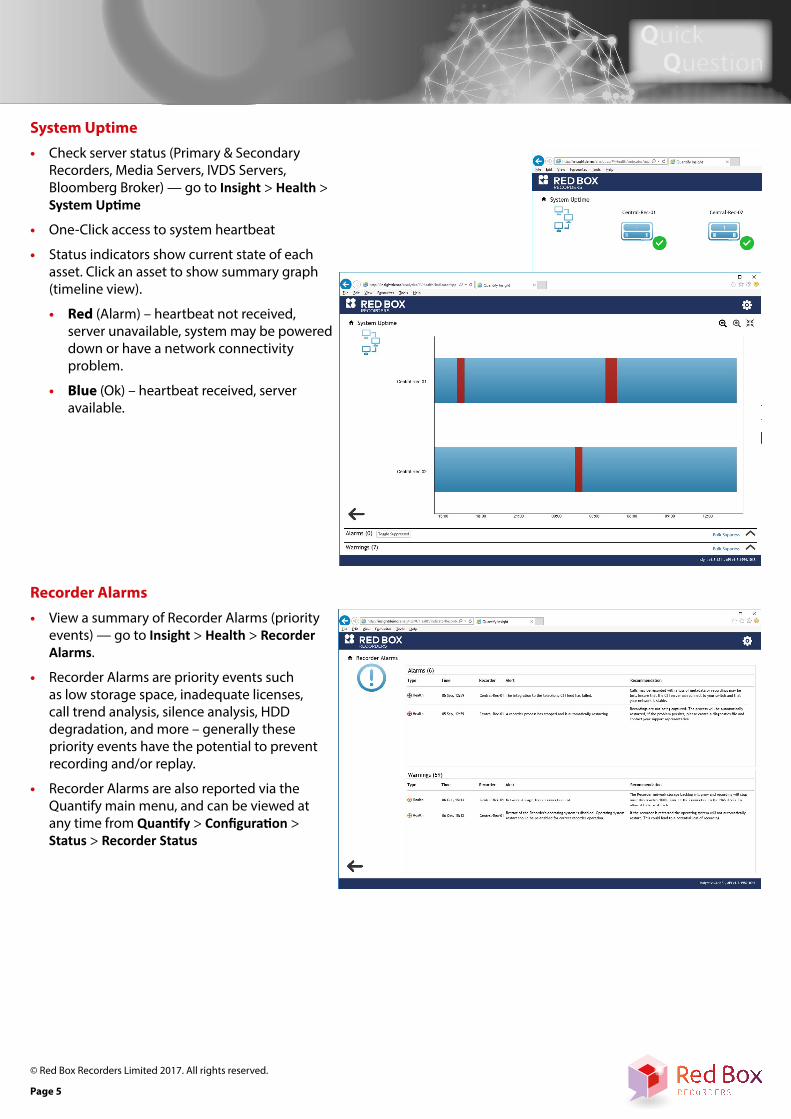
System Uptime
• Check server status (Primary & Secondary Recorders, Media Servers, IVDS Servers, Bloomberg Broker) — go to Insight > Health > System Uptime
• One-Click access to system heartbeat
• Status indicators show current state of each asset. Click an asset to show summary graph (timeline view).
• Red (Alarm) – heartbeat not received, server unavailable, system may be powered down or have a network connectivity problem.
• Blue (Ok) – heartbeat received, server available.
Recorder Alarms
• View a summary of Recorder Alarms (priority events) — go to Insight > Health > Recorder Alarms.
• Recorder Alarms are priority events such as low storage space, inadequate licenses, call trend analysis, silence analysis, HDD degradation, and more – generally these priority events have the potential to prevent recording and/or replay.
• Recorder Alarms are also reported via the Quantify main menu, and can be viewed at any time from Quantify > Configuration > Status > Recorder Status

Page 6
© Red Box Recorders Limited 2017. All rights reserved.
UsersReview user statistics and license usage.
Replay Licenses
• Monitor and manage replay licenses — go to Insight > Users > Replay Licenses
• Graph shows maximum concurrent replay licenses used during each day. Rejected replay requests due to breached license limits are also highlighted.
• You can review logged in users and allocated replay licenses from Quantify > Configuration > Status > Logged In Users — click a user to force a logout.
• If license limits are breached regularly, you should purchase additional replay licenses — contact your reseller or Red Box Recorders. Replay licenses are applied dynamically and no recorder restart is required.
StorageReview your call storage utilisation.
NAS Oldest Call
• Monitor and manage call storage and retention policy (NAS capacity – oldest call stored) — go to Insight > Storage > NAS Oldest Call
• Alarm thresholds are based on Network Storage Filter - Deletion Warning setting (Min Call Age) and NAS Maximum Call Age setting (Max Call Age).
• Alarms may mean you are at risk of not meeting your retention policy.
• For a new NAS, notifications are not generated until:
• Age of the 1st call stored in the NAS is greater than or equal to the Minimum Call Age.
• Unless calls are deleted before this happens.

Page 7
© Red Box Recorders Limited 2017. All rights reserved.
Callstore
• Monitor and manage the Callstore — go to Insight > Storage > Callstore
• Graph shows Callstore capacity – days until full.
• Thresholds set to 30 days (Warning), 10 days (Alarm).
• “Days until full” is based on historic recorded data throughput.
• For systems with just a Callstore (local hard drive), this sub-category is useful for indicating capacity in the early stages of system deployment.
• This sub-category is most useful when storage is increased with NAS or Removable Archive (RA). Here, for any recorded communications transferred to NAS or RA the space on the Callstore is then effectively regarded as “available”. Breached thresholds would then indicate an issue with NAS or Removable Archive operation, or an insufficient NAS transfer schedule (set via NAS configuration).
• Note that the HDD Degradation Recorder Alarm can also be used to monitor the Callstore physical hard disk. See “Recorder Alarms” on page 5 for sub-category details.
Network Storage
• Monitor and manage network storage — go to Insight > Storage > Network Storage
• Graph shows backlog waiting transfer (from local Callstore to NAS) and indicator bar shows capacity used (percentage).
• Can highlight issues with NAS data transfer (network issue, changed username or password, insufficient transfer schedules, etc).
• Data is aggregated across all available NAS.
• Thresholds set to 70% Warning, 90% Alarm.
• Callstore thresholds may also be breached if left unattended.

www.redboxrecorders.com
+44 (0)845 262 5005
RBRQQ1015 V1.1
All product, service, and company names are the trademarks or registered trademarks of their respective owners.© Red Box Recorders Limited 2017. All rights reserved.
Page 8
AssureAutomated device testing to assure recording.
Daily System Check
• Quantify Assure, Daily System Check is a licensed feature within Insight and provides an active tool to automatically test that all devices are being recorded, using a test call. This feature is documented separately but is summarised here.
• Test and manage devices — go to Insight > Assure > Daily System Check
• Status indicator shows status of last test — Ok (all devices passed) or Fail (one or more devices failed).
• Test results tables show test call results for All, Passed and Failed devices.
Related Documents