Int. J. Industrial and Systems Engineering, Vol. 2, No. 1, 2007 101 Copyright © 2007 Inderscience Enterprises Ltd. Quick-response decision-making in the food processing industry A. Mousavi*, Muna Hamdi and M. Sarhadi School of Engineering and Design Brunel University Uxbridge, Middlesex, UB8 3PH, UK E-mail: [email protected] E-mail: [email protected] E-mail: [email protected] *Corresponding author Abstract: This paper proposes a quick-response decision modeller to help managers deal with the demands of a volatile food production environment. It argues the need for a focused, real-time, high-quality information apparatus to support production managers on the shopfloor. This is achieved by providing specified definitions for the Key Performance Factors (KPF) within the industry. A cost/benefit analysis tool will be presented that reports on system performance. The article presented focuses on improving the quality of decisions made during food production process with the aim of realising the real operational costs, thus improving profit margins. By creating the proper information environment and equipping the system with a suitable prediction platform, stressed managers can be advised on various action plans and the consequences for each decision. This is to be achieved, firstly, by creating a comprehensive information environment for precise measurement of the state of the system in real-time and, secondly, by providing an accurate prediction platform for improved decision-making. Keywords: production management; Key Performance Factors (KPF); food industry; real-time data; decision support; cost analysis. Reference to this paper should be made as follows: Mousavi, A., Hamdi, M. and Sarhadi, M. (2007) ‘Quick-response decision-making in the food processing industry’, Int. J. Industrial and Systems Engineering, Vol. 2, No. 1, pp.101–124. Biographical notes: Alireza Mousavi is a Lecturer of Systems Engineering and Mobile Computing at the School of Engineering and Design, Brunel University. His research interests are in production planning, simulation and modelling, operational research, computing, and supervisory control and data acquisition systems. The research group (SERG) that he leads is part of the Manufacturing and Design Research Centre at Brunel University. For the last nine years, he has been involved in research and development of projects related to manufacturing. His research team also studies the application of Manufacturing Systems tools and techniques in other sectors such as Transport Planning and Healthcare in the UK. He has been involved in a number of funded research projects from Engineering and Physical Sciences Research Council, Department for Environment Food and Rural Affairs, WestFocus, and other industrial sources. A brief description of his team’s current and previous projects can be viewed at http://www.brunel.ac.uk/~emstaam/.

Welcome message from author
This document is posted to help you gain knowledge. Please leave a comment to let me know what you think about it! Share it to your friends and learn new things together.
Transcript
Int. J. Industrial and Systems Engineering, Vol. 2, No. 1, 2007 101
Copyright © 2007 Inderscience Enterprises Ltd.
Quick-response decision-making in the food processing industry
A. Mousavi*, Muna Hamdi and M. Sarhadi School of Engineering and Design Brunel University Uxbridge, Middlesex, UB8 3PH, UK E-mail: [email protected] E-mail: [email protected] E-mail: [email protected] *Corresponding author
Abstract: This paper proposes a quick-response decision modeller to help managers deal with the demands of a volatile food production environment. It argues the need for a focused, real-time, high-quality information apparatus to support production managers on the shopfloor. This is achieved by providing specified definitions for the Key Performance Factors (KPF) within the industry. A cost/benefit analysis tool will be presented that reports on system performance.
The article presented focuses on improving the quality of decisions made during food production process with the aim of realising the real operational costs, thus improving profit margins. By creating the proper information environment and equipping the system with a suitable prediction platform, stressed managers can be advised on various action plans and the consequences for each decision. This is to be achieved, firstly, by creating a comprehensive information environment for precise measurement of the state of the system in real-time and, secondly, by providing an accurate prediction platform for improved decision-making.
Keywords: production management; Key Performance Factors (KPF); food industry; real-time data; decision support; cost analysis.
Reference to this paper should be made as follows: Mousavi, A., Hamdi, M. and Sarhadi, M. (2007) ‘Quick-response decision-making in the food processing industry’, Int. J. Industrial and Systems Engineering, Vol. 2, No. 1, pp.101–124.
Biographical notes: Alireza Mousavi is a Lecturer of Systems Engineering and Mobile Computing at the School of Engineering and Design, Brunel University. His research interests are in production planning, simulation and modelling, operational research, computing, and supervisory control and data acquisition systems. The research group (SERG) that he leads is part of the Manufacturing and Design Research Centre at Brunel University. For the last nine years, he has been involved in research and development of projects related to manufacturing. His research team also studies the application of Manufacturing Systems tools and techniques in other sectors such as Transport Planning and Healthcare in the UK. He has been involved in a number of funded research projects from Engineering and Physical Sciences Research Council, Department for Environment Food and Rural Affairs, WestFocus, and other industrial sources. A brief description of his team’s current and previous projects can be viewed at http://www.brunel.ac.uk/~emstaam/.
102 A. Mousavi, M. Hamdi and M. Sarhadi
Muna Hamdi has over 19 years experience as a Computer and Systems Engineer, working on various projects from embedded design, management, teaching, research to consultancy. Her current interests include knowledge management and decision support systems, machine learning and behaviour analysis. Her PhD project, ‘Intelligent Real-Time Lift Scheduling System’ (Loughborough University, E&E Engineering Department, 1994–1999), was an industrial project that assessed new scheduling approaches and intelligent monitoring techniques in order to aid the design of new elevator systems and to improve the performance of existing installations. She joined Nortel Network (1997–1999), analysing voice traffic over Narrowband ATM networks to optimise the performance of those networks by providing early detection and prediction, and by applying methods of routing and congestion control. She was a Senior Researcher within the AI Planning group at Durham University in the field of Domain Independent Planning and Scheduling (2000–2002).
Mansoor Sarhadi is the Vice-Principal of Brunel University. He is a Professor in Engineering and a member of IEE. His research addresses electronics and manufacturing systems, industrial automation and automated manufacture of aero-structures and aircrafts. Professor Sarhadi has been a member of the EPSRC College of Referees, EPS Committee of the BBSRC and the IEE Accreditation Panel. He has held major consultancy positions for aerospace, power generation, manufacturing and financial services industry. Currently, he is a member of the Technical Opportunities Panel of the EPSRC and the Programme Management Committee of DEFRA’s Link Programme on Advanced Food Manufacturing.
1 Introduction
The scope of this paper is based on requirements defined by our industrial partners commissioned by the Department of Environment, Food and Rural Affairs (DEFRA) in the UK (AFM218BR, 2005). The aim is to conduct research into the latest challenges of food manufacturing sector in the UK, and evaluate the feasibility of a decision aid tool to help them address some of their needs. The concerns for food manufacturers are to reduce their cost base and produce high quality products on time, and at economic cost. The main issues for food manufacturers are:
1 dealing with wastages and yield variations
2 prevention of unwanted and unexpected stoppages
3 reduction in number of production changeovers and system set-ups
4 sustainable improvements in quality
5 improvements in intelligence on shopfloor activities.
To date, many have spent a great deal of time and energy bemoaning the ruthlessness of supermarket chains. The supermarkets demand consistently high(er) quality at lower cost or, at best, the same price. For example, product traceability seems to be highly desirable for supermarket chains and their customers (Migdal, 2004), however, they are less willing to provide any financial incentive to the manufacturers for this often
Quick-response decision-making in the food processing industry 103
complicated and costly practice (Mousavi et al., 2005). The immense pressure is on food manufacturers and producers to yet again reduce their operational costs to remain competitive in a market pressed with continuous price competitions.
A number of companies have invested heavily in ERP systems only to find that benefits fall short of expectations, often because these propriety systems can only be truly effective when fed with accurate, real-time, factory floor line/product performance information. Where this is slow or collected manually, ERP systems cannot be expected to encourage optimum performance (Roberts, 2005).
The more advanced manufacturers have invested in real-time factory information management systems or supervisory control and data acquisition systems, and have improved the quantity and quality of data collection from the shopfloor. But even these users can miss valuable opportunities because these systems do not provide clear-cut information. This can be due to information overload and lack of competent/qualified personnel to deal or even prioritise problems. So many companies, faced with supermarket pressure on the one hand and shareholders demands on the other, have taken the instant and obvious ‘cost saving’ route of reducing the head count. Even during the past ten years, the workload upon already busy managers has increased by more than 50% (Green, 2005). This reduction in personnel merely increases the need for automated information and decision aids.
Production managers are challenged by the difficult task of incorporating all related information in a decision-making process while managing resources and solving various problems that involve several departments with different policies. According to our study, which targeted a number of literature review, interviews with industry experts and manufacturers and in consultation with process monitoring and information management companies, there is no quick response decision-making tool in the industry to help production managers evaluate the gains and losses behind each option available to them (Hamdi et al., 2005). For example, in a typical day, the control system alerts the line manager of a large variance in filling line (yield). This variance further down is causing rejects (waste); however, she/he is under pressure to meet orders from a highly valued customer (customer satisfaction). For simplicity reasons, lets assume two scenarios. The first scenario is to continue with the current state and try to meet demand (option 1) and risk damage to the equipment, increased wastage, or, at best, lower yield. The second scenario is to stop the line, sort the filling problem and continue with the process. Traditionally, these types of decisions are made based on line managers’ experience and intuition. Normally, these decisions are based on expediency and turn out to be the right ones and occasionally, they may go wrong and cause losses for the system.
It seems that a platform that can incorporate the information based on a cost/benefit analysis format to help the manager make such split second decisions is highly desirable. The aim of the paper is to put forward a framework that may achieve this. We will be pursuing the following set of objectives:
• To provide an insight to the challenges production managers encounter in a typical food manufacturing environment.
• To define four Key Performance Factors (KPF), which contribute the most to high labour and production process overheads. Customer Satisfaction, Resource Utilisation, Waste, and Yield are the KPF proposed in this work to be the most influential. These factors are given specific definitions to prevent redundant calculations.
104 A. Mousavi, M. Hamdi and M. Sarhadi
• To provide a cost modeller by ‘estimating analogy’ (Fabrycky et al., 1997) as a common base for analysis and comparison of system performance. It will then facilitate evaluation of decision options with respect to the four KPF.
• To offer an overview of the information and data acquisition construct that will facilitate real-time system monitoring with minimal post interpretation.
The decision-making tool aid discussed here, argues for a combination of cost models to turn systems state information into cost implications, thus facilitating recommendations for action options that minimise cost (Operational Research Techniques). It will also argue the use of simulation techniques for fast-forward playing out of What if scenarios to help line managers to be proactive and thereby, reduce the need for more typically reactive ‘fire fighting’.
In the following section, we discuss the proposed definition of KPF. Section 3 provides an overview of the most recent academic and industrial advancements in food manufacturing and shopfloor management. We discuss the technical requirements of the proposed framework in Section 4.
2 Production management issues and definition of key performance factors
In a number of interviews conducted with production managers of food manufacturing companies in the UK and according to latest literature, we realised that the major issues facing the food manufacturers are:
2.1 Product traceability and shelf life for customer satisfaction
In a recent survey, consumers rated product freshness and traceability as the most important factor for them (Migdal, 2004). Depending on product ingredients, product shelf life can be determined. Normally, these ingredients have a short life span. Where an MRP database is available, e.g., SAP®, product identification codes are for storage and traceability purposes. In cases where electronic systems are not installed, traditional paper records maintain information about product shelf life and traceability.
In addition to product information, it is important to keep accurate information about customers. Different customers may require different product settings and packaging instructions. For example, a Bacon, Lettuce and Tomato (BLT) sandwich prepared for Marks & Spencer may be different from the one that is prepared for Safeway Morrison’s, especially that some customers insist upon using their own approved suppliers and may request more stringent checks on product quality.
One of the KPF defined in this project was customer satisfaction. For customer satisfaction evaluation, the CORE methodology is proposed. The CORE methodology maps customer satisfaction based on the difference between the expected value of service to the actual value of service (Mousavi et al., 2001; Satistica1). The closer the actual value is to the expected value, the higher customer satisfaction will be. For simplicity, we proposed product freshness as the only attribute for customer satisfaction evaluation. This KPF implicitly covers product traceability.
Quick-response decision-making in the food processing industry 105
Product freshness was defined as the shelf life of the product. Longer product shelf life shows that the ingredients have had shorter stock time and the product has been produced more recently. From customers’ point of view, identical products with higher level of freshness will be more desirable. Using CORE methodology, we can acquire expected values of freshness from customers and obtain the actual value of freshness from the shopfloor information management system. Consequently, customer satisfaction can be calculated.
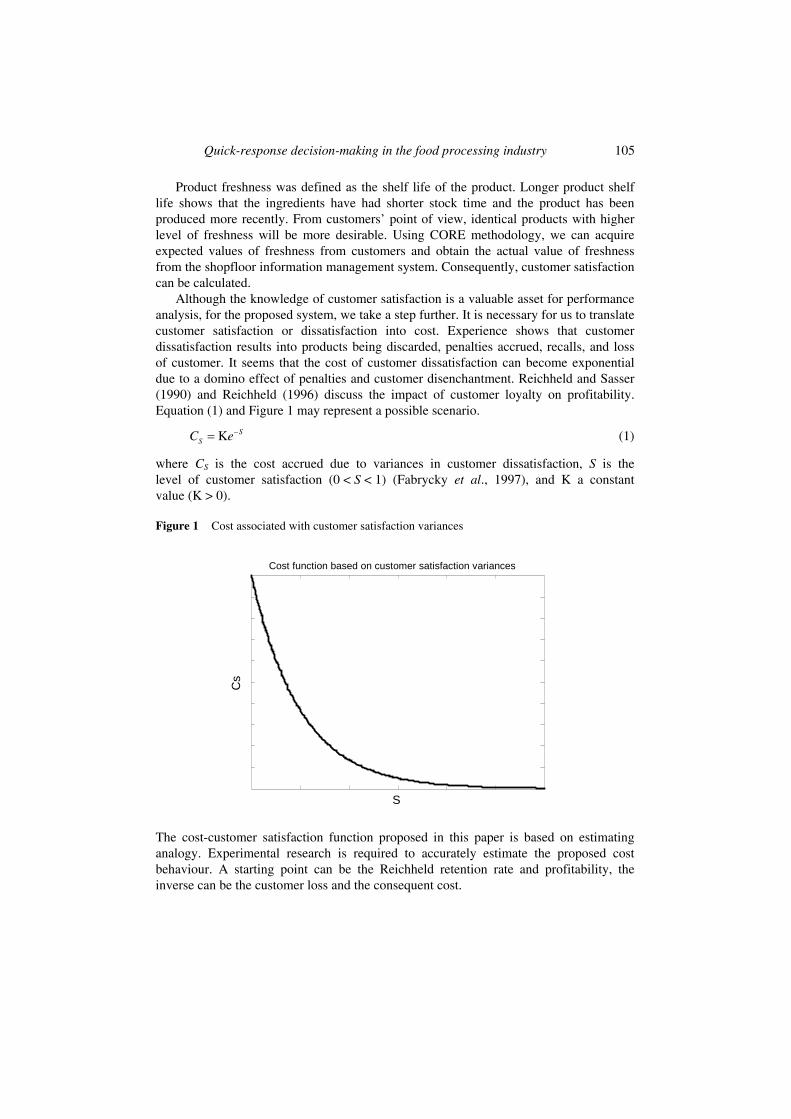
Although the knowledge of customer satisfaction is a valuable asset for performance analysis, for the proposed system, we take a step further. It is necessary for us to translate customer satisfaction or dissatisfaction into cost. Experience shows that customer dissatisfaction results into products being discarded, penalties accrued, recalls, and loss of customer. It seems that the cost of customer dissatisfaction can become exponential due to a domino effect of penalties and customer disenchantment. Reichheld and Sasser (1990) and Reichheld (1996) discuss the impact of customer loyalty on profitability. Equation (1) and Figure 1 may represent a possible scenario.
K SSC e−= (1)
where CS is the cost accrued due to variances in customer dissatisfaction, S is the level of customer satisfaction (0 < S < 1) (Fabrycky et al., 1997), and K a constant value (K > 0).
Figure 1 Cost associated with customer satisfaction variances
The cost-customer satisfaction function proposed in this paper is based on estimating analogy. Experimental research is required to accurately estimate the proposed cost behaviour. A starting point can be the Reichheld retention rate and profitability, the inverse can be the customer loss and the consequent cost.
S
Cs
Cost function based on customer satisfaction variances
106 A. Mousavi, M. Hamdi and M. Sarhadi
Our research shows that the key indicators that contribute to customer satisfaction in the food industry are product market shelf life and traceability (ingredients and origin). Any source of customer dissatisfaction in this regard implies penalties, product recalls and, in severe cases, loss of business altogether.
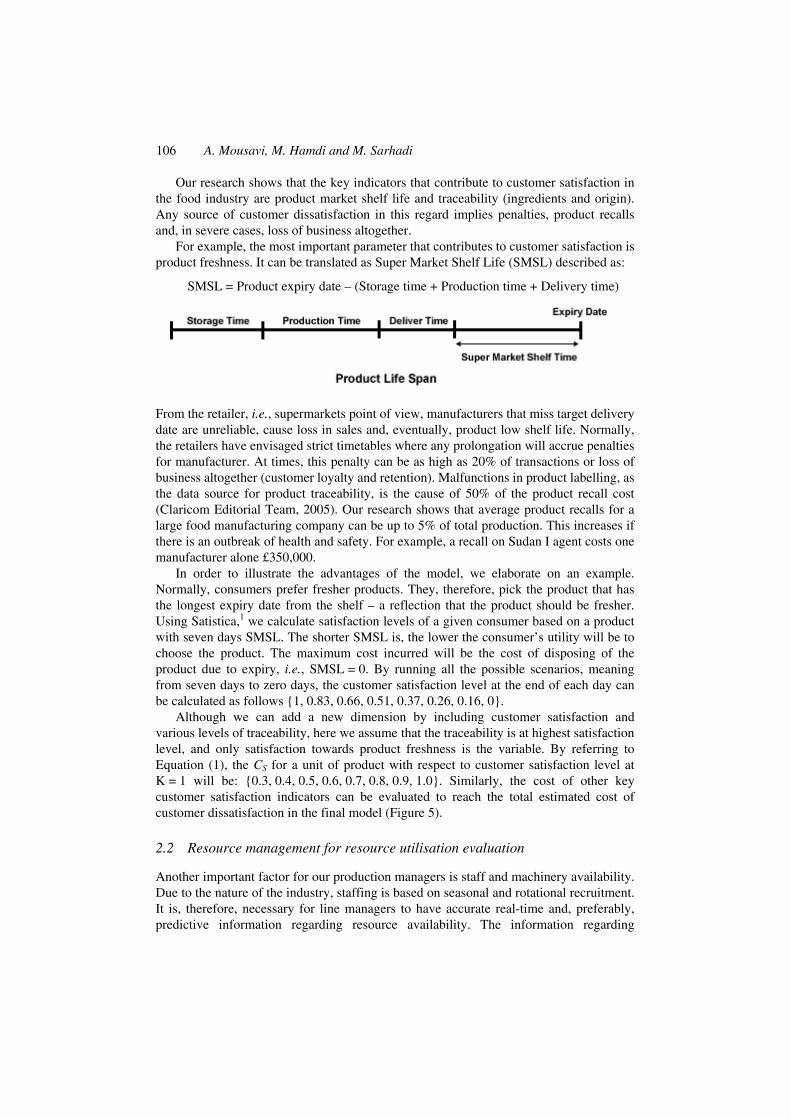
For example, the most important parameter that contributes to customer satisfaction is product freshness. It can be translated as Super Market Shelf Life (SMSL) described as:
SMSL = Product expiry date – (Storage time + Production time + Delivery time)
From the retailer, i.e., supermarkets point of view, manufacturers that miss target delivery date are unreliable, cause loss in sales and, eventually, product low shelf life. Normally, the retailers have envisaged strict timetables where any prolongation will accrue penalties for manufacturer. At times, this penalty can be as high as 20% of transactions or loss of business altogether (customer loyalty and retention). Malfunctions in product labelling, as the data source for product traceability, is the cause of 50% of the product recall cost (Claricom Editorial Team, 2005). Our research shows that average product recalls for a large food manufacturing company can be up to 5% of total production. This increases if there is an outbreak of health and safety. For example, a recall on Sudan I agent costs one manufacturer alone £350,000.
In order to illustrate the advantages of the model, we elaborate on an example. Normally, consumers prefer fresher products. They, therefore, pick the product that has the longest expiry date from the shelf – a reflection that the product should be fresher. Using Satistica,1 we calculate satisfaction levels of a given consumer based on a product with seven days SMSL. The shorter SMSL is, the lower the consumer’s utility will be to choose the product. The maximum cost incurred will be the cost of disposing of the product due to expiry, i.e., SMSL = 0. By running all the possible scenarios, meaning from seven days to zero days, the customer satisfaction level at the end of each day can be calculated as follows {1, 0.83, 0.66, 0.51, 0.37, 0.26, 0.16, 0}.
Although we can add a new dimension by including customer satisfaction and various levels of traceability, here we assume that the traceability is at highest satisfaction level, and only satisfaction towards product freshness is the variable. By referring to Equation (1), the CS for a unit of product with respect to customer satisfaction level at K = 1 will be: {0.3, 0.4, 0.5, 0.6, 0.7, 0.8, 0.9, 1.0}. Similarly, the cost of other key customer satisfaction indicators can be evaluated to reach the total estimated cost of customer dissatisfaction in the final model (Figure 5).
2.2 Resource management for resource utilisation evaluation
Another important factor for our production managers is staff and machinery availability. Due to the nature of the industry, staffing is based on seasonal and rotational recruitment. It is, therefore, necessary for line managers to have accurate real-time and, preferably, predictive information regarding resource availability. The information regarding
Quick-response decision-making in the food processing industry 107
resource (human and machinery) availability is needed to provide the metrics for resource utilisation. Resource utilisation can be described as, the proportion of the time a resource is busy to the time it is available (Kelton et al., 2004).
( )
( )
0 1
resource busyU
resource available
U
=
≤ ≤
(2)
Time and motion study, line balancing, maintenance and capacity planning will provide sufficient information for extracting resource utilisation figures (Barnes, 1980). Discrete event simulation techniques and existing software such Arena® (Kelton et al., 2004), Witness® (Markt and Mayer, 1997) and Simul82 can be helpful tools for accurate resource utilisation evaluation.
The cost of under-utilised or over-utilised resources is one of the major concerns in the food industry. Low profit margins have forced manufacturers to implement complex recruitment policies. These policies include rotational and seasonal recruitments. Although such policies may seem to save wage costs, they often lead to loss of skilled staff, low morale, longer production life cycle (Mousavi et al., 2005), and occasionally overwhelmed staff. This is especially evident in the more labour intensive section of the industry. In automated areas, strict planning, maintenance and machine set up times are required during changeovers to optimise resource utilisation. Balakrishnan et al., (20001b; 2001c) present a simple framework to classify capacity resources by their intrinsic characteristics. Although the research only considers opportunity cost of an idle resource, it could be a viable starting point. The cost of overwhelmed resources is more difficult to estimate and experimental research is required to accurately estimate the costs.
In order to estimate the cost for resource utilisation (CU), one can assume that when the resource utilisation is low, the cost is higher, the more the system resources are utilised, the more cost is reduced; and finally when the resource utilisation exceeds a threshold, the cost increases again. For example, consider labour utilisation, if resources are ‘available’ and ‘idle’ 0U → , the system is running with no production at ever increasing cost. On the other extreme, if resources are over-utilised (overwhelmed)
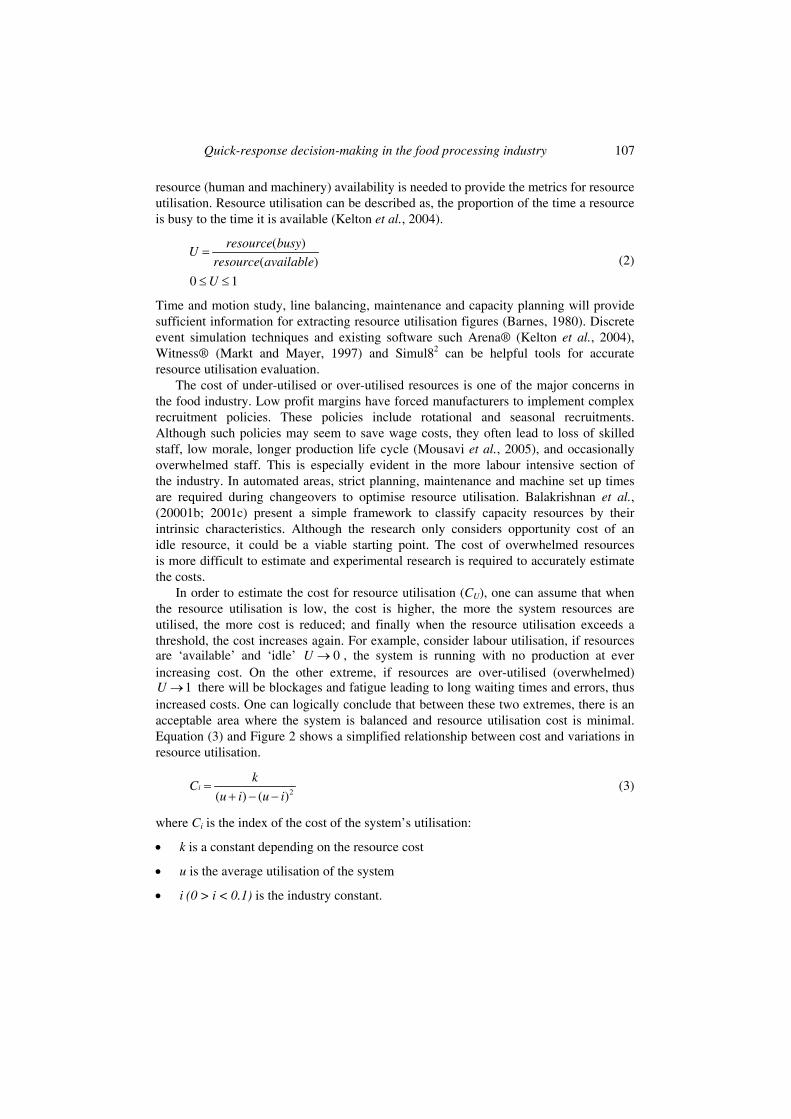
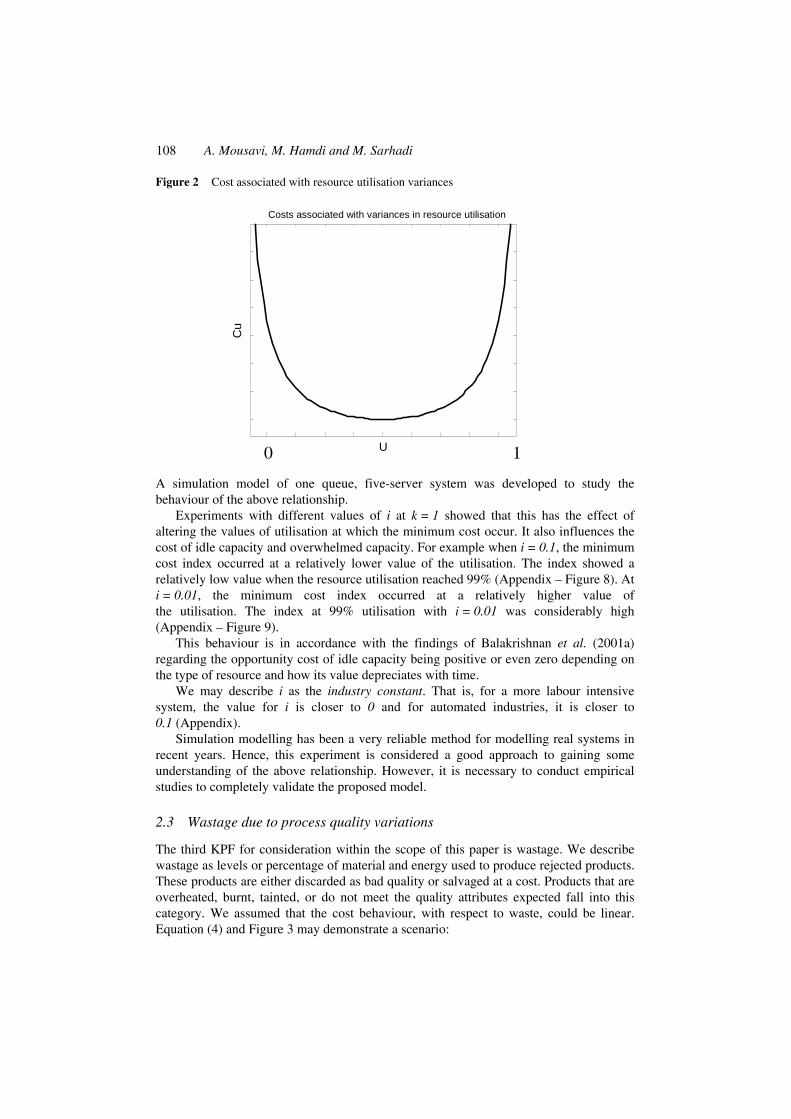
1U → there will be blockages and fatigue leading to long waiting times and errors, thus increased costs. One can logically conclude that between these two extremes, there is an acceptable area where the system is balanced and resource utilisation cost is minimal. Equation (3) and Figure 2 shows a simplified relationship between cost and variations in resource utilisation.
2( ) ( )i
kC
u i u i=
+ − − (3)
where Ci is the index of the cost of the system’s utilisation:
• k is a constant depending on the resource cost
• u is the average utilisation of the system
• i (0 > i < 0.1) is the industry constant.
108 A. Mousavi, M. Hamdi and M. Sarhadi
Figure 2 Cost associated with resource utilisation variances
A simulation model of one queue, five-server system was developed to study the behaviour of the above relationship.
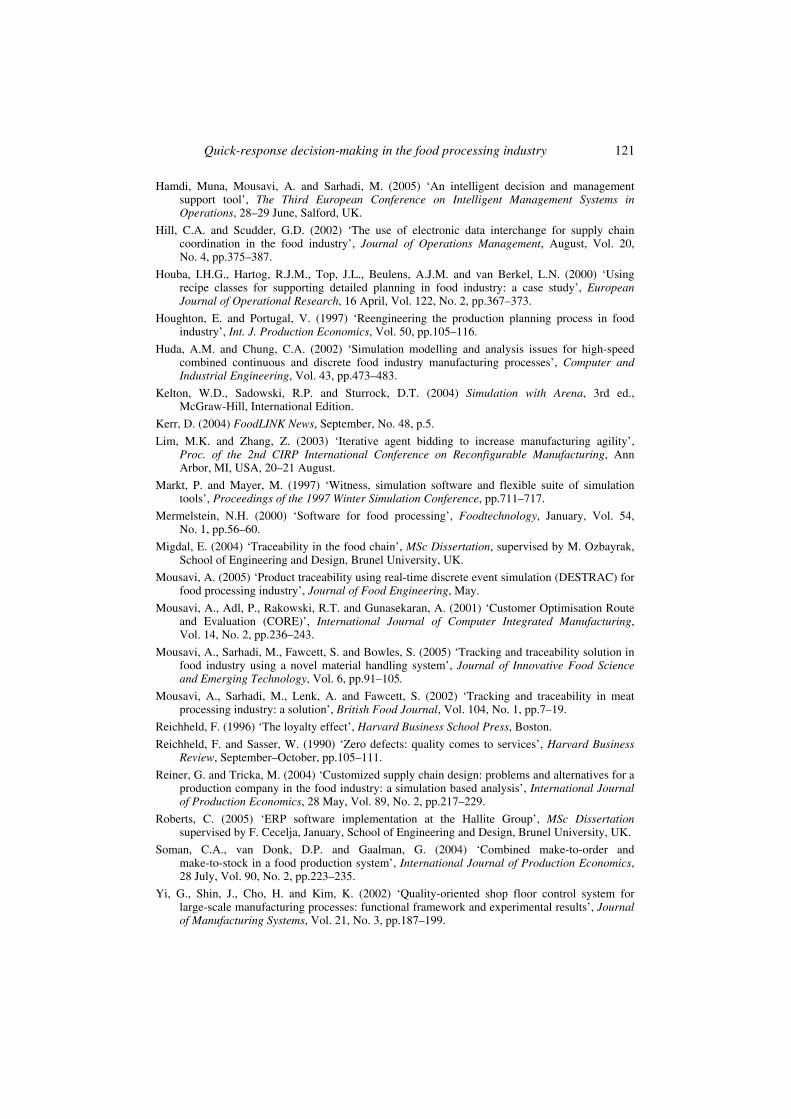
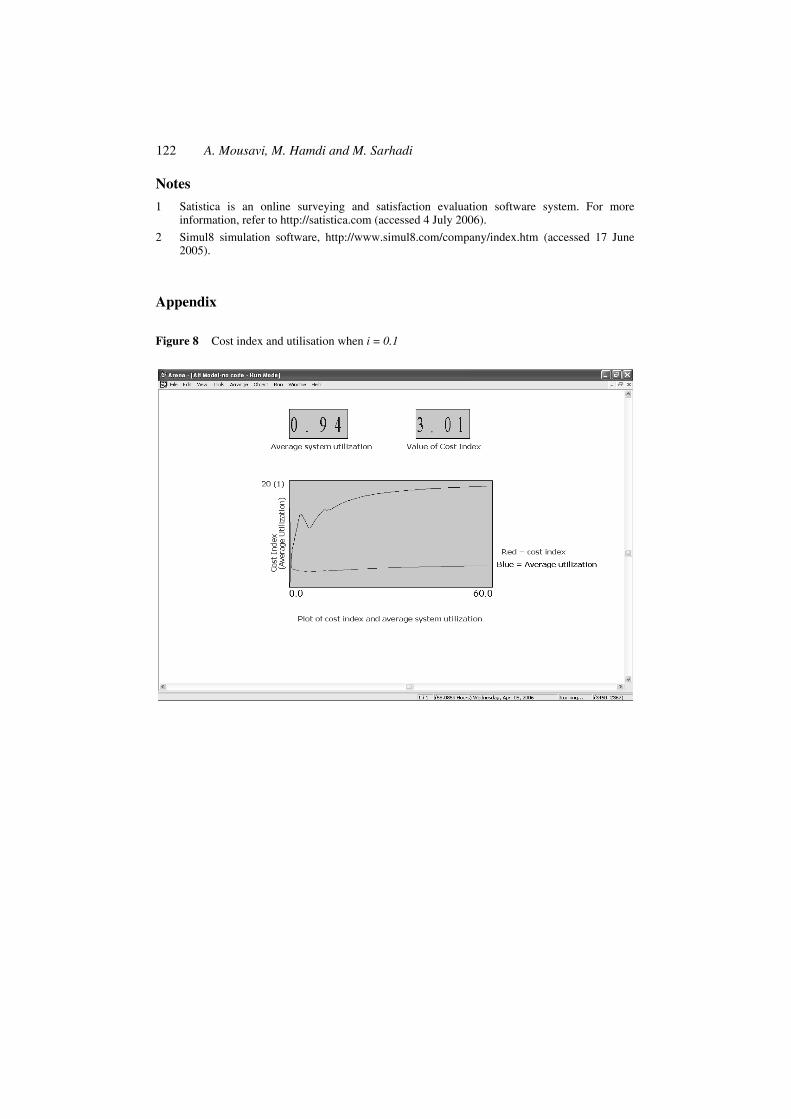
Experiments with different values of i at k = 1 showed that this has the effect of altering the values of utilisation at which the minimum cost occur. It also influences the cost of idle capacity and overwhelmed capacity. For example when i = 0.1, the minimum cost index occurred at a relatively lower value of the utilisation. The index showed a relatively low value when the resource utilisation reached 99% (Appendix – Figure 8). At i = 0.01, the minimum cost index occurred at a relatively higher value of the utilisation. The index at 99% utilisation with i = 0.01 was considerably high (Appendix – Figure 9).
This behaviour is in accordance with the findings of Balakrishnan et al. (2001a) regarding the opportunity cost of idle capacity being positive or even zero depending on the type of resource and how its value depreciates with time.
We may describe i as the industry constant. That is, for a more labour intensive system, the value for i is closer to 0 and for automated industries, it is closer to 0.1 (Appendix).
Simulation modelling has been a very reliable method for modelling real systems in recent years. Hence, this experiment is considered a good approach to gaining some understanding of the above relationship. However, it is necessary to conduct empirical studies to completely validate the proposed model.
2.3 Wastage due to process quality variations
The third KPF for consideration within the scope of this paper is wastage. We describe wastage as levels or percentage of material and energy used to produce rejected products. These products are either discarded as bad quality or salvaged at a cost. Products that are overheated, burnt, tainted, or do not meet the quality attributes expected fall into this category. We assumed that the cost behaviour, with respect to waste, could be linear. Equation (4) and Figure 3 may demonstrate a scenario:
U
Cu
Costs associated with variances in resource utilisation
10
Quick-response decision-making in the food processing industry 109
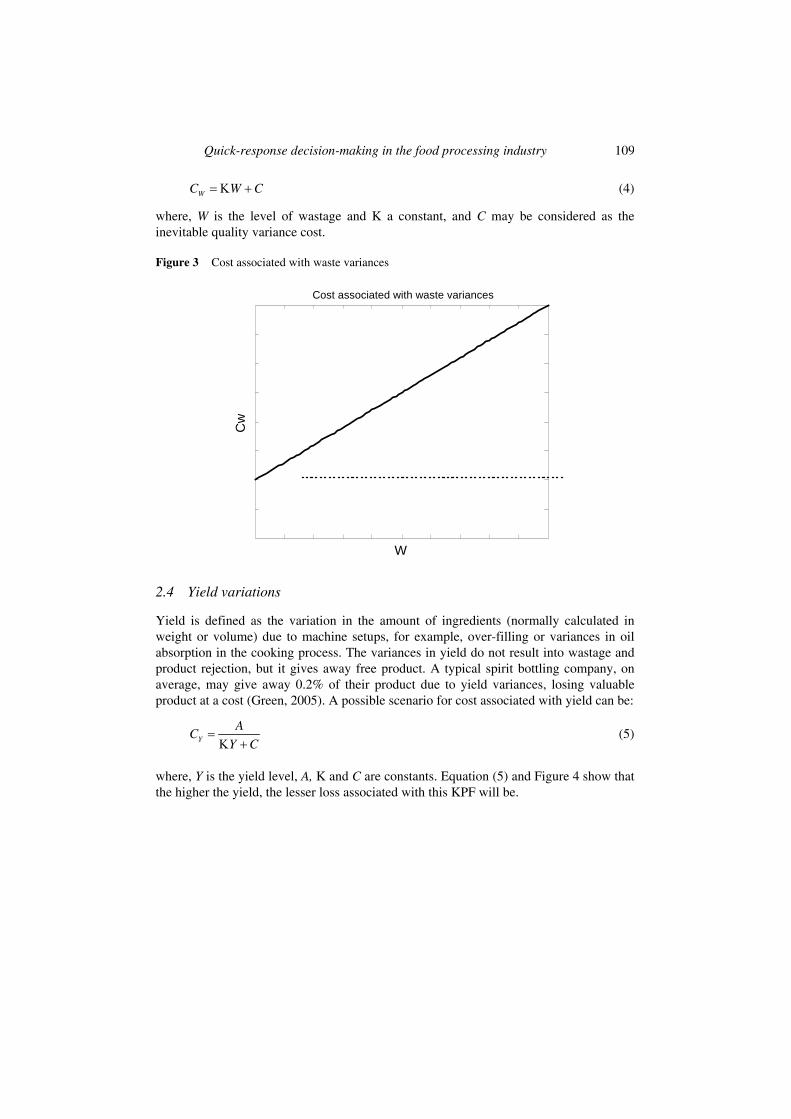
WC W C= Κ + (4)
where, W is the level of wastage and K a constant, and C may be considered as the inevitable quality variance cost.
Figure 3 Cost associated with waste variances
2.4 Yield variations
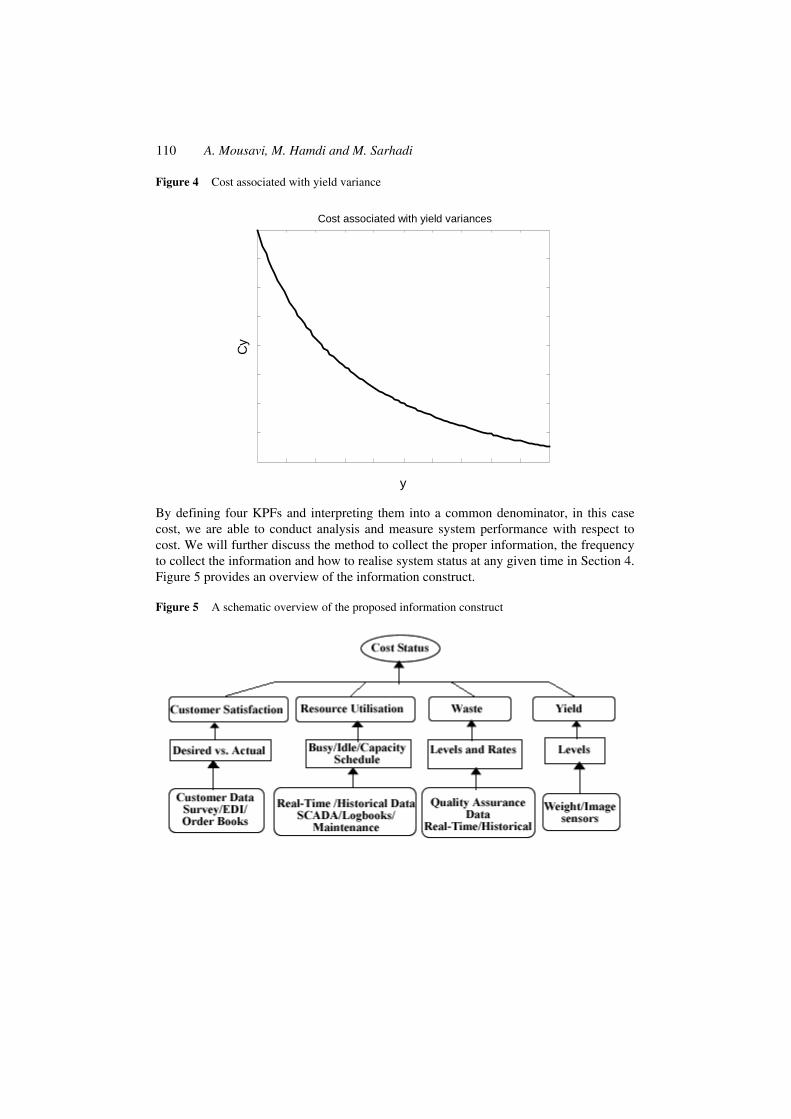
Yield is defined as the variation in the amount of ingredients (normally calculated in weight or volume) due to machine setups, for example, over-filling or variances in oil absorption in the cooking process. The variances in yield do not result into wastage and product rejection, but it gives away free product. A typical spirit bottling company, on average, may give away 0.2% of their product due to yield variances, losing valuable product at a cost (Green, 2005). A possible scenario for cost associated with yield can be:
Y
AC
Y C=
Κ + (5)
where, Y is the yield level, A, K and C are constants. Equation (5) and Figure 4 show that the higher the yield, the lesser loss associated with this KPF will be.
Cost associated with waste variances
W
Cw
110 A. Mousavi, M. Hamdi and M. Sarhadi
Figure 4 Cost associated with yield variance
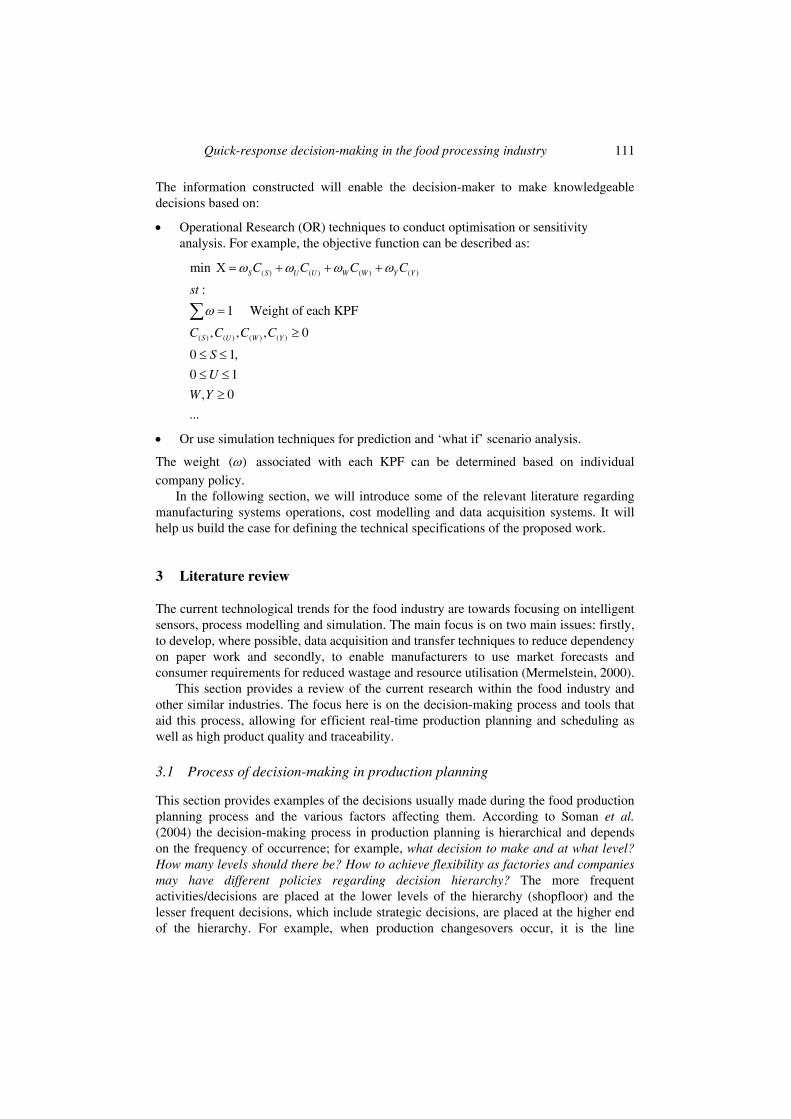
By defining four KPFs and interpreting them into a common denominator, in this case cost, we are able to conduct analysis and measure system performance with respect to cost. We will further discuss the method to collect the proper information, the frequency to collect the information and how to realise system status at any given time in Section 4. Figure 5 provides an overview of the information construct.
Figure 5 A schematic overview of the proposed information construct
Cost associated with yield variances
y
Cy
Quick-response decision-making in the food processing industry 111
The information constructed will enable the decision-maker to make knowledgeable decisions based on:
• Operational Research (OR) techniques to conduct optimisation or sensitivity analysis. For example, the objective function can be described as:
( ) ( ) ( ) ( )
( ) ( ) ( ) ( )
min
:
1 Weight of each KPF
, , , 0
0 1,
0 1
, 0
...
S S U U W W Y Y
S U W Y
C C C C
st
C C C C
S
U
W Y
ω ω ω ω
ω
Χ = + + +
=
≥
≤ ≤≤ ≤
≥
∑
• Or use simulation techniques for prediction and ‘what if’ scenario analysis.
The weight ( )ω associated with each KPF can be determined based on individual company policy.
In the following section, we will introduce some of the relevant literature regarding manufacturing systems operations, cost modelling and data acquisition systems. It will help us build the case for defining the technical specifications of the proposed work.
3 Literature review
The current technological trends for the food industry are towards focusing on intelligent sensors, process modelling and simulation. The main focus is on two main issues: firstly, to develop, where possible, data acquisition and transfer techniques to reduce dependency on paper work and secondly, to enable manufacturers to use market forecasts and consumer requirements for reduced wastage and resource utilisation (Mermelstein, 2000).
This section provides a review of the current research within the food industry and other similar industries. The focus here is on the decision-making process and tools that aid this process, allowing for efficient real-time production planning and scheduling as well as high product quality and traceability.
3.1 Process of decision-making in production planning
This section provides examples of the decisions usually made during the food production planning process and the various factors affecting them. According to Soman et al. (2004) the decision-making process in production planning is hierarchical and depends on the frequency of occurrence; for example, what decision to make and at what level? How many levels should there be? How to achieve flexibility as factories and companies may have different policies regarding decision hierarchy? The more frequent activities/decisions are placed at the lower levels of the hierarchy (shopfloor) and the lesser frequent decisions, which include strategic decisions, are placed at the higher end of the hierarchy. For example, when production changesovers occur, it is the line
112 A. Mousavi, M. Hamdi and M. Sarhadi
manager who would decide the assignment of resources and material. It is the duty of the line manager to ensure the availability and smooth handover during the production process. The duty of higher management, i.e., human resources is only to ensure sufficient workforce not the details of how this workforce is utilised.
Planning decisions are taken according to what the production and inventory policy are aiming for, products are divided into two types, products that are Made-to-Stock (MTS) and the ones that are Made-to-Order (MTO). Higher MTO production levels mean less inventory and more set-up times leading to increased production lead-time. To avoid some of the issues with MTO, MTS is proposed. MTS items have limited shelf life in food industry and normally high inventory costs. Hence, if the production process is efficient, the reliance on MTS needs to be kept to a minimum.
Soman et al. (2004) conclude firstly, that customers tend to have fluctuating requirements causing rapid change of market trends. Secondly, the food industry is mainly moving towards MTO products, and highlights that the consumers prefer fresh products with short response time. If an order is put forward on a specific day and consequently more the next day, customers expect a longer shelf life for these products than the one they received the day before. In a separate research conducted at Brunel University, consumers were asked to rate the importance they give to food products. ‘Freshness of product’ was ranked the highest amongst others (Migdal, 2004).
Hence, it is necessary to have an efficient process planning to meet demands and maximise profit. To enable this and to cope with the pressures marked by the market characteristics, a planning or a production manager needs to make the right decision fast. To rely solely on historical data and forecasting techniques is no longer enough to achieve higher product quality and maximum profit.
3.2 Information extraction, classification and representation
Any decision-making process needs to incorporate a number of factors and their associated data, where some of these factors may be conflicting. Moreover, the effect over time would mean that sales would rise with quality and hence, increase profit. It is, therefore, important to identify suitable algorithms that can deal with a number of highly correlated variables as well as the ability to account for deterministic and random behaviour of a volatile manufacturing environment.
Data extraction and representation is crucial for the improved and accelerated decision-making process (Houba et al., 2000). Cho et al. (2003) explain that intelligent algorithms such as, Bayesian and Neural Networks, are now preferred as a data fusion technique to identify the underlying relationships between common and unique attributes. They proposed the method for the analysis of customers’ behaviour when forecasting market demands and customer profile. They also claim that AI-based approaches generally outperform the correlation approach, improve predictability, and the relative performance of AI-based approaches tends to improve as the amount of missing data increases.
Similar methods can be used to predict behavioural patterns of non-deterministic key performance parameters such as rush orders. When focusing on shopfloor within the food industry, most parameters under control are deterministic. Once the behaviour of the parameters is identified, it will be possible to find the best method to control and predict them.
Quick-response decision-making in the food processing industry 113
3.3 Scheduling and process monitoring
Recognising that most food production managers would end up using there own experience and intuition when it comes to producing a real-time schedule, some degree of interaction is now considered as an important part of the decision and optimisation process. This requires real-time interface with process monitoring equipment to generate feedback action plans for the scheduler.
Houba et al. (2000) present a scheduler that allows the production operator to specify the number of available resources and the duration of the production process. The work has some limitations, for example, the scheduler should consider constraints on the parameters specified by the operators (e.g., min/max number of resource) and advice back, with the best process duration or number of resources that should be used. Although several product recipes may share one activity, resources and ingredients, it is not clear if the scheduler would allow these products to be processed in parallel.
Gargouri et al. (2002) introduce another example of real-time collaborative decision-making and scheduling system, where the operator could influence the decision process by taking a particular suggested action. Their work considered prediction of unforeseen events, stock availability, quantity and expiry date, end product and intermediate product storage cost, ingredients and recipe variety and minimising the cost overhead resulting from expired products. The proposed method used static scheduling and pre-planning by first taking into account ingredient types (e.g., flavour and concentration) and cleaning time (change over time). For real-time scheduling, multiple criteria were used to satisfy and control a number of decision steps according to the priority of the criteria or the optimisation objective. The operator is guided through decision steps and balancing actions are taken accordingly. Gargouri et al. (2002) emphasise on the importance of production monitoring to ensure quality and reduce wastage. The authors support their work by providing case study fermentation and maturation process. The authors could have used simulation techniques to guide the operator through evaluations of each decision. Also, it was not clear from the literature if ingredient and product quality were considered.
Data updates and preliminary processing should become as automated as possible. Once key parameters measurements are taken, process simulation can then be used to predict future performance and evaluate alternative schedules, thereby responding to varying conditions in time.
3.4 Quality, traceability and process optimisation
As well as optimising and controlling production process, other factors such as wastage reduction, quality control and traceability are now taking major priority within food industries (Mousavi et al., 2002; 2005; Houba et al., 2000).
Quality assessment in the manufacturing plants we visited normally took place on a weekly basis using handwritten reports. Some retailers require these reports as proof of quality checks. The quality inspections include visual, aroma and taste of the raw materials and final product.
One method suggested by Kerr (2004), who is working on ‘intelligent package sealing and inspection system for semi-rigid food containers’ is image processing. Image processing is used in two stages; first a camera with a large Field of View (FOV) and low resolution is used during the filling process to check for any contamination, and if the
114 A. Mousavi, M. Hamdi and M. Sarhadi
container is properly positioned. Otherwise, the belt is stopped. In the next stage, another camera would be focused on the sealing process with small FOV and high resolution to inspect the sealing quality.
Brosnan and Sun (2002) present an example of quality monitoring using computer vision in the food industry and report its use in the inspection and grading of fruit and vegetables. They report on the success in the analysis of grain characteristics and in the evaluation of food quality such as meat, cheese and pizza.
Yi et al. (2002) include quality assurance in their proposed online-automatic shopfloor control system. Their system is responsible for matching sensory and quality inspection data, data acquisitions and monitoring, process diagnosis and optimisation for quality improvement, and scheduling to satisfy objectives such as timely product delivery. The paper addresses large-scale industries, where an efficient method for optimal parameter adjustment is required for product quality, due to large number of controllable and uncontrollable (such as ambient temperature) process parameters. To achieve process optimisation, the system fixes the uncontrollable factors and then solves non-linear programming to minimise quality variations. The authors identify the difficulty for operators to keep changing these parameters. Therefore, the number of changing parameters must be minimised. It is unclear if the quality inspection process is done continuously through the production process or only restricted to final product assessment.
3.5 Prediction, simulation and cost-profit evaluation
There is sufficient evidence in the literature of the need for cost evaluation tools that help in the planning and decision-making process. Cost curves, for different priority rules under different circumstances, can be used to calculate a marginal break-even price at each additional utilisation due to addition of MTO items (Soman et al., 2004). Houghton and Portugal (1997) have also used a cost function during innovation transition periods, when introducing new lines and products for assessing production reengineering and capacity planning costs. Lim and Zhang (2003) proposed agent based iterative bidding mechanism to facilitate the process of job assignment to machines and to handle the negotiation between agents. A currency scheme is proposed to encourage or prohibit agents to put forward their bids. This mechanism enables optimum process plans and production schedules to be produced concurrently.
Online simulation system can be integrated with several functional areas of the manufacturing environment and used as an efficient prediction tool for testing different production scenarios as well as understanding the production process. It is particularly preferred for its ability to capture complex interactions within a manufacturing system, where analytical methods fail (Drake et al., 1995; Huda and Chung, 2002; Reiner and Tricka, 2004). Soman et al. (2004), emphasise the need for a parametric decision aid and cost-profit comparison that can be used on different levels of the decision process. The authors recommend using simulation as a decision aid to help in understanding the interactions between products and capacity under varying demand patterns, set-up times and processing times. The authors claim that stability and maintainability of the production cycle are the main performance measures rather than cost measures at the scheduling and control level.
Quick-response decision-making in the food processing industry 115
It seems reasonable to conclude that a decision aid tool must take into account factors that maintain production stability by taking into account all aspects of resource utilisation and inventory management, which include staff management, machine maintenance and capacity planning. The idea of giving a decision-maker an evaluation tool that provides him/her with cost indications and future consequences of each decision will be essential in such a volatile and fast-moving environment. Such a tool, in fact, will be attractive to all industries.
Simulation of the food production involves both discrete and continuous operations of many high-speed minute component and flow-oriented manufacturing processes (Huda and Chung, 2002). It can help capacity planners determine order lot sizes, release dates, and work calendars for resources by incorporating simulated scheduling constraints in their decision-making.
In dynamic manufacturing environments, it may be advantageous to change the way a process is controlled at certain points in time. Drake et al. (1995) describe a Multi-Pass Expert Control System, where the production cycle is divided into several intervals separated by decision points. At each decision point, the current factory status is evaluated and a series of deterministic simulations are run to determine which control rule provides the best performance. The simulation is divided into process simulation modules, one for real-time task generator, and the other for analysis or look-ahead mode. This allows simultaneous task distributions and schedule comparison to avoid any production delays during the analysis process.
3.6 Management issues in food production
Other management issues include customer order negotiations, communication tools used and the effect of production policy on supply chains and vice versa. Reiner et al. (2004) examine production process effects on supply chains within a pasta-processing factory. The article explains supply chain behaviour where design depends on both product and company policy. The characteristics of finished products are related to customer requirements and form the basis for developing supply chain strategy. They use simulation to analyse and understand the effect of production and order fulfilment processes, and to generate the manufacturer input to the supply chains. Simulation results are used to determine the most appropriate values of decision variables (such as batch size), which yield the required level of performance.
Electronic Data Interchange (EDI) tools are now used to coordinate relationships between food manufacturers and their customers and suppliers (Hill and Scudder, 2002). During our visits to food factories, we observed that the use of EDI is limited to whether the customer uses EDI or not. Customer complaints for example, are still mostly communicated by paperwork via royal mail.
The main problem observed is the dependency on paper work, thereby affecting speed and accuracy of required data and information, for example, when gathering information regarding product quality, machine status and staff availabilities and holidays. Data updates and preliminary processing should become as automated as possible.
116 A. Mousavi, M. Hamdi and M. Sarhadi
The general trend now in research is to use intelligent data analysis and simulation rather than statistical process control, for delivering faster and better quality of information and control.
In the following section, the authors discuss the overview of the proposed solution for improving the decision-making process within the food industry.
4 Overview of the proposed system
Production managers interviewed in our research expressed their desire for having some form of tool that will assist and enable them to make better decisions with respect to the current state of the system. They need focused real-time and accurate information that offer them an analysis of the current situation, and in case of quick response decision-making, a number of options to choose from. Some of the factories implemented SAP software only to increase their confusion with data overload. Moreover, it proved to be difficult to synchronise SAP to report real-time data, which made the integration of the planner and scheduler difficult to maintain.
Other examples of desired information, in addition to real-time, are predictive information, automatic update of processing time and ingredient quantities, quality reports and alternative schedules and due dates. We have observed from the literature survey presented that some research have already taken this direction by presenting decision tools that, for example, offer prioritised options and others that allow the operator to interact by specifying desired completion time and number of resources used. However, there seems to be no decision tool that looks into the future and feedback both the future state and recommend scheduling options, with each option evaluated in terms of cost and profit. Meaning, how much may it cost to make a particular decision? For example, if a line is producing too much waste, is it possible to stop the line and reset the machine? Or continue with production to meet demand? Which option is less costly? The operator here has to make an informative decision whether the company can afford to delay the products’ due date or alternatively continue production to satisfy customers’ order. In the long-run, which option results to more profit?
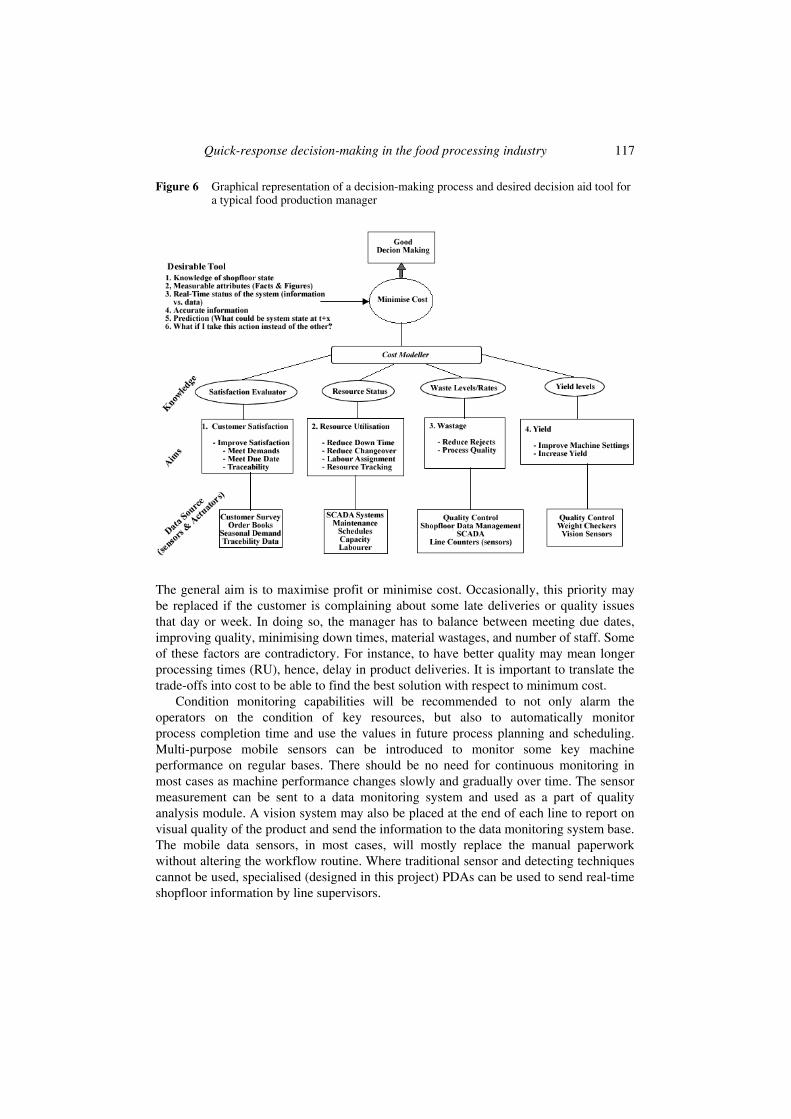
In this article, we propose a possible decision support system that may assist production and line managers with their daily shopfloor-level decisions and problem solving. A graphical representation of a typical line manager’s decision-making process and desired decision aid tool is shown in Figure 6.
The data source layer is the section where raw data is collected. For example, information required for assessing customer satisfaction will be collected from customer surveys, order books, seasonal demand, and the traceability data from MRP and ERP systems. This information can then be used to calculate customer satisfaction and consequently, create the much-needed knowledge to assess the cost incurred due to customer satisfaction variations (Mousavi et al., 2001; Markt and Mayer, 1997). Similarly, data on resource status, wastage and yield can be retrieved from real-time Supervisory Control and Data Acquisition (SCADA), or historical information. In less-automated plants, data needs to be collected via frequent manual observations.
Quick-response decision-making in the food processing industry 117
Figure 6 Graphical representation of a decision-making process and desired decision aid tool for a typical food production manager
The general aim is to maximise profit or minimise cost. Occasionally, this priority may be replaced if the customer is complaining about some late deliveries or quality issues that day or week. In doing so, the manager has to balance between meeting due dates, improving quality, minimising down times, material wastages, and number of staff. Some of these factors are contradictory. For instance, to have better quality may mean longer processing times (RU), hence, delay in product deliveries. It is important to translate the trade-offs into cost to be able to find the best solution with respect to minimum cost.
Condition monitoring capabilities will be recommended to not only alarm the operators on the condition of key resources, but also to automatically monitor process completion time and use the values in future process planning and scheduling. Multi-purpose mobile sensors can be introduced to monitor some key machine performance on regular bases. There should be no need for continuous monitoring in most cases as machine performance changes slowly and gradually over time. The sensor measurement can be sent to a data monitoring system and used as a part of quality analysis module. A vision system may also be placed at the end of each line to report on visual quality of the product and send the information to the data monitoring system base. The mobile data sensors, in most cases, will mostly replace the manual paperwork without altering the workflow routine. Where traditional sensor and detecting techniques cannot be used, specialised (designed in this project) PDAs can be used to send real-time shopfloor information by line supervisors.
118 A. Mousavi, M. Hamdi and M. Sarhadi
As for traceability, each component of the final product would have a number, which is part of the overall product code, or the product batch. Rather than having sensors continuously monitoring and tracing the component, a simulation of the process can trace the location of each component and the final batch number of that particular product (Mousavi, 2005).
The information environment created from the proposed system should be capable of regular data updates using real-time information to adjust historical data, if necessary. This can be achieved by collecting data and conducting a curve-fitting analysis. The information will be compared to the existing (assumed) information and updates will be made where necessary. For example, a typical production processing time is historically assumed to be conforming to a Triangular Distribution with value of (3, 10, 14) time units. A collection of real-time data, statistically verified, reveals that, currently, our system works with a Triangular Distribution with values (4, 12, 16). This will automatically update the resource utilisation figure for the resource at any given time.
The cost modeller uses the extracted values and their corresponding weight factors to evaluate and provide cost status report in time intervals. The operator can then conduct sensitivity analysis or simulation analysis to assess various possible options and view the impact on cost.
The operation management will be responsible for making the final decisions based on the options provided by the cost calculator.
Better action options (diagnostics) are likely to be generated as a consequence of the combined effect of accurate real-time information. We will then be able to create a time series to represent the system status.
An abstract mathematical model has been proposed to relate the performance factors and to represent the totality of the production model with respect to the four defined KPF.
The total cost defined within the scope of this paper can be represented as:
1 2 3 4
4
1
1
:
S U W Y
i
C C C C C
i
ω ω ω ω
ω
= + + +
=∑ weight of each KPF
the number of KPF
(6)
The system state vector at time t can be defined as:
[ ] [ ], , ,t S U W Y it tC C C C ωΧ = × (7)
Each tΧ will provide a reference point for the system’s overall performance trajectory in
time. The system state matrix with respect to a time ( 0 )t T= → series will be:
0 0 ,0 ,0 ,0 1
1 ,1 ,1 ,1 ,1 2
3
4, , , ,
:
:
...
:
S, U W Y
S U W YT
T S T U T W T Y T
t C C C C
t C C C C
t C C C C
ωωωω
⎡ ⎤ ⎡ ⎤⎢ ⎥ ⎢ ⎥⎢ ⎥ ⎢ ⎥Χ = ×⎢ ⎥ ⎢ ⎥⎢ ⎥ ⎢ ⎥⎢ ⎥ ⎢ ⎥⎣ ⎦⎣ ⎦
(8)
Quick-response decision-making in the food processing industry 119
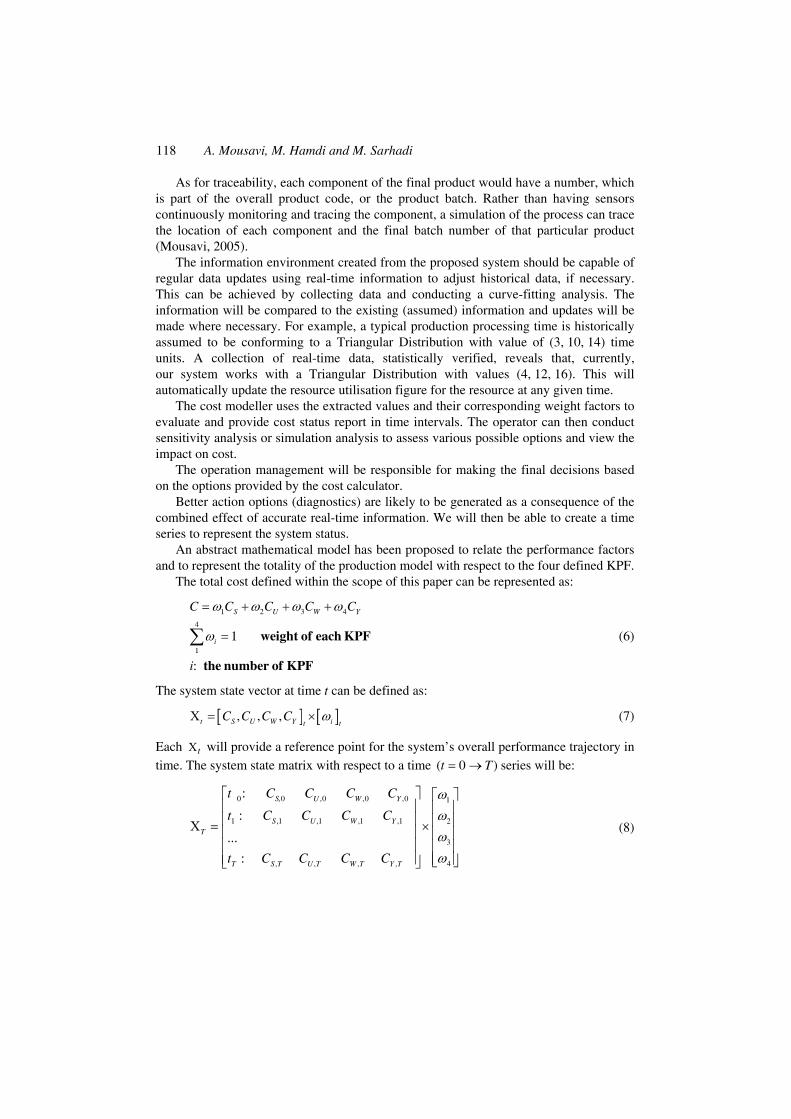
Figure 7a provides a schematic overview of the proposed system. Figure 7b shows the ideal location for the proposed system in the factory information system management structure. The system should be a suitable tool to link propriety SCADA and MRP/ERP systems by providing meaningful information.
Figure 7 (a) Proposed system (b) The location of the proposed in the factory information systems management structure
5 Conclusion
In view of the current situation, it is clear that SCADA, MRP and ERP alone are not enough, neither are propriety standard Information Management systems. The results of our research to date provide evidence that generating prioritised reports upon problems, which managers have no time to read let alone act upon, is not enough. Diagnosis is interesting but can only be beneficial when acted upon.
This paper outlined the:
• four Key Performance Factors (KPF) within the food industry
• relationship between variances in the KPF with cost as the common denominator for system performance analysis
• utilisation of real-time and historical shopfloor data to construct an information structure capable of collecting critical real-time data from the shopfloor, fusing the data to produce meaningful information
• provision of a platform for prediction and what-if scenario analysis.
The decision aid proposed brings to bear a combination of algorithms to turn diagnosis into action options, recommending the best course of action, in response to daily condition prevailing in a typical food production environment. The integration of the proposed system with a standard simulation tool will provide line managers with fast-forward option in playing out ‘What if scenarios’.
120 A. Mousavi, M. Hamdi and M. Sarhadi
For future research, the cost models described in Section 2 need to be experimentally proven. Experiments need to be designed to accurately formulate the cost behaviour. Currently, activities are taking place to create a working prototype of the proposed system. Research is ongoing to further prove and enhance the cost modellers.
Acknowledgements
The authors would like to acknowledge the valuable input from Northern Foods plc, Ginsters, Grampian Country Food Group and Harford Control. This project was supported and funded by the Department of Environment, Food and Rural Affairs (DEFRA), UK. Also we would like to acknowledge Alexander Komashie for his contribution to the simulation of the proposed models. The authors would also like to acknowledge the anonymous reviewers for their comments on the earlier version of the manuscript.
References
AFM 218BR (2005) Resource Management and Product Traceability (e-Track), July 2004–February 2005.
Balakrishnan, R., Sivaramakrishnan, K. and Sunder, S. (2001a) Granularity, Time, and Control of Economic Resources, Working paper, Carnegie Mellon University.
Balakrishnan, R., Sivaramakrishnan, K. and Sunder, S. (2001b) Is the Opportunity Cost of Idle Capacity Zero? Coase (1938) Versus Managerial Accounting Circa 2000, Yale University, http://www.som.yale.edu/faculty/sunder/Idle/IdleDec01.PDF (accessed 17 June 2005).
Balakrishnan, R., Sivaramakrishnan, K. and Sunder, S. (2001c) Is the Opportunity Cost of Idle Capacity Zero? Coase (1938) Versus Managerial Accounting Circa 2000, http://citeseer.ist.psu.edu/498597.html.
Barnes, R. (1980) Motion and Time Study Design and Measurement of Work, 7th ed., John Wiley and Sons.
Brosnan, T. and Sun Da-Wen (2002) ‘Inspection and grading of agricultural and food products by computer vision systems – a review’, Computers and Electronics in Agriculture, November, Vol. 36, pp.193–213.
Cho, S., Baek, S. and Kim, J.S. (2003) ‘Exploring artificial intelligence-based data fusion for conjoint analysis’, Expert Systems with Applications, Vol. 24, pp.287–294.
Claricom Editorial Team (2005) ‘Management of pack traceability essential’, Manufacturingtalk, Web’s Publication for Production Engineers, 7 February, http://www.manufacturingtalk.com. news/cla/cla107.html (accesses 18 July).
Drake, G.R., Smith, J.S., and Peters, B.A. (1995) ‘Simulation as a planning and scheduling tool for flexible manufacturing systems’, Proceedings of the 1995 Winter Simulation Conference, Washington, DC, pp.805–812.
Fabrycky, W.J., Thuesen, G.J. and Verma, D. (1997) Economic Decision Analysis, Upper Saddle River, NJ: Prentice Hall.
Gargouri, E., Hammadi, S. and Borne, P.A. (2002) ‘Study of scheduling problem in agro-food manufacturing systems’, Mathematics and Computers in Simulation, 30 September, Vol. 60, Nos. 3–5, pp.277–291.
Green, R. (2005) ‘Real-time factory information management systems’, Interview Conducted with the Managing Director of Harford Control, Specialists in Yield Analysis, Wiltshire, UK.
Quick-response decision-making in the food processing industry 121
Hamdi, Muna, Mousavi, A. and Sarhadi, M. (2005) ‘An intelligent decision and management support tool’, The Third European Conference on Intelligent Management Systems in Operations, 28–29 June, Salford, UK.
Hill, C.A. and Scudder, G.D. (2002) ‘The use of electronic data interchange for supply chain coordination in the food industry’, Journal of Operations Management, August, Vol. 20, No. 4, pp.375–387.
Houba, I.H.G., Hartog, R.J.M., Top, J.L., Beulens, A.J.M. and van Berkel, L.N. (2000) ‘Using recipe classes for supporting detailed planning in food industry: a case study’, European Journal of Operational Research, 16 April, Vol. 122, No. 2, pp.367–373.
Houghton, E. and Portugal, V. (1997) ‘Reengineering the production planning process in food industry’, Int. J. Production Economics, Vol. 50, pp.105–116.
Huda, A.M. and Chung, C.A. (2002) ‘Simulation modelling and analysis issues for high-speed combined continuous and discrete food industry manufacturing processes’, Computer and Industrial Engineering, Vol. 43, pp.473–483.
Kelton, W.D., Sadowski, R.P. and Sturrock, D.T. (2004) Simulation with Arena, 3rd ed., McGraw-Hill, International Edition.
Kerr, D. (2004) FoodLINK News, September, No. 48, p.5.
Lim, M.K. and Zhang, Z. (2003) ‘Iterative agent bidding to increase manufacturing agility’, Proc. of the 2nd CIRP International Conference on Reconfigurable Manufacturing, Ann Arbor, MI, USA, 20–21 August.
Markt, P. and Mayer, M. (1997) ‘Witness, simulation software and flexible suite of simulation tools’, Proceedings of the 1997 Winter Simulation Conference, pp.711–717.
Mermelstein, N.H. (2000) ‘Software for food processing’, Foodtechnology, January, Vol. 54, No. 1, pp.56–60.
Migdal, E. (2004) ‘Traceability in the food chain’, MSc Dissertation, supervised by M. Ozbayrak, School of Engineering and Design, Brunel University, UK.
Mousavi, A. (2005) ‘Product traceability using real-time discrete event simulation (DESTRAC) for food processing industry’, Journal of Food Engineering, May.
Mousavi, A., Adl, P., Rakowski, R.T. and Gunasekaran, A. (2001) ‘Customer Optimisation Route and Evaluation (CORE)’, International Journal of Computer Integrated Manufacturing, Vol. 14, No. 2, pp.236–243.
Mousavi, A., Sarhadi, M., Fawcett, S. and Bowles, S. (2005) ‘Tracking and traceability solution in food industry using a novel material handling system’, Journal of Innovative Food Science and Emerging Technology, Vol. 6, pp.91–105.
Mousavi, A., Sarhadi, M., Lenk, A. and Fawcett, S. (2002) ‘Tracking and traceability in meat processing industry: a solution’, British Food Journal, Vol. 104, No. 1, pp.7–19.
Reichheld, F. (1996) ‘The loyalty effect’, Harvard Business School Press, Boston.
Reichheld, F. and Sasser, W. (1990) ‘Zero defects: quality comes to services’, Harvard Business Review, September–October, pp.105–111.
Reiner, G. and Tricka, M. (2004) ‘Customized supply chain design: problems and alternatives for a production company in the food industry: a simulation based analysis’, International Journal of Production Economics, 28 May, Vol. 89, No. 2, pp.217–229.
Roberts, C. (2005) ‘ERP software implementation at the Hallite Group’, MSc Dissertation supervised by F. Cecelja, January, School of Engineering and Design, Brunel University, UK.
Soman, C.A., van Donk, D.P. and Gaalman, G. (2004) ‘Combined make-to-order and make-to-stock in a food production system’, International Journal of Production Economics, 28 July, Vol. 90, No. 2, pp.223–235.
Yi, G., Shin, J., Cho, H. and Kim, K. (2002) ‘Quality-oriented shop floor control system for large-scale manufacturing processes: functional framework and experimental results’, Journal of Manufacturing Systems, Vol. 21, No. 3, pp.187–199.
122 A. Mousavi, M. Hamdi and M. Sarhadi
Notes
1 Satistica is an online surveying and satisfaction evaluation software system. For more information, refer to http://satistica.com (accessed 4 July 2006).
2 Simul8 simulation software, http://www.simul8.com/company/index.htm (accessed 17 June 2005).
Appendix
Figure 8 Cost index and utilisation when i = 0.1
Quick-response decision-making in the food processing industry 123
Figure 9 Cost index and utilisation when i = 0.01
Figure 10 Cost index and utilisation when i = 0.9
124 A. Mousavi, M. Hamdi and M. Sarhadi
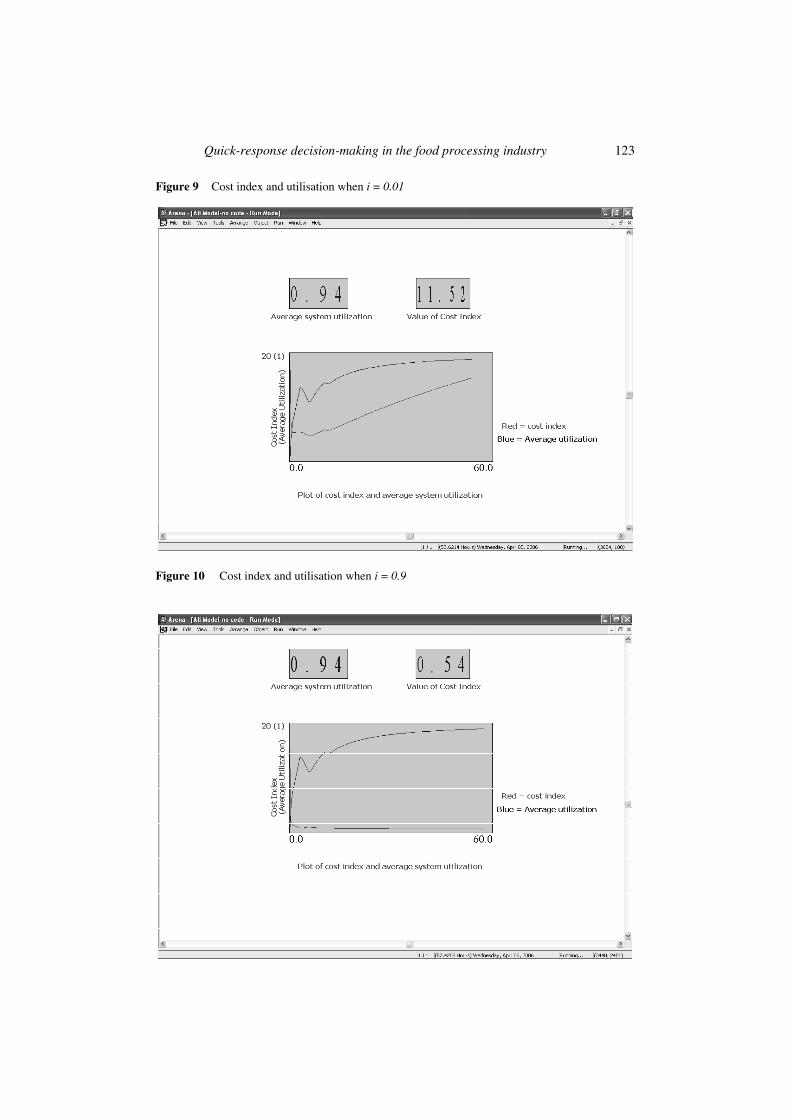
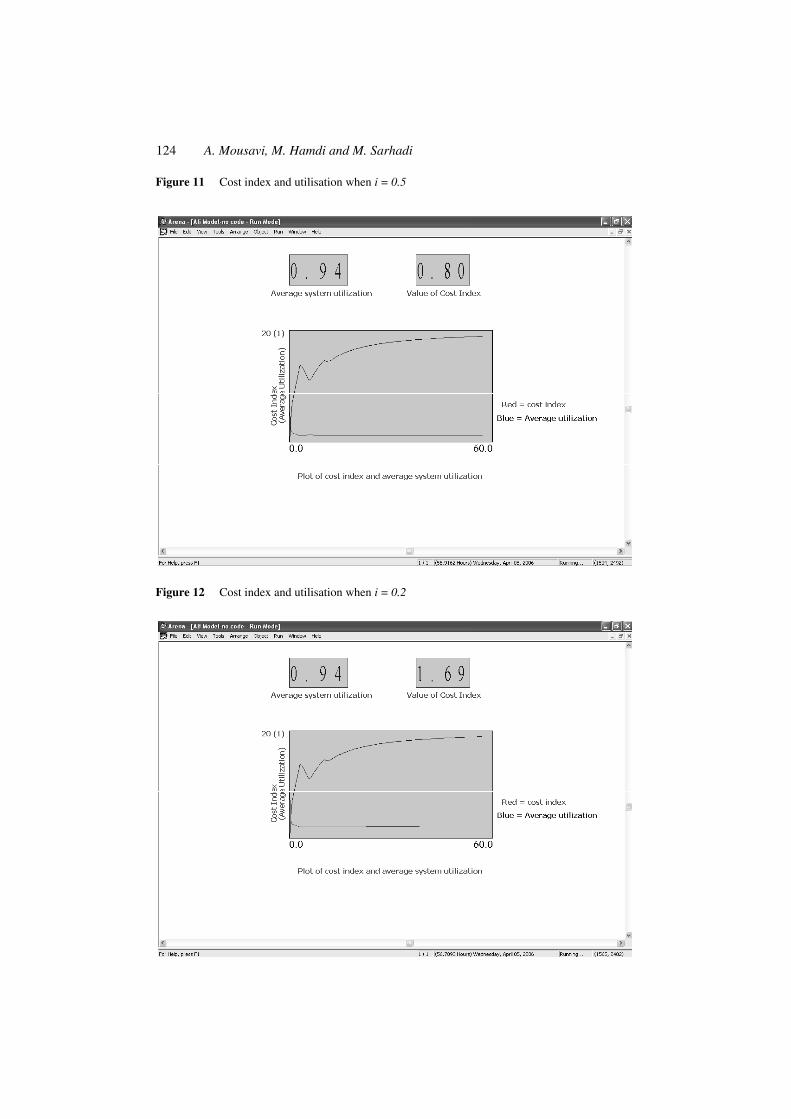
Figure 11 Cost index and utilisation when i = 0.5
Figure 12 Cost index and utilisation when i = 0.2
Related Documents


