Discrete Event Simulation & Queuing Systems ORIE 3120 Lecture 10 March 3rd and 5th

Welcome message from author
This document is posted to help you gain knowledge. Please leave a comment to let me know what you think about it! Share it to your friends and learn new things together.
Transcript

Discrete Event Simulation & Queuing Systems
ORIE 3120Lecture 10
March 3rd and 5th
Simulation
Using the computer as our laboratory!
Implement (mathematical) model of (physical) system on computer.
Do experiments on model to draw conclusions about system.

Examples
• Traffic lights• Plant breeding• Setting prices• Design of cryptocurrency• Staffing (of, e.g., call centers)• Verifying analytic results• https://www.youtube.com/watch?v=0ZGbIKd0XrM

There are 2 kinds of simulation
• Discrete event simulation• Discrete time simulation
• The focus in this course will be on discrete event simulation

Overview
• Example: The Cookie Problem
• Discrete Event Simulation
• A Graphical Language
• Programming a Simulation in MS Excel

Cookie Problem (#1)
Trays of cookies arrive every 13.75 minutes
Oven capacity is two trays
Oven cycle is 13.5 minutes, cannot be interrupted
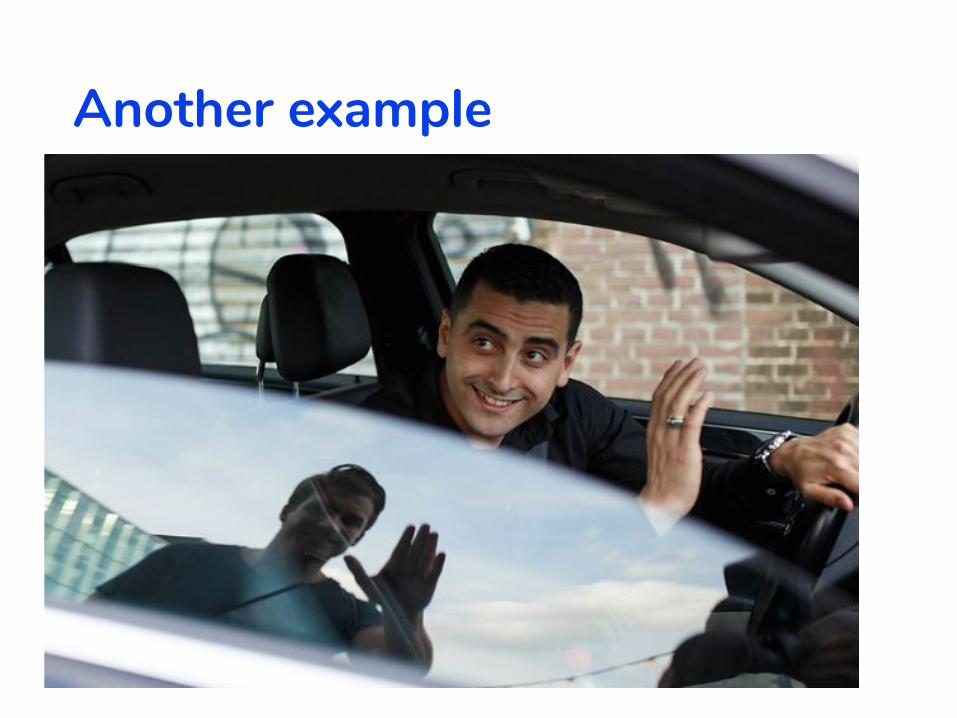
Another example

Ride sharing at an airport
Riders arrive randomly
A queue of riders can build up If riders wait too long,
some will find another way home
If the driver queue is too long, some will leave
Drivers arrive randomly A queue of drivers
can build up
Riders & drivers are matched

Cookie Problem (#1)
Trays of cookies arrive every 13.75 minutes
Oven capacity is two trays
Oven cycle is 13.5 minutes, cannot be interrupted

What is the average rate at which trays leave the oven?
(a) 1 tray / 13.5 min = 0.074 trays/min(b) 2 trays / 13.5 min = 0.148 trays/min(c) 1 tray / 13.75 min = 0.073 trays/min(d) 2 trays / 13.75 min = 0.145 trays/min(e) none of the above

What is the average rate at which trays leave the oven?
(a) 1 tray / 13.5 min = 0.074 trays/min(b) 2 trays / 13.5 min = 0.148 trays/min(c) 1 tray / 13.75 min = 0.073 trays/min(d) 2 trays / 13.75 min = 0.145 trays/min(e) none of the above
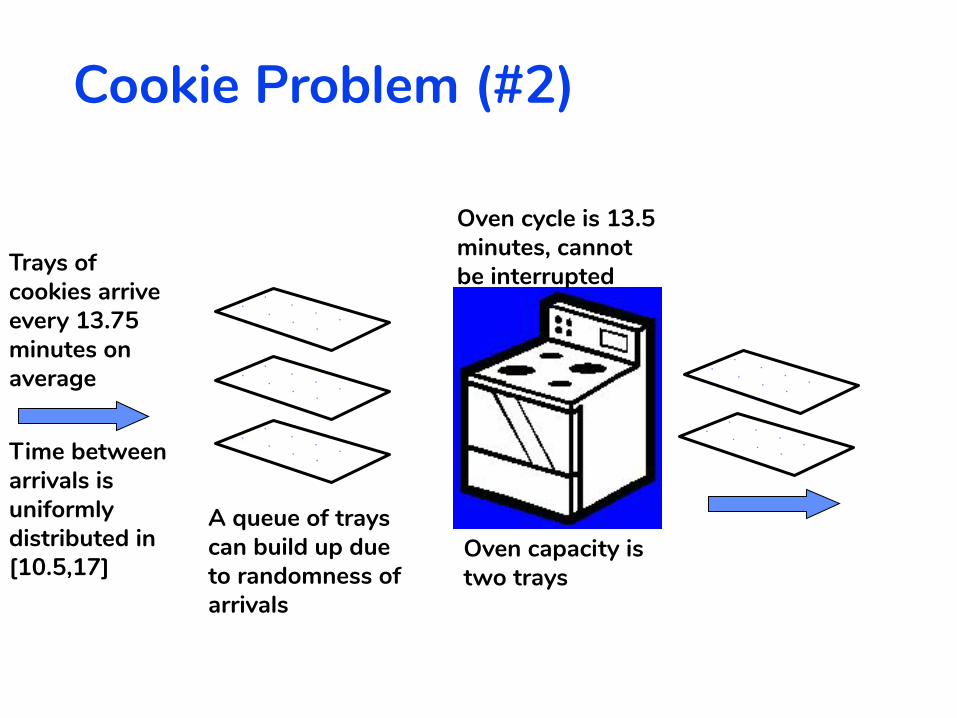
Cookie Problem (#2)
Trays of cookies arrive every 13.75 minutes on average
A queue of trays can build up due to randomness of arrivals
Oven cycle is 13.5 minutes, cannot be interrupted
Oven capacity is two trays
Time between arrivals is uniformly distributed in [10.5,17]
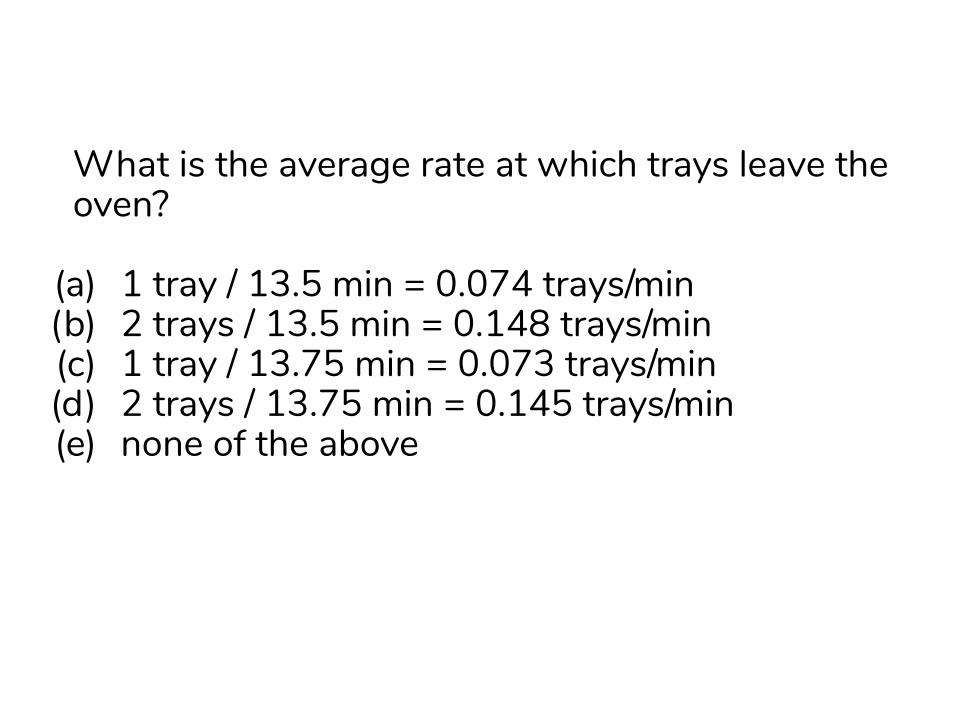
What is the average rate at which trays leave the oven?
(a) 1 tray / 13.5 min = 0.074 trays/min(b) 2 trays / 13.5 min = 0.148 trays/min(c) 1 tray / 13.75 min = 0.073 trays/min(d) 2 trays / 13.75 min = 0.145 trays/min(e) none of the above

What is the average rate at which trays leave the oven?
(a) 1 tray / 13.5 min = 0.074 trays/min(b) 2 trays / 13.5 min = 0.148 trays/min(c) 1 tray / 13.75 min = 0.073 trays/min(d) 2 trays / 13.75 min = 0.145 trays/min(e) none of the above

Cookie Problem (#3)
Trays of cookies arrive every 6 minutes on average
A queue of trays can build up due to randomness of arrivals
Oven capacity is two trays
Time between arrivals is uniformly distributed in [4,8]
Oven cycle is 13.5 minutes, cannot be interrupted

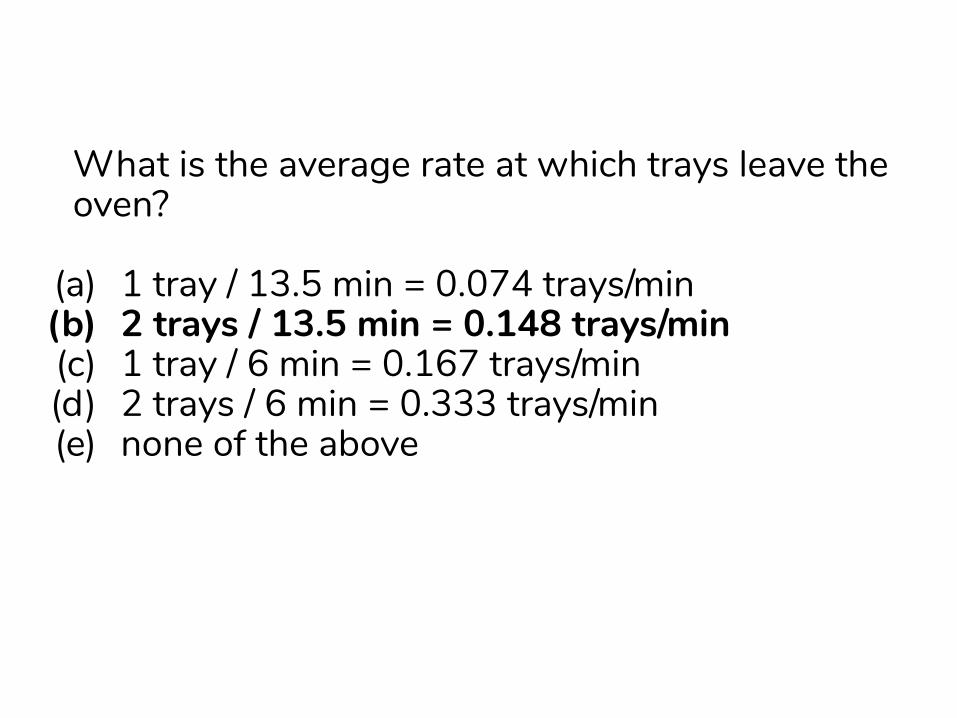
What is the average rate at which trays leave the oven?
(a) 1 tray / 13.5 min = 0.074 trays/min(b) 2 trays / 13.5 min = 0.148 trays/min(c) 1 tray / 6 min = 0.167 trays/min(d) 2 trays / 6 min = 0.333 trays/min(e) none of the above
What is the average rate at which trays leave the oven?
(a) 1 tray / 13.5 min = 0.074 trays/min(b) 2 trays / 13.5 min = 0.148 trays/min(c) 1 tray / 6 min = 0.167 trays/min(d) 2 trays / 6 min = 0.333 trays/min(e) none of the above

Cookie Problem (#4)
Trays of p.b. arrive every 14 minutes on average,uniform over [12,16]
Trays of c.c. arrive every 13.5 minutes on average
Queues of trays can build up due to randomness of arrivals
Oven cycle is 13.5 minutes but cannot be interrupted
Oven capacity is two trays (can be of mixed type)
Maximum throughput is 2 trays every 13.5 minutes
uniform over [9,18]

What is the average rate at which trays leave the oven?
(a) 2 trays / 13.5min = .148 trays/min(b) 1 tray / 13.5min + 1 tray/ 14min= .145 trays / min(c) 1 tray / 13.5 min = .074 trays/min(d) 1 tray / 14 min = .071 trays/min(e) none of the above

What is the average rate at which trays leave the oven?
(a) 2 trays / 13.5min = .148 trays/min(b) 1 tray / 13.5min + 1 tray/ 14min= .145 trays /
min(c) 1 tray / 13.5 min = .074 trays/min(d) 1 tray / 14 min = .071 trays/min(e) none of the above

Point is...
Can still answer this particular question analytically, but…
… it’s easy to simulate and get an answer!
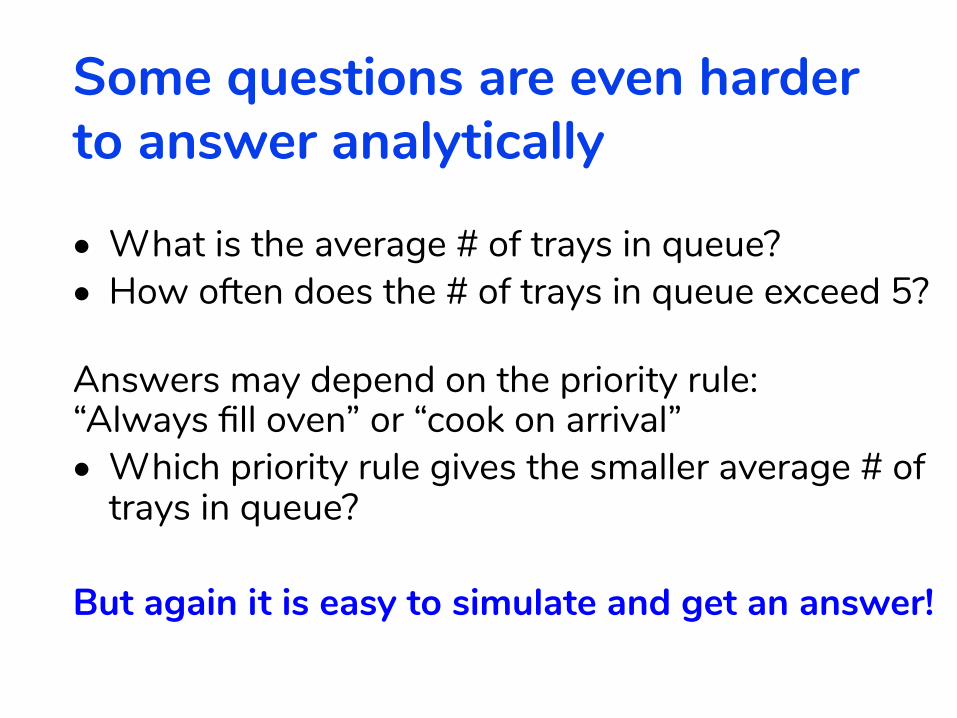
Some questions are even harder to answer analytically
• What is the average # of trays in queue?• How often does the # of trays in queue exceed 5?
Answers may depend on the priority rule:“Always fill oven” or “cook on arrival”• Which priority rule gives the smaller average # of
trays in queue?
But again it is easy to simulate and get an answer!

Examples from ride sharing
• What fraction of riders won’t be able to get a car?• What fraction of riders will have to wait longer
than 10 minutes to be picked up?• What is the average price that riders will pay?• How much money per hour will drivers earn?• What pricing algorithm should I use to maximize
the total value created for riders and drivers?
Again easy to simulate and get an answer!

Discrete Event Simulation
• The system is described by a state.• The state changes only at discrete points in
time, called events.• The interval between events is called a delay,
or duration. The delay could be random.• Events can trigger other events depending on
conditions that depend on the state.

The Cookie Problem
• What is the state of the system?• At what points in time (events) does the state
change?• What are the delays?• What events could trigger other events?• What are the conditions under which events
are triggered?

Discrete Event Simulation is powerful.• It models complex behavior with simple
language of “states”, “events”, “delays”, “conditions”, and “triggers”
• It can jump in time from one event to another• Nothing ‘interesting’ happens between events: no
change in state• This allows it to rapidly simulate days/weeks/years
of real-time activity.• If the state is simple (e.g. inventory counts)
then processing time and memory required are very small.
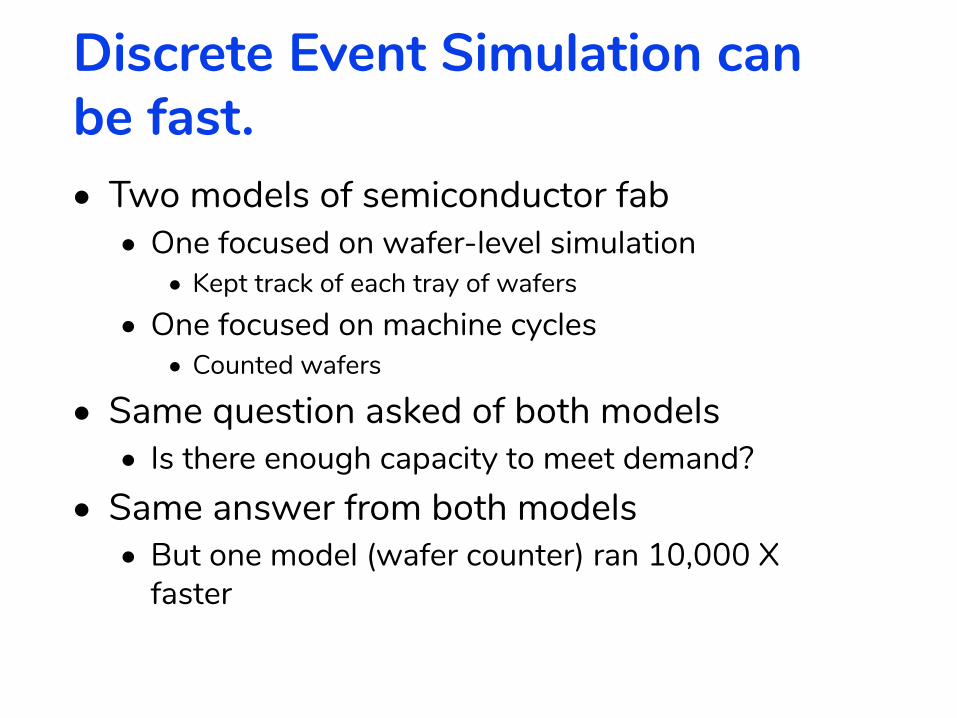
Discrete Event Simulation can be fast.• Two models of semiconductor fab
• One focused on wafer-level simulation• Kept track of each tray of wafers
• One focused on machine cycles• Counted wafers
• Same question asked of both models• Is there enough capacity to meet demand?
• Same answer from both models• But one model (wafer counter) ran 10,000 X
faster
Overview
• Example: The Cookie Problem
• A Model of Behavior: Discrete Event Simulation
• A Graphical Language
• Programming a Simulation in MS Excel

How a Discrete Event Simulation Works• At any point in time there is an ordered list of events scheduled to
occur in the future (the event queue).• The state of the system is described by state variables.• The simulation engine removes the first event from the event queue
and advances the simulation clock to the time recorded on that event.• The function associated with that event is called.
• The function may change the values of the state variables.• The simulation engine checks to see if any trigger conditions are
satisfied.• If a trigger condition is satisfied, the simulation engine creates a new event
for each trigger.• The scheduled time for the new event is the current simulation clock time
plus any delay associated with the trigger.• The new event is inserted into the event queue in order of the event time.
• The simulation continues until there are no more events in the event queue, or until a simulation stop time is reached.
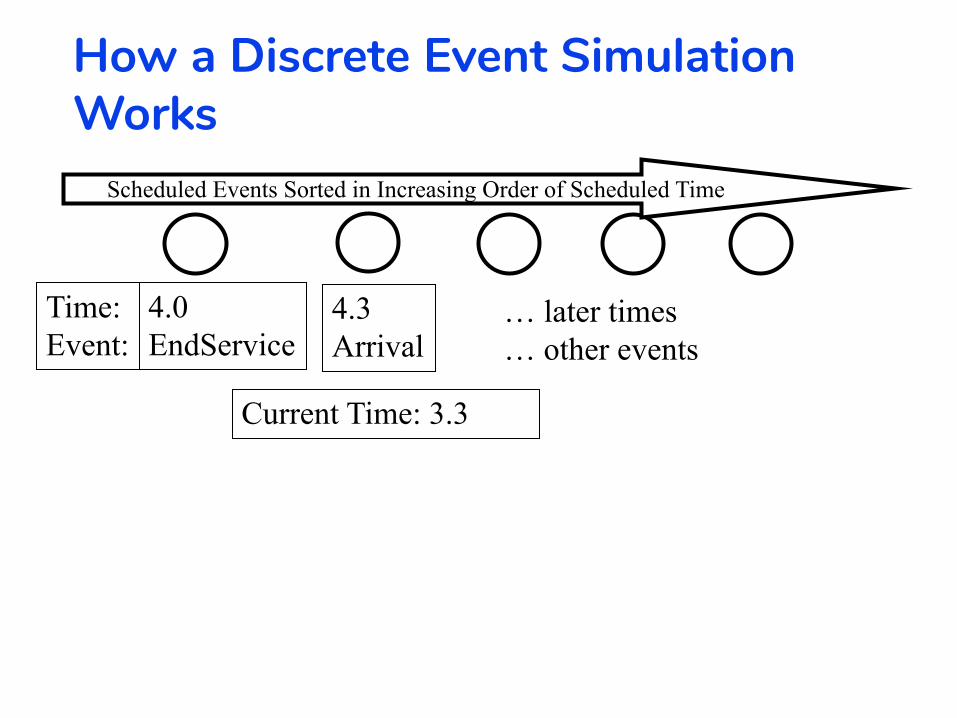
Scheduled Events Sorted in Increasing Order of Scheduled Time
Time:Event:
4.0EndService
4.3Arrival
Current Time: 3.3
… later times… other events
How a Discrete Event Simulation Works
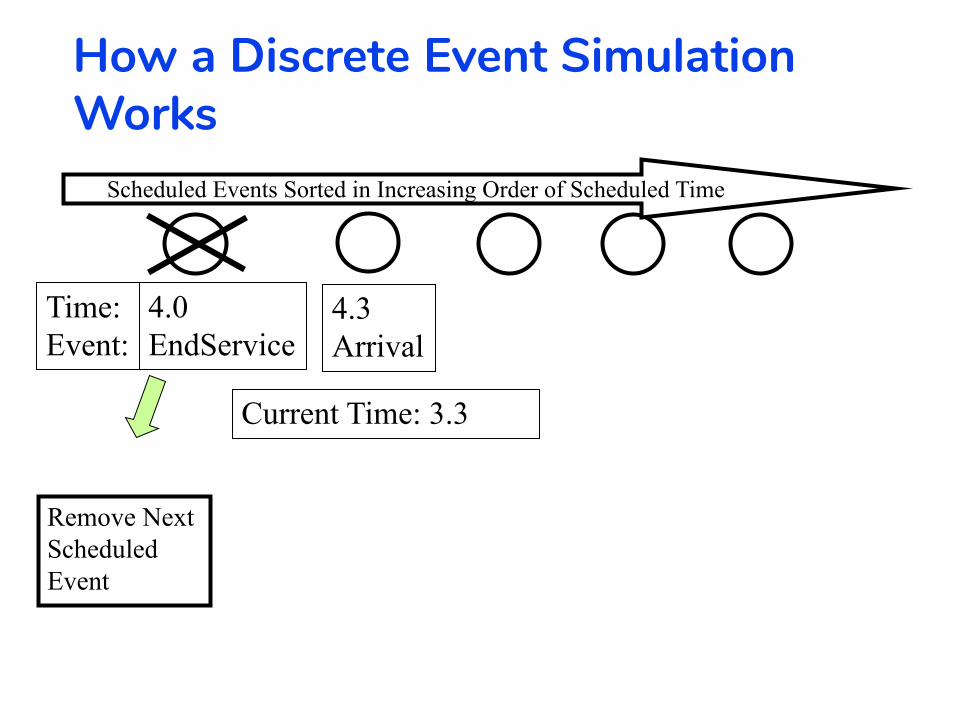
Time:Event:
4.0EndService
4.3Arrival
Remove Next Scheduled Event
Current Time: 3.3
Scheduled Events Sorted in Increasing Order of Scheduled Time
How a Discrete Event Simulation Works

Time:Event:
4.0EndService
4.3Arrival
Advance Simulation Clock
Current Time: 3.3
Current Time: 4.0
Scheduled Events Sorted in Increasing Order of Scheduled Time
How a Discrete Event Simulation Works

Time:Event:
4.0EndService
4.3Arrival
Execute State Change Function
Current Time: 4.0
Scheduled Events Sorted in Increasing Order of Scheduled Time
How a Discrete Event Simulation Works

Time:Event:
4.0EndService
If Condition Satisfied…
4.3Arrival
Current Time: 4.0
Scheduled Events Sorted in Increasing Order of Scheduled Time
How a Discrete Event Simulation Works
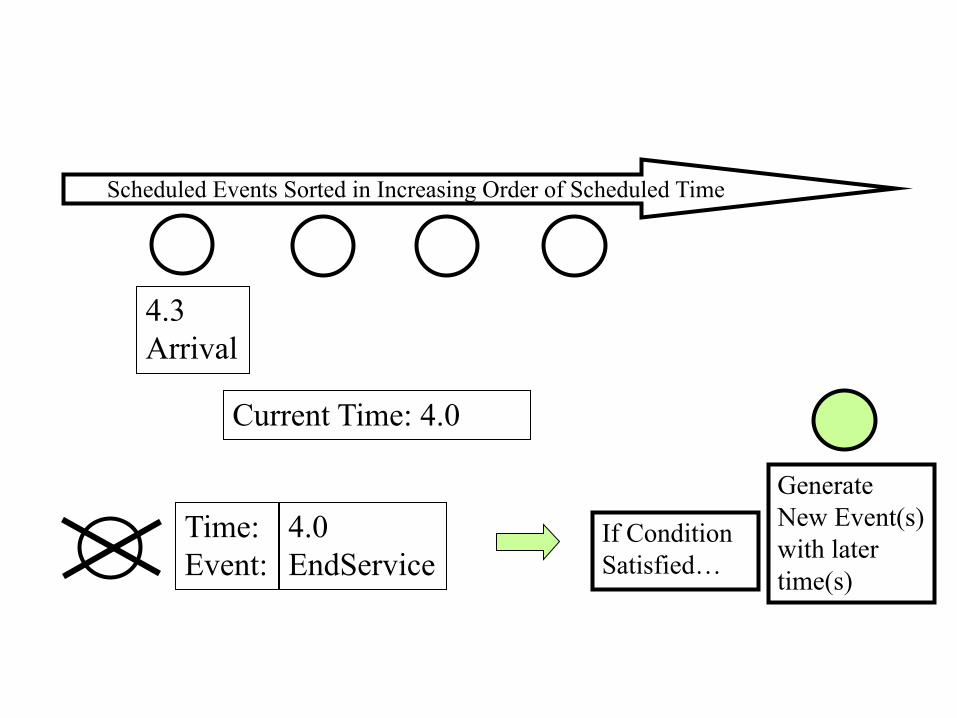
Time:Event:
4.0EndService
If Condition Satisfied…
Generate New Event(s) with later time(s)
4.3Arrival
Current Time: 4.0
Scheduled Events Sorted in Increasing Order of Scheduled Time

Insert Event into Schedule
4.3Arrival
Current Time: 4.0
Scheduled Events Sorted in Increasing Order of Scheduled Time
How a Discrete Event Simulation Works

Insert Event into Schedule
4.3Arrival
Current Time: 4.0
Scheduled Events Sorted in Increasing Order of Scheduled Time
How a Discrete Event Simulation Works

4.3Arrival
Current Time: 4.0
Remove Next Scheduled Event
Scheduled Events Sorted in Increasing Order of Scheduled Time
How a Discrete Event Simulation Works
Repeat

… later times… other events
How a Discrete Event Simulation Works: Summary
Time:Event:
4.0EndService
4.3Arrival
Remove Next Scheduled Event
Advance Simulation Clock
Execute State Change Function
If Condition Satisfied…
Generate New Event(s) with later time(s)
Insert Event into Schedule
Current Time: 3.3
Current Time: 4.0
Scheduled Events Sorted in Increasing Order of Scheduled Time

The Simplified Cookie Problem
Trays of cookies arrive every 13.75 minutes on average
A queue of trays can build up due to randomness of arrivals
Oven cycle is 25 minutes but cannot be interrupted
Oven capacity is two trays
Maximum throughput is 2 trays every 25 minutes
Time between arrivals is uniformly distributed in [10.5,17]

Modeling
• State of the system• Q = number of trays in queue (0,1, 2,…) • P = number of trays in oven (0,1, or 2)
• Events that change system• Arrival (Q increases)• Start (Q decreases, P increases)• Finish (P decreases)• Initialize (set P and Q to initial values)

Modeling Triggers and Delays
• Start triggers Finish with delay of 25 minutes• Call this OvenCycleTime• OvenCycleTime = 25
• Arrival triggers Arrival with delay of 13.75 minutes, on average• Call this InterarrivalTime • InterarrivalTime =10.5 + Rnd()*(17-10.5)• Rnd() is a pseudo-random number in (0,1)
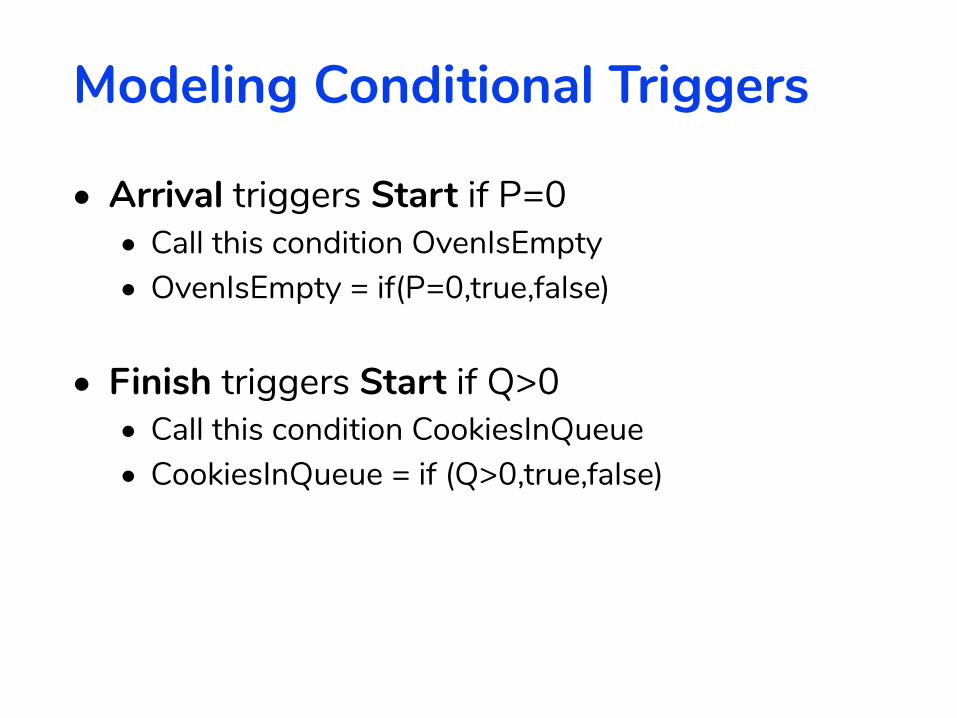
Modeling Conditional Triggers
• Arrival triggers Start if P=0• Call this condition OvenIsEmpty• OvenIsEmpty = if(P=0,true,false)
• Finish triggers Start if Q>0• Call this condition CookiesInQueue• CookiesInQueue = if (Q>0,true,false)

Modeling State Changes
• Arrival: Q = Q+1• Finish: P = 0• Start: if Q > 2 then P = 2, else P = Q; Q = Q-P
• Start does not get triggered unless Q is at least 1• Initialize: Q=0,P=0

Overview
• Motivation: The Cookie Problem
• A Model of Behavior: Discrete Event Simulation
• Event Graph Language
• Programming a Simulation in MS Excel
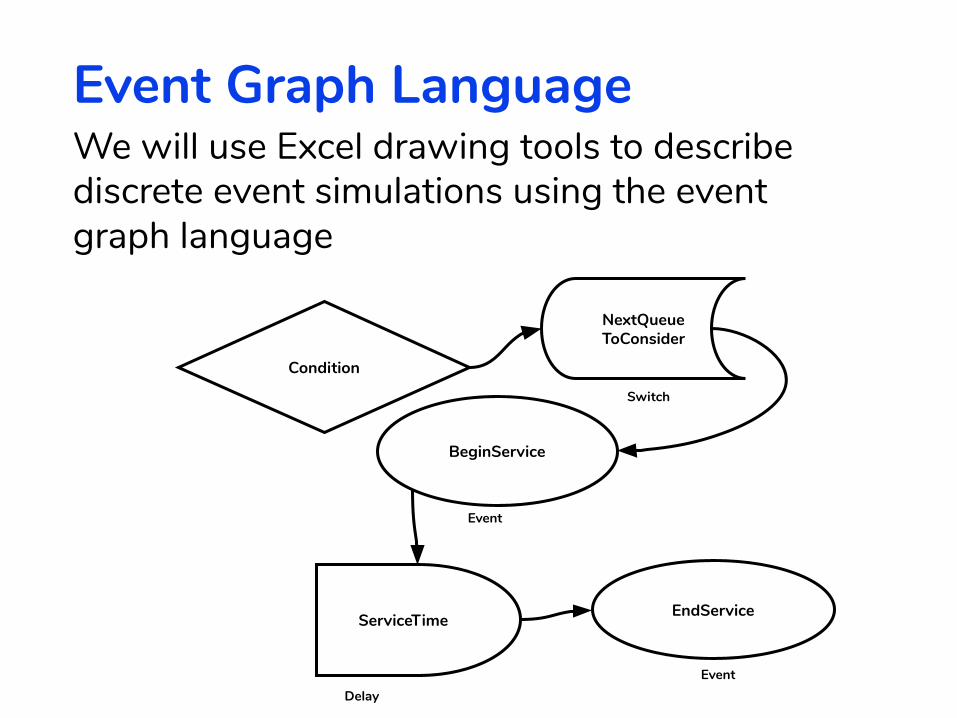
Event Graph LanguageWe will use Excel drawing tools to describe discrete event simulations using the event graph language
BeginService
ServiceTime
Condition
NextQueueToConsider
EndService
Delay
Event
Event
Switch

Graph Language is for Illustration PurposesGraph language implements event, trigger and delay logic of simulation
Could also implement this yourself in any general purpose language (e.g., Python)
[Still have to implement state changes in VBA]

Next few slides uses Excel Implementation
… but the main purpose is to serve as an example what Discrete Event Simulation is.

The Simplified Cookie Model
CookiesInQueue
Initialize
Arrival
Start
Finish
OvenIsEmpty
InterarrivalTime
OvenCycleTime

The Simplified Cookie Model
CookiesInQueue
Initialize
Arrival
Start
Finish
OvenIsEmpty
InterarrivalTime
OvenCycleTime
Q=0;P=0
Q=Q+1
If Q>2 then P=2, else P=Q;Q=Q-P
P=0
=10.5+rnd()*(6.5)
=25
=if(P=0,true,false)
=if(Q>0,true,false)
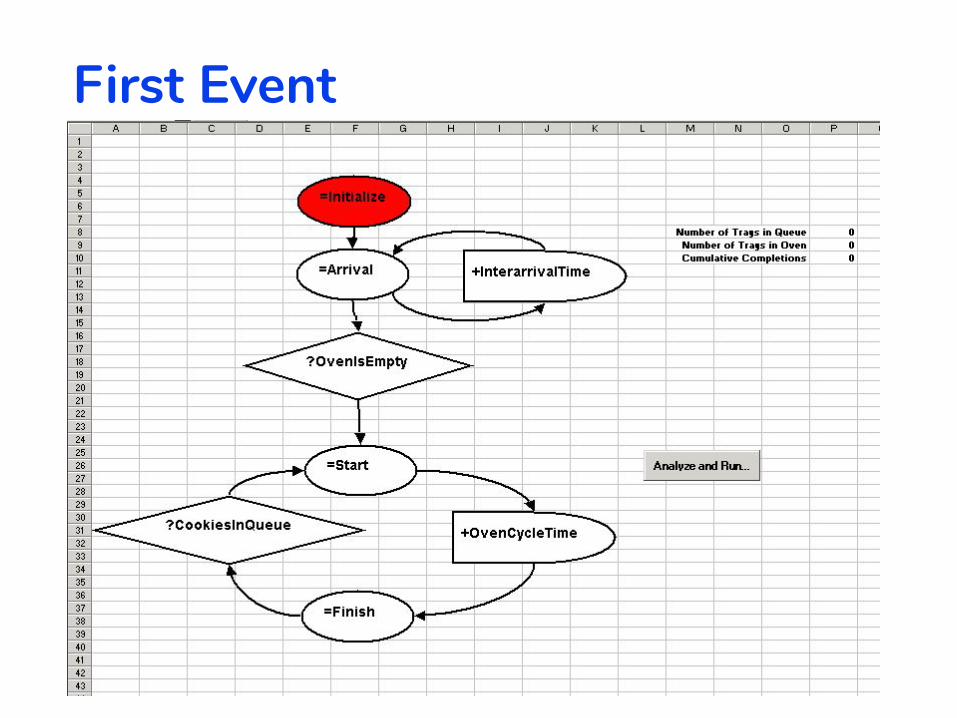
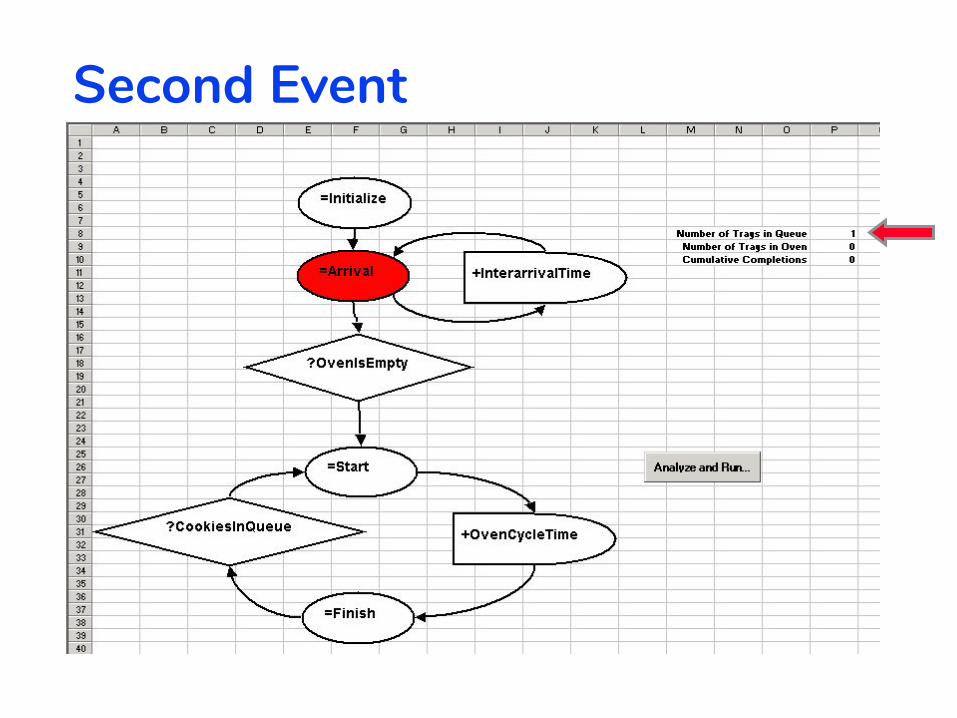
First Event

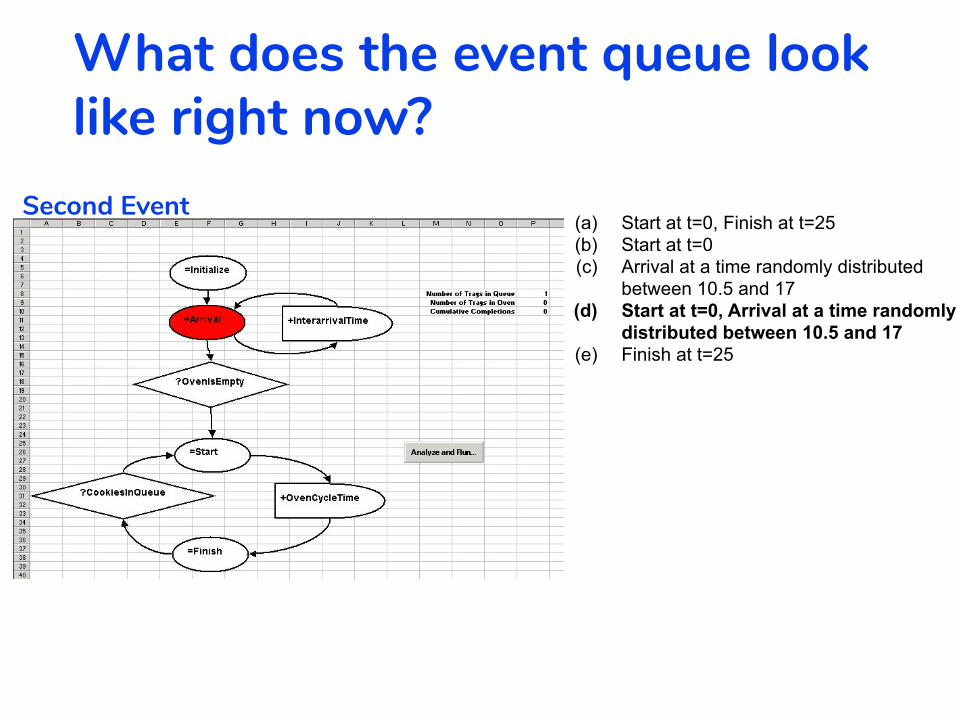
Second Event

What does the event queue look like right now?
(a) Start at t=0, Finish at t=25(b) Start at t=0(c) Arrival at a time randomly distributed
between 10.5 and 17(d) Start at t=0, Arrival at a time randomly
distributed between 10.5 and 17(e) Finish at t=25
Second Event
What does the event queue look like right now?
(a) Start at t=0, Finish at t=25(b) Start at t=0(c) Arrival at a time randomly distributed
between 10.5 and 17(d) Start at t=0, Arrival at a time randomly
distributed between 10.5 and 17(e) Finish at t=25
Second Event

Third Event

What does the event queue look like right now?
(a) Arrival at a time randomly distributed between 10.5 and 17; Finish at t=25
(b) Arrival at a time randomly distributed between 10.5 and 17; Finish at t=0
(c) Arrival at a time randomly distributed between 10.5 and 17; Finish at a time randomly distributed between 0 and 25
(d) Finish at a time randomly distributed between 0 and 25
(e) Finish at t=25
Third Event
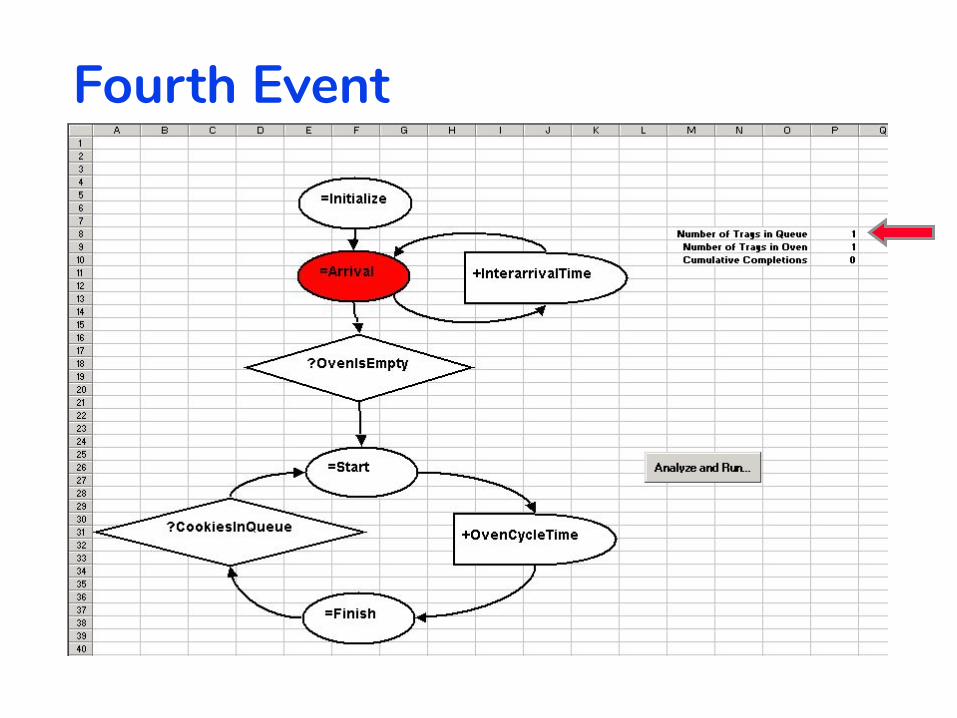
Fourth Event
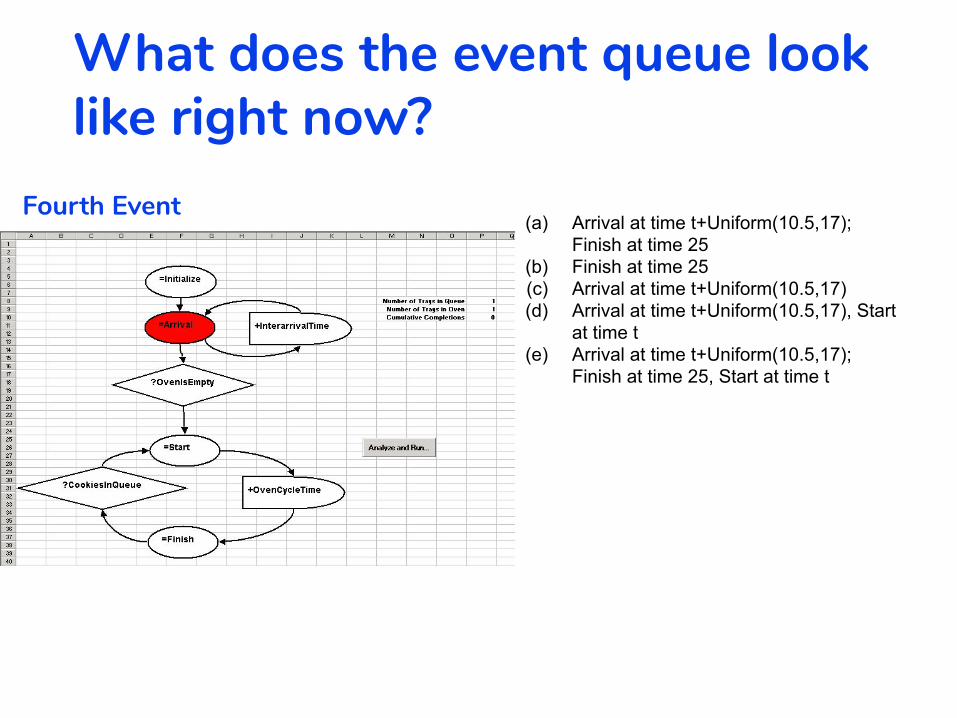
What does the event queue look like right now?
(a) Arrival at time t+Uniform(10.5,17); Finish at time 25
(b) Finish at time 25(c) Arrival at time t+Uniform(10.5,17)(d) Arrival at time t+Uniform(10.5,17), Start
at time t(e) Arrival at time t+Uniform(10.5,17);
Finish at time 25, Start at time t
Fourth Event
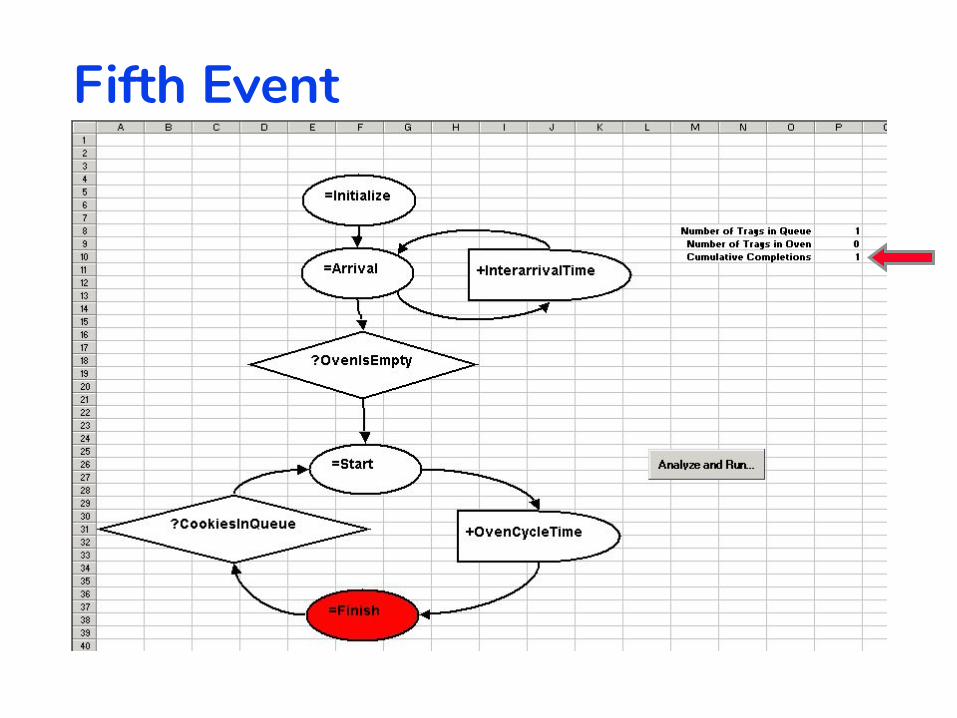
Fifth Event

Graph Rules
• There must be one event node that has no incoming arcs (triggers): this is the first event
• Nodes must be connected (use MS Excel connectors).• Condition nodes trigger all outgoing arcs, if condition
is true • There are no “yes/no” branches in this language• You will need two condition nodes to model a branching
process (one for the “yes” and one for the “no”)• Events can be triggered only by other events,
through condition nodes and delay nodes
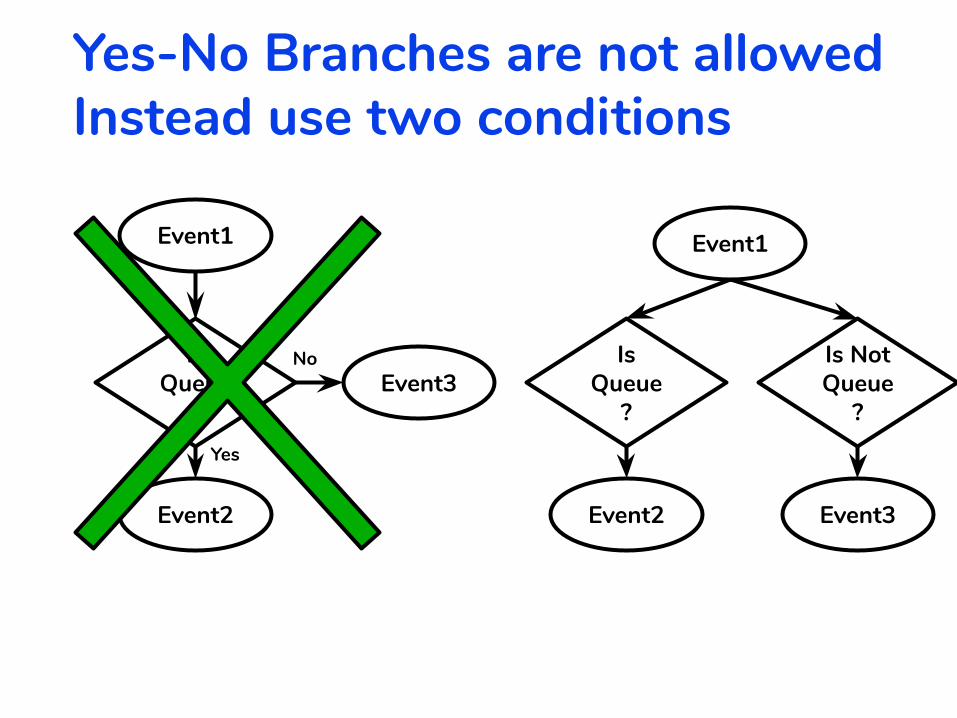
Yes-No Branches are not allowedInstead use two conditions
Event1
Event2
Is Queue
?Event3
Yes
No
Event1
Event2
Is Queue
?
Event3
Is Not Queue
?
In Recitation & HW, you will get hands-on experience • First, you will create an MS Excel style event
graph to model a problem
• Then, you will program and run the simulation model.

Overview
• Motivation: The Cookie Problem
• A Model of Behavior: Discrete Event Simulation
• A Graphical Language
• Programming a Simulation in MS Excel

Now we’ll focus on this particular Excel implementation
• Use Visual Basic for Applications (VBA) in Excel• Use simulation template file to start
• “SimplifiedCookie.xls”• Contains code to analyze graph and run simulation• Simplified model is already coded

Building the Graphical Model

Model in Excel

Use Tokens in Text Strings
• Template code ignores shape• Use tokens to indicate type of node
• = for events• + for delays• ? for conditions

Model With Tokens
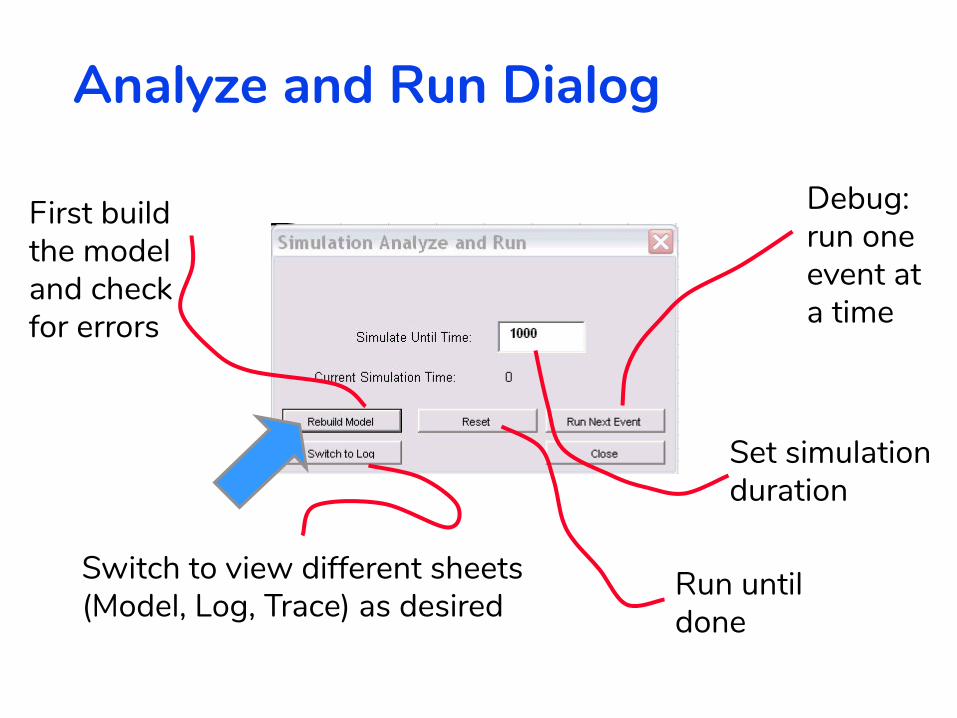
Analyze and Run Dialog
First build the model and check for errors
Debug: run one event at a time
Switch to view different sheets (Model, Log, Trace) as desired
Set simulation duration
Run until done

English Interpretation on Sheet “SimLog”
Coding the Components
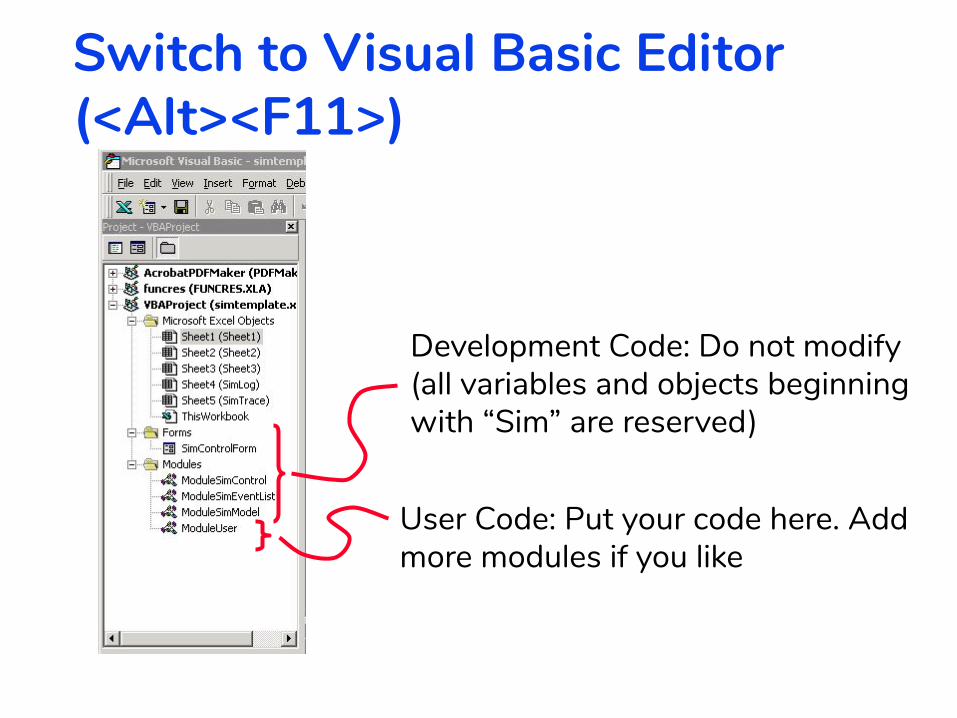
Switch to Visual Basic Editor (<Alt><F11>)
Development Code: Do not modify (all variables and objects beginning with “Sim” are reserved)
User Code: Put your code here. Add more modules if you like

You Write the Code:Declare Your State Variables
Q is the variable tracking the number of trays in the queue.
Global means it is available for use in other modules.
P is the number of trays in the oven.
'Declare your variables hereGlobal Q As IntegerGlobal P As IntegerGlobal CumulativeCompletions As Integer
CumulativeCompletions is a statistic we want to compute; it is not essential to the model.
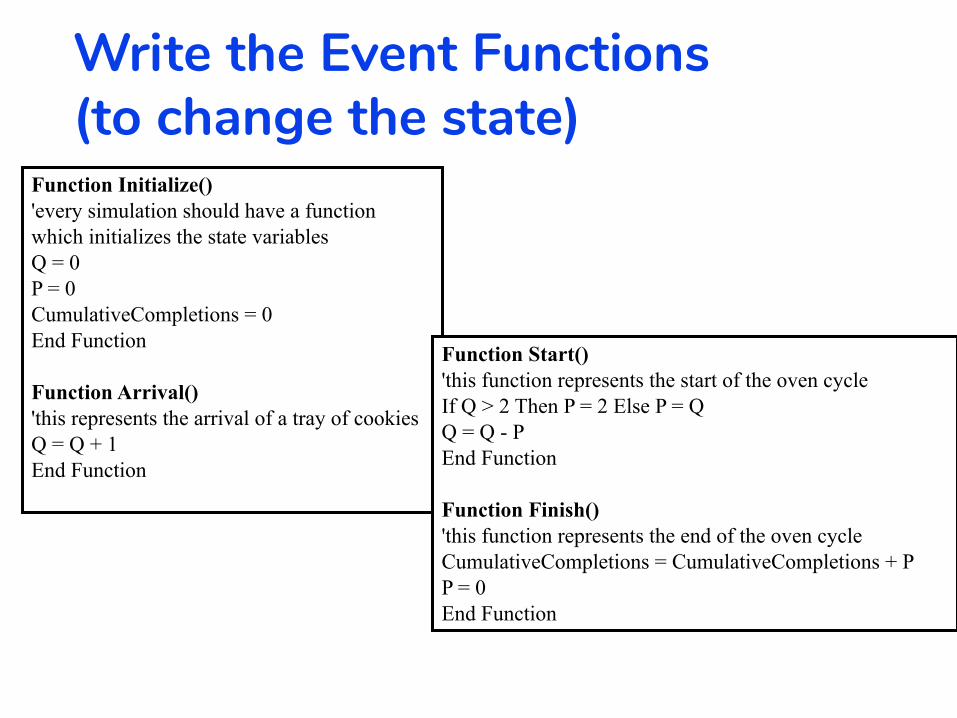
Write the Event Functions(to change the state)
Function Initialize()'every simulation should have a function which initializes the state variablesQ = 0P = 0CumulativeCompletions = 0End Function
Function Arrival()'this represents the arrival of a tray of cookiesQ = Q + 1End Function
Function Start()'this function represents the start of the oven cycleIf Q > 2 Then P = 2 Else P = QQ = Q - PEnd Function
Function Finish()'this function represents the end of the oven cycleCumulativeCompletions = CumulativeCompletions + PP = 0End Function

Write the Condition Functions: to Test the State
Function CookiesInQueue() As Integer'this illustrates the if...then...else statementIf Q > 0 Then CookiesInQueue = True Else CookiesInQueue = False End Function
Function OvenIsEmpty() As IntegerIf P = 0 Then OvenIsEmpty = True Else OvenIsEmpty = False End Function
Condition functions must return an integer: True = -1; False = 0
Question
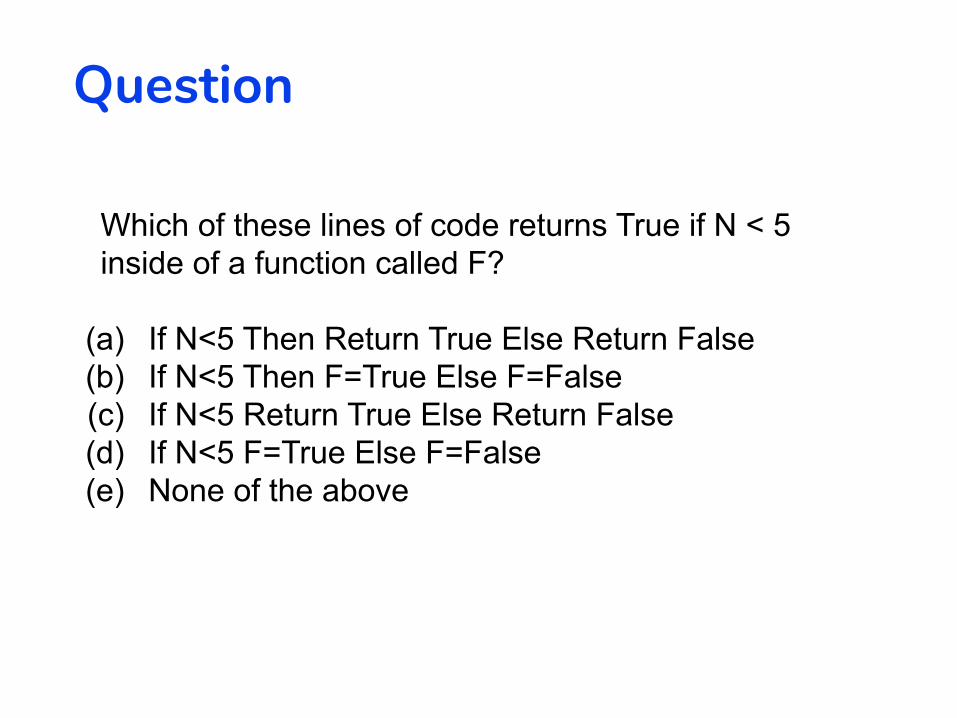
Which of these lines of code returns True if N < 5 inside of a function called F?
(a) If N<5 Then Return True Else Return False(b) If N<5 Then F=True Else F=False(c) If N<5 Return True Else Return False(d) If N<5 F=True Else F=False(e) None of the above

Question
Which of these lines of code returns True if N < 5 inside of a function called F?
(a) If N<5 Then Return True Else Return False(b) If N<5 Then F=True Else F=False(c) If N<5 Return True Else Return False(d) If N<5 F=True Else F=False(e) None of the above
Question
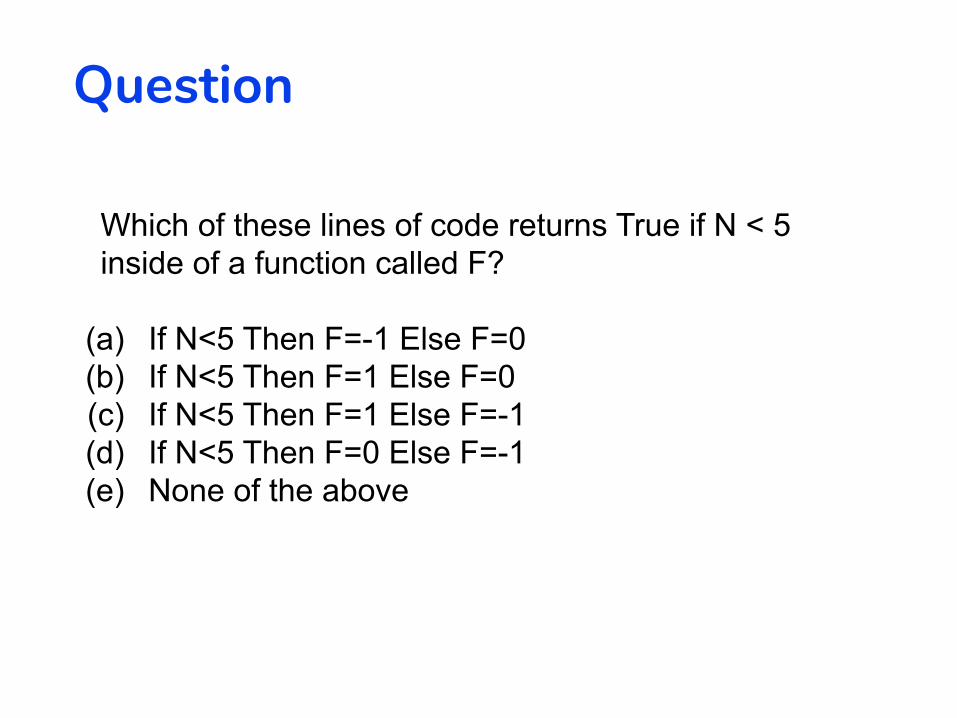
Which of these lines of code returns True if N < 5 inside of a function called F?
(a) If N<5 Then F=-1 Else F=0(b) If N<5 Then F=1 Else F=0(c) If N<5 Then F=1 Else F=-1(d) If N<5 Then F=0 Else F=-1(e) None of the above
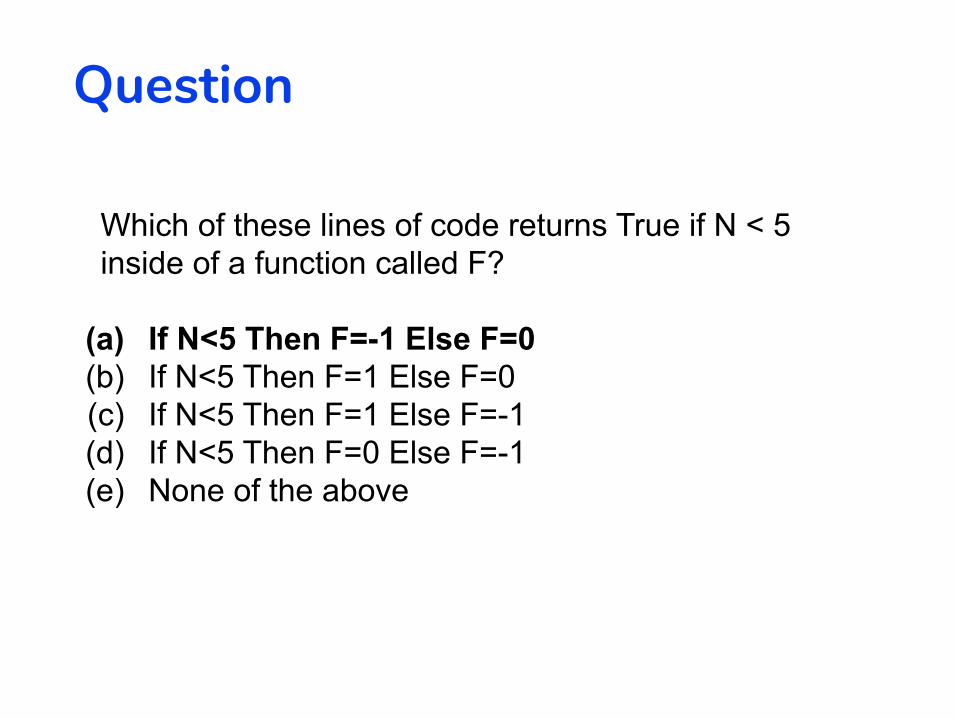
Question
Which of these lines of code returns True if N < 5 inside of a function called F?
(a) If N<5 Then F=-1 Else F=0(b) If N<5 Then F=1 Else F=0(c) If N<5 Then F=1 Else F=-1(d) If N<5 Then F=0 Else F=-1(e) None of the above

Write the Code to Generate Delays and Durations
Function OvenCycleTime() As Variant'functions that return a value for time should use the Variant data typeOvenCycleTime = 25End Function
Function InterarrivalTime() As Variant'this function returns a random interarrival timeDim duration As Variant 'local variable declaration; duration will be the length of the interarrival timeduration = 10.5 + Rnd() * 6.5 'duration will be a random number uniformly distributed between 10.5 and 17.InterarrivalTime = duration 'this is how you return a valueEnd Function

Question
How do I create a random variable that is Uniformly distributed between 5 and 7?
(a) duration = 5 + 7*Rnd()(b) duration = 7 + 5*Rnd()(c) duration = 5 + 2*Rnd()(d) duration = 2 + 5*Rnd()(e) None of the above

Debugging the Model

Debug: Step Through Model

Define Ranges to Store Variables

Write Code to Store Variables
Function OutputVariables()
Worksheets("Sheet1").Range("Number_of_Trays_in_Queue").Value = Q
Worksheets("Sheet1").Range("Number_of_Trays_in_Oven").Value = P
Worksheets("Sheet1").Range("Cumulative_Completions").Value = CumulativeCompletions
End Function
Your range names Your state variables
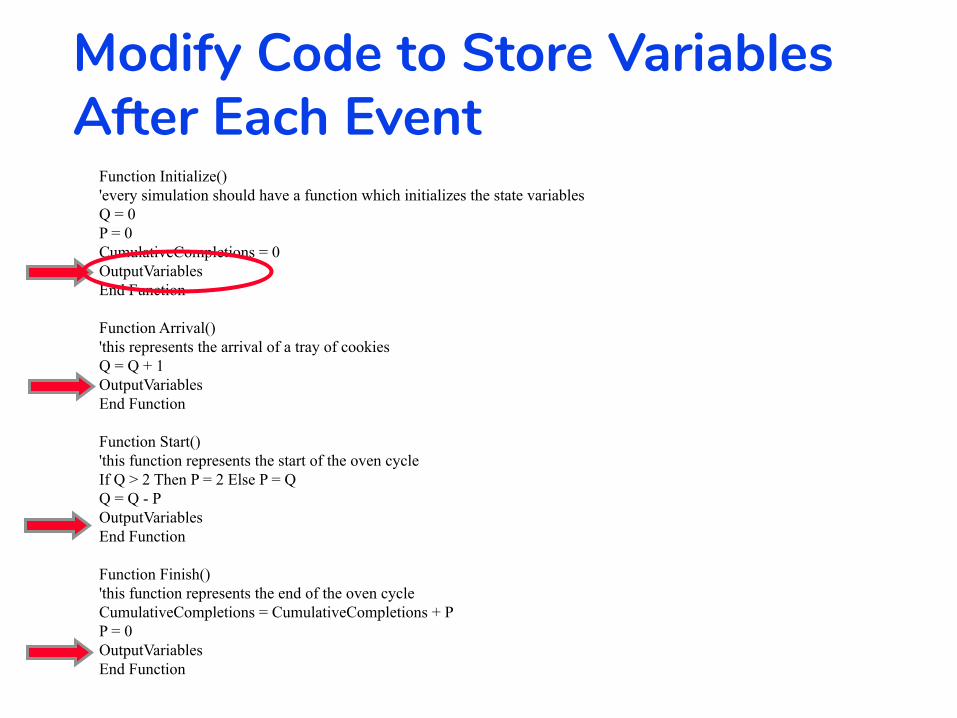
Function Initialize()'every simulation should have a function which initializes the state variablesQ = 0P = 0CumulativeCompletions = 0OutputVariablesEnd Function
Function Arrival()'this represents the arrival of a tray of cookiesQ = Q + 1OutputVariablesEnd Function
Function Start()'this function represents the start of the oven cycleIf Q > 2 Then P = 2 Else P = QQ = Q - POutputVariablesEnd Function
Function Finish()'this function represents the end of the oven cycleCumulativeCompletions = CumulativeCompletions + PP = 0OutputVariablesEnd Function
Modify Code to Store Variables After Each Event

Input/Output
• If you want to read input data from the spreadsheet (eg. Initial parameter settings), use ranges in a similar way.
• Now, single step through your simulation watching your variables change with each event.• The more variables you track, the easier it will be
to debug your model.

First Event
Second Event

Third Event

Fourth Event

Fifth Event
Running the Model,Collecting its Output

Creating a Trace
• A trace is a history of your state variables after each event
• The simulator automatically writes out whatever is in the range called “SimTraceRange” before and after each event• Stored on separate lines of sheet “SimTrace”
• It also writes out the labels found in the range called “SimTraceLabelRange” at the head of this list.
• You must define these two ranges.

Define Trace and Label Ranges

This is how a trace looks.
There are 2 rows for each event: begin and end. The 2nd row captures time spent in state (“Elapsed time”)

This is how a trace looks.
To see how a variable changes over time, make an X-Y scatter plot. Get X from “Current Time” and Y from the variable you want to plot (e.g., “Number of Trays in Queue”)

Analyzing the Output
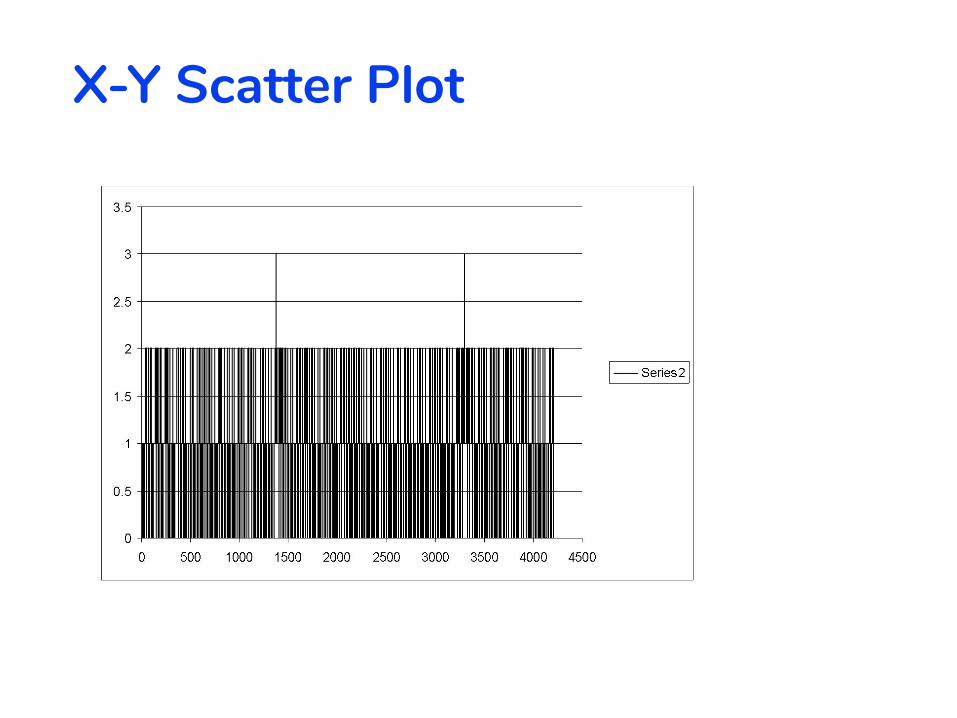
X-Y Scatter Plot
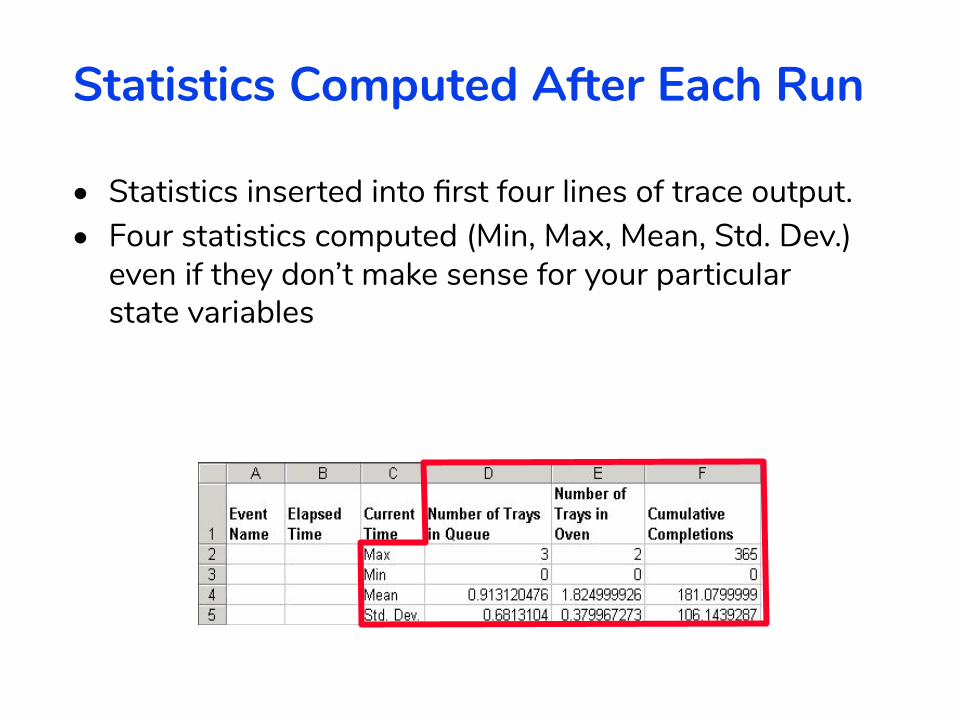
Statistics Computed After Each Run
• Statistics inserted into first four lines of trace output.• Four statistics computed (Min, Max, Mean, Std. Dev.)
even if they don’t make sense for your particular state variables
One Problem
• If you copy and paste a node or a connector, MS Excel does not give it a new name.
• Since the code uses the name of the autoshape to identify it, the code gets confused.
• Be sure to create each node from the shapes menu fresh, to make sure it has a unique name.

Overview
• Motivation: The Cookie Problem
• A Model of Behavior: Discrete Event Simulation
• A Graphical Language
• Programming a Simulation in MS Excel

Key Lessons
• Discrete event simulation is a flexible way to describe a system’s behavior.
• Basic simulations can be implemented in Excel, but require user coding in VBA.
• The structure of a simulation model can be described with an event graph.
• Building, running, and analyzing a simulation model is a structured process.
Related Documents


