Queueing Theory M/M/1 and M/M/m Queues

Welcome message from author
This document is posted to help you gain knowledge. Please leave a comment to let me know what you think about it! Share it to your friends and learn new things together.
Transcript

Queueing TheoryM/M/1 and M/M/m Queues

2K Analysis ExperimentsNumber of servers 1 and 3
Number of client machines 3
Instances of memtier per machine 1 (1 middleware) or 2 (2 middlewares)
Threads per memtier instance 2 (1 middleware) or 1 (2 middlewares)
Virtual clients per thread 32
Workload Write-only and Read-only
Multi-Get behavior N/A
Multi-Get size N/A
Number of middlewares 1 and 2
Worker threads per middleware 8 and 32
Repetitions 3 or more (at least 1 minute each)
Investigate the following parameters for Write-Only and Read-Only workloads:● Memcached servers : 1 and 3● Middlewares : 1 and 2● Worker threads per MW: 8 and 32
For each of the two workloads, what is the impact of these parameters on throughput, and response time?

Why queuing theory?
● Reason about the system● Analyze different components● Determine bottlenecks● Queues are a core aspect of complex systems
Art of Computer Systems Performance Analysis - p. 511

Little’s Law
● Relates the number of requests to the response time● Valid for any type of queueing system● Valid for systems in its entirety or for parts of the system
Number of requests in the system = arrival rate * mean response time
Number of requests in the queue = arrival rate * mean waiting time in the queue

What you are trying to predict?● Be clear what the input to the model is. This
depends on what you have measured!● Be clear what elements you want to predict● Explain which aspects of your system correspond
to the model and which ones do not● Consider all the data you have gathered
There are many options to proceed!Input Anything that has been measuredGoal Arrival rate, service rateOutput Length of the queues, number of request in
the system, graphs, behaviour, ... Art of Computer Systems Performance Analysis - p. 525

M/M/1 Queue
μλ
m=1
How can we determine this?
MeasuredGiven by the model

M/M/1 Queue
μλ
m=1
How can we determine this? 0 20 40 60 80 100 1200
10
20
30
40
50
60
70
load
thro
ug
hp
ut

M/M/1 Queue
μλ
m=1
How can we determine this? 0 20 40 60 80 100 1200
10
20
30
40
50
60
70
load
thro
ug
hp
ut
Find the maximum observed throughput ● Input to the model: λ, μ● How to measure the service rate μ?
– There are many approaches, depending what aspect of your system you want to model!
– E.g., use configuration that gives maximum throughput

M/M/1 Queue
μλ
m=1
How can we determine this? 0 20 40 60 80 100 1200
10
20
30
40
50
60
70
load
thro
ug
hp
ut
Find the maximum observed throughput
Service rate > arrival rate. ρ < 1.
● Input to the model: λ, μ● How to measure the service rate μ?
– There are many approaches, depending what aspect of your system you want to model!
– E.g., use configuration that gives maximum throughput

Example of computing the output ofM/M/m models

Example 1: M/M/2● Input: λ=9 req/s, m=2, μ=5 req/s● Utilization:● Average service time per worker:● Average number of requests in queue:● Average waiting time in queue:● Average response time:
5 r/s
5 r/s
9 r/s
m=2

Example 1: M/M/2● Input: λ=9 req/s, m=2, μ=5 req/s● Utilization: ρ = λ/(m*μ) = 90%● Average service time per worker:● Average number of requests in queue:● Average waiting time in queue:● Average response time:
5 r/s
5 r/s
9 r/s
m=2

Example 1: M/M/2● Input: λ=9 req/s, m=2, μ=5 req/s● Utilization: ρ = λ/(m*μ) = 90%● Average service time per worker:
E[s] = 0.20 s● Average number of requests in queue:
E[nq] = 7.674● Average waiting time in queue:● Average response time:
5 r/s
5 r/s
9 r/s
m=2
1/service rate (μ)

Example 1: M/M/2● Input: λ=9 req/s, m=2, μ=5 req/s● Utilization: ρ = λ/(m*μ) = 90%● Average service time per worker:
E[s] = 0.20 s● Average number of requests in queue:
E[nq] = 7.674● Average waiting time in queue:
E[wq] = 0.853 s● Average response time:
5 r/s
5 r/s
9 r/s
m=2
1/service rate (μ)
Mean number of req. in the system= arrival rate * mean response time
For the queue: E[nq] = λ * E[wq]Little’s Law!

Example 1: M/M/2● Input: λ=9 req/s, m=2, μ=5 req/s● Utilization: ρ = λ/(m*μ) = 90%● Average service time per worker:
E[s] = 0.20 s● Average number of requests in queue:
E[nq] = 7.674● Average waiting time in queue:
E[wq] = 0.853 s● Average response time:
E[w] = 0.853 + 0.20 = 1.053 s
5 r/s
5 r/s
9 r/s
m=2
1/service rate (μ)
Mean number of req. in the system= arrival rate * mean response time
For the queue: E[nq] = λ * E[wq]Little’s Law!
Total response time= queuing time + service time
Can also be computed as a functionof λ, μ, m, ρ.. (see book)

Example 1: M/M/2● Input: λ=9 req/s, m=2, μ=5 req/s● Utilization: ρ = λ/(m*μ) = 90%● Average service time per worker:
E[s] = 0.20 s● Average number of requests in queue:
E[nq] = 7.674● Average waiting time in queue:
E[wq] = 0.853 s● Average response time:
E[w] = 0.853 + 0.20 = 1.053 s
5 r/s
5 r/s
9 r/s
m=2
1/service rate (μ)
Mean number of req. in the system= arrival rate * mean response time
For the queue: E[nq] = λ * E[wq]Little’s Law!
Total response time= queuing time + service time In your report, you need to
compare the output of the modelto your measurements.Explain the difference!Can also be computed as a function
of λ, μ, m, ρ.. (see book)

Example 2: M/M/4● Input: λ=9 req/s, m=4, μ=5 req/s● Utilization: ● Average service time per worker:● Average number of requests in queue:● Average waiting time in queue:● Average response time:
5 r/s5 r/s9 r/s
m=4
What changes for m=4?
5 r/s5 r/s

Example 2: M/M/4● Input: λ=9 req/s, m=4, μ=5 req/s● Utilization: ρ = λ/(m*μ) = 45%● Average service time per worker:
E[s] = 0.20 s● Average number of requests in queue:● Average waiting time in queue:● Average response time:
5 r/s5 r/s9 r/s
m=4
What changes for m=4?
5 r/s5 r/s

Example 2: M/M/4● Input: λ=9 req/s, m=4, μ=5 req/s● Utilization: ρ = λ/(m*μ) = 45%● Average service time per worker:
E[s] = 0.20 s● Average number of requests in queue:
E[nq] = 0.105● Average waiting time in queue:
E[wq] = 0.012 s● Average response time:
E[w] = 0.012 + 0.20 = 0.212 s
5 r/s5 r/s9 r/s
m=4
What changes for m=4?
5 r/s5 r/sLower
Lower
Lower
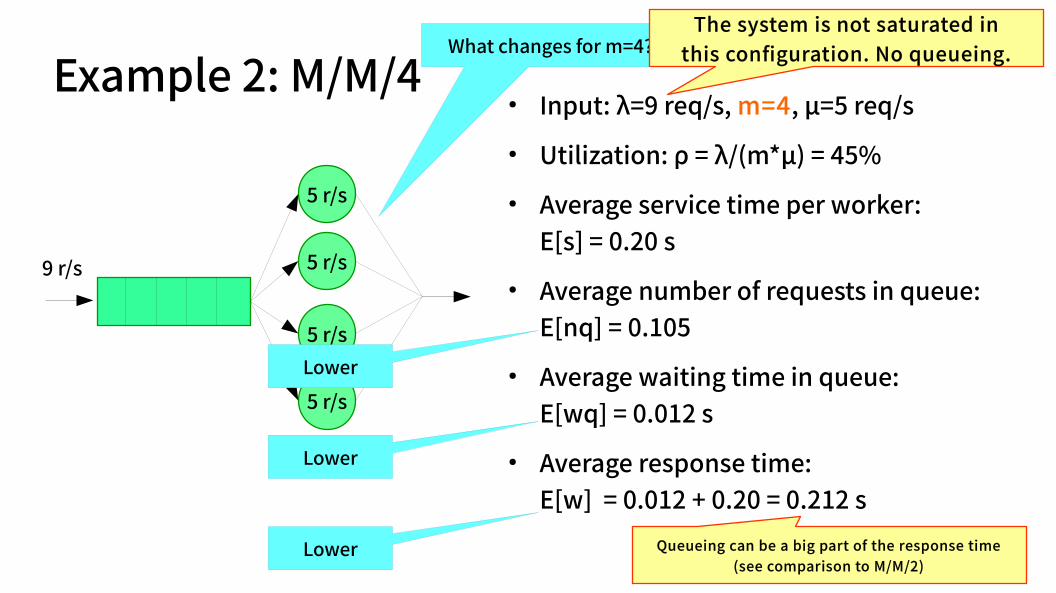
The system is not saturated inthis configuration. No queueing.
Queueing can be a big part of the response time(see comparison to M/M/2)

Example 3: How do these systems differ?5 r/s5 r/s
18 r/s5 r/s5 r/s
λ=9 req/s, m=2, μ=5 req/s λ=18 req/s, m=4, μ=5 req/sUtilization
Service timeQueue LengthQueuing Time
Response Time
5 r/s9 r/s
5 r/s

Example 3: How do these systems differ?5 r/s5 r/s
18 r/s5 r/s5 r/s
λ=9 req/s, m=2, μ=5 req/s λ=18 req/s, m=4, μ=5 req/sUtilization 90% 90%
Service timeQueue LengthQueuing Time
Response Time
5 r/s9 r/s
5 r/s
Both systems have a 90% utilization Both systems have a 90% utilization

Example 3: How do these systems differ?5 r/s5 r/s
18 r/s5 r/s5 r/s
λ=9 req/s, m=2, μ=5 req/s λ=18 req/s, m=4, μ=5 req/sUtilization 90% 90%
Service time 0.200 s 0.200 sQueue LengthQueuing Time
Response Time
5 r/s9 r/s
5 r/s

Example 3: How do these systems differ?5 r/s5 r/s
18 r/s5 r/s5 r/s
λ=9 req/s, m=2, μ=5 req/s λ=18 req/s, m=4, μ=5 req/sUtilization 90% 90%
Service time 0.200 s 0.200 sQueue Length 7.67 requests 7.10 requestsQueuing Time
Response Time
5 r/s9 r/s
5 r/s

Example 3: How do these systems differ?5 r/s5 r/s
18 r/s5 r/s5 r/s
λ=9 req/s, m=2, μ=5 req/s λ=18 req/s, m=4, μ=5 req/sUtilization 90% 90%
Service time 0.200 s 0.200 sQueue Length 7.67 requests 7.10 requestsQueuing Time 0.853 s 0.394 s
Response Time
5 r/s9 r/s
5 r/s

Example 3: How do these systems differ?5 r/s5 r/s
18 r/s5 r/s5 r/s
λ=9 req/s, m=2, μ=5 req/s λ=18 req/s, m=4, μ=5 req/sUtilization 90% 90%
Service time 0.200 s 0.200 sQueue Length 7.67 requests 7.10 requestsQueuing Time 0.853 s 0.394 s
Response Time 1.053 s 0.594 s
5 r/s9 r/s
5 r/s

Example 3: How do these systems differ?5 r/s5 r/s
18 r/s5 r/s5 r/s
λ=9 req/s, m=2, μ=5 req/s λ=18 req/s, m=4, μ=5 req/sUtilization 90% 90%
Service time 0.200 s 0.200 sQueue Length 7.67 requests 7.10 requestsQueuing Time 0.853 s 0.394 s
Response Time 1.053 s 0.594 s
5 r/s9 r/s
5 r/s
What would be better?2x M/M/2 or 1x M/M/4
M/M/4 has less queueing!

● We updated the VMs-template on the website to minimize VMs cost in Azure.● Look at the report in its entirety
– Analysis is about the same system in every section– Make a list of all the measurements you need– Write down all the configurations you need to test
● Next week: Network of queues– Afterwards: Q&A sessions– Office hours (Details to be announced next week)
Related Documents


