Questions on Critical Path Analysis 1: Construct a network diagram from the information below and mark the critical path Activity Description Preceded by Duration (days) A Send out invitations and wait for replies --- 7 B Research and book suitable venue based on numbers A 2 C Book entertainment (music and awards ceremony) B 5 D Order wines and cake for delivery B 7 E Set up hall and stage for the party C, D 3 2: Construct a network diagram from the information below and mark the critical path Task Preceded by Duration (days) A ---- 2 B A 2 C A 3 D B,C 2 3: Construct a network diagram from the information below and mark the critical path Task Preceded by Estimated time (weeks) A --- 1 B --- 3

Welcome message from author
This document is posted to help you gain knowledge. Please leave a comment to let me know what you think about it! Share it to your friends and learn new things together.
Transcript

Questions on Critical Path Analysis
1: Construct a network diagram from the information below and mark the critical path
Activity Description Preceded by Duration (days)A Send out
invitations and wait for replies
--- 7
B Research and book suitable venue based on numbers
A 2
C Book entertainment (music and awards ceremony)
B 5
D Order wines and cake for delivery
B 7
E Set up hall and stage for the party
C, D 3
2: Construct a network diagram from the information below and mark the critical path
Task Preceded by Duration (days)A ---- 2B A 2C A 3D B,C 2
3: Construct a network diagram from the information below and mark the critical path
Task Preceded by Estimated time (weeks)A --- 1B --- 3C B 2D C,A 3E D 2F D 3G E,F 2
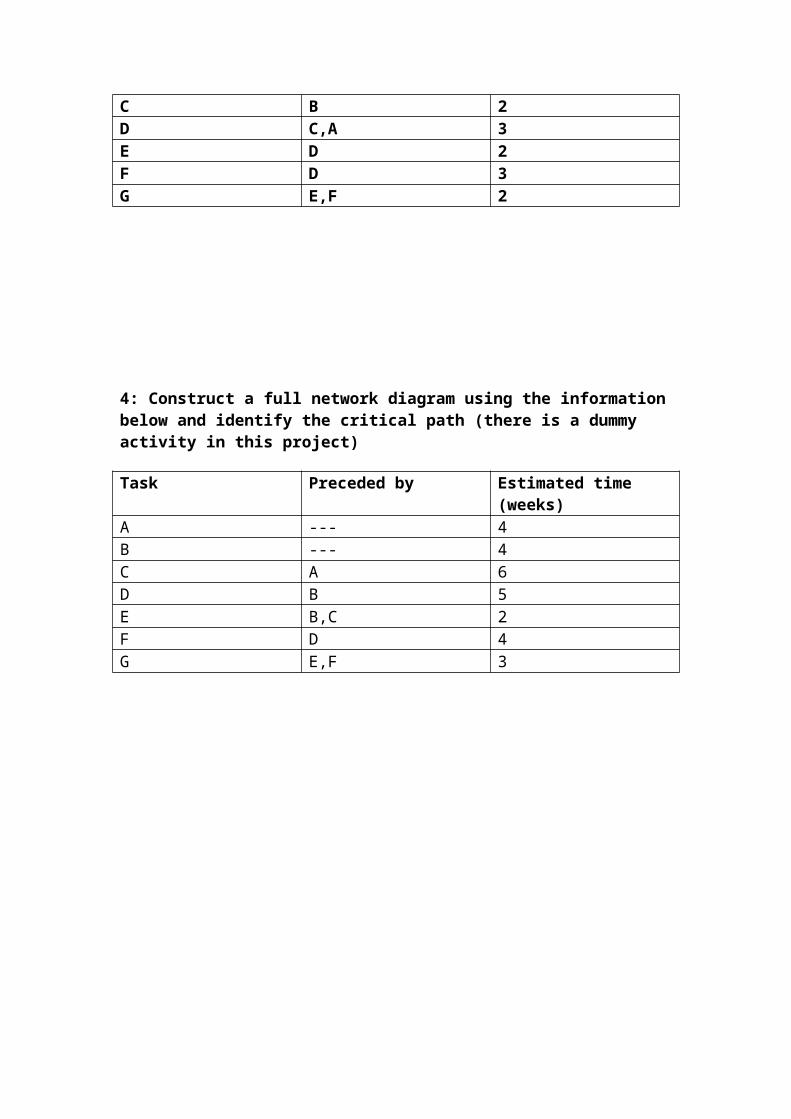
4: Construct a full network diagram using the information below and identify the critical path (there is a dummy activity in this project)
Task Preceded by Estimated time (weeks)A --- 4B --- 4C A 6D B 5E B,C 2F D 4G E,F 3
Critical Path Analysis
Step 1
The first step to using critical path analysis is to set out the activities that must be
completed in order for the project to be completed. If we take a simple game
framework it might look something like this:
[A] Graphics Engine
[B] Sound Engine
[C] Music Engine
[D] Input Engine
[E] Gameplay/general programming
[F] Physics
[G] 2D Artwork
[H] 3D Artwork
[I] Sound effects
[J] Music recording
[K] Level Design
Anyone who's completed a game will probably realise that there's much more to it
than the above list, but this is only an example – and it can easily be extended. You
could go as far as doing a separate analysis for the development of the graphics
engine. It's only limited to the detail that you include.
Step 2
Now that you know what activities you must complete in order to complete the
project you need to decide what dependencies there are. This will involve creating a
hierarchy for the activities – what activities must be completed before you can start
this activity? Notice that the original list (in Step 1) has a letter for each activity. This
is just for convenience. Later on when you start drawing out diagrams it'll get a little
crowded and complicated to put the complete activity name in, so we're referring to
them by letter.

[A] depends on: no other activity
[B] depends on: I
[C] depends on: J
[D] depends on: A
[E] depends on: B, C, D
[F] depends on: E
[G] depends on: no other activity
[H] depends on: G
[I] depends on: no other activity
[J] depends on: no other activity
[K] depends on: F
The above list is called the dependency list. Notice that [K] only depends on [F]. You
may be thinking that level design doesn't only require physics to be completed – it
requires almost everything else to be completed as well. But if you look closely, [F]
requires that [E] is completed, and [E] can't be completed until almost everything else
has been. Therefore [F] effectively implies that everything before it has been
completed – in this case [E], so Level Design (K) does actually require that (almost)
everything else is completed.
Step 3
In this step we must draw a graph.
This graph can also be referred to as a network - a series of points (nodes or vertices)
connected by lines (arcs or edges). Nodes represent events, positions (of buildings for
example) and the edges represent a path between them (a road for example).These
edges will have an arrowhead on them indicating that you can only 'travel' in that
direction along the edge. Finally, a couple of conventions: 1) where possible edges
should not cross each other, 2) Critical Path Analysis graphs start on the left and the
finish is on the right.
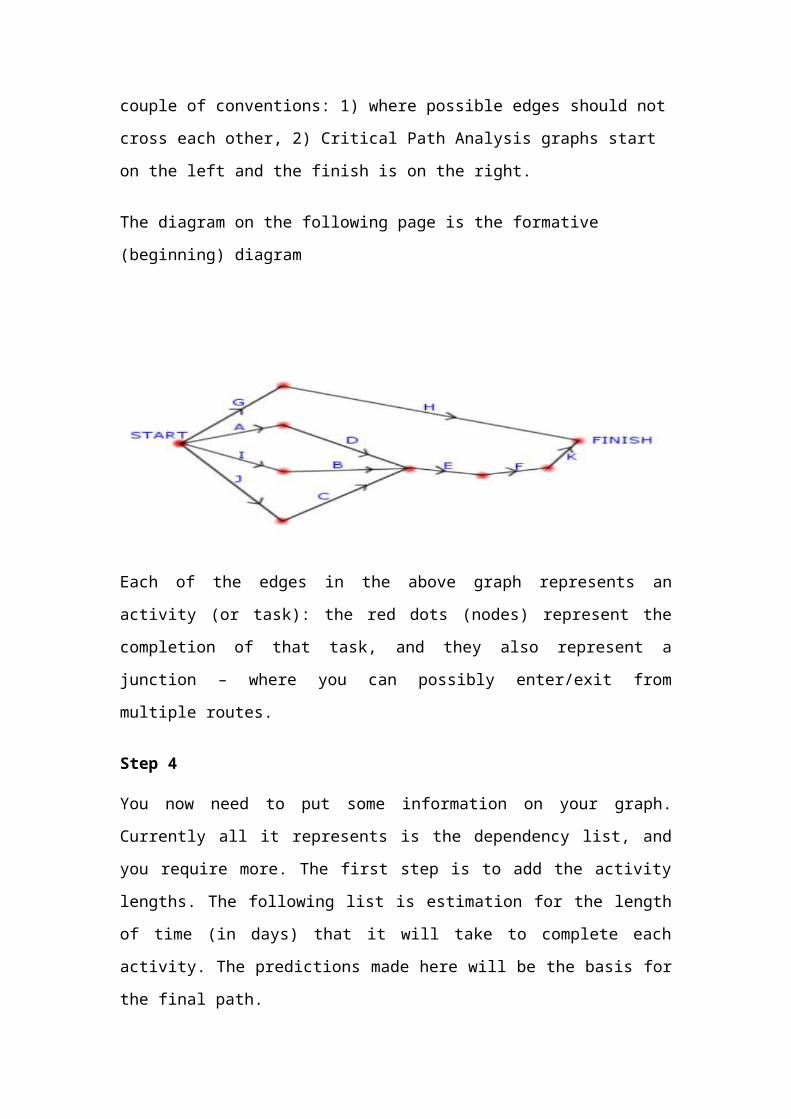
The diagram on the following page is the formative (beginning) diagram
Each of the edges in the above graph represents an activity (or task): the red dots
(nodes) represent the completion of that task, and they also represent a junction –
where you can possibly enter/exit from multiple routes.
Step 4
You now need to put some information on your graph. Currently all it represents is
the dependency list, and you require more. The first step is to add the activity lengths.
The following list is estimation for the length of time (in days) that it will take to
complete each activity. The predictions made here will be the basis for the final path.
[A] Graphics Engine = 14 days
[B] Sound Engine = 5 days
[C] Music Engine = 5 days
[D] Input Engine = 10 days
[E] Gameplay/general programming = 31 days
[F] Physics = 7 days
[G] 2D Artwork = 14 days
[H] 3D Artwork = 21 days
[I] Sound effects = 14 days
[J] Music recording = 9 days
[K] Level Design = 21 days
Now that you have some times you need to add them to your network. By convention
they go in brackets after the activity label. The graph now looks like this:
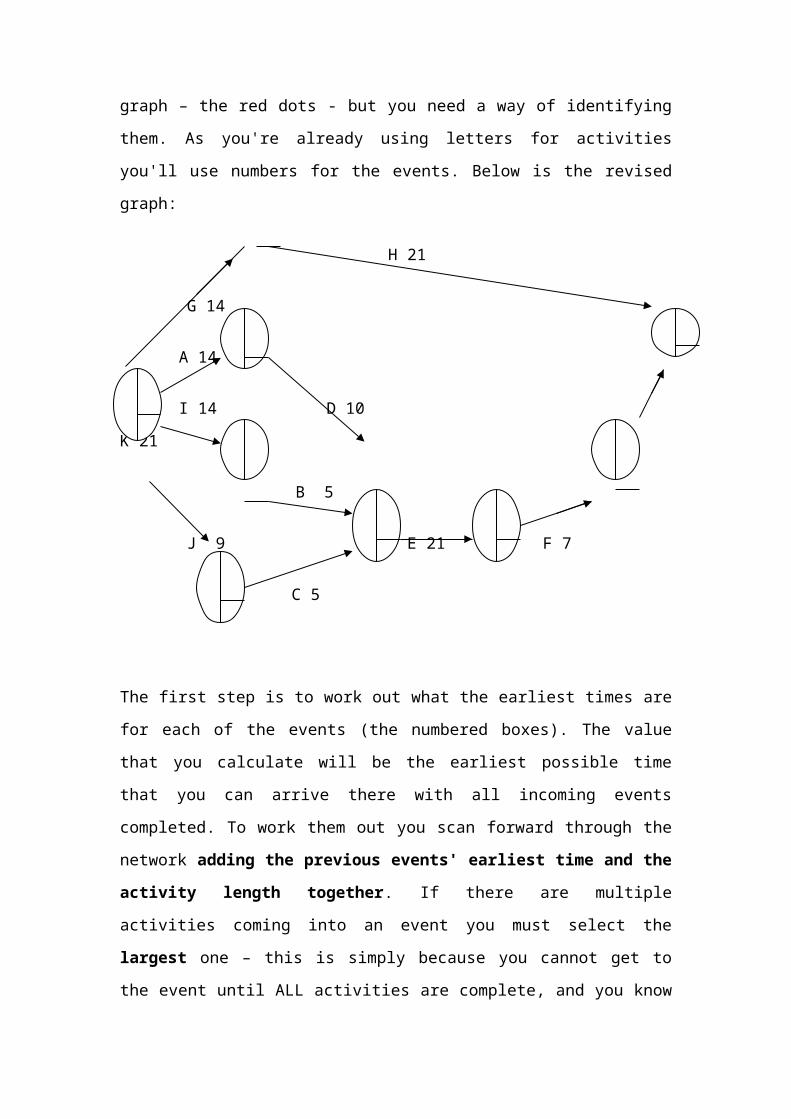
Step 5
There is one final thing that you must do (to make it easier for you), which is to add in
events. So far you've just added activities. Events are actually already in the graph –
the red dots - but you need a way of identifying them. As you're already using letters
for activities you'll use numbers for the events. Below is the revised graph:
H 21
G 14
A 14
I 14 D 10 K 21
B 5
J 9 E 21 F 7
C 5
The first step is to work out what the earliest times are for each of the events (the
numbered boxes). The value that you calculate will be the earliest possible time that

you can arrive there with all incoming events completed. To work them out you scan
forward through the network adding the previous events' earliest time and the
activity length together. If there are multiple activities coming into an event you
must select the largest one – this is simply because you cannot get to the event until
ALL activities are complete, and you know all activities are complete when the one
with the longest duration is complete.
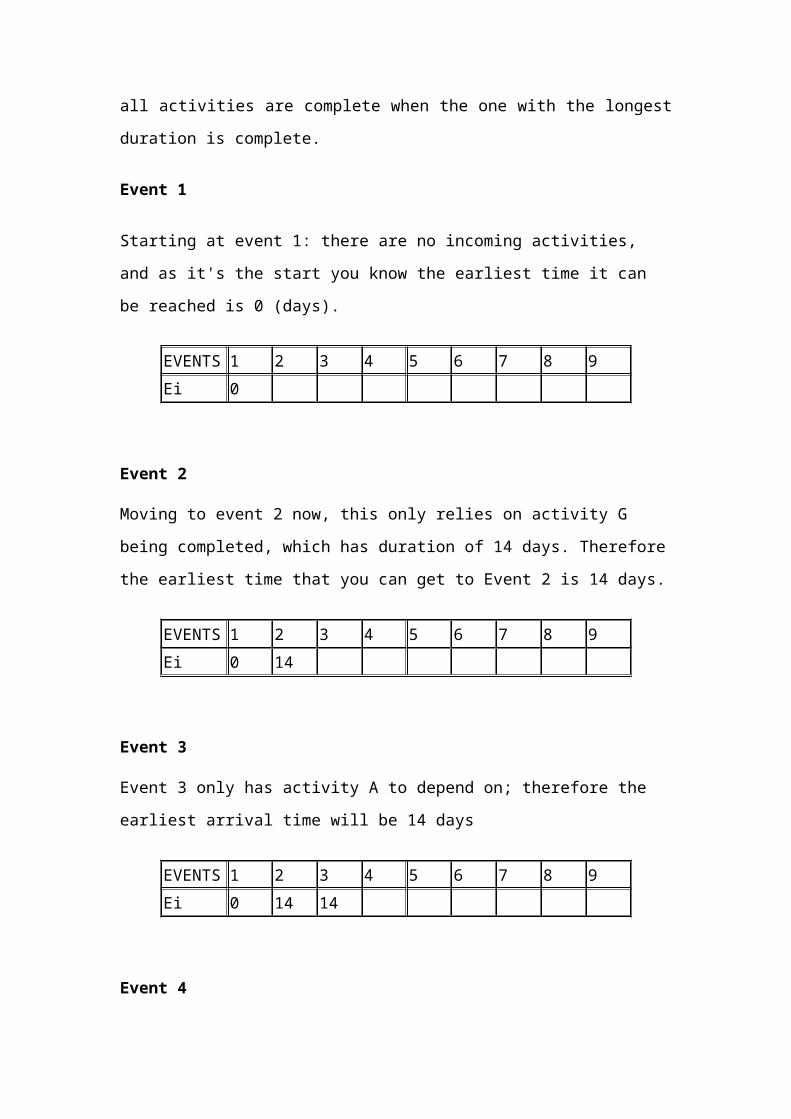
Event 1
Starting at event 1: there are no incoming activities, and as it's the start you know the
earliest time it can be reached is 0 (days).
EVENTS 1 2 3 4 5 6 7 8 9Ei 0
Event 2
Moving to event 2 now, this only relies on activity G being completed, which has
duration of 14 days. Therefore the earliest time that you can get to Event 2 is 14 days.
EVENTS 1 2 3 4 5 6 7 8 9Ei 0 14
Event 3
Event 3 only has activity A to depend on; therefore the earliest arrival time will be 14
days
EVENTS 1 2 3 4 5 6 7 8 9Ei 0 14 14
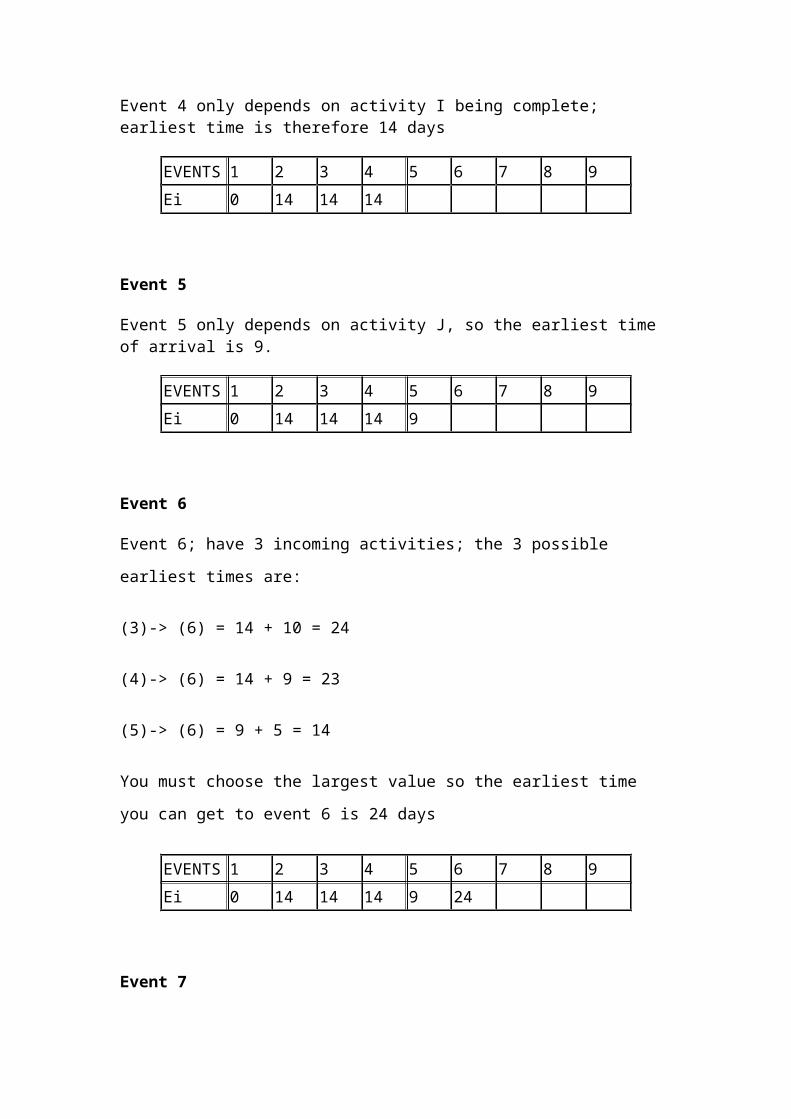
Event 4
Event 4 only depends on activity I being complete; earliest time is therefore 14 days
EVENTS 1 2 3 4 5 6 7 8 9Ei 0 14 14 14
Event 5
Event 5 only depends on activity J, so the earliest time of arrival is 9.
EVENTS 1 2 3 4 5 6 7 8 9Ei 0 14 14 14 9
Event 6
Event 6; have 3 incoming activities; the 3 possible earliest times are:
(3)-> (6) = 14 + 10 = 24
(4)-> (6) = 14 + 9 = 23
(5)-> (6) = 9 + 5 = 14
You must choose the largest value so the earliest time you can get to event 6 is 24
days
EVENTS 1 2 3 4 5 6 7 8 9Ei 0 14 14 14 9 24
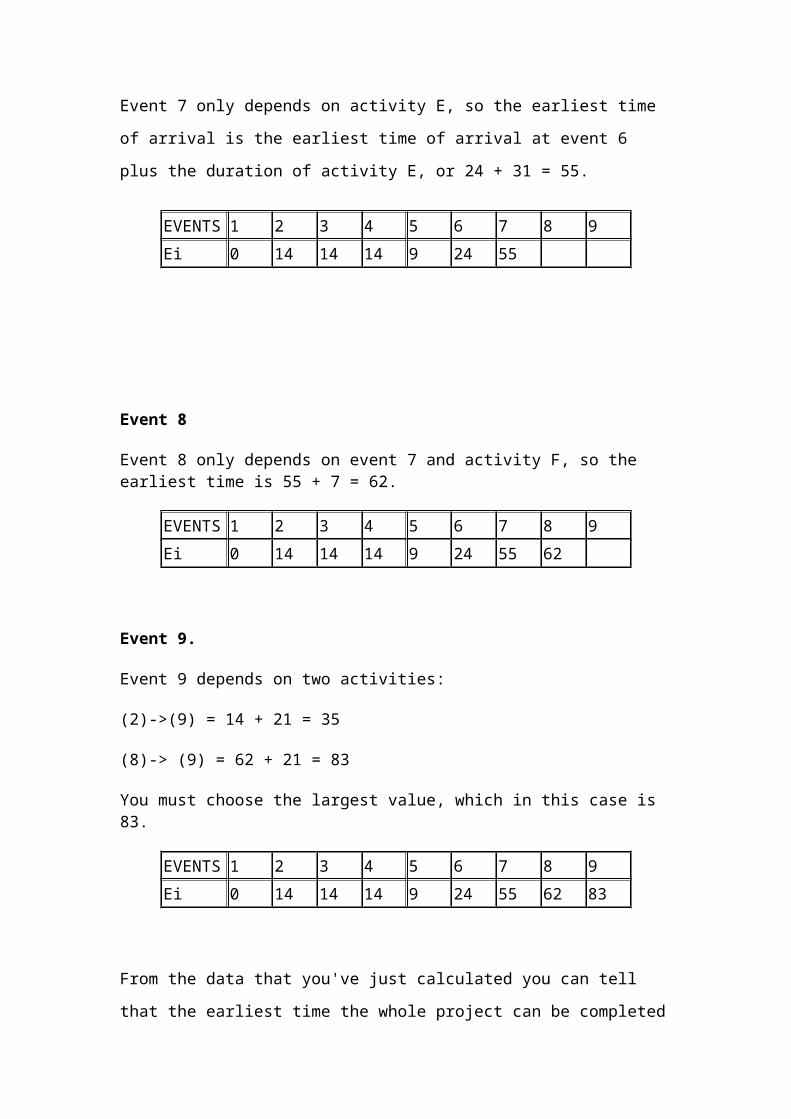
Event 7
Event 7 only depends on activity E, so the earliest time of arrival is the earliest time of
arrival at event 6 plus the duration of activity E, or 24 + 31 = 55.
EVENTS 1 2 3 4 5 6 7 8 9Ei 0 14 14 14 9 24 55
Event 8
Event 8 only depends on event 7 and activity F, so the earliest time is 55 + 7 = 62.
EVENTS 1 2 3 4 5 6 7 8 9Ei 0 14 14 14 9 24 55 62
Event 9.
Event 9 depends on two activities:
(2)->(9) = 14 + 21 = 35
(8)-> (9) = 62 + 21 = 83
You must choose the largest value, which in this case is 83.
EVENTS 1 2 3 4 5 6 7 8 9Ei 0 14 14 14 9 24 55 62 83
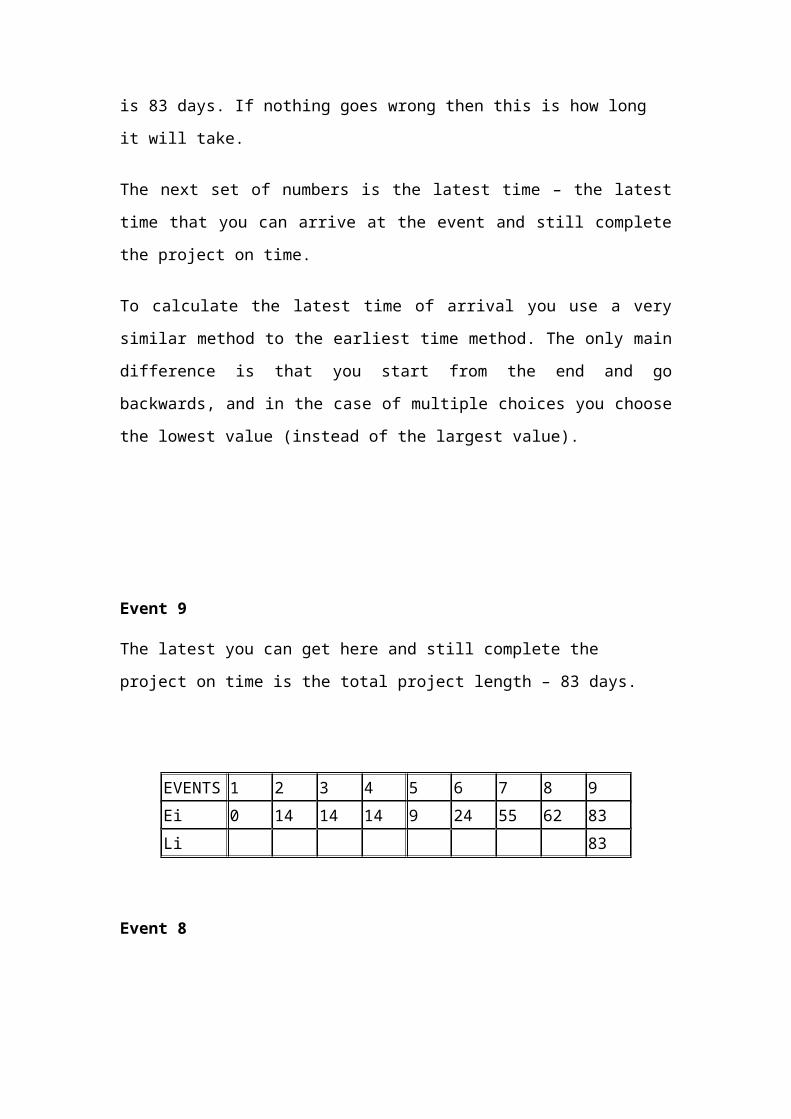
From the data that you've just calculated you can tell that the earliest time the whole
project can be completed is 83 days. If nothing goes wrong then this is how long it
will take.
The next set of numbers is the latest time – the latest time that you can arrive at the
event and still complete the project on time.
To calculate the latest time of arrival you use a very similar method to the earliest
time method. The only main difference is that you start from the end and go
backwards, and in the case of multiple choices you choose the lowest value (instead
of the largest value).
Event 9
The latest you can get here and still complete the project on time is the total project
length – 83 days.
EVENTS 1 2 3 4 5 6 7 8 9Ei 0 14 14 14 9 24 55 62 83Li 83
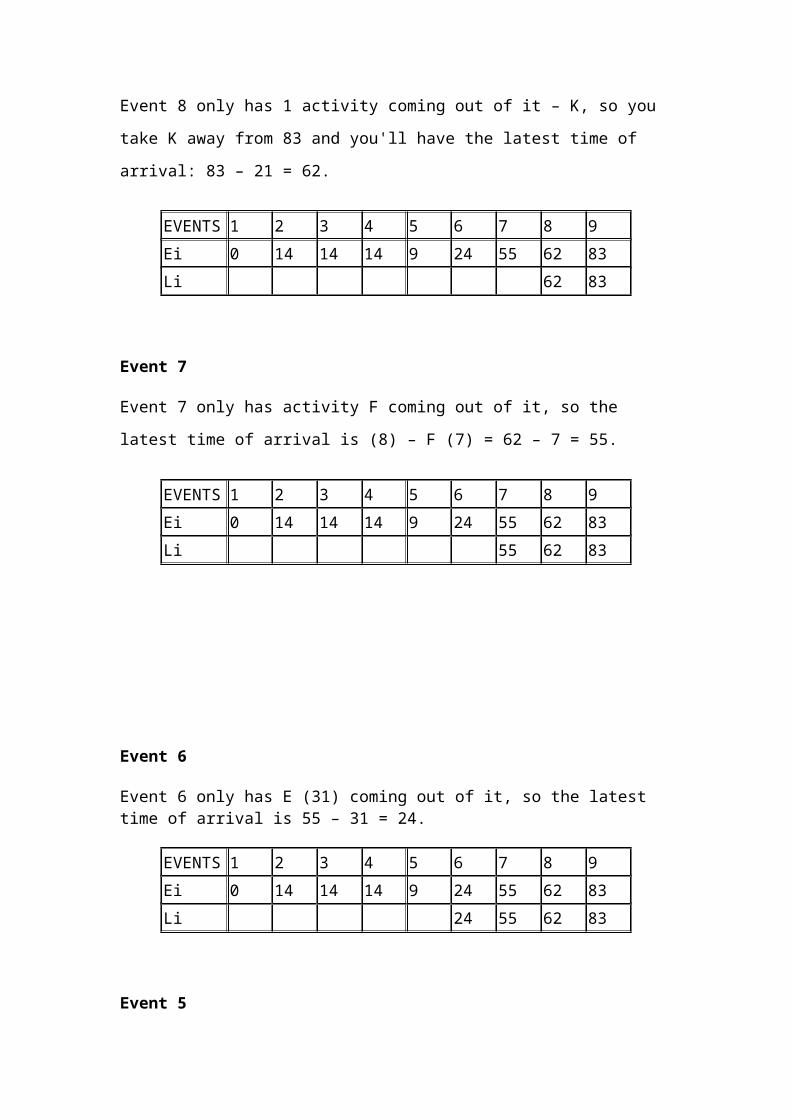
Event 8
Event 8 only has 1 activity coming out of it – K, so you take K away from 83 and
you'll have the latest time of arrival: 83 – 21 = 62.
EVENTS 1 2 3 4 5 6 7 8 9Ei 0 14 14 14 9 24 55 62 83Li 62 83
Event 7
Event 7 only has activity F coming out of it, so the latest time of arrival is (8) – F (7)
= 62 – 7 = 55.
EVENTS 1 2 3 4 5 6 7 8 9Ei 0 14 14 14 9 24 55 62 83Li 55 62 83
Event 6
Event 6 only has E (31) coming out of it, so the latest time of arrival is 55 – 31 = 24.
EVENTS 1 2 3 4 5 6 7 8 9Ei 0 14 14 14 9 24 55 62 83Li 24 55 62 83
Event 5
Now event 5, which only has activity C (5) coming out of it. The latest time of arrival
is therefore 24 – 5 = 19.
EVENTS 1 2 3 4 5 6 7 8 9Ei 0 14 14 14 9 24 55 62 83Li 19 24 55 62 83
Event 4
Event 4 only has B (5) coming out of it, the latest time of arrival is 24 – 5 = 19.
EVENTS 1 2 3 4 5 6 7 8 9Ei 0 14 14 14 9 24 55 62 83Li 19 19 24 55 62 83
Event 3
Event 3 only has activity D (10) coming out of it, so the latest time of arrival is 24 – 10 = 14.
EVENTS 1 2 3 4 5 6 7 8 9Ei 0 14 14 14 9 24 55 62 83Li 14 19 19 24 55 62 83
Event 2
Event 2 only has activity H (21) coming out of it, so the latest time of arrival is 83 – 21 = 62.
EVENTS 1 2 3 4 5 6 7 8 9
Ei 0 14 14 14 9 24 55 62 83Li 62 14 19 19 24 55 62 83
Event 1
Finally, Event 1 will always be 0. You can work it out if you want!!!
EVENTS 1 2 3 4 5 6 7 8 9Ei 0 14 14 14 9 24 55 62 83Li 0 62 14 19 19 24 55 62 83
Step 6
Earliest Time of Arrival: This indicates that if you were very quick and worked
hard, then this is the earliest time that you could get to that event.
Latest Time of Arrival: This is more important as far as the analysis goes. The value
you have for the event indicates the latest time of arrival while still completing the
project on time. Take event (2) for example, you could get there by day 14, yet you
could put it off until day 62. If you start it before day 14 any other dependencies won't
be ready (therefore it's impossible). If we start after day 62 the project will be
delayed; yet we can start on any day between 14 and 62 and not hold the project up at
all.
You have further calculations called the total float, free float and the slack. Float is for
activities and slack is for events.
Slack
Slack = Latest Time – Earliest Time
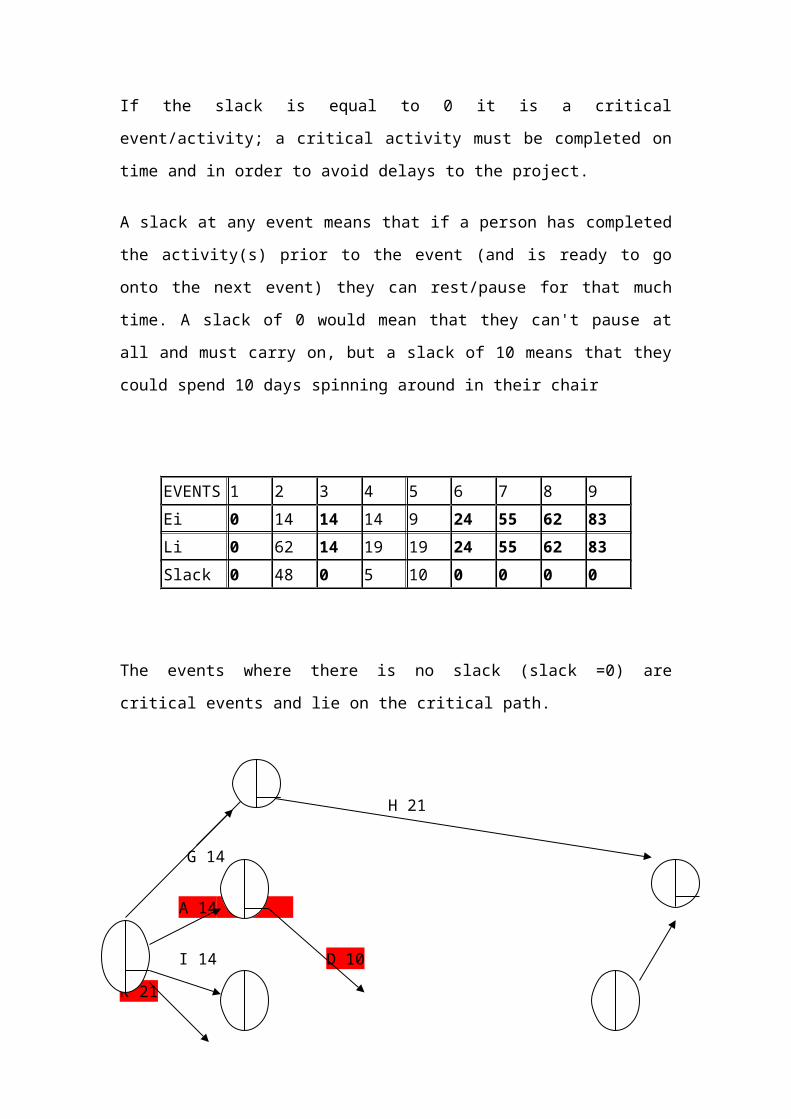
If the slack is equal to 0 it is a critical event/activity; a critical activity must be
completed on time and in order to avoid delays to the project.
A slack at any event means that if a person has completed the activity(s) prior to the
event (and is ready to go onto the next event) they can rest/pause for that much time.
A slack of 0 would mean that they can't pause at all and must carry on, but a slack of
10 means that they could spend 10 days spinning around in their chair
EVENTS 1 2 3 4 5 6 7 8 9Ei 0 14 14 14 9 24 55 62 83Li 0 62 14 19 19 24 55 62 83Slack 0 48 0 5 10 0 0 0 0
The events where there is no slack (slack =0) are critical events and lie on the critical
path.
H 21
G 14
A 14
I 14 D 10 K 21
B 5
J 9 E 21 F 7
C 5
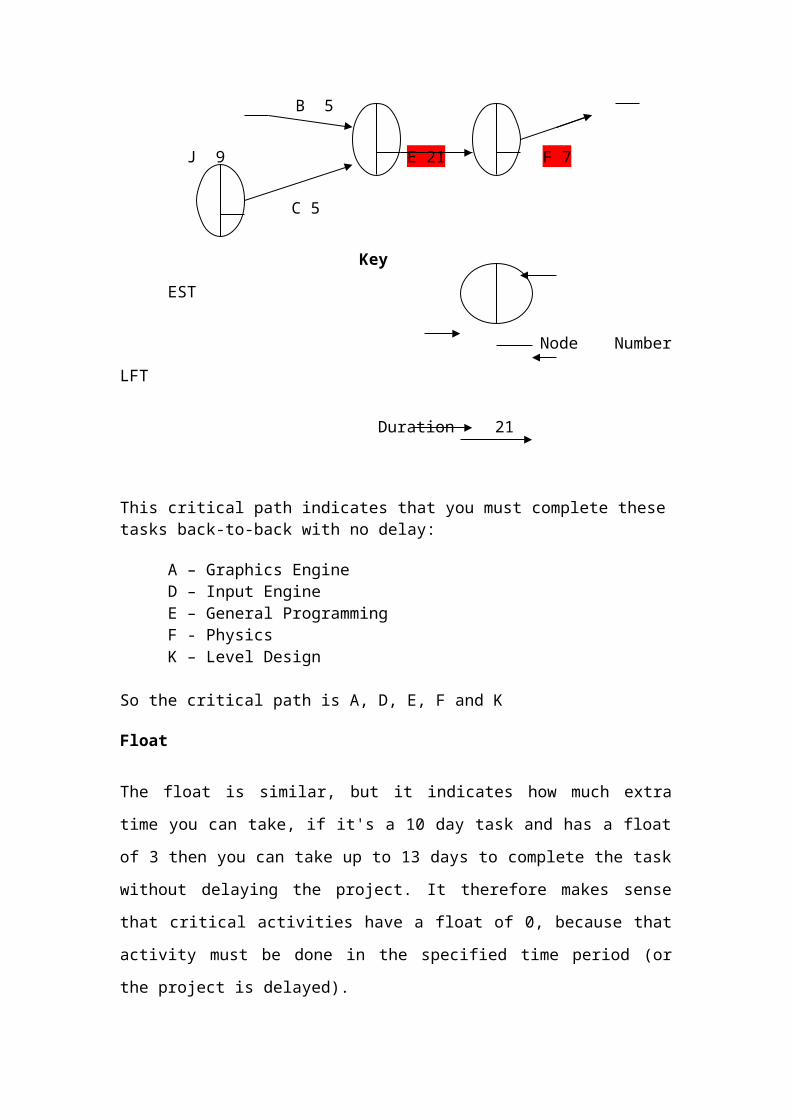
Key EST
Node Number LFT
Duration 21
This critical path indicates that you must complete these tasks back-to-back with no delay:
A – Graphics EngineD – Input Engine

E – General ProgrammingF - PhysicsK – Level Design
So the critical path is A, D, E, F and K
Float
The float is similar, but it indicates how much extra time you can take, if it's a 10 day
task and has a float of 3 then you can take up to 13 days to complete the task without
delaying the project. It therefore makes sense that critical activities have a float of 0,
because that activity must be done in the specified time period (or the project is
delayed).
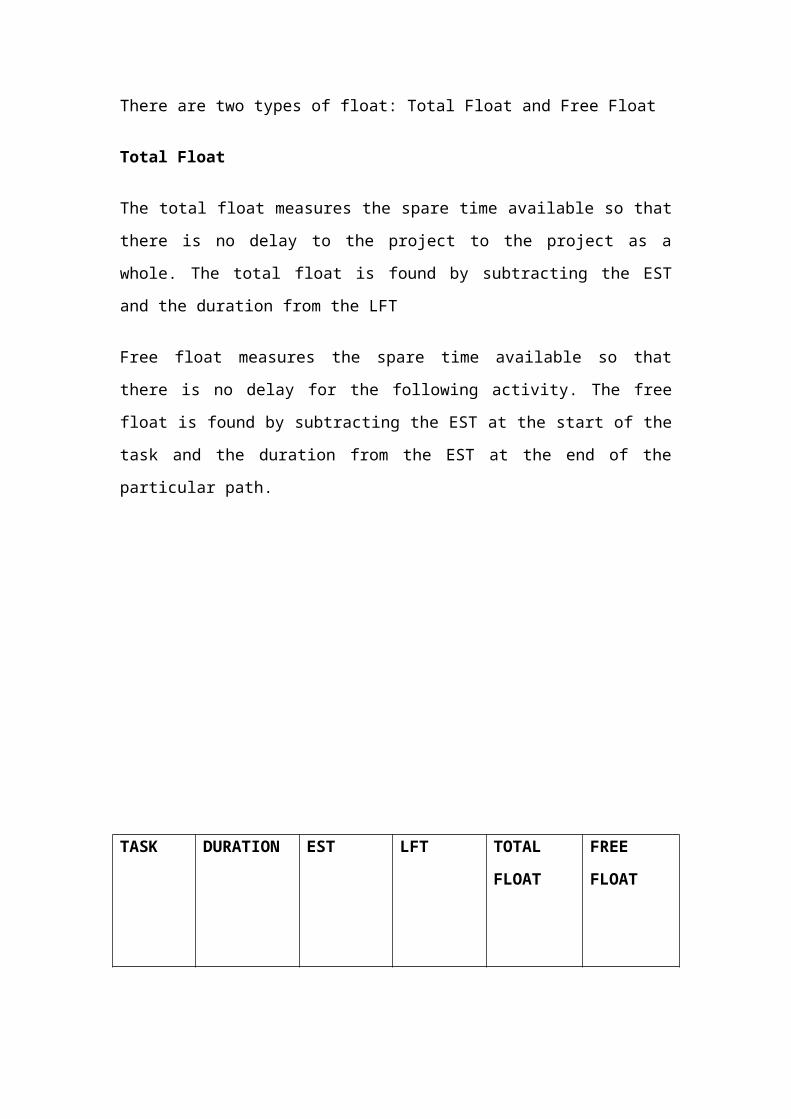
There are two types of float: Total Float and Free Float
Total Float
The total float measures the spare time available so that there is no delay to the project
to the project as a whole. The total float is found by subtracting the EST and the
duration from the LFT
Free float measures the spare time available so that there is no delay for the following
activity. The free float is found by subtracting the EST at the start of the task and the
duration from the EST at the end of the particular path.

TASK DURATION EST LFT TOTAL
FLOAT
FREE
FLOAT
A 14 0 14 14-0-14 =0 14-14-0=0
B
C
D
E
F
G
H
I
J
K
A Dummy Activity
A dummy activity is an activity that uses no time or resources, but is included in a network to maintain
the logic of the diagram and the relations between activities.
Example
TASK ORDER/DEPENDENCY ESTIMATED TIME
A CAN START AT SAME TIME AS B 2
B CAN START AT SAME TIME AS A 2
C MUST FOLLOW A 6
D MUST FOLLOW A 3
E MUST FOLLOW B 1
F MUST FOLLOW B 8
G MUST FOLLOW C 2
H MUST FOLLOW D, E 1
J CANNOT BEGIN UNTIL C,H, HAVE FINISHED 3
K CANNOT BEGIN UNTIL C,H, HAVE FINISHED 3
L MUST FOLLOW G, J 4
A C G L
2 6 2 4
D 3 J 3
H K
1 3
E1
B F2 8
The problem here is that J cannot begin until both C and H have finished. Yet, both C
and H are on different paths in the diagram.
We rectify this by drawing a dotted line with an arrow on the end of it from Event 5 to
Event 6. Thus we are showing the continuity between Activities C, H and J.
When you use a dummy activity, the EST and LFT of both nodes, which are being
connected, need to have exactly the same values.
Thus the diagram will be as follows:
A C G L
2 6 2 4
D 3 J 3
H K
1 3
E1
B F
3 8
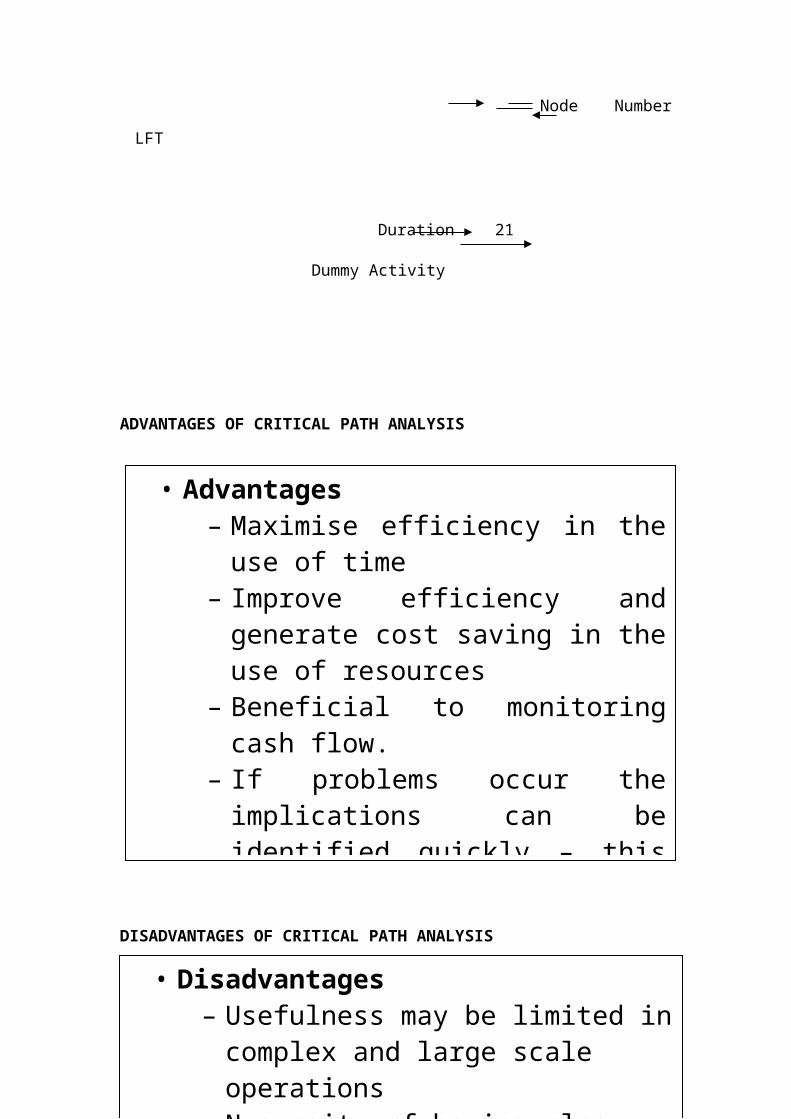
Key EST
Node Number LFT
Duration 21
Dummy Activity
ADVANTAGES OF CRITICAL PATH ANALYSIS
DISADVANTAGES OF CRITICAL PATH ANALYSIS
• Advantages– Maximise efficiency in the use of time– Improve efficiency and generate cost
saving in the use of resources– Beneficial to monitoring cash flow.– If problems occur the implications can
be identified quickly – this leads to speedy informed decisions being made.
• Disadvantages– Usefulness may be limited in complex
and large scale operations– Necessity of having clear and reliable
information– Skilled management and team philosophy
is essential.– Diagrams can become unmanageable.– Gantt charts tend to be preferred as they
show visually the time span of the activities.

CPA Questions
1: Show the information given in the table below about a project activity as a Critical Path Analysis diagram
Activity Description Duration (Weeks)
Preceding activity
A Select software 4 ---B Select Hardware 3 AC Install hardware 6 BD Install software 2 CE Test software 3 DF Train staff 5 EG System run-up 1 F
(a) From your diagram identify the total project duration
(b) Show which activities you feel could be run alongside others (in parallel rather than sequentially). Redraw the network diagram and calculate the new project duration.
2: Show the information given in the table below about a project activity as a Critical Path Analysis diagram using the notation provided
Activity Description Duration (Weeks)
Preceding activity
A Select software 4 ---B Upgrade office
network3 A
C Install hardware 6 AD Test software 2 BE Structure
database3 B
F Train staff 5 C,DG System run-up 1 E,F
(a) From your diagram, do the forward pass and calculate the minimum project duration(b) Do the reverse pass and calculate the latest event times(c) Show the critical path activities using the notation suggested(d) Assuming that the completion time is critical, identify which activities you would suggest should be the focus for management attention.

3: The table below considers the development of a short-course in project management. From the information, construct the critical path analysis diagram.
Activity Description Duration (Weeks)
Preceding activity
A Design course overview and publicity
4----
B Identify potential staff to teach on course
2 ----
C Construct detailed syllabus
6 ----
D Send out publicity and application forms
10 A
E Confirm staff availability
2 B
F Select staff to teach on course
1 C,E
G Acknowledge student applications
3 D
H Identify course written material
2 F
J Preparation of teaching material
20 G,H
K Prepare room for the course
1 G
(a) Determine the ESTs, the LFTs, the project duration and the critical activities
(b) Show the slack for each activity

4. ST is the operations director of F Bakery. He is in the process of putting together a project plan for the introduction of a new production plant that will enable the bakery to expand its product range, moving into high quality cakes and desserts.
ST has identified a number of activities that must be undertaken to set up the new bakery production plant. He now intends to construct a network analysis to assist ST in the planning of the project. This will also enable him to provide an answer for the HR manager who has asked him to provide advice on when she can start the recruitment campaign to select new employees needed to work in the new part of the bakery.
The activities can be broken down as follows:
Activity Dependency Time (weeks)A - 12B - 10C - 6D C 26E A 9F B 14G E, F 10H D,G 6
G = Recruitment campaign
(a) Construct a network diagram showing the critical path for the introduction of the new production plant for the bakery and the overall duration of the project.
(b) Identify the earliest time the recruitment campaign can start.
(c) Identify the activities where there is float/slack time in the project, and Calculate how much float/slack time there is.
5. ST is the operations director of F Bakery. He is in the process of putting together a project plan for the introduction of a new production plant that will enable the bakery to expand its product range, moving into high quality cakes and desserts. ST has identified a number of activities that must be undertaken to set up the new bakery production plant. He now intends to construct a network analysis to assist ST in the planning of the project. This will also enable him to provide an answer for the HR manager who has asked him to provide advice on when she can start the recruitment campaign to select new employees needed to work in the new part of the bakery.
The activities can be broken down as follows
Activity Preceding Activity Activity duration in weeks
A -- 12B -- 10C -- 6D C 26E A 9F B 14G E,F 10H D,G 6
G = recruitment campaign
a. Construct a Gantt chart for the introduction of the new production plant for the bakery and the overall duration of the project.
b. Identify the earliest time the recruitment campaign can start.
Related Documents