I ) I ( ) Research Product 89·21 Questionnaire Construction Manual Annex Questionnaires: Literature Survey and Bibliography June 1989 Fort Hood Field Unit Systems Research Laboratory U.S. Army Research Institute for the Behavioral and Social Sciences Approved for public release: distribution is unlimited.

Welcome message from author
This document is posted to help you gain knowledge. Please leave a comment to let me know what you think about it! Share it to your friends and learn new things together.
Transcript
I
)
I
( )
Research Product 89·21
Questionnaire Construction ManualAnnex
Questionnaires: Literature Survey andBibliography
June 1989
Fort Hood Field UnitSystems Research Laboratory
U.S. Army Research Institute for the Behavioral and Social Sciences
Approved for public release: distribution is unlimited.
11NFO-PUBLICRTIONS
t
U.S. ARMY RESEARCH INSTITUTEScientific Information Office--Publications
5001 Eisenhower AvenueAlexandria. VA 22333-5600
CDmIIl " (70J) 274-8029 or DSN 2BU029FAX I (70J) 617·0030
•
•'- This fax is UNCLASSIFIED
From: U•S. ARI IE. Borg
Date:_O_6_1_10_I_9_6----------
Number ot pages (including header) I
To=__D_e_lo_r_R_S_C_'8_1ll.;.pb_e_l_l _
. ~.
-7-·
Time: _
Office ,ymbol:, _
Fax number:. '_6_7_-9_0_7_0 _
•
•
•Re:Cerencc: Research PTodu('.t 89-21 J " Questionnaire construction manualRemarks: _
Annex. Questionnaires: 1.1ceralure ~UTVCY ~nd bibliographY" by Bettina A. Babbitt and
Charles O. Nystrom, June 1989.
The following pageR were 1ntentionn,J 1>, ltllt blnnk and not numbared i~ t:he report:
•
iv. viii, 4. 6. 2,2, 30, 40, 44,58, 62. 66, 82, 8S, 92, 100" 108,' 126, 128, 136, 164. 166, •
176, 184, 232, 234.
•
•
•. .. _.__._ ~r,.,~.. ·__ ~~""""".. '!C'::."""".__• __-.r-r__~ -..."
, ~
UNCLASSIFIEDSECURITY CLASSIFICATION OF THIS PAGE
/)..-<"
REPORT DOCUMENTATION PAGE I Form Approved ,OMBNo.0704·0188
la. REPORT SECURITY CLASSIFICAnON
Unclassified i
1b. RESTRICTIVE MARKINGS
-- ,"', '. ".;
'\
2a. SECURITY CLASSIFICATION AUTHORITY 3. DISTRIBUTION /AVAILABI~lrY OF REPORT--~~~~~~~~~~~~~~~~~~----~------~Approved for pub1i~ release;~~ DECLASSIFICATION/DOWNGRADING SCHEDU~E distribution .is unlimited.
4. PE~FORMING ORGANIZATION REPORT NUMBER(S), ,., ., .' .. 5. MONITORIN.G ORGANIZATION REPORT NUMBER(S)
Essex Corporation ARI Research Product 89-216a. N*ME OF PERFORMING ORGANIZATION
-Ess1x Corporation
6b. OFFICE SYMBOL(If applicable)
7a. NAME OF MONITORING ORGANIZATION
U.S. Army ~esearch InstituteFort Hood Field Unit
6c. AqDRESS (City, State, and ZIP Code)
741 Lakefield Road, Suite BWestlake Village, CA 91361
7b. ADDRESS (City, State, and ZIP Code)
HQ TCATA (PERI-SH)Fort Hood, TX 76544
8a. NAME OF FUNDING/SPONSORING,. 8b.OFFICE:SYME!OlORGANIZATION U.S. Army' Research (If applicable)'
Institute for the Behavioraland Social Sciences J --
9.:PROCUReMENT'lNSTRUMENT IDENTIFICATION 'NUMBER"
M.PA903-83~C~00338c. ADDRESS (City, State,a!},d2IPCode) . : 'lO:;,:S08RCEOF'~l!NDINGNUMBERS
5001 Eisenhower,AvenueAlexandria, VA 22333-5600
PROGRA:M:, " i.: iPROJECT TASKELEMENT' NO; . ,NO. NO.
"6'~7j9A 793 321
WORK UNITACCESSION NO.
AO!, 11. Tl1;LE (Include Security Classification)
Questionnaire'Construction Manual AnnexQue~tionnaires: Literature Survey and Bibliograpry
, . ~
~. ,12.PEflSONAL AUTHOR(S} ..
O Babb'itt, Bettina, A. (Essex Corporation), and,. • , I ·:13a. TYPE OF REPORT ' }13b. TIIV1ECOV,ERED \
:i !Final . FROM 83/05 TO 85/01
1'1Yl?hom, Charles o. (ARI)1'4. DATE OFiREPORT:(Year.Month,Day), . 1969, June .
1.15. PAGE COUNT
1 228,I ! 16. SUPPLEMENTARY NOTATION
i -Con~racting Officer's Representative, Charles A. Nystrom.
; iF· FIE'LD GR'OCOUSpATlCOD'SEuSB.GROUP .18,. SUBJECT TERMS (Continue on reverse if necessary and identify by block number)Multiple-choice scales Rank order scales .
,~;-,----,--~~-------+------------~Bipolar scales Paired-comparison scales, . , Semantic differential scales (Continued)
, , . , I , i 1.9. ABSTRACT (Continue'on 'reverSe (f necessary and identify by blQck; number)~ ,I • ,I ~ ,: • "I.
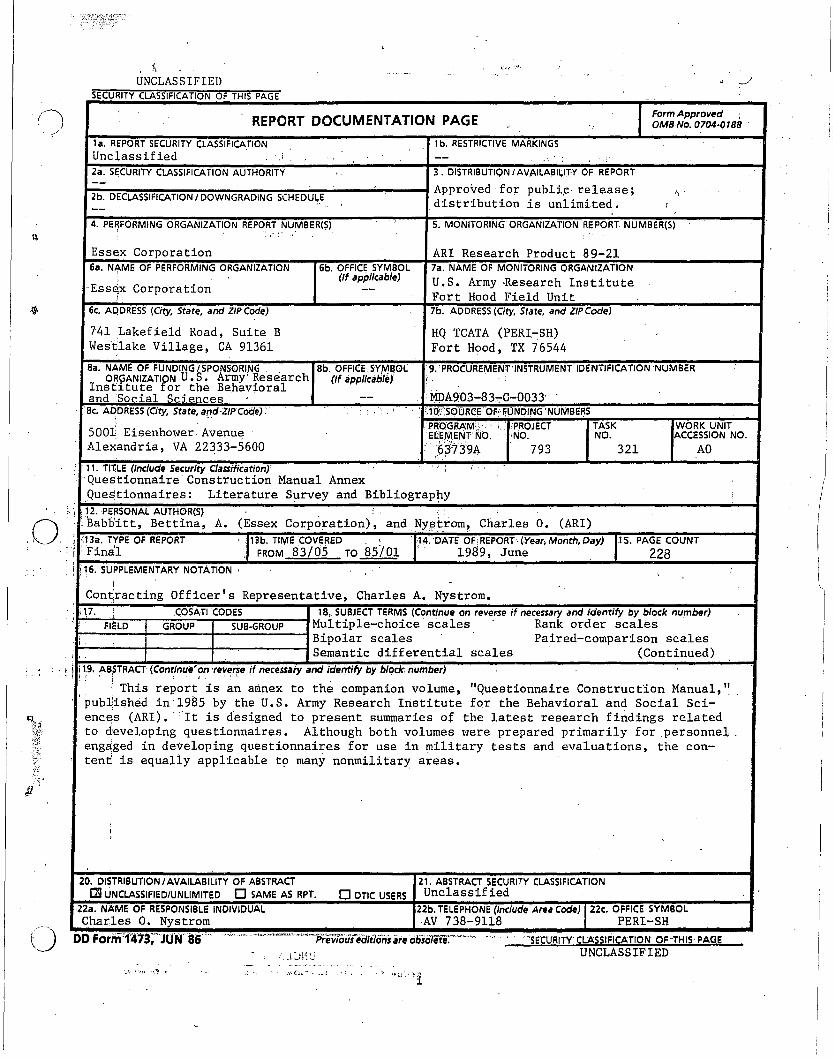
• ,1 This report is an artnex to the companion volume, "Questionnaire Construction Manual,"'pub~ished in'19$5 by the U.S. Army Research Institute for the Behavioral and Social Scienc~s (ARI). It is designed to present summaries of the latest research findings relatedto developing questionnaires. Although both volumes were prepared primarily for personnel .eng~ged in developing questionnaires for use in military tests and evaluations, the content is equally applicable t9 many nonmilitary areas.
20. DISTRIBUTION / AVAILABILITY OF ABSTRACT
[]I UNCLASSIFIED/UNLIMITED 0 SAME AS RPT.
21. ABSTRACT SECURITY CLASSIFICATIONo OTIC USERS Unclassified
22a. NAME OF RESPONSIBLE INDIVIDUALCharles O. Nystrom
22b. TELEPHONE (Include Area Code) 22c. OFFICE SYMBOLAV 738-9118 PERI-SH
"SECURITY'CLASSIFICATION OF-THIS' PAGE
UNCLASSIFIED.",.(;;, - ;. .,-1 .,', ""'f
UNCLASSIFIEDSECURITV CI.ASSIFICATlON OF THIS PAGE(WlIen Data Enta'.d)
ARI Research Product 89-21
18. SUBJECT TERNS (Continued)
Demographic characteristics. Continuous and circular scalesBehaviorally anchored rating scalesQuestionnaire layoutBranchingMiddle scale point
Response alternativesBibliographyRating scalesScale pointsItem wordingQuestionnaire construction
'; i I
UNCLASSIFIEDSECURITV CI. ...SSIFIC ... TION OF THIS PAGE(Whan Dat. Ent.,.d)
ii
,If
Research Product 89-21
Questionnaire Construction Manual AnnexQuestionnaires: Literature Survey and Bibliography
Bettina A. BabbittEssex Corp.
Charles O. Nystromu.s. Army Research Institute
ARI Field Unit at Fort Hood, TexasGeorge M. Gividen, Chief . '
Systems Research LaboratoryRobin L. Keesee, Director
U.S. Army Research Institute for the Behavioral and Social Sciences5001 Eisenhower Avenue, Alexandria, Virginia 22333-5600
Office, Deputy Chief of Staff fqr PersonnelDepartment of the Army
June 1989
u
Army Project Number2Q263739A793
Human Factors In Training andOperational Effectiveness
Approved for public release; distribution is unlimited.
iii
(j
..
u
FOREYORD
_This research was sponsored by the U.S. Army Research Institute for theBehavioral and Social Sciences (ARI) , field Unit at Fort Hood, Texas, todevelop a Questionnaire Construction Manual, Literature Survey,and Bibliography. The literature survey and bibliography present the latest researchmethods for developing questionnaires. The guidance contained will assistArmy personnel in performing field tests and evaluations. Methods that areapplicable to constructing questionnaires are described. The literaturereview and bibliography focus on content areas regarding scale categories,behavioral scales, design of questionnaire items, design of scale categories,interviewer and respondent characteristics, and questionnaire format. Thisresearch is a follow-on to the literature review of questionnaire and interview construction and administration conducted by Operations Research Associates in 1975 and edited and revised by the Army Research Institute in 1976.
fidijf~Technical Director
v
ACKNOVLEDGMENTS
The preparation of this report was greatly facilitated by the genetousassistance of several persons. A very special acknowledgment goes 'to Dr.Frederick A.' MuckIer, Essex Corporation, for his guidance and continuoussupport during all aspects of the preparation of this report.
The consultation and contribution of Mr. George M. Gividen, U.S. Army. Research Institute for the Behavioral and Social Sciences (ARI), CommanderVilliam,F. Moroney, Naval Air Development Center, and Dr~ F. ThomasEgg~meir,
Vright State University, are most gratefully acknowledged. Mr. Clarence A.Semple, Essex Corporation, contributed generously in, editing. Mrs. Joan M.Funk, Essex Corporation, provided valuable technical assistance in preparing~nd editing the manuscript.
vi
)))
o
()~
QUESTIONNAIRE CONSTRUCTION MANUAL ANNEXQUESTIONNAIRES: LITERATURE SURVEY AND BIBLIOGRAPHY
EXECUTIVE S.D.:::.:'Mc:.:M.:.:.A~R~Y ,",,--,_~ ..__. ._._
In 1975, Operations Research Associates (ORA) reviewed the literature onthe construction and administration of questionnaires and interviews. Twopublications resulted: a QuestionnaireConstrtlction Mlilnual, which was revised/~dited in 1976 to appear as an Army Researc~ Inst5tute special publication,P··77-1; and a Literature Survey and Bibliography Annex published asP-77-2. Also under contract to ARI, the Essex Corporation began in 1983 asurvey of the literature for research done subsequent to ORA's cutoff date.The present volume is a sequel to P-77-2. It is intended for those concernedwith questionnaire construction research from research design and developingscales to demographic characteristics of respondents.
Questionnaire construction research has not progressed evenly acrossprofessional fields. Sustained, programmatic research has hardly existed,whereas methodological considerations require a comprehensive series of experiments. In recent years, the computer has entered survey research. Itsimpact on construction, administration, and scoring is largely economic".Microprocessor, accessory, and software costs have continued to decline, andthe efficiencies that result from computer use make its application veryattractive.
Recommendations are provided for future research. Priorities are established for research topics as they relate to Operational Test and Evaluationperformed by the Army Research Institute, Fort Hood, Texas. Topics coveredare as follows: (1) scale development procedures and analysis; (2) proceduralguides to item wording; (3) subjective workload assessment methods; (4) Auto~
mated Portable Test System; (5) cognitive complexity; (6) BehaviorallyAnchored Rating Scales,; (7) item nonresponse, branching, and demographiccharacteristics; and (8) pictorial anchors.
vii
QUESTIONNAIRE CONSTRUCTION MANUAL ANNEXQUESTIONNAIRES: LITERATURE SURVEY AND BIBLIOGRAPHY
CONTENTS
VIII. FUTURE RESEARCH ..•...••.•.•..
CONTENTS (Continued)
VII. QUESTIONNAIRE FORMAT .•.
7.1 Questionnaire Layout7.2 Branching ....••.
BIBLIOGRAPHY
. . . . . ...
('~Page
· · · · 165
· · · · 167
· · · · · · 173
· · · · · · 177
· · · · · · 185
APPENDIX A. P-77-2, QUESTIONNAIRE CONSTRUCTION MANUAL ANNEX.LITERATURE SURVEY AND BIBLIOGRAPHY: TABLE OF CONTENTS 225
233
!B,. COMPARISON BETWEEN P-77-2, QUESTIONNAIRE CONSTRUCTION
MANUAL ANNEX, AND THE SEQUEL • • . • . • . . . • • • • 229
C. OVERVIEW OF CONTENT AREAS COVERED BY P-77-2AND THE SEQUEL . . . • • . • • • • • . • . .
. : I
.p. FUTURE RESEARCH RECOMMENDATIONS
x
235
,.f)....~._h
o
.',i\II ,
o
QUESTIONNAIRE CONSTRUCTION MANUAL ANNEXQUESTIONNAIRES: ' LITERATURE SURVEY AND BIBLIOGRAPHY
CHAPTER IINTRODUCTION
In 1975, Operations Research Associates (ORA) reviewed the literatureon questionnaire and interview construction, and administration research.They produced two products: a Questionnaire Construction Manual which wasrevi sed/edi ted in 1976, appeari ng as an Army Research Insti tute (ARI)special publication, P-77-1; and a Literature Survey and Bibliographyvolume pUblished as p-n-2. Also under contract to ARI, Essex Corporationbegan in 1983 a search of the literature for research on questionnairesdone sUbsequent to ORA's cut-off date. The present ,vol ume is a sequel top-n-2. It is a companion volume that does not include the content of theprevious work, although it does include the Table of Contents of P-77-2.This volume is, again, directed toward those who are tasked with questionnaire construction research ranging from research design, developingscales, through demographic characteristics of respondents.,
To initiate the literature search, computer-assisted and manualsearches were employed. The computer-assisted literature search accessedDialindex across the following 20 data bases: ERIC, Educational ResourcesInformation Center; NTIS, National Technical Information Services, U.S.Department of Commerce; SOCIAL SCISEARCH, Institute for Scientific Information; COMPENDEX, Engineering Information, Inc.; AIM/ARM, Center forVocational Education; PSYCINFO, American Psychological Association; ABI/INFORM, Data Courier, Inc.; SCISEARCH, Institute for Scientific Information; COMPREHENSIVE DISSERTATION INDEX; SOCIOLOGICAL ABSTRACTS; MANAGEMENTCONTENTS; CONFERENCE PAPERS INDEX, Cambridge Scientific Abstracts; MENTALHEALTH ABSTRACTS, National Clearinghouse for Mental Health Information,National Institute of Mental Health; ECONOMICS ABSTRACTS INTERNATIONAL,Dutch Ministry of Economic Affairs; U.S. POLITICAL SCIENCE DOCUMENTS,University of Pittsburgh Center for International Studies; HARVARD BUSINESSREVIEW, John Wiley &Sons, Inc.; HEALTH PLANNING AND ADMINISTRATION, U.S.National Library of Medicine; FIND/SVP REPORTS AND STUDIES INDEX; LC MARC,U.S. Library of Congress; BOOKS IN PRINT, R. R. Bowker. '
Results from the Dialindex computer search suggested modification inthe number of data bases to access. The 10 data bases which were used inthe actual search and retrieval of citations were: ERIC, NTIS, SOCIALSCISEARCH, COMPENDEX, PSYCINFO, ABI/INFORM, SOCIOLOGICAL ABSTRACTS MANAGEMENT CONTENTS, U.S. POLITICAL SCIENCE DOCUMENTS, and HEALTH PLANNING ANDADMINISTRATION. From the original computer-assisted literature search andthe manual search, 16,816 citations were obtained, and 343 citations wereidentified as being potentially appropriate for questionnaire research.SUbsequently, a supplemental computer-assisted Dialog search was run in thePSYCHINFO data base on the key word "Psychometrics. 1I For the years 1976through 1983, 2,415 citations were retrieved. Out of the 2,415 citations,68 were under consideration for inclusion in the literature review. Subsequently, 178 citations were used in writing the sequel, although 463 citations on questionnaire methodology are found in the bibliography.
1
The content of the sequel was researched and wri tten usi ng the actualjournal articles, reports, and books, and not the abstracts of the journalarticles. Journal articles, reports, and books selected for inclusion inthe bibliography were screened for their relevance to questionnaireconstruction. This sequel is designed to answer questions about the latesttechnical methods for developing questionnaires. These questionnaires areto assist Army personnel in performing field test evaluations. Methodological' considerations which are relevant to constructing questionnaires, andcou 1d be genera1i zed from other fi e1ds for m-i 1i tary app 1i ca ti on, were usedin conjunction with questionnaire construction research from the military •
. Relevant literature for questionnaire construction research from otherfields included: political science, marketing, organizational. management,human factors engineering, psychology, and- education. Research on questi onnai res was compared according to: descripti on of subjects, number ofsubjects, number and type of experimental conditions, number of scaledimensions, number of scale points, response alternatives, hypothesestested, results, scale reliability, and scale validity.
Each sect; on in the sequel has been divi ded into four parts: (1)description of the content area, (2) examples of the content area, (3)comparison of studies, and (4) conclusions generated from the technicalreview. There are 27 different sectio'ns. Each section may be considered astand-alone section. Each chapter subsection" II, 2.1-2.6; III, 3.1-3.4;IV, 4.1-4.5; V, 5.1-5.4; VI, 6.1-6.6; and VII, 7.1-7.2, for findings arerestated in preference to directing the reader to another section.
The chapters contain re'lated sections. Chapter II,. Scale Categories,contains an overview for various multiple-choice scales that representnominal, ordinal, and interval measurement. The assumptions underlying (~~)
scale construction and developmental procedures are reviewed for bipolar, t.,,!semantic differential, rank order, paired-comparison, continuous, andcircular scales.
Chapter III, Behavioral Scales, consists of a wide variety of formsand methods to develop scales whi-ch have behavioral anchors. The developmental procedures for behavioral scales are addressed.
Chapter IV, Design of Questionnaire Items, expands upon contingencies. involved in developing questionnaire items, such as the effectiveness ofusing positively and negatively worded items to create a balanced surveyinstrumEmt.-Cfther--considerations include the number of items to use in asurvey, and how many words to include in a question stem.
".
Chapter V,- Design of Scale Categories, consists of the selection ofnumber of seal e poi nts and type of response a1terna ti ves.
Chapter VI, Interviewer and Respondent Characteristics, views questionnaire construction from the standpoint of the impact on the targetpopulation, as well as on the interviewer, instead of the impact of thedesign of the instrument. Demographic characteristics which influenceitem responses are examined.
2
"
~."\ ..' 'J
d
o
o
Chapter VII, Questi onnaire Format, focuses on the phys i ca' structureof the questionnaire, the actual layout of the format, and the use ofbranching.
,Chapter VIII, Future Research, is devoted to recommendations whichwill allow for systematic investigation of questionnaire construction forArmy applications.
3
-j
, )
)
CHAPTE:R II
SCALE CATEGORIES
Well-known scales are reviewed in this chapter together with scalecons tructi on exp1ana ti ons based on the theoreti ca1 founda ti ons deve loped byresearchers, such as Thurstone , Likert, Guttman, and Osgood, Suci,and Tannenbaum. Examples of nominal, ordinal, and interval items, and responseal~rnatives are provided. Scale category research is expanded upon inthis section for bipolar, semantic differential, rank order, pairedcomparison, continuous, and circular scales.
Since developmental procedures affect the statistical analysis obtained after scale administration, developmental procedures are importantto ensure a quali~ scale. Guttman scales are suggested for applicationswith interval data. However, Guttman scales are more difficult to developthan other types of scales, and require greater development time. Thisconstraint would be a hindrance in situations where Army personnel wereparticipating in military field tests to assess equipment, training, organizations, and concepts, etc. due to the typical lack of developmental time.This constraint would apply to other scale categories to a lesser degree aswell. The quality of any survey instrument depends on the quality of thedevelopmental procedures.
In questionnaire construction, there have been no firm guidelinesregarding when to use a checklist that forces a respondent into a dichotomous rating. It is suggested that checklists may be best applied in twotypes of situations. They are useful for rating observable job behaviors(this would be considered hard data), and for a presurvey to assist indeveloping refined items.
Even after items have been refined, there remains the issue of selecting response- alternatives, and the question of what the midpoint is actually measuring (or for that matter, whether to use a midpoint) ~ There is thepossibility that in some instances subjects may be confounding scale dimensions with response alternatives. There has been evidence that responsestyles do exist, and the evidence has been conflicting. Apparently, minorviolations in the development of response alternatives, and different typesof response alternatives, have not jeopardized the reliability of instruments.
Overall research has not consistently shown one type of scale to bebetter than another. It has also been noted that the use of differenttypes of statistics will generate different results with varying interpretations. Because of conflicting data, investigations have shifted to otheraspects of questionnaire construction, such as: cognitive complexity ofthe respondent, and training respondents to use scales.
5
I)
o
'Ii .
"
u
2.1 MULTIPLE-CHOICE SCALES
Description of Multiple-Choice Scales
In questionnaire construction there are two primary types of structured questions and response modes: (1) an open-ended question or (2)amultiple-choice questi,on requiring a forced response. Researchers involvedin the development of 'survey instruments usually use both types of/questions. Open-ended questions serve well as preliminary screening devicesfor the development and refinement of mUltiple-choice questions (Orlich,1978; Backstrom &Hurchur-Cesar, 1981).
While the world of questionnaires may be divided into these two categories, open-ended items require much less discussion because of theirsimp'licity and limited role in questionnaires. Open-ended questions servewell when one is trying to determine what the relevant response alternatives to a question are. Thus, they enable the refinement of multiplechoice questions on the basis of the exploratory or pilot study administration (Orlich, 1978; Backstrom &Hurchur-Cesar, 1981). This is not todeny their utility on other occasions.
Multiple-choice items are preferred over open-ended i~ems/because oftheir potential for speed and objectivity in usage, provided that theirdevelopment has involved sound procedures (Green, 1981). The number ofresponse a1terna tives used wi th an item may range from 2 to over 20. Therespondent may be directed to mark only one response choice, or may beallowed to select all response alternatives that seem appropriate to him/her. The choices mayor may not be mutually exclusive (Orlich, 1978;Backstrom &Hurchur-Cesar, 1981).
Multiple-choice items represent measurement scales which are nominal,ordinal, or interval, and these scales indicate the rules for assigningnumbers to the data so that the appropriate statistical analysis can beperformed (Roscoe, 1975). Measurement scales for nominal" i terns are nonnumerical in their relationship. These items have mutually exclusiveanswers, and classify responses into categories (Roscoe, 1975; Orlich,1978; Backstrom &Hurchur-Cesar, 1981).
Ordinal measurement scales have higher and lower categories, but themagnitude of the interval between responses is not specified. Unequaldistances between intervals is always assumed, and the data is consideredcontinuous when it is ranked (Roscoe, 1975). Ordinal measurement scalesare common in surveys where respondents are required to rank items or touse a paired-comparison method (Backstrom &Hurchur-Cesar, 1981). Thisapproach to scaling uses a Thurstone technique (Orlich, 1978). Usually,when 10 or more items are to be ranked, a Q Sort method should be usedinstead of a rank order scale.
Weighting scales for psychological distance or intensity can addexactness to a scale since it indicates how much difference there is amongresponses (Backstrom &Hurchur-Cesar, 1981). Interval measurement scaleshave equal intervals between the scale points (Roscoe, 1975), as well asretaining the characteristics of the previous scales.
7
~ Likert scales are the most widely us.e.d scales among researchers per-fomi ng surveys (wi ththe exception of market research surveys) • Likertscales are usually composed of five or more response categories. Theresponse categories for Likert scales are mutually exclusive and exhaustive(Backstrom & Hurchur-Cesar, 1981). Likert scales contain a statement of .opinion followed by various levels of agreement or disagreement with thatstatement (Brannon, 1981). These rating scales are designed to presentrespondents with a statement, phrase, or word which describes their opinionor feeling. In addition to Likert scales, there are semantic differentialscales, sunmed index scales, Guttman scales (Backstrom &Hurchur-Cesar,1981), and Behaviorally Anchored Rating Scales (BARS). This list of scales
'is not meant to be inclusive.
Examples of MUltiple~Chotce'Scales
. In the design of a survey, researchers must decide whether to use anopen question or a closed question with a mUltiple-choice fonnat. Theselection Of a multiple-choice question automatically provides a fixed setof alternatives (Schuman &Presser, 1981).
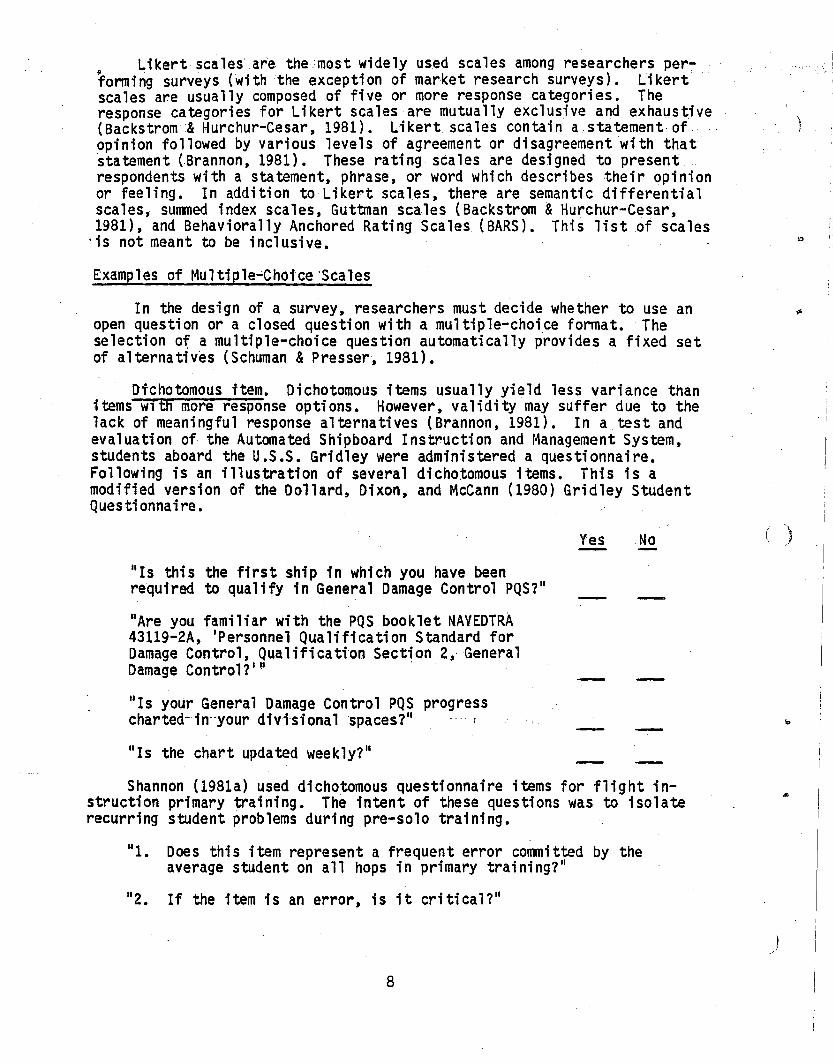
Dichotomous item. Dichotomous items usually yield less variance thanitems wlth more response options. However, validity may suffer due to thelack of meaningful response alternatives (Brannon, 1981). In a test andevaluation of the Automated Shipboard Instruction and Management System,students aboard the U.S.S. Gridley were administered a questionnaire.FollOWing is an illustration of several dichotomous items. This is amodified version of the Dollard, Dixon, and McCann (1980) Gridley StudentQuesti onnai re.
II Is thi s the first ship in whi ch you have beenreqUired to qualify in General Damage Control PQS?II
IIAre you fami 11ar wi th the PQ S boo k1et NAV EDTRA43119-2A, 'Personnel Qualification Standard forDamage Control , Qual i fi cation Secti on 2,.Genera1Damage Control?·!1 !
Yes No )
II Is your General Damage Control PQS progresscharted- in"your divisi onalspaces?1I
Ills the chart updated weekly?1I
Shannon (1981a) used dichotomous questionnaire items for flight instruction primary training. The intent of these questions was to isolaterecurring student problems during pre-solo training.
111. Does this item represent a frequent error committed by theaverage student on all hops in primary training?1I
112. If the item is an error, is it critical?1I
8
)
...
C)
u
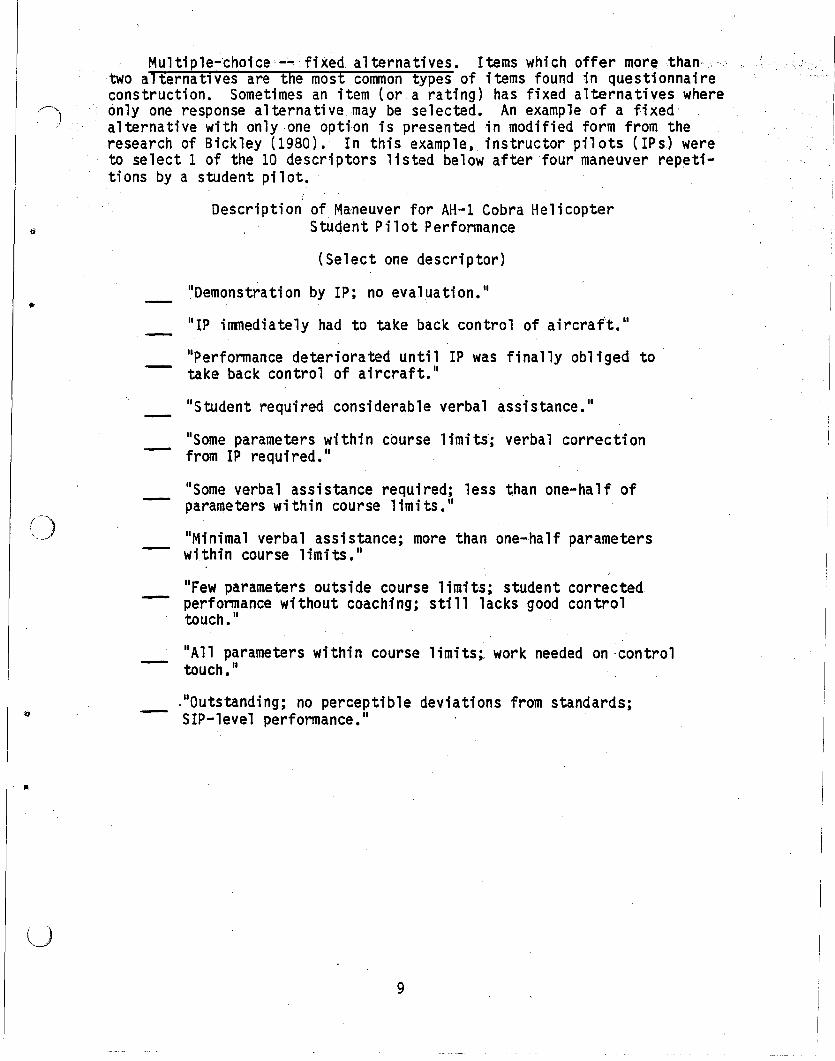
Multiple-choice ...;.. fixed. alternatives. Items which offer more than"two alternatlves are the most common types of items found in questionnaireconstruction. Sometimes an item (or a rating) has fixed alternatives whereonly one response alternative may be selected. An example of a fixed'alternative with only one option is presented in modified form from theresearch of Bickley (1980). In this example, instructor pilots (IPs) wereto select 1 of the 10 descriptors listed below after four maneuver repetitions by a student pilot.
Description of Maneuver for AH-1 Cobra HelicopterStudent Pilot Performance
(Select one descriptor)
"Demonstration by IP; no evaluation."
"IP immediately had to take back control of aircraf't."
"Performance deteriorated until IP was finally obliged totake back control of aircraft."
"Student required considerable verbal assistance."
"Some parameters wi thin course limi ts; verbal correcti onfrom IP requi red. \I
"Some verbal assistance required; less than one-half ofparameters within course limits."
"Minimal verbal assistance; more than one-half parameterswithin course 1imi ts. II
"Few parameters outside course limits; student correctedperformance without coaching; still lacks good controltouch. II
"All parameters within course limits;, work needed on 'controltouch. "
."Outstanding; no perceptible deviations from standards;SIP-level performance."
9
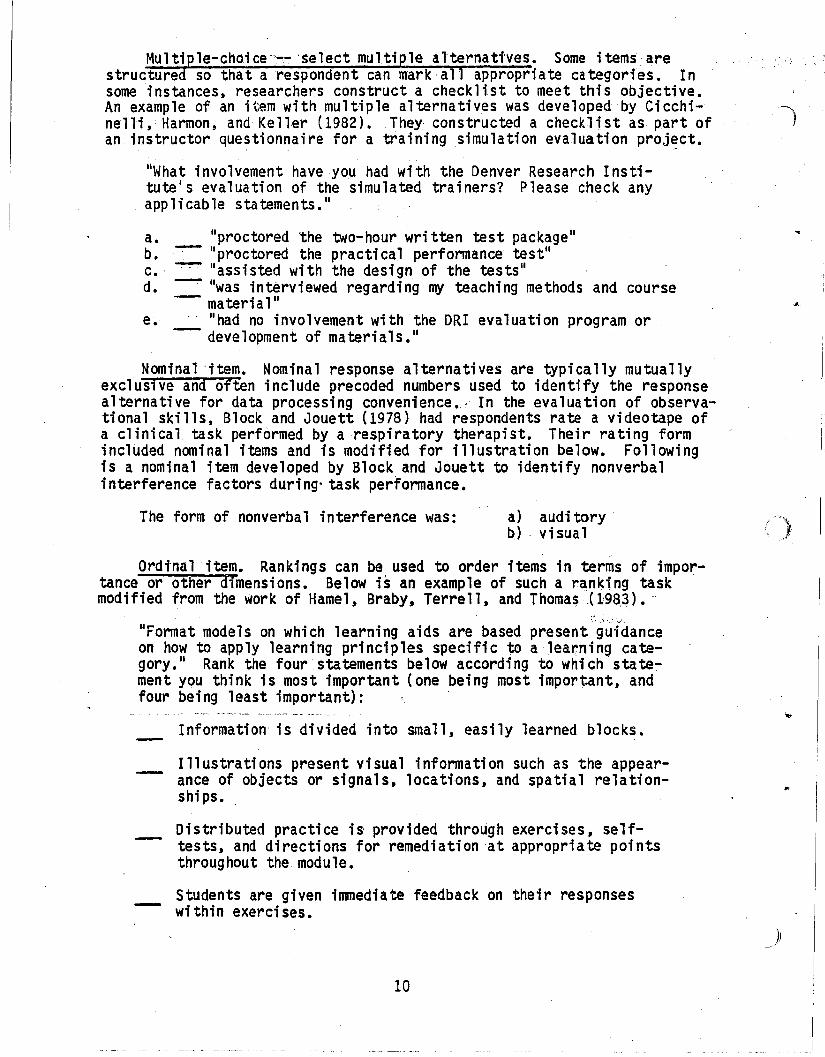
Multiple-choice-'-- 'select multiple alternatives. Some items arestructured so that a respondent can mark all appropriate categories. Insome instances, researchers construct a checkl i st to meet thi s objective.An example of an item with multiple alternatives was developed by Cicchi- --)nelli, Harmon, and Keller (1982). They constructed a checklist as part ofan instructor questionnaire for a training simulation evaluation proj~ct.
IIWhat involvement have you had with the Denver Research Institute's evaluation of the simulated trainers? Please check anyapp 1i cab le statements. II
a. IIproctored the two-hour wri tten test package"b. ~ "proc tored the practical performance test ll
c. ~ lIassisted with the design of the tests ll
d. ~ IIwas interviewed regarding my teaching methods and course- material II
e. ,. IIhad no involvement with the DRI evaluation program or- development of materials."
~ominal 'item. Nominal response alternatives are typically mutuallyexclusive and often include precoded numbers used to identify the responsealternative for data processing convenience., In the evaluation of observational skills, Block and Jouett (1978) had respondents rate a videotape ofa clinical task performed by a respiratory therapist. Their rating formincluded nominal items and is modified for illustration below. Followingis a nominal item developed by Block and Jouett to identify nonverbalinterference factors during- task performance.
The form of nonverbal interference was: a) auditoryb) , visual ( )
-~.'
Ordinal 'item. Rankings can be used to order items in terms of importance or other dimensions. Below is an example of such ~ ranking task 'modified from the work of Hamel, Braby, Terrell, and Thomas (1·983). '0'
lIFormat models on which learning aids are based present guidanceon how to apply learning principles specific to a lear:ning category.1I Rank the four statements below according to which state':'"ment you think is most important (one being most important, andfour being least important):
Information is divided into small, easily learned blocks.
Illustrations present visual information such as the appearance of objects or signals, locations, and spatial relationshi ps.
Distributed practice is provided through exercises, selftests, and directions for remediation at appropriate pointsthroughout the module.
Students are given immediate feedback on their responseswithin exercises.
10
.,
))
. Ordinal item--· paired-comearison. Backstrom and Hurchur-Cesar (1981)structured a paired-comparison 'Item as a way to rank alternatives in asurvey. Sources of information about federal involvement in a model city.project was the topic area. A modified example of their paired-comparisonmethod is presented here.
Which do you generally find more reliable for obtaining information about the United States federal government involvement inci ty affairs?
newspapersradiotelevision
or radioor televisionor newspapers
o
..
u
Ordinal item --Q Sort. Ordinal measurements, where the paired-comparison items reach 10 items or more, are difficult to rank since ranking10 pairs would require 45 different pairwise comparisons. A Q Sort technique can be applied in this type of situation. Moroney (1984) explains asorting operation used with the Subjective Workload Assessment Technique(SWAT) which was developed by Shingledecker (1983).
"SWAT is a two step process. Each individual scheduled to use .SWAT participates in both a scale development phase and an eventscori ng phase. Duri ng the scale deve1opmen t phase, the person isasked to order a set of 27 cards from lowest workload to highestworkload. The cards contain descriptions of level s of the threedimensions (i.e., time, effort, and stress). There are threelevels of each of the three dimensions; therefore, all possiblecombinations result in 27 sets of descriptions. The individual· srankings of these sets of descriptions are then analyzed usingconjoint measurement in order to find a mathematical model thatdescribes the person's ordering. This model is then used todefine scale values for workload from 0 for the lowest workloadto 100 for the highest workload and 25 scale values in between.Thus, the scale is tailored to ea~h individual's concept of howthese factors combine to create the subjective impression ofworkload. II
11
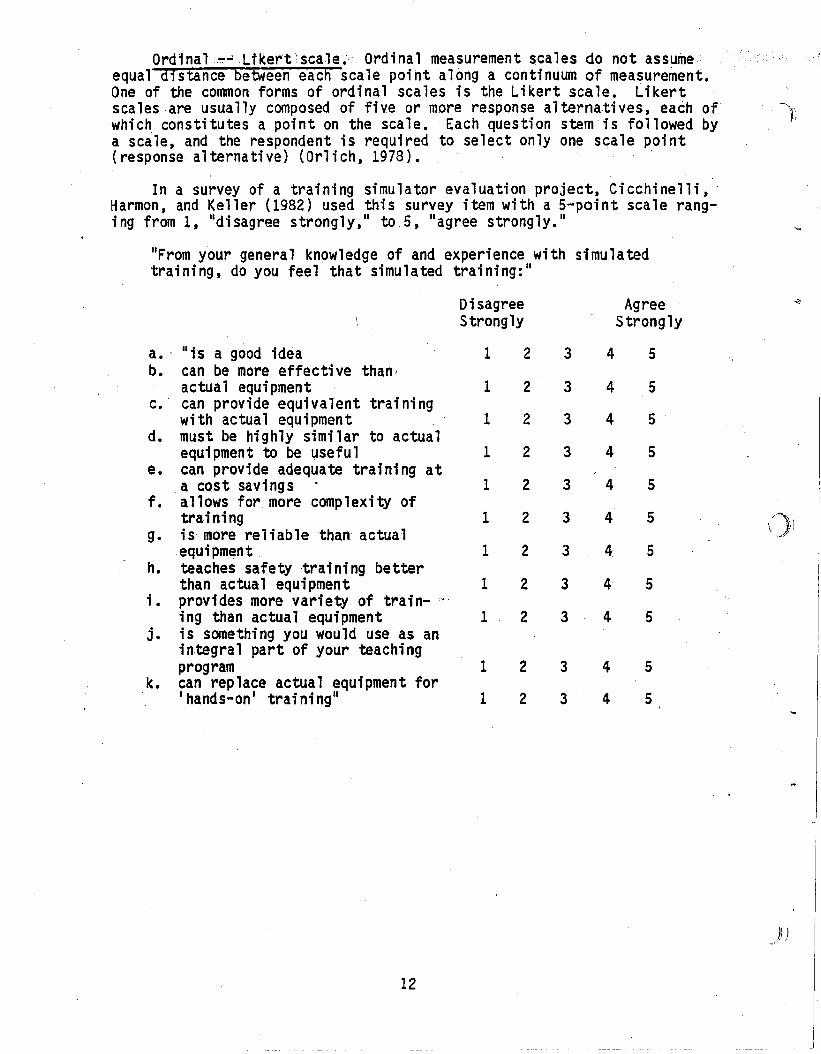
Ordinal,~-,Ltkert:scale.Ordinal measurement scales do not assumeequal distance between each scale point along a continuum of measurement.One of the common forms of ordinal scales is the Likert scale. Likertscales are ~sually comPiOSed of five 0lr more rhespons: alternatiivesl'leaCh of ~);which constltutes a po nt on the sca e. Eac questl0n stem s fo owed bya scale, and the respondent is requi red to select on ly one scale poi nt(response alternative) (Orlich, 1978). .
In a survey of a training simulator evaluation project, Cicchinelli, ,Harmon, and Keller (1982) used this survey item with a 5-point scale ranging from 1, "disagree strongly," to 5, "agree strongly."
"From your general knowledge of and experience with simulatedtraining, do you feel that simulated training:"
DisagreeStrongly
AgreeStrongly
a. ' "is a good ideab. can be more effective than,
actual equipmentc. can provide equivalent training
with actual equipmentd. must be highly similar to actual
equipment to be usefule. can provide adequate training at
a cost savingsf. allows for more complexi~ of
trainingg. is more reliable than actuall
equipmenth. teaches safety training better
than actual equipmenti. provides more varie~ of train- '0'
ing than actual equipmentj. is something you would use as an
integral part of your teachingprogram
k. can replace actual equipment forI hands-on l trainingll
12
1
1
1
1
1
1
1
1
1
1
1
2
2
2
2
2
2
2
2
2
2
2
3
3
3
3
3
3
3
3
3
3
3
4
4
4
4
4
4
4
4
4
4
4
5
5
5
5
5
5
5
5
5
5
5
))
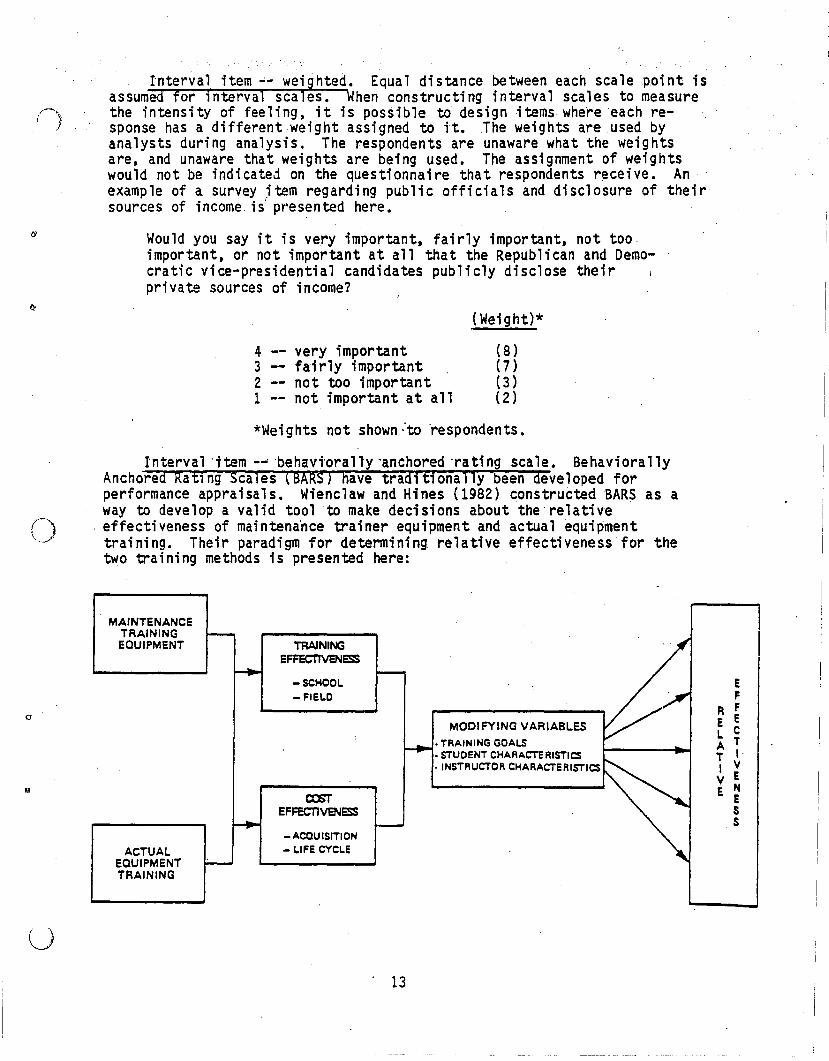
Interval item -- weighted. Equal distance between each scale point isassumed for interval scales. When constructing interval scales to measurethe intensity of feeling, it is possible to design items where each response has a different weight assigned to it. The weights are used byanalysts during analysis. The respondents are unaware what the weightsare, and unaware that weights are being used. The assignment of weightswould not be indicated on the questionnaire that respondents rE!ceive. Anexample of a survey item regarding pUblic officials and disclosure of theirsources of income is' presented here. '
Would you say it is very important, fairly important, not tooimportant, or not important at all that the RepubHcan and Democratic vice-presidential candidates pUblicly disclose theirprivate sources of income?
4321
very importantfai rly importantnot too importantnot important at all
(Weight}*
(8 )(7)(3)(2)
o
*Wei ghts not shown:to 'respondents.
lnterval 'ttem -~ 'behavtoraHy 'anchored 'rating scale. BehaviorallyAnchored Rating Scales (BARS) have traditionally been developed forperformance appraisals. Wienclaw and Hines (1982) constructed BARS as away to develop a valid tool to make decisions about the 'relative
, effectiveness of maintena'ncetrainer equipment and actual equipmenttraining. Their paradigm for determining relative effectiveness for thetwo tr,aining methods is presented here:
u
MAINTENANCETRAININGEOUIPMENT
ACTUALEOUIPMENTTRAINING
TRAININGEFFECTIVENESS
-SCHOOL- FIEL.O
a::sTEFFECTlVENESS
- ACQUISITION- LIFE CYCLE
. 13
MODIFYING VARIABLES
• TRAINING GOALS• STUDENT CHARACTERISTICS• INSTRUCTOR CHARACTERISTICS
EF
R FE EL C
TA I.T VI EV NE E
SS
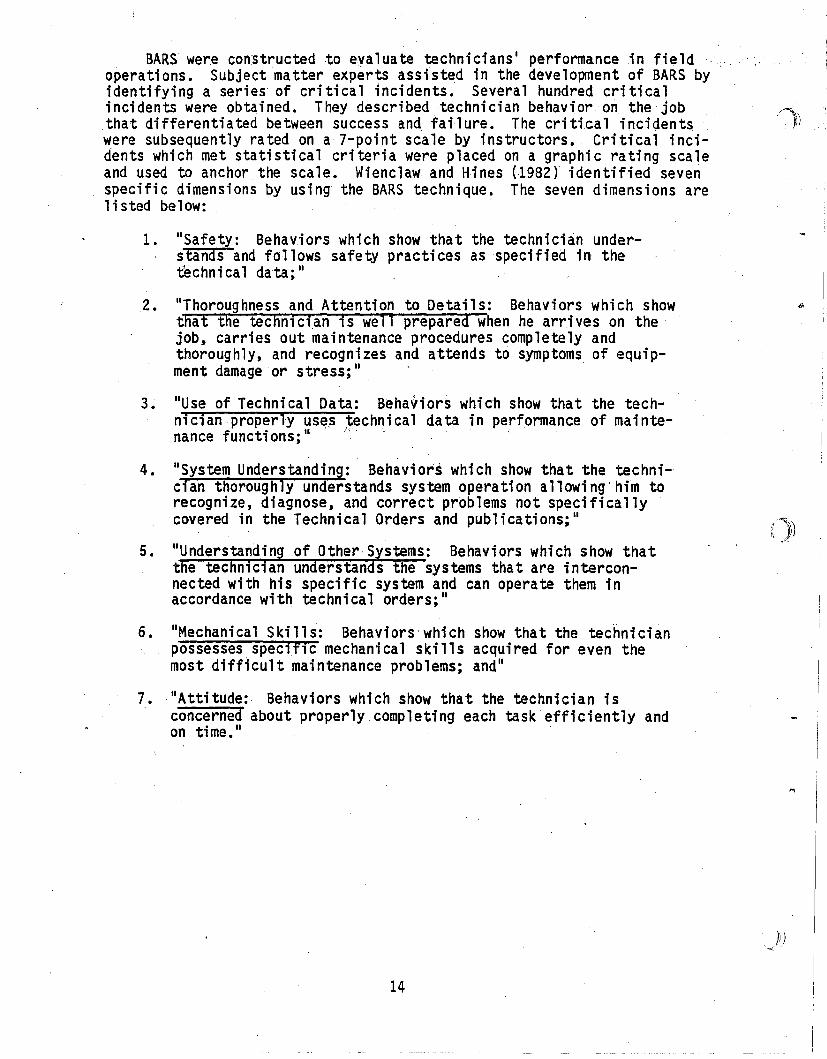
BARSwerecon'structed to evaluate techni ci ans I performance in fieldoperations. Subject matter experts assisted in the development of BARS byidentifying a series of critical incidents~ Several hundred criticalincidents were obtained. They described technician behavior on the job.that differentiated between success and failure. The critical incidents})were subsequently rated on a 7-point scale by instructors. Critical inci-dents which met statistical criteria were placed on a graphic rating scaleand used to.anchor the scale. Wienclaw and Hines (1982) identified sevenspecific dimensions by using the BARS technique. The seven dimensions arelisted below: .
1. "Safety: Behaviors which show that the technician understands and follows safety practices as specified in thetechni ca1 data; II
2. "Thoroughness and Attention to Detail s: Behaviors whi ch showthat the technician is well prepared when he arrives on thejob, carries out maintenance procedures completely andthoroughly, and recognizes and attends to symptoms of equip-ment damage or stress; II . '
3. "Useof Technical Data: Beha~iors which show that the technicianproperly uses ~echnical data in performance of maintenance functions;II'
4. "System Understanding: Behavi ors whi ch show that the technician thoroughly understands system operation allowing'him torecognize, diagnose, and correct problems not specificallycovered in the Technical Orders and pUblications; II
5. "Understandingof Other Systems: Behaviors which show thatthe technician understands the systems that are interconnected with his specific system and can operate them inaccordance with technical orders;"
6. "Mechani ca1 Ski 11 s: Behavi ors' whi ch show that the techni ci anpossesses speclfic mechanical skills acquired for even themostdif{icult maintenance problems; and"
7. UAttitude:, Behaviors which show that the technician isconcerned about properly completing each task efficiently andon time. II
,.,
)1 )'~--~/
14
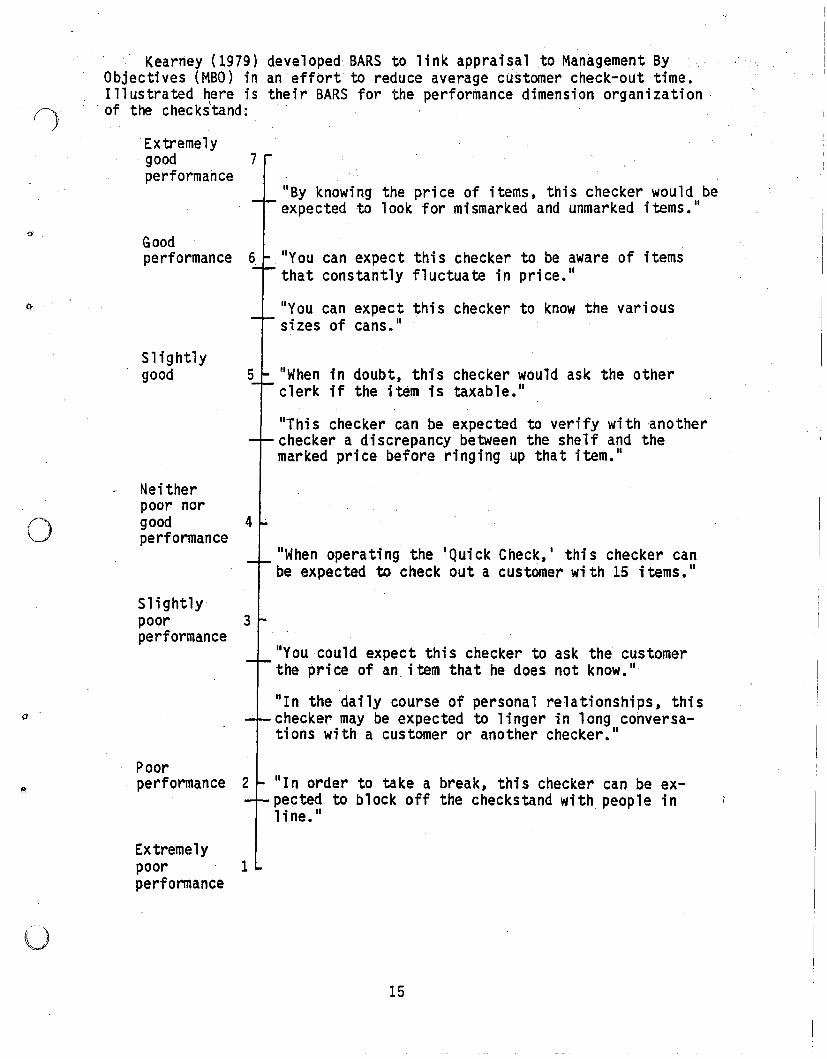
Kearney (1979) developed BARS to link appraisal to Management ByObjectives (MBO) in an effort to reduce average customer check-out time.Illustrated here is their BARS for the performance dimension organization
(-''il . of the chec ks''tand:)
Extremelygoodperformance
Goodperformance
Slightlygood
"By knowing the price of items, this checker would beexpected to look for mi smarked and unmarked items. II
"You can expect this checker to be aware of itemsthat constantly fluctuate in price. 1I
"You can expect this checker to know the varioussizes of cans. 1I
"When in doubt, this checker would ask the otherclerk if the item is taxable. II
IIThi s checker can be expected to verify wi thanotherchecker a discrepancy between the shelf and themarked price before ringing up that item. 1I
oNeitherpoor norgood 4performance
Slightlypoor 3performance
IIWhen opera ti ng the I Quick Check, I thi s checker canbe expected to check out a customer wi th 15 i terns. II
"You could expect thi s checker to ask the customerthe price of an, item that he does not know. 1I
, Poor, performance
I
"In the daily course of personal relationships, thischecker may be expected to linger in long conversations with a customer or another checker."
IIIn order to take a break, this checker can be expected to block off the checkstand with people inline."
o
Extremelypoor 1performance
15
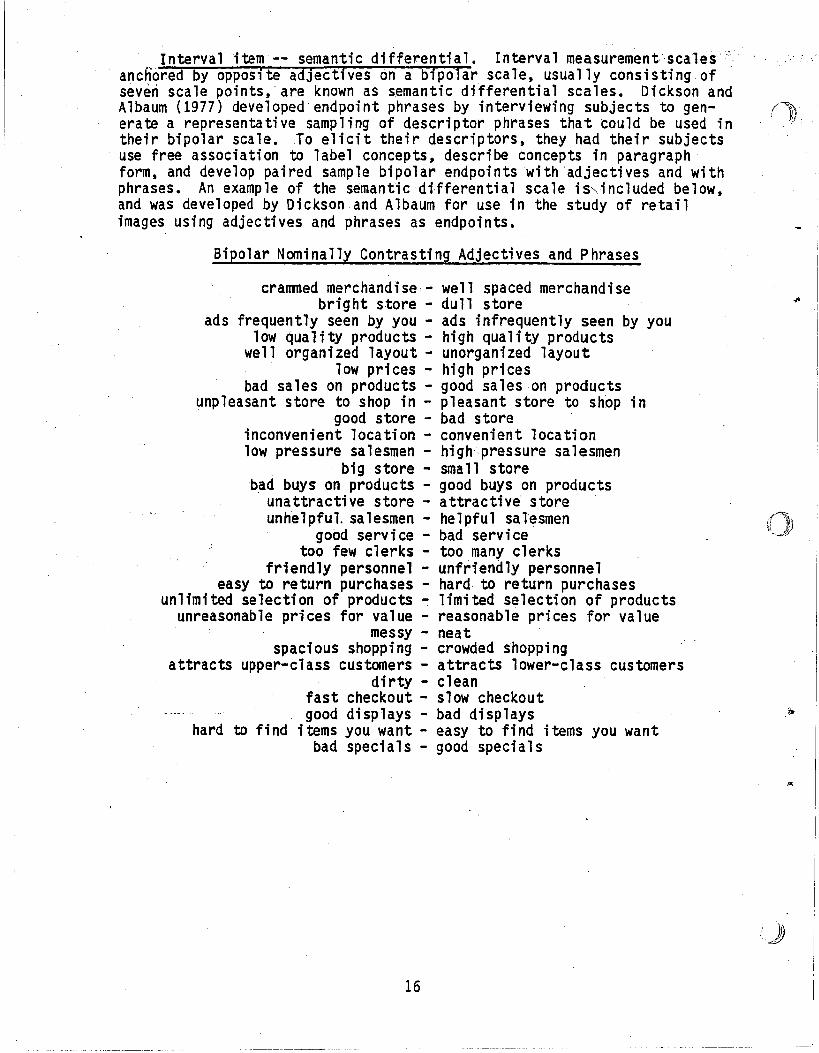
Interval item -- semantic differential. Interval measurementscales';ancnoredby opposite adjectives on a bipolar scale, usually consisting. ofseven scale points, are known as semantic differential scales. Dickson andA1baum (1977) deve1?ped' endP
l~i nt 'fPhrasesi by intehrvi ewing subjects to gen- (),
erate a representatlve samp lng 0 descr ptor p rases that could be used intheir bipolar scale. To elicit their descriptors, they had their subjectsuse free association to label concepts, describe concepts in paragraphform, and develop paired sample bipolar endpoints ~ithadjectives and withphrases. An example of the semantic differential scale is"included below,and was developed by Dickson and Albaum for use in the study of retailimages using adjectives and phrases as endpoints.
Bipolar Nominally Contrasting Adjectives and Phrases
crammed merchandise,- well spaced merchandisebright store - dull store
ads frequently seen by you - ads infrequently seen by youlow quality products - high quality products
well organized layout - unorganized layoutlow prices - high prices
bad sales on products - good sales on productsunpleasant store to shop in - pleasant store to shop in
good store - bad storeinconvenient location - convenient locationlow pressure salesmen - high' pressure salesmen
big store - small storebad buys on products - good buys on products
unattractive store - attractive' storeunhelpful. salesmen - helpful salesmen
good service - bad servicetoo few clerks - too many clerks
friendly personnel - unfriendly personneleasy to return purchases - hard, to return purchases
unlimited selection of products - limited selection of productsunreasonable prices for value - reasonable prices for value
messy - neatspacious shopping - crowded shopping
attracts upper-class customers - attracts lower-class customersdirty - clean
fast checkout - slow checkoutgood displays - bad displays
hard to find items you want - easy to find items you wantbad specials - good specials
16
.~
.'j)
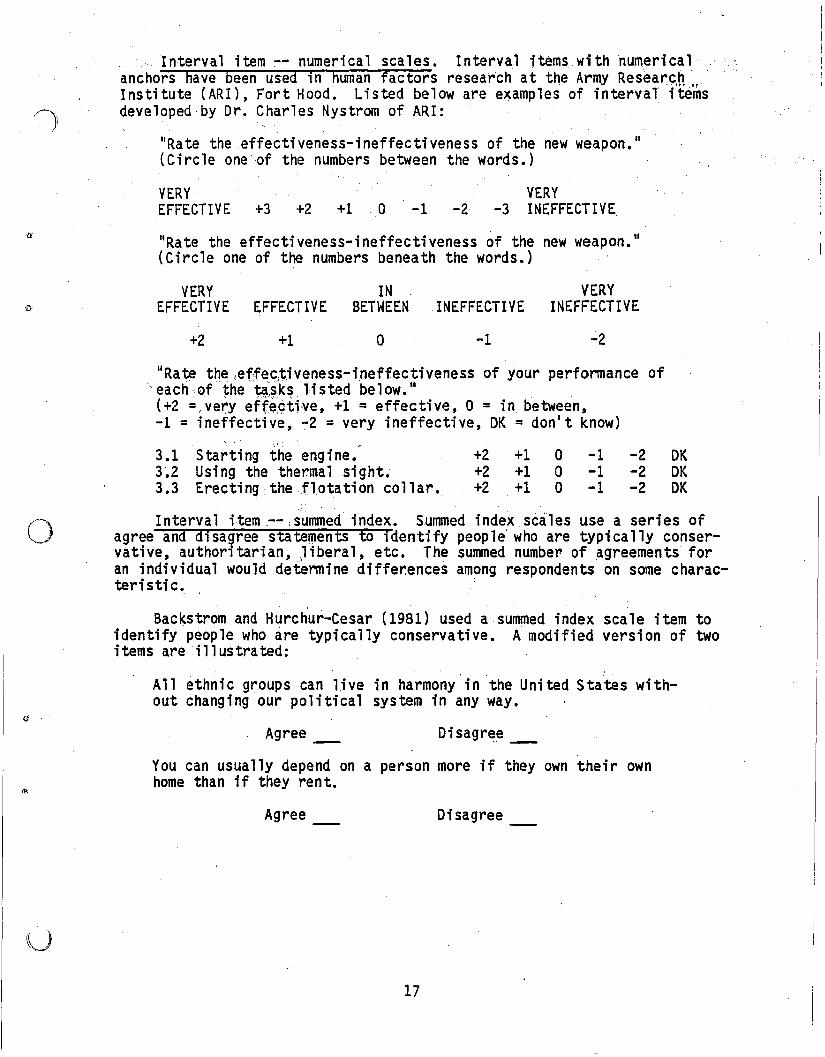
Interva1 item :-- numeri cal seal es. I nterva1 items withnumeri calanchors have been used in htunan factors research at the Army Researc.h.,Institute (ARI), Fort Hood. Listed below are ex.amples of interval itemsdeveloped 'by Dr. Charles Nystrom of ARI:
"Rate the effectiveness-ineffectiveness of the new weapon."(Circle -one'of the numbers between the words.)
VERY VERYEFFECTIVE +3 +2 +1 0 -1 -2 -3 INEFFECTIVE
"Rate the effectiveness-ineffectiveness of the new weapon."(Circle one of the numbers beneath the words.)
VERY IN VERYEFFECTIVE EFFECTIVE BETWEEN INEFFECTIVE INEFFECTIVE
I
I
I
+2 +1 o -1
"Rate the /efJec,tiveness-ineffectiveness of your performance of\ each'of-thet9.sk~ listed below. 1I
(+2 = veryeffec;:t1ve, +1 = effective, 0 = in between,-1 = ineffective, ~2 = very ineffective, DK = don1t know)
Interval item --summed index. Summed index scales use a series ofagree and disagree statements to identify people who are typically conservative, authoritarian, liberal, etc. The sunmed number of agreements foran individual would determine differences among respondents on some charac-teri sti c. .
o
;.. ' . ,
3.1 Starting the engine.3~2 Using the thermal sight.3 .3 Erecting theflotati on collar.
+2 +1 0 -1+2 +1 0 -1+2 +1 0 -1
-2 DK-2 OK-2 DK
Backstrom and Hurchur-Cesar (1981) used a summed index scale item toidentify people who are typically conservative. A modified version of twoitems are illustrated:
All ethnic groups can live in harmony in the United States without changing our political system in any way.
Agree oisagr~_e _
You can usually depend on a person more if they own their ownhome than if they rent.
Agree
17
Disagree
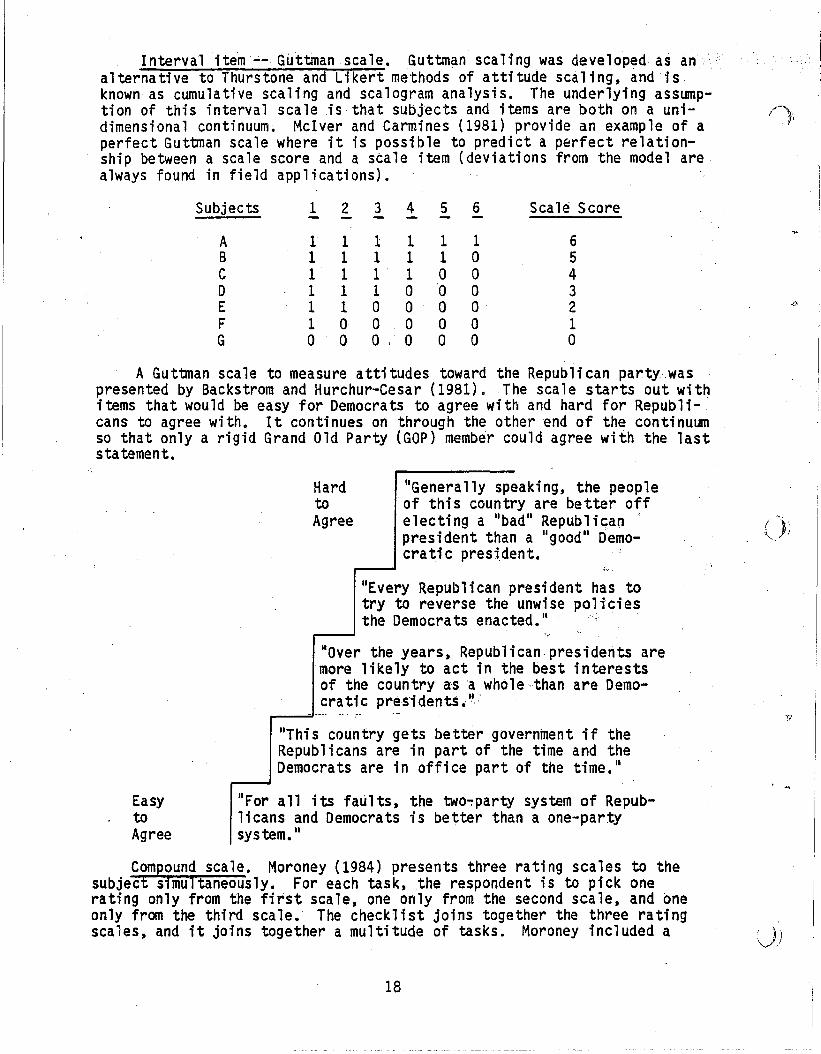
Interval item-- Guttman scale. Guttman scaling was developed as an .alternative to Thurstone and Likert methods of attitude scaling, and isknown as cumulative scaling and scalogram analysis. The underlying assump-tion of this interval scale is that subjects and items are both on a uni- /1"dimensional continuum. McIver and Carmines (1981) provide an example of aperfect Guttman scale where it is possible to predict a perfect relation-ship between a scale score and a scale item (deviations from the model arealways found in field applications).
Subjects 1 2 3 4 5 6 Scale Score
A 1 1 1 1 1 1 6B 1 1 1 1 1 a 5C 1 1 1· 1 a a 4D 1 1 1 a a a 3E 1 1 a a a O· 2 J;,.
F 1 a a a a a 1G a a a , 0 a a a
A Guttman scale to measure attitudes toward the R.epublican party waspresented by Backstrom and Hurchur-Cesar (1981). The scale starts out withitems that would be easy for Democrats to agree wi th and hard for Repub1i-cans to agree with. It continues on through the other end of the continuumso that only a rigid Grand Old Party (GOP) member could agree with the laststatement.
resi dent has tounwise policiesed. lI
,
sys tem of Repubn a one-party
can presidents aree best interestse-than are Demo-
erninent if thee time and theof the time. II
eaking, the peopleyare better offdll Repub1i can t·')·: .a II good" Demo- \ .. )
nt.
Hard IIGenera11y spto of this countrAgree electing a IIba
president thancratic presi.de
IIEvery Repub1i can ptry to reverse thethe Democrats enact
1I0ver the years, Repub1imore likely to act in thof the country asa who1crati c presi den ts .11 ..
'_._.-, ... ...
IIThi s country gets better govRepUblicans are in part of thDemocrats are in office part
IIFor all its faults, the two,,:,partylicans and Democrats is better thasystem. II
EasytoAgree
Compound scale. Moroney (1984) presents three rating scales to thesubject simul taneous1y. For each task, .the respondent is to pi ck onerating only from the first scale, one only from the second scale, and oneonly from the third scale. The checklist joins together the three ratingscales, and it joins together a multitude of tasks. Moroney included a ~)
18
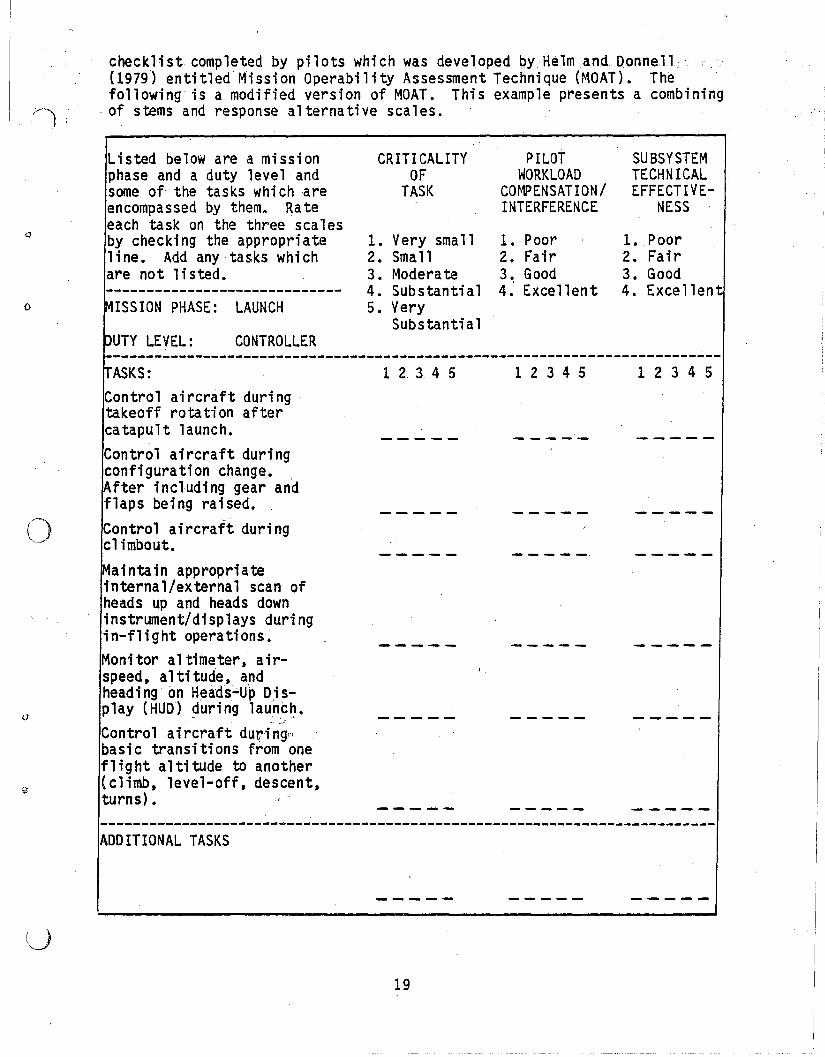
checklist completed by pilots which was developed by Helm and Donnell(1979) entitled Mission Operability Assessment Technique (MOAT). Thefollowing is a modified version of MOAT. This example presents a combining
. of stems and response alternative scales.
Listed below are a mission CR ITI CALITY PILOT SUBSYSTEMphase and a duty level and OF WORKLOAD TECHNICALsome of the tasks whi chare TASK COMPENSATION/ EFFECTIVE-encompassed by them. Rate INTERFERENCE NESSeach task on the three scales
CI by checking the appropriate 1. Very small 1. Poor 1. Poorline. Add any tasks which 2. Small 2. Fair 2. Fairare not 1i sted. 3. Moderate 3. Good 3. Good----------------------------- 4. Substantial 4." Excellent 4. ExcellentMISSION PHASE: LAUNCH 5. Very
SUbstantial
--"---
()
pUTY LEVEL: CONTROLLER~--------------------------------------------------------------------------~ASKS: 1 2. 3 4 5 1 2 3 4 5 1 2 3 4 5Control aircraft duringtakeoff rotation aftercatapult launch.Control aircraft duringconfiguration change. , .~fter including gear andflaps being raised.Control aircraft duringclimbout.~aintain appropriateinternal/external scan ofheads up and heads downinstrument/displays duringin-flight operations.Monitor altimeter, airspeed, altitude, andhead i ng on Hea.ds~U·p Di s-play (HUD) ~uring launch..Control aircraft dur.;-..ingn
basic transitions from oneflight altitude to another(climb, level-off, descent,turns).
ADDITIONAL TASKS
19
Developing survey items begins with a canvass of what questions ought,to be asked. Following this is considerq.tion of how to structure theresponse set for the respondent, and identifying the type of questionnairelayout. The statistical analysis selected will follow from the measurement ""1.'1scale displayed and response data obtained.
Comparisons of Multiple-Choice Scales
The research reviewed in this section on mUltiple-choice items wasperformed with samples containing college level students, with the excep~ion of two studies representing Australian males (Ray, 1980) and computergenerated samples (Blower, 1981). 'No clear comparisons or conclusions werepossible because of , the different research designs used in comparing theseitems. For example, Blower measured a psychophysical procedure using afour-alternative mUltiple-choice task on a computer-generated sample.Deaton, Glasnapp, and Poggia (1980) measured the effects of frequencymodifiers, item length, and statement direction.
Deaton, Glasnapp, and Poggia (1980) found a main effect for itempositive and negative wording, and item length at the .05 level of significance. As item length increased, the average response rate moved towardthe center of the response scale. Posi tive ly-worded items received highermean responses than negatively-worded items.
Likert formats were used by Deaton, Glasnapp, and Poggio (1980), Ray(1980), and Bardo and Yeager (1982). Bardo and Yeager found .that Li kertforma ts were consistently affected by response style regardl ess, of thenumber of scale points (4, 5, and 7). Ray compared measures of achievementmotivation using a Likert behavior inventory format,fQrced-chpi,c;e items, (')i'and a projective test. Behavior inventories, using a Likert format and " ,forced-choice format, were both valid although a projective format was not.
Beltramini (1982) compared unipolar, bipolar, vertical, horizontal,and 5 and 10 scale point instrtanents to determine whether individual scaleitems were able to discriminate between two objects (black and whi tefullpage advertisements for a national fast-food restaurant) for the differentformats used in this experiment. There were no signi.ficant interaction 'effects or main effects. Behavtoral expectation scales were compared tochecklists and graphic rating scales by Zedeck, Kafry"and Jacobs (1976).
'No conclusion as to format or scoring system superiority could be drawnfrom-thi's-research.- "Even so, different response formats and scoring systems led to different interpretations for performance appraisal scales.
Conclusions Regarding Multiple-Choice Scales
Results for multiple-choice scales are mlxed. They do not lead to anyconcise conclusions. Replication of studies may be useful. Research thatfocuses on other variables, such as training, cognitive style, scale developmental procedures, and other variables, other than format variations, maybring about more fruitful lines of research.
20
'~
)
)
No one mUltiple-choice type of fonnat can be reconmended.Likertscales appear to be statistically superior to Thurstone scales, and Guttmanscales are statistically superior to Likert scales (McIver &Carmines,1981) • Guttman sealesshouldbe used with interval measurement on ly,andare the most difficult to develop. Guttman scales have been used to measure psychophysical phenomena (Blower, 1981; Jesteadt, 1980) and attitudesurvey items (McIver &Cannines, 1981; Backstrom &Hurchur-Cesar, 1981).Guttman scaling theory is used in the expanding field of adaptive testing.
21
(),
..".
()
·Pit'
u
2.2 BIPOLAR SCALES
Description of Bipolar Scales
Bipolar scales are usually associated with semantic differentialscales (K10ckars, King, &King, 1981). Bipolar scales are traditionallyanchored by verbal labels at the endpoints. It is assumed that the scaleshave bipolarity since they are usually anchored by adjectives which areantonyms (Mann. Phillips, & Thompson, 1979). As semanti cdi fferenti a1scales, they have been used extensively in marketing research. In addition, Army Research Institute (ARI), Fort Hood, TRADOC Combined Arms TestActivity (TCATA), and Operational Test and Evaluation Agency (OTEA) haveused bipolar scales almost exclusively in their human factors assessmentsof Army systems, organizations, and training. Bipolar scales have been.extensively used for self-description in personality assessment, althoughthere have been other applications for these scales. (Army Research Institute, Fort Hood, Texas has been using bipolar scales, but not in semanticdifferential format.) , .
The semantic space between the bipolar anchors theoretically have athree-factor structure: evaluation, potency, and activity, which wasintroduced by Osgood, Sud, and Tannenbaum (1957). The. three-factor structure introduced by Osgc;>od et a1~. has' been found to be present when measuring person~lity traits and attitudes. The application of bipolar scalesfor human factors. assessments of Army systems cannot be. assyrned to have thesame under1yi ng three dimensi ons. Evaluation would be the 'primary dimen-sion used in the assessments of Army systems~ Included in·:·theeva1uationdimension are the com'ponen~s of'evaluation of human factors/ sU'ch as:effectiveness (+,-),(~dequacy '(+,-), satisfactoriness (+,-),time1iness(+~ .. ), and accuracy (+, -). ,Mann, Phi 11 ips,' and Thompson (1979 )menti oned 'that there has been the assumption ,that a line anchored by" the polar termshas opposite meaning and equal distance between the twosyrmnetrical poles.
,T hi s assumpti on ha,s not been totally supported bY research'; I t does notaccount for th~ center of the 'scale (zero poi nt), without whi ch one cannot·te1rWhere 'onenieani ng 1eaves off and its opposite starts. 1t is assumed,that the' 'distance from the mid'point to Pole A is equai and opposite thedi stance from the midpoi nt to Pole B. '
Construction of bipolar scales ,embedded in the ~emantic differentialfreciuently uses a series of seven i:ntervals along the scale, ,line. Someresearchers use other numbers of sc'aleinterva1s, such' as: 5' and 11 (Johnson, 1981;'Eiser & Osmon, 1978;' Klockar's, King, & King, 1981). The bipolarscales are often anchored by four adjec:tive trait terms. The scales aredivided into subsets so that each ~djective is used as an endpoint onlyonce in each 'subset. K10ckars et ale provide an example of bipolar endpoints using, Peabody' s 1967 four adjecti.ve trait terms: Cautious"';Bold,Rash-Timid, Cautious-Rash, Bo1 d-Tiinid. Other variati ons for the i dentification of endpoints on bipolar scales have also been deve1;oped. Forexample'Lquasi-po1ar scales were developed by using partial 'antonyms ofundetermined functional antonymity (Vidali, 1976). Beard (1979) usedbipolar scales with pictorial anchors~ and Dickson and Albaum (1977) usedphrases as endpoints.
23
".: :Examples 'of Btpola~ Scales
Dolch (1980) compared numerical bipolar scales and adverb bipolarsea1es on a semantic differenti a1 to measure students I fee ling~ to evaluatea text for introductory sociology. An example of one of his numerical )scales is as follows:
"Be10w is a series of adjectives which might be used. to describethe Cap10w text. Circle the number which best expresses how youfeel.
Important 32 1 a 1 2 3 Unimportant
If you feel the book is really important, circle 3."
The adverb scale varied from the numerical scale by placing adverbs at thescale points instead of numbers. Subjects using the adverb scales wererequested to circle the adverb that best expressed their feelings.
Bipolar scales are widely used.with the semantic differential technique. Researchers have selected bipolar scales using the semantic differential that appeared to be appropriate to measure various contert areas.When new bipolar scales are developed, they need to be tested for theirpsychometric properties, the bipolarity of the endpoints, and for theunderlying assumptions of the semantic differential.
In the bipolar items that the ARl, Fort Hood, Texas uses, the researchers started out using scale lines, but have reduced the frequency ofsuch use greatly. The scales use a horizontal layout; a scale lin.e couldhave been penned in if it was worth the effort. ARI resear.chers a1 so usethe same response alternativ~s in a vertical format; both with ~ndwithoutnumerical values preceding the positive and negative respon~e a1te.rnatives,and a "0". in front of the midpoint response alternative. It's ,probablysomewhat less obviousthit..t the.,re.searchers are suggesting a scale whenusing the .vertical fonnat, .but they are,. The pr;oime example .ofa/scale is aruler. Most rulers ct.re,unipolar and have three,e"ements: the numbers, thetick marks, and theli.ne'.' ARI, Fort ~ood, Tex'a~ ..h~s ,got~n awaY ,f:rom usingthe tick marks and the 1ine ,but sti 11 uses the numbers. ' The ARI researche.rs use a variation influenced by the scales one finds (or used to) in analgebra book. That is, they have a conceptua·11ine with a "0" centereda 1J~119.j t;__lleg_a t'L'LELflymbers- r._unntng 5n _onedi recti on; and pos i ti ve numbersrunning in the opposite direction (left or right makes no difference to thescale, although in algebra the negative numbers run to the left or downward). When unlined scales are used with word anchors at the ends and;-ntermediate points with numbers beneath the words, the numbers may notalWaYS be equally spaced. There is no deliberate distortion sought or .deviation from the appearance of equal spacing of the response alternativesalong the conceptual line.
The Nystrom Number Scale is based on an algebrct.ic number scale. In anearlier version of this scale, antonyms were placed above the numbersrather than at the two ends of the string of numbers. The concept was. tolabel the two directions without overly influencing or anchoring the mean,ing of the end numbers. The result might be that respondents would make
24
.""
/ )
'/00>
()
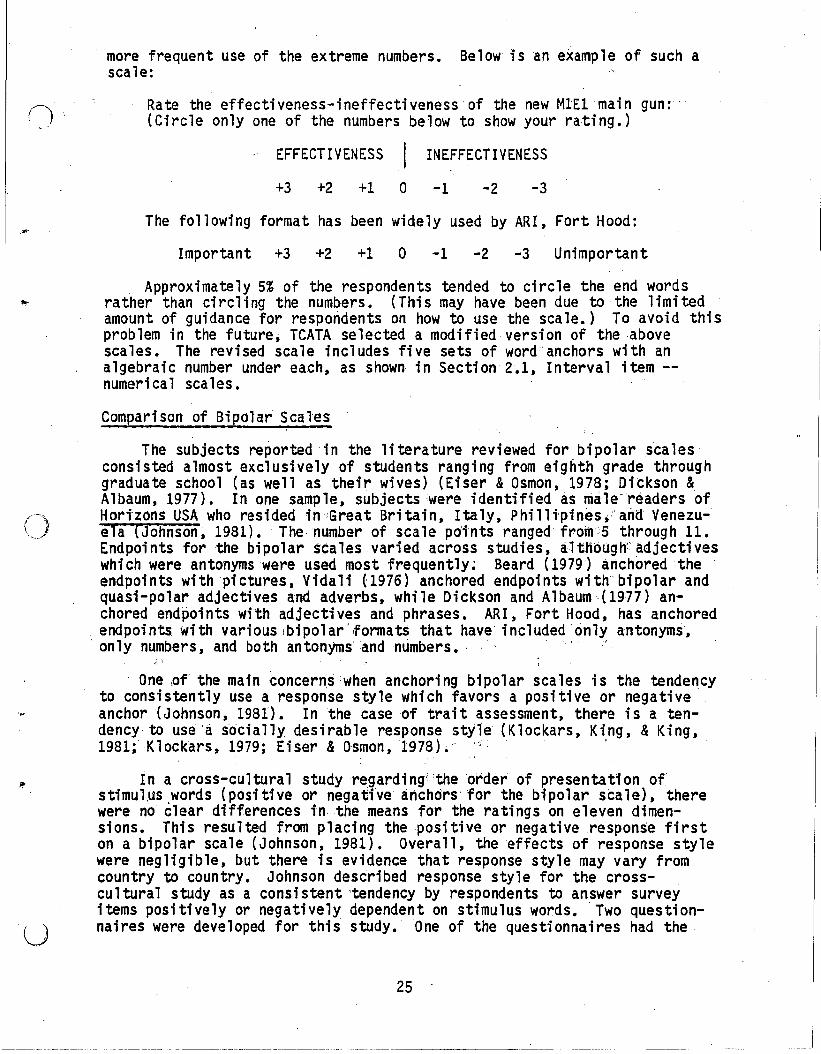
more frequent use of the extreme numbers. Below isan example of such ascale:
Rate the effectiveness-ineffectiveness of the new M1El main gun: .(Circle only one of the numbers below to show your rating.)
EFFECTIVENESS INEFFECTIVENESS
+3 +2 +1 a -1 -2 -3
The following format has been widely used by ARI, Fort Hood:
Important +3 +2 +1 a -1 -2 -3 Unimportant
Approximately 5% of the respondents tended to circle the end words'I'!" rather than'circling the numbers. (This may have been due to the limited
amount of guidance for respondents on how to use the scale.) To avoid thisproblem in the future, TCATA selected a modified version of the abovescales. The revised scale includes five sets of word anchors with analgebraic number under each, as shown in Section 2.1, Interval item -numerical scales.
Comparison of Bipola~ Scales
The SUbjects reported in the literature reviewed for bipolar scalesconsisted almost exclusively of students ranging from eighth grade throughgraduate school (as well as their wives) (Eiser &Osmon, 1978; Dickson &Albaum, 1977). In one sample, subjects :were identified as male readers of
/-~)' Hortzons USA who resided in';Great Britain, Italy, Philli'pines;"and Venezu-\.,. ela (Johnson, 1981). The number of scale po'ints rangedfroin5 through 11.
Endpoints for the bipolar scales varied across studies, altnouglfadjectiveswhi ch were antonyms 'were used most frequently; Beard (1979) anchored theendpoints with 'pictures, Vidali (1976) anchored endpoints with bipolar andquasi-polar adjectives and adverbs, while Dickson and Albaum·(1977) anchored endpoints with adjectives and phrases. ARI, Fort Hood, has anchoredendpoints with various !bipolar',formats that have included only antonyms,only numbers, and both antonyms'andnumbers., . '."
... \
One lof the main concern,s when anchoring bipolar scales is the tendencyto consistently use a response style which favors a positive or negative
',< anchor (Johnson, 1981). In the case of trait assessment, there is a tendency to use 'a socially desirable response style (Klockars, King, & King,1981; Klock'ars, 1979; Eiser & Osmon, '1978) ....;. '
In a cross-cultural study regarding ;theorder of presentation ofstimul,uswords (positive or negative anchors' for the bipolar scale), therewere no clear differences in the means for the ratings on eleven dimensions. This resulted from placing the positive or negative response firston a bipolar scale (Johnson, 1981). Overall, the effects of response stylewere negligible, but there is evidence that response style may vary fromcountry to country. Johnson described response style for the cross-cul tural study as a consi stent 'tendency by respondents to answer surveyitems posi tively or negati vely dependent on stimul us words. Two questi on-.U naires were developed for this study. One of the questionnaires had the
25
......_-- _. ------ ._._---- .
positive stimulus words presented first. The other questionnaire had thenegative stimulus words presented first. (This was on a semantic differential scale with 11 intervals from 0-10.) Johnson performed sign tests todetennine the significance of differences between the means within eachcountry. The sign test was significant at the .05 level fora responsestyle in the·Philippines, and in Italy. These results indicate that thereis a tendency by respondents in the Philippines to use a positive responsestyle, and by respondents in Italy to use a negative res.ponse style.Respondents from Britain and Venezuela had no response style related to theorder of presentation for the two questionnaires. Johnson suggested thatbipolar adjective scales have not usually been affected by the placement ofstimulus words across national studies, but that cross-cultural studies mayrequire taking response style into consideration for homogeneous groups,especially when the situation is ambiguous and/or unstructured (see Section4.5, Balanced Items).
Klockars, King, and King (1981) and Klockars (1979) explored bipolarscales for social desirability responses. Klockars et ale used sets ofbipolar scales in the semantic differential format to measure the sUbjects '(psychology students) self-description for 13 different personality traits.Scales were constructed so that they had both positive (desirable) endpoints, both negative (undesirable) endpoints, and a combination of onepositive (desirable) endpoint and one negative (undesirable) endpoint. Itwas assumed that the underlying structure for the connotative meaning iscomposed of evaluation, potency, and activity (see Section 2.3, SemanticDifferential Scales). They explored the dimensionality of the bipolarscales used in self-description for personality assessment. It has beenargued that there is a social desirability response (related to the evaluation portion of the underlying structure of the semantic differential), andthat it may confound the response style on personality instruments. Theyinvestigated whether the social desirability responses were predominant inself-ratings. It was determined that the scores were.internally consistentand were not correlated with social desirability. They were not able toobtain evidence to support a social desirability response tendency.
Klockars (1979) felt that when both endpoints on a bipolar scale wereanchored with verbal labels that there was the possibility of confoundingratings with trait (for personality scales), and social desirability responses. This research was simi 1ar to that reported above by Kl ockars,King, and King (1981). The scales that were constructed by Klockars (1979)were all trait scales. The results were confounded whether the stem was adesirable or undesirable adjective. These findings were significant at the.05 level indicating that subjects systematically rate scales so that thedesirability dimension is confounded with the trait dimension. Klockars(1979) compared the strength of the social desirability effect when thestem words were undesirable.' The level of significance obtained was .05.When a socially undesirable adjective is presented, there is a propensityfor ~ubjects to select an adjective which is opposite in desirability. Theresults obtained by Klockars (1979) are in conflict with the Klockars,King, and King (1981) findings.
In a study performed by Eiser an~ Osmon (1978), bipolar scales wereconstructed. Half of the scales consiste~ of endpoints anchored by positive labels at both ends of the scale. The other half of .the scales were
26
( )
anchored by negative labels at both endpoints of the scales. They hypothesized that when a scale was anchored at both ends by negative labels, theresponses obtained should represent a wider perspective and have lesspolarized ratings. This should be irrespective of the attitudes of therespondents. They also hypothesized that scales which were anchored atboth endpoints by positive labels would have more polarized ratings. Theirfindings indi~ated that subjects gave more polarized ratings at the .001level of significance for scales with endpoints which were both positivelylabeled, as well as for scales with both endpoints negatively labeled. Themiddle portions of the scales may have been perceived as being neutral whenboth endpoints were labeled positive or negative. They indicated thatra ters tended to give posi ti ve responses to i terns they agreed wi th, andnegative responses to items they disagreed with. For items respondentsagreed with, they tried to avoid giving a negative response. Respondentstried to avoid giving positive ratings to items they disagreed with. Theseresearchers intended that the scales used in this study be symmetrical interms of grammatical form and evaluation. They determined that the effectsof the response language (positive or negative) used for endpoints on abipolar scale can influence the response, independent of the subjects'atti tudes.
In situations where researchers are using bipolar scales as a vehiclefor determining the influence of positive and negative anchors, they may attimes be violating the theories relevant to the underlying structure oftheir scales. For example, it is assumed that bi.polar scales are anchoredby adjecti ves whi ch are antonyms (Mann, Phi 11 ips, & Thompson, 1979). Whena scale is anchored by endpoints which have labels that are both positiveor both negative, the researchers have violated the assumption of bipolarity. More research may be required on bipolarity because of: violation ofthe basic assumption of bipolarity, conflicting research results, andpaucity of research on the toplc. There is not clear evidence to substantiate the effects of: the influence. of positive or negative endpoints onbipolar scales, and the effects of social desirability responses and theirconfounding with other variables (e.g., the evaluation factor found insemantic differential 'scales).
Other research has focused on bipolar endpoints which differ in otherways than positive and negative anchors. Dolch (1980) compared bipolarscales anchored with numerical or adverb responses. The correlation between the two scales was -.929. On the surface, it did not appear tomatter which type of endpoints were used. A factor analysis of the twoscales ·revealed markedly 'different factor structures which indicates thatthe two scales were not measuring meaning in the same way.
The differences between scales anchored by bipolar or quasi-polaradjecti ves and the effects of concept interacti on were exami ned by Vi da 1i(1976). Quasi-polar scales contained anchors that were considered to beonly partially antonymous. The effects of concept-scale interaction on reliability did not impair the reliability of the scales. There was aninteraction effect when the scale was used with certain concepts identifiedas "unstable. 1I The inadvertent use of mismatching scales (by using antonyms with partial antonyms) did no·t appear to jeopardize the reliability ofthe scale.
27
( In an unusual approach in the developnent of bipolar scales, Beard(1979) anchored endpoints with pictures instead of by the common verbalanchoring. Beard anchored bipolar scales with pictorial anchors throughthe use of color slides and rating forms with replicas of the .slides. Thepictorial anchors were not verifiable as antonyms. There may be an appl ication for this type of measurement in human factors research on equipnentdesigns, and for respondents who are limited by language facility yet havecognitive strengths for spatial differentiation. New developnental techniques and methods would have to be established for group administration.
The studies cited in this research in bipolarity have been diverse inthe variables measured, the analyses applied, and the results obtained.Applicability is limited to students and survey application to academicenvironments.
Conclusions Regarding Bipolar Scales
The assu~ption of bipolarity for scaling pu~poses is that Pole A toPole B is 180. In application, scale bipolarity may be approximate.Scales do not always meet the criterion of bipolarity mentioned above.The variables that have affected bipolar scales have been: the differencesamong how respondents rate the scales, the issue of the relevancy of thescale to the respondent, and the assumptions about the psychometric qualities of the scale as developed by Osgood, Suci, and Tannenbaum (1957).
Conformation in studies was not found for social desirability responses, and first presentatiton of endpoints for positive or negativeanchors. Subjects may be confounding trait dimensions with response anchors. It is possible that some individuals may make greater use of theextreme categories at the ends of the scale because they are influenced bythe descriptive anchors (Johnson, 1981; Eiser &Osmon, 1978; Klockars,1979; Klockars, King, &King, 1981). There is no clear evidence to suppo~t
the existence of response style associated with the order of positive ornegative anchors.
The meaning of the midpoint is also of concern for bipolar scales,behavioral observation scales, behavioral expectation scales, behaviorallyanchored rating scales, etc. There is some question abqut what the midpoint is actually measuring (neutrality, ambivalence, or irrelevance).According to Mann, Phillips, and Thompson (1979), respondents may includean irrelevance response separate from the scale midpoint, such as the"Don't Know" category. Variations in instrument format and instruction didnot alter the scale dimension. These bipolar scales did not provide aseparate "Don't Know" category (see Section 5.2, "Don't Know ll Category, andSection 5.4, Middle Scale Point Position).
Bipolar scales have ~ad many applications. For example, Dickson andAlbaum (1977) were able to successfully develop a marketing survey onretail store images for supermarkets, department stores, shoe stores, anddiscount stores using a semantic differential format. This indicates thatsurvey researchers may want to explore the use of the semantic differentialwhen developing new bipolar instruments.
28
--- _._--- -------
.~.
"j
)
(. '\
I',)
Bipolar scales have proven to be psychometrically sound when using thesemantic differential format. Manipulation of the anchors for type ofanchor or presentation of positive/negative anchors does not appear togreatly affect the resul ts. Research on response sets has not been con-sistent so that a trend cannot be cited. '
29
/' ",
. )
..
,r. i' .
\.,1
2.3 SEMANTIC DIFFERENTIAL SCALES
Description of Semantic Differential Scales
Semantic differential scales were developed by Osgood, Suci, andTannenbaum .in 1957 (Klockars, King, &King, 1981; Downs, 1978; Maul &Pargman, 1975). A concept or descriptive term is presented to the respondent (Maul &Pargman, 1975). These scales are usually anchored by adjectives with opposite meanings at the endpoints (Backstrom &Hurchur-Cesar,1981; and Klockars, King, &King, 1981). Semantic differential scalesalmost always have a horizontal bipolar format with seven s.cale points(Church, 1983). Some scales have been known to have fewer scale points(Albaum, Best, &Hawkins, 1981~ and Vidali, 1976).
The underlying assumption of the semantic differential scale is thatthere are three major factors for the measurement of concept in the semantic space (Klockars, King, &King, 1981; Malhotra, 1981; Dziub~n &Shirkey,1980; and Maul &Pargman, 1975). The three major factors accounted for inthe semantic space are: Evaluation, Potency, and Activity (EPA). Theevaluation factor is responsible for.the greatest amount of variance(Klockars, King, & King, 1981). The dominant evaluative factor indicates agood-bad perception by the respondent. Perception of the potency factor isrelated to a strong-weak relationship, and the activity factor indicates aperception of fast-slow (Maul &Pargman, 1975).
Semantic differential scales have been used by researchers in multiplefields, such as marketing, education, and psychotherapy. Marketing re:searchers have used this instrument extensively (Malhotra, 1981; Downs,1978). These scales measure attitudes and opinions (Church, 1983), Attitudes may include unconscious or nonverbalized avoidance tendencies.Opinions are restricted to verbalized attitudes. The concepts of attitudeand opinion are closely aligned and not always overlapping (Kiesler, Collins, &Miller, 1969).
The selection of anchors for endpoints has been accomplished in various ways. One approach has been to select anchors through free associationof subjects for concepts, and through the use of dictionaries and thesau~
ruses. After a pool of' items has been compiled, agreement by judges facilitates a reduction in the number of items. Factor analysis and clusteranalysis can also be used to detennine which items load on 'the same factor,and which items tend to cluster together. This allows for further reduction in the number of items (Malhotra, 1981). The selection of itemsallows for instruments which are individually designed for specific research projects (Dziuban & Shirkey, 1980). This is an important aspect ofscale development for the semantic differential since the meaning of anitem and its relationship to other items will ,change depending on whatconcept is being assessed (Dickson &Albaum, 1977).
Examples of Semantic Differential Scales
Semantic differential scales have been developed with different endpoint anchors, such as adjectives, adverbs, and phrases. These scales have
31
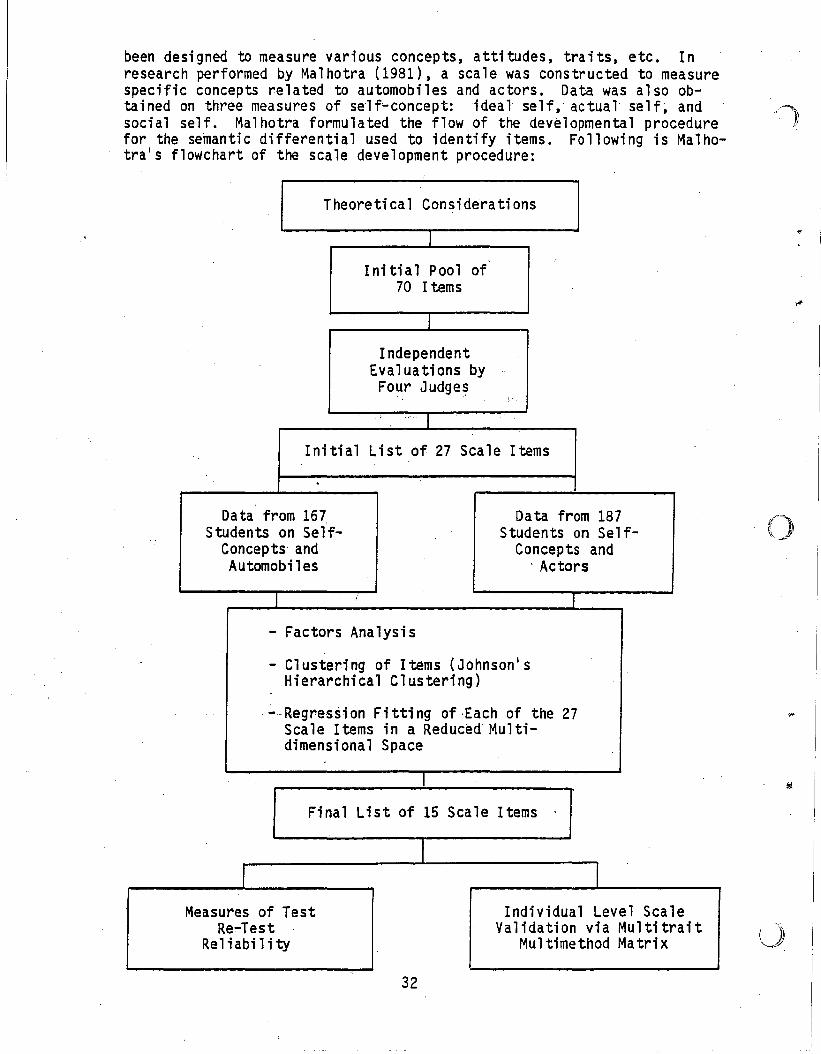
been designed to measure various concepts, attitudes, traits, etc. Inresearch performed by Malhotra (1981), a scale was constructed to measurespecific concepts related to automobiles and actors. Data was also obtained on three measures of self-concept: ideal self,actual self~ andsocial self. Malhotra formulated the flow of the developmental procedurefor the semantic differential used to identify items. Following is Malhotra's flowchart of the scale development procedure:
i
Theoretical Considerations
I
In i ti alP 001 of70 Items
I
IndependentEvaluations byFour Judges
,,' I
Initial List of 27 Scale Items
Da ta from 167,Students on Self
Concepts' andAutomobiles
Data from 187Students on Self
Concepts and, Actors
()
- Factors Analysis
- Clustering of Items (Johnson'sHierarchical Clustering)
-Regres*ion Fitting of ,Each of the 27Scale Items in a Reduced' Multidimensional Space
I
Final List of 15 Scale Items
,..
IMeasures of Test
Re-TestRe1i abil i ty
I
32
IIndividual Level Scale
Validation via MultitraitMultimethod Matrix (~
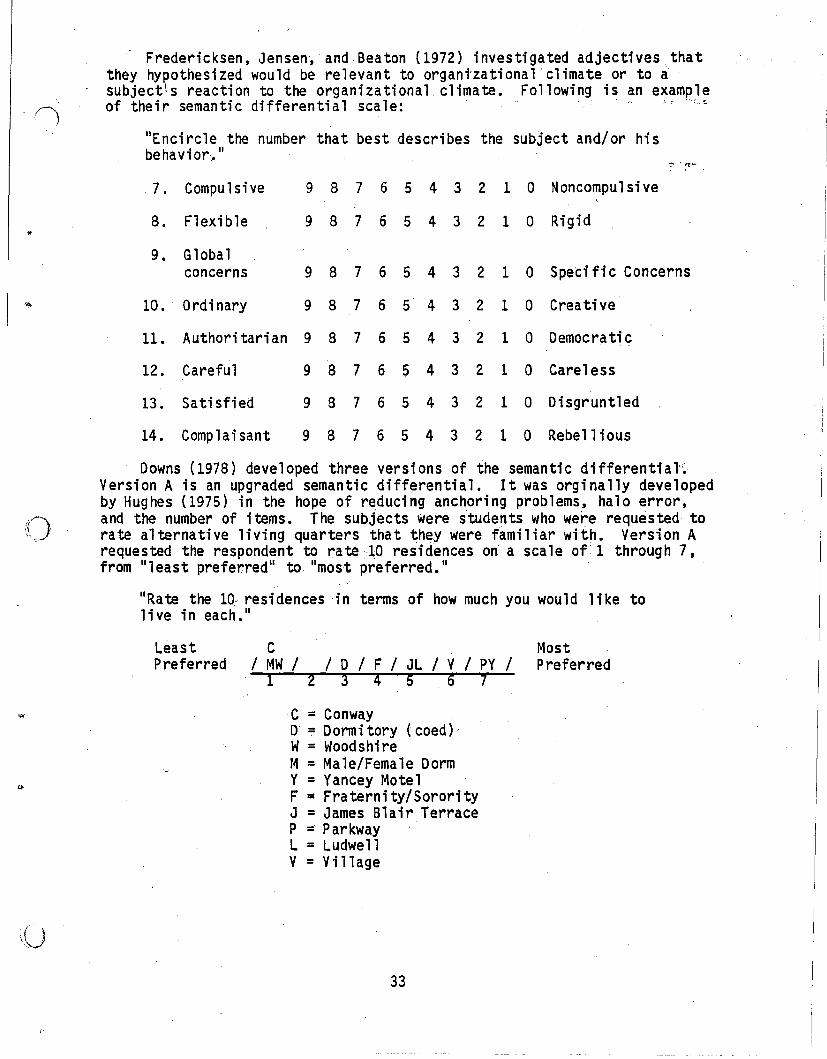
Fredericksen, Jensen, and Beaton (1972) investigated adjectivescthatthey hypothesized would be relevant to organi'zationalclimate or to asUbject!s reaction to the organizational climate. Following is an exampleof their semantic differential scale: .\ : ..;';:t
-,..--)
IIEnci rcle the number that best descri bes the subject and/or hisbehavi or,. II
~ . 1":: ....
7. Compulsive 9 B 7 6 5 4 3 2 1 0 Noncompulsive
8. Flexible 9 8 7 6 5 4 3 2 1 0 Rigid
9. Globalconcerns 9 8 7 6 5 4 3 2 1 0 Specific Concerns
~ 10. ' Ordi nary 9 8 7 6 5 4 3 2 1 0 Creative
11. Authori tari an 9 B 7 6 5 4 3 2 1 0 Democrati c
12. Careful 9 8 7 6 5 4 3 2 1 0 Careless
13. Satisfied 9 8 7 6 5 4 3 2 1 0 Di sgruntled
14. Complaisant 9 8 7 6 5 4 3 2 1 0 Rebellious
Downs (1978) developed three versions of the semantic differential'~
Version A is an upgraded semantic differential. It was orginally developedby Hughes (1975) in the hope of reducing anchoring problems, halo error,and the number of items. The subjects Were students who were requested torate alternative liVing quarters that they were familiar with. Version Arequested the respondent to rate 10 residences on a scale of 1 through 7,from IIl eas t preferred ll to IImost preferred. II
IIRate the 10 residences in terms of how much you would like tolive in each. 1I
Least C MostPreferred / MW / / D / F / JL / V / PY / Preferred
1 2 345 6 7
-C = ConwayD = Dormi tory (coed))W= WoodshireM =Male/Female DormY = Yancey MotelF = Fraternity/SororityJ =James Blair TerraceP :: ParkwayL = LudwellV = Vi llage
{)
33
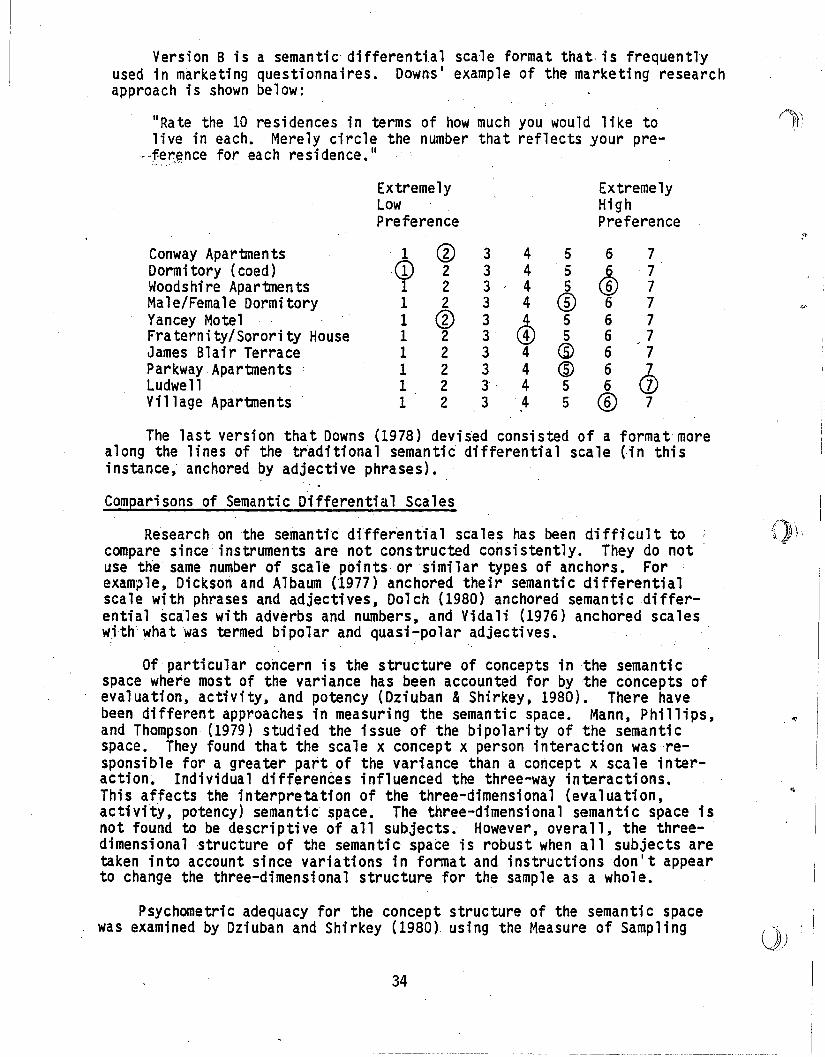
Version B is a semanti~differential scale format that, is frequentlyused in m~rketing questionnaires. Downs' example of the marketing researchapproach is shown below:
The last version that Downs (1978) devised consisted of a format morealong the lines of the traditional semantic differential scale (in thisinstance, anchored by adjective phrases).
Comparisons of Semantic Differential Scales
Research on the semantic differ'ential scales has been difficult tocompare since: instruments are not constructed consistently. They do not "use the same number of scale points or similar types of anchors. Forexample, Dickson and Albaum (1977) anchored their semantic differentialscale with phrases and adjectives, Dol ch (1980) anchored seman ti cdi fferential scales with adverbs and numbers, and Vidali (1976) anchored scalesw,ith what was termed bipolar and quasi-polar ,adjectives.
Of particular concern is the s tructureof concepts i nthe semanticspace where most of the vari ance has, been accounted for by the concepts ofevaluation, activity, and potency (Dziuban &Shirkey, 1980). There havebeen different approaches in measuring the semantic space. Mann, Phillips,and Thompson (1979) studied the issue of the bipolarity of the semanticspace. They found that the scale x concept x person interaction was 'responsible for a greater part of the variance than a concept x scale interaction~ Individual differences influenced the three-way interactions.This affects the interpretation of the three-dimensional (evaluation,activity, potency) semantic space. The three-dimensional semantic space isnot found to be descriptive of all subjects. However, overall, the threedimensional structure of the semantic space is robust when all subjects aretaken into account since variations in fonnat and instructionsdon't appearto change the three-dimensional structure for the sample as a whole.
Psychometric adequacy for the concept structure of the semantic spacewas examined by Dziuban and Shirkey (1980) using the Measure of Sampling
34
V)
"
()
Adequacy. A change in dimension may take place when different concepts arepaired with different scales~ Use of the Measure of Sampling Adequacy canassist the researcher in identifying which sca1es are inferior,and,w,hjC:.h:scales to retain. Dickson and Albaum (1977) tested the concept. x scaleinteraction of the semantic space by developing bipolar scales where themajority of anchors were phrases. Their scales were found to be reliableat the .01 level of significance. Benel and Benel (1976) investigated "whether there were male/female differences in rating the semantic differential fo~ the three-dimensional concept scale interaction (evaluation,activity, potency), and found no differences in rating.
The three-dimensional concept scale interaction for the semantic spaceappears to be robust across studies, although it cannot be counted on tqhold for ideosyncratic differences. Different scales combined with different concepts may not prove adequate. For different experimental conditions, the researcher is forced to design new instruments instead ofborrowing instruments from dtfferent investigators (Vidali, 1976; Dickson &Albaum, 1977; Dziuban &Shirkey, 1980).
The literature reviewed indicated the subjects were all students withthe exception of Dziuban and Shirkey (1980), where the subjects were schoolteachers. The field of marketi ng research has used semantic'differenti a1scales to design questionnaire surveys more than any other type of scale(Dickson & Albaum, 1977; Downs, 1978). Prior to application of thesescales to the Armed Services, research using semantic d;fferentialscaleswould require scale developmental procedures u~irig the,military population.to construct scales specific to their research situations.
Since the largest portion of the variance has been' found: to be in theunderlying structur~, tl:!rm~d.}:!',aluati9n component of the semantic: space,there is always thepQssibility ofa socially:desirable response set. Thistendency is especiaFYi pronounced for the appi i cati on of the· semanti c .differential to measure,persq~ality traits where trait 'and desirabilitydimensions,.become confoundedi: :K,lockars (1979) determined that subjects hada stronger'tendencY1rto select adjectives whi ch ...,ere opposi te in desi rabili~ty when a soCially undesirabl,e adjective anchor was presented first.· Thisfinding was signifi6int at the .05 level. Klockars, King, and King (1981)were not ..,ab:le tors!Jbstantiate a socia.l desirabi 1i ty response set wherebipolar ·sca~e$ ~er~:anchoredby adjectives. The anchors were not correlated withis.ocial desirab,ility~ The inclusion of, or leick' of, a socialdesirability response. set may be associated with the developmental procedures used in sele~tion and configuration of the semantic differentialscales. . .
Typically, semantic differential scales'include seven scale p()intswith anchors. at ea:chend,although Albaum,: Best,. and Hawkins (1981) andVidali (1976) developed scales with five scale points .. Albaum, Best, andHawkins (1981) reported a. review of the literature where McKelvie (1978)indicated a loss of information when scales employ fewer than ,five or sixscale categories. No further gain of information was obtained beyond 9 to12 categories. These findings are consistent with other literature thatindicates modification of format can produce similar results among instruments.
35
In research performed by Dolch (1980), two semantic differentialscales were developed. One was a numerical scale and the other was anadverb scale. The correlation between the two scales' was -.929. It appeared that the formatdi fference made 1i ttle difference in the responsedistributions. Yet, a factor analysis revealed that the meaning in thesemantic space was not equivalent for the two instruments.
In general, the semantic differential scales have consistently maintained acceptable levels of reliabillty among studies. Validity has notalways been measured. This finding is based on the premise that sounddevelopmental procedures are used in scale construction. Semantic differential scales have appropriately been used in different contexts tomeasure the meaning of words and attitudes. The scale is flexible inmeasuring different concepts, and can be applied successfully in a numberof env i ronmen ts.
Conclusions Regarding Semantic Differential Scales-
As with other scales, no one semantic differential format has provedsuperior to others. Even though three primary concepts constitute thesemanti c spa~e, ~he. true meani ng of the semanti c space may not be known(Dolch, 1980). Of course, it is possible that there never wi 11 be a 'truemeaning for the semantic space since semantic meanings change over time~In addition, semantic meaning is dependent on the spoken word:and thewritten'word~ which are both interpreted by the encoding and decoding ofthe sUbject. It also follows that any addition, deletion, or other type ofmodification would have the potential to change the meaning of the semanticspace.
The. issue of social desirability response sets may be overcome bycareful scale construction (Klockars, King, & King, 1981; Klockars, 1979).The, use of the semantic differential scale has received extensive research.Support for this type of ,scale has'been indicated by research results thatconsistently produced levels of signi'ficance at the .05 level and above(Albaum, Best, & Hawkins,.1981; Malhotra, 1981; Mann, Phillips, & Thompson,1979; Downs, 1978; Dickson &Albaum, 1977;Vidali, 1976).
Downs (1978) administered three versions of the semantic differential.'Versions A and B, the nontraditional semantic differential scales, are'illustrated in this section under Examples of Semantic Differential Scales.Wh-i-le'-f-i-ndi-ng- no"di-fference .among the response di stri buti ons to the threevers i'ons, the tradi ti ona1 vers i on was preferred by the re sp onden ts. Thesemantic differential is sensi ti ve enough to measure person, product, and's.~lf,:~.oJ)~e.pts so that it can, be used to coordinate the image of a productto a target market (Malhotra, 1981). The seman'tic differential scale ca,nbe used in manY environments, is flexible as to alterations in the fonnat,and holds fairly stable to the three-dimensional semantic space. However,these studies on the semantic differential do not reflect the operationaltest and evaluation community·s concern for the evaluation of weaponssystems. It may be feasible to research the application of the semantlcdifferential scale to this type of environment. Respondent attitudestoward equipment would be a viable area of application.
36
.~
(),•. ,.......•..
,)
)
)
2.4 RANK ORDER SCALES
Description of Rank Order Scales
Rank order scales originate from ordinal scale measurement. Thecategories on a rank order scale do not indicate how much distance there isbetween each category, and unequal distances are assumed. The ranking process by the respondent establishes a hierarchical order (Orlich, 1978),which is also an ordinal order. In the development of rank orde~ scalesfor survey use, subject ranking has been commonly used (Backstrom &Hurchur-Cesar,1981). Respondents receive instrJctions on the assignment ofnumbers to the items (1, 2, 3, 4, etc.). This is to reveal the rank ordering that the respondent places upon the item in terms of an attribute, suchas beauty, length, performance, and preference. It is possible that theremay be any number of dimensions along which the respondent is asked to rankorder things. This set of rank orderings is termed the ordinal set so thata rank order scale is synonymous with an ordinal scale.
Thurstone investigated rank order scales and how to compare psychological variables. He developed the law of comparative judgement with anunderlying assumption which is defined in the following way: II ••• thedegree to which any two stimuli can be discriminated is a direct functionof the difference in their status as regards the 'attribute in question"(McIver & Carmines, 1981). Thurstone generated three new scalingn:Jethodsbased on his law of comparative jUdgement. , The th~ee scaling methods areknown as paired-comparisons, successive intervals, and equal 'appearingintervals.
Rank order scales continue to be used in survey research, althoughother scaling methods have gained popularity, such as Likert and Guttmanscales. There have been instances when rank order scaling procedures havebeen integrated with other complex systems. An illustration of this is thede 1ta sea1ar method used by the U. S. Navy and the Air Force AerospaceMedical Research Laboratory. The delta scalar, method is a complex system,of rank ordering found in the Mission Operability Assessment Technique andSystems Operability Measurement Algorithm (u.S. Navy), and the SubjectiveWorkload Assessment Technique (U.S. Air Force) (Church, 1983). These ,systems involve establishing a rank order scale that is converted to aninterval scale (converting ranked data into an interval scale is sometimesincorporated into the developmental procedures for behaviorally anchoredrating scales· (BARS) and behavioral expectation scales (BES) •.
ShannoA and Cart~r (1981) combined rank order methods with 7-point and5-point scales to measure pilot training. Shannon (1981b) designed abattery to assess aviator performance for pilot training on propeller, jet,and hell copter aircraft. A behavioral analysi s was performed usi og taskanalysis that included procedures such as rank ordering to isolate thecri ti cal components of the task. In other research performed bi Shannon(1981c), questionnaires were mailed to all operational squadrons in thefleet using two 7-point functional inventory scales to measure: time,effort, importance of each task, duty, and role. After the data from thequestionnaires was quantified, the tasks were rank ordered. It was felt
37
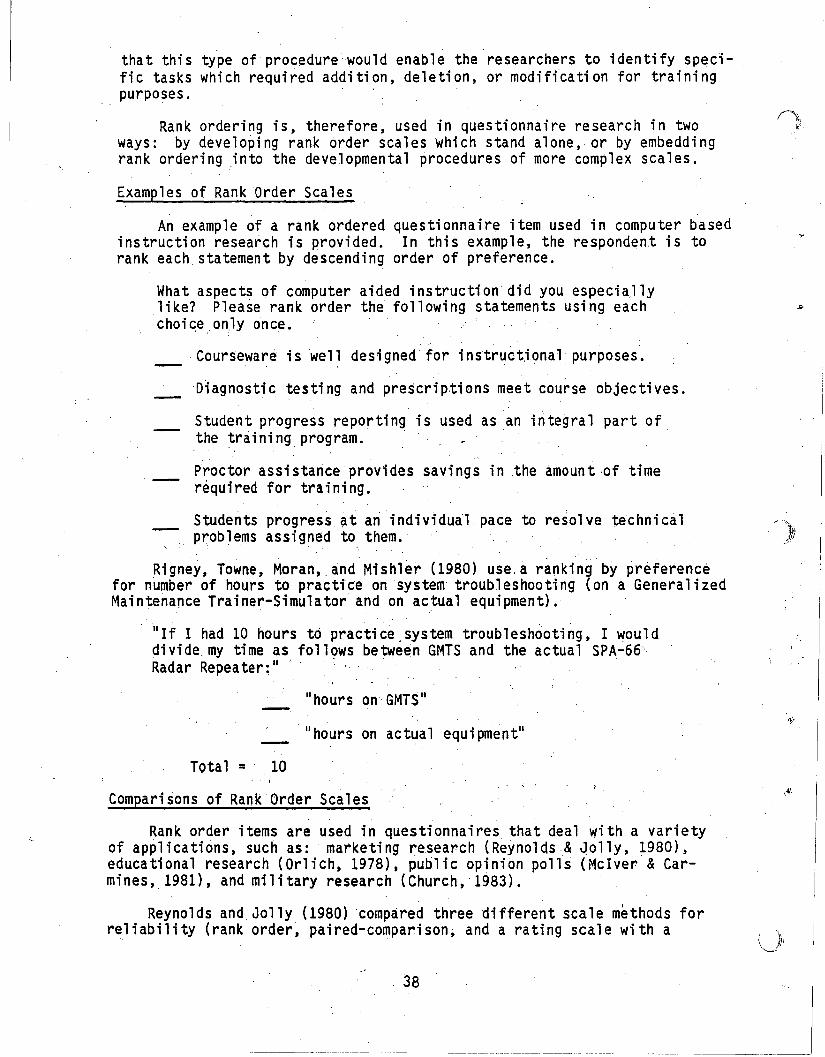
that this type of procedure would enable the researchers to identify specific tasks which required addition, deletion, or modification for trainingpurposes.
Rank ordering is, therefore, used in questionnaire research in two r~,ways: by developing rank order scales which stand alone, or by embeddingrank ordering into the developmental ~rocedures of more complex scales.
Examples of Rank Order Scales
An example of a rank ordered questionnaire item used in computer basedinstruttion resea~ch is provided. In this example, the respondent is torank each statement by descending order of preference.
What aspects of computer aided instruction did you especiallylike? Please rank order the following statements using eachchoice only once.
Courseware i swell des; gned for instructional purposes.
Diagnosti c testi ng and prescri pti cns meet course objecti ves.
Student progress reporting is used as an integral part ofthe training program. '
Proctor assistance provides savings in the amount of timerequired for training.
Students progress ~t an individual pace to resol vetechni calproblems assigned to them.
.. . . . .' '., .
Rigney, Towne, Moran, and Mishler (1980) use.a ranking by preferencefor number of hours to practice on 'system troubl eshooti ng (on a General i zedMaintenance Trainer-Simulator and on actual equipment).
IIIf I had 10 hours to practice ,system troubleshooting, I woulddivide, my time as follows between GMTS and the actual SPA-66'Radar Repea ter ~ II '
"hours onGMTS II
IIhours on actual equipment ll
Total = 10• '. t
Comparisons of Rank Order Scales
Rank order items are used in questionnaires that deal with a varietyof applications, such as: marketing research (Reynolds &~olly, 1980),educational research (Orlich, 1978), public opinion polls (McIver &Carmines" 1981), and military research (Church,'1983).
Reynolds and Jolly (1980) compared three different scale m~thods forreliability (rank order, paired-comparison; and a rating scale with a
. 38
, )'\ )'~c
(J
()
u
Likert format). Analysis of the data for test-retest reliabilities varieddepending on whether a Spearman rho was used or Kendall's tau~ Using
'Spearman's rho, the three methods appear to have equal r~liabilities. Theyreconvnend the use of Kendall' s t~u as a more appropriate measure of reliability. Using Kendall's tau, the rank order and paired-comparison procedures are more reliable than the rating scale method. They found that therating scale and rank order technique required less respondent time to rateth~n paired-comparison (significant at the ~OOOl level); Their ~indingswould indicate that rahk ordering would be a preferred scale format.
Most questi onnaire items today are based on forma ts other than rank,ordering (e.g., Likert scales). There is not enough research evidence tosubstantiate the use of rank order scales in place of other scaling meth-ods. '
Conclusions Regarding Rank Order Scales
Rank order scales are appropriate for survey items dealing with ordinal measurement. When Thurstone developed the law of compara'l:ivejudgment,his scaling techniques were considered a major advancement. Sincerankorder scales and paired-comparison scales both have a foundation 1n ordinalmeasureme'nt, rank order scales would be more time and cost effective thanpaired-comparison scales. . .
Current research indicates that the use of rank ordering isi,n transformation because it is being, used and embedded in th~procedures of morecomplex scaling systems (C-hur'ch, 1983; Shannon, 1981b, 1981c). More re-
, search will be,required to determine how functional, reliable, and valid,these new procedures will be. For example, the statistical analysesachieve varying results when the ordinal data is converted into intervalscales~ Some of the new scaling systems require prolonged periods forscale development (Church, 1983). .
39
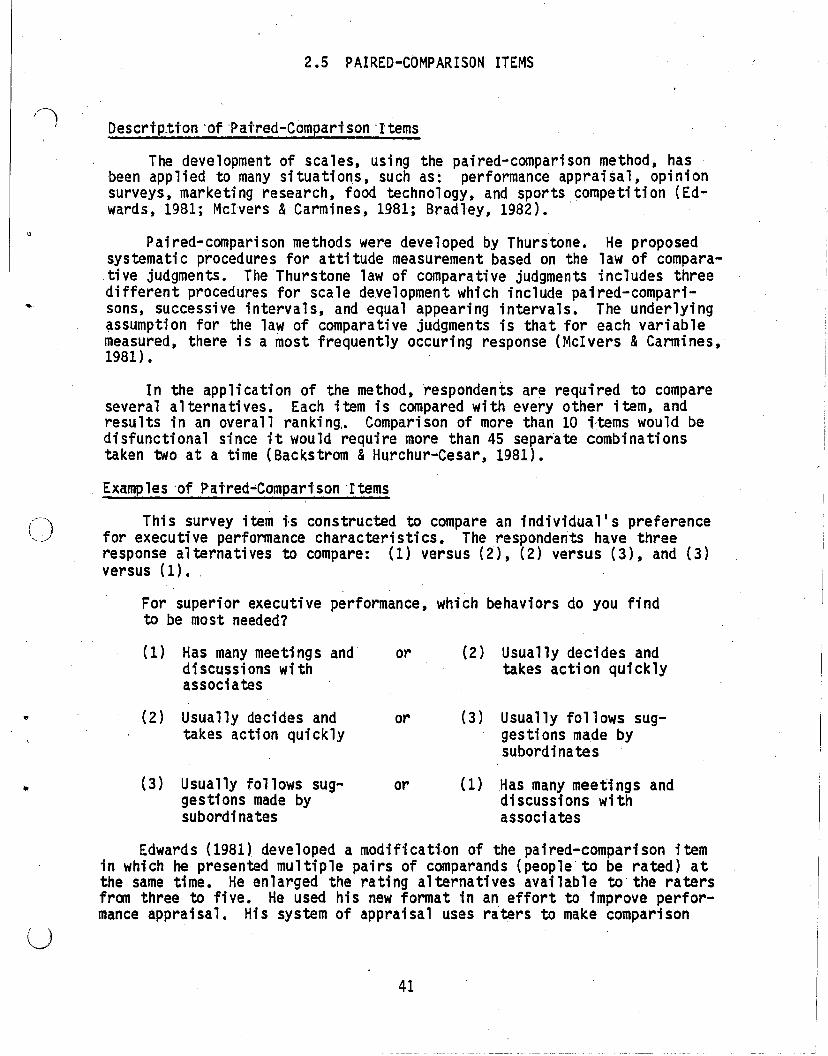
! .....
()
2.5 PAIRED-COMPARISON ITEMS
Descrtp.Uon 'of'Patred-Compartson 'Items
The development of scales, using the paired-comparison method, hasbeen applied to many situations, such as: performance appraisal, opinionsurveys, marketing research, food technology, and sports competition (Edwards, 1981; McIvers & Carmines, 1981; Bradley, 1982). .
Paired-comparison methods were developed by Thurstone. He proposedsystematic procedures for attitude measurement based on the law of comparative jUdgments. The Thurstone law of comparative judgments includes threedifferent procedures for scale development which include paired-comparisons, successive intervals, and' equal appearing intervals. The underlying~ssumption for the law of comparative jUdgments is that for each variablemeasured, there is a most frequently occuring response (McIvers &Carmines,1981). '
In the application of the method, respondents are required to comparesevera1 a1terna ti ves. Each item is compared wi th every other item, andresults in an overall ranking,. Comparison of more than 10 i·tems would bedisfunctional since it would require more than 45 separate combinationstaken two at a time (Backstrom & Hurchur-Cesar, 1981).
Examples 'of Patred-Comparison 'Items
This survey item i·s constructed to compare an individual's preferencefor executive performance characteristics. The respondents have threeresponse a1terna ti ves to compare: (1) versus (2), (2) versus (3), and (3)versus (1).
For superior executive performance, which behaviors do you findto be most needed?
..
(1) Has many meetings anddiscussions withassociates
(2) Usually decides andtakes action quickly
(3) Usually follows suggestions made bysubordinates
or
or
or
(2) Usually decides andtakes action quickly
(3) Usually follows suggesti ons made bysubordinates
(1) Has many meeti ngs anddiscussions withassociates
u
. Edwards (1981) developed a modificati·on of the paired-comparison itemin which he presented multiple pairs of comparands (people to be rated) atthe same time. He enlarged the rating alternatives available to the ratersfrom three to five. He used his new format in an effort to improve performance appraisal. His system of appraisal uses raters to make comparison
41
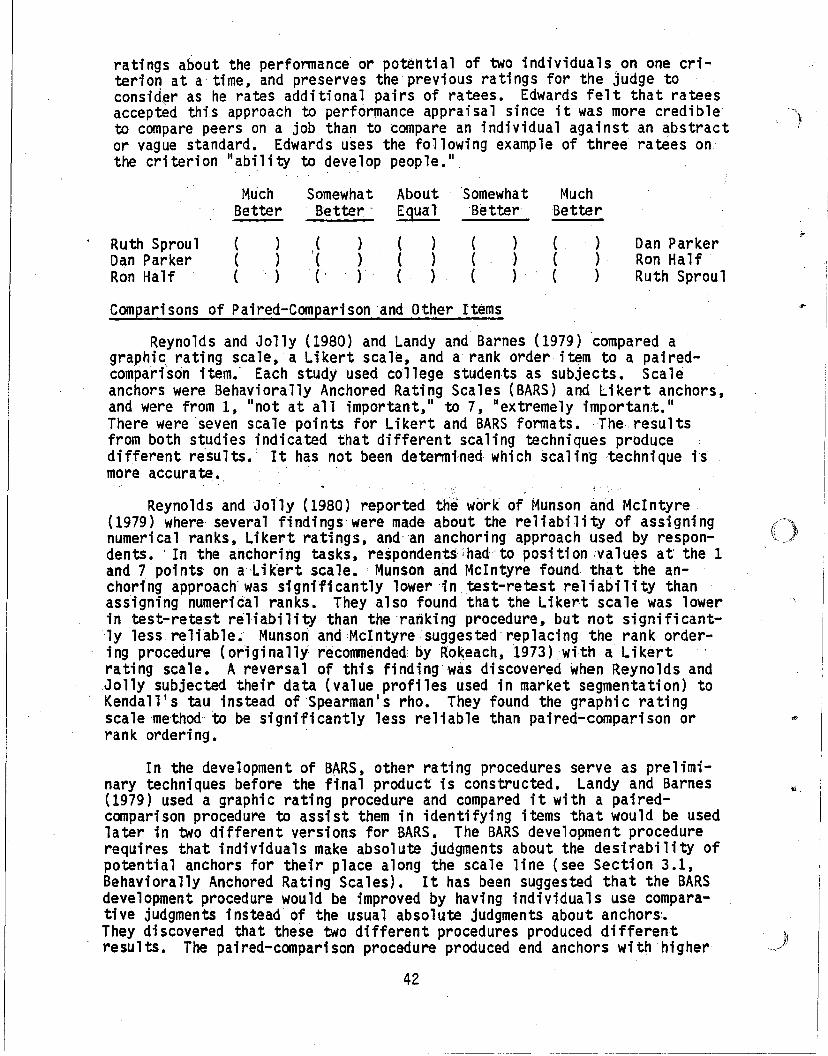
~.
ratings about the perfonnance or potential of two individuals,on one criterion at a time, and preserves the' previous ratings for the judge toconsider as he rates additional pairs of ratees. Edwards felt that rateesaccepted this approach to performance appraisal since it was more credible , '-}to compare peers on a job than to compare an i ndividua1 against an abstractor vague standard. Edwards uses the following example of three ratees onthe criterion liability to develop people.",
Much Somewhat About Somewhat MuchBetter Better' Equal 'Better Better
( ) ,( ) ( ) ( ) ( ) '"Ruth Sproul Dan ParkerDan Parker ( ) ( ) ( ) ( ) ( ) Ron HalfRon Half ( ) (- ) ( ) ( ) ( ) Ruth Sproul
Comparisons of Paired-Comparison 'and Other Items
Reynolds and Jolly (1980) and Landy and' Barnes (1979) compared agraphic rating scale, a Likert scale, and a rank order item to a pairedcomparison item. Each study used college students as subjects • Scaleanchors were Behavi orally Anchored Ra ti ng Scales (BARS) and Li kert anchors,and were from 1, IInot at all important,1I to 7, "ex tremely important. IIThere were seven scale points for Likert and BARS fonnats.The, resultsfrom both studies indicated that different scaling techniques producedifferent resu 1ts. • It has not been detennined whi ch scali n'Stechni que i'smore accura te. ,
"
Reynolds and Jolly (1980) reported the work of Munson arid McI ntyre(1979) where several findings were made about the reliability of assigning /~"-)'numerical ranks, Likert ratings, and an anchoring approach used by respon- t __ ,dents •. In the anchoring tasks, respondents"hadto position :values at' the 1and 7 points on a 'Likert scale•. Munson and McIntyre found that the an-chori ng approach' was si gnifi cantly 1ower in test-retest re1i abi 1i ty thanassigning numerical ranks. They also found that the Likert scale was lowerin test-retest reli abi 1i ty than therariki ng procedure, but not si gnifi cant-lyless reliable. Munson and McIntyre suggested' replacing the rank order-i ng procedure (or; gi nally, recoTll1lended: by Rokeach, 1973) 'with a Li kertrating scale. A reversal of this finding'was discovered when Reynolds andJolly subjected their data (value profiles used in market segmentation) toKendall's tau instead, of 'Spearman's rho. They found the graphic ratingscalemethod"tobe significantly less reliable than paired-comparison orrank ordering.
In the development of BARS, other rating procedures serve as prelimi-nary techni ques before the final product is constructed. Landy and Barnes(1979) used a graphic rating procedure and compared it with a pairedcomparison procedure to assist them in identifying items that would be usedlater in two different versions for BARS. The BARS development procedurerequires that individuals make absolute judgments about the desirability ofpotential anchors for their place along the scale line (see Section 3.1,Behaviorally Anchored Rating Scales). It has been suggested that the BARSdevelopment procedure would be improved by having individuals use compara-tive jUdgments instead of the usual absol ute judgments about anchors:.They discovered that these two different procedures produced differentresults. The paired-comparison procedure produced end anchors with higher
42
..
o
...
u
variances, and middle anchors with lower variances. There were more datapoints per anchor with the paired-comparison procedure. It appeared thatthe paired-comparison dispersion of anchors along the BARS scale lineproduced better estimates of the population than the graphic estimatesidentified by the other procedure. Using the paired-comparison procedureis a possible way to generate more anchors for the center of BARS.
The literature reviewed on paired-comparison items seems to indicatethat different scale development methods result in different item variances. However, the correct scale values are not known when comparingdifferent types of items and scales. In addition, the results are mixed asto which is the most reliable item and scale, depending on which type ofstatistical analysis is used. According to McIver and Carmines (1981), ithas not been possible to prOVide evidence of unidimensionality for theThurstone scaling method •
Concl usi ons Regarding Pai'red-Compari son' Items
Based on the current research, it is not possible to substantiate theuse of pat red-compari soni tems asbei ng superior to other types of itemsand scaling methods~
One of the drawbacks to using this kind of item is that, when morethan 10 items are compared, it ~canbecome confusing.' to the respondents(Backstrom &Hurchur-Cesar, 1981). It is also time consuming to use
, paired-comparison items. Reynolds and Jolly (1980) found that rank orde,rscales and Likert scales required less respondent time to complete than didpaired-comparison items. This difference was significant.at the .0001level. ' '
Some researchers· promote the use of; a ran k orderi ng type of sea1e ... '(Edwards, 1981 ; Bradley; 1982).. Rank ordering has been suggested for use.in performance appraisal and market research. However, rank' order scale.s·have fallen out of usage with most types of survey research. An illustration of this lack of usage is that public opinion surveyors more or less,abandoned paired-comparison items in the construction of survey~ to measurethe political system. The pair;ed-eomp.ar:-ison ,m~thod\'las qui,te popular 'inthe 1920s and 1930s (McIver &:Cannines;. 1981).
'J .'
43
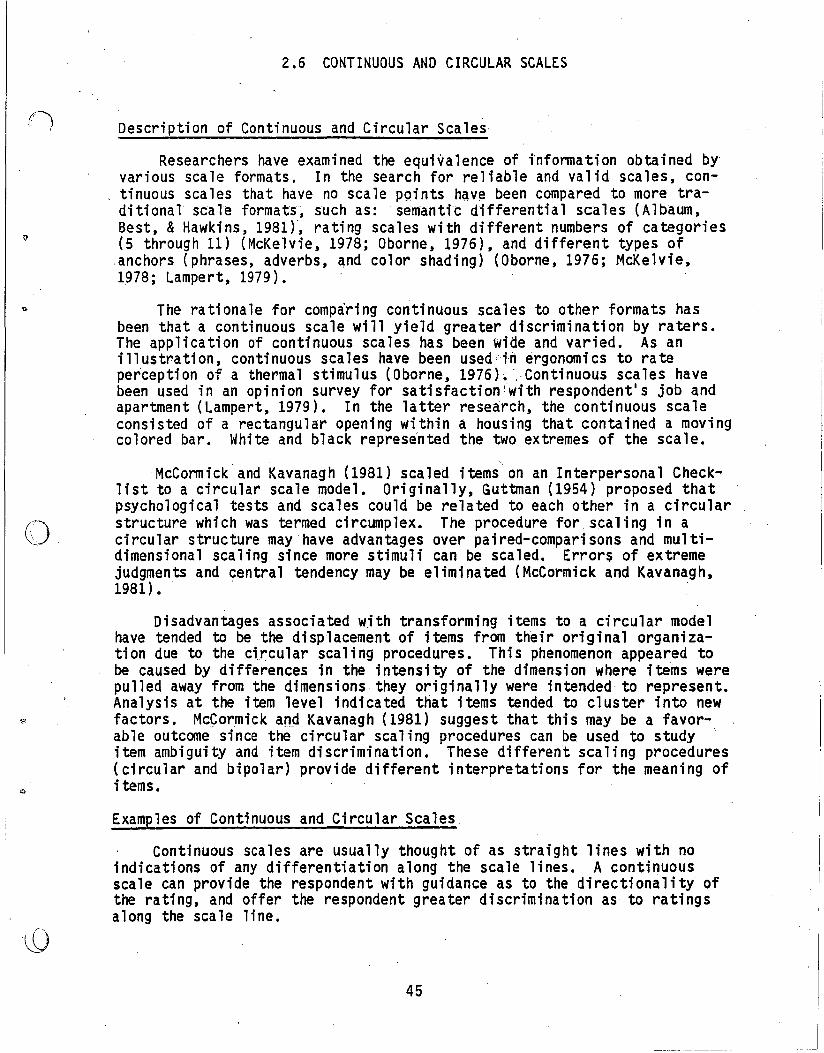
2.6 CONTINUOUS AND CIRCULAR SCALES
Description of Continuous and Circular Scales
Researchers have examined the equivalence of infonnation obtained by'various scale formats. In the search for reliable and valid scales, continuous scales that have no scale points hgve been compared to more traditional scale formats, such as: semantic differential scales (Albaum,Best, & Hawkins, 1981), rating scales with different numbers of categories(5 through 11) (McKelvie, 1978; Oborne, 1976), and different types ofanchors (phrases, adverbs, a.nd color shading) (Oborne, 1976; McKelvie,1978; Lampert, 1979).
The rationale for comparing continuous scales to other formats hasbeen that a continuous scale will yield greater discrimination by raters.The application of continuous scales has been wide and varied. As anillustration, continuous scales have been used'in ergonomics to ratepe~ception of a thermal stimulus (Oborne, 1976)~ ~ Continuous scales havebeen used in an opinion survey for satisfaction'with respondent's job andapartment (Lampert, 1979). In the latter research, the continuous scaleconsisted of a rectangular opening within a housing that contained a movingcolored bar. White and black represented the two extremes of the scale.
McConnick and Kavanagh (1981) scaled item; on an Interpersonal Checklist to a circular scale model. Originally, Guttman (1954) proposed thatpsychological tests and scales could be related to each other in a circularstructure which was termed circumplex. The procedure for scaling in acircular structure may have advantages over paired-comparisons and multidimensional scaling since more stimuli can be scaled. Errors of extremejudgments and central tendency may be eliminated (McCormick and Kavanagh,1981). . .
Disadvantages associated with transforming items to a circular modelhave tended to be the displacement of items from their original organization due to the ci.tc:ular scaling procedures. This phenomenon appeared tobe caused by differences in the intensit¥ of the dimension where items werepulled away from the dimensions they originally were intended to represent.Analysis at the item level indicated that items tended to cluster into newfactors. Mc~ormick arrd Kavanagh (1981) suggest that this may be a favorable outcome since the circular scaling procedures can be used to studyitem ambiguity and item discrimination. These different scaling procedures(circular and bipolar) provide different interpretations for the meaning ofitems.
Examples of Continuous and Circular Scales.
Continuous scales are usually thought of as straight lines with noindications of any differentiation along the scale lines. A continuousscale can provide the respondent with guidance as to the directionality ofthe ra ti ng, and offer the respondent greater di scrimi na ti on as to ra ti ng salong the scale line.
45
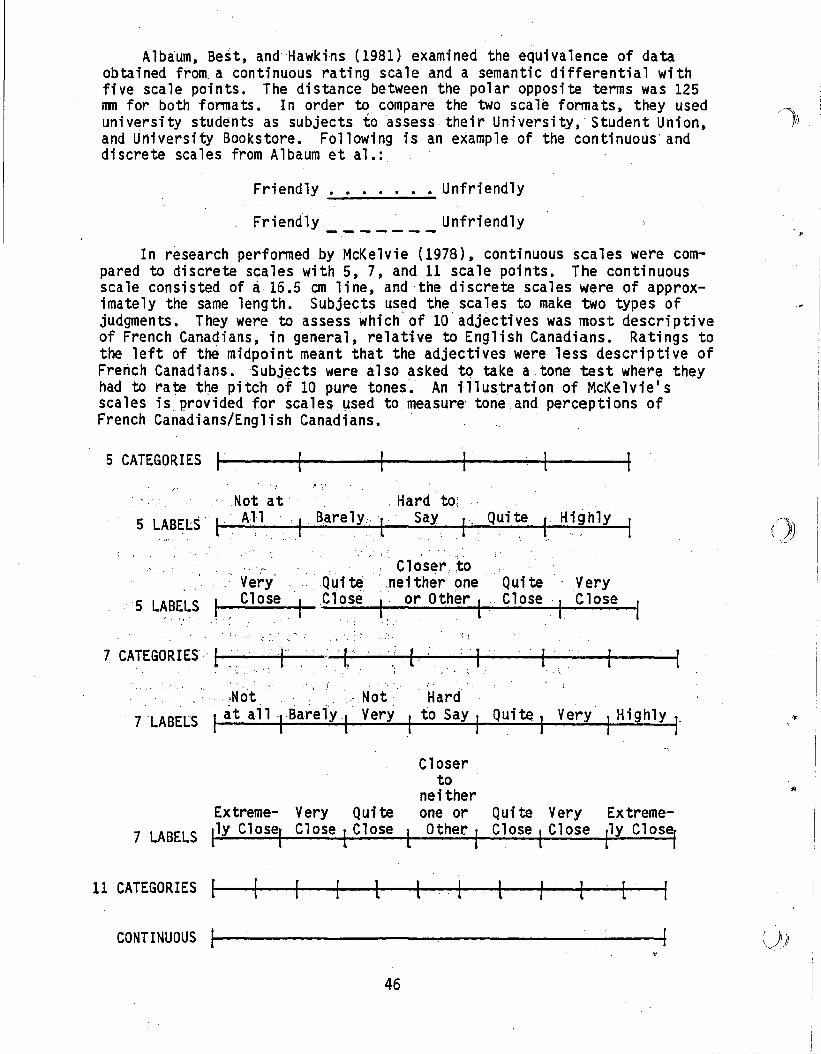
Alba'um, Best, and Hawkins (1981) examined the equivalence of dataobtained from. a continuous rating scale and a semantic differential withfive scale points. The distance between the polar opposite terms was 125nm for bothfonnats. In order to compare the two scalefonnats, they useduniversity students as subjects to assess their University, Student Union, /1))and University Bookstore. Following is an example of the continuous' and'discrete scales from Albaum et al.:
Friendly ••...•• Unfriendly
Friendly Unfriendly'
In research perfonned by McKelvie (1978), continuous scales were compared to discrete scales with 5, 7, and 11 scale points. The continuousscale consisted of a 16.5 em line, and the discrete scales were of approximately the same length. Subjects used the. scales to make two types ofjudgments. They were to assess which' of 10' adjectives was most descriptiveof French Canadians, in general, relative to English Canadians. Ratings tothe left of the midpoint meant that the adjectives were less descriptive ofFrench Canadians.Subj~cts were also asked to take a tone test where theyhad to rate t~e pitch of 10 pure tones~ An illustration of McKelvie'sscales is provided for scales L.lsed to measure' tone and perceptions ofFrench Canad i ans/Engli sh Canadians.
5 CATEGORIES f-----------+I-'-~-----1,. "
'5 LABELS
No~ at " ,Hard to5 LABELS' [All, Barely f Say I Quite I' Hi~hlY
, Clo'ser. 'to. Very ,Quite 'neither one Quite Very
__c';...o_se_l_c'ose I' or Other.[ ," Close I Close
.~ ..
7 CATEGORIES· (------I" , -~...,~. ....;....;....;... -il~·--,I-'----f[-'----f~--I' " ""
r. ,Not ··Not· Harci'
TLABElS I at .alllBareiy ( Very l to Say J QUite,) Very I Highly]
Extreme- Very Quite7 LABELS llY Close, Close 1Close
Closerto
neitherone or
l Other IQuite Very ExtremeClose IClose r'y c'os~
11 CATEGORIES
CONTINUOUS
46
(,))
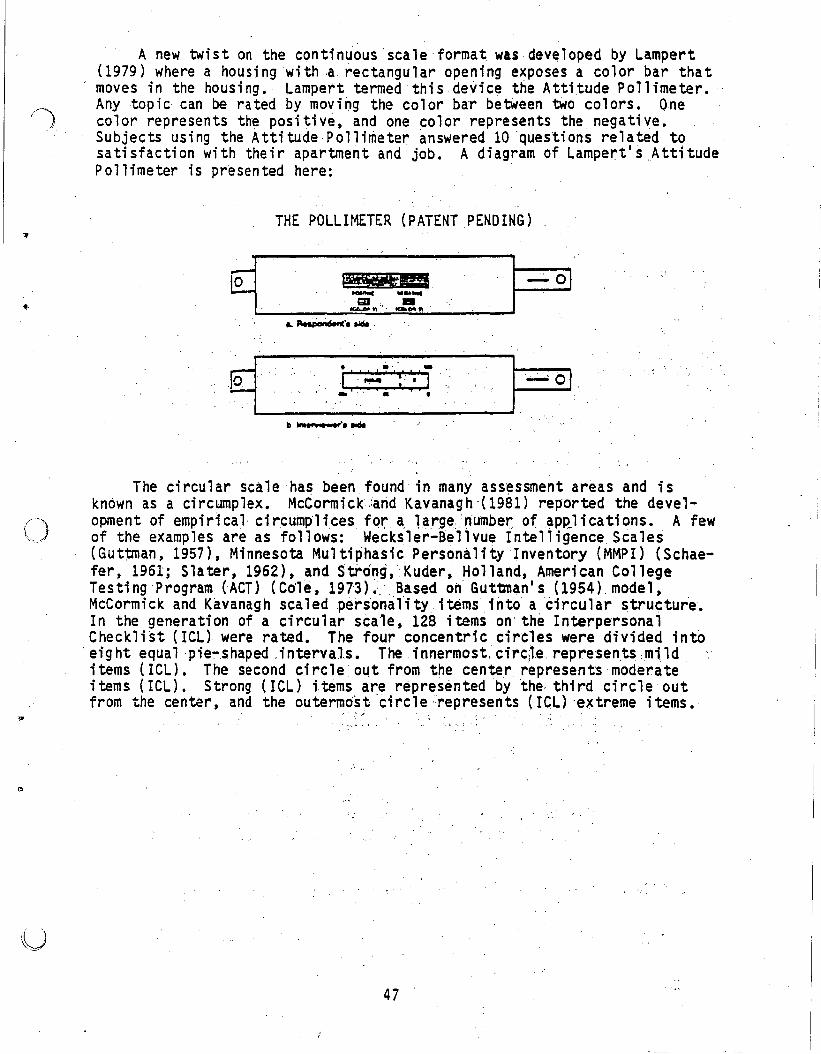
ii,
(-.):..:,...
A new twist on the continuous scale ,format wasdev~loped by Lampert(1979) where a housing with ,a rectangular opening exposes a color bar thatmoves in the housing., Lampert termed 'this device the Attitude Pollimeter.Anytop;c can be rated by moving the color bar betWeen two colors. Onecolor represents the positive, and one color represents the negative.Subjects using the AttitudePollimeter answered 10 'questions related tosatisfaction with their apartment and' job. A diagram of Lampert's AttitudePollimeter is presented here:
THE POLLIMETER (PATENT PENDING)
~_', ,__----"'~='~~,·:__'=!d~- l- 0,II ..B!." .....I!!.. _&.~•• ",
9_"__j:_."~_::'_::::_<!_'.. l~ 01b ...., • sr" ..
The circular scale has been found in many aSSessment areas and isknown as a circumplex. McCormick,iarid Kavanagh-(1981) reported the development of empirlcal circump'li.ces fora, large,number, ofappJications. A fewof the examples are as follows: Wecksler-Bellvue Intelligence Scales(Guttman, 1957), Minnesota MUltiphasic Personality Inventory (MMPI) (Schaefer, 1961; Slater, 1962), and Strong, KUder, Holland, American CollegeTesting Program (ACT) (Co'le, 1973L' Based otlGut'b'nan's (1954) model,McCormick and Kavanagh scaled personality i1:emsinto a Circular structure.In the generation of a circular scale, 128 items on'the Interpersonal
, Checklist (ICL) were rated. The four concentric circles were divided intO,eight equalpie~shaped,intervals. The innermost. circ;le represents mild ,items (ICL). The second circle out from the center represents moderateitems (ICL). Strong (lCL) items are represented by the· third circle outfrom the center, and the outermost 'circle ::represents (lCL) extreme items •
.: ,;
47
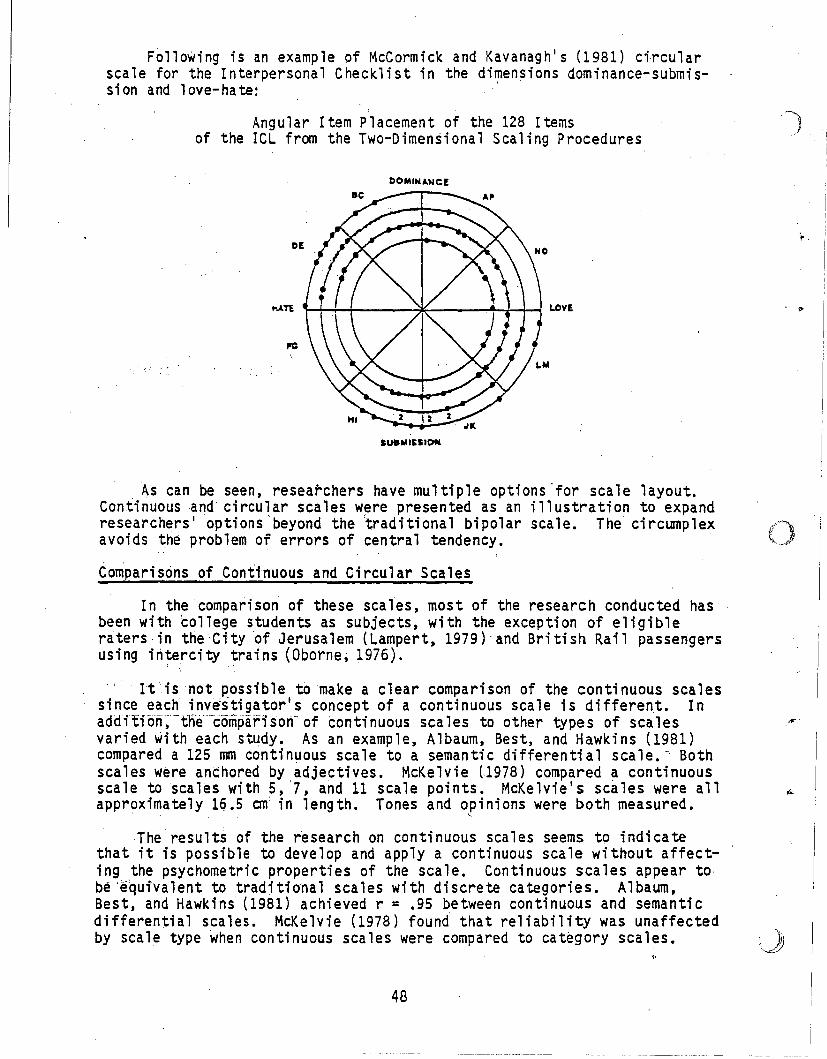
Following is an example of McCormick and Kavanagh's (1981) circularscale for the Interpersonal Checklist in the di~ensions dominance-submissi on and 1ove- ha te:
Angular Item Placement of the 128 Itemsof the ICL from the Two-Dimensional Scaling Procedures
DOMINI-He!
SL/8MIUION
. As can be seen, researchers have multiple options 'for scale layout.Conti nuousand ci rcul ar scales were presented as an ill ustra ti on to expandresearchers' options beyond the traditional bipolar scale. The circumplexavoids the problem of errors of central tendency.
Comparisons of Continuous and Circular Scales
In the comparison of these scales, most of the research conducted hasbeen with college students as subjects, with the exception of eligibleraters inthe'City :of Jerusalem (Lampert, 1979)'and British Rail passengersusing intercity trains (Oborne; 1976).
It'isnot possible to make a clear comparison of the continuous scalessince each inv~itigator's concept of a continuous scale is different. Inadd;t;on~-tne'~compari son" of continuous sca les to other types of scalesvaried ~ith each study. As an example, Albaum, Best, and Hawkins (1981)compared a 125 mm continuous scale to a semantic differential scale." Bothscales were anchored by ~djectives. McKelvie ~1978) compared a continuousscale to scales with 5, '7, and 11 scale points. McKelvie's scales were allapproximately 16.5 on in length. Tones and opinions were both measured.. ,
the results of the research on continuous scales seems to indicatethat it is possible to develop and apply a continuous scale without affecting the psychometric properties of the scale. Continuous scales appear tobe 'equivalent to traditional scales with discrete categories. Albaum,Best, and Hawkins (1981) achieved r = .95 between continuous and semanticdifferential scales. McKelvie (1978) found that reliability was unaffectedby scale type when continuous scales were compared to category scales.
"
48
'F,
, ...
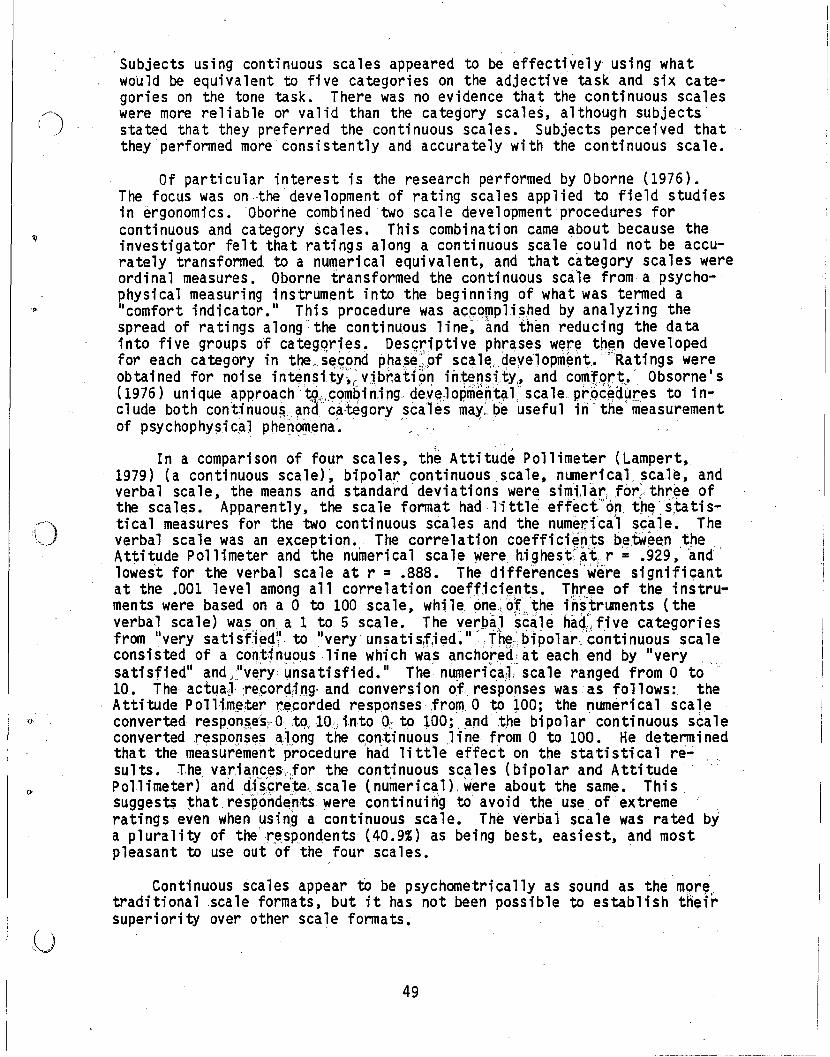
.,..
()
Subjects using continuous scales appeared to be effectively using whatwo'uld be equivalent to five categories on the adjective task and six categories on the tone task. There was no evidence that the continuous scaleswere more reliable or valid than the category scales, although SUbjectsstated that they preferred the continuous scales. Subjects perceived thatthey performed more consistently and accurately with the continuous scale.
Of particular interest is the research performed by Oborne (1976).The focus was on ··the' development of rating scales applied to field studiesin ergonomics. Oborlle combined two scale development procedures forcontinuous and category scales. This combination came about because theinvestigator felt that ratings along a continuous scale could not be accurately transformed to a numerical equivalent, and that category scales wereordinal measures. Oborne transformed the continuous scale from a psychophysical measuring instrument into the beginning of what was termed a"comfort indicator." This procedure was ac~o~plished by an,lyzing thespread of ratings along-the continuous line: and them reducing the datainto five groups of categQries. DesGriptivephrases wer~ th~n developedfor each category in t~,.s~,G.ond pha~e:.of scal~.,qevelopment.'Ratingswereobtained for noise intensitY'~i:vjbrati9~ il1~nsity" and COrnT.c;>f1:.• · Obsorne ' s(1976) uni que approaGh' ~.".comq,i ri,; ng deye,:l opmeht.~l sca le pr"Qc~~~res to include both continuou~,~nd ca:t?gory scales may"be useful in the measurementof psychophY$i c,al phe~~ena'." ,',.
In a comparison of four scales, the Attitude Pollimeter (Lampert,1979) (a continuous scale)', bipolar continuous scale, numerical scale, andverbal scale, the means and standard deviations.were si",j,l~~ifor,;:thr.~e ?fthe scales. Apparently, the scale format had 11ttle effect <?n. the"S,tatlStical measures for the two continuous scales and the numerical scaJe. Theverbal scale was an exception. The correlation coefficigtrt:,s b.e.tWe~n .the .Attitude Pollimeter and the numerical scale were h,ighest;'~t" r .,; .929, andlowes't for the verbal scale at r = .888. The differences"were significan.tat the .001 level among all correlation coeffici~nts. Thr,ee of the instrumentswere based on a 0 to 100 scale, whi leone, oT,the ih's'trLJnents (theverbal scale) was on a 1 to 5 scale. The verbal scale hac( five categoriesfrom "very satisfl~4~' to livery unsatistied~n:The,.:t>ipolar.'continuous scaleconsi sted of a con:tjn~ous 1ine whi ch was anchor-,ed: at each end by livery ,satisfied" and,:"v~ry unsatisfied. II The numerica,l;' scale ranged from 0 to"10. The actua·a ,rec::or<1ting·· and conve.rs; on of: respo,nses was as foll ows: theAttitude PolHm,~:ter r,ecorded r~sp.onses ,frolTt 0 to ~OO; the numerical scaleconverted resP9n~,es?,O, ,tQ; 10,; into 0,: to, 100; ,and the bipolar continuous scaleconverted ,respor,lse? along thec,on.:tinuous Ji ne from 0 to 100. Hedetermi nedthat the measurement procedure had little effect on the statistical re~
sults. The, vati~l1c~s;;lor the cont,inuous sc~les (bipolar and AttitudePollimeter) and Ms;c;re;tescale (numericCll).w,ere about the same. This.suggests that respondentS were continuing to avoid the use of extremeratings ev~n when using a continuous scale. The verbal scale was rated bya plurality of the'r~spondents.(40.9~) as being best, easiest, and mostpleasant to use out of the four scales.
Continuous scales appear to be psychometrically as sound as the moretraditional scale formats, but it has not been possible to estabHshthe1rsuperiority over other scale formats.
49
Conclusions Regarding Continuous and Circular Scales
Continuous scales offer the researcher another option in the selectionof scale format. Even though some researchers prefer the use of continuousscales to offer the respondent a greater differentiation in rating, thismay not necessarily be realized. For example, Oborne (1976) found respondents rating continuous scales on an equivalent of five categories.McKelvie (1978) found respondents rating continuous scales on the equivalent of five or six categories depending on what was being measured.
Even though subjects may state that they prefer a continuous scaleover a category scale (McKelvie, 1978), their preference does not indicatepychometric superiority of this format over other formats. In a comparisonof four scal in·g· formats, Lampert (1979) found that subjects wi th a lowlevel of education preferred verbal scales as their first choice, with theAttitude Pollimeter (a continuous scale) as their second choice.
Since fonmatvariations do not seem to influence the psychometricresults to that ~reat of a degree, there ·are some novel developmentalscaling procedures open to resea.rchers.' One of these is in the area ofergonomi c measUrement." F'ur'ther":·research'inergonoini c scale deve1opmentseems reasonab'le for the integratioh'and 'trarisfonna1:10nof'continuousscales into.'category scales:in the measurement ofpsychophysicar'phenomenausi ngthe procedures of Oborne (1976).
For respondents who have a low educational level, the Attitude PoTlimeter may be appropriate. There may be a drawback to its use in largesurveys ('Lampert, 1979). In using the Atti'tude Pollimeter, each respondentis interviewed. Ra·ting takes place ona one,..to-one basis with this device.At fts presen't level of development,. ,this would not be a cost effectiveapproach to obtaining survey data.'
. One of the 'most unusual approaches to scale development has been thecircular scale (also known as the circumplex). Circular scales have beendeveloped for almost every area ,of psychological assessment, such'as: 'intelligence tes~s,personality. inventories,'and vocational inventories(McCormick and Kavanagh, 1981); One'of the -advantages for using circular'scales has been the elimination of-the error of central tendency throughrandom presentation. of the' stimuli. Another advantage :is the measure ofvariability of 'response to an item which allows for the determination ofJ-tem-amb·i~gt.i-ty-an<:i""'<:i;-S'crim'ination.,·One of the' drawbacks to thi s .sca1e isthe skewness in item dist~ibutions brought about by the procedure.
," .'
.... ;Continuous,and circular scales 'appear to be as effective as 'otherscales. Cons:iderable effqrt is required for the development of circularscales. The ,selection of :scale format is essentially based on the preference of thei nvesti ga tor. As ,wi th other types "of scales, the developmentalprocedures have.greater importance than the scale format.
; :
50
(')')..... '
," I
()
'I~
{j
(J
CHAPTER II I
BEHAVIORAL SCALES
Behavioral scales are reviewed in this chapter for Behaviorally Anchored Rating Scales (BARS), Behavioral Expectation Scales (BES),Behavioral Observation Scales (BOS), and.Mixed Standard Scales (MSS). There area wide variety of behavioral scales using variations of the Smith and Kendall (1963) format. This list of behavioral scales is not claimed to beall inclusive~ Behavioral scales were developed to encourage rateri.to observe behavior more accurately. The primary application for these scaleshas been in the area of performance appra i sa1. Other appl i cati ons haveemerged since they were originally established by Smith and Kendall.Behavioral scales are built on critical incidents, and they have been usedto: evaluate morale, establish feedback, train raters, and delineateorganizational goals. ·They could be used as a 1ink to Management By.Objectives (MBO) during the planning stage.
". .
The time and cost factors involved .in developing behavioral scales hasbeen extensive compared to other scaling techniques. To make this scalingtechnique viable, it may be necessary to generalize the use of the beh~Vioral scale to multiple applications such as those mentioned above. Inaddition to this constraint, psychometric studies of behavioral scales havenot.indicated that they are consistently better than other types of scales.
. . , .
PsythOOletri c soundness for these sea les .has depended large-ly on thespecific developmental procedures used,. For ex alllP1e,.criti ca1 incidentsare grouped into dimension categories by groups of participants. Thepercentage level of agreement for inclusion~of a critical incident intn adimension varies with different research projects. It may fluctuate between 60% up to 80% agreement .depending,on the research method. To improveaccuracy in ratings, training sessions have been used so that raters wouldbetter understand how to use ~ehavioral scales and how to eval~ate perfor~
mance. Tra i n1 ng raters to reduce errors has brought about mixed re$~lts.o.
The amount of time devoted to the training, as Well a~'the'content of thetraining, have influenced ratings'using behavioral scales. An illustrationof the.varied impact of training was reported by Bernardin and Walter(1977) where halo error was reduced, but ratee discriminationandin"ter-rater reliability were not increased by training.·' ,; ,
- .
Some of the varied approaches to developing behavioral scales have hadtheir own inherent problems. BES translate actualbehavior.s! into expectedb~haviors. This procedure culminates in requiring raters to infer a,ratee l s abil ity by predicting what the 'ratee! s expected per,formance wil,.be. Another deficit has been in the content of BOS:. BOS use· criticalincidents to define 'i:!ffective and ineffective, behaviors; There is the' ..possibil ity that some of the behaviors may be exhibited so infrequentlythat they are not useful in differentiating among ratees. MSS were developed to reduce rating errors by randomizing the presentation of items.This has been frustrating to some raters. MSS has an apparent lack of facevalidity, yet at the same time is internally consistent.,
51
Behavioral scales are designed to rate the performance rather thantraits of individuals. It is possible that judgments'made using thesescales require recall of performance over extended periods of time. Thisindicates that behavioral scales may be measuring traits as well as be- I,/""';,','}
havi ors. r
52
)
)
)
3.1 BEHAVIORALLY ANCHORED RATING SCALES
Description of Behaviorally 'Anchored Rating 'Scales
A wide variety of forms and methods of scale development is groupedunder the term Behaviorally Anchored Rating Scales (BARS). BARS wereestablished to 'encourage raters to observe behavior more accurately (Bernardin & Smith, 1981). These scales'have developmental procedures based onthe Smith and Kendall (1963) format. The original developmental procedureestabli.shed by Smi th and Kendall had si x steps. Subsequent researchershave slightly varied the original developmental methodology with successiverefinements (Murphy, 1980).
It was recommended by Smith and Kendall (1963) that the rating environment remain constant across ratings, and that the raters rate the rateesin a similar manner (Jacobs, Kafry, &Zedeck, 1980). The raters are required to make inferences from observed behaviors to expected behaviors.This allows the rater to generalize from the specific critical incidentslisted out on the BARS form to the range of equivalent incidents that therater has observed regarding the behavior of the ratee while they work'together on the job. The expected behaviors are those that are printed onthe BARS format. In addition, it'is not possible to list out every possible expected behavior on a BARS format. The rater must generalize to whatwould be expected behavior by the ratee. This is based on the transformedcritical incidents identified along the scale line on the BARS format. Itis assumed that the rater will be able to review the behavioral anchors andselect the behavioral anchor which best represents the expected behavior ofthe ratee.
A potential rating problem may occur if the rater has not observed thebehaviors identified by the behavioral anchors. The task of the rater isto generalize from known behavior to what would be an expected behaviorwhen the anchors ,do not adequately describe the ratee. Rating expected behaviors'may facilitate rating unobserved events (Jacobs, Kafry, & Zedeck,1980). Behavior-based scales appear more reliable than trait- based scalesfor performance appraisal measurement. BARS are more specific in identifying behaviors (Schneier & Beatty, 1979a"1979b, 1979c) observed on a jobthan a personality tr'~it sUc;h as "re~ponsibility." ..
. . .'.. .."',!, ,I
As a way to minimize errori" sca'le development, Bernardin, La Shells,Smith, and Alvares (1976) sugges'tedtt:lat each dimension of performance bedefi ned wi th cri tic:~l 'incidents ,for eac;h. interva1 on the dimensi on. Theyused two groups of 'p~r,ti ci pa'nts for sa r~9'ti ng and sca1i ng the cri ti ca1incidents. The first group placed crittcalincidents into dimension categories with at least 60~agre;e.ment for incidents to be included. Re-'searchers initiate thisp~ocess with hundreds of critical incidents, and attimes there may be o~e.r 1,000 'critical incidents. Individuals are selectedas judges, and they are required to make a jUdgment as to which dimension acritical incident would fit into. If the 60~ level of agreement has notbeen reached, then the critical incident would "be deleted from the pool of
53
critical incidents. This is a way to reduce the number of critical incidents used in the BARS format. The second group of judges rates the critical incidents regarding the value of behavioral dimensions. It is desiredthat critical incidents which form a dimension have as little overlap aspossible with the other ~imensions (L~ndy &Barnes, 1979). The first groupof ,participants working with the critical incidents will typically generateenough incidents to establish between 5 and 12 dimensions (Cocanougher &Ivancevich, 19.78); , '
Anchoring thec:rifical incidents to the scale continuliJnmay affect themeans and standard deviatiqns as different scaling procedures are used.Locander and Staples (1978) and Staples and Locander (1975) advised anchoring the critical incidents to a la-point scale with 9 intervals. Thevalues assigned to the scale were between 0.00, "undesirable," to 9.00,"highly desirable. II The degree of effective 'or ineffective j.pb performancewas assigned to'behaviors which were subsequently scaled between 0.00 and9.00 for each performance dimension. Each behavior (critical incident)along the scale line was analyzed for mean scores and standard deviations.Paired-comparison and graphic rating scale techniques have been used toanchor critical incidents to intervals on dimensions (Landy & Barne's,1979). .
BARS has typi cally been used to constructsca les for performanceappraisal. In an effort to construct a scale to measure morale in ,militaryuni ts by means other than self-reports, Motowi d10 and Borman J1977) were.able to successfullY use BARS.. They developed eight dimensions of groupmorale to rate 47platoon-size~'units in the U.S. Army stationed in aforeign location. Even though the critical incidents are from differentjobs within the Army, they reflect the morale of the'soldiers. The Moto-wi dl 0 and Borman BARS format for the dimension "performance and effort onthe job" covered the morale level for a variety of jobs., This means that·the rater must generalize to the expected beha.vior since not every description of morale for each type of job is part of this scale. This is anill ustra ti on of the Jacobs, Ka fry, and Zedeck (1980) warni ng about genera1izing from a critical incident to an expected behavior (see Section 2.1, 'Multiple-C~oice Scaies).. ..
Examples of Behavioral~y Anchored Rating Scales
An example belowi~ from Motowidlo and Borman (1977). BARS havetraditionally bee/'l developed for performance,appra,isals. In an unusualapplication of BARS'~ Motowidlo and Borman developed a .scale to measuremorale for military units stationed in the U.S. and in two foreign locations. The strategy'used' was to obtain examples of expressions of morale.They started out with 1,163 examples of morale. The BARS illustrated hererepres~nts behavioral anchors associated with "performance and effort onthe job. II' Each scale point is designed to reflect a different level ofmorale .. A high level. of morale indicates behaviors such as spending extra)time to get the ,job completed and volunteering to perform the task well.
54
--------------------------
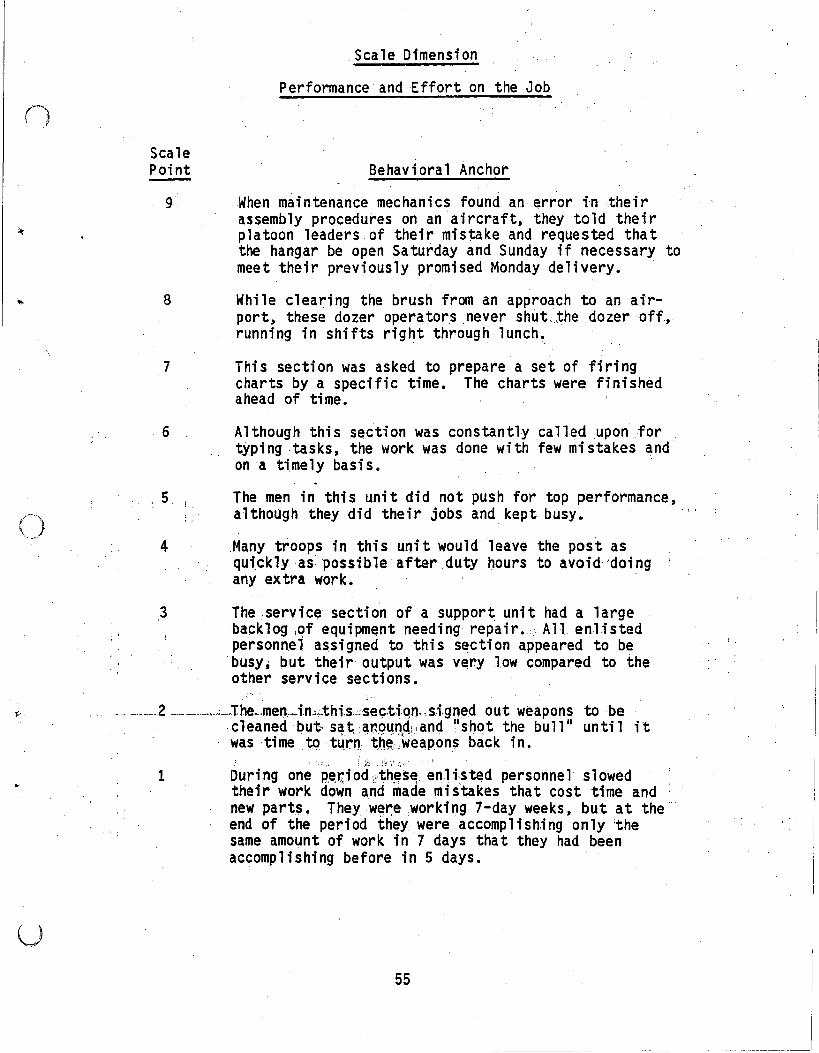
n
Scale Dimension
Performance and Effort on the Job
ScalePoint
9
8
7
6
, 5.
.4
Behavioral Anchor
When mai ntenance mechani cs found an error ;'n theirassembly procedures on an aircraft, they told theirplatoon leaders of their mistake and requested thatthe hangar be open Saturday and Sunday if necessary tomeet their previously promised Monday delivery. .
While clearing the brush from an approach to an airport, these dozer operators .never shut.;the dozer off,.running in shifts rig~t through lunch~ .
This section was asked to prepare a set of firingcharts by a specific time. The charts were finishedahead of time.
Althoug/:l this s~ction was constantly caned upon for .typing ·tasks, the work was done with few mistakes andon a timely basi s.
The men in this unit did not push for top performance,although they did their jobs and kept busy.
Many troops in this uni t would leave the post asquickly as possible after duty hours to avoid 'doingany extra work.
3 Theservic~ section of a support unit had a largebacklog :qf equipment needing repair., All enlistedpersonn~l assigned to this s~ction appeared to bebusy j but their output was very low compared to theother service sections.
_._ -.----2 .-.----'.-'the,....men,-,d.n~;.,thi.s.~,se~,t:i:qn·,si,gn~d out weapons to bec1eanedbut· sat· aroundH and liS hqt the bu11" un ti 1 itwas time ,tQ tur.n~h~ ..weapon$back in.
~ ~1~ ,;,_~ "I;
1 During one pe.~,i od,'th~S~. enl is ted personne l' slowedtheir work down and made mistakes that cost time andnew parts. They we~e,working 7-day weeks, but at theend of the period they were accomplish.ing only 'thesame amount of work in 7 days that they had beenaccomplishing before in 5 days.
55
ComQarisons of Behaviorally 'AnchoredRating Scales
BARS have been developed for various populations, such as police officers (Landy, Farr, Saal, & Freytag, 1976), soldiers (Motowidlo & Borman;1977), and students (Hom, De Nisi, Kinicki, &Bannister, 1982). Investigation of BARS has focused on various applications, such as feedback usingdifferent instruments as opposed to no feedback (Hom et al., 1982), scalingof critical incidents using paired-comparison and graphic rating (Landy &Barnes, 1979), format differences in conjunction with training or lack oftraining (Borman, 1979), and the effect of participation in scale constructi on (Friedman & Cornel ius, 1976).
Scale dimensions have ranged from 2 (Landy &Barnes, 1979) through 10(Hom, De Nisi, Kinicki, & Bannister, 1982). Scale points have numberedbetween 5 (Hom et al., 1982) and 9 (Landy, Farr, Saal, & Freytag, 1976).Different anchors have been used for critical incidents (Motowidlo &Borman, 1977). For example, numerical anchors along with descriptors "high,"lIayerage,1I and IIl ow" have been used (Landy, Farr, Saal, & Freytag, 1976),as well as non-continuous Likert-type anchors (Hom et al., 1982). Dimensions and anchors have different definitions as well as different titlesfor the various scale formats.
The Smith and Kendall (1963) model for BARS developmental proceduresrequires the participation of raters in scale construction procedures.Participation in BARS and graphic rating scale construction has led ,toincreased convergent validity. Participation by raters in scale develop'"ment did not lead to high levels of discriminant validity (Friedman &Cornelius, 1976). There has been little support for the involvement of .raters in scale construction (Kingstrom & Bass, 1981).
Other avenues for the use of BARS have been sought. For example, itis possible to use the data from BARS in the feedback condition for performance appraisal (Hom, De Nisi, Kinicki', & Bannister, 1982). Job analysiscan be compared with critical incidents (Atkin & Conlon, 1978). Managementby Objectives (MBO) (Locander& Staples, 1978) can be used in conjunctionwith BARS. Because of the time and'money involved in the construction ofBARS, the rationale for BARS use without secondary applications provides aweak case for their selection.
The psychometric soundness of BARS has been more promising for developmental procedures than for application in field studies (Jacobs, Kafry, &Zedeck, 1980). There have been disappointing levels of convergent validity, and no discriminant validity for some studies. Mixed results werefound for rating characteristics in several types of formats as they werecompared to BARS (Borman, 1979; Kingstrom & Bass, 1981).
Many studies have examined the effects of rater training in an effortto reduce rating errors and increase reliability (Land~ &Farr, 1980).Using a short training program (5 to 6 minutes), Borman (1975) found littleimpact on the qualit¥ of ratings. Training sessions conducted by Bernardinand Walter (1977) had little impact on·ratee discrimination and interraterreliability, but they did reduce halo error. In research performed byBorman (1979), three hours of training versus no training reduced haloerror. It did not improve accuracy of ratings. No one scale format was
56
consistently better than another. Training raters to reduce errors whileusing BARS .has produced varied results.
Errors in ratings may be attributed to a number of sources such asscale fonnat, rater ability to observe behavior, and motivation of raters.Rater effectiveness may also be influenced by the cognitive complexity ofraters. Schneier (1977a) viewed BARS as requiring more cognitive complexity than other formats (Jacobs, Kafry, &Zedeck, 1980; Landy &Farr, 1980).
Conclusions °Regardi"ng °Behavi'orallyAnchored Rating Scales
BARS psychometri c soundness appears to be dependent on the specffi cdevelopmental procedures used and the research design selected. It has notbeen possible to substantiate psychometric superiority of BARS. Even so,BARS has not appeared to be inferior to other scales (Murphy, 1980).Specific statistical indices used in different studies created problems ofinterpretation (Kingstrom &Bass, 1981).
Smith and Kendall (1963) originally recoll1l1ended the developmentalprocedures to use in constructing BARS. As more research has been perfonned in the development of BARS, many investigators have modified theSmith and Kendall methodology to try and improve upon the procedures. Itis difficult to compare BARS studies since the developmental proceduresvary from stUdy to study. There is the possibility that for some of theprocedure, there has been inappropriate matching of rating fonnats, scales,and oraters. This would result in a lack of convergent validity. This isnot to say that all such modifications negatively influenced the reliability or validity of the scales.
)/ A serious concern for the development of BARS is the time and costinvolved (Cocanougher & Ivancevich, 1978). This is why expanding the useof BARS for more than performance appraisal may be a prerequisite in aneffort to capture BARS spin-offs. For example, Staples and Locander (1975)suggest that appraisal criteria may be used as a guide for delineatingorganizational goals. Another use for BARS could be as a link to MBOduring the MBO action planning" stage. Performance appraisal dimensions andspecific job behaviors can be identified as a way to achieve many objectives (Kearney, 1979). This makes BARS more viable and cost effective tothe organization. The application of BARS to measure group morale wasencouraging as an alternative to the traditional self-report measuresobtained in surveys. This is an indication that BARS is a fonn of scaleconstruction that can be used in surveys and not only for performanceappraisal.
57
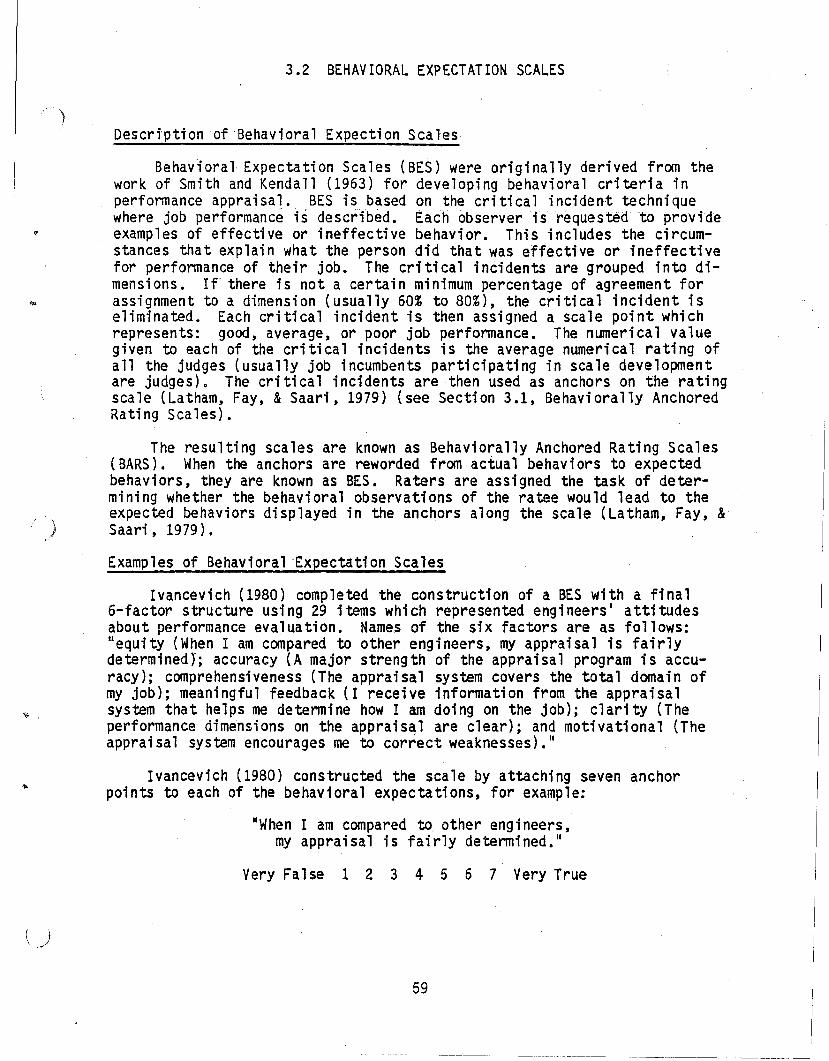
''''
)
)
()
)
3.2 BEHAVIORAL EXPECTATION SCALES
Descrtptionof "Behavioral Expection Scales
Behav"ioral Expectation Scales (BES) were originally derived from thework of Smith and Kendall (1963) for developing behavioral criteria inperfonnance appraisal. BES is based on the cri ti ca1 i nci dent techni quewhere job performance is described. Each observer is requested to provideexamples of effective or ineffective behavior. This includes the circumstances that explain what the person did that was effective or ineffectivefor perfonnance of their job. The critical incidents are grouped into dimensi ons. If' there is not a certai n minimum percentage of agreement forassignment to a dimension (usually 60% to 80%), the critical incident iseliminated. Each critical incident is then assigned a scale point whichrepresents: good, average, or poor job perfonnance. The numerical valuegiven to each of the critical incidents is the average numerical rating ofall the jUdges (usually job incumbents participating in scale developmentare judges). The critical incidents are then used as anchors on the ratingscale (Latham, Fay, &Saari, 1979) (see Section 3.1, Behaviorally AnchoredRating Scales).
The resulting scales are known as Behaviorally Anchored Rating Scales(BARS). When the anchors are reworded from actual behaviors to expectedbehaviors, they are known as BES. Raters are assigned the task of determining whether the behavioral observations of the ratee would lead to theexpected behaviors displayed in the anchors along the scale (Latham, Fay, &Saari, 1979).
Examples of Behavioral 'Expectation Scales
Ivancevich (1980) completed the construction of a BES with a final6-factor structure using 29 items which represented engineers' attitudesabout performance evaluation. Names of the six factors are as follows:lI equity (When I am compared to other engineers, my appraisal is fairlydetermined}; accuracy (A major strength of the appraisal program is accuracy); comprehensiveness (The appraisal system covers the total domain ofmy job); meaningful feedback (I receive information from the appraisalsystem that helps me detennine how I am doing on the job); clarity (Theperformance dimensions on the appraisal are clear); and motivational (Theapprai sal system encourages me to correct weaknesses). II
Ivancevich (1980) constructed the scale by attaching seven anchorpoints to each of the behavioral expectations, for example:
IIWhen I am compared to other engineers,my appraisal is fairly determined. 1I
Very False 1 2 3 4 5 6 7 Very True
59
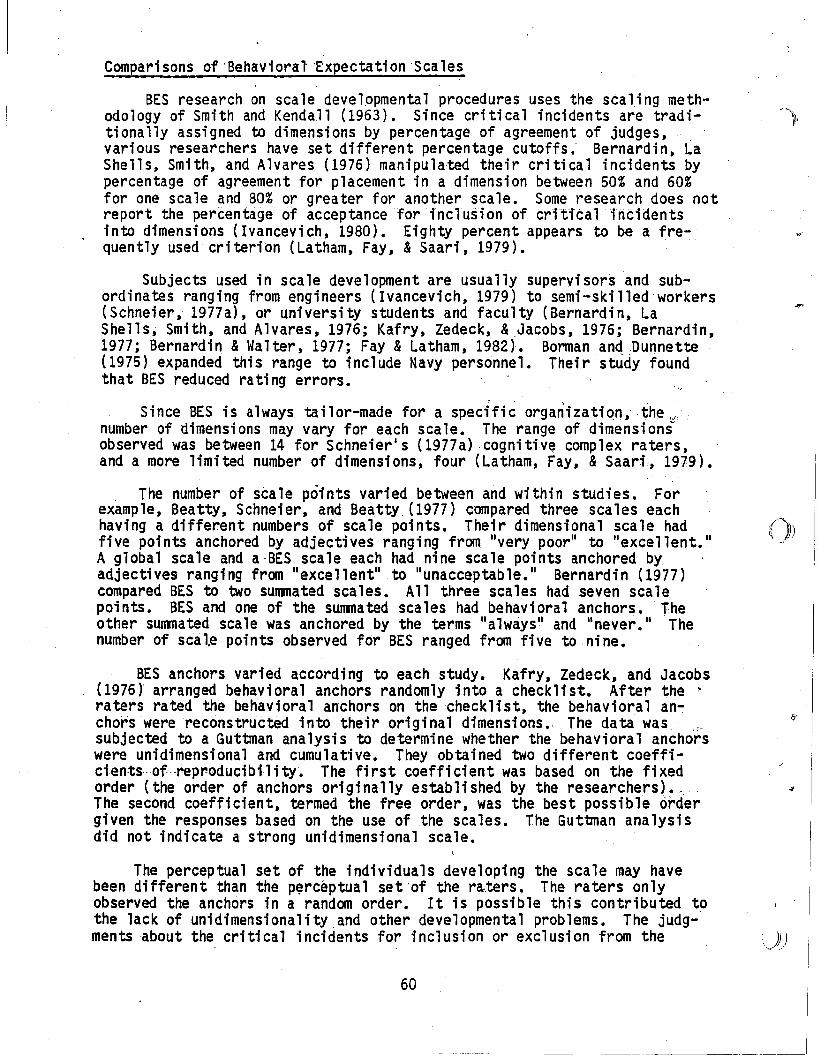
Comparisons of 'Behavioral 'Expectation 'Scales
BES research on scale develppmental procedures uses the scaling methodology of Smith and Kendall (1963). Since critical incidents are tradi-tionally assigned to dimensions by percentage of agreement of judges, ,vari ous researchers have set different percentage cutoffs.' Bernardin, LaShells, Smith, and Alvares (1976) manipulated their critical incidents bypercentage of agreement for placement in a dimension between 50% and 60%for one scale and 80% or greater for another scale. Some research does notreport the percentage of acceptance for inclusion of critical incidentsinto dimensions (Ivancevich, 1980). Eighty percent appears to be a fre~quently used cri terion (Latham, Fay, & Saari, 1979).
Subjects used in sca le development are usually supervi sors and subordinates ranging from engineers (Ivancevich, 1979) to semi-skilled workers(Schneier, 1977a), or university students and faculty (Bernardin, LaShells, Smith, and Alvares, 1976; Kafry, Zedeck, &Jacobs, 1976; Bernardin,1977; Bernardin & Walter, 1977; Fay & Latham, 1982). Bonnan and ,Dunnette(1975) expanded this range to include Navy personnel. Their stUdy foundthat BES reduced rating errors. '
Since BES is always tailor-made for a specific organizatiqn,the "i,
number of dimensions may vary for each scale. The range of dimensionsobserved was between 14 for Schneier's (1977a) ,cognitiv~ complex raters,and a more limited number of dimensions, four (Latham, Fay, & Saari., 1979).
The number of scale points varied between and within studies. Forexample, Beatty, Schneier, and Beatty. (1977) compared three scales eachhaving a different numbers of scale points. Their dimensional scale hadfive points anchored by adjectives ranging from livery poor" to "excellent."A global scale and aBES scale each had nine scale points anchored by,adjectives ranging from "excellent" to "unacceptable." Bernardin (1977)compared BES to two sUl1l11ated scales. All three scales had seven scalepoints. BES and one of the sUl1l11ated scales had behavioral anchors •. Theother sUl1l11ated scale was anchored by the terms "always" and "never. II Thenumber of scal~ points observed for BES ranged from five to nine.
BES anchors varied according to each study. Kafry, Zedeck, and Jacobs(1976) arranged behavioral anchors randomly into a checklist. After the ~raters rated the behavioral anchors on the checklist, the behavioral an-chors'were reconstructed into their original dimensions., The data was ".subjected to a Guttman analysis to determine whether the behavioral anchorswere unidimensional and cumulative. They obtained two different coefficients--of· ·reproducibility. The first coefficient was based on the fixedorder (the order of anchors ori gi nally estab1i shed by the researchers).:.The second coefficient, termed the free order, was the best possible ordergiven the responses based on the use of the scales. The Guttnan analysisdid not indicate a strong unidimensional scale.
The perceptual set of the individuals developing the scale may havebeen different than the p~rceptual set of the raters. The raters onlyobserved the anchors in a random order. It is possible this contributed tothe lack of unidimensionalityand other developmental problems. The judgmentsabout the critical incidents for inclusion or exclusion from the
60
,)J)
x,-
.....
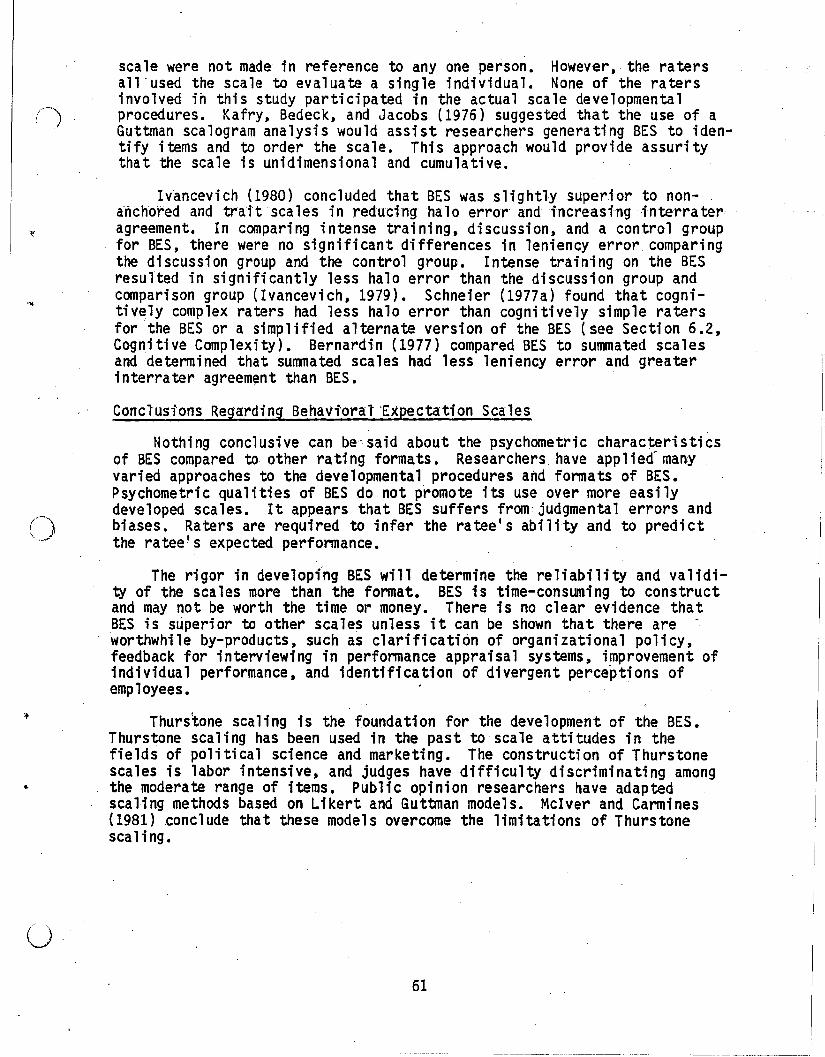
'"
()...-""'"
u
scale were not made in reference to anyone person. However, the ratersall .used the scale to evaluate a single individual. None of the ratersinvolved in this study participated in the actual scale developmentalprocedures. Kafry, Bedeck, and Jacobs (1976) suggested that the use of aGuttman scalogram analysis would assist researchers generating BES to identify items and to order the scale. This approach would provide assuritythat the scale is unidimensional and cumulative.
Ivancevich (1980) concluded that BES was slightly superior to nonanchored and trait scales in reducing halo error and increas;ng;nterrateragreement. In comparing intense training, discussion, and a control groupfor BES, there were no significant differences in leniency error comparingthe discussion group and the control group. Intense training on the BESresulted in significantly less halo error than the discussion group andcomparison group (Ivancevich, 1979). Schneier (1977a) found that cogn;tively complex raters had less halo error than cognitively simple ratersfor the BES or a simplified alternate version of the BES (see Section 6.2,Cognitive Complexity). Bernardin (1977) compared BES to sunrnated scalesand determined that sunrnated scales had less leniency error and greaterinterrater agreem~nt than BES.
Conclus,'ons Regarding Behav,'oral Expectation Scales
Nothing conclusive can be said about the psychometric characteristicsof BES compared to other ra ti ng formats. Researchers. have app 1i ed- manyvaried approaches to the developmental procedures and formats of BES.Psychometric qualities of BES do not promote its use over more easilydeveloped scales. It appears that BES suffers from judgmental errors andbi ases. Raters are requi red to infer the ra tee I s abi 1ity and to predictthe ratee1s expected performance •
The rigor in developing BES will determine the reliability and validit¥ of the scales more than the format. BES is time-consuming to constructand may not be worth the time or money. There is no clear evidence thatBES is superior to other scales unless it can be shown that there are worthwhi 1e by-products, such as clarifi cation of organi zati ona1 pol i cy,feedback for interviewing in performance appraisal systems, improvement ofindividual performance, and identification of divergent perceptions ofemployees.
Thurstone scaling is the foundation for the development of the BES.Thurstone scaling has been used in the past to scale attitudes in thefields of political science and marketing. The construction of Thurstonescales is labor intensive, and judges have difficulty discriminating amongthe moderate range of items. Public opinion researchers have adaptedscaling methods based on Likert and Guttman models. McIver and Carmines(19B1) ~onc1ude that these models overcome the limitations of Thurstonescaling.
61
- - - ------------ _.------------~--------------------_._-_._._----_..- -------------,
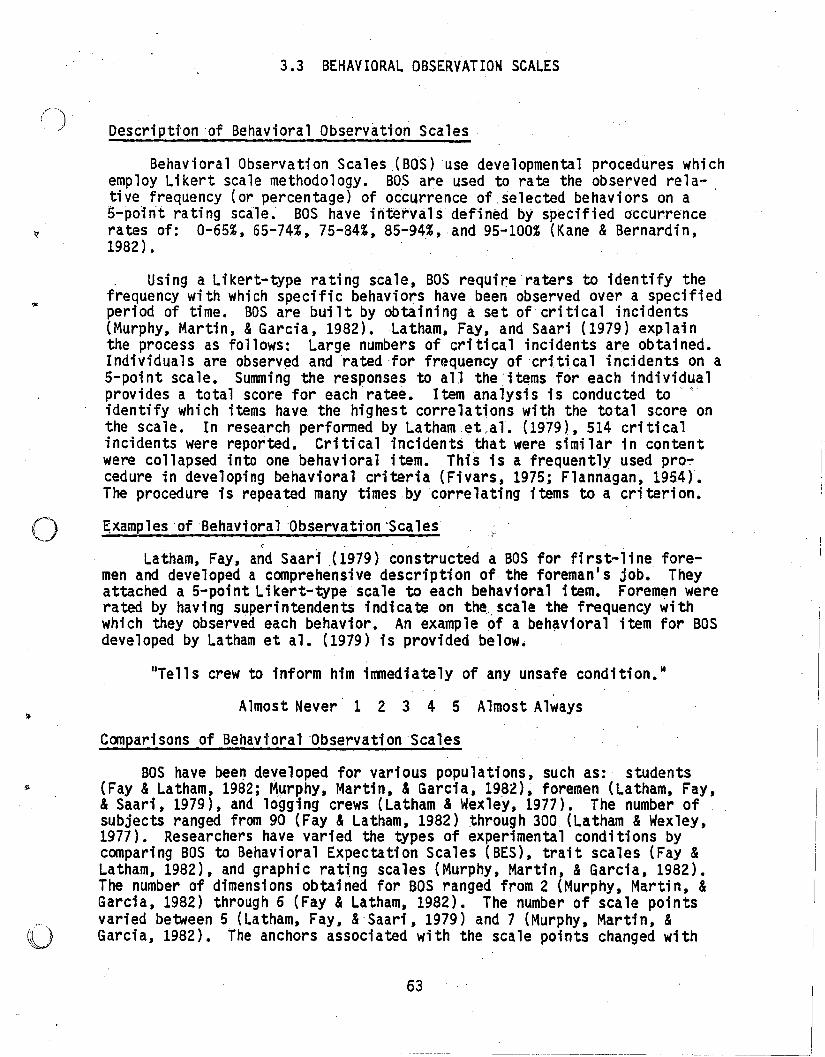
o
3.3 BEHAVIORAL OBSERVATION SCALES
Description 'of Behavioral Observ~tton Scales
Behavioral Observation Scales (BOS) use developmental procedures whichemploy Likert scale methodology. BOS are used to rate the observed relative frequency (or percentage) of occ~rrence of selected behaviors on a5-point rating scale. BOS have interval s defined by specified occurrencerates of: 0-65%, 65-74%, 75-84%, 85-94%, and 95-100% (Kane &Bernardin,1982). .
Using a Likert-type rating scale, BOS require raters to identify thefrequency with which specific behaviors have been observed over a specifiedperiod of time. BOS are built by obtaining a set of critical incidents(Murphy, Martin, &Garcia, 1982). Latham, Fay, and Saari (1979) explainthe process as follows: Large numbers of critical incidents are obtained.Individuals are observed and rated for frequency ofcriti.cal incidents on aS-point scale. Summing the responses to all the items for each individualprovides a total score for eachratee. Item anaiysis is conducted to ,.identify which items have the highest correlations with the total score onthe scale. In research performed by Latham et,a1. (1979), 514 cri ti ca1incidents were reported. Critical incidents that were similar in contentwere collapsed into one behavioral item. This is a frequently used pro~
cedure in developing behavioral criteria (Fivars, 1975; Flannagan, 1954).The procedure is repeated many times .bycorrelating items to a criterion.
~xamples 'of Behavioral Observati'on 'Scales~ .
Latham, Fay, and Saar1(l979) constructed a BOS for first-line foremen and developed a comprehensive description of the foreman's job. Theyattached a S-point Likert-type scale to each behavioral item. Foremen wererated by having superintendents indicate on the." scale the frequency withwhich they observed each behavior. An example of a behavioral item for BOSdeveloped by Latham et ale (1979) is provided below.
"Tells crew to inform him irrmediately of any unsafe condition. 1I
Almost Never' 1 2 3 4 5 Almost Always
Comparisons of Behavioral 'ObservationScales
BOS have bee~ developed for various popUlations, such as: students(Fay &Latham, 1982; Murphy, Martin, &Garcia, 1982), foremen (Latham, Fay,&Saari, 1979), and logging crews (Latham &Wexley, 1977). The number ofsubjects ranged from 90 (Fay &Latham, 1982) ~hrough 300 (Latham &Wexley,1977). Researchers have varied the types of experimental conditions bycomparing BOS to Behavioral Expectation Scales (BES), trait scales (Fay &Latham, 1982), and graphic rating scales (Murphy, Martin, &Garcia, 1982).The number of dimensions obtained for BOS ranged from 2 (Murphy, Martin, &Garcia, 1982) through 6 (Fay & Latham, 1982). The number of scale pointsvaried between 5 (Latham, Fay, & 'Saari ,1979) and 7 (Murphy, Martin, &Garcia, 1982). The anchors associated with the scale points changed with
63
each study, for example, "almost always" to "almost never," and "always,1IIIgenerally," II sometimes,1I "seldom," and IInever.1I .
Fay and Latham (1982) provided subjects with four hours of training, ,,,')while Latham, Fay, and Saari (1979) provided subjects with six hours of,training. Fay and Latham (1982) found that training led to significantlymore accurate ratings than no training. BOS and BES were both signifi-cantly more accurate for rating ratees at the .05 level of significancethan trait scales were for rating "firstimpressions" of natees •. The6-hour training program minimized ratin~ errors for contrast effects,central tendency, positive and negative leniency, halo effect, and first ~
impressions. Latham et al. (1979) determined that BOS was content validand was capable of differentiating between successful and unsuccessfulemployees.
In comparing BOS to other scales and conditions, it is not possible todetermine or discover any clear trends in the literature. Some of thereasons for this are the lack of replication across studies for: . number ofsUbjects, number and types of conditions, number and type of scale points,and number and type of dimensions. Since no one behavioral scale is any.less subject to errors than the other scales, the selection of methodologycould be based on one's prefe~ence for a Thurstone model or for a Likertmodel, etc. As previously noted, BOS develOpmental procedures are based ona ~ i kert-type model, and thi senhahces thei r psychometric soundnes.s.
Conclustons Regarding Behayioral Observation Scales
Critical incidents used to develop BOS which define effective andineffective behavior are sometimes observed so infrequently that they lack ~:=>the abiliW to differentiate good from bad ratees (Latham, Fay, & Saari,1979). BOS appear to require raters to make simple observations. Thisscale may be really measuring a trait like judgment.. because of the recallover time required by raters (Murphy, Martin, &Garcia, 1982). Anotherweakness of the BOS is the occurrence rate for each interval. Frequenciesfor various items of effective or ineffective behavior may not hold con-stant for each interval with the same percentages'(Kane &Bernardin, 1982;Bernardin &Kane, 1980).
Since no one scale format is any less error prone than another, theselection of scale developmental procedures could be based on a preferencefor the use of a Thurstone scale or a Likert scale. BOS developmentalprocedures have a Likert foundation which enhances their psychometricsoundness. ~ikert items employ ordinal scales and are primarily used forassEfssfng opi ni ons for survey research. They are also known as sUl11Tla ti verating scales and are used to select a set of items that measure the sameattitude or attribute (Orlich, 1978). An underlying assumption of Likertscaling is that behaviors of respondents are being rated rather than attitudes. This assumption attributes systematic variation in responses todifferences among respondents. Another assumption is that all items, as agroup, measure the same attribute so that the sum of the items will containthe same variable as the individual items. Separate scores are treated aspredictors of the total scores. However, it has been difficult to substantiate that the sum of the measures collecti vely measure the same dimensi on(McIver &Carmines, 1981).
64
---------------
')!
rt.-)·'""-
\1.
'Likert and Guttman scales appear to be superior to Thurstone scalessince they have overcome the limitations inherent in Thurstone scales.According 'to McIver and Carmines (1981), there are three basic assumptionsunderl yi ng the Li kertl sunmated model: (1) each item has a monotoni c traceline, (2) the sum of the trace lines is monotonic and approximately linear,and (3) the set of items measures only the attribute of interest. The useof BOS does not ensure valid ratings. Validity and reliability of scalesdepends on the rigor of the scale development procedures.
" ~ .... r, r
(.
65
i, \'\,J
3.4 MIXED STANDARD SCALES
Description of Mixed Standard Scales
Mixed Standard Scales (MSS) are a variant of the Behaviorally AnchoredRating Scale (BARS) technique. MSS ratings are behaviorally based with ahigh relevance to task performance. It is common to require rater participation inMSS and BARS scale development (Rosinger,Myers, Levy, Loar,Mohrman, &Stock, 1982). MSS were established to reduce rating errors(Saa1, 1979). Blanz and Ghise11i (1972) proposed thai a reduction in haloand leniency errors would take place by disguising the relationship amongthe items and the dimensions.
The actual MSS developmental procedures are structured on a Guttmanrating method (Saal, 1979). Gut1man scaling was developed as a response todeficiencies in scaling techniques established by Thurston and Likert. Ina true Gut1man scale (McIver &Carmines, 1981), it is possible to predictthe subject's response to each item making up the scale. A perfect correlation between overall scale score and item scores is almost neverachieved. Guttman scales are able to. demonstrate that a series of itemsbelong on a unidimensional continuum. The calculation for scoring theGuttman scale is similar to sUl'll11ing the positive responses on a Likertscale. The divergence between a cumulative Guttman model and a summativeLikert model hinges on when the responses are totaled and how the responsesare interpreted.
Rosinger, Myers, Levy, Loar, Mohrman, and Stock (1982) described MSSdevelopmental procedures as requiring a 4-step process. Step 1 is a seriesof interviews with potential respondents for the wording of the three(triad) anchors for each item. The second step consists of taking thepreliminary anchor type statements, and having a grpup of respondentssuggest changes for each statement and level of statement in the, triad.Feedback by respondents allows for modification of the original statements.The modified statements from the triads are then arranged in a randomorder. Each of "the statements is rated by respondents from 1, "very poor,"to 7, "very exceptional." Step 3 requires statistical analysis of the,triads to determine which triads to include in the final form. A pilottest of the instrwnent is performed for Step 4. Since the statements aremixed (and disguised) ,it is not possible to directly assign numericalratings to the format.
The respondents must rate each item without knowledge of the item'sdimensionality since the items are randomized in their presentation. Eachitem must be rated with a plus (+), zero (0), or minus (-) (Dickinson &Zellinger, 1980). Items rated with a plus indicate better performance thanthe item describes. Items rated with a zero indi·cates that the ratee',.s ,performance fits the item description. Items rated with a minus indica'tethat the ratee's performance is poorer than the item description. When therespondent completes the rating, the ratings are assigned a score. Analleged strength of MSS is that scoring would not be obvious to the rater(Katcher &Bartlett, 1979).
67
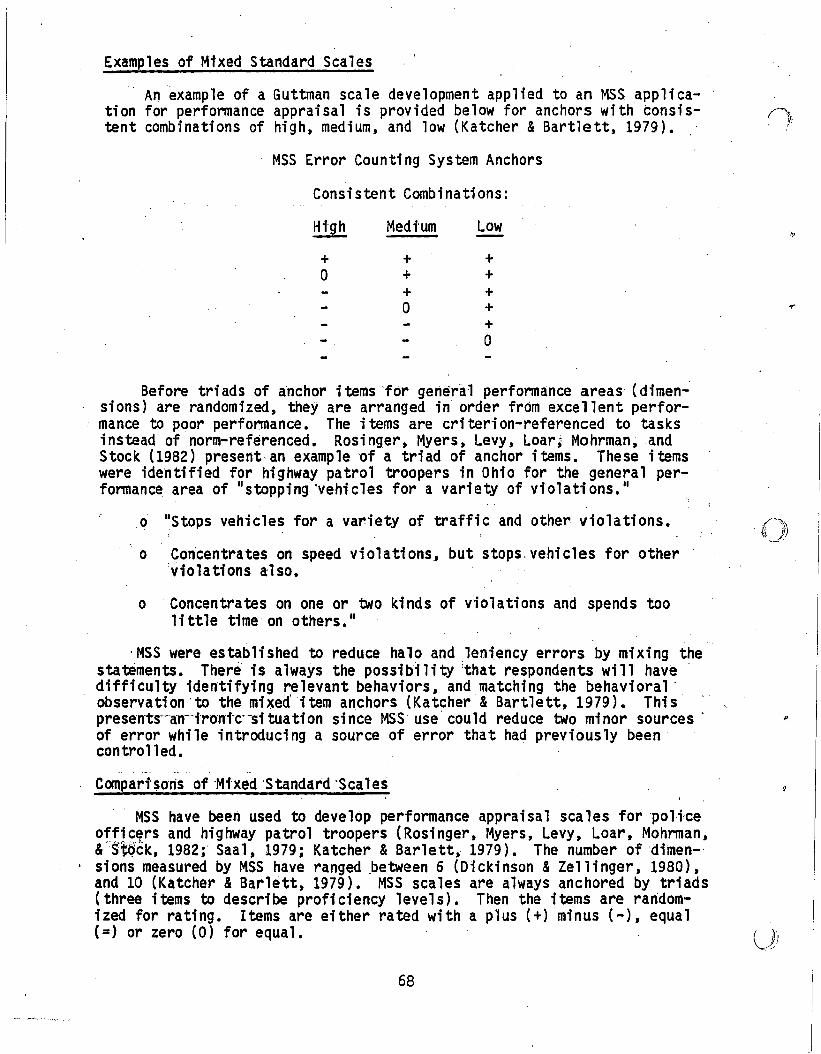
Examples of Mtxed Standard Scales
An example of a Guttman scale development applied to an MSS applica-tion for performance appraisal is provided below for anchors with consis- (')tent combinations of high, medium, and low (Katcher &Bartlett, 1979).
MSS Error Counting System Anchors
Consistent Combinations:
+o
Medium
+++o
Low
+++++o
''\'
Before triads of anchor items 'for general performance areas (dimensions) are randomized, they are arranged in order from excellent performance to poor performance. The items are criterion-referenced to tasksinstead of norm-referenced. Rosinger,Myers, Levy, Loar; Mohrman, andStock (1982) present an example 'of a triad of anchor items. These itemswere identified for highway patrol troopers in Ohio for the general performance area of II s topping 'vehicles for a variety of violations. II
o "Stops vehicles for a variety of traffic and other violations.
o Concentrates on speed violations, but stops, vehicles for other'violations a'lso.
o Concentrates on one or two kinds of violations and spends tooli ttle time on others. II
'MSS were established to reduce halo and leniency errors by mixing thestatements. There is always the possibility 'that respondents will have'difficulty identifying relevant behaviors, and matching the behavioral'observation 'to the mixed'itemanchors (Katcher & Bartlett, 1979). Thispresen'ts-an-;-ro'ni-c'-situation since MSS use could reduce two minor sources'of error while introducing a source of error that had previously beencontrolled •
.-- - .'
Compari'$ons of 'Mi'xed 'Standard 'Scales
MSS have been used to develop performance appraisal scales for 'poli'ceofficers and highway patrol troopers (Rosinger, Myers, Levy, Loar, Mohrman,&S;t(jck, 1982;' Saal, 1979; Katcher & Barlett, 1979). The number of 'dimen-
. sions measured by MSS have ranged ,between 6 (Dickinson & Zellinger, 1980),and 10 (Katcher & Barlett, 1979). MSS scales are always anchored by triads(three items to describe proficiency levels). Then the items are randomized for rating. Items are either rated with a plus (+) minus (-), equal(=) or zero (0) for equal. U)
68
MSS are a variant of BARS and require only three anchor items forexcellent, average, and poor performance. These anchor items tend to be
. shorter and more concise than those used with BARS. There is some evidencethat MSS are similar in reliability and validity to BARS, and to graphic
; rating scales (Rosinger, Myers, Levy, Loar, Mohrman, &Stock, 1982; Saal,1979). More research is required with MSS since Finley, Osborn, Dubin, andJeanneret (1977) found the BARS format to be superior in convergent anddiscriminant validities to the MSS format.
.',>
'of,
)
)
In research performed by Rossinger, Myers, Levy, Loar,Mohrman, andStock (1982), the majority of triads exceeded the .80 reproducibilitylevel. Interrater reliability for the instrument as a whole was at the .90level, and concurrent validity was .69 for the appraisal fonm as a whole.Dickinson and Zellinger (1980) obtained convergent and discriminant validity. The MSS format had as much discriminant validity as BARS and Likertformats •. In research performed by Saal (1979), graphic rating scales werefound to have greater interrater reliability than MSS. MSS had less haloerror than graphic rating scales. The MSS investigated was a revisedsystem for translating responses into numerical ratings. It was recommended that the revised MSS system would enhance rater acceptance andincrease face validity. The revised system did not alter previous resultsobtained in the comparison of graphic rating scales and MSS.
( . , ,-
The MSS format appears to perform psychometr{caJly as well a~ otherformats, e.g., graphic,~rating scale, Likert Seal,e" and BARS. As wfth theother formats, what s~~ms to be important is the',actual scale development.The MSS format appears to be as desirable as other formats in pSY<;hometricproperties when developmental procedures are rigorous such as in the' retranslation of expectations. Raters have not been. as receptive to the MSSformat, and have identified more preferred formats (BARS)'. Face validityand unidimensionality have also been issues with this scale •. MQ,st of theproblems identified with the MSS appear to result from sophisticated attempts by researchers to remove minor sources of error and by concealingthe scoring system from the rater.
Conclusions Regarding Mtxed Standard Scales
MSS are structured using a Guttman rating method (Saal, 1979') ~. Guttman scaling was developed as a response to deficiencies in the scalingtechniques established by Thurstone and Likert (McIv.er andCarmines, 1981).Guttman scaling is designed to order subjects, as .'we"l as items,' on anunderlying cumulative dimension. The-assumption is that a series of itemsin a Guttman scale belongs o'n a unidimensional continuum. '. ".;'
A high index of unidimensionality indicates that there are fewerinconsistencies in the rating of each item•. 'It is imperative that unidimensionality be verified when the MSS are applied infield stUdies sincethis factor cannot be assumed. For example, in the eV,aluation of policesergeants and lieutenants, it was found that 95% of the ratings ·were.,Jnionsistent (Katcher & Bartlett, 1979). An inconsistent. combination of ratingswould result in a rating of "equa l" or lithe same" for the high anchor, anda rati ng of II not 1i ke ly as good as" for the med i urn and low anchors •.
69
There has been some concern regarding the MSS coding system sincethere are three possible responses to each behavioral statement. Withthree item anchors per dimension, there are 27 possible response combi-nations for anyone dimension. MSS preclude the direct assignment Of'/"').'l"..numerical ratings so that a coding system is required. The coding system Ygenerally used for MSS ratings does not appear to be internally consistentwith face validity, although it is psychometrically consistent (Saal,1979). .
There isa1wciYs' the·posslbility that anchor items may be multidimensional instead of unidimensional, and this would yield inconsistent ratings. There is also the possibility that raters will inconsistently ra·tevarious behaviors: while comparing the rateeto each anchor since the separate anchor may appear to represent different dimensions even if they areunidimensional. MSS may be more appropriate for use with cognitive1ycomplex raters (Schneier. 1977a) because of the potential problems with the ~
item ahch·ors •... Ina cOOlp~rison of MSS toLiker~ scales and BARS, Dickinson. and Ze11 i nger (1980) found. tha t ra ters preferr~d a BARS format.Rateracceptance can be an issue with MSS.
From a psychornetri c standpoi n't·, MSS seem to be as sound as otherscales when developmental procedures are thorough. MSSare not consi stently superior whe~ compared to other formats~ Rater acceptance of MSS holdsthe potential for concern :bE!cause of theinconsi stant ratings obtai ned frommultidimensional scales applied to field environments. Other areas ofdeficit have been where the anchor items were thought to be unidimensional,but did not prove to be. -There is' al so the problem of the apparent lack offace va lidi ty for codi ng scores even though they .are i nternallyconsi stent.:
-Last, but not.1east, there is the frustration of. some raters not being ableto identify anchor items since the anchor items are disguised by randomlymixing them.' . . .
....:--.
70
()
u
CHAPTER IV
DESIGN OF QUESTIONNAIRE ITEMS
Questionnaire construction methods reviewed in this chapter focus onhow to write questionnaire items and how to order the items for inclusionin the questionnaire. The importance of open and closed items, and when touse each type is examined. Guidelines are presented for how to word items,how many words to use in each item, and the infl uence of posi tiveandnegative wording. Research on the sequencing of items in a survey, andvarious approaches to balancing items are presented.
In the area of when to use an open item, and:: when to use a closeditem, there have been many recommendations. However, much of what was'written appears to be based on folk wisdom more than on, empirical research.The literature does indicate that open-ended items are helpful in developing closed items and response alternatives, prior to the construction of apretest.
It is known that the selection of wording in an item can change theresponse patterns to a significant degree. Even so, the state-of-the-arthas not progressed to a point where researchers are able to consistentlypredict the effect of wording on item responses. It has been proposed thatresearchers may never be able to solve this dilemma because each time aword is changed in an item, there is the possibility that it will changethe meaning of the entire item. One attempt to address this issue has beenthe creation of a system to guide the researcher in selecting words whichgo into items. The rationale is that it is possible to follow a set procedure to assist in identifying what words to. select for items.
There have been some questions about not only ~hat wording to includein an item, but also how many words to include in.an item. The number ofwords to include in an item appears to be contingent on the content of anitem. For most items (except threatening items), the number of words doesnot seem to influence results. .
Once the actual items have been written, the researcher must decide.how to order the items within the survey itself. This is another situati'onwhere researchers are cognizant of the fact that the order of items caninfluence the results, yet there is no known way to predict when item ordereffects will exist. Some researchers have suggested that randomly mixingthe items wi 11 elimina te order effects. Thi s does not appear to be aviable solution since some items won1t make any sense to the respondentunless they follow a content-related sequence. The common advice for sucha sequence has been to develop general items which are followed by contentsp.eci fi c items.
Balancing items so that they have positive or negative wording, orpositive or negative response alternatives, was investigated for its influence on response effects. It appears as though items which measure personalit¥ traits are more influenced by balancing than items constructed forother. applications.
71
Overall, the design of questionnaire items is tenuous since it is notpossible to predict in advance the proper wording or ordering of items.Even so, this chapter provides some tentative recommendations to followunder the constraints of minimal empirical data.
72
( ~)
)
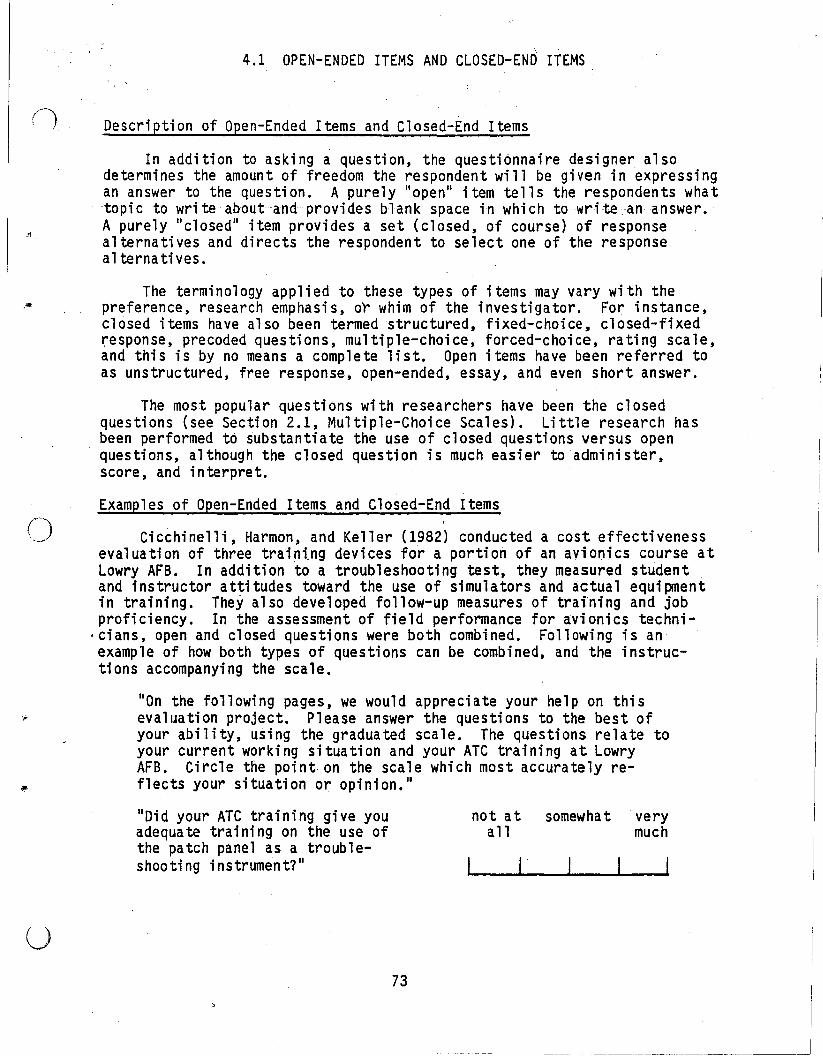
4.1 OPEN-ENDED ITEMS AND CLOSED-END ITEMS
(,.,Description of Open-Ended Items and Closed-End Items
In addition to asking a question, the questionnaire designer alsodetermines the amount of freedom the respondent will be given in expressingan answer to the question. A purely "open" item tells the respondents whattopi c towri teaboutand provides blank space in which to write an answer.A purely "closed" item provides a set (closed, of course) of responsealternatives and directs the respondent to select one of the responsea1terna ti ves.
.-
()
The terminology applied to these types of items may vary with thepreference, research emphasis, or whim of the investigator. For instance,closed items have also been termed structured, fixed-choice, closed-fixed~esponse, precoded questions, multiple-choice, forced-choice, rating scale,and this is by no means a complete list. Open items have been referred to'as unstructured, free response, open-ended, essay, and even short answer.
The most popular questions with researchers have been the closedquestions (see Section 2.1, Multiple-Choice Scales). Little research hasbeen performed to substanti ate the use of closed questions versus openquestions, although the closed question is much easier to administer,score, and interpret.
Examples of Open-Ended Items and Closed-End Items
Cicchinelli, Harmon, and Keller (1982) conducted a cost effectivenessevaluation of three traini.ng devices for a portion of an avionics course atLowry AFB. In addition to a troubleshooting test, they measured studentand instructor attitudes toward the use of simulators and actual equipmentin training. They also developed follow-up measures of training and jobproficiency. In the assessment of field performance for avionics techni-
·cians, open and closed questions were both combined. Following is anexample of how both types of questions can be combined, and the instructions accompanying the scale.
liOn the following pages, we would appreciate your help on thisevaluation project. Please answer the questions to the best ofyour ability, using the graduated scale. The questions relate toyour current working situation and your ATC training at LowryAFB. Circle the point on the scale which most accurately re-fl ects your si tua ti on or opi ni on. II
u
"Did your ATC training give youadequate training on the use ofthe patch panel as a troubleshooting instrument?"
73
not at somewhat veryall much
I
"What aspects of your ATC training do you specifically use inyour current field assignment?" _
"What aspects of your ATC training do you use very little in your. current field assignment?" ----------------
"What would you add to the overall ATC training program at,'LowryAFB to better prepare avionics technicians for their fieldassignments?" ----------------------
In a study comparing open versus closed questions, Bradburn and Sudman(1979) used a national sample from the National Opinion Research Center(NORC). Their questions started out with content focused on leisure andsport activities, and then transitioned tO'what would be considered threatening questions. They developed eight different questionnaire forms including open and closed questions. The open and closed questions wereidentical except that the closed questions incorporated response alternatives. An illustration of a question developed by Bradburn and Sudman(1979) includes an open and closed question in juxtaposition:
"How would you de.scrib.e your marriage, taking all thin'gs together? Would you say your marriage is completely happy, veryhappy, moderately happy, slightly happy, or not atall happy?"
Comparisons of Open-Ended Items and Closed~End Items
The Bradburn and Sudman "(1979) research or),,,open versus closedquestions measured the following hypotheses: "HI Open-el'Jded, questions elicithigher levels of reporting for threatening behavioral topics than closedended questiohs. H2 Long questions elicit higher reporting levels forthreatening behavioral topics t~an,short questions. H3 Familiarquestionselicit higher reporting levels than questions employing standard research-chosen wording." : .
Bradbu~n-and~Sudman-Ci9_I9J foundtha t questions that have a "yes ll orII no" response for behavior performed at least once do .not support the thr~ehypotheses 1i sted above. For C'yes/no" response) questi ons about threa tening behavioral topics, open-ended questions did not elicit higher levels ofreporting than closed-end questions. Questions that ask the respondent toquantify the frequency or intensity of IIsensitivell behavior produced different results. Hypothesis 3 continued to be rejected. Hypotheses 1 and2 were supported for questions with threatening content. Open-ended questions thus are the preferred format for addressing threatening be'havioraltopics.
Schuman and Presser (1981) experimented with open versus closed questions, but did not focus on the area of threatening questions as Bradburnand Sudman had (1979). A work val uesexp~riment was conducted by Schuman
74
'II;.
()
u
and Presser using an open and closed question format asking respondentswhat they most prefer on a job. They were notable to determine which typeof question provided the most accurate view of respondent values. Almost60% of the responses to the open question were not included in the fixedresponse alternatives in the closed question. These discrepancies may havebeen due to the fact that t.he fixed alternatives in the closed question maynot have been pretested or that the response may no longer reflect currentopinion. (Their fixed alternative had been previously generated by NORCSocial Sciences Survey.)
Schuman and Presser (1981) hypothesized that the open question underestimated the respondents' perceptions of their' concern regarding crime.The response category for crime and violence on the closed question had apercentage rate of more than twice that achieved for open responses identifying crime. An alternative hypothesis could also have been developedsuggesting that.the closed-end format may have induced overestimates byvirtue of having presented fewer topics over which to distribute the responses. The open-ended interview is recommended aS,a way to discoverresponse alternatives that the researcher did not think of.
Modification of the fixed alternatives in two following experiments bySchuman and Presser (1981) resulted in a shift in responses so that 58% ofall the responses on the open form were included in the fixed alternativeresponses too. Previously it has be'en only 42%. Schuman and Presserconsi dered the closed questi on form better to use than the open form sincethe responses are easier to code. Open question responses are not alwaystha t arti cul ate, and responses can be vague.
Open questions are useful in pretesting questions to search out andselect adequate response alternatives for closed questions. After questionrefinement is completed, closed questions appear to be superior for administration of the questionaire (Schuman &Presser, 1981; Orlich, 1978).
Conclusions Regarding Open-Ended Items and Closed-End Items
Because of the constraints', involved in using open questions, mostresearchers, have turned to closed questions for their surveys. Reservations about the use of open questions have been many. Some of the resistance to their use involves coding, tabulating, and quantifying the subjective response~ -- this analysis can be extremely time consuming (Orlich,+978). Open questions are alsq time consuming for the respondent (as wellas the interviewer when interviews are conducted). For example, openquestions have answers that are much more difficult to record than the~closed questions. They either require more writing by a respondent or aninterviewer depending on the type of questionnaire administratton. Sinceopen questions'are more time consuming, this places a limitation on thenumber of questions that can be asked. It places an additional physicallimitation on the questionnaire as to the number of pages and amount ofspace alloted for recording responses to each open question (Backstrom &Hurchur-Cesar, 1981).
There is a special role for the use of open questions. In the constructi on of a techni ca lly sound instrument, SchW11an and Presser (1981)recommend conducting research with a large sample of the target popUlation
75
by initially surveying the sample with open qu~stions. The responsesobtained are then transformed into response alternatives for closed questions. Backstrom and Hurchur-Cesar (1981) offer additional suggestions forthe use of open questions. Open questions are able to elicit responsesthat can be used later in conjunction with quantified responses to adicolor to survey results. A qualitative analysis that includes anecdotalinformation can be included. Qualitative analyses compare the data collected from the open~ended questions with some predetermined standard ofwhat it should,be. Qualitative analyses are-theoretical, and not quanti-fied. Open questions are also a way to explore a respondent'~ attitudesand in-depth motivations.
Bradburn and Sudman (1979) found long open questions to be most usefulin obtaining information from respondents under,specific conditions. Thesequestions were directed toward gaining information about sensitive behavior(gambling, alcohol, drugs, sexual activity, and income) using familiarwording. Differences between open questions and closed questions forthreatening topics were significant at the .05 level. Threatening questions which request information about whether a behavior took place, andonly require a "yes " or "no " answer, obtain the same response whether theyare open or closed questiQn~. Bradburn and Sudman indicated that it may beeasier for respondents to acknowledge they were involved in a behavior thanto indicate their degree of participation.
The research conducted by Schuman and .Presser (1981) suggests that thedifferences in responses to open and closed ~uestions may be differentialacross populations. Apparently more educated populations tend· to havegreater congruity between open-ended and closed-end forms, while less educated respondents have more 'divergencebetween these forms. TMs disparitymay resu1 t~from the 1ower motivation' possessed!by~the:1ess educated')' to.wri te essay answers. ii''e'( ~,!,"i •
There is a need for both open-ended and'c10seQ-end questions. Openquestions are most appropriately usedfdr pilot testing prior toselect:inga closed question response forma t.Open-ended quest; ons may be "useful"whEmresearchi ng sensi ti ve content areas that mi ght be percei ved asthrea teni ng
:by respondents. Research that compares open and c1~sed questions has beensparse, although this topic has been under consideration for over 50 years.Therefore, the conc'lusions rendered here are somewhat tentative. It ·has 'been _tbe...s.tandard o.per.atingprocedure for most researchers to use closed.questions as the primary type of question in their refinement of surveyinstruments. .
())
76
:)
o
4.2 WORDING OF ITEMS AND TONE OF WORDING
Descri'ptton of Wordi'ng of Items and Tone of Wording
There have 'been a number of investigations regarding what is the bestway to word items in questionnaires. Application of the wording of itemshas been diverse and includes: questionnaires used for surveys, questionnaires used for performance rating scale items, and questions for testitems. Many of these investigations have followed the armchair philosophyapproach to science by coming up with commonsense advice on how to worditems. There have been sOOIe empirical l'nvestigations(experimental designsusing quantitative methods) for the wording of items.
SOOIe of the research has focused on wording items by developing adichotomy of positive or negative statements (Ory, 1982). Positive or .nega ti ve wording of items was explored to determi ne whether respondentswould have a tendency to endorse positively worded items and reject negatively worded items (Deaton, Glasnapp, & Poggio, 1980). Other kinds ofdichotomies have also been proposed for wording items. For example, Orlich(1978) suggested that questi onnai re items could be worded so that they areei ther personal or impersonal. Supposedly, items worded personally will bemore personal than they would be if worded impersonally. There is thepotential that the personally worded item will be more specific to theexperience of the respondent. This may provide the researcher with resultsthat have greater accuracy for items that are non-threatening. ~or threatening items written in personal terms, there may be a tendency to underestimate a behavior which would result in less accuracy. Of course, it alsois possible to include both personal and impersonal.versions of items inthe same questionnaire.
Researchers who are responsible for the wording of items face manyproblems since it is known that a slight change in wording could change theresults of the survey (Orlich, 1978). A potential pitfall for wordingitems has been identified. The use of technical words and technical jargonwould be understood by professionals, but may not be understood by respondents (Labaw, 1980; Strang, 1980; BackstrOOI &Hurchur-Cesar, 1981). Somewords embedded in questionnaire items cause ambiguity for respondents.This ambiguity may be created for a number of reasons~ An illustration ofthis would be words to which a respondent cannot relate. This could becaused by words which lie'outside their experience (BackstrOOI &HurchurCesar, 1981). Other reasons for ambiguity may be the use of words embodying complicated abstractions or words that have multiple meanings (Labaw,1980) • ;
Backstrom and Hurchur-Cesar (1981) indicated that each word needs tobe viewed not only for its own meaning, but also by the context in which
. the word is found. Items may be distorted by emotionally charged words orby using terminology which indicates to the respondent that one alternativemay be more desirable than another (loading the question). Each item needsto be worded so that the meaning will be clear and unequivocal to allrespondents. Individuals who write questionnaire items should screen forwords which would cause a biasing of results. Most blatantly biasing words
77
YES, NO, NOT SURE
probably are identified and removed from survey item's. It is difficult topredict in advance which words will bias an ite~. Schuman and Presser(1981) found that it was not the blatantly biasfng words that cause themost distortion, but the much more subtle words~ They felt that the bla~
tant words were so outstanding ,compared to the other words that it wasimpossible not to notice these biasing words in an item.
Examples of Wording 'of rtemsand Tone of Wordtng
In some sample questions developed by Orlich (1978), the differencesin i tern content for personally wri tten items versus impersonally wri ttenitems were illustrated., Orlich developed items regarding interpersonaLrelationships with managers. Personally oriented items requested respon~
dents to rate their relationships with management. Items which were impersonal requested respondents to rate how other. employees get along withindividuals on the job, and how work is rated by managers.
Smith (1981) presented examples of questions that were highly ambiguous. Apparently, many of the respondents did not consider the first itemin a sequence of questions in a literal sense. Instead, the respondentsdid not seem to be able to imagine how the consequences of their firstanswer would impinge on thelr responses to the following items. Below isone set of items that obtained many illogical response patterns due to theambiguity of the wording (Smith, 1981).
IIAre there any si tuati ons you can imagii'lE:~,in which you would' approve of a policemanstriking. an adult male citizen?1I
/''PI
,..
" ()IIWould you approve if the citizen II . ,). . . ..., .
"
and ohscen~A. II had said, vulgar things topo1i ceman,?'11
,.
YES, NO, NOT. SUREa
B. II WaS being questioned as a suspect ina murder case?1I YES, NO, NOT SURE-
C. IIwa~, attempting to escape fromcustody?1I
,.YES, NO, NOT SURE
D. II was' -attack;-n'g' the policeman w.ith hi sfi stS?1I YES; NO, NOT SURE
For all the respondents who said ll non to the "first question, 86~, selectedlI yes ll to one or more. of ,the latter items (A. B.,C. or D). Additionalstructuring of these questions could have been provided to alleviate theambiguity which resulted.
Schuman and Presser (1981) reported on the work of Mueller (1973)where Mueller researched the Korean and Vietnam wars regarding publicopinion data. A trend was identified by Mueller in an experiment using aGallup question. When questionnaire items mentioned the threat ofCommunism, support for'U.S. intervention was increased. The origfnal item used
78
())
I ~
()
o
in a Gallup Opinion Index in 1967 was later used in an experiment by Schuman and Presser (1981) along with a modified iteni that incorporated thethreat of Communism. They found that support for U.S.mili,tary intervention can be increased by as much as 15% if an item incorporates thepossibility of a Communist threat.' . .
Usually, 'the blatant attempts to bias an item by tone of wording arenot so 1i ke ly to succeed. I n add i tion, not every change in word i ng willcreate a significant differ~nce among marginals(Schuman & Presser, 1981).Margi nal s are percentages of respons~s to each response alterna.ti ve foreach item in a questionnaire. Schuman and Presser reported the work ofStouffer (1955) where an item identified individuals who were againstchurches and religion as being bad and dangerous. Thi.s blatant languageappeared to have no effect on the responses.
Comparisons 'ofWording 'of Items 'and Tone of 'Wording
A great deal of the literature on item wording and tone of wordingdoes not fit into the framework of an experim~ntal design. Many recommendations for the way in which items are worded are pased on the actual fieldexperience (folk wisdom) of individuals who design questionnaires. Theseresearchers Irecommendati ons are more or less consi stent across the 1i terature. For example, individuals who design questionnalres would agree thatthe use of ambiguous words in an item would distort the intent of the item.The meaning of the item would then be ambiguous to the respondent(s) (B'ackstrom &Hurchur-Cesar, 1981; Smith, 1981; Laba~, 1980; Orlich, 1978).
Ory (1982) in~estigated the positive and negative wording of questionnaire items. These items were embedded in a performance evaluation scale.Ory hypothesized that respondents would be influenced by positively wordeditems and by negatively worded items. The results of two studies conductedby Ory indicated that the positive and negative wording of the items didnot affect the respondents. There were no significant differences foundfor rating items with.positive or negative wording. Research performed byDeaton, Glasnapp, and Poggio (1980) indicated that positively worded itemsreceived higher mean responses than negatively worded items. This trend inrating positive items higher, and negative items lower, did not reachstatistical significance. Respondents appeared to express a preference foror agreement with positively worded items by rating them higher than negatively worded items. Deaton et ale provide limited evidence that the toneof wording (positive or negative). can influence response patterns.
Schuman and Presser (1981) hypothesi zed that respondents with strongattitudes toward a topic would be less influenced by the tone of wording ina survey item,· and that respondents who.did not have a strong attitudetoward the content area would be more easily influenced by the tone ofwording in an item. They were not able to establish convincing evidence tosupport their hypothesis.
Items where respondents frequently ignored the absolute phrasing werethe focus of research conducted by Smi th (1981) ( see Section 4. 2,Examplesof Wording of ItemS and Tone of Wording -- policeman striking citizen).The wording on the survey items Smith used did not prevent respondents fromanswering the questions with contradicting response patterns. Respondents
79
who answered the first item in a series of 5 items with a " no " would alsohave to answer "no " to the other 4 items in order to maintain a logicalsequence. However, 86% of the respondents who .answered "nou. to the firstitem of the series provided a contradjctory response to the rest of theseries. Smith's investi"gation of incongruity for ambiguous item responseconcluded in a profile for those particular res~ondents. The respondentswho answered "no" to the first question regardi,ng the approval for a policeman to strike an adult male and then answered "yes " to one or morei terns approving such stri ki ng were i nvesti gated further. Addi tionalda taoobtained from these respondents was: (l) Interviewer's assessment of therespondent's comprehension, and a 10-item word identification test measuring verbal ability and years of schooling; (2) Respondents were askedabout their attitudes toward the judicial system and questions about firsthand exp~rience with varying degrees of violence; and (3) The respondent'sprl?l?~·I)S~ty to check "don't know" response a1terna tives was exami ned.Respondents with contradictory response patterns were non-white, had lesseducation, less verbal achievement, and lower comprehension than otherrespondents. These respondents were more likely to be female, and theirattitude:was in favor of the initial statement in each series of five
..j terns •..'
Schaefer, Bavelas, and.Bavelas (1980) developed a method to ensure·that respondents would only be subjected to items that they could understand. The technique that they used is called "Echo." They developeditems that were used in a performance rating scale~ It would be possibleto use theUEcho" technique in the development of survey items too.Essentia.l1y~ the "Echo" tec,hnique is a method for wording questionnaireitems in' the language of the respondents. A detailed procedure for usingthe "Echo" technique is available from J. B. Bavelas (1980).
The "Echo" technique assumes that there) are two separate populationsin the development of questionnaire items.. One population is the researchers, and the other population is the respondents. Phrasing of itemsneeds to be in the language of the respondents, and it requires contentvalidation. A sUll1Tlary of the "Echo" technique includes the development ofa pool of items generated by a survey directed to the target population.The sample of potential respondents from the target population followsprinted guidelines to write the items. Another sample from the 'targetpopulation is selected to sort items into categories •.. · Part of this processincludes concurrence by the members of the sample that the· categories aremutually exclusive. .
Schaefer, Bavelas, and Bavelas (1980) determined that a questionnaireconstru'cted by the "Echo" method was rated by respondents as superior-tilfour other questionnaires at the .001 level of significance. The~ res~lts .they obtained support a suggestion made by Labaw (1980). Respondents' canexplain what they mean to assist researchers in clarifying item wording.This is a way to assure that questionnaire items do not become instrumentsto force researchers' language, jargon, and values upon the respondents.
80
I (J)
..
()
u
Conclusions Regarding Wording of Items and Tone of Wording
. Researchers are cognizant of the fact that the wording of an itemand/or the tone of wording has the potential to change the marginal responses to a significant degree. Yet, being able to predict when this .effect will take place, and by what kind of words, seems to be beyond thecapability of research at this time. This is not to say that in someinstances'researchers have not been able to predict the effect of wordingin items (Mueller, 1973; Deaton, Glasnapp, &Poggio, 1980). The resultsaren't consistehtlyreplicable. .
Schaefer, Bavelas and Bavelas (1980) pointed out one of the primaryfactors inhibiting research for the identification of words for inclusionin items. A standardized set of acceptable words or standardizedquestionnaires may not be what is neede~ for writing reliable and valid items.There are too many contexts for word inclusion in items, too many diffe'rentpopulations to address, etc. What may be needed is a procedure or methodto ide~tify specific words to be used in items, and the structure of theitem itself. Obviously, such an approach calls for greater rigor, time,and work by the research community. The selection of words for inclusionin items must be contingent on respondent experience with the content•. Theonly way to ensure that respond~nts will understand the wording is to usethe language of the respondents. Currently, there are no clear-cut ways tocontrol for word bias with the exception that questionnaire item design~rs
be sensitive to the issues of bias. If a word is so outstanding that thereis no doubt that it would bias an item, then there 1s a good chance' thatthe reverse will take place (Schuman & Presser, 1981). Ifit is thatnoticeable, then resp~ndents would probably not be influenced by the biasing words either.
~ r· : .
81
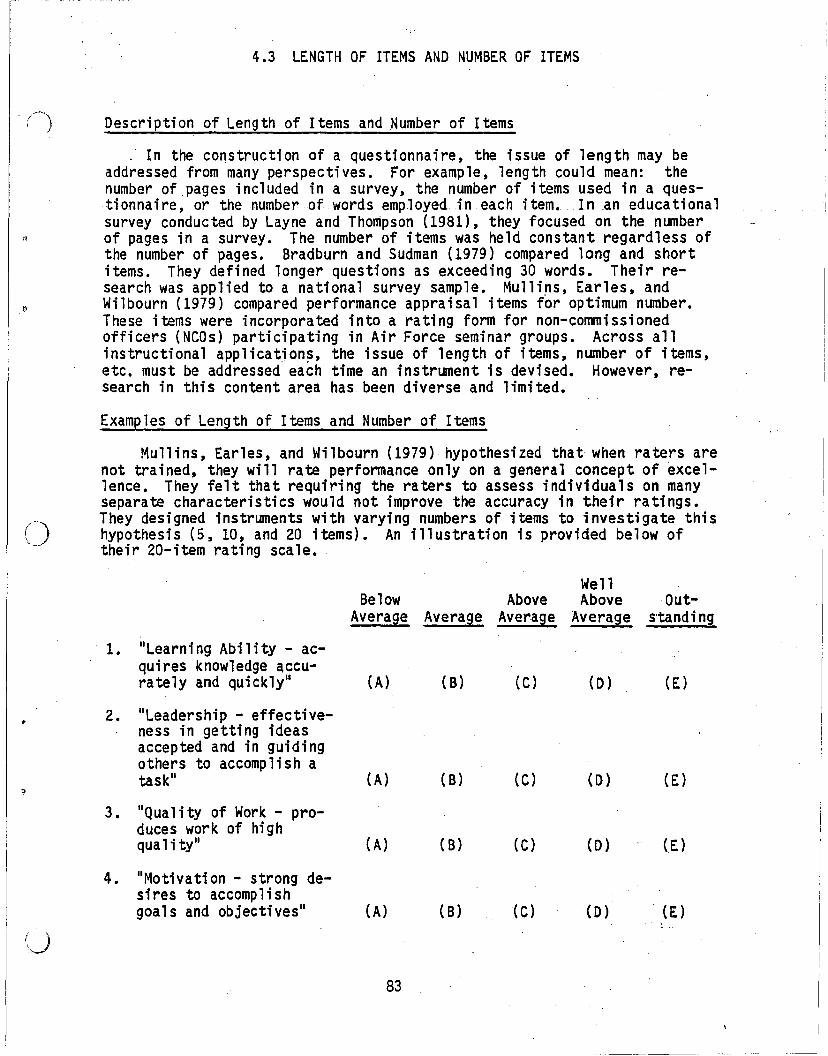
4.3 LENGTH OF ITEMS AND NUMBER OF ITEMS
. (~) Description of Length of Items and Number of Items
. In the construction of a questionnaire, the issue of length may beaddressed from many perspectives. For example, length could mean: thenumber of.pages included in a survey, the number of items used in a questionnaire, or the number of words employed in each item. Inan educationalsurvey conducted by Layne and Thompson (1981), they focused on the number
" of pages in a survey. The number of items was held constant regardless ofthe number of pages. Bradburn and Sudman (1979) compared long and shortitems. They defined longer questions as exceeding 30 words. Their research was applied to a national survey sample. MU11i~s, Earles, and
~ Wilbourn (1979) compared performance appraisal items for optimum number.These items were incorporated into a rating form for non-commissionedofficers (NCOs) participating in Air Force seminar groups. Across allinstructional applications, the issue of length of items, number of items,etc. must be addressed each time an instrument is devi sed. However, research in this content area has been diverse and limited.
Examples of Length of Items and Number of Items
Mullins, Earles, and Wilbourn (1979) hypothesized that when raters arenot trained, they will rate performance only on a general concept of excellence. They felt that requiring the raters to assess individuals on manyseparate characteristics would not improve the accuracy in their ratings.They designed instruments with varying numbers of items to investigate thishypothesis (5, 10, and 20 items). An illustration is provided below oftheir 20-item rating scale.
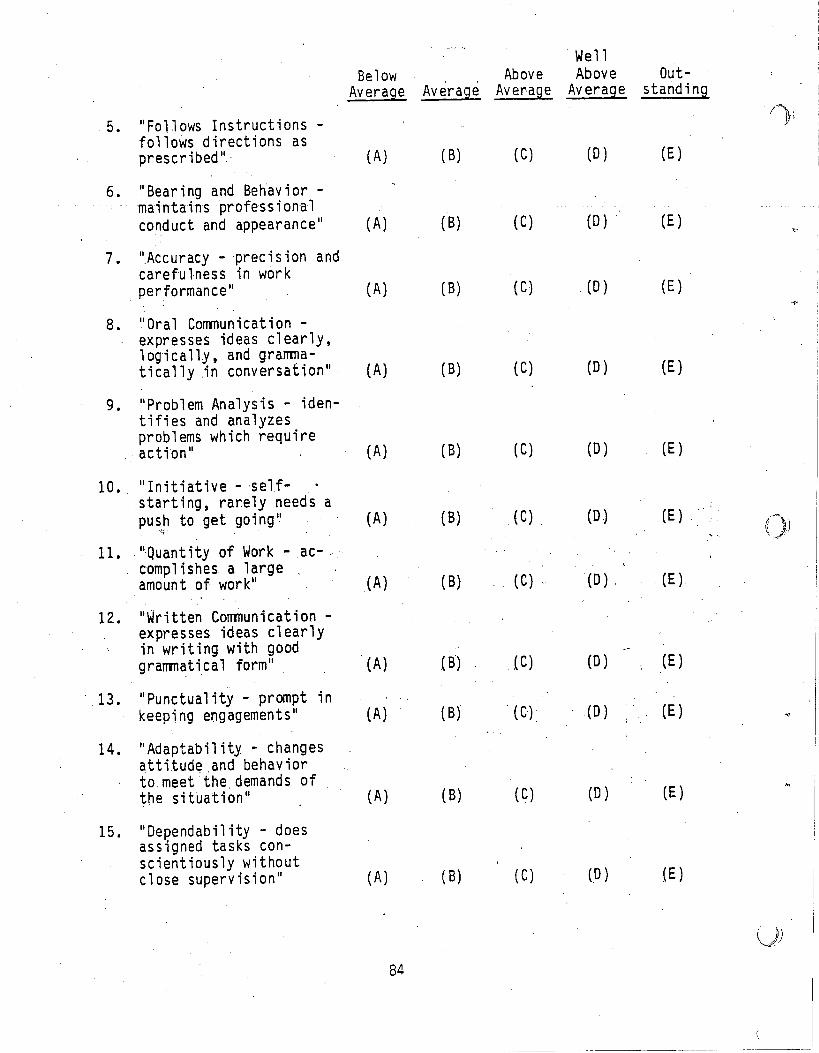
84
i ))~ ..
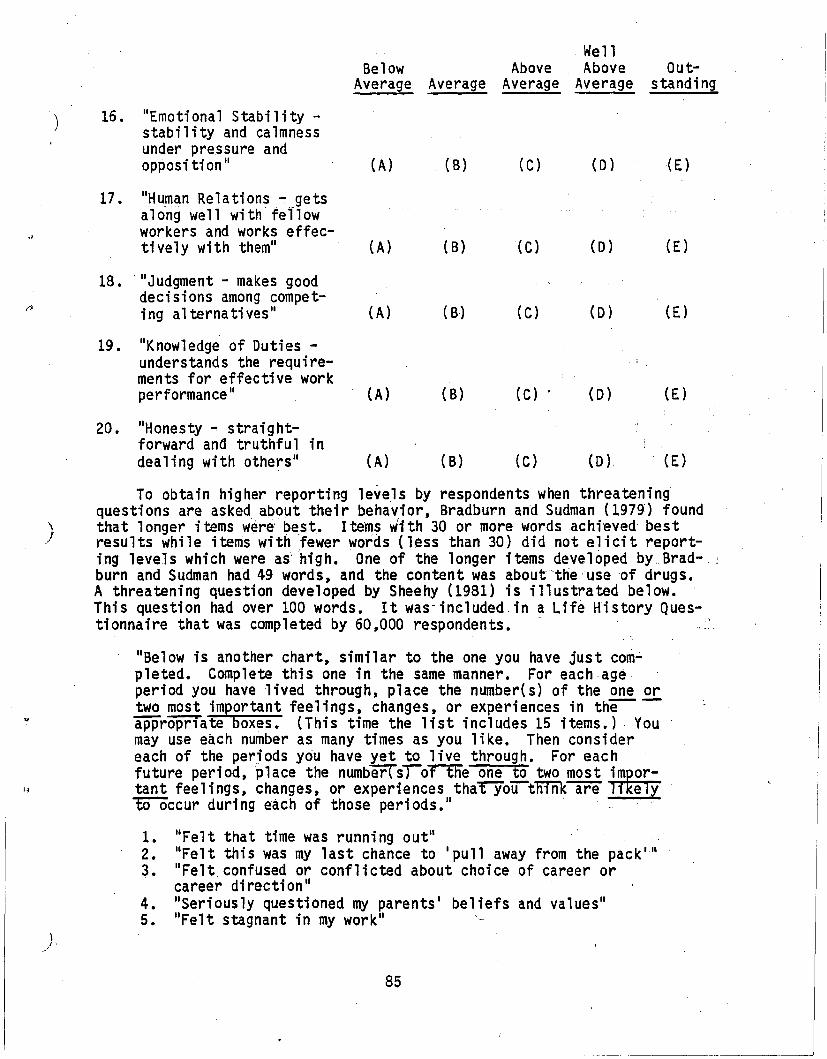
WellBe low Above Above au t-
Average Average Average Average standing
"
) 16. "Emotional Stability stability and calmnessunder pressure andopposition"
17. "Human Relations~ getsalong well with fellowworkers and works effecti ve1y wi th them"
(A)
(A)
(B)
(B)
(C) (D)
(D)
(E)
(E)
18. ' "Judgment - makes gooddecisions among compet-
r"> ing al terna ti ves" (A) ( B) (C) (D) (E)
19. "Knowledge of Duties -understands the require-ments for effective workperformance II (A) ( B) (C) . (D) (E)
20. "Honesty - straight-forward and truthful indealing with others" (A) (B) (C) (D) (E)
)
To obtain higher reporting levels by respondents when threateningquestions are asked about their behavior, Bradburn and Sudman (1979) foundthat longer items were be,st. Items with 30 or more wordsachi'eved bestresults while items with fewer words (less than 30) did not elicit reporting levels which were as'high •. One of the longer items developed by Bradburn and Sudman had 49 words, and the content was about the use 'of drugs.A threatening question developed by Sheehy (1981) is illustrated below.This question had over 100 words. It was-included, in a Life H'istory Ques-ti onnaire that was completed by 60 ,000 respondents. -,
"Below is another chart, similar to the one you have just com-pleted. Complete this one in the same manner. For each ageperiod you have lived through, place the number(s) of the one ortwo most important feelings, changes, or experiences in the-appropriate boxes. (This time the list includes 15 items.) , Youmay use each number as many times as you like. Then considereach of the periods you have yet to live through. For eachfuture period, place the number' srortFi'e one to two most~tant feelings, changes, or experiences thal:YoU-tnTnk are~to"Occur duri ng each of those peri ods. " .
}/
12.3.
4.5.
"Felt that time was running out""Felt this was my last chance to 'pull away from the pack lll
"Felt confused or conflicted about choice of career orcaree~ direction""Seriously questioned my parents' beliefs and values ll
IIFelt stagnant in my work ll
85
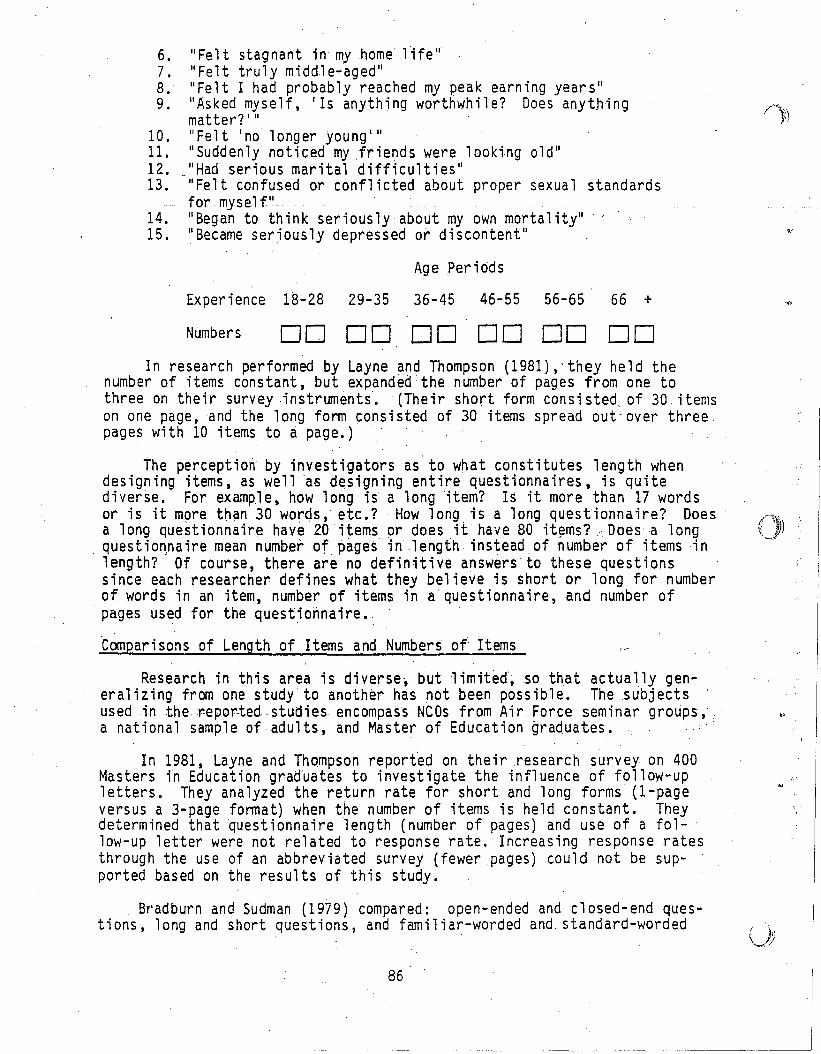
6. "Felt stagnant in my home life"7. "Felt truly middle-aged"8. "Felt I had probably reached my peak earning years"9. "Asked myself, 'Is anything worthwhile? Does anything
matter?11I10. "Felt I no longer young lll
11. "Suddenly noticed my .frie~ds were looking old"12. "Had serious marital difficulties"13. nFelt confused or conflicted about proper sexual standards
formyself"14. "Began to think seriously'about my own mortality"15. "Became seriously depressed o~ discontent"
Age Periods
Experience 18-28 29-35 36-45 46-55 56-65 66 +
'/
Numbers DO DO DO DO DO DOIn research performed by Layne and Thompson (1981),' they held the
number of items constant, but expanded the number of pages from one tothree on their survey ,instruments. (Their short form consisted,of 30 itemson one page,and the long form consisted of 30 items spread out- over threepages with 10 items to a page.)
The perception by investigators as to what constitutes length whendesigning items, as well a; designing entire questionnaires, is quitediverse. For example, how long is' a long 'item? Is it more than 17 wordsor is it more than 30 words, etc.? How long is a long questionnaire? Doesa long questionnaire have 20 items or does it hav~ 80 it~ms?· Does·a longquestionnaire mean numbef of ~ages in length instead.of number of items inlength? Of course, there are no definitive answers to these questionssince each researcher defines what they believe is short or long for numberof words in an item, number of items in a questionnaire, and number ofpages used for the questionnaire •.
Compari sons of Length of Items and Numbers of Items
Research in this area is diverse~ but limited, so that actually general izing from one study to another has not been possible. The subjects'usedinthe--r-epor-ted- stud; es encompass NCOs from Ai r. Force seminar groups,.a national sample of adults, and Master of Education graduates.
In 1981, Layne and Thompson reporfed on their .research survey on 400Masters i~ Education grad~ates to investigate the influence of f~llow-up
letters. They analyzed the return rate for short and long forms (I-pageversus a 3-page format) when the number of items is held constant. Theydetermined that questionnaire length (number of pages) and use of a fol~
low-up letter were not related to response rate. Increasing response ratesthrough the use of an abbreviated survey (fewer pages) could not be supported based on the results of this study.
Bradburn and Sudman (1979) compared: open-ended and c1osed- end questions, long and short questions, and familiar-worded and. standard-worded
86
..
()
u
questions for a national sample of adults. They defined long questions asthose using more than 30 words. The hypothesis was that more informationwould be obtained for responses to threatening questions with more words.They found that there was no format difference for the responses to threatening questions. This finding was for questions that requested informationon whether a behavior was performed only once. These are questions whichrequired only a "yes " or "no " response. When questions are structured toobtain the frequency about a "sensitive" behavior (in this study a sensitive behavior had to do with drug use, sexuality, alcohol consumption,etc.), items of greater length (more than 30 words) tend to increase thereporting. They suggested that non-threatening types of questions are notaffected by the number of words in the item •
The most efficient number of items to include in performance appraisalrating instruments was investigated by MUllins, Earles, and Wilbourn (1979). Their SUbjects were 132 Air Force NCOs assigne9 to the Air TrainingCommand. Subjects rated peers on 5, 10, and 20 item instruments. Theyhypothesized that they would rate performance on a general concept ofexcellence. They felt that adding additional items to the rating formwould not influence the raters ability ,to discriminate. They concludedthat more than five items on an instrument designed to measure performancewas not advantageous. In this particular stUdy, subjects were later askedto identify peer profiles based on peer ratings. More than five items did,not add to the accuracy of the ratings when peer profiles were used as acri teri on.
Conclus10ns'Regarding'length'of rtemsand Number of Items
Research in this area is diverse and limited. It is not possible togeneralize any specific theories or models about how many items to includein a questionnaire or about how many words to include when writing an item.From the limited da~ presented, there was an indication that the number ofpages used in a questionnaire did not influence response rate when thenumber of items was held constant (Layne &Thompson, 1981). When Mullins,Earles, and Wilbourn (1979) compared number of items (5, 10, and 20) to usein rating perfonnance,they found that five items were adequate in theirscale construction. Questionnaires constructed with a large number ofitems may not provide any more valid measurement than questionnaires constructed with a smaller number of items. Their stUdy employed a singleexternal criterion of class standing to compare the ratings against. Perhaps the raters were unable to differentiate between items (traits), andwere reflecting their general perception of the ratee1s performance. Even-If the respondents were better able to differentiate,item reduction techniques are recommended to reduce the number of i terns used in a questionnaire. Item reduction is a common technique used in the development ofquestionnaires. It has been used extensively in the development of behaviorally anchored scales and in marketing surveys.
Bradburn and Sudman (1979) researched threatening questions. Fonnatdifferences did not influence respondents· willingness to report the occurrence .of the behavior. Measurement of the frequency of a behavior was bestachieved through the use of open-ended ,questions which had 30 or morewords. Apparently, responses to non-threatening questions are not influenced by number of words in a question. This finding for non-threateningquestions is consistent with research findings in Section 7.1, Questionnaire Layout.
87
f--, )
()
'.
u
4.4 ORDER OF ITEMS
Description of Order of Items
The order of items may be configured in many ways, dependent on howthe items will be used. For instance, when items are used in opinionnaires, investigators sometimes ask mUltiple questions on a topic. Thismay reveal a greater depth of infonnationas. the questions become morespecifi c and continue in a sequence. Respondents try, to be consi stent inthis type of situation. However, it is possible that the respondents' answers are based on information they are obtaining by' reading the previousquestions. The responses may not be well thought-out attitudes on thetopic (Labaw, 1980).
Schuman and Presser (1981) found that initial items may influencelater items. Items which are replicated in different contexts may notcontrol for order effects, but may be confounding order effects with truechange. I twas determi ned that general items are more prone to ordereffects than more specific items. '
<.
Item ordering for test construction has been investigated for writingitems in an easy to hard' sequence~ Items whi ch are found in tests aresometimes ordered by the degree of difficulty. Easier items are presentedfirst followed by succeedingly harder items. The easy to hard ·sequencefound in constructing items uses the rationale that if individuals do notanswer an item correctly then they will probably get the next item incorrect too. If they get an item correct, there is a better chance of gettingthe following item correct.
Examples of Order of Items
Labaw (1980) concluded accepting responses at face value for initialitems may not provide the researcher with valid results. For example, whatparty a person voted for in a previous election (Democrat or Republican) isa better indicator of future voting behavior than responses that indicatethe respondent prefers to vote for lithe best candidate. II Labaw provides anexample of item ordering which sorts out this type of inconsistency:
1) II I vote for the man ~ not the party. II
2) "What are the characteristics of the man you vote for?~'Answer: "Honesty. II
3) "How do you define honesty?"Answer: "An hpnest man is one who votes on my side of the
issues. II
4) "How do you know he votes on. your side of the issues?1IAnswer: "Because he is a Democrat. II
In a study on the effects of item order, McFarland (1981) investigatedwhether general items ona survey should be followed by items which aremore specific. One of the general items pertaining to energy requests therespondent to describe the current energy problem in the U.S. The respondent is to rate it in a range between "ex tremely serious" and II no t serious
89
at a1l. 11 Specific items focused on specific attitudes toward energy related content areas, such as: causes of the gasoline shortage, windfallprofits tax on oil companies, nuclear energy, and strip mining regulationsthat had the potential, to increase coal costs.'
Comparisons of 'Order 'of Items
Surveys usually consist of consecutive items which are re1ated·bytopic. The ordering of items for context effects occurs when two or moreitems are presented together on the same topic or with closely relatedtopics. Items which are general and not specific may be prone to contexteffects. Yet, the meaning of the items would be changed if they wereseparated from their topic areas (Schuman &Presser; 1981). The currentstate-of-the-art for context effects suggests that all items which areinterrelated by content area may be affected by context effects. There iscurrently no way to predi ct whi ch items wi 11 have context effects.
The orderi ng of i terns has not usually been subjected to experimentalresearch. Some investigators tend to give prescriptive advice on the wayto sequence items in a survey' (from general to specific in topic areas).McFarland (198l) examined general and specific survey items' for ordereffect. No significant relationship was found between order effects, sex,and educa ti on. Order of the. items di d not appear to effect the re1ati onships between the general and specific items. However, 2 out of 17 relationships did reach significal1ce at the .02 level. It is proposed. that astronger survey instrument may be provided by designing general itemsfirst, followed by specific. items on re~ated topic areas.
Another 'approach to dea1i ng wi th content re1ated item orderi ng wasproposed by Labaw (1980). Using this approach, each item is formulated tofollow a logical progression. This may provide a better opportunity tohave the responses screened. ' The respondents can be assessed for' theirknowledge and understandi ng of the topi c area to legi timate1y answer theitem. There is certainly no guarantee even then as.to the respondentknow1 edge base . '
The issues related to order of items have been investigated by anumber of researchers (Spies-Wood, 1980; Dambrot, 1980; Gerow, 1980; ,Schmitt & Sche,irer, 1977; Spiers & Pihl, 1976) for multiple-choice questions. The question of what is the right order of items has focused onincluding items';n a sequence where the items start out easy and thenbecome hard.' ,
Overall, respondent attitude toward success in responding to an itemseems to have an effect on the test performance •. S~quencing easy to harditems assists respondents in building up a feeling of success according toSpies-Wood (1980). Dambrot (1980) found that sequencing items from easy tohard had little effect on respondent performance. Dambrot also reportedthe work of Schmitt and Scheirer (1977) and Spiers and Pih1 (1976), wherethe item order did not have a demonstrable effect on respondent performance. Gerow (1980) found no significant difference for the ordering ofeasy to hard items versus random ordering on test construction and administration. The weight of the evidence does not appear to support theproposition that ordering items from easy to hard facilitates questionnaire-answering performance.
90
..
,/ -"~ J' .•••" •••• "'<' '
jI
()
o
'Conclusions Regarding Order of Items
Questionnaires are plagued by contextual effects attributed to itemordering. This occurs when a number of items are developed on the sametopic and then grouped together by content. The result of this type ofitem cQ~position differs by questionnaire. Consistency of responses acrossitems may emphasize a perceived similarity or it may have the oppositeeffect where differences are emphasized. Apparently, contextual effectscan be minimized by generating items which are more spec ifi c in content(Schuman & Presser, 19B1; McFarland, 1981).
, The quality of responses to items on a questionnaire willhe determined by the respondent's background and knowledge of the topic area. Aseries of specific items (versus general items) will provide informationabout whether the respondent understands the ~ontent of the items. Itshould expose any logical inconsistencies in response patterns. Respondents with limited or no experience regarding the content area may deviatefrom the original approach. Their answers to questions change as theybecome more famil iar with. the topic through order 'effects., Researchers inaynot want to accept early responses as having face validity. Order of itemsand consistency in logic can be reviewed in a pretest.by questioning respondents on what they think each item means (Labaw, 1980). While additional research is needed on the effects of ordering multiple-choice itemsfrom easy to hard, the results of the ,research performed so far indicatesthat random ordering produces results no different from easy to hardordering. '
It is assumed, that, item order effects exist, yet it is not possible topredict when they will occur. Some research has indicated item ordereffects in marginals. Marginals ,are percentages of respon~es to eachresponse alternative for each item in aquestiorinaire. This distribution isconsidered a function of the wording of the item or possibly the orderingof an item. The wording of items has been knowD to change the size and/orthe direction of relationships for the distribution of responses to theresponse alternatives. The differences in percentages attributed to eachresponse alternative is studied for items.; Research designs have beendeveloped to compare the ordering of items, and to compare the word i ng ofitems by a,ssessing the differences among the r:n,arginals. Apparently, it ispossible to have order effects without their being displayed in the margi~
nals. Order effects also have been measured by finding correlations among.items which have been affected.
91
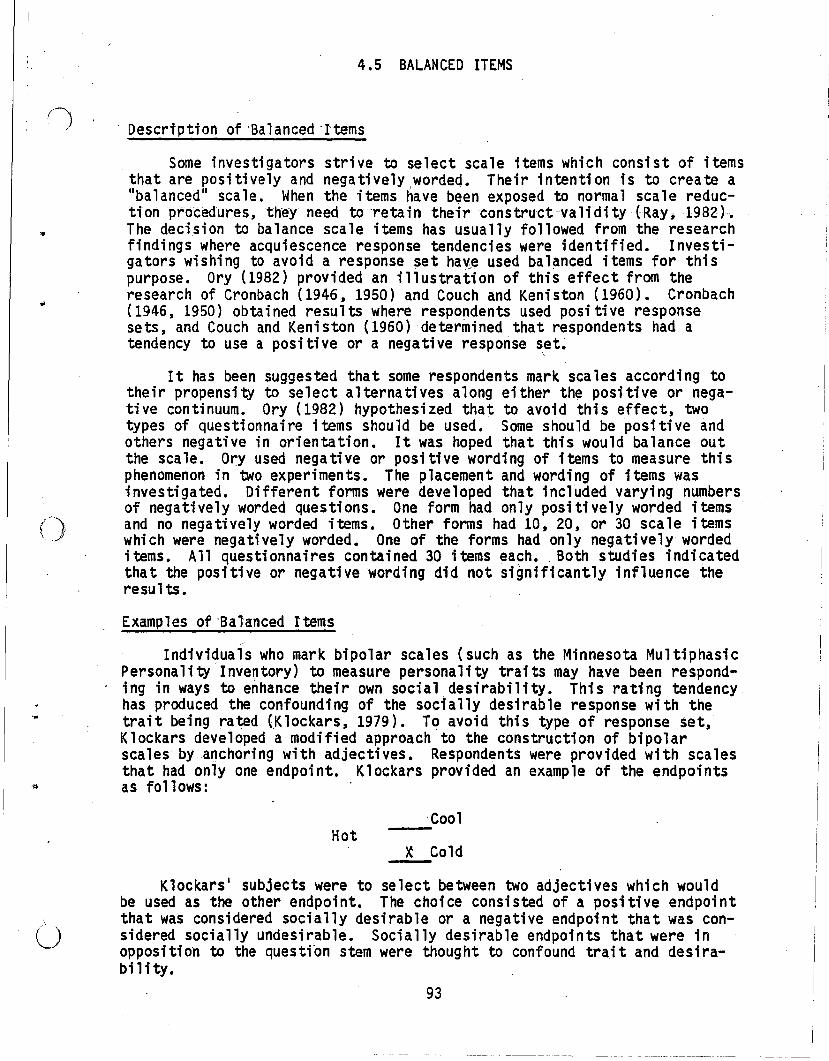
,,.
4.5 BALANCED ITEMS
. Description of 'Sa1anced 'Items
Some investigators strive to select scale items which consist of itemsthat are positively and negatively worded. Their intention is to create a
I ."balanced" scale. When the items have belen exposed to normal scale reduc-tiorl procedures, they need to retain their construct validity (Ray, 1982).The decision to balance scale items has usually followed from the researchfindings where acquiescence response tendencies were identified. Investigators wishing to avoid a response set have used balanced items for thispurpose. Ory (1982) prOVided an illustration of this effect from theresearch of Cronbach (1946, 1950) and Couch and Keniston (1960). Cronbach(1946, 1950) obtained results where respondents used positive responsesets, and Couch and Keniston (1960) determined that respondents had atendency to use a positive or a negative response set.,
It has been suggested that some respondents mark scales according totheir propensity to select alternatives along either the positive or negative continuum. Ory (1982) hypothesized that to avoid this effect, twotypes of questionnaire items should be used. Some should be positive andothers negative in orientation. It was hoped that this would balance outthe scale. Dry used negative or positive wording of items to measure thisphenomenon in two experiments. The placement and wording of items wasinvestigated. Different forms were developed that included varying numbersof negatively worded questions. One form had only positively worded itemsand no negatively worded items. Other forms had 10, 20, or 30 scale itemswhich were negatively worded. One of the forms had only negatively wordeditems. All questionnaires contained 30 items each•. Both studies indicatedthat the positive or negative wording did not significantly influence theresul ts.
Examples of 'Balanced Items
Individuals who mark bipolar scales (such as the Minnesota MUltiphasicPersonality Inventory) to measure personality traits may have been responding in ways to enhance their own social. desirability. This rating tendencyhas produced the confounding of the socially desirable response with thetrait beingra~d (Klockars, 1979). To avoid this type of response set,Klockars developed a modified approach to the construction of bipolarscales by. anchoring with adjectives. Respondents were prOVided with scalesthat had only one endpoint. Klockars provided an example of the endpointsas follows:
Hot'Cool--
X Cold
uKlockars' SUbjects were to select between two adjectives which would
be used as the other endpoint. The choice consisted of a positive endpointthat was considered socially desirable or a negative endpoint that was considered socially undesirable. Socially desirable endpoints that were inopposition to the questfon stem were thought to confound trait and desirabi 1i ty.
93

Johnson (1981) examined response styles for the order of presenta ti onof positive and negative items at the first position/endpoint in semanticdifferential scales. The sample included male readers of Horizons USA inGreat Britain, Italy, Phillipines, and Venezuela. The semantic differential scale consisted of 11 intervals identified as 0-10. Two versions ofthe survey questionnair~ were developed. One scale had positive anchorsfirst and the second scale had negative anchors first. An illustration isprovided below listing the positive and negative anchors Johnson used forthe item presentation in the 11 bipolar scales in four countries:
Item- "
AccurateInaccurate
.' Authori ta ti ve-Not authoritative
Impartial-Prejudiced
Well intenti onedQuestionable intentions
Timely-Old, dated
• Important to meUnimportant to me
Thought provoking-. Bland
Relevant to my interestsIrrelevant to my interests
Visually attractive- .Vi sua llyunattractive
Credible-Not credible
, Best magazine of>its kind-Worst magazine of its kind
There was no significant difference between the two formats for thepresentation of positive or neg;ativeanchors placement on the scale. Orderof presentation was not assotiatedwithresponse style across multinational
. setti ng s (J ohn(son, 1981). .' " . . .
Ory (1982) used items from the Instructor and Course Evaluati.on System(ICES) to study the effect of negatively worded items on respondent rat-i ng s • Ory I s research i nd i ca ted tha t the pos i ti ve or negative word i ng didnot significantly influence the results. An example is presented here ofthe positive and negative items Ory included in his questionnaire. Students rated 'their course and instructor on a S-point scale wi th anchoralternatives from "po.or" (=1) through "excellent ll (=S).
lIPositiVe version = Exams-covered a· reasonable amount· of material"
"Negative version = Exams covered 'an unreasonable amount of material."
Balancing questions in attitude surveys has also consisted of anapproach termed "formal balance." Some researchers have tried to persuade
94 .
t.':)')\ ' .; .,;.
vV-' I
II
.__ ....J
o
0'
,their respondents that it isperfectlya,cceptable to select both positiveand negative response alternatives. One way of doing this is to use itemsthat contain both positive and negative content. These types of survey .items are considered to have "formal balance" (Schuman & Presser, 1981).
The researchers at the Army Research lnsti tute, Fort Hood, recommendavoiding the'use of unbalanced directionality or'intensity of attitude inthe stem of a que.stion. They usually work with rating scales similar tothe semantic differential, which simplifies the composition of the stem.These researchers do not reque.st a rati ng for how effective a system is,but instead they ask for a rating of how lI effective-ineffective ll the systemis. Alternatively, they delete the dimension from the stem altogether, andshow the respondent the dimension only in the list of response alternatives. This approach is thought to cre~te a formal balance in the responsealternatives. Using these techniques, the stems either have a formalbalance or avoid specifying the dimensionality of the rating.
Balance in questionnaires has been,achieved in ~iverse ways for different applications. Professional survey organizations use internal methods to balance questionnaire ,items by balancing wording within each item toincl ude pos; tive and negative statements. Questionnaire~ used for studentrating forms have con.trasted positive items with negCitive items. Marketingsurveyors have anchored endpoints in semantic di'f,.ferential scales withpositive endpoints first or negative endpointsf1rsi. Balancing has beenused to anchor endpoints for personality measurements as a way to controlfor socially desirable ·resp~nse sets., ..
Comparisons 'of 'Balanced'! tems" .
." :'
Pos,itively and negatively worded items were developed to balance aLikert scale constructed to measure environmentalist attitudes (Ray, 1982).Four questionnaires were ultimately developed. T~Q questionnaires werebalanced with 12 items and 20 items, and 'tWo questionnaires were notbalanced. ,They contained 12 'items and 20 items also. Ray was interestedin determining whether the construct validity of the scale could be maintained during item red!J.cti,on procedures commonly. us~d in scale development.These four questionnaires were, correlated with the initial 77-item scaleand with each other., Corr~lation coefficients rClnged between .•78 and .87for reliabi 1i ty. For va lidi ty, correlation coeffi cients ranged between .aOand .90. Normal scale reduction procedures did not jeopardize initial andfinal forms of ,a balanced scale or an unbalanced scale. Construct validitywas maintained when forced balancing was used. This research was performedthrough New. South Wale!s University in Australia. Seventy-five respondentswere i nvo lved .' in thi s,'study .' "
Using a semantic"clifferential scale (with U intervals), Johnson(1981) investigated the presentation of ei.ther positive or negative endpoints displayed first at the left-hand side of the scale. Johnson wasconcerned wi th the possibi 1i ty of a response set where a respondent consistently marks a positive or negatlve s~imulus anchored word depending onits placement on a bipolar scale. Primarily male subjects were selectedfrom Great Britain, Italy, Phillipines, and Venezuela on the basis of theirreadership of Horizons 'USA magazine. The type' of response style focused on
, 95
--- '-,. --
in this study is the tendency to consi stently answer posi ti vely or negatively. This tendency depends on the placement of the positive or,negativeendpoint displayed at the left-hand side of the semantic differentialsca1e. When the data was combi ned for all four countri es) there was nosignificant difference between the two formats. The order of presentationfor the placement of positive or negative endpoints was not associated withresponse style since there was no clear pattern across the individualdimensions. However, when the data was analyzed on a country-by-countrybasis (instead of combined for all four countries), there was some evidencethat response styles differ nationally. For the Phillipines there was abias ,toward",positive stimulus words, and for Italy there was a bias towa.rdnegative stimulus words.
KloCkars (1979) researched semantic differential scales for responses~ts (soCially desirable responses) that were confounded with trait selfdescriptions on clinical instruments. The results indicated at the .05level of si gnifi cance that subjects confound the desirabi 1i ty dimensionwith the trait dimension. Klockars found that the presentation of a negative adjective (one 'that was socially undesirable) would influence theselection of a positive adjective (opp'osite,Jin meaning).
Schuman and Presser (1981) established balanced questions by balancingthe. pro and con response totally in one question. For example, on a question regarding unions,:thebalanced survey item was constructed as follows:"lftherei's a union at'a particular company or business, did you thinkthat all workers there should be required to be union members, or are youopposed to thi s1" They investi gated whether "balanci ng" items thi swaywou ld change survey resu 1ts in compari son to items whi ch were not balanced.They conducted four experiments with three of the experiments giving noindication of' a difference. Only the fourth experiment showed significance, '''\'ith'a' 9% increase for the balanced item in the negative direction.T~eywere 'not able to obtain evidence to SUbstantiate that balanced itemsaffect response on attitude surveys (there appeared to be no dif~erence indistribution). In other research performed by Schuman and Presser (1981),they found that adding a counter-argument into an' item did not serve tobalance the item. Instead, it established a new item 'which influenced thenegati veresponse. .
.'~ f".r'
Dry (1982) invest; gated whether posi ti vely or negati vely worded di agnostic items:wouldinfluence response sets for global items used in theevaluation of instruction. Diagnostic items were defined by Dryas itemswhich " .••measure student judgments and observations of specific behaviorsof ~the instructor) .instructi ona1 techni ques, and detailed student outc\oine~~II" G1oba1 items were defi ned as i terns which " ..•measure student·, I
evaluations of general areas of instruction." Dry determ.ined that the .positive or negative wording of the diagnostic items did not influence theresults~ In another attempt to measure effects of positive and negativewording of items, Deaton, Glasnapp, and Poggio (1980) compared forced~'
choice scale items for positive or negative wording, item length, andeffects of vague adverbs used to modify sentences, such as: "I I sometimes'enjoy being outdoors." The main effects for item direction (positive.ornegative wording) and item length were significant at the .05 level, although none of the interactions were significant, nor was the matn effectfor modifier intensity. Apparently longer items produced responses that
96
..
",.
{'"
"J'
[ .\)
were closer to the center of the response scale. Shorter items yieldedmore positive responses. Items that were positively worded received highermean responses than negatively worded responses.
Conclusions Regarding Balanced Items
From the research presented regarding balanced questionnaires, it canbe seen that the term "balancing" means different things to different researchers. ,In two studies (Johnson, 1981; Klockars, 1979), the balancingof anchors was investigated. the Johnson scale was used ill acroSs national survey, and the Klockars scale was used for clinical purposes to measurepersonality traits. The manipulation of anchors to achieve balance'for .:these two semantic differential scales resulted in different conclusions.Balancing positive and negative anchors did not indicate a response setoverall across four conditions. When anchors were balanced on a trait .
. scale, socially desirable (positive) responses were confounded with thetrait. In a semantic differential developed by Eiser and Osmon (1978),half the scales were anchored with positive labels, and half were anchoredwith negative labels. Positive anchored scales received significantly moreextreme ratings than negatively anchored scales. The usefulness of balancing anchors appears to depend on what type of application the scaleswill have since these were all semantic differential scales.
Dry (1982) and Deaton, Glasnapp, and Poggio (1980) interpreted thebalancing of items to mean that each item was either worded positively orworded negatively. Dry did not substantiate an influence in responsesbased on whether the item was positive or negative. Balanc1ng items couldnot be supported in this context (students rating instructors). Barker andEbel (1982) concluded that negatively worded items (on a true-false test)did not discriminate any bett~r than positively worded items. Negativelyworded items were designed to discriminate between the high ancllow achievers. The negatively worded items were found to be psychometrically moredifficult to rate by the students than the positively worded items. However, they were not more discriminating.
Deaton, Glasnapp, and Poggio (1980) did find that item length and itemdirection main effects were statistically significant at the .05 level.When item length increased (more than 17 words), responses tended to betoward the center of the scale. When item length was short (less than 17words), there was a tendency to respond toward the positive end of thescale resulting in higher mean responses. ' They concluded that items wereambiguous to the respondent when they were long and negatively worded.Thi s appeared to infl uence respondents to rate these items toward the.~
mid-range of the scale.- Schuman and Presser (1981) included positiv-~'-andnegative statements in each item to construct a wholly balanced item instead of balancing items by placing only positive and only negative itemsin juxtaposition on a scale. They found no significant difference betweentheir version of a balanced item and items that were not balanced (fornational survey items). Balancing items did not appear to be useful whenconstructing the national survey items or in the construction of instructional rating scales. ,Personality trait measurements were influenced bybalancing and length of questions.
97
Balancing items seems to be most influential when it is applied to themeasurement of traits (Klockars, 1979; Deaton, Glasnapp, &Poggio, 1980).Ray (1982) substantiated that the traditional method of item reduction usedin the construction of surveys would retain validity when items have been~))submitted. to ba1anci ng •
'O, .;
f" ,.
~ .
~..' .
,·,t·
,~ .... ;. _, I .. ~'
.';r ,'f ..; .
98
\
{>
----~--_._-_.__.- ---_.-_-~-_.
(")
CHAPTER V
DESIGN OF SCALE CATEGORIES
This chapter focuses on the design of scale categories. Severalstudies have been conducted to identify the best way to anchor a scale.Response alternatives selected have been varied such as: numbers, adjectives ,adverbs, phrases ,comp lete sentences, and descriptorsofbehavi or.In selecting response alternatives, researchers must determine whether theywish to include the category generally known as the "Don l t Know" category.This category wo~ld be useful for inclusion in a questionnaire for respondents who are not aware of the content of an item. The number of scalepoints to use is also an issue since there has never been consensus as tothe optimal 'number of scale points. There have been recommendations forthe use of a range of scale points all the way from 2 through 25. Obviously, this range includes scales that have an even number of scale points,as well as scales that have an odd number of scale points. When an oddnumber of scale points is selected, the labeling of the middle scale pointposition may cause difficulties for the researcher.
Apparently, the meaning of the middle scale point position has variedwith respondents. The concept behind the middle position is that the midpoint indicates a halfway position on the bipolar scale. " It is assumedthat the middle position provides the respondents with a response alternative that allows them to rate an item as neutral. Yet, it is known thatrespondents will rate the middle position when they have no opinion at all.Because of this possibility, some researchers omit the middle responsealternative altogether as a way to force respondents toward a polar"posi~
ti on on the scale. '
Labeling the middle response alternative has been~of concern to re-"searchers. It has" been especially troublesome for those individuals taskedwith developing behavioral scales. Since behavioral scales are built onlarge numbers of critical incidents, data reduction techniques are used toassign critical incidents to dimensions. Scaling the critical incidentsgenerates more behavioral anchors toward the poles, leaving few at the midpoint. This has made it difficult to label the midpoint of the behavioralscales. The assignment of the midpoint response alternative has been ambiguous since different popUlations have divergent perceptions as to themeani ng of the 1abe1. There have been suggestions to" use terms such as"neutral" or "borderline."
There is no conclusive evidence to support the use of one specificnumber of scale points. It would be psychometrically acceptable to suggest
.a numerical range of acceptable scale points. A tentatively acceptable "range might be between four and seven scale points. Five scale points arethe most preferred and predominately used by researchers. The number ofscale points is probably not what influences the reliability and the validity of a scale so much as the development of sound items. The same couldbe said for labeling a scale. Respondents seem to prefer scales with whichthey are most familiar, and are easy to use. This would be especiallyimportant for respondents that have lower levels of education.
99
-.J
)
)
)
5.1 RESPONSE ALTERNATIVES
Description of Response Alternatives
Points along the continuum of a scale have been identified (anchored)by numbers, adjectives, adverbs, description of behaviors, simple words,phrases, and complete sentences. Even the frequency and pattern of assigning anchors to the scale points has been varied. Some scales are comp1etely anchored with an anchor at each scale point. Other scales have anchorsonly at the two endpoints of the scale. For example, the semantic differential has an anchor beyond each end of the scale which labels each bipolardirection.
Several studies have been conducted to discover the effects of different. patterns and content of anchors on response distributions, reliability,etc. (Boote, 1981; Ivancevich, 1980; Borman &Dunnette, 1975; Reynolds &Jolly, 1980; Dolch, 1980; Menezes &.Elbert, 1979; Mathews, Wright, Yudowitch, Geddie, &Palmer, 1978; Beltramini, 1982). Researchers have beeninterested in: the re1ati ve re1i abi 1i ty of scales. G9mpri sed of differentanchoring, the cognitive structure used in responding to anchors, theabilities to define and differentiate among each anchor, and the raterspreference for particular scales and anchors (Landy &Farr, 1980). Thetype of anchor selected may also be determined by how the questionnairewill be administered, the content area surveyed, and the population it fsdirected toward (Backstrom & Hurchur-Cesar, 1981; Groves, 1979).
Examples of Response Alternatives
Backstrom and Hurchur-Cesar (1981) developed anchors for items theyconsidered sensitive or that they felt required complicated responses.
'They used cards having precoded responses printed on them for sensitiveitems, and also' for a lengthy series of questions requiring complicatedresponses. Use of a response card with precoded alphabet letters fordifferent categories allows the respondent to mention a specific categoryand tends to reduce respondent anxiety about revealing sensitive information. For a lengthy series of items with complicated response categories,they used a 7-point scale. The scale ranged from 1 (bad) through 7 (good).Each item was read to the respondents, and they were then requested toselect a number from 1 through 7. The scale was printed on a card whichthe respondent held. .
Groves (1979) reported on survey research conducted through personalintervJiews and over the telephone.' The scale used consisted of a "political thermometer II anchored by degrees from o through 100 for items about
.Jimmy Carter. Groves indicated that labeling a point on a response cardmay facilitate its choice by a respondent .. The following illustrated isGroves histogra~ of responses for the Carter feeling thermometer fromtelephone and personal interviews.
101
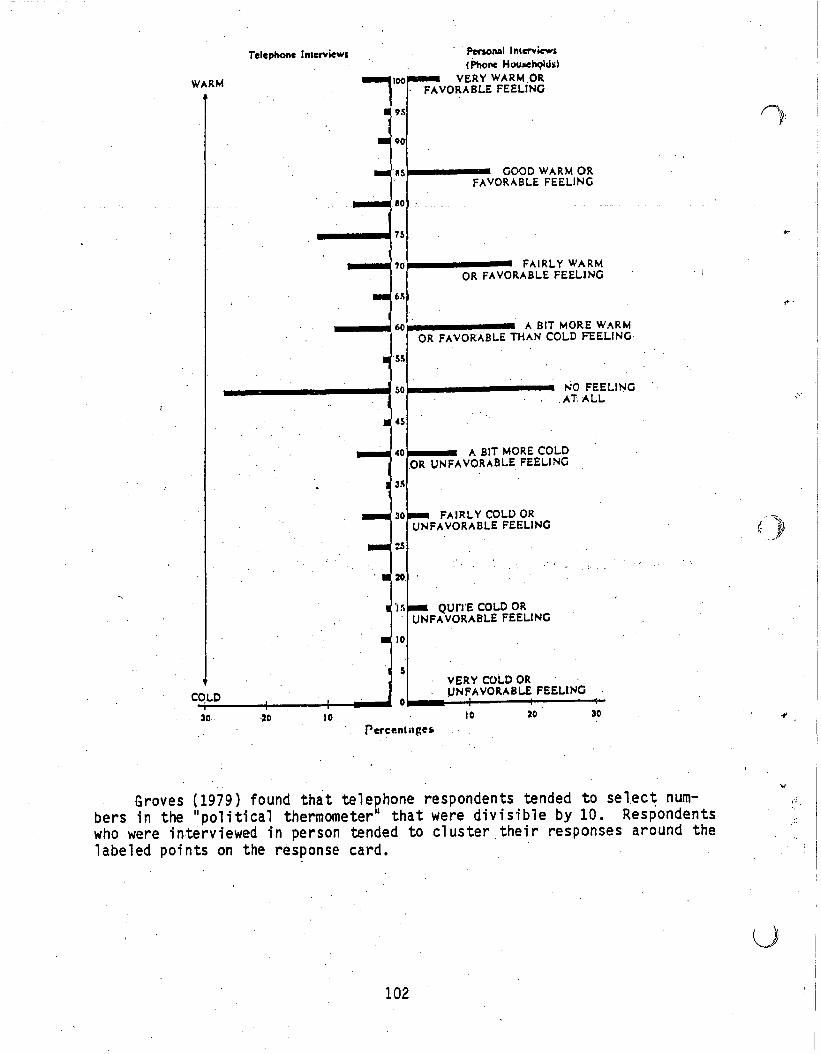
WARM
Telephone Interviews
91\
90
__""\80
____... 7~
, Penol\lll Interviews(PhoIlC HoulIChQlu~)
VERY WARM ORFAVORABLE FEEliNG
GOOD WARM ORFAVORABLE FEELING
1)\:
,"
5
COLO
__11(70_----- FAIRLY WARMOR FA VORABLE FEELING
A BIT MORE W.6,RMOR FAVORABLE THAN COLO FEELING·
NO FEELING.. ATALL
40 A BIT MORE COLDOR UNFAVORABLE FEELING
FAIRLY COLD ORUNFAVORABLE FEELING
Qurl'E COLD ORUNFA VORABLE FEELING
VERY coLO ORUNFAVORABLE FEELING
O__II---t----t-----+-
, I
,.-'
30. 20 10 10 20 30
Groves (1979) found that telephone respondents tended to select numbers in the "political thermometer" that were divisible by 10. Respondentswho were interviewed in person tended to cluster their responses around thelabeled points on the response card.
102
."
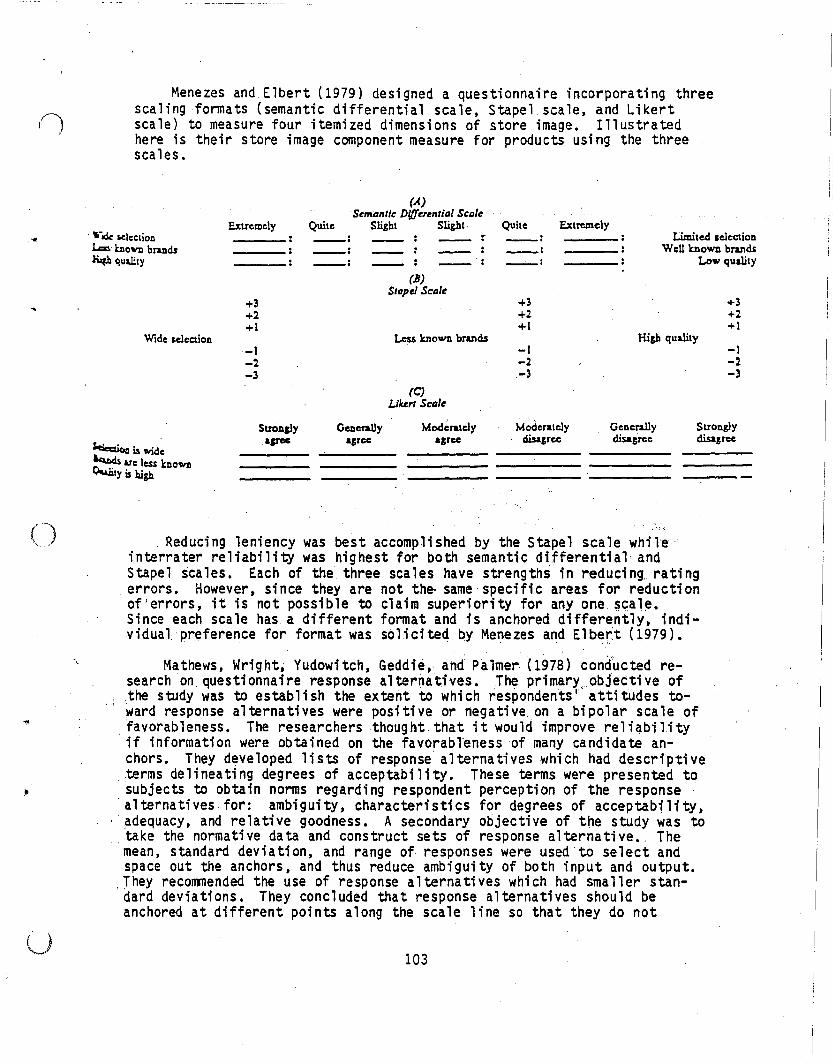
Menezes and. Elbert (1979) designed a questionnaire incorporating threescalingfonnats (semantic differential scale, Stapel scale, and Likertscale) to measure four itemized dimensions of store image. Illustratedhere is their store image component measure for products using the threescales.
."-aGe IoCleCliOll~ known bl'&lldsHq.b quaEty
Wide selectioD
Extremely
+3+2+1
-1-2-3
Quite .-_.._.
(A)ScmantlcDi/Juclltial Scali!
Slight Slight.
.-_.._.(8)
Stopel Scali!
Less known brands
(C)Likert Scali!
Quite
+3+2+1
-1-2-3
ExtremelyLimited selection
Well known brandsLow quality
+3+2+1
Hi;h quality-I-2-3
~iswide~ lie less known~ly is high
StrODPY&P'CC
Mod~l'&telyalree
Moderalelydisagree
Gencrallydisagfcc
()
....
u
. Reducing leniency was best accomplished by the Stapel scale whil'einterrater reliabili~ was highest for both semantic differential andStapel scales. Each of the three scales have strengths in reducing ratingerrors. However, since they are not th~ same specific areas for reductipnofierrors, it is not possible to claim superiority for any one, ~cal~.
Since each scale has a different fonnat and is anchored differently, individual preference for format was solicited by Menezes and Elbert (1979).
Mathews. Wright, Yudowitch, Geddie,· and: Palmer (1978) concfucted research on questionnaire response alternatives. The primarY,objective of.the study was to establish the extent to which respondents' attitudes to
0' ward response alternatives were positive or negative on a bipolar scale of· 'favorableness. The researchers thought that it would improve reliabilityif information were obtained on the favorableness of many candidate anchors. They developed lists of response' alternatives which had descriptive
· .terms delineating degrees of acceptability. These terms were presented tosubjects to obtain norms regarding respondent perception of the response
· alternatives for: ambiguity, characteristics for degrees of acceptability,o adequacy, and relative goodness. A secondary objective of the study was to
:take the normative data and construct sets of response alternative •. Themean, standard deviation, and range of responses were used to select andspace out the anchors, and thus reduce ambigui ty of both input and output.They recommended the use of response alternatives which had smaller standard deviations. They concluded that response alternatives should beanchored at different points along the scale line so that they do not
103
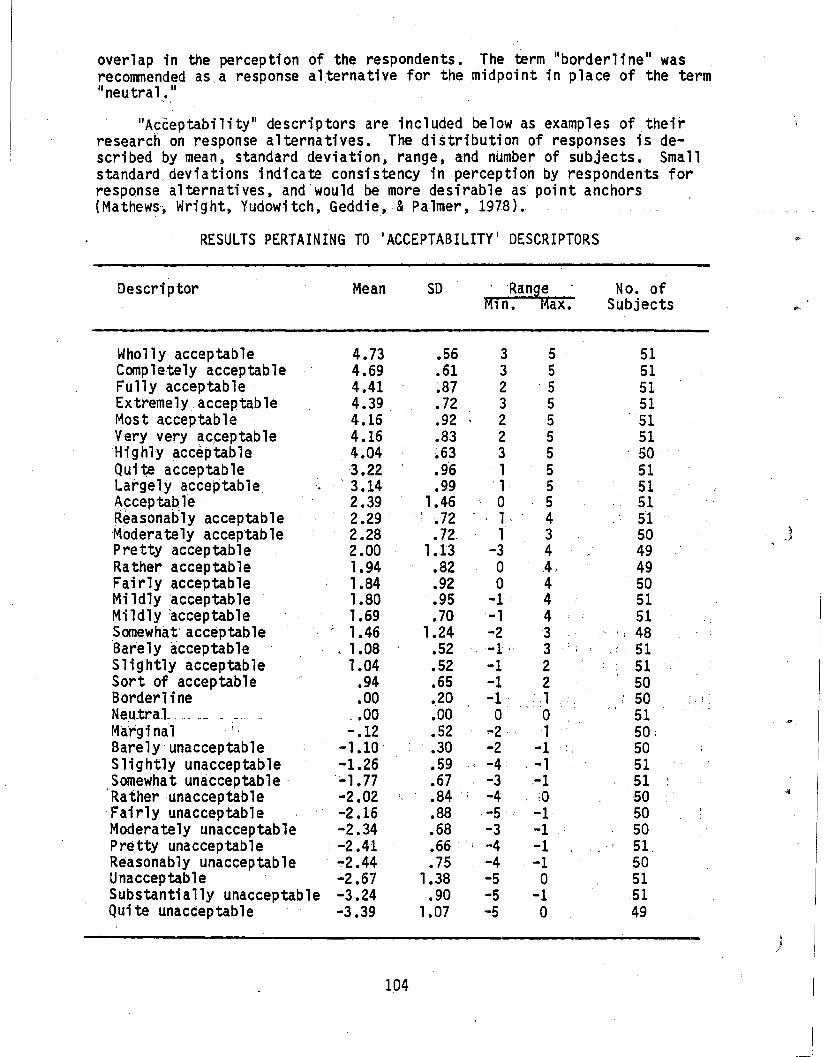
overlap in the percepti on of the respondents. The term "borderl i ne" wasrecol11l1ended asa response alternative for the midpoint in place of the term"neu tra1. II
". ",
IIAcceptabi 1; ty" descriptors are incl uded below a$ examples of thei rresearch on response alternatives. The distribution of responses is described by mean, standard deviation, range, and number of subjects. Smallstandard. deviations indicate consistency in perception by respondents forresponse alternatives, and would be more desirable as point anchors(Mathews, Wright, Yudowi tch, Geddie,& Pa-lmer ,1978) •
RESULTS PERTAINING TO 'ACCEPTABILITY' DESCRIPTORS
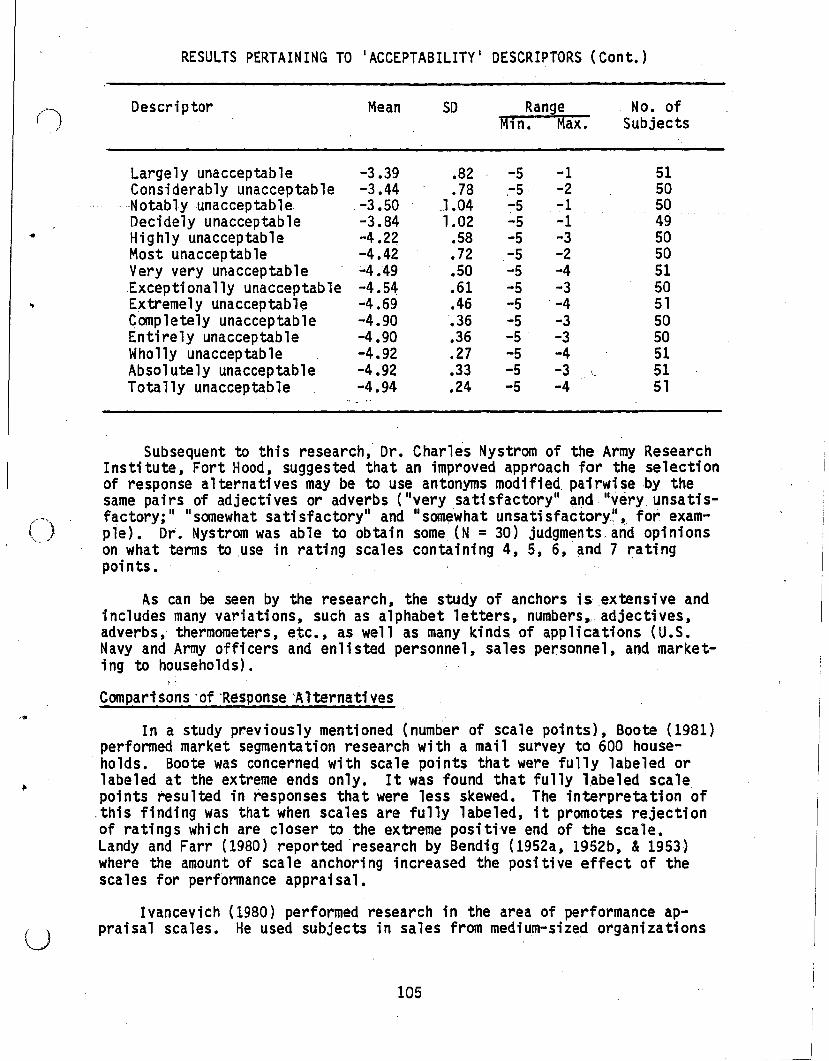
RESULTS PERTAINING TO 'ACCEPTABILITY I DESCRIPTORS (Cont.)
() Descri ptor Mean SO Range No. ofMin. Max. Subjects
. >
Largely unacceptable -3.39 .82 -5 -1 51Considerably unacceptable -3.44 .78 ,-5 -2 50Notably unacceptable -3.50 1.04 -5 -1 50Decidely unacceptable -3.84 1.02 -5 -1 49.. Highly unacceptable -4.22 .58 -5 -3 50Most unacceptable -4.42 .72 -5 -2 50Very very unacceptable ;'4.49 .50 -5 -4 51.Excepti ona lly unacceptab le -4.54 .61 -5 -3 50
.. Extremely unacceptable -4.69 .46 -5 -4 51Completely unacceptable -4.90 .36 -5 -3 50Entirely unacceptable -4.90 .36 -5 -3 50Wholly unacceptable -4.92 .27 -5 -4 51Absolutely unacceptable -4.92 .33 -5 -3 \.., 51Totally unacceptable -4.94 .24 -5 -4 51
Subsequent to this research,· Dr. Charles Nystrom of the Army ResearchInstitute, Fort Hood, suggested that an improved approach for the selectionof response alternatives may be to use antonyms modified pairwise .by thesame pairs of adjecti ves or adverbs (livery sati sfactory" ~nd livery unsati sfactory; II II somewhat sati sfactory" and II somewhat unsa ti sfactoryU, for example). Dr. Nystrom was able to obtain some eN = 30) judgments arid opinionson what terms to .use in rating scales containing 4, 5, 6,' ~nd 7 ratingpoints.
As can be seen by the research, the study of anchors is ex tensi ve andincludes many variations, such as alphabet letters, numbers,. adjectives,adverbs, thermometers, etc., as well as many kinds of applications (U.S.Navy and Army officers and enlisted personnel, sales personnel, and marketing to households).
, .'
"
u
Comparisons 'of 'Response 'Alternatives
In a study previously mentioned (number of scale points), Boote (1981)performed. market segmentation research with a mail survey to 600 households. Boote was concerned with scale points that were fully labeled orlabeled at the extreme ends only. It was found that fully l~beled scalepoints resulted in responses that were less skewed. The interpretation of
,this finding was that when scales are fully labeled, it promotes rejectionof ratings which are closer to the extreme positive end of the scale.Landy and Farr (1980) reported ·research by Bendig (1952a, 1952b, &1953)where the amount of scale anchoring increased the positive effect of thescales for performance appraisal.
Ivancevich (1980) performed research in the area of performance appraisal scales. He used subjects in sales from medium-sized organizations
105
on the east coast and mid-west. ,Ivancevich hypothesized that BehavioralExpectation Scales (BES) would exhibit less psychometric error than nonanchored scales or trait scales. Results indicated that BES was superiorto nonanchored rating scales at the .05 ~leve'l of significance for interrater reliability. Overall, psychometric superiority was not achieved throughthe use of the BES. Performance appraisals using behavioral anchors maynot be worth the developmental effort. Ivancevich mentioned similar find- ,i ngs by Borman and Dunnette (1975) for subjects who were U. s. Navy personnel.
Market segmentation studies were conducted to evaluate three methodsused to gather and evaluate value profiles with scales consisting of nu~
merical ranks. Formats were developed for Likert ratings using 7-pointscales and a paired condition using a minicomputer (Reynolds & Jolly, ,1980). They found that the rank and Likert scales required less respondenttime to complete than the paired~comparisonmethod at the .001 level ofsignificance. 'Interest in completing the scale items tended to decrease asthe number of stimuli increased. Using Kendall's tau as a measure oftest-retest re.liability, the Likert scale was ,less reliable than rank orderor paired-comparison 'scales. In another marketing study r~enezes and Elbert(1979) eval uated three scaling formats (Li kert scale, semanti c differentialscale, and Stapel scale) to measure store image. It was found that therewere no overall differences among the three scale formats (each scale wasanchored differently; see Menezes and Elbert for example of semantic differential, Stapel, and Likert scales).
c
Dolch (1980) compared.semantic differential scales anchored by eithernumbers or adverbs, and concluded that there were high intercorrcelationsfor both types of anchors. There appeared to be no difference betweenanchors. Howeve'r, when the semantic space was factor analyzed, it appearedthat the adverbi al anchors had di fferent mean; ngs for different respondents. Apparently, the two scales were not measuring meaning in the samewa~. In research performed by Beltramini (1982), the following scales werecompared: unipolar versus bipolar,S through 10 response alternatives, andhorizontal versus vertical physical format. Some of these scales werecomprised of ' verbal anchors and some consisted of numerical anchors.Beltramini (1982) found that none of the main or interaction effects weresignificant at the .05 level. '
,Inconsistency of results for application, scale construction, scale .format,_andscale anchoring suggests that perhaps the research would pro-'duce more useful results if scale item investigations were pursued in lieuof response alternatives. The assumption is that good scale item ,construction will be followed by the selection of anchors that are definitive sothat respondents will no~ attribute the same meaning to more than one scalepoint along the continuum. Mathews, Wright, Yudowitch, Geddie, and Palmer(1978) proposed that scale anchors should occupy narrow bands along thescale continuum so that they do not overlap. This is why they only selected anchors which had a standard deviation of 1.00 or smaller.
Conclusions 'Regarding 'Response AlternaUves
There are any number of ways a scale can be anchored (alphabet letters, numbers, political thermometer 0 to 100 degrees, verbal anchors, and
106
f),).~ -'"
,,))
()
....
•
u
behavioral anchors). Marketing studies comparing different scales anddifferent anchors (Reynolds &Jolly, 1980; Menezes &Elbert, 1979) were ndtable to find overall differences across ~ca1i ng forma ts.Sca1i ng developedfor performance appraisal (Ivancevich, 1980; .Borman &Dunnette 1975; Landy&Farr, 1980) comparing different scale formats and different anchorsindicated that no one format was able to claim psychometric superiorityover another. It was suggested by Landy and Farr that the best type andnumber of anchors selected would probably depend on the adequacy of thescale 4tmensions.
There has also been an inconsistency for the reliability and validityof an instrument and the preference of respondents for instrument usage.For example, Menezes and Elbert (1979) determined that each scale has itsown strengths and weaknesses, and that no one scale could be claimed asbeing more robust than another (Likert, semantic differential, Stapel).They questioned which scale would be of most use in measuring retailimages. Respondents in this study ranked the Likert scale as most preferred followed by the semantic differential, and lastly the Stapel scale.They suggested that the easiest formats be selected for less educatedsubjects. For ease of scale construction, the Stapel scale ranks firstsince it alleviates the problem of ·selecting antonyms or constructingLi kert- type statements. '
There is some evidence (Boote, 1981; and Bendig, 1952a, 1952b, 1953)that anchoring scales is useful in obtaining superior psychometric results.However, this area of investigation has received little replication for thenumber of scale points anchored, and there has been great inconsistency inresults to support anyone type of anchoring system versus another. Ifanchors are selected independent of a.nyi tern and measured for bands alongthe scale dimension, there is the potential that anchor linkage to the itemwould modi fy the standard deviati on of each anchor •
Beltramini (1982) and Dolch (1980) anchored scales verbally and withnumbers. In both cases, no one scale was psychometrically superior toanother. Variations in the anchors did not.seem to affect the item'sability to 'discriminate. Dolch determined that the semantic spa,ce was'different for adverb versus numerical anchors.' The developmental procedures used in selecting the items may be of greater importance than theanchoring 'since similar results have been obtained using different anchors.The determination of which type of anchor to use should also be contingenton the ques"f'ionnaire application (survey use, appraisal, .description ofrespondents, etc.) •
107
•
()
u
5.2 "bONIT KNOW" CATEGORY
Description of the "Doni t Know" Category
Some respondents are known for their tendency to withhold an op' n, on.They have a tendency to prefer to mark the category "donlt know" when it isan option on questionnaire forms. Withholding an opinion could mean thatthe respondent is not aware of the content in the questionnaire item andhas no knowledge of the content area. Another interpretation when selecting the "doni t know" category is that the respondents refuse to expresstheir opinion (Backstrom &Hurchur, 1981). Many attempts have been made todetermine the personality trait profile of respondents who have, the tendency to select the "don't know" category (Innes, 1977; Biggs, 1970; SchllJlan &Presser, 1981). However, results of research have been inconsistent in theidentification of a specific personality trait or a demographic attribute,such as age, sex, education, etc.
It has been determined that:a certain strata of respondents willprovide a substantive response to a standard version of a questionnaireform (that does not have a "don l t know" category). Yet, they will include"don It know" when they ar~ provided the opportuni ty. These same subjectswill indicate a~ldon't know" resp()nse when it is included in their selection choice on the form. To measure the "don't know" response,. Schuman andPresser (1981) developed "filtered" questions along with st~ndard ques- .tions. The filtered questions have an option for the "don l t know" categorywhere standard questions do not. It is possible for subjects to volunteera "don l t know" response on the standard form.
Examples of the "Don l tKnow" Category
Schuman and Presser (1981) established "don ' t know" filter items onvarious surveys to identify what type of respondent would select an opinionon one questionnaire form (without a IIdon l t know" category) and then mark a"don l t know" on surveys that include that option. Examples of their filterand standard questions are provided. These questions were previouslyincorporated into surveys from the National Opinion Research Center (NORC)and the Survey Research Center (SRC). Included along with the questionsare the marginals. (Marginals are the percentage of responses to eachresponse alternative for.each item in a questionnaire.)
109
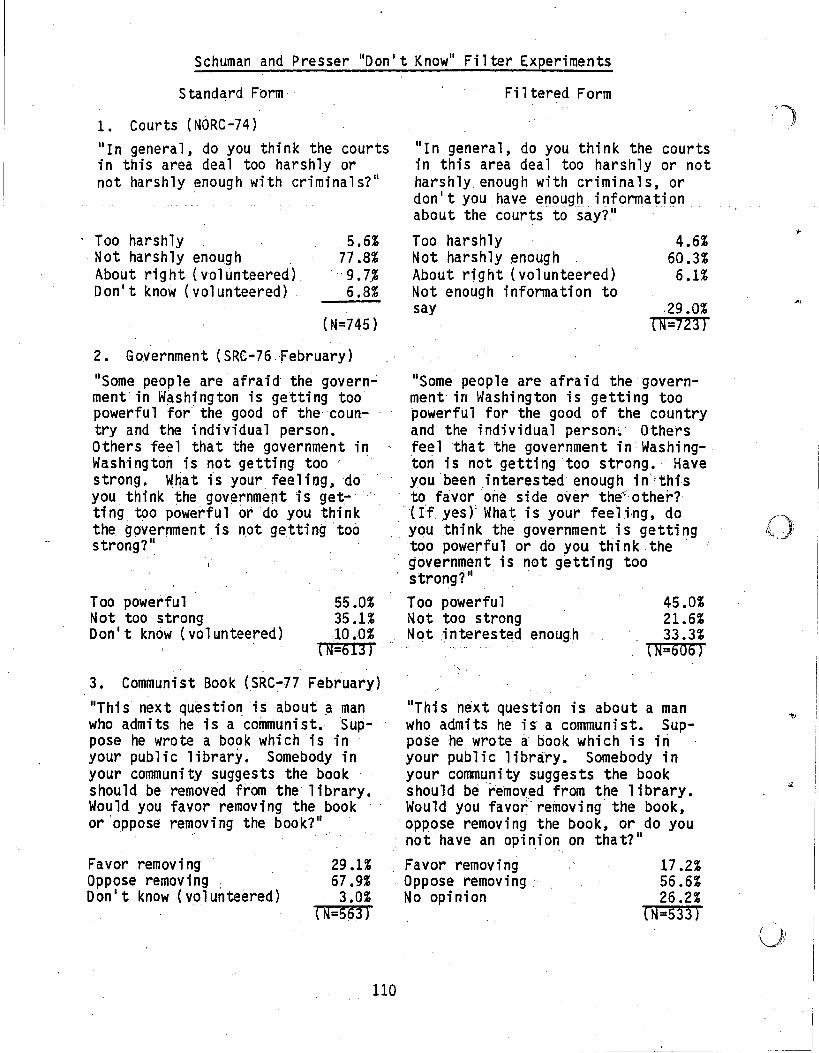
Schuman and Presser IIDon It Know ll Fi 1ter Experiments
Standard Form
1. Courts (NORG-74)IIIn general, do you think the courtsin this area deal too harshly ornot harshly enough with criminals?1I
Filtered Form
IIIn general, do you think the courtsin this area deal too harshly or notharshly enough with criminals, ord()n't you have enough i nfonna ti onabout the courts to say?1I .
Too harshlyNot harshly enoughAbout right (volunteered)Don't know (volunteered)
, 5.6%77 .8%
" 9.7:%6.8%
(N=745)
Too harshlyNot harshly ~nough
About right (volunteered)Not enough infonnation tosay
4.6%60.3~
6.1%
29.0%(N=723J
..
2. Government (SRC-76 February )IISomepeople are afraid' the government in Washi ng ton is getti ng toopowerful for the good of thecountry and the individual person.Others feel that the government inWashington is not getting too' 'strong. What is yourfeeliog,doyou thi nkthe,government is get:-' "ting too powerful or do you thinkthe government is not getting' toostrong?1I '
fU·".'/
45.0%21.6%33.3%
(N=606J
17.2%56.6%26.2~
(N=533)
IIThis next question is about a manwho admits he is a communist. Suppose he wrote a bookwhi ch is i riyour pUblic library. Somebody inyour coltll1uni ty suggests the bookshould be removed from the library.Would you favor'removing the book,oppose removing the book, or do younot' have an opi ni on on tha t? II
Favor removingOppose removing'No opinion
IIS ome people are afraid the government'in Washington is getting toopowerful for the good of the countryand the individual person~ Othersfeel that the government in Washing-,ton is not getti rig too strong. Haveyou beeni nterested enough in'! thisto favor one side over the{ other?
'(If yes r Wha t is your fee1;,ng ,do, you think the government is getting'too powerful or do you ttii nk the '
government is not getting toostrong?1IToo powerfulNot too strongNot ,interested enough
29.1%67.9%3.0%
(N=5$3)
Too powerfu1Not too strongDon't know (volunteered)
55.0%35.1%10 .,0%
(N'=613 J
3. Communist Book (SRC-77 February)IIThis next question is about J manwho admi ts he is a coinniuni st. Suppose he wrote a book which is inyour pUblic library. Somebody inyour community suggests the bookshould be removed from the library.Would you favor removing the bookor 'oppose removing the book?1I
Favor removi ngOppose removing :Don't know (va1un tee,red )
110
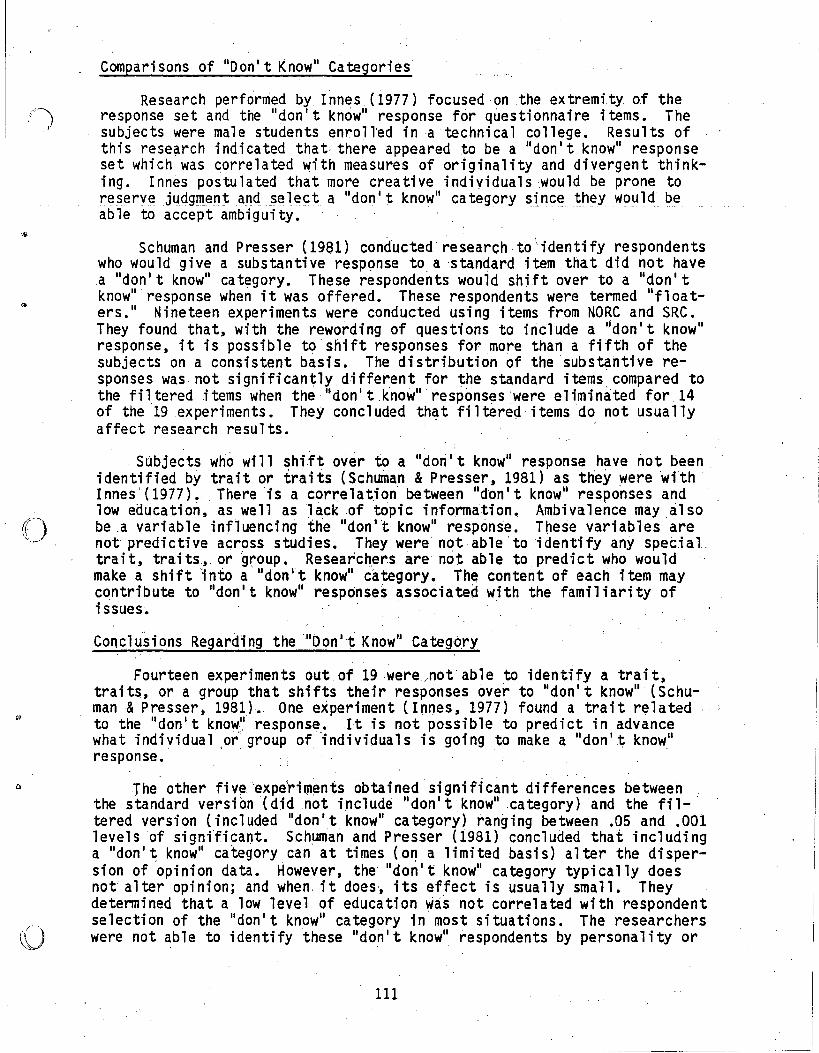
/'J)
'.1/
()
Concl u'si ons Regarding the"Donlt Know" Category
Fourteen experiments out of 19 .were/not able to identify a trait,traits, or a group that shifts their responses over to "don't know" (Schuman & Presser, 1981) •. One experiment (Innes, 1977) found a trait relatedto the "don ' t know·.' response. It is not possible to predict in advancewhat individual ,or'. group of 'individuals is going to make a "don l t knowuresponse.
uThe other five 'experim~nts obtained significant differences betweenthe standard version (d1d not include "don'tknow" category) and the fil-'tered version (included "don 1 t know ll category) ranging between .05 and .001levels of significant•. Schuman and Presser (i981) concluded that includinga "don't know" category can' at times (or'! a limited basis) alter the dispersion of opinion data. However, the IIdon't knowll category typically doesnot alter opinion; and when. it does·, its effect is usually small. Theydetermined that a low level of education was not correlated with respondentselection of the IIdon't know" category in most situations. The researchers
~O were not able to identify these "don't know" respondents by personality or
111
social characteristics. It appears as though the content of the surveyitem may influence the selection of a lidoi'll t know" response for items .dealing with obscure issues. For this type of item, there" isa correlation'with respondents identified as having a low level of education (0 to 11years of school). "
Apparently, knowledge of the "don't know" response set does not signifi cantly i nfl uence the response di stributi ons when the IIdon' t know" responsesareeliminated from the questionnaire (in most cases). The actualcontent of the item may be determining the likelihood of a "don't know"reSponse for items which have unfamiliar content to the respondents. Thereappears to be no special set of individuals who wi.ll shift (when given theopportunity) over to a "don l t know" response. There is a relationship be~
tween 1ow education and se1ecti on of the "don It know" response for obscureissues. The same holds true for individuals with a, weak opinion on a topicor a lack of information about a topic •
. !"
112
,..
."
(i<
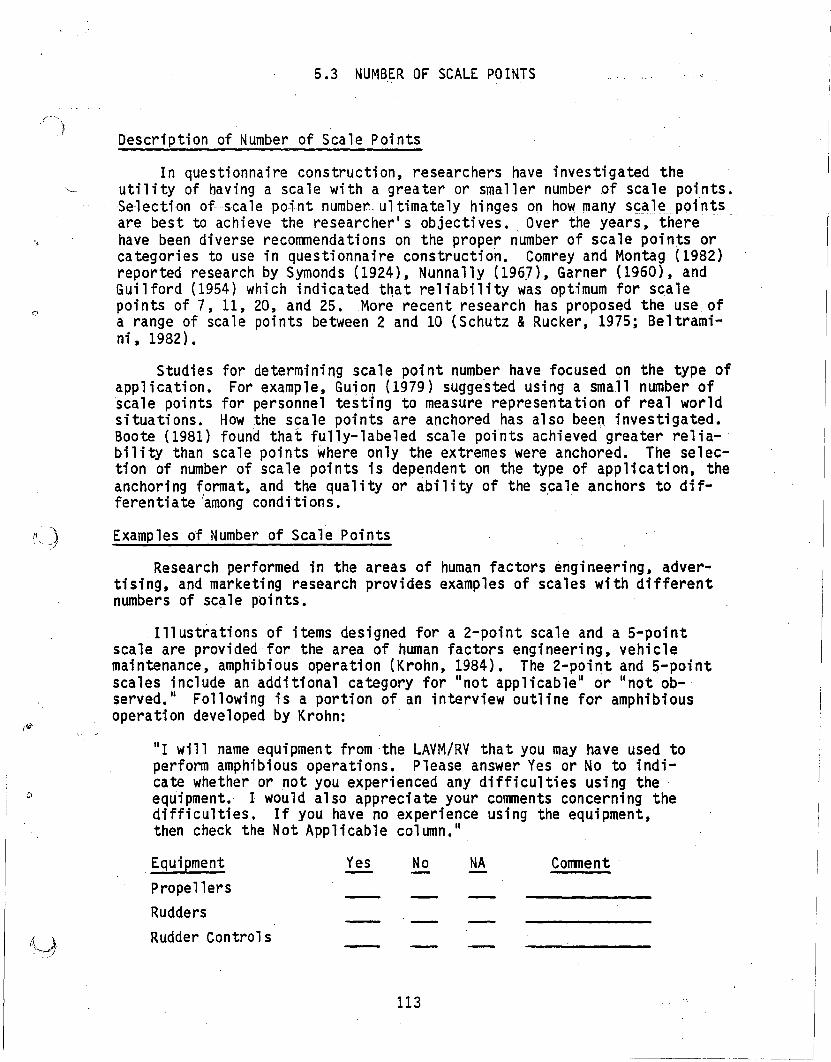
5.3 NUMBER OF SCALE POINTS
Description of Number of Scale Points
In questionnaire construction, researchers have investigated theutility of having a scale with a greater or smaller number of scale points.Selection of scale point number ultimately hinges on how many sc:ale pointsare best to achieve the researcher's objectives. Over the years, therehave been diverse recorrmendations on the proper number of scale points orcategories to use in questionnaire construction. Comrey and Montag (1982)reported research by Symonds (1924), Nunnally (1967), Garner (1960), andGuilford (1954) which indicated tnat reliability was optimum for scalepoints of 7, 11, 20, and 25. More recent research has proposed the use ofa range of scale points between 2 and 10 (Schutz &Rucker, 1975; Beltramini, 1982).
Studies for determining scale point number have focused on the type ofapplication. For example, Guio~ (1979) suggested using a small number of'scale points for personnel testing to measure representation of real worldsituations. How the scale points are anchored has also been investigated.Boote (1981) found that fUlly-labeled scale points achieved greater reliability than scale points where only the extremes were anchored. The selection of number of scale points is dependent on the type of application, theanchoring fprmat, and the quality or ability of the scale anchors to differentiate among conditions.
!\} Examples of Number of Scale Points
i)
Research performed in the areas of human factors engineering, advertising, and marketing research provides examples of scales with differentnumbers of sc~le points.
Illustrations of items designed for a 2-point scale and a 5-pointscale are provided for the area of human factors engineering, vehiclemaintenance, amphibious operation (Krohn, 1984). The 2-point and 5-pointscales include an additional category for II not applicable" or II not observed." Following is a portion of an interview outline for amphibiousoperation developed by Krohn:
III will name equipment from -the LAVM/RV that you may have used toperform amphibious operations. Please answer Yes or No to indicate whether or not you experienced any difficulties using theequipment. 1 would also appreciate your corrments concerning thedifficulties. If you have no experience using the equipment,then check the Not App 1i cab1e col urnn. II
EquipmentPrope llersRuddersRudder Control s
Yes No
113
NA Comment
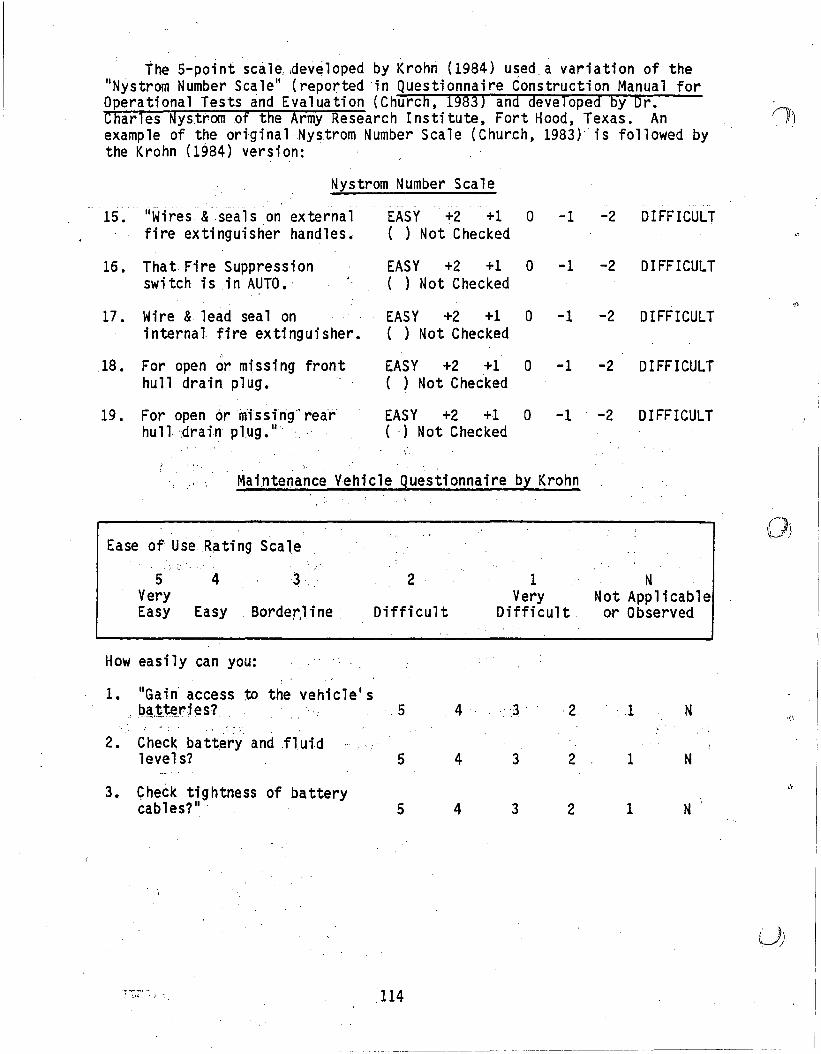
The 5-po1nt scale",developed by Krohn (1984) used,a variation of the"Nystrom Number Scale" (reported in Questionnaire Construction Manual forOperational Tests and Evaluation (Church, 1983) and developed by Dr.Charles Nystrom of the Army Research Institute, Fort Hood, Texas. Anexample of the ori'ginalNystrom Number Scale (Church, 1983)'is followed bythe Krohn (1984) version: '
Ease of Use Rating Scale()\
5 4VeryEasy Easy
3'
Border,l i ne
2
Difficult
. 1Very
Difficult,
NNot Applicableor Observed
How easily can you:
1. "Gain access to the vehicle's.bg.~,~r:ies? " " 5
2. Check battery and .fluidlevel s1 5
3. Gheck tightness of batterycables?" 5
4
4
4
,3 '
3
3
2
2
1
1
1
N
N
N'
. ~.', .;": 114
------ -_."._._... - ------------~-------~~~~._-----
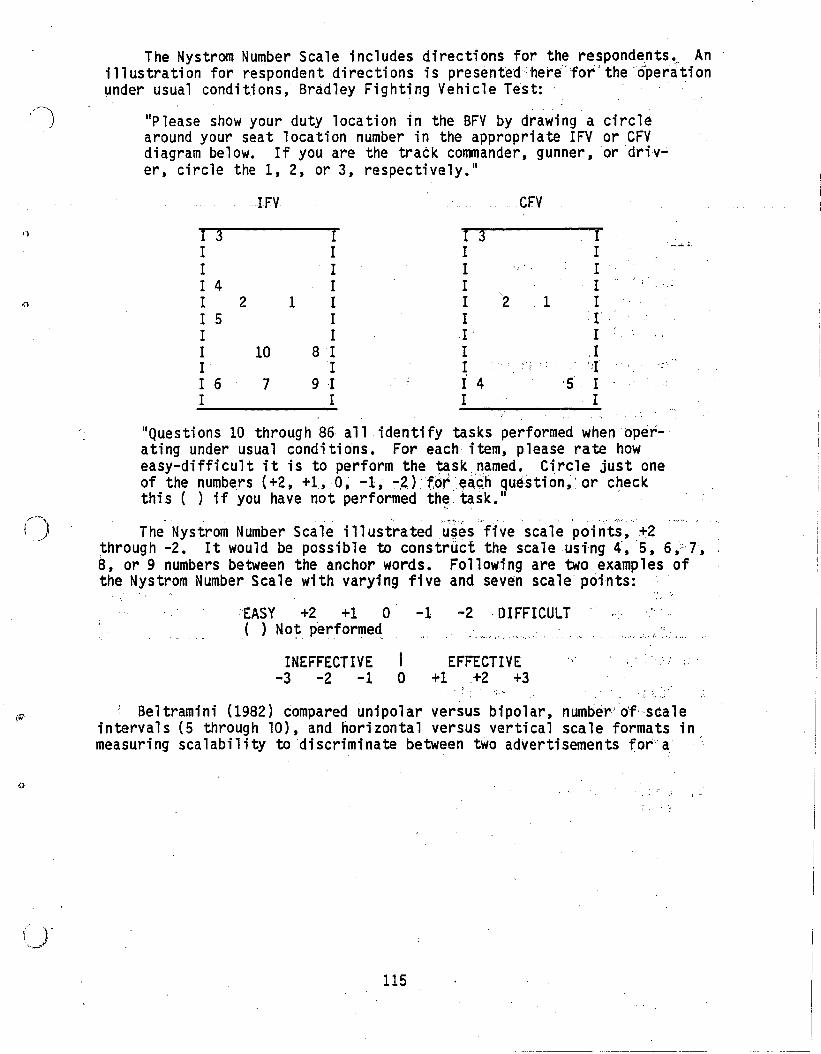
The Nystrom Number Scale includes directions for the responde.nts._, Anillustration for respondent directions is presented·'here·:for'the6"perationunder usual conditions, Bradley Fighting Vehicle Test: .
IIPlease show your duty location 1n the BFV by drawing a circlearound your seat location number in the appropriate IFV or CFVdiagram below. If you are the track cOl1l1lander, gunner, 'or driv..;.er, circle the 1, 2, or 3, respectively.1I
IFV CFV
I 3 I I,) I 3I I I I
..... ..J.. ••
I I I II 4 I I I ,
"2 II 2 1 I I 1I 5 I I rI I I II 10 8 I I ,II I I i '1I 6 7 9 I I 4 '5 II I I I
IIQuestions 10 through 86· all identify tasks performed whenoper...ating under usual conditions. For each item, please rate howeasy-difficult it is to perform the ~sknamed. Circle just oneof the numbers (+2, +1,0~ -1, -2).fd~~~~~h qu~~tion,'or checkthis ( ) if you have not performed th~task.1I .
• • :'-''-''-':··r. ',,- •
The Nystrom Number Scale illustrated ui;es five scale points, +2through -2. It would be possible to construct the scale using 4',5, 6,'T,8, or 9 numbers between the anchor words. Following are two examples ofthe Nystrom Number Scale with varying five and seven scale points:
EASY +2 +1 0 -1 -2 ·DIFFICULT( ) No~ performed
INEFFECTIVE I EFFECTIVE-3 -2 -1 0 +1 .+2 +3
... '.. ' .... ,.. ,".
'.' -. ..
'." ; . , .~ , .~
" ':. ,,:
.'., )..!(
'-
: Beltramini (1982) compared unipolar versus bipolar, number·'·o'f···scaleintervals (5 through 10), and horizontal versus vertical scale formats inmeasuring scalability to discriminate between two advertisements for a
115
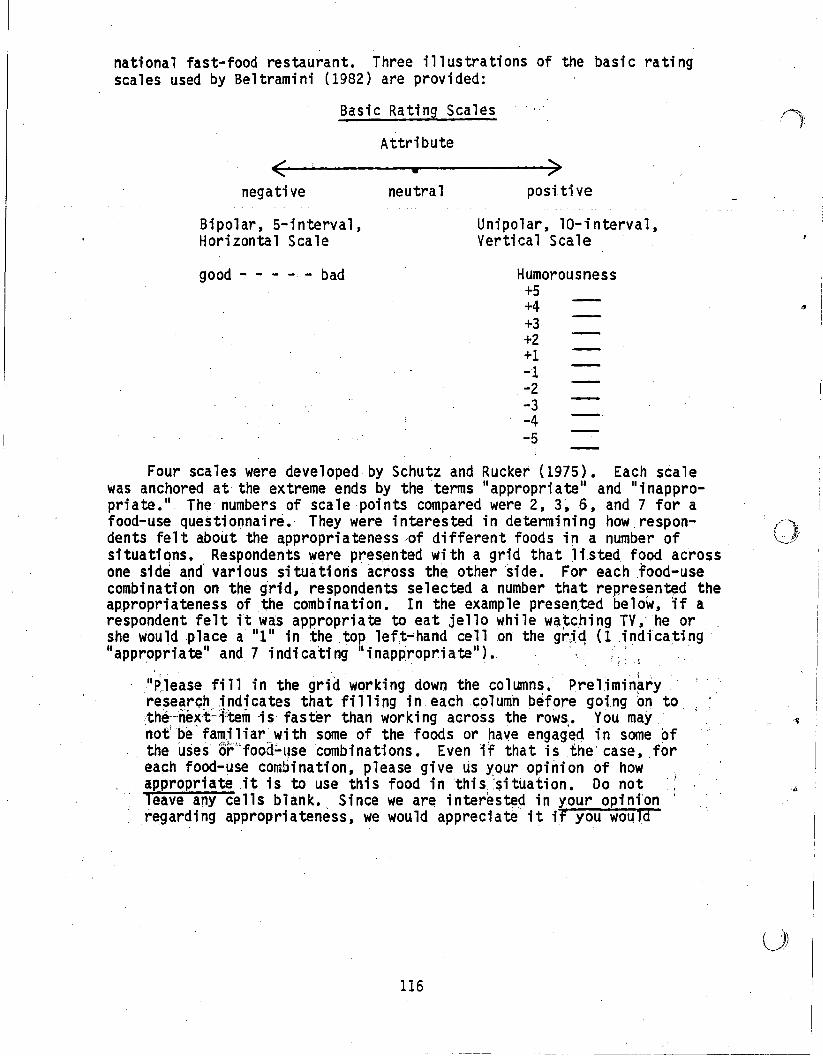
national fast-food restaurant. Three illustrations of the basic ratingscales used by Beltramini (1982) are provided:
<negative
Basic Rating Scales
Attri bute
•neutral
>posi.ti ve
Bipolar, S-interva1,Horizontal Scale
good - - - - - bad
Unipolar, 10-; nterva1,Vertical Scale
Humorousness+5+4+3+2+1-1-2-3-4-S
Four scales were developed by Schutz and Rucker (1975). Each scalewas anchored at the extreme ends by the terms II appropri ate ll and II i nappropri ate. II The numbers of sca1e poi nts compared were 2, 3, 6, and 7 for afood-use questionnaire. They were interested in determining howrespondents felt about the appropriatenessJof different foods in a number ofsi tuations •. Respondents were presented wi th a grid that 1isted food acrossone side and various situatioris across the other ·side. For each food-usecombination on the grid, respondents selected a number that represented theappropriateness of the combination. In the example presen,ted below, if arespondent felt it was appropriate to eat jello while wa:tching TV,. he orshe would .place a "1 11 in the top lef,t-hand cell .on the grJet (l.indica;ting"appr,opriate" and 7 indicating uinappropriate"). .' ';: ~ .
"Please fill in the grid working down the colwnns. Preliminaryresear~h .indicates that filling in each column before going on tothe-nex-f-+'temis-faster than working across the rows. You maynot'be"familiar with some of the foods or have engag'ed in some of
"the uses or'·'food;:'l,se·combinations. Even if that is the case,.foreach food-use combination, please give us your opinion of howappropriatei~ is to use this food in this:sitiJ.ation. Do not .;leave any cells blank. Since we are interested in your opini'on I
regarding appropriateness, we would appreciate it if you wo~ld
116
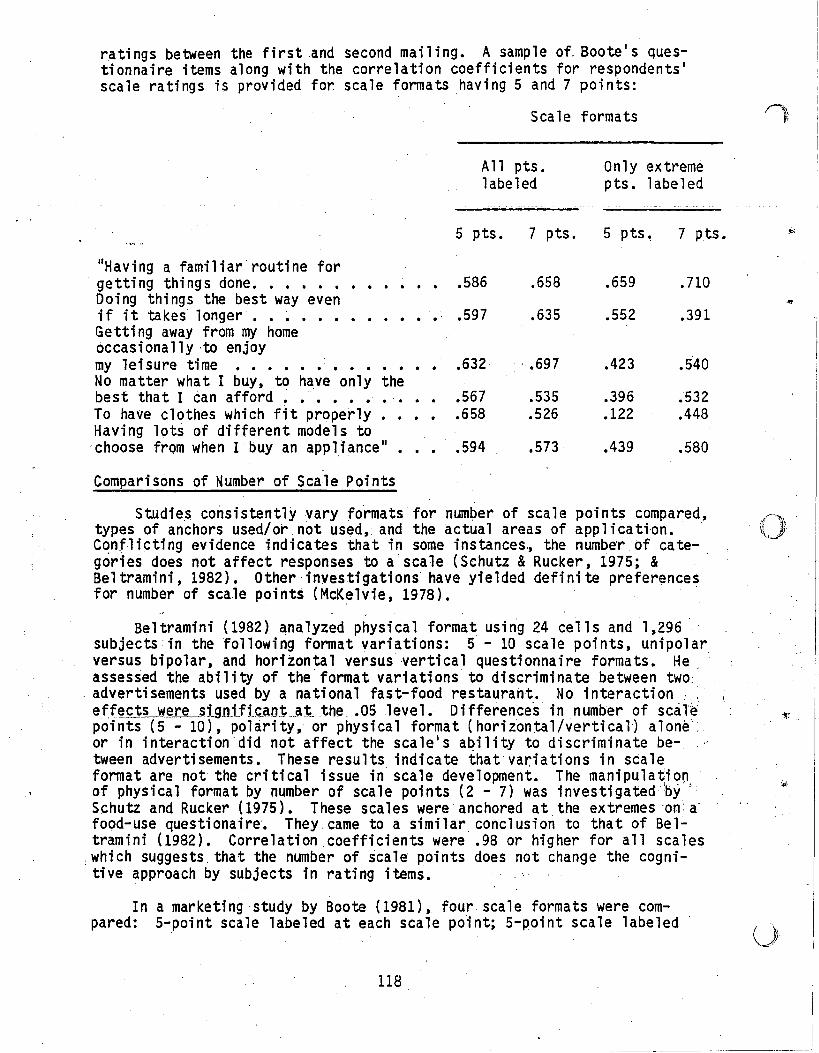
ratings between the first and second mailing. A sample of. Boote's questionnaire items along with the correlation coefficients for respondents'scale ratings is provided for scale fonnats having 5 and 7 points:
Scale formats
. ,
All pts.labeled
5 pts. 7 pts.
Only extremepts. labeled
5 pts ~ 7 pts.
"Having a familiar routine forgetting things done••••..Doing things the best way evenif it takes longer .•••Getting away from my homeoccasionally -to enjoymy leisure time •••••••••No matter what I buy, to have only thebest that I ~an afford • •. • . •• •To have clothes which fit properly .Having lots of different models to
'choose from when I buy an appl1ance" •
. .
.586
.597
.632,
.567
.658
.594
.658
.635
, .697
.535
.526
.573
.659
.552
.423
.396
.122
.439
.710
.391
.540
.532
.448
.580
~, ..
,.'
Comparisons of Number of Scale Points
Studies consistently vary formats for num~er of scale points compared, '(~J"\'types of anchors used/or, not used, and the actual areas of app 1i cation.' xt'Conflicting evidence indicates that in some instances" the numbe'r ofcate-gories does not affect responses to a scale (Schutz &Rucker, 1975; & 'Be1tramini, 1982). Other' investi gati ons' have yielded defi ni te preferencesfor number of scale points (McKelvie, 1978).
Beltramini (1982) analyzed physical format using 24 cells and 1,296subjects 'in the following fonnat variations: 5 - 10 scale points, unipolarversus bipolar, and horitontal versus vertical questionnaire formats. Heassessed the ability of the'fonnat variations to discriminate between two:
, advertisements used by a national fast-food restaurant. No interaction, ,effEg:ts were __slgnlficant, at_ ,the .05 level. Differences in number of scalepoints (5 - 10), polarity, or physical format (horizontal/vertical) alone-,or in interaction'did not affect the scale's ability to discriminate be-tween advertisements. These results indicate that variations in scalefonnat are not the critical issue in scale development. The manipulation'of physical format by number of scale points (2 - 7) was investigatedhy ,Schutz and Rucker (1975). These scales were anchored at the extremes 'on a-food-use questionaire. They came to a similar conclusion to that of Bel-tramini (1982). Correlation coefficients were .98 or higher for all scaleswhich suggests that the number of scale points does not change the cognitive approach by subjects in rating items.
I n a marketi ng study by Boote (1981), four sca1e formats were compared: 5-point scale labeled at each scale point; 5-point scale labeled
118
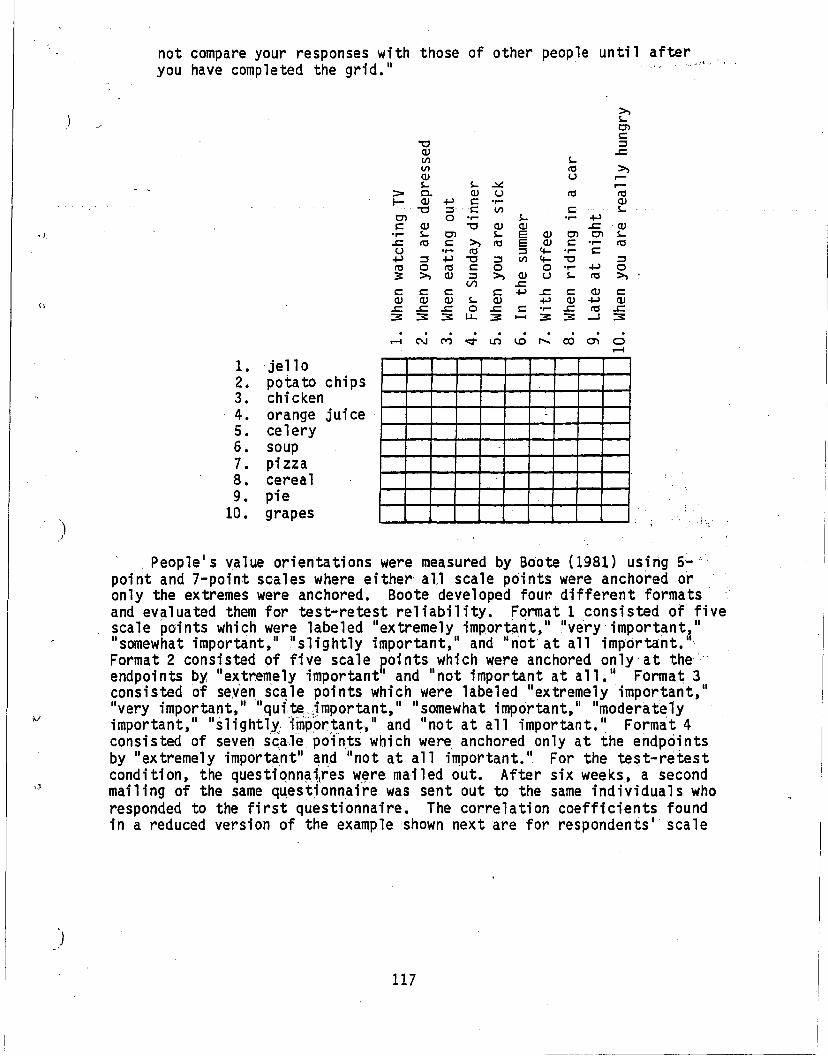
.:>
not compare your responses with those of other people unti 1 afterhave completed the grid. II .• ,".'ii. "
you
>..,~C'le:
"'0 ::::lQ) ..s::Vl ~Vl ro >..,Q) u ....-~ ~ ..::.:: ....-
:::- 0- Q) U ro roI- Q) ol-l e: ..... Q)
"'0 ::::l e: Vl e: ~
C'l 0 ..... ~ ..... -4-Je: Q) "'0 Q) Q) ..s:: Q)..... ~ C'l ~ E Q) C'l C'l ~
..s:: ro e: >.., ro E Q) e: ..... rou ..... ro ::::l 4- ..... e:
ol-l ::::l ol-l "'0 ::::l Vl 4- "'0 ::::lro 0 ro e: 0 0 ..... -4-J 03 >.., Q) ::::l >.., Q) u ~ ro >..,
(/) ..s::e: e: e: e: ol-l ..c e: QJ e:Q) Q) Q) ~ Q) ol-l OJ -4-J Q)
..c ..s:: ..s:: 0 ..s:: e: ..... ..c ttl ..s:::3 :3 :3 L.L. :3 ..... :3 :3 -l :3. . . . . . . . . ....-l N ("I') oc::r LO 1.0 "" co '" 0
...-l
1. jello2. potato chips3. chi cken4. orange juice5. celery6. soup7. pi zza8. cereal9. pie
10. grapes
, Peop le I s v,a1ue ori enta ti ons were measured by Boote (1981) us i rig 5'- ",point and 7-point scales where either all scale pdints were ancho~ed o~only the extremes were anchored. Boote developed four. different formats'and evaluated them for test-retest reliability. Format 1 consisted of fivescale points which were labeled "ex tremely important," livery important,""somewhat important," "slightly important," and "n'ot, at all important. II,
Format 2 consisted of five scale p'0ints which were anchoredonly'at theendpoints by, "ex,tremely important' and "not important at all." Format 3consi sted of se,ven. sc~ le poi nts whi ch were labeled "ex tremely important, II
livery important, II " qu ite,jmportant, II II somewhat important, II " modera te lyimportant," "slightly,lmp:or.tant," and "no t at all important." Format 4consisted of seven sc'a,le, poin.ts which were anchored only at the endpointsby "ex tremely important" ~nd "no t at all im.portant." For the test-retestcondition, the questiqnn~~tes w~,re mailed out. After six weeks, a secondmailing of the same questionnaire was sent out to the same individuals whoresponded to the first questionnaire. The correlation coefficients foundin a reduced version of the example shown next are for respondents' scale
117
,""
u
only at the endpoints; 7-point scale labeled at each scale point; and7-point scale labeled only at the endpoints. Boote examined differences inreliability attributed to differences in anchoring scale points and numberof scale points. It was determined that scales fully labeled yielded lessskewed response distributions than scales labeled only at the endpoints.Five-point scales were superior to 7-point scales for these particularmarketing studies.
McKelvie (1978) concurred with Boote in that a recommendation was madefor the use of five or six scale points, but no greater or lesser numberthan five Qr six. It was felt that a greater number of scale points wouldhave ho psychometric advantage, and that a smaller number of scale pointswould threaten the discriminative power and validity of the instrument.McKelvie's research was conducted using instruments measuring opinions aswell as psychophysical stimuli (tones).,
Boote (1981) and Mckelvie (1978) have divergent recommendations whenit comes to labeling the scale points. Boote's findings indicated that itwas best to label each scale point, and McKelvie's findings indicated thatit made little difference 'regarding the reliability and validity of aninstrument whether verbal labels were used. Their samples were composed ofdifferent popUlations (students versus respondents from households). Theapplications were quite divergent (marketing psychographic segmentation,pUblic opinion, and psychophysical measurements).
Simulation of test scores by Lissitz and Green (1975) using a multivariate normal generator with different numbers of scale points (2, 3, 5,7,9, and 14) resulted in increases in the standard deviation as covariencedecreased, and decreases in the standard deviation as the number of scalepoints increased. They found a leveling off in the increase of reliabilityafter five scale points. They reject 7-point scales as an optimum numberand support the use of 5-point scales.
In the comparison of personality item formats for a 2-choice or 7choice response format, Comrey and Montag (1982) concluded that the 7choice response (7 scale points) allowed for finer discriminations bysubjects using a persona1it¥ inventory. In this study, five scale pointswere not included as one of the format variations.
In selecting the number of scale points to use in a study, the selection will depend on the area of application. There is a trend toward theuse of 5-point scales. Five-point scales were recommended for the development of tests (Lissitz &Gre~n, 1975), marketing surveys (Boote, 1981),and measuring psychophysical stimuli (McKelvie, 1978).
Conclusions 'Regarding Number 'of 'Scale P?ints
The number of scale points selected will depend on the researchdesign, the area of application, and the types of anchors used. However,the developmental procedures used in the design of items probably has moreweight than the physical format which would be represented by the number ofscale items and ~pes of anchors (Be1tramini, 1982; Schutz &Rucker, 1975).
119
There· is some' psychometric support for the selection of five, scalepoirl'ts'''as'':;an optimum number across areas of application (Boote, 1981;McKe~h/ie;;r 1978; Lissitz & Green, 1975). Even so, because of conflictingeViCiend~!'fromstudies recoTlll1ending seven scale points, (Cornrey & Montag,1982,)j; a 'range of five or six scale points (McKelvie, 1978), or greaterrange's of scale points (all the way from 2 through 10) (Schutz & Rucker,1975; Beltramini, 1982), it is not possible to recommend with certainty aspecific number of scale points. There is flexibility within the selectionprocess.
There is no conclusive evidence to support which is the best way toanchor the scales once the number of scale points has been identified•._McKelvie (1978) found no significant effect for anchoring, but Boote (1981)found that fully-labeled scale points achieved higher reliablity thananchoring only the extreme endpoints of a scale. As with the number ofscale points, there is flexibility in selecting the scale anchors sinceresearch trends have not been able to identify optimal response alternatives. There has peen a shift in research so that a greater emphasis hasbeen placed on developmental procedures for items land anchors, training ofraters, and cognitive approaches to rating by subjects.
120
)
)
'''';'
)
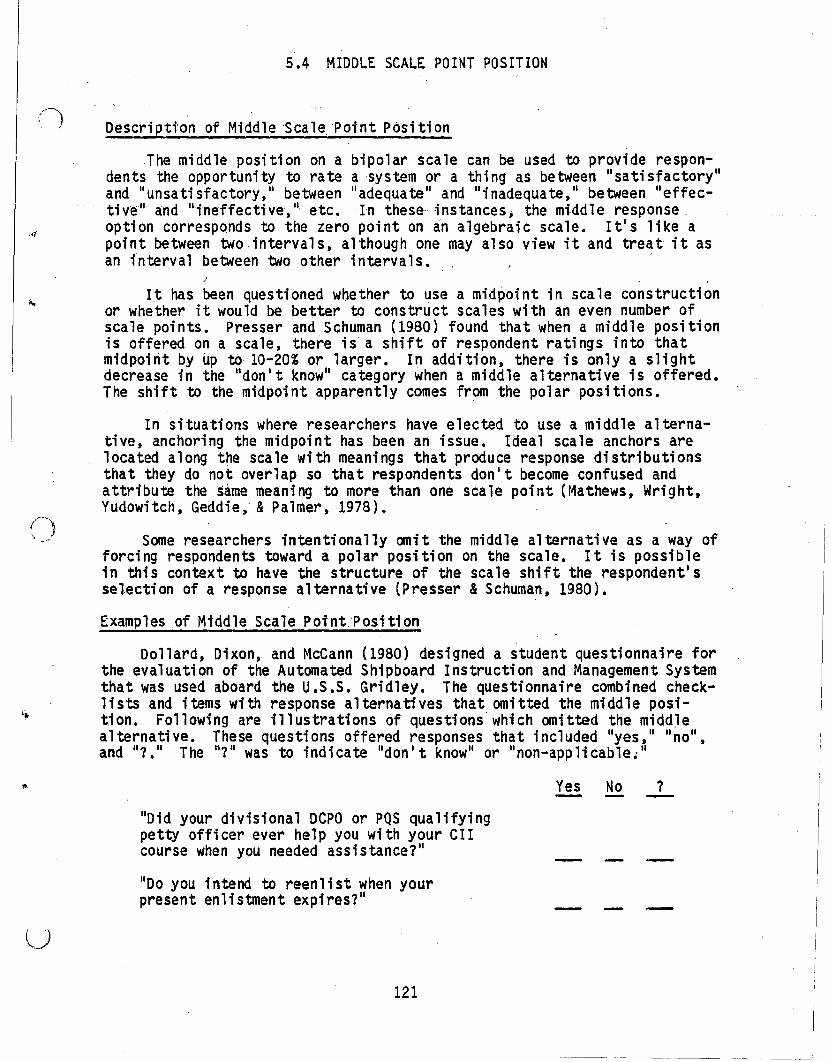
I~
5.4 MIDDLE SCALE POINT POSITION
Description of Middle 'Scale'Point POsition
The middle position on a bipolar scale can be used to provide respondents the opportunity to rate a system or a thing as between II sa tisfactori'and "unsa tisfactorY,1I between "adequate ll and lIinadequate," between lI effective ll and lIineffective, II etc. In these instances, the middler-esponseoption corresponds to the zero point on an algebraic scale. It1s like apoint between two intervals, although one may also view it and treat it asan interval between two other i nterva1s •
.J
It has been questioned whether to use a midpoint in scale constructionor whether it would be better to construct scales with an even number ofscale points. Presser and Schuman (1980) found that when a middle positionis offered on a scale, there is a s~ift of respondent ratings into thatmidpoint by iJp to 10-20% or larger. In addition, there is only a slightdecrease in the IIdon l t know ll category when a middle alternative is offered.The shift to the midpoint apparently comes from the polar positions.
In situations where researchers have elected to use a middle alternative, anchoring the midpoint has been an issue. Ideal scale anchors arelocated along the scale with meanings that produce response distributionsthat they do not overlap so that respondents don I t become confused andattribute the same meaning to more than one scale point (Mathews, Wright,YUdowitch,Geddie,' &Palmer, 1978).
(-)\ __." Some researchers intenti ona lly anit the middle al ternati ve as a way of
forcing respondents toward a polar position on the scale. It is possiblein this context to have the structure of the scale shift the respondent1sselection of a response alternative (Presser & Schuman, 1980).
Examples of Middle ScalePoint.Posttion
Dollard, Dixon, and McCann (1980) designed a student questionnaire forthe evaluation of the Automated Shipboard Instruction and Management Systemthat was used aboard the U.S.S. Gridley. The questionnaire combined checklists and items with response alternatives that omitted the middle position. Following are illustrations of questions' which omitted the middlealternative. These questions offered responses that included lIyes ,1I II noll ,and 117. 11 The 117 11 was to indicate IIdon l t know ll or IInon-applicable.1I
1>.
IIDid your divisional DCPO or PQS qualifyingpett¥ officer ever help you with your CIIcourse when you needed assi stance?1I
liDo you intend to reenli st when yourpresent enl istment expi res?1I
Yes No ?
121
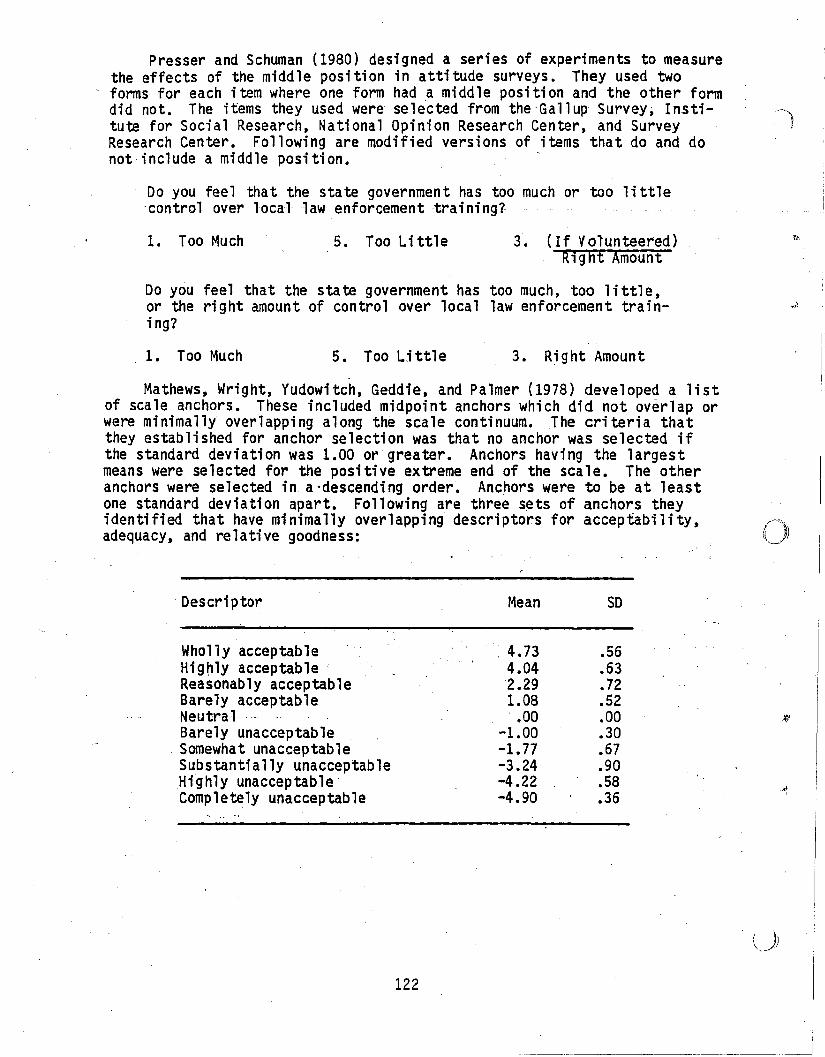
Presser and Schuman (1980) designed a series of experiments to measurethe effects of the middle position in attitude surveys. They used twoforms for each item where one form had a middle position and the other formdid not. The items they used were selected from the Gallup Survey; Institute for Social Research, National Opinion Research Center, and SurveyResearch Center. Following are modified versions of items that do and donot-include a middle position. '
Do you feel that the state government has too much or too littlecontrol- over local law enforcement training?
-~
5. Too Li ttle1. Too Much 3. (If Volunteered)Right Amount
Do you feel that the state government has too much, too little,or the right amount of control over local law enforcement training?
1. Too Much 3. Right Amount
Mathews, Wright, Yudowitch, Geddie, and Palmer (1978) developed a listof scale anchors. These included midpoint anchors which did not overlap orwere minimally overlapping along the scale continuum. The criteria thatthey established for anchor selection was that no anchor was selected ifthe standard deviation was 1.00 or greater. Anchors having the largestmeans were selected for the positive extreme end of the scale. The otheranchors were selected in a-descending order. Anchors were to be at leastone standard deviation apart. Following are three sets of anchors theyidentified that have minimally overlapping descriptors for acceptability, -adequacy, and relative goodness: (~)
.- Descriptor Mean SO
Wholly acceptable . 4.73 .56Hignly acceptable' 4.04 .63Reasonably acceptable 2.29 .72Barely acceptable 1.08 .52Neutra-l- -- .00 .00 !l)1
Barely unacceptable -1.00 .30Somewhat unacceptable -1.77 .67Substantially unacceptable -3.24 .90Highly unacceptable- -4.22 .58 A(Completely unacceptable -4.90 .36
(I)\J
122
i
I
,
I,---_...------------
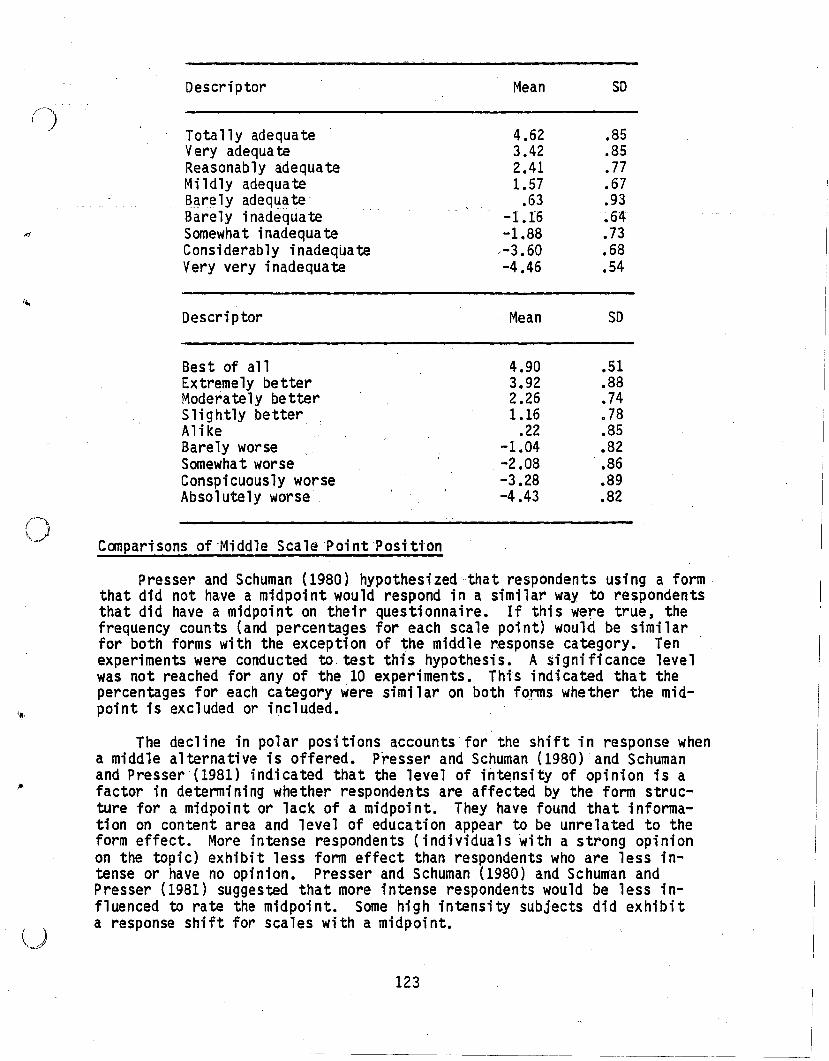
Presser and Schuman (1980) hypothesi zed'that respondents using a formthat did not have a midpoint would respond in a similar way to respondentsthat did have a midpoint on their questionnaire. If this were true, thefrequency counts (and percentages for each scale poi nt) would be simi larfor both forms with the exception of the middle response category. Tenexperiments were conducted to test this hypothesis. A significance levelwas not reached for any of the 10 experiments. This indicated that thepercentages for each category were similar on both forms whether the mid-point is excluded or included. -
The decline in polar positions accounts for the shift in response whena middle alternative is offered. Presser and Schuman (1980) and Schumanand Presser (1981) indicated that the level of intensity of opinion is afactor in determining whether respondents are affected by the form structure for a midpoint or lack of a midpoint. They have found that information on content area and level of education appear to be unrelated to theform effect. More intense respondents (individuals with a strong opinionon the topic) exhibit less form effect than respondents who are less intense or have no opinion. Presser and Schuman (1980) and Schuman andPresser (1981) suggested that more intense respondents would be less influenced to rate the midpoint. Some high intensity subjects did exhibita response shift for scales with a midpoint.
123
-----_~- ----------
Presser and Schuman (1980) and Schuman and Presser (1981) noted thatmiddle alternative anchors are generally used for surveys. They recommended that examination of anchors for, the middle alternative would beuseful in conceptually defining populations. This type of research wasperformed by Gividen(1973) and Mathews, Wright, Yudowitch. Geddie, andPalmer (1978). Their subjects were Army officers and enlisted men.Mathews, et ale investigated verbal anchors for sCqle value on a bipolarscale of favorableness (from positive to negative). (See identified descri ptors for acceptabi 1i ty, adequacy, and re 1ati ve goodness for verbalanchors provi dedasexamples in' thi s section.)
Research results for scale midpoints were obtained with means andstandard deviations at zero for the three lists of scale anchors developedthat had a midpoint termed "neu tral. 1I Mathews, Wright, Yudowitch~ Geddie,and Palmer (1978) cited previous research by Gividen (1973) where Army testofficers were not totally clear regarding the meaning of the term "neu tral ll
as a midpoint anchor. Some respondents thought it meant indifferent,having·no opinion. There were respondents who thought it meant the valuein the middle of the scale. Others were aware that it could mean eitherand didn't know which meaning was intended. Because of the ambiguity ,surroundi ng thi s term. Gividen reconmended the term IIborderl i nell as amidpoint anchor. The term "borderline ll was coined by Dr. Charles Nystromof the Army Research Institute, Fort Hood, Texas.
The design of rigorous scales .requires examination of the item variabilit¥ for verbal anchors since there can be large variances among subjects in their assignment bf values to anchors. Scale values obtained byMathews, Wright, YUdowitch, Geddie, and Palmer (1978) cannot be directlygeneralized over to other questionnaires. .
Conclusions RegardtngMtddle'Scale Point'Position
Researchers are simultaneously confronted with two issues in the construction of que~tfonnafres as it relates to the scale midpoint. The firstissue i~ whether they wish to include a midpoint in th~jr scale. Thesecond iss4e is. if they do, then how should the midpofnt be anchor~,d?
Investigat10ns in the area have not been abundant al tho,ugh previous re-search does provi,de some gu; de1i ne~s • "
It has beeh conmon'pra'ctice i'n the'con§truction of questionnaires toelimina-te-·th-e-m·i-ddle-·a-lternative in an effort 'to force respondents towardone or the other poles on a bipol~r scaler. In these situations, there isthe possibilit¥ that the. Jormat may, be assisting in structuring the respon~dent's de.cisi.on-making.' This may'be'especially true for attitude questionnaires when respondents have weak opinions, or have no opinion regardingthe content of the question.
Presser and Schuman (1980) found that response distributions thatinclude the middle response alternative look about the same as the distributions without the middle response alternative. The decision'regardingthe inclusion or exclusion of the middle category in the de.sign of a scaleshould depend on the t¥pe of information the researcher is interested inretrieving from the SUbjects. When the researcher seeks a highly refined/precise description of the response distribution, the inclusion of a middle
124
(.'~)""~\. :" .'
.'
',<I
alternative would be useful. Of course, use of additional polar ca'tegorieswould also support this objective. It may be better to exclude the middlealternative when subjects have a weak opinion on the topic and/or it is of
(') importance to elicit the direction of the opinion! attitude. Forcing respondents toward one of the poles may be viewed as a trade~off. Thoserespondents with weak opinions tend to select the middle alternative in1arge proporti ons. When the mi dd le a1terna ti ve is de leted from the response alternatives, they are forced toward a polar position. Some respondentsmay indicate that they were not allowed to accurately state theiropinion.
As to the identification and selection of the midpoint anchor, it isnot unrelated to the other anchors used on the scale. It is not possibleto identify a midpoint anchor without also determining the content and formof the other scale anchors as well. In the research performed by Gividen(1973) and Mathews, Wright, Yudowitch, Geddie, and Palmer (1973), theyidentified the midpoint anchors "borderline" and "neutral. \I Mathews, et I
al. indicated the Rreference for the usage of "borderline" based on resultsobtained by Gividen.
"
Different populations are going to have different means and variancesin their attitudes toward various scale anchors whether they be midpointsor located at the extreme ends of the scales. Recent studies have indi~
cated that a sound scale is predicated on the developmental procedures usedin the construction of the items more than on the format or type of anchorused. '
125
',a:
'i!.I
CHAPTER VI
INTERVIEWER AND RESPONDENT CHARACTERISTICS
The effect of the interviewer on respondent ratings is examined inthis chapter. The impact of demographic characteristics on response distributions is, also reviewed. It has not proven feasible to identify anyone questionnaire format over another. There have been suggestions byquestionnaire construction experts that other characteristics related tothe respondent may be more potent and reliable in the design of questionnaires. Investigators have been trying to, enhance the psychometric qualityof ratings by adapting the rating format to the cognitive' structure of therespondent. This approach takes into account the respondent compatibilitywi th the demands of the rati ng format. Thi s form of questionnaire construction has been termed cognitive complexity when applied to behavioralscales.
Foun demographic characteristics are broken out into individual sections (education, ethnic background, age, and gender) in Chapter VI. It iscommon knowledge that these variables frequently interact with each otherin empirical investigations. There ,is some evidence that response patternsare influenced by the education of respondents for high levels of educationand for low levels of ,education. High educational level has been definedas completing at least some college. Low educational level has been de- ,fined as not completing high school. The research indicates that individuals with a low educational level may be the most influenced by item wordingor survey format. Individuals with a low level of education may also beprone to survey nonresponse when education is interrelated with othervariables. '
Ethnic background of respondents has been 'examined for its effect onrating patterns. For surveys which use interviewers, the influence of theethnic background of the interviewer has been investigated. This researchtends to indicate that nonracial items appear'to be immune to interviewereffects fO,r ethnicity. Performance ratings have also supported thesefindings where no significant differences were found between black andwhite raters. There have been exceptions to this finding in the area ofself-assessment.
. ' .
Item rating is sometimes influenced by age, education, and itemcontent. This may be a phenomenon of opinion questionnaires. Theseq~estionnaires could.easily elicit different responses, depending on theperceptions of different age and gender groups. W~en item responses areinfluenced by the age of the respondent, it most often relates to itemnonresponse or survey nonresponse by older subjects. As with other demographic characteristics, age,and education usually interact with otherdemographic characteristics.
127
\ ..~
i (~)
, "-......
6.1 INTERVIEWING
Description of Interviewing
The conduct of a survey through interviews is sometimes made in preferenceto a mail surveyor to a paper/pencil questionnaire administration.There are several situations which would support the choice of interviews.For example, 1tis well known that telephone interv;ewsandface-to-faceinterviews have a higher response rate than mail surveys (Orlich, 1978;Shosteck &Fairweather, 1979). In situations where a high survey responserate is critical, the interview would be a primary,'vehicle for achievingthat purpose. When survey results are required within a short period oftime, it is possible to use telephone interviews. The Air Force has beenknown to use telephone surveys where the results were reported within 48hours (Chun, Fields, &Friedman, 1975). Air Force personnel have also usedinterviews for survey data collection. Pilots served as interviewers forrespondents who were test pi lots. Thi s approach was suggested to reduceerror.' It was thought that the questionnaire might not fully reflect thepilot1s experience or opinion. The interviewer would be able to probe thetest pilots to determine the in-depth meaning of th~ir responses (Church,1983).
One of the drawbacks to the use of interviews has been the increasedcost compared to surveys that do "not require interviewers (Orlich, 1978).There is the cost of' training the interviewers'; the 'cost of sending theinterviewer;·to the face-to~·face interview site, and the time involved for.each interview.Shosteck and Fairweather (1979) compared the cost of mailsurveys with that of· surveys using face-to-face interviews. Mail surveys
. were $24 per respondent, an9 interviews were $63 per respondent (thesefigures do not include administrative costs).
Researchers interested in obtaining accurate data from their interviews generally ask multiple questions for each topic. The questions aresequenced to provide smooth transitions throughout the interview (Labaw,1980). Development of questionnaire items is based on hypotheses that theresearcher has developed. The hypotheses are presented to a group ofindividuals who are subject matter experts, and they perform a preliminaryassessment of the hypotheses (Labaw, 1980). The questionnaire may requiremodification if the hypotheses are not viable.
Most survey formats that gather data through the interview techniquewould not use response alternatives that are dichotomous, such as a "yes/no" response. There is not much to probe wi th thi s type of format (Bradburn &Sudman, 1979). There have been exceptions where interviews used a"yes-no" checklist. Krohn (984) advised using this dichotomous format fora series of separate scenarios that determined human factors problemsunique to the task. The checklist was accompanied by comments. Numerousscenarios could be discussed, and interview time was minimized by thisprocedure. The advantage in using this approach was that thiS provided amaximum, or at least a satisfactory coverage of the topics during one .interview with each test participant. The constraints of this field testdid not allow for follow-up time.
129
Surveys using interviewers require that questionnaire format contain alogical sequence for the interviewer to follow. To insure consistencyacross interviewers, it is customary to develop instructions for the inter-viewer regarding how to use the questionnaire form. It is possible to .~
design a questionnaire with interviewer instructions embedded in the body "of the questionnaire. These instructions are usually set off by capitalletters that have been enclosed in parentheses (Backstrom &Hurchur-Cesar,1981).
Telephone "'in terviews -he'nefit-if-thesurveyscontain-items--andresponsefonnats which differ from face-to-face interviews. To reduce the potential'for phone disconnects, questionnaires must have fewer items than face-toface interviews. These items should be shorter. This facilitates a higherinteractio~ between the respondent and the interviewer. , It tends to reducethe number of telephone disconnects. Telephone interviews preclude the useof visual cues that might be found on response cards in face-to-face interviews (Backstrom &Hurchur-Cesar, 1981).
For face-to-face interviews, interview schedules may include itemsthat are both closed and open-ended. As with telephone interviews, allinterviewers require training to maintain content validity and reducepotential interviewer bias.
Survey'instrumentsusing interviews have received many types of fieldassessm.ents. Krohn (1984) used interviews in human factors engineeringtasks involving recovery vehicles~Interviews were used by Nemeroff andWex ley (1979) to' assess perronnance feedback characteriStics, and Vance,Kuhnert, and; Farr (1978) used questionna'ires subjected to an interviewtechnique as a 'way to 'select employees. Interviewing is the most cOl1ll1on (~;
technique used for national opinion surveys, and large samples are employed ,~as well (Groves, 1979).'
\" ..
Examples of Interviewing
Face;"to~face interviews were used by Krohn (1984) as part of a humanfactors evalu'ation~,Recovery vel1icles, tasks, and equipment were subjected,to operational ,testing., Interviews were used in conjunction 'with lIyes/nollcheckliSts. Each c,hecklist was dedicated 'to a different aspect of recovery
. veh~cle operati9n, ~uch as: maintain and repair, recover vehicles including fuel transfer, tow vehicles, and amphibious operations. The fonna,tprovideda-spiicfffo-r coimlentsrelating to equipment, and' tasks in eachcateg9ry of reco'ver~. vehicle operati on (these were termed s~enari os) •.
The ,lIyes-noll checklist, in conjunction with the conments, serve ascues to, the interviewer to probe in depth any safety hazards and the humanfactors problem areas that the respondent identifies. Krohn (1984) indicated that administration of the checklist and an interview of criticalareas would reduce the total interview time. This approach to interViewingwould focus on interviewing only in problem areas. A portion of the checklist that Krohn used in conjunction with interviews follows.
130
--, '-'-_._'-_._---------~-,._~-------,
(J);
11·
"',j
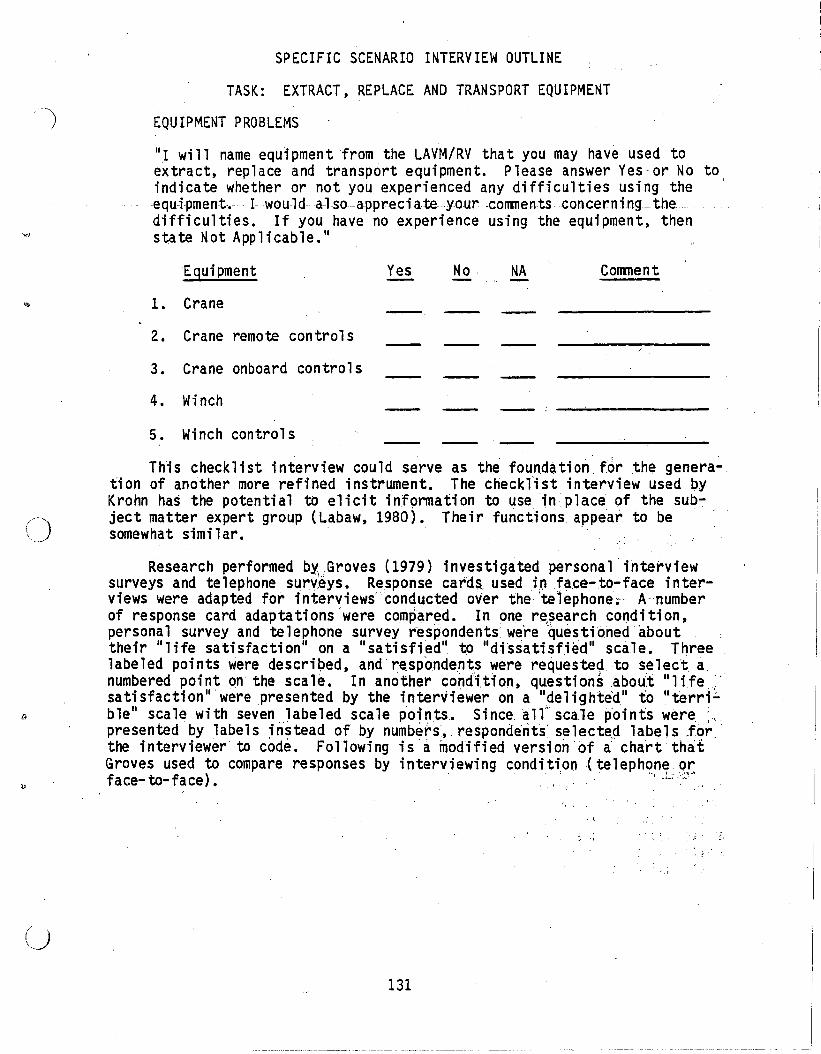
").I
'vi
(j
SPECIFIC SCENARIO INTERVIEW OUTLINE
TASK: EXTRACT, REPLACE AND TRANSPORT EQUIPMENT
EQUIPMENT PROBLEMS
"1 will name equipment from the LAVM/RV that you may have used toextract, replace and transport equipment. Please answer Yes or No toindicate whether or not you experienced any difficulties using theequ-i,pment,. -1 wou-ld-a-lso-a-PPl"eciate your ,comments concerning ,thedifficulties. If you have no experience using the equipment, thenstate Not Applicable."
Eguipment Yes No ' NA Conment
l. Crane -2. Crane remote controls
3. Crane onboard controls
4. Winch
5. Winch controls
This checklist interview could serve as the foundation' for the generation of another more refined instrument. The checklist interview used byKrohn has the potential to elicit infc;>rmation to use in place of the subject matter expert group (Labaw, 1980). Their functions appear to besomewhat similar. -, - -
Research performed by.Groves (1979) investigated personal interviewsurveys and telephone surv:eys. Response cards. used .i.nface-to-face interviews were adapted for interviews conducted over the 'telephone; A'numberof response card adaptations'were ca,mpared. In one re,search condition,personal survey and telephone survey respondents were 'questioned abouttheir "life satisfaction" on a "satisfied" tp "dissatisfied" scale. Threelabeled points were descri~ed, and' r~..spondents were requested to select anumbered point on the scale. In another condJtl0n, qu.estionsabout "life.satisfaction" were presented by the interviewer ona "delightedU to "terri':'ble" scale with sevenJabeled scale points. Since all' sca.le p'oints were '~,presented by labels jnstead of by numbers, respondentS' selected labels ,for'the interviewer to code. Following isa modified version of a chart thatGroves used to compare responses by interviewing condition (telephone orface-to-face). . ," .L:~~'~
;. "
. ,
, ,
131
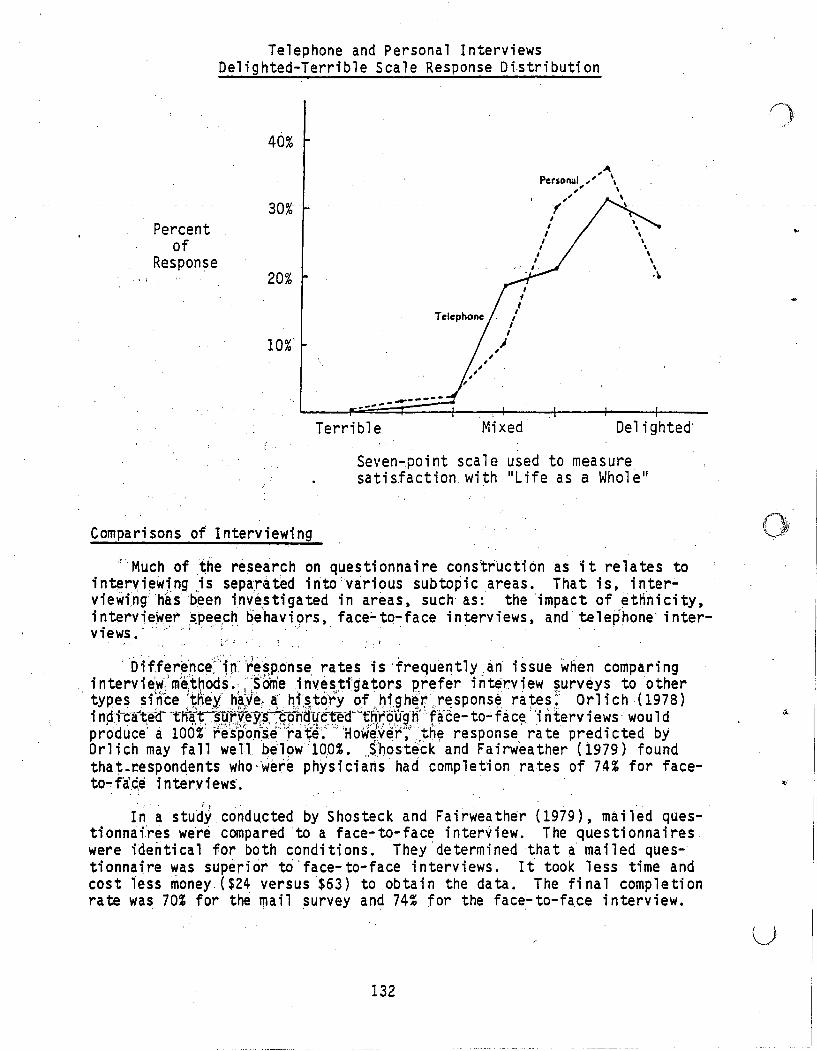
Telephone and Personal InterviewsDelighted-Terrible Scale Response Distribution
40%
..
Delighted
,""Pcrsolllll,' \
" \" \f \,,,,,,,,
Mixed"
,tt,,
II
,J,,, ,,,,,
_..----_ ..- .. -Terrible
20%
10%'
Percentof
Response",",
Seven-point scale used to measuresatis.faction with "Life as a Whole ll
Comparisons of Interviewing
,r Much of "the research on questionnaire cons'truction as it relates toi nterv iewi ng is separa. ted into 'vari ous subtopi c areas. That is, i nterviewi"ng"hasbeeninvestigated in areas, such as: the impact of ethhicity,i n~rvieWer s.pee,ch t)e"havi ors, face;. to-face interviews, and telephone' i nter-views ..." :", '".' . "",,; , "'''. ,," , '
• 1 f
. ",,", ':'" ,,". "1"" "" "
'Dif.fer~~nce:'in· 'r~~p"onse, rates is 'frequently an" issue when comparing, intervi~~"/mef~~od_s~; \"JOm'e ,!nv~~;;ti'gators prefer irit~rview ~urvey~ to other
tYRes s,nce,~heyh~lei,~ ~J.~tqrY qf ,.h,19h~17 ,re.sponse. ra Fe~~ Orl, ch (1978)i n~ti-c-a-'t:eCl~ -tn~r"'~,~:r.IY;~Y},; ~qii·9·~-t-;te.cr"·~nJ;9,L1g.n·fa·ce- to.; fa ce. '"i nterv i ews ' wo u1dpro'duce' a 100%" re's'pon-s¢-)"a~e':"'How~v~r'~"Jh~ response, ra te predicted byOrlich may fall well b.el()w 100%. "S'hQsteck and Fairweather (1979) foundtha :t-respondents who ,'were physi ci ans had completi on rates of 74% for faceto-fa¢~ interview~.
I, ,"
1.n a study condu,cted by Shosteck and Fairweather (1979), mailed questionnaires were compared to a face-to-face interview. The questionnaires"were ideritical for both conditions. They 'determined that i mailed questionnaire was superior to'face-to-face interviews. It took less time andcost less money" ($24 versus $63) to obtain the data. The final completionrate was 70% for the mail survey and 74% for the face-to-face interview.
u132
)
Weeks and Moore (1981) researched the ethnic background of interviewers. They examined whether the relationship of the ethnic background ofthe interviewer and respondent would bias the responses on a survey. Theethnic backgrounds of respondents examined were: Cubans (residing inMiami), Chicanos (residing in E1 Paso), Chinese (residing in San Francisco), and native Americans (residing in Northeast Arizona). There were 101interviewers used in this study (50 ethnics and 51 nonethnics). Ethnicinterviewers were defined as being members of one of the four ethnicgroups: Cuban, Chicano, Chinese, and native American. Nonethnic interv-iewerswere Caucasian --not~~ofLatin~descent. Theresults~indJcated~ thatthere were no significant differences between ethnic and nonethnic interviewers.
)
For survey items which are non-threatening, and are non-social, thedifference in ethnicity between interviewer and respondent does not appear
V} to bias survey results. Weeks and Moore (1981) reported the work of otherresearchers which supported their results for Mexican American and Anglointerviewers (Welch, Comer, & Steinman, 1973),and caucasian and blackinterviewers (Hyman, Cobb, Feldman, Hart, &Stember, 1954; Williams, 1964;Schuman & Converse, 1971; Hatchett & Schuman, 1975; Schaeffer, 1980).
,Ethnicity of interviewer does not appear to bias"survey results.
Bradburn and Sudman (1979) strove to eliminate errors in interviewquestionnaire administration. They were interested in identifying theinterviewer characteristics which contributed to the error. They observedthat on about hal f of all questi onnai re admi ni strati ons, interviewers committed non-prograrmied behavior and errors instea,d of faithfUlly followingthe interview schedule. They controlled for interviewer errors throughstringent selection criteria and interviewer training. They had interviewscoded for non-prograrrmed speech behavi or on 41,292 i ndividuaJ item admi n- .istrations. According to their analysis, reading errors"occu'rred morefrequently than any other type of error. They were able to identify! interviewer and respondent characteristi cs whi ch contributed to the non-'prograrrmed behaviors. Age was the, primary variable affecting interviewerand respondent behaviors. These behaviors threatened the standardiza ti on, ,for administering the questionnaire. They found that older respondents (65and over) had a higher interaction rate with the in;terviewerthan younger' ,respondents. Older respondents required prompting to cOl11p1ete, the surveyitems. Older interviewers (55 and over) were less likely to fd110w theinterview schedule as closely as younger i nterviewers.Therefore), the, "survey procedures were not as standardi zed. Non-pro.granmed behavior, ex"; j :,:
hibited by these interviewers may have been due to their grea,ter, experience'level and less formal approach. " '.' ' ,,' ~.; .
(,I
)
Interviewer characteristics were examined by Groves (1'979) ,for'di;Tf~'r:"<'ences between ~lephone and face-to-face interviews. Groves' wa's concer'ned"with identifying interview st~ategies (interviewer behavior) that wouldproduce better da 1:a cdll ecti on. He was also concerned' wi itt adapti ng' response cards from face-to-face interviews 'into acceptable cO'mn1uni cati on . ':vehicles for telephone interviews. As with the response rate for face-' I:>"
to-face interviews versus a mail survey (Shosteck & Fairweather, 1979)~ , ",,'response rate was higher for the face-to-face interviews than for the' "telephone interviews (Groves" 1979). Adaptation of response cards used in <
face-to-face interviews and telephone interviews produced varying results
133
depending on the type of interview. Labeling the scale points. with numbersgenerated large differences between conditions when the numbers were represented by more uncommon number labeling (Feeling Thermometer number labelsranged from 0 to 100). The response card for face-to-face interviews wasnot numerically labeled for 75 and 80 degrees. This created the largestsingle difference between response patterns for the telephone interview andthe face-to-face interview. The difference may have been an artifactualone. According to Groves, there were also varying response patterns between interview modes when response cards were numerically labeled in suchaway· thattheywere··di-v;·sible.bylarger.numbers.(teJephoneresponsecar-dswere labeled 0-50 degrees,.50 degrees, and 50-100 degrees).
The effectiveness of using interviews has received attention for!management application. Nemeroff and Wexley (1979) and Kingstrom (1979)investigated this approach for performance feedback. Research findingssupported the use of structured interviews for performance ,feedback.Vance, Kuhnert, and Farr (1978) felt that a structured interview formatwould be useful for selecting employees. They used behavioral ratingscales to compose structured interview items. Psychometric properties ofinterview ratings were compared for behavioral scales and graphic scales.The hypothesis that behavioral scales would be psychometrically superiorwas supported. When asked for their preference, managers strongly favoredthe behavioral scales (p<.OOl).Kingstrom found no significant differencesbetween apprai sal format-for interviews, and supervi sors I wi 11 i ngness to.conduct performance feedback interviews. Research results are mixed, andfurther research is required regardi ng performance feedback interviews.For employee selection, Vance et ale determined that interview surveys canbe reliable. Behavioral scale ratings were significantly more accuratethan graphic rating scales. . ' '
Research which focuses on interviewing for questionnaires is diversein content. It .is not possible to have implicit confidence in the conclusions about the gener.alizibility of these findings since the methods,experimental designs, etc. vary so greatly. For example, the,; subjects usedin research on i'nterviews 'have incl uded persons from non-Engli sh speaki ngbackgrounds, managers and subordinateswhoworki n·men ta1 hygiene, salessupervisors'~ members of households across the United S.tates, physicians,and, of course, students.
,<.J
Conclusions Reg'arding InterViewing
Research on interVlewing> techniques that focuses on character; sti cs 'ofthe. interview provides evidence that this·type of survey is viable when1:ime.andmoney are not a constraint for face-to-face interviews. They arereconmended in situations where a high percentage of response 'rate isvalued. Where time is a constraint but cost is not, telephone surveys mayserve as an i,ntermediary approach to collecting data. The response ratedoes not tend to be as high for telephone surveys as that of face-to-facei nterv iews.
Perhaps improving interview techniques that are used for telephonesurveys would enhance the response rate. Greater care is required wheninterview guides are designed for research conditions that include telephone surveys in conjunction with other types of surveys, such as mail or
134
.'
:~\
().,...,.....
u
face-to-face interviews. How the 1nterviewerlabels the scale points andhow the questions are constructed (unfolding general questions to obtainmore specific information) has the potential to bias survey resul ts(Groves, 1979). \
The research of Weeks and Moore (198~) supports the contention that adifference in ethnici~ between the interviewer and the respondent does notbias the results of the survey. However, in situations where the items arethreatening or race-related, the survey results would' probably be influencedby.ethnicity ,of thetntervJewer,.as. well.as_thAt()f.t.be, respondent.Race-related questions require ma'tching interviewer and respondenfbiethnicity. Apparen~ly age is a variable that impinges on the accuracy ofsurveys whi ch are conducted by face- to-face, interviews. ,Bradburn and Sudman (1979) found that interviewers over 55 years of age tended to present anonstandardized survey to respondents (they appeared to,be less formal intheir presentation of survey items). ,In addition, respondents 65 years andolder requested clarification more frequently than younger respondents, andsubmi tted a hi gher frequency of inappropriate item responses.,
When interview surveys have been applied to solve management-typeproblems, mixed results were obtained. This may be related to the type ofinterview used. Vance, Kuhnert, and Farr (1'978) determined that behavioralscales used in interviews for selection were superior to interviews thatincorporated a graphic rating scale. Interviews used for performancefeedback conditions were'recommended as a way of increasing participationby employees to provide them with an opportunity to set job-specific goals.Thi s type of procedure requi res tra i ni ng for super"i sors who are' performi ngthe interview (Nemeroff & Wexley, 1979). 'Tra.ining interviewers for thistask is subject to issues of reliability among format, rater characteristics; and attitude toward feedback interviews (Kingstrom, 1979L
The development ofinterv1ewing schedules and'training interviewers toconduct standardized interviews is time-consuming. Individuals tasked withconducting military surveys may have underutilized their professionalskills in the developmental stages of interview surveys. This ,is due tothe time constraints placed on them (Chun, Fields, & Friedman, 1975).There has been a tendency in military surveys to over sample (large-scale 'periodic surveys have had response rates ranging between 38~ and 51~ according to Chun et al.). Military survey research could benefit from thefollowing: exploring various ways to obtain more lead time in surveydevelopment, increase response rate, control standardizations in field,administration, and control for methodological bias (response bias ofre~pondents brought about by the influence of superiors).
135
o
6.2 COGNITIVE COMPLEXITY
(----'I,I Description of Cognitive Complexity
In recent years, researchers have shifted the exploration of scalecharacteristics, such as number of scale points, to relationships amongrespondent characteristics, format preference, and other aspects of thera~tingsituati-on.Original1y, . the .termUcogniti ve~compJexityU .wasdeJinedby Schneier (1977a), although it was developed from Kelly's (1955) theoryof personal constructs. Cognitive complexity has been"colJl1lonly defined asthe ability to differentiate person-objects in the social environment.
Cognitive complexity, according to Schneier (1977a), is a trait whereby respondents would have the ability to perceive the behavior of others ina highly differentiated system. It follows then that individuals who arecognitively simple would perceive their environment' in a'relatively undifferentiated manner (lacking the ability to discriminate between dimensions)(Bernardin, Cardy, &CarlY1e, 1982). Out of Schneier's research on cognitive complexity, a theory of cognitive compatibility was formed. Cognitivecompatibility purports to enhance the psychometric quality of ratings whenthe rating format is compatible with the cognitive structure of the respondent (Bernardin, Cardy, &Carlyle, 1982; Lahey &Saal, 1981). Cognitivecompatibility theory suggests that cognitively complex respondents shouldbe matched to cognitively complex formats, and that cognitively simple respondents should be matched to cogni tively simp le forma 1::s '.; I t was hypothesized that the matching of respondent to format would increase respondentsatisfaction and confidence about thei'''' evaluation. The coric;,~pt of compatibility is especially important since there has been,~h~ c()ncern thatrespondents' ability to discriminate may break down astQ~;~oumber of eval-uations they are tasked to make reaches higher and higherl'h!ve.l~. Theconcept of compatibility has been especially important since there is theconcern that requesting respondents to make too many evaluations may exceedtheir abilit¥ to discriminate (Jacobs, Kafrey, &Zedeck, 1980).
Examples of Cognitive Complexity
Measures of cognitive complexity were obtained by Lahey and Saal(1981) for participants in their research. Measures were taken on theRole Constructs Repertory (REP) test, factor analysis of the REP test, anda scoring task. These three measures were used to divide scores at themedian in order to assign participants to a cognitively complex or cognitively simple designation. Four scale formats were developed, two formatsbeing cognitively complex while two formats were consideredcognitivelysimple. Rating scales used were Behaviorally Anchored Rating Scales(BARS), Mixed Standard Rating Scales (MSS), Graphic Rating Scales (GRS),and an Alternate Scale (AS) with three scale points. They also used a5-point Likert scale to measure respondents confidence in their ability tomake accurate ratings. Following is their description of the four ratingscales they used which they considered either cognitively complex or cogni ti vely simp 1e•
u137
"Behaviorally anchored ratinscales. The behaviorally an-chore ratlng sca es BA contalne nine performance dimen-sions,each of which,was rated on a separate 7-point linear scalewith both numerical and be,havioral anchors. Dimensions containedeither 5 or 6 anchors; a total of SO behavioral anchors appearedon the scales." '
"Mixed standard rating scales. After obtaining appropriatebehavioral anchors for each level of performance on each of th~nine dimensions,tnree levels were chosen for. inclusion in themixedstandardrafi rig scales 'eMS'S r; , one'statemen-t reflectedsuperior performance, one reflected average performance, and thethird reflected inferior or poor performance. The. statements forthe nine' dimensions were randomly ordered, and raters were asked'to indicate if their instructor was better than, accurately described by, or worse than each of the 17 statemen,ts. Numericalratings for the nine dimensions were determined according to theprocedure suggested by Saal (19.79), a revision of Blanz andGhiselli's (1972) origin~l scoring scheme."
"Graphic rating scales. The graphic rating scales (GRS)contained the same nl~e performance.dimensions, and definitionslisted on the BARS. The behavioral anchors were replaced withthe 1abe1s 'excepti ODa llY good' and 'excepti onally poor' at thetop and bottom,' respectively, of the 7-point numerical scale."
"A1terna tera.ti ng ,s.ca l:es. Adopting thetermi no logy used bySchneler lIgna), an. a Ifernaterating scale' (AS) was deve.lop~d by .listing the nine performance dimensions, and 'their definftions, .
'along with a 3-optipnscale.Raters.were asked to place a che~k,
mark .next to the adjective,("above average~~' "average," "below'average") that best described their instructors' performance on~ ,.e.ch of th~ ~imensions." ' .
.. 'f
BARS and the GRS were considered the cognitively complexs9ales" whileMSS and AS were viewed as the cpgnitively simple s·cales. '
. , ." .' ....
Comparisons of Cognitive Complexity
The' ini ~ia,i. researc~ Q.J'1·'909ni ~i'~~ comple'~lty conducted by $chneie:r" ~ ,(l~UaLw,as ~iJlj:t:J~ted_g,ut".,.QL~.c'(:).ng:l:!rn ,Jprp",~ the/.use of BARS.' This i sduetothe fact that .when a r.C!-ting ~~~leii,h~~ .. ~~ .. larg,enumber of dimensions to rate,this may impo.se .acogni.tive ..9y(!rlo~.c;1 on. ~he respondents~ In this context:,~
it was felt that they are no lpingeraQ,1e. to.accurately discriminate a~ong
dimensions (Jacobs, Kafry, & Ze.deck,1980). Schneier used two fonnats' in:his research. BARS served as'the cognitively'complex format,' as well as!simpler forma~ for use by cognitively simple respondents. The subjects inSchneier's research were manufacturi ng workers ( Sauser & Pond, 1981). Oneoutcome of thi~ research was that the cognitivelY simple raters preferredthe cognitively simple form, while the cognitively complex raters preferredBARS. It was found that cognitively complex raters exhibited less restriction of range and less leniency than cognitively simple raters when theBARS format was used. In addition, less halo was exhibited by complexraters regardless of whether the format was complex or simple (Bernardin,Cardy, &Carlyle, 1982).
138
"..
•
()
...
..
The intuitive appeal of aligning coinplexity of format to cognitivecomplexity of respondent prompted resear,chers to investigate this phenomenon. The results of further r~search ha~e been disappointin~. Schneier's(l977a) research indicated that the characteristics of the-rater may influence the quality of the ratings (Borman, 1979). However, attempts toreplicate his findings have not been ,supported. Bernardin, Cardy, andCarlyle (1982) compared a cognitively complex BARS (MSS were used in one ofthe experiments) format with a cognitively simple GRS in four differentexperiments. Their findings indicated that there was no significantrelationsMpbetween·responden:t'scognitive .. !=omplexi ty and confidence in._ ra,tingscale, halo, and scale acceptability. Noneof the four 'experiments produced any evidence supporting Schneier's theory of cognitive complexity.It has been noted that the conditions of Schneier's original research onthis topic has not been exactly replicated. ,Schneier's subjects weremanufacturing workers. Subjects for Bernardin et al. were students inthree of their experimentaJ groups, and police sergeants and patrol officers in one experimental group. Schneier had subjects rate 14 dimensionsfor his cognitively complex format and 10 dimensions for hi s cognitivelysimple format. Bernardin et al. varied'the number of dimensions measuredin th~. four experiments between 5 and 13.
Sauser and Pond (1981) explored the effects of training and scaleconstruction participation on cognitive complexity. ,It was hypothesizedthat psychometric error would be reduced by having raters, participate inscale construction or receive training.: They used BARS with 9 and 11dimensions with their student raters. BARS with 9 dimensions was _cons,iderect simple, and BARS with 11 dimensions wa,s,,',~onsidered coinp'lex·.Eventhough the rater gro'ups'were significantly different from each other at the "-.0001 level for cognitive complexity, there were no significant multivari-ate findings for cognitive complexity x participation x rating (leniencyerror was not affected by these variables). - Their' study showed no evidenceto support the contention that cognitive complexity, training, and scaleconstructi on parti,ci pa ti on reduced bi as 'and error in ra ting s.
, "Using college students as subjects~ Lahey and Saal (1981) measured thecognitive demands of rating using a GRS, BARS, MSS, and a 3-point AS.' Allfour scales consisted of nine dimensions. The cognitively complex formatswere theGRS and the BA~S, each'having,sevenscale points. The cognitivelysimple scales each had three scale points. They investigated the characteristics' of ,cognitive complexity'as they 'relate to psychometric quality.They' found n'o si gniT'i cant differe'rices, ei ther as a functi on of cogni tivecomplexlty or an interaction' for cognitive complexity x scale format (leniency, halo, and range' restriction). Cognitive compatibil ity as a theorywas' 'not supported across four' different r~tingscale formats, 'and acros,sthree different operatiohal,~efinition~of cognitive complexity •
,'The research performed to 'investigate cognitive complexity indicatesthat the variables which id.ntify resporident charattistics for cognition asthey relate to scale format are not currently known (Bernardin, Cardy, &Carlyle, 1982; Sauser &pond~~1981; Lahey &Saal, 1981).
lJ139
Conclusions Regarding Cognitive Complexity
Reviews of performance appraisal literature for future research insea le constructi on have suggested that cogn; tive complexity· may· be animportant rater characteristic. Yet, several attempts to replicate Schnei-}:,el"l s (1977a) findings· have been to no avail. Several suggestions have beenmade as to why it has not been possible to substantiate the cognitivecamp lexi ty hypothesi s .
.. '.' ~
-Sauser-and-Pond- +198})-mehti-onedan explanati on _attributed .to_Be.rnar·~din aM Boetcher (1978) where there is the possi bi 1i ty that for cogni tiv,e.complexity to be a meaningful research variable, it would require scalesthat are composed of more t~an seven dimensions of performance. Anotherdiscrepancy is comparing research on cognitive complexity with the .1977work of Schneier. Most sUbsequent studies were performed with studentsrather than with workers in manufacturing plants. Instead of rating peers(in manufacturing plants), students rated their professors CSauser & Pond,1981). Lahey and Saal (1981) suggested that Schneier's BARS may have beentoo complex for most·practical situations. . .
For whatever the reasons, researchers have not been able to provideevidence that cognitive complexity is an important variable in rating behavior. The continuous failure to repli~ate Schneier's findings castsdoubt on the validity of cognitive complexity as an issue.
:.'
;! ;l
~,; • ~ ": i
..
))
140
.~
6.3 EDUCATION
Description of Education
Education, as it relates to questionnaire construction, usually meansthe educational level of the respondents in conjunction with other demographic characteristics, such as: gender, age, and ethnic background. The·effectofeducation··on·respondent.ratings .. is,Jrequentlyex,al11tlledby .. re-searchers conducting surveys (Schuman &Presser, 1981; Messmer &Seymour,1982; Smith, 1981).
·There have been several approaches to examining the influence of theeducational level of respondents on the way they respond to rating scalesand which type ,of scale they prefer. An illustration of this 'research isthat done on ~he 'relationship of educational level to the use of the IIdon'tknow ll response over awi de range of issues (Schuman & Presser, 1981).,Response consistency, over time, has been examined for its relationship toeducational level (Schuman & Presser; 1981). Respondents' preference fordifferent types of scales has also been investigated as a function of educational level,(Lampert, 1979). There is the possibility that respondents'rating of items",rnay, in other respects, be a function of their educationallevel (Smith, 1981).
Examples of Education, '
To collect information on the educational level of respondents, re-{,.:~\ searchers have had to define e~ucational categories for purposes of col-,_.JI lecting data.
In General Social Surveys for 1976 and 1978, respondents were found tofrequently ignore items with absolute phrasing. Further responses on subsequent items became contradictory (Smith, 1981). Because of this trend,severa,l hypothe,ses were formed. Smith hypothesized that subjects who ratedquestionnaire items with contradictory response patterns would have lowereducation and/or lower intelligence. It was suggested that these subjectswould misunderstand the questions due to cognitive limitations. Theselimitations would be manifested as: lack of imagination to visualize arange of situations, and lack of experience with questionnaires. Thishypothesis was examined by determining the years of schooling that therespondents had 90mpleted. In addition, a 10-item word identification testwas used to measure respondents' verbal ability. Interviewers also evaluated the comprehension of the respondents.
Response rates in survey research were investigated by O'Neil (19}9).Using random digit dialing, a general population telephone survey was conducted for over 1,200 households in Chicago. The effects of respondents'refusals were investjgated by placing up to 20 call backs at staggeredtimes to reach persons who had not previously been at home. Elaboratefollow-up strategies were used to persuade respondents who initially refused to participate in the survey. Individuals conducting, the surveytried to persuade .them to change their minds and parti cipate in the survey.
(~ O'Neil used many demographic characteristics for this study, inclUding
141
educational level. ,Listed below are the demographic categories used todescri be thi s su·rvey samp 1e:
Occupa ti onAgeEthnicityRaceEd,uca ticn
Family Income'ReligionChi ldrenOwner 0 ccupancy
Dwell i ng Type
The·· i nterpretation·of,the·resultsof·~th·is·surveY·has· been·diffi cul t .'.because the selection of respondents within household was not done randomly. The random digit.dialing procedure produced a sample that was dividedin half by randomly selecting half ·of the respondents in the sample toattempt an interview with a'male respondent. The other half of the sampleconsisted of whoever answered the phone first. This resulted in nonrandomization within household selection for the demographlc characteristics ofeducation, age, and occupation~ The other demographic characteristicslisted above were considered to almost never vary within households.
It is not unusu'al to.ask respondents more than one question regardingtheir educa ti onallevel. For example, Survey Research Center (SRC) asksrespondents to identify, by year., their highest grade of school or year ofcollege completed up through grade level 17 and beyond. They then requestaddi ti ona1 inf,ormation from.respondents. Respondents are questioned aboutwhether they obtained a high sct:rool diploma or passed a high school equivalency test in Heu of a diploma. Respondents are also queried about'whether they,have a college"deg,ree{Scht.anan & Presser, .~98l). Educationhas been an :important variable in descri.bing the demographic characteri stics of a sample.• ,However, i·t is always used in conjunction wi'th othervariables., .
Comparisons of Education
Various assumptions, have been made about the educational level of'respondents, and the relationship of this characteristics for its effect onrating items. Studies dealing with the educational. 1eve1·of resp'ondentswere desi gned to' answer research quest; ons "about other"questi onnaire constructi on topi cs, such as bran~hing, ,scale prefer~nce, ~nd'':''dp-nI, t know"response.. Educati ona1 1ev·e1 of responden~ .. i-s ;'collll'qon1y;';measured ; alongwith other demographic ¢naracteristics'~; forge"rider,:age, and ethnic backgroun<1:-~rtr;s ;isWaeternri:ne~the'"?;':effec~'orV~r:esponses of thi s vari ab1e byitself, or in combinatiqnwitn othef demographic variables. .
" , ~) ~\:,' .<, ._~ ~ , ;-' :'
Presser and Scht.anan (1980) compared the effects of omi tti ng or offering a middle alternative in forced-c~oice attitude questions on five experiments. In addition to the replication 'on .severa1 national surveys, oneof their' interests was whether education was related to rating the middlealternative. They were also interested in"effects of educational level onomission of the middle alternative. They hypothesized that education wouldbe related to these form differ~nces. They felt that respondents with lesseducation would be the most influenced by,inc1usion or omission of the middle alternative. They were not able to support this hypothesis. Evidently, education is not related to how respondents use the middle alternative.Responses by educational level do not appear to be affected by whether or
142
..
CJ
not the middle alternative' is included or omitted. Offering the middlecategory, of course, increases the number of responses to that category,but does not appear to affect meaningf~lly the overall ~istribution ofresponses.
I,t was determined by Schuman 'and 'Presser (1981), that the "don l t know"'response alternative was selected most frequently by respondents who hadthe least amount of education. lndividuals with less education appear tobe those respondents who are most i nfl uenced ,by format when a "don It know"re sJ}onse is included. ' However,' for survey ttems·whichrequest an-opinion .for an obscure topic area, there is a propensity for respondents withhigher level s of 'education to select a "don' tknow" response. Respondentswith less education have a tendency to give' an opinion. Respondents withhigher levels of education seem to be more willing to admit they do nothave knowledge of a topic area. ' Respondents with low levels of educationdo not appear to admit they don't know. Instead, they select a responsea 1terna ti ve to represent thei·r opi ni on. '. ,..
In a General Social-Survey, Smith (1981) found evidence that re~pon
dents had a tendency to; gnore the absolute phrasing of the surveY items.This caused·contradictory resRonse patterns., In one 'cif Smith's' hypotheses,it was suggested that respondents'who had lower education/ intelligencewould misunderstand the general questions. ' Thi swould produce contradi ctory response patterns. Smith found that respondents with contradictoryresponse patterns had significantly less education, and lower ,comprehensionassoci a ted wi th lower verbal achievement. These respondents were morelikely to be non-caucasian 'and female. The'items used in:. the questionnairewerere'lated to the approval of hitting' by private citizens and police'.Respondents with contradictory response patterns were· less in favor ofpunitive actions than other respondents. Perhaps researchers need to evaluate general-type questions which appear to result ,in ambiguous meaning.This would be especially important for respondents with lower educationallevels. The items with absolute phrasing were no't answered as though theywere absol ute, but i nsteadthey were answered as though they were nonabsolutes. For example, Smith used an absolute question as follows:"Arethere any si tuati ons 'you c'ariimagine inwhi ch you would approve of a policeman striking an adu,lt malecitizen?" ,Even though some respondentsanswered II no" to this questi on "they SUbsequently approved of situationswhere they accepted the use:of physical force by a police officer or citizen. RespondentS with;"higher levels of education appeared to be able tounderstand the "phrasi ngand"meani ng of the questi ons which used absoluteterms. Therefore, :their responses were not contradi ctory. ' '
, Demographi c characteristi cs were measured by Messmer and Seymour(1982) in their research on ,i tem nonresponse~ They examined responses of alarge sample (2,114 respondents) in a mail survey for items which il111lediately followed a branch.' They hypothesized that: liThe frequency of itemnonresponse will be greater for questions inmediately following a branchinstruction than for those questi'ons wHich do not follow a branch." Out of
,the eight hypotheses established by Messmer and Seymour, two were directedtoward the demographic characteristics of education and age. The hypotheses relating to education and age are presented here: "The greater thelevel of education of the respondents, the lesser the frequency of itemnonresponse for branching items. II liThe greater the age of the respondent,the greater the frequency of item nonresponse for branching questions."
143
The Messmer and Seymour (1982) hypothesis for the adverse influence ofitem nonresponse for questions immediately following a branch was supportedat the .005 level of significance. These hypotheses were partially supported. Hypotheses regarding the demographic characteristics for age wassupported, but not for education. They did not reach a level of significanF~,for education, as it is associated with the frequency of nonresponsefor items inmediately following a branch. However, item nonresponse increased for older respondents (e.g., 60 and older). This was significantat the .014 level. Item nonresponse did not seem to be influenced byeduca'tiOn, gender,dTstancefraTi 'tfleb'ranching-que'stion"to'the resulti'ngquesti~n; number of p~evious branches, branches which deal with futurebehavior, or branches which require an attitudinal response.
The work of O'Neil (1979) for nonresponse to telephone surveys isexpanded upon here. ObviouslY,it is a difficult task to describe subjectswho refuse to participate in· a survey. Yet, OINeil tried to identify thecharacteristics of these subjects. The effects of nonresponse under varying conditions was studied. It was determined that respondents with lesseducation and lower incomes tended to initially refuse to participate inthe survey. Other demographic characteristics described these individualsas more likely to be over 65 years old, caucasian, and of Polish, German,or Irish descent. Researchers must decide how much extra expense they arew'illing to incur to minimize nonresponse rate, and what benefits they'derive by incr~asing response rate. OINeil was able to increase the response rate up to 86.8% from the initial response rate of 74.5%. Theoriginal sample, .p~ior to telephoning respondents, consisted of 1,392eli~ibTe haus~holds~· .
Education was used as a demographic variable along with gender, age,and ethnic origin to i nvesti ga te the re~pondentsI abil i ty to i ndi ca te thei ratti tudes 'oli four di fferent types of scales (Lampert, 1979). Educa ti on wasthe only variable which differentiated among the subjects. Respondentswith education below the grammar school level were significantly differentin rating the scales at the .0001 level of significance than the other respondents in the sample. Respondents with educational levels above partialhigh school education did not influence the correlation coefficients. Thiswas because their response distribution was notmuefl different from thedistribution of those subjects whoSE! educational level'was even higher.The four stales emp'loyed were:' Attitude PoTllme'ter (an attitude continuousscale with visual elements), as we~ll as a verba'l'!~ numerical, and continuous
"oi p~1ar . sea1E!"'( see"'Sectioifi2:-S'.j" CbrrtfiiUous1'and,.'Ci rcul ar Scales).)''': i/.· ,..,. ',','
This'research indicates that, for some studies, educational level ofthe· respondent's".may,·be associ ated wi tho how i terns are rated. Researchfindings do not consistently support this contention, although there ispartial ,evidence.
Conclusfons "Regarding 'Educatfon
..... ).Ii
',. :.11
Some evidence supporting the hypothesis that education may influenceresponse patterns was presented by Schuman and Presser (1981) regardi ng theomission or the use of the "don l t know II response alternative. 'Evidently,respondents with a low level of education were most influenced. by formatsince they had a tendency to select the IIdon't know ll response alternative J
. more frequently than respondents wi th higher 1eve1s of educa ti on. .. ./
144
'''If
...
jr-")'.'-..
u
For the purposes of their research, education was differentiated intothree levels. They collected very specific data as to the number of yearsof education completed by respondents. A high level of education wa$defined as II some college. 1I A middle level of educatiohwas considered tobe. those individuals who had never been to college but had completed a high,school 'diploma or equivaJency certificate. Respondents who did not ha~'{~ ahigh school diploma or who did not pass a high school equivalency tes~ ~ere
identified as having a low ed~cational level.
"For·survey·· itemsaboutobscure.top·ics,-· ·there ..·w~s.a. grea-ter ...tendencyfor responden ts wi th a hi gh 1eve1 of educa ti on to ra te the items wi th aIIdon,,' t know ll response. Those respondents with a low educational leveltended to select a response alternative that represe~ped their intensity ofemotion in cases where they probably had no opinion (Tor items they apparently knew nothing about). This research included the general populationof the U.S. as the sample. It wouJd be useful to know whether these samecharacteristics c~n be.;g~n~r~lizedto enlisted perso~nel who have lowlevels of educati()n. 'If~Qjs were true, then it might be useful to omitthe IIdon't know ll
resp()i1$e,alt~rnative for topic areas tnat 'the respondents·have experienced.,~~ms sh04ld be reviewed to ensure that the respondentsunder$tand the content so that they doni t select ~n opinion on a scale justto appear knowledgeable. ' '
Schuman and Presser (1981) found an interaction' among educationallevel of respondents~,1:heir response consistency in' rating items, and theiri ntensi ty, of f~~lln~:'~bout the i tem. There~ppearec:t l~?,,)be' agrea ter con~sistency in ra'ting-'Ttems when respondents had a middle and higher level ofeducati,on'r apd Jl~din;tense feelings about the 'co~~ent of" ..t~~ item. Tl1is "interaction, was .. no't,significant for individuals,with a lower level ofeducation. ~Theysuggested that resP9ng~'nts'~Jlh.~,:·Jower·le·velof .educationmay have a,more ~if,ficult time separa'ting o~,tflthe'1r;att;tude tOward thecontent of"an· it~m and their attitude strengti~' as a personal response'sty1e. i'e.
In relateg research conducted by $~Jth(1981),' respondents ~ith a lowlevel of education misunderstood items which' had been phrased.using abso-'lute terms. Because of their faulty interpretation of the items, theirresponse patterns were not consi stent. The response patterns were contradictory. Smith could have reworded the general questions tO,avoid confu- ,sion by respondents who have low levels of education. Research by Schumanand Presser (1981) and Smith (1981) indicates that respondents with lowerlevels of education may not understand the content of an item in the sameway as other respondents wi th hi gher levels ,of educa ti on. Respondents wi thvarying levels of education may not be interpreting the items in the sameway. .
There is some evidence that respondents may be marking items and theIIdon't know ll response alternative in divergent ways (based on their educational level). The actual format of the survey has the potential to contribute to divergent ratings, too. Using education, gender, age, andethnic origin as demographic variables, Lampert (1979) found that theeducational level of respondents was influenced by format. Results indicated that respondents with a low level of education (in this instance low
145
()),,,--,., .
level refers to education below the 'grari1ner school level) were significantly different than the sample as a whole in rating four different scales.Above the grarrrnar, school, level, there were no significant differences amonggroups for any of the demographic characteristics~ (~
_~Jn~someinstances, education appears to be linked to nonresponse. Ina telephone survey by OINeil (1'979), low educational level was associatedwith respondents' who had initially refused to~'participate in 'the survey(these indiv idualswouldhave ,probablybeennonrespondents had'el aboratefolr6w~up' proceOure's 'notbeen'us'eowith' them). 'rnfhis parllcLJlar' study,education 'was related to other' characteristics of',age, race, and ethnicorigin~ Education is, attimes~ theohly demogr~phic ~haracteristic obtaining levels of significance, although education is usually f6urid to beassociated with other variables.,'
There have been occasiqns where researchers felt that education mayhave -influenced the outcome ofquestionnair'e responses, yet this phenomenonwas not consistently supported 'by psychometric results. For example, Messmer and Seymour (1982·) hypothesized that education would be a factor initem nonresponse for items jrrrnediately following a branch. Results did notreach a level of significance to support this hypothesis. They did deter-'mine that: age was associated with item nohresponse. Presser and Schuman(1980) compared the OO1ission or the inclusion of:a middle, alternative in '"forced-choice, attitud~ questions. They felt that education would be associated with~ theseform'differences.They"were not able to obtain evidenceth~t ,would~supp6~t their Gontention. 'V~rylittle is 'known about the effettof ~adcat~6~~lYTiv~T 6ri'f~i~6hses'to questicinnaires th~t are d~signed 'for'use in performahce appraiSaL- 1hareview of the'literature oi1performancea~praisal~ L~nayCarid' Farr, (1980)' re~orted thew6rk of Cascio and"V~lenzf '(1977). Theyinvestigatedrat~r educati6nal'~levels on supervisorj ratingsfor job" 'perfonnance of pol ice officers. Education contributed only a smallperceiitage'of.'>the total rating variance, and this finding was not, consi-dered to 'be of' practical ;importance. -The demographi ccharacteri st i c II edu-cation,", at times~ impacts o~ questionnaire construttion. Education isusually linked to other demographic characteristics when it affetts re-sponse patterns: 'i .' i ','
,~ . ' : '! '
.. ,~._ ..__ .__. ..:_.-.._- ._- - --- ~,... ~ .. ,~.- ._...."' ...
! '
:.' .
: -:. .... . ~
.. ' "
())
146
... _ .. -""' ,- - _....__ ..
,..... ..~
" )
u
6.4 ETHNIC BACKGROUND
Description 'ofEthntc 'Background
Survey research investigations into ethnic background have usually.been focused on differences between b1 ack and caucasi.ari .r~sponden~s (Landy&Farr, 1980; OINei 1,. 1979 LThere havebeenexcept10ns tothls trend. .
"where .r'es'earchTnetfiiifcrty 'has-5een-expanded-'to-ihcTuae::CUl:5atis; -Ch'i ca'n<>s'(and other Hispanics), native Am~ricans, Chinese (and q1:her.Orienta1s), aswell as those of Polish; German, and Irish descent (Weeks & Moore, 1981;Imada & London, 1979; 0 I Nei 1,1979 ) • . '. ,
. ,
Ethni ci ty has been exami ned 'from a number of perspecti ves, such as:ethnic background of the interViewer, ethnic background of respondents,culture-free content of questionnaire items, effects of ethnicity on performance appraisal scores, response rates associa:tedwith ethnicity, use ofself-assessment instruments, and surv~ys of race relations (Segal &.Savell,1975; van Rijn, 1980; O'Neil, 1979; Landy &Farr, 1980; Schuman & Presser,1981). . . . .
Examples'of'Ethnic 'Background
, Research on ethnic influences on surveys has'been ,quit~ diverse, aswill be apparent from the' examples below. lnves;tigations h~v.efocused on .such issues as differences· betweenbJack and .caucasian interviewers,. the .. 'ethnic background'ofindiv1duals who refused' to be respondents in'a tele~phone survey~a:nd the extent: to which stereotypical ratings.ar~a function;of the rater, 'the scale, ar:-d. the: stimuli being ~rated., ., '.' .. :, ..... . ' ..
r.'.. -', : ., •
SChum~n.\and, Presser' ,'1981)'. conduc~d a~ 'exp~rirrient to·me~~ure. r~spo~~edifferences;,iobtatned by black or caucasial"!interviewers. , They. asked re-,spondents the fo 11 owi ng ques tion:' "
"Tell me who two or three of your 'favori teactors or entertain~r~are?"
The resp'onses' were 'later coded according to ethnic backgrpund of respondents and interviewers to determine the differences.
~' :
OINeil (1979) contacted 1,209 Chicago households to identify individuals from different ethnic backgrounds who refused to be part of a telephonesurvey prior to extensive follow-up techniques. Questions were asked'relating to neighborhood 'crime. OINeil eliminated ethnic groups who comprised less,:than 41j;·of the sample. To determine the ethnic background ofrespondents'" they were specifically asked:
"What foreign country would you say that most of your ancestorscome from?" '
Semantic differential scales were developed by Imada and London (1979)to measure ethnic stereotypes. Respondents received'a questionnaire consisting of a biographical information form and a page of instructions. A
147
,~,
3-way interaction among the scales, stimuli, and subjects was analyzed.Subjects were caucasians, blacks, and Orientals. Their social perceptionsof ethnic stereotypes were measured on an a-poi nt bipol ar scale wi th 24sets of adjectives. The adjectives they used are listed below: ,~
headstrong-mild, gentle- excitable-calm
simp le, d i rect-imag i na ti vecareless-fussypessimist-ic-optimis-tic·undependable-responsibleuncoopera ti ve-coopera ti veaimless-motivatedir.ritable-good naturedma·l adjus ted-adjus tedunsuccessful-successfulquitting, fickle-perseveringdisreputable-reputablenervous-poisedclumsy-refinedsi 1ent- taka,ti veshy-outgoingsecretive-frank, openstati c-dynami cSUbmissive-dominant.passive-activeweak-stronginsensitive-sensitivepowerless-powerfUl
~ ..
Research in ethnic background effects has b~en quite diverse forvarious aspects of ethnicity, including: scale design, ratings,",con~nt,and implementation. Studies have focused on different ethnic backgroundsof interviewers and respondents. ,
Compari.sons of Ethni c Background
t"
l'" "
Implications exist for biasing survey results due to ethnicity when-'eversurveys~ i:ncorporate face~:to-face j nter.vi:ewing •. ' ,Th'i s 'potential ;for·'biasing could be due tothe,:diJferent,ethn'iccbackgroundsof interv...iewe.rsand·-resp-ondents-;----A-lso;the content of the survey items may possibly produce biased r.esul:ts,.'- ~
""" ,:,,' :rie' _,;':1::.S_ch.ulIl-an:.and :Pine.s:s_er,( 19a1t: a'ddr..essed these issues "by conducting a
study where the rac~ of the4nter.vjewers (black and caucasi,an) was.variedalong with the context of the' questions. One of the items on the surveyasked respondents to name their favortte entertainers. The researchersused two survey forms. Each form included questions related to racialdiscrimination. They hypothesized that more black entertainers would beidentified on the first form than on the second form. The first formstarted out by asking racially-discriminating questions, and then askedrespondents to identify a favorite entertainer. The second form askedrespondents to identify a favorite entertainer. This request was followedby racially-discriminating questions. The respondents were black; and it eli
148
\..~-~-----_._".,.---------_.. _.- ---- _._-
'C(
-cl
·0
.' ...,)
)
was hypothesized that more black entertainers would be identified when interviewers were black than when interviewers were caucasian. There was nosignificant difference for question order effect. Racially discriminatingi terns before or after a request to name favori te entertainers apparentlydid noti nfl uence t.he responses. There was no, significant effect for raceof interviewer.
Investigation of the ethnicity of interviewers was conducted by Weeksand Moore (1981) in a sample of 1,472 household respondents from nonEnglish. language .backgroundsCCubans-JChicanos., .. nati v.e .Ameri.cans, .. anci' Ghi-..nese). They analyzed whether there were any significant differences ininterview results by the ethnic interviewers mentioned above and AngloAmerican interviewers. Surveys and test scores were compiled for each subject. They found that there was no significant difference in interviewresults between ethnic interviewers and Anglo-American interviewers. Thisresearch supports previous findings for interviewer effects for black andcaucasian interviewers. I~terviewer nonprogrammed behaviors that includereading errors, feedback, and requests for clarification were investigatedby Bradburn and Sudman (1979) for possible ethnic influence. They determined that there were no significant differences for race or sex of interviewer, although age of interviewer was a factor.
In a telephone survey of 1,209 Chicago households, O'Neil (1979)sought to isolate the characteristics of individuals who refused· to participate in a telephone survey. Individuals initially not willing toparticipate in the survey tended to have a lower income,· were older, andhad less education than other members of the sample as a whole. For thissurvey, resistant respondents were caucasian blue collar and service workers of Polish, German, and Irish d~scent. (Black respondents, overall, didnot have a tendency' tp refus~ participation in the'survey.)
The ethni c backgro!Jnci of ra ters a~s~ssin9 :loa tees in performance appraisal scales was review~q;'~~Landx~ng Farr (1980). . Result~. for thistype of research have been mlXed sotl:lat there appear to be no clear guidelines. For example,. they repor~ed .the··work of Crook~ (l~72), De Jung andKaplan (1962), and Hamner, Kim, Baird, and ~igoness(19~4) where higherratings were received by ratees when the rater was of the same race. Theyalso reported the work of Schmidt and Johnspn (1973) and Bass and Turner(1973) where there was no significant effect for same-race raters ~ith .peer rating~, and no significant differehces for black andcauca~1an 'raters. . .
Self-assessment has been used by ratees in essentially two types ofapplications. Self-asse~~me~t h~s been used by applicant candidates forselection into new positJons. I~ addition, self-assessment has been usedby individuals in perfonnance appra'isa1. Ratees appraise their own per-,formance instead of being evaluated by a supervisor (van Rijn,1980). VanRijn reviewed r~search performedpy Levine, Flory, and Ash (1977) whereself-assessment for minority group members for typing abilities were examined. Self-assessment ratings were somewhat similar, for caucasians andminorities. However, caucasian job applicants were able to predict theirtyping scores at r = .64, while minority applicants predicted their. typingscores at r = .39. In the range of self-assessment ratings, the commonregressi on 1i ne for the total group underpredi cted the performance of
149
, '
caucasian applicants, and overpredicted the performance of minority applicants. In a stUdy reported by van Ri jn (1980) and conducted by Hardt,
Eyde, Primoff, and Tordy (1978), van Rijn indicated that applicants ratingtheir knowledge, skills, and abilities for police officer positions had a r-)low correlation with actual tests. 'There:were differences among caucasian,:'Hispanic, and black applicants; blacks and Hispanics were apparently not asaware of their abilities, knowledge and skill level as were caucasianaapp 1i cants.
Ttie imp-acts' of ethnici'ty 'ontherel iability' 'andvalidityofse If-··assessment ratings 'requires further research. Research findings indicate
. differences in responses based on ethnic background. Bacause of the paucity of research in thi s area, it is premature to infer trends for ethni ci tyin re1ati onshi p to self assessment. '
Response patterns for caucasian and non-caucasian high school 'studentswas investigated by Arima (1980). The Armed Services Vocational AptitudeBattery (ASVAB) was compared wi tha performance-based, culture-free test.There were no significant differences ~etween caucasian (and non-caucasianmale sUbjects, as well as no 'significant differences between caucasian maleand caucasian female subjects. There was a significant difference betweencaucasian and non-caucasian female subjects. According to Arima, femalerespondents typically scored lower on the ASVAB. .Evidently, females showequal scoring to males 'on the clerical tasks only. 'Research performed bySchmidt and Hunter (1980) indicated that tests which appeared to be morevalid,for one race than for another were not really,ableto meet the psychometric rigor of validity'~ "Sedlacek (1977) pointed ,out that evidencedoes not support content maki'ng a difference for 'scoring on tests"\for,racial minorities or females. Administration may be what is influencingthe results. It is known that the ethnic background, of a test administrator, and the percepti on by the respondent for the 'use of the scores, hasthe potential to influence test results. Sedlacek was referri'ng to the1anguage used in the items. In research performed by Arima, i tern: contentdid influence scores on vocational tests. For females (caucasian andnon-caucasian), there were scoring differ'ences. This may have been due tothe vocati ona1 content of the tests. .'0 ,
The U.S. Army has conductedsurveys bn 'racerelati'ons (Segal & Savell,1975). Collectingmu'ltiple sources of data that: accurately reflectedethni ci ty wi thi n the Army was approached by supp lementi ng su rv,eys wi th-fie'laoDservation5;Tnternrive'fn-te'rvi'ews, Army 'records, and experimentalprograms. Even though alternate methods for collecting data were used,surveys were considerecl'the primary'data collection instrument. Theysugges,ted that 'a better understanding,s"'of questionnaire construction methodsand sampling theory would improve'the'quality of data.
The' effect of ethnic background for the 'areas of self-assessment,performance appraisals, and'vocational tests are mixed. Studies providelittle guidance for the structuring of item content on questionnaires inthese areas. Research associated with interviewer effects may be moreuseful in application.
150
T)
...
"
u
Conclusions Regarding Ethnic Background
There has been a consistent trend related to ethnic backgrounds ofinterviewers and respondents. Studies indicate that nonsensitive, nonracial items appear to be relatively ilTlTlune to interviewer effects forethnic background (Weeks &Moore, 1981; Welch, Comer, &Steinman, 1973;Hyman, Cobb, Feldman, Hart, &Stember, 1954; Schuman &Converse, 1971;Schaeffer, 1980). Schuman and Presser (1981) found no significant effect·for ethni c interacti on wi th the interviewer and respondent. Thi s,researchwas ·supportedby ·the-work·ofWeeks··and·Moore(1981) and Bradburn·and·Sudman(1979), where ethnic background of interviewers was compared. There was nosignificant difference in interviewing by race. Response rates for surveyswere examined for ethnicity by O'Neil (1979). Even though ethnic backgrounds were identified as Polish, German, and Irish for those termedresisters (subjects which did not want to participate 'in the survey), ~he
real issue may be one of age and socio-econOOlic background. For example,in searching for characteristics whi~h explain interviewer errors, Bradburnand Sudman (1979) discovered that age was the only factor identifiablewhile ethnic background was Qot an issue.
Scales developed for performance appraisal, when implemented, have attimes been subject to the effects of rater bias due to the ethni c backgrounds of raters and ratees (Crooks, 1972; De Jung &Kaplan, 1962; HalTlTler,Kim, Baird, &Bigoness, 1974; Landy &Farr, 1980). However, there havebeen inconsistencies in the research so that some researchers have not beenable to replicate the effects of ethnic background on rating (Schmidt &Johnson, 1973; Bass &Turner, 1973; Landy &Farr, 1980). Performanceappraisal scales which were self-administered for selection purposes indicated that caucasian subjects underpredicted their performance. Minoritysubjects over-predicted their performance (Levine, Flory, &Ash, 1977). Asimilar finding was observed for self-admin,istered performance appraisalswhere caucasian sUbjects were more accurate in evaluating their performancethan minority subjects (Hardt, Eyde, Primoff, &Tordy, 1978). Most of thestudies on self-assessment have been for lower level jobs, and the resultshave been mixed. Further research will be required to determine the extentto which self-assessment can be used. Historically, this approach has beenfraught with technical and practical problems. It has been suggested byvan Rijn (1980) that self-assessment in personnel selection'be used tosupplement more traditional instruments. Researchers who are involved inquestionnaires designed for more traditional approaches to performanceappraisal may find .it useful to control for possible bias in ratings causedby ethnic backgrounds of raters and ratees.
Questionnaires designed for tests have been subject to ethnic differences (Arima, 1980). Controlling for these differences by changing thewording of items qoes not necessarily result in modifying response patterns(Sedlacek, 1977). Employment tests which purport to be valid for caucasianand not for black respondents, or valid for black and not for caucasianrespondents, have not been psychometrically supported according to Schmidtand Hunter (1980). This places the entire concept of culture-free tests inquestion. For example, investigating culture-free, performance-based testswith the ASVAB indicated that there were no significant differences betweencaucasian and non-caucasian samples overall. However, females were nega~
tively affected by these instruments (Arima, 1980). Females performed
151
poorly on the trade tests. Their performance was equal to that of males inthe areas of attention to detail and numerical operations. These areaswere both elements of the clerical test. This adversely affected theirselection into the technical courses. It is known that there are ethnicdifferences relating to culture-free tests. Yet, these tests may not beany more valid than tests which were designed on the basis of culture.
This conclusion represents the on-going, broad-based research that isreq9ired in questionnaire construction to resolve technical problems asso-
.ciated-with.ethnic.background.The... U.• S_. Armyuseda ..soundapproach. in.designing data collection techniques on the topic of race relations. Tosupplement survey data, a composite of methodologies was used. This provided a method for supplementing and cross-checking the survey data (Segal&Savell, 1975). Not enough is known regarding the impact of ethnic background on questionnaire design. It is possible to reach some conclusionsregard i ng interviewer interacti ons.
)
152
_______~ ....__ --_I
..
u
6.5 GENDER-
Description of Gender
When questionnaire items are constructed, investigators tend to assumethat item content and item order are not affected by respondent gender.Yet, it is not always possible to make- such assumptions. Schuman andpresser(T981)analyzed--·differences--- inresponse·pa·ttern·associa.ted.withgender. They compared male-female responses to open-ended items andclosed-end items on two different questionnaires. The topic area coveredon the questionnaires dealt with job preference. Males and females haddifferent response patterns, although the statistical findings were nothighly significant. Females tended to select pleasantness, and malestended to select autonomy as preferred job attributes.
In the study of questionnaire construction, gender of the respondentdoes, at times, influence the survey outcome. Item content has a potentialfor item-gender interaction. The ordering of items may also interact withgender. It has been suggested by McFarland (1981) that question order becarefully plann~d. McFarland examined question order effects for generaland specific survey items to investigate the strength of order effectsassoci ated wi th gender and/ or educa ti on.
Questionnaire construction research has been sensitive to the potential for stereotypical response patterns brought about by rate.r/rateeitem-gender interaction on performance appraisals. Different male versusfemale response patterns have been found in testing. This i$}especiallytrue for items in the vocational domain. Whenever a questionnaire isconstructed, there is the possibility that item content or item order mayproduce response pattern differences attributable to gender.
Examples of Gender
The search for response patterns reflecting gender differences hasbeen pursued through the use of various research designs, populations,scaling variations, etc. Many hypotheses have been constructed to explainthe response patterns of females and the response patterns of males. Thesemantic differential is one of the instruments which has been subjected tothis type of research.
The underlying three dimensions of the semantic differential (according to Osgood, Suci, & Tannenbaum, 1957) are: l)evaluative, 2) activity,and 3) potency (see Section 2.3, Semantic Differential Scales). Benel andBenel (1976) reported the hypothesis of Meisels and Ford (1969) and Miller(1974) that differences which occur within the evaluative dimension areattributable to females i
• It was felt that females have a greater need forsocial approval than males. According to one hypothesis termed the lIimpulsivity hypothesis'" females will have extreme ratings on all factors inrelationships to the male mean's midpoint scale score. Benel and Benelselected ~motiona1ly charged concepts to accentuate the impul sivi ty of
153
female responses. Listed below are the concepts they identified for theirsemantic differential.
"Love, Life, Truth, Vomit, Polllition, Beggar."
In a study on question order effects, McFarland (1981) suggested that theorder of items on a survey may be critical, depending on the popUlationbeing surveyed. McFarland 'sought interactions between question order,education, and gender' for a telephone survey of Kentucky households. Thesurvey items were administered using two different forms. On the first
"fornl~ ·a.·serleso·T····specfrfC·qlJestioriswas·lonowed·by general 'questions .... Ori'the second form, general questions were followed by a series of specificquestions. An illustration of general questions used by McFarland isincluded here.
1. "How would you describe the current energy problem in theUnited States?1I .
a. Extremely seriousb. Somewhat seriousc. Not serious at all
2. IIDuring the next year, do you think the economy ... II
a. Will get betterb. Wi 11 ge~ worse.c.' . Stay ~he" s:ame .
3., IIIngeneral, how interested would you say you are in poli-ti cs: II
a. Very interestedb. Somewhat interestedc. Not very interested
4. "In general, how interested would you say you are in rel i-g;on: 1I
a. Very interestedb. Somewhat interestedc. Notvf#ry interested
Research performed by Norton, Gustafson, and Foster (1977) focused on'ra ter-ra tee sex bi as in ra ti ng scales' used to measure manageri a1 performance.' They indicated that scales should be general enough to describebehavior in varying management situations. These scales need to remainunidimensional to describe only one kind of behavior (construct). Following is an example of a scale item used to measure management skills insetting and achieVing objectives. Managers rated male and female versions
154
))
(j)
_.._--_._----.....__ ._. ~~~~ ---~-------~.~-~_._......__.._-~_._------,
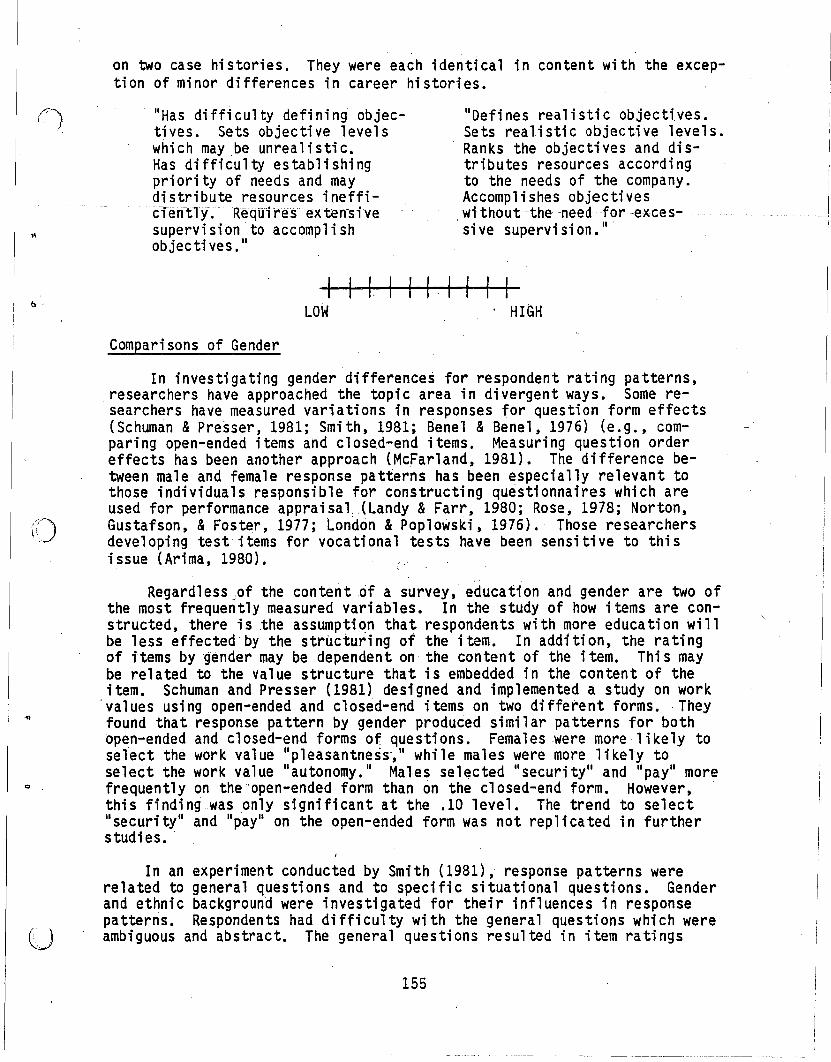
on two case histories. They were each identical in content with the exception of minor differences in career histories.
"Has diffi culty. defi ni ng objectives. Sets objective levelswhich maybe unrealistic.Has difficulty establishingpriority of needs and maydistribute resources inefficfe'ftTY.·ReqUires exten-sivesupervision to accomplishobjectives."
"Defines realistic objectives.Sets realistic objective levels.Ranks the objectives and distributes resources accordingto the needs of the company.Accomplishes objectiveswithout -the-needfor-exces-
• •• II'Slve supervlslon.
l).
LOW . HIGH
(()
.. .
u
Comparisons of Gender
In investigating gender differences for respondent rating patterns,researchers have approached the topic area in divergent ways. Some researchers have measured variations .in responses for question form effects(Schuman & Presser, 1981; Smith, 1981; Benel & Benel, 1976) (e.g., comparing open-ended items and closed-end items. Measuring question ordereffects has been another approach (McFarland, 1981). The difference between male and female response patterns has been especially relevant tothose individuals responsible for constructing questionnaires which areused for performance appraisal.(Landy &Farr, 1980; Rose, 1978; Norton,Gustafson, & Foster, 1977; London & Poplowski, 1976).' Those researchersdeveloping test items for vocational tests have been sensitive to thisissue (Arima, 1980).
Regardl ess )of the content of a survey, educati on and gender are two ofthe most frequently measured variables. In the study of how items are constructed, there is the assumptipn that respondents with more education willbe less effected by the structuring of the item. In addition, the ratingof items by gender may be dependent on the content of the item. Thi s maybe related to the value structure that is embedded in the content of theitem. Schuman and Presser (1981) designed and implemented a study on work
'values using open-ended and closed-end items on two different forms. Theyfound that response pattern by gender produced similar patterns for bothbpen-ended and closed-end forms of questions. Females were more likely toselect the work value "pleasantne~s~" while males were more likely toselect the work value "autonomy." Males selected "security" and "pay" morefrequently on the' open-ended form than on the closed-end form. However,this finding was only significant at the .10 level. The trend to select"securi ty" and "pay" on the open-ended form was not rep1i ca ted in furtherstudi es•.
In an experiment conducted by Smith (1981), response patterns wererelated to general questions and to specific situational questions. Genderand ethnic background were investigated for their influences in responsepatterns. Respondents had difficulty with the general questions which wereambiguous and abstract. The general questions resulted in item ratings
155
,...
that had contradictions in response patterns. Respondents who rated itemsin a contradictory pattern tended to be female, non-white with less educa~
tion. McFarland (1981) was interested in question order effects for bothgender and educa ti on. I twas hypothes i zed tha t general and sped fi c ques- -'j)tions on topic areas would be either diminished or enhanced by placingcontent sped fi c questi onsei ther before or after the general questi ons.McFarland found that there ~as no evidence for question order effect bygender or education. It was suggested that specific questions are lessprone to order effects than,general questions. Perhaps McFarland's generalq'ueslforls were riot'as aostractas the--general que'stionsdevelopedbySmith~
A semantic differential scale was used by Benel and Benel (1976) toinvestigate male/female differences in rating. It was hypothesized thatfemales would rate items' according to social desirability. Their resultsindicated that male-female ratings were consistent. There were no significant differences between ratings by gende~. For the evaluation dimension of the semantic differential {see Section 2.3, Semantic DifferentialScales), differences in gender rating have been attributed to the females'need for social approval. For the dimensions of activity and potency,differences in gender ratings have been attributed to a greater impUlsivityof females. Nei ther of these hypotheses was' supported.
~ :-:. ...The effect of genderdi fferencesi n<response pattern have little '
support. Rating characteristics identi-fiedby gender alone are not enoughto explain rating differences. Other variables, must·be taken into accountas well. When other characteristi csare i ncl uded wi th gender, .such asethnic background and education, there is a greater potential for interactions which influence rating •. Schuman and Presser (1981), McFarland(1981), and Benel and Benel (1976) were not able to attain a level ofsignificance which would attest to .re$ponse patterns by gender.· Smith·(1981) did obtain evi.dence ofaresponse. pattern by gender, but it wascombined withothervar;ables that'i'ncluded ethnic background, lower edu-'cation, lower comprehension, and lower verbal achievement.
Questionnaire construction for items used in performance appraisal hasbeen suspect for di fferences in response patterns by gender. The percep.ti onexists that items may be rated according to sex-role stereotypes. Lan,dyand Farr (1980) reported the work of Schein (1973) where male and femaleraters held common sex-role stereotypes. For example, male and femalemanagers perceived' successful middle-level managers as having common traitsascr;bedtomales~ Rose (1978) examined ratings by gender according toattribution theory. The results of this research indicated that male andfemale raters attributed greater effort and higher ratings to those managers whose subordinates were of the opposite sex.• Findings indicated thatwhen subordinates and managers were of the same sex, their managerialperformance was rated lower. The subjects used in this research were upperdivision. and graduate students enrolled in business courses. Landy andFarr indicated that there needs to be more performance appraisal researchconducted in the actual work environment. Results obtained by Rose wereunusual. When gender differences in ratings do occur, they usually takeplace along the lines of sex-role stereotypes. Male managers tend toreceive higher ratings regardless of the gender of the subordinate (Schein,1973).
156
,I.
()
Norton, Gustafson, and Foster (1977) trained managers using a casestudy method. These managers worked for a pUblic utility company •. Theyconcluded that there were significant differences at the .01 level formeans and variances of ratings for male and female subjects. They found nointeraction effect before or after training, or between sex of rater andsex of ratee. London and Poplowski (1976) obtained conflicting results tothose of Norton et ale Ratings by females were significantly more positivethan ratings by males. The subjects in the London and Poplowski study werestudents. There may be a difference in performance appraisal ratings bystuden ts ·-cOO1p-ar-edwith--i-ndivtdualswho are a-ctually on the job. .Of course, .there are student differences for ratings obtained on vocational-typetests, too (Arima, 1980).
Conclusions ·Regarding Gender
Review of the research. associated with questionnaire construction anddifference in response patterns by gender has received mixed results. Somestudies have found differences in rating by females and males, while otherstudies have not. When researchers analyze their data for interactionswith other demographic characteristics, there is a greater possibility ofidentifying gender as an interacting variable. Common characteristicsfound to interact have been ~ender, education, age, and ethnic background(Schuman & Presser, 1981; Smlth, 1981; Landy & Farr, 1980).
The actual content of an item may elicit rating differences by malesand females. For example, items about the work environment in an opinionsurvey were found to be rated differently at the .10 level of significance(Schuman &Presser, 1981). Arima (1980) found that females taking militaryvocational tests performed more poorly than males. When standardized normswere applied to the females, there was not equi~ in the selection offemales into the more desirable technical courses. Even so, females werefound to be comparable in general cognitive ability. These gender differences in ratings indicate that the content of an item may have thepotential to bias ;-t. There are differences in the values that males andfemales hold. The content of some items is not equally relevant. Therespondent may lack the background and experience required to adequately
. respond to the item. This is illustrated by the differences in vocationalscores where males and females are cognitively comparable. Yet, femalesusually do not have the background experience to adequately respond to theitems. This situation is analogous to the argument over ethnic backgroundand culture-free tests.
To reduce the amount of bias in the content of items, it appears to bebeneficial to use more content specific items (see Section 4.2, Wording ofItems and Tone of Wording). Item content that is general, and possiblyambigous, has been known to produce survey results which are highly questionable. Item content may effect those respondents with less educationmore than other respondents (Smith, 1981). The question order shouldprobably proceed by constructing questionnaires with general questionsfirst, followed by more specific questions. Concrete items are less proneto question order effects (McFarland, 1981) (see Section 4.4, Order ofItems). McFarland found that the strength of order effects did not varyfor gender or age.
157
Questionnaires developed for use as performance appraisal instrumentshave been examined for male-female rating differences. There has beenconcern as to whether raters were rating ratees by stereotypes or by actualbehavior. There has been evidence to support both sides of this issue(Landy & Farr, 1980; Schein, 1973; Rose, 1978; Norton, Gustafson, & Foster,1977; London _& Poplow-ski, 1976). Many studies performed in this area haveused college students as sUbjects. Studies investigating rating by genderfor work environments -might be best performed in "rea l world" work situa-tions instead of in classrooms. -
Questionnaires'which measure differences in rating by gender have beenfound to use almost every possible format known to researchers (Brannon,1981). 'The different formats used to measure gender differences have notall proven ,to· be equally' desirable (see Section 7.1, Questionna.ire Layout).The issues of response style for males and-females, as it relates to format, are no different than the issues of selection Of format for otherkinds of measureinents.··· The question is not whether males or females willbe usi ng : the form; but what is the purpose of the study. For examp le,open-ended questions may be good for an exploratory study regardless ofwhether the respondents are ma~e or fema le. The deve 1opment of sound itemsfollowing appropriate scale development procedures is the best defenseagainstitems'which are susceptible to rating differences by gender. Ifthe investigator suspects differences in rating by males arid. females, thenthe interaction of other characteristics should also be examined •
. ~ ;-. "
:'"
, ~.
158
"'''')1..,
...
-U
.~-----_._------~------- --._------------------
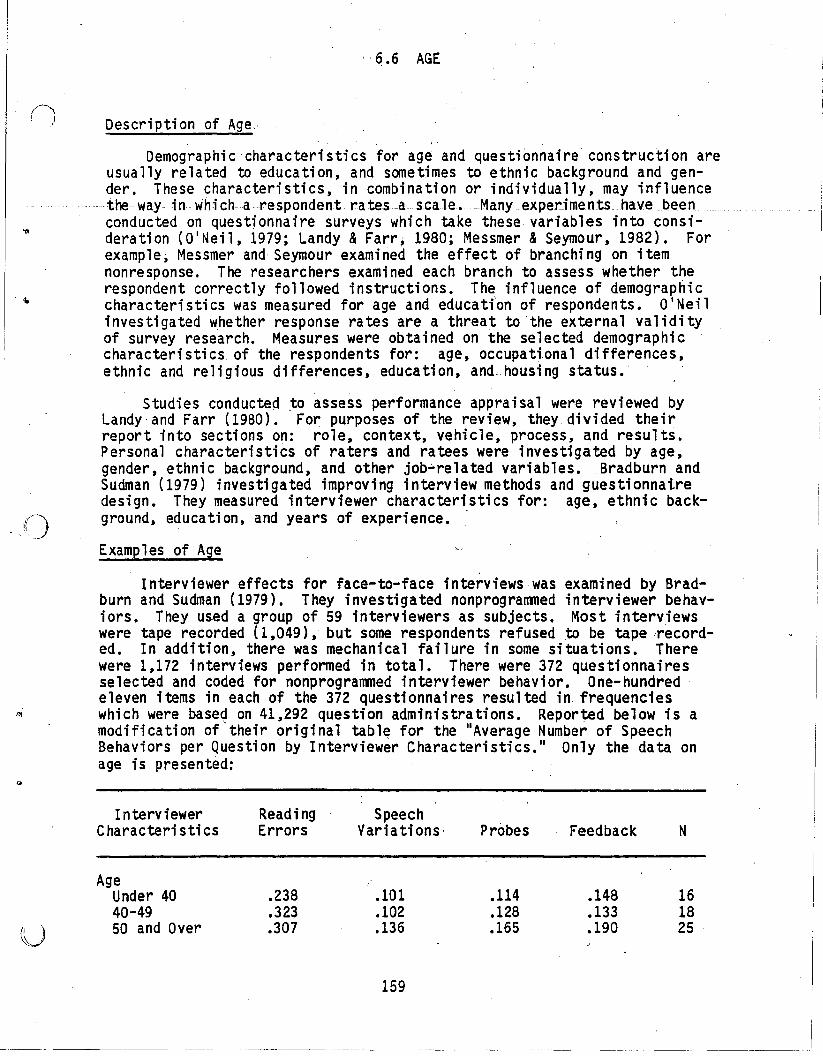
()
'6.6 AGE
Description of Age.
Demographi c characteri sti cs for age and questi onnaire constructi on areusually related to education, and sometimes to ethnic background and gender. These characteristics, in combination or individually, may influence
. the way·in.which a.respondent rates a scale. Manyexper.iments. have_beenconducted on questionnaire surveys which take these variables into consideration (OINeil, 1979; Landy &Farr. 1980; Messmer &Seymour, 1982). Forexample, Messmer and Seymour examined the effect of branching on itemnonresponse. The researchers examined each branch to assess whether therespondent correctly followed instructions. The influence of demographiccharacteristics was measured for age and educatfon of respondents. 0 I Nei 1investigated whether response rates are a threat to 'the external validityof survey research. Measures were obtained on the selected demographiccharacteristics. of the respondents for: age, occupational differences,ethnic and religious differences, education, and, housing status.
Studies conducted ~o assess performance appraisal were reviewed byLandy and Farr (1980). For purposes of the review, they divided theirreport into sections on: role, context, vehicle, process, and results.Personal characteristics of raters and ratees were investigated by age,gender, ethnic background, and other job~related variables. Bradburn andSudman (1979) investigated improving interview methods and guestionnairedesign. They measured interviewer characteristics for: age, ethnic background, education, and years of experience. -
Examples of Age
Interviewer effects for face-to-face interviews was examined by Bradburn and'Sudman (1979). They investigated nonprogrammed interviewer behaviors. They used a group of 59 interviewers as subjects. Most interviewswere tape recorded (1,049), but some respondents refused ..to be tape recorded. In addition, there was mechanical failure in some situations. Therewere 1,172 interviews performed in total. There were 372 questionnairesselected and coded for nonprogrammed interviewer behavior. One-hundredeleven items in each of the 372 questionnaires resulted in frequencies
"', which were based on 41,292 question administrations. Reported below is amodification of 'their original tabl~ for the IIAverage Number of SpeechBehaviors per Questi on by Interviewer Characteri sti cs. II Only the data onage is presented:
InterviewerCharacteri sti cs
AgeUnder 4040-4950 and Over
ReadingErrors
.238
.323
.307
SpeechVariations'
.101
.102
.136
159
Probes
.114
.128
.165
Feedback
.148
.133
.190
N
161825
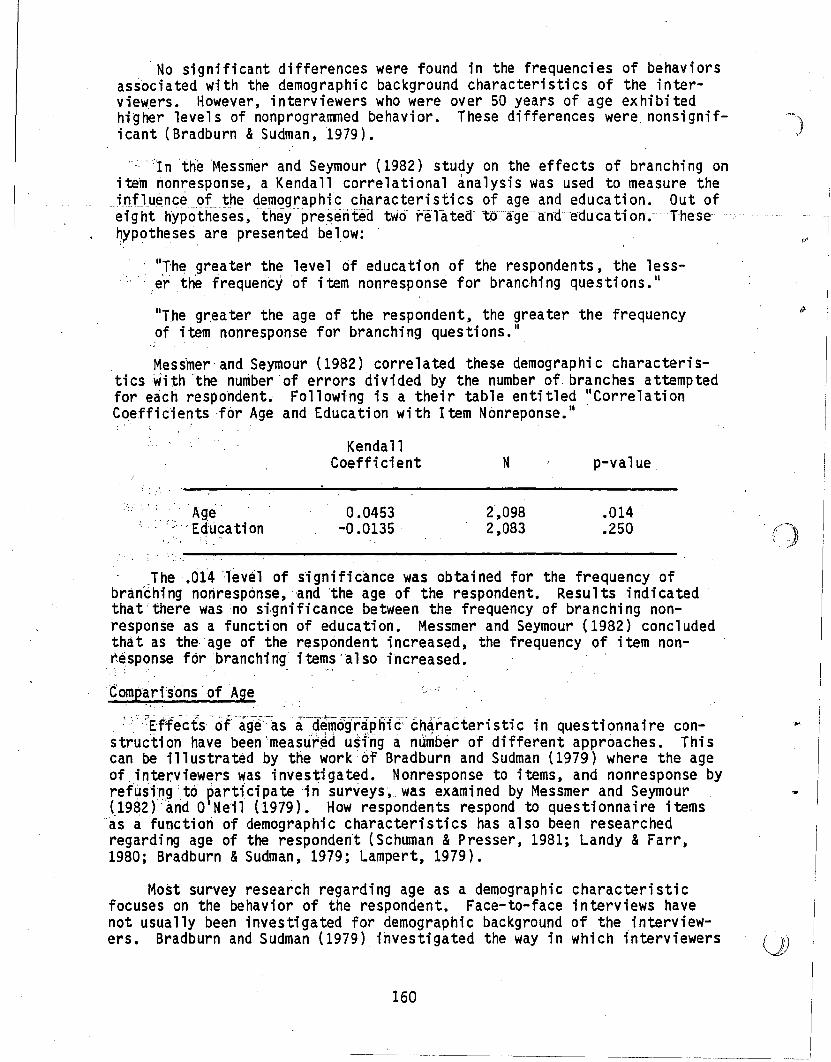
'No significant differences were found in the frequencies of behaviorsassociated wi th the demographi c background characteri sti cs of the i nterviewers. However, interviewers who were over 50 years of age exhibitedhigher levels of nonprogranmed behavior. These differences were, nonsignif- ~'),'
i cant (Bradburn & Sudman, 1979).
"., ':1 n 'the Messnier and Seymour (1982) study on the effects of branchi ng onitem nonresponse, a Kendall correlational analysis was used to measure thejnfluen<:~otthe demographic characteristics ofageandeduca ti on. Out ofeight hypotheses, "they pre.seriteo" tiNc)" reTiftecr wage and education. Thesehypotheses are presented be low::. -. , .
, liThe greater the level of education of the respondents, the less-, er the frequency of item nonresponse for branchi ng questi ons. II
liThe gr,eater the age of the respondent, the greater the frequencyof item nonresponse for branchi ng ques ti ons. II
Messmer and Seymour (1982) correlated these demographic characteris-,ti cswi th "the nuniber' of errors divided by the number of branches attemptedfor each respondent. Following is a their table entitled "CorrelationCoeffic'ients ,for Age and Education with Item Nonreponse."
., .
Age, :' :; ;. EdLica ti on
KendallCoefficient
0.0453-0.0135
N
2',0982,083
p-val ue
.014
.250
,:,.-,---~---------------------
.The.014levEil of significance was obtained for the frequency ofbranching nonresponse,'and 'the age of the respondent. Results indicatedthat there was no s1-gnifi cance between the frequency of branchi ng nonresponse as a function of education. Messmer and Seymour (1982) concludedtha t as the age of the respondent increased, the frequency of item non-
,response for branching items 'al so increased.
C:omp~ri's'ons"of Age
." "Effects -of"a:g-e--as a-a~mog~~pfHC'·cha.racteristic in questionnaire construc'ti on have been 'measuir~d usi'ng a ntimber of different approaches. Thi scan be illustrated by the work of Bradburn and Sudman (1979) where the ageof interviewers was investigated. Nonresponse to items, and nonresponse byrefus'fng to parti'cipa te 'in surveys, was exami ned by Messmer and Seymour(1982) 'arid °Ne'il (1979). How respondents respond to questionnaire items
'as afuncti on of demographic characteri sti cs has also been researchedregarding age of the respondent (Schwnan & Presser, 1981; Landy & Farr,1980; Bradburn &Sudman, 1979; Lampert, 1979).
Most survey research regarding age as a demographic characteristicfocuses on the behavior of the respondent. Face-to-face interviews havenot usually been investigated for demographic background of the ,interviewers. Bradburn and Sudman (1979) iiwestigated the way in which interviewers
160
----~~-"----------
\\11"-
ask respondents questions. They analyzed how often nonprogrammed interviewer behaviors occurred for reading errors, errors in recording, speechvariations, feedback, methods of probes, and failures to probe. Theirfindings indicated that about one-half of all item administrations includedthese nonprograrrmed behaviors. Reading errors were the most prevalent. '.Interviewer characteristics measured were: race (caucasian and black), age(under 40,40-49,50 and over), education (no college, some college,·graduated from college), and interviewing experience (under 1 year, 1-5 years,over 5 years). The national sample consisted of 1,200 adult respondentsand-59 female interviewers. -They found no significantdHferenGesamong-·frequencies of behavior associated with the demographic characteristics ofthe interviewer. Interviewers who are 50 years old or over tended to havehigher levels of nonprogranrned behavior. This was not statistically significant. They suggested that older interviewers were more casual in theirif'lterviewing technique, and they were not as likely to present a standardized survey to the respondent.
Messmer and Seymour (1982) investigated the effect of branching onitem nonresponse for a mail survey. They determined .that branching instructions significantly increased the rate of item nonresponse at the.0057 level for questions that irrmediately followed the branch. Older.'respondents reached a si gni fi cant level· of .014 for item, nonrespons'e,although age for older respondents was never defined. Item· nonresponse wasnot significantly related to other characteristics, such as gender andeducati on.
Most studies for nonresponse rate have been conducted through mailsurveys. In an unusual research design, a telephone survey was conducted
-to measure nonresponse. The adequacy of respo~se rat~ was investigatedusing random digit dialing. To increase response rate ina telephonesurvey, OINeil (1979) used c~llbacks of up to 20 calls for individuals whowere not at home. fndividuals who werenonrespondents on the first callreceived a persuasive letter and were called b~ck again requesting their·incl usi on in the survey. Some of the demographic characteri sti cs i denti- .,fi ed as potenti ally contri buti ng to survey nonresponse were: age, occupation, family income, education, and; race. O'Neilidentified individualswho had a proclivity toward being nonrespondents. They were identified bytheir initial resistance toward being a participant in the survey. Resultsindicated that those individuals who were resistant to participation in thesurvey were 65 years or older and caucasian of Polish descent. German andIrish descendents,had a lesser propensity than Polish-descent respondentstoward survey nonresponse. Subjects who i ni ti ally were nonrespondents hadlower incomes and less education.
Schuman and Presser. (1981) conducted studies with formalh;~balanced.items. Opinion questionn~ire items were fonnally balanced by pre~enting
two sides of an issue written in parallel language•. Following is an illus-tration o~ af0l"!Jlally-balanced question: . '
"Some people thi nk the use of mari juana should be made legal.Other people think marijuana use should not be made legal. Whic~
do you favor?"
161
Effects of age, education, personal information, interest, sex, andrace were measured. They were not found to be significant. Backgroundcharacteri s,ti cs of respondents is often mea,sured in survey research for theway individuals respond to different survey instruments, and the way theyrespond to different items. Lampert (1979) developed, a new attitude scaling device called the Attitude Pollim,eter which is a continuous scale. TheAttitude Pollimeter was compared to a verbal scale, a numerical scale, anda ,bipolar scale. Lampert obtained background characteristic measures onage, sex, and education. This was to determine whether these character-is tics"-would- -affect the-respondent'sabHity-to 'use-thedifferentscales~
Education waS the only variable that differentiated among subjects. Educational l~vel was significant at the .0001 lev~l. In this particular study~the background characteristjcs of age and sex apparently did not influencethe ability to' use the different scales. This study used a random sampleselected from a list of eligible voters. It is assumed that the age variedwidelY,but age categories were not provided in the report.
Research on performance ratings was reviewed by Landy and Farr (1980).They reported ,findings on demographic characteristics for ages of rater andratee, and other variables. Performance ratings as a function of ages ofrater and' ratee for full-time employees, and part-time employees, did notreach lev~Js 'of significance (reported by Landy & Farr, 1980) in researchconducted'bY,Klores (1966) and Bass and Turner (1973). No significant cor~
relation was'f9und between ratings for black full-time employees and age(Bass & Turner ~ 1973 as ci ted by Landy & Farr, 1980).
C6n6i~si~nsR~garding ~ge :
N'6nrespoflse assQtiated wi th branchi ng and/or surveys has been i nfl uenced more by older subjects according to the studies reviewed. HOwever"most surv~y items do not appear ,to beihfluenced by ratings from a particular group. How groups of indivlduals rate'an item,probably interacts withmore than one demographic characteristic, but not in all circumstances.'
When response alternatives are influenced by the age of the respondent, the content of the item may possibly be related to the historicalperspective of the different cohort group. The rating of response alternatives by cohort group was illustrated by the work of Bradburn and Sudman(1979). They asked respondents about their use of marijuana and alcohol.
'They found;'that'the mean age for respondents who had tried marijuana was 29yea'rs-.-T~he-me'an""a·ge~fbr-re"sp·~hdents·-wno.;'ha:adrunk alcohol in the past yearwas 41 yea'rs old. 'There appears to be historical-cultural differences foreach group of cohorts in our society. This age perspective was reflectedtoward the use of alcohol and marijuana by these respondents.
Nonresponse to an entire survey, or to specific items in a survey,remains a threat to the validity of the research results. OINeil (1979)and Messmer and Seymour (1982) designed experiments to focus on nonresponse. They sought to identify background characteri sti cs of respondents which would influence nonresponse behavior. In both studies, age wasa variable which influenced nonresponse: nonresponse for participation ina telephone survey, and nonresponse for answering items following branching. Age was' the only characteristic which was found to influence itemnonresponse following a branch. Nonresponse for survey participation was
162
ct'
I-
----- -------------~._-- -------~--_.~~-----_..~~~~~~'
t)..-....
q
o
related to age, as well as other variables, on a telephone survey. Research on item nonresponse has traditionally been focused on the backgroundcharacteristics of the respondents, the application of the instrument, andthe design of the ins trumenti tself.' The research performed by Messmer and'Seymour was supported by previous findings. They reported on the work ofFerber (1966) and Craig'and McCann (1978), where the age of the respondentwas 'related to nonresponse. Nonresponse behavior increased as age in-creased above about 60 years. "'''.~,.. " "
. . . .
Agehas-been.es-tablishectas.a. characterJstic-whi ch mayinfJ uenceitemnonresponse and survey nonresponse. Research performed on survey nonresponse has been limited. It is difficult to develop experimental designsthat measure survey nonresponse. Further research is required in the areasof survey nonresponse arid item nonresponse for the background ,characteri s-tic of age. ' "
Demographic characteristics have been measured for item form and scaleformat differences. No significant differences were found for age-relatedresponses to formally-balanced items. There were no significant ~iffer
ences for age-related response for the ability to use different scale types(Schuman &Presser, 1981; Lampert, 1979). Bradburn and Sudman(1979) didobserve that, in same instances, item cQntent may'influence age-relatedresponses by cohorts. Although the research was limited, performance,ra ti ngs did not appear to be i nfl uenced becau..se of the age of the ,rater, orratee (Landy &Farr, 1980; Klores~ 1966~ Bass &T~rner, 1973). '
Most research that takes into account the demographic characteristic~
of the sample is not psychometrically concerned with the influence of aninterviewer when a survey incorpora'tes interviews as part of the suryeydesign. Bradburn and Sudman (l979) determined that older interviewers hadmore' nonprogrammed behavior that younger interviewers. Further research onthe nonprogrammed behavior of interviewers, wouiCi need' to be conducted 'inorder to confi rm thi s fi nd i ng. ' '
.' ;
( ..
r
r163
I,J
)
)
CHAPTER VII .
QUESTIONNAIRE FORMAT
Questionnaire formats have been compared for a wide variety of physical layouts and different types of scales. This chapter reviews questionnaire formats that have been used in such diverse fields as the military,m·arke·ting;····andeducation.
Branching is one aspect of a questionnaire format that can reduce theamount of time it takes to complete a survey. When this type of format isused, it is imperative that the branching instructions be clear. There isthe potential for branching to increase item nonresponse for items following a branch. This phenomenon appears to be associated with older (e.g.;60 years) respondents~ Branching may also be a useful tool for researcherswho believe that their ordering of items has influenced the response distribution. This is a common occurrence where respondents are educated inthe topic area by the items themselves. If this is suspected, it would bepossible to design a study where there were two questionnaires. They wouldboth have identical items, with the exception that one questionnaire wouldinclude branching and the other questionnaire would not. In this way, thestimulus value of the questions could be compared on the two versions ofthe questionnaire.
Other questionnaire layout. variations have focused on the amount ofstructuring for items, responses, and simUlation on forms. In experiments'with Navy personnel for a behavioral observation form, it was found that astasks became more complex, semi structured forms were best. Less comp1extasks were best rated using highly-structured formats.
Clari~ in the layout of a questionnaire is critical since respondentsmay inadvertently rate an item which they did not mean to select. This maybe even more important for respondents who have a low level of education.Education and preference for scale and format have been found to interact.No one format can be purported to be consi stently better than any otherformat. . .
165
._~_._-_.- ---------_._----
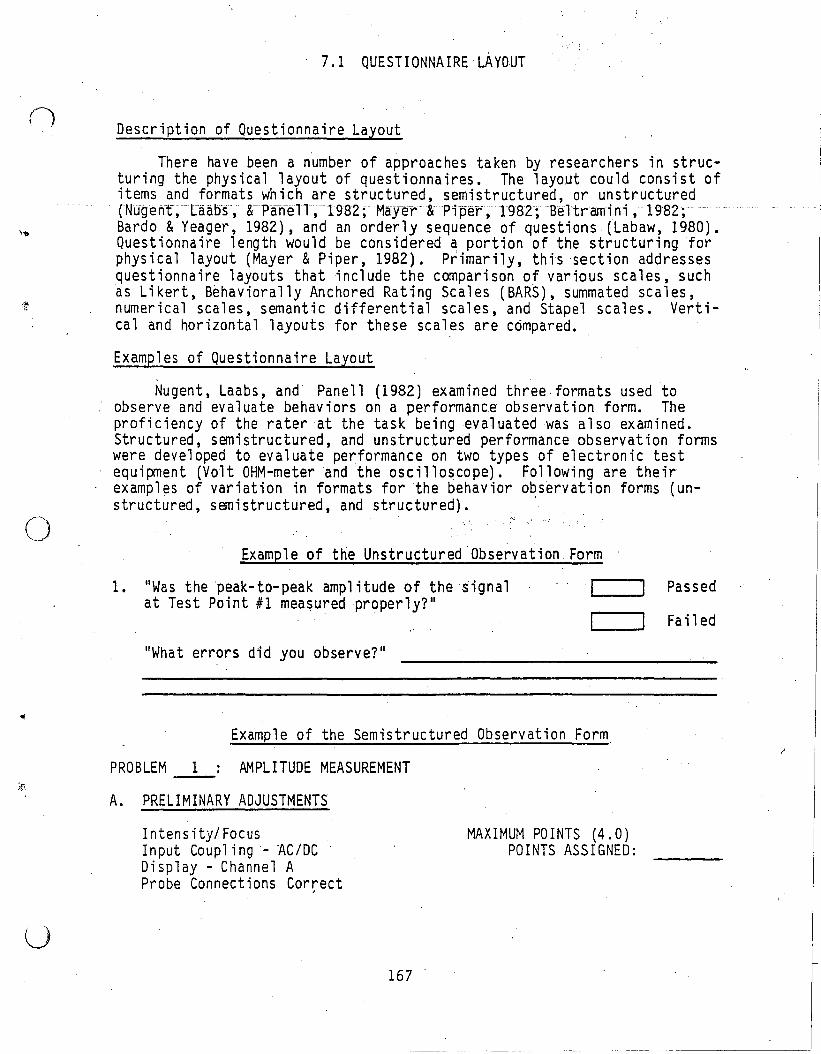
7.1 QUE STI ONNA IRE LA YOUT
Description of Questionnaire Layout
There have been a number of approaches taken by researchers in structuring the physical layout of questionnaires. The layout could consist ofitems and formats which are structured, semistructured, or unstructuredCNUgent,-Caabs-,-&PahEH1;---198Z;-Ma.y-er--1t·-Piper; T982;Beltramini,1982;Bardo &Yeager, 1982), and an orderly sequence of questions (Labaw, 1980).Questionnaire length would be considered a portion of the structuring forphysical layout (Mayer &Piper, 1982). Primarily, thts section addressesquestionnaire layouts that include the comparison _of various scales, suchas Likert, Behaviorally Anchored Rating Scales (BARS), summated scales,numerical scales, semantic differential scales, and Stapel scales. Vertical and horizontal layouts for these scales are c6mpared.
Examples of Questionnaire Layout
Nugent, Laabs, and Panell (1982) examined three·formats used toobserve and evaluate behaviors on a performanc.e· observation form. Theproficiency of the rater at the task being evaluated was also examined.Structured, semistructured, and unstructured performance observation formswere developed to evaluate performance on two types of electronic testequip:nent (Volt OHM-meter and the oscilloscope). Following are theirexamples of variation in formats for the behavior obs~rvation forms (unstructured, semistructured, and structured).
()
oExample of the Unstructured Observation Form
1. "Was thepeak-to-peak amplitude of the signalat Test Point #1 measured properly?"
"What errors did you observe?"
Example of the Semistructured Observation Form
Passed
Failed
PROBLEM 1 AMPLITUDE MEASUREMENT
u
A. PRELIMINARY ADJUSTMENTS
Intensity/FocusInput Coupling- AC/DCDisplay - Channel AProbe Connections Correct
167
MAXIMUM POINTS (4.0)POINTS ASSIGNED:
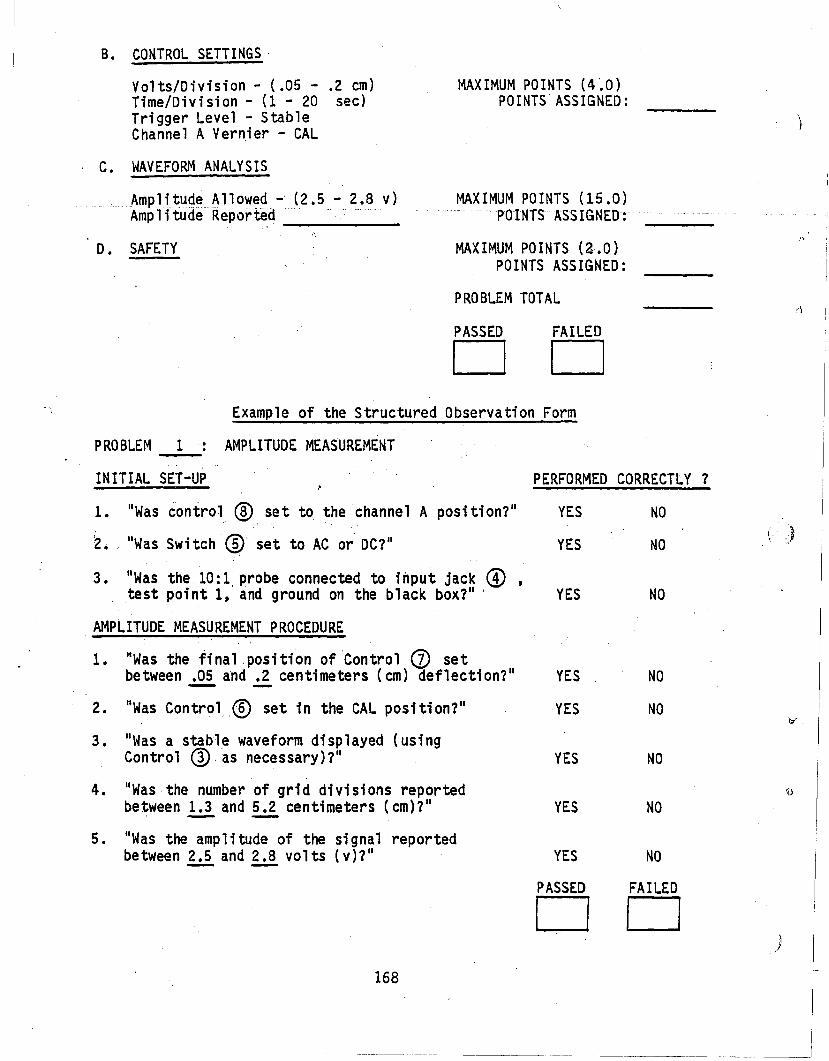
B. CONTROL SETTINGS,
Volts/Division - (.05 - .2 em)Time/Division - (1 - 20 sec)Trigger Level - StableChannel A Vernier - CAL
C. WAVEFORM ANALYSIS
Amp1JtU<:1(!A11 owed - (2.5 - 2. 8 v)Amplitude Reported ------
D. SAFETY
MAXIMUM POINTS (4~0)
POINTS ASSIGNED:
MAXIMUM POINTS (15.0)POINTS·· ASSIGNED:
MAXIMUM POINTS (2.0)POINTS ASSIGNED:
PRO BLEM TOTAL
, )
PASSEDo FAILED
oExample of the Structured Observation Form
PROBLEM 1 : AMPLITUDE MEASUREMENT
INITIAL SET-UP PERFORMED CORRECTLY?
1. "Was control ® set to the channel A position?"
2. ' "Was Swi tch '(§)' set to AC or' DC?II
3. "Was the 10:1,probe connected to input jack ®, test point 1, and ground on the black box?" ,
AMPLITUDE MEASUREMENT PROCEDURE
1. "Was the final ,position of Control (J) setbetween .05 and .2 centimeters (em) deflection?1I
2. "Was Control ® set in the CAL posi ti on?"
3. "Was a stab'l,e waveform displayed (usingControl @,as necessary)?"
4. "Was the number of grid divisions reportedbetween 1.3 and 5.2 centimeters {cm)?11- -
5. IIWas the amp 1i tude of the si gna1 reportedbetween 2.5 and 2.8 volts (v)?"
168
YES
YES
YES
NO
NO
NO
( )
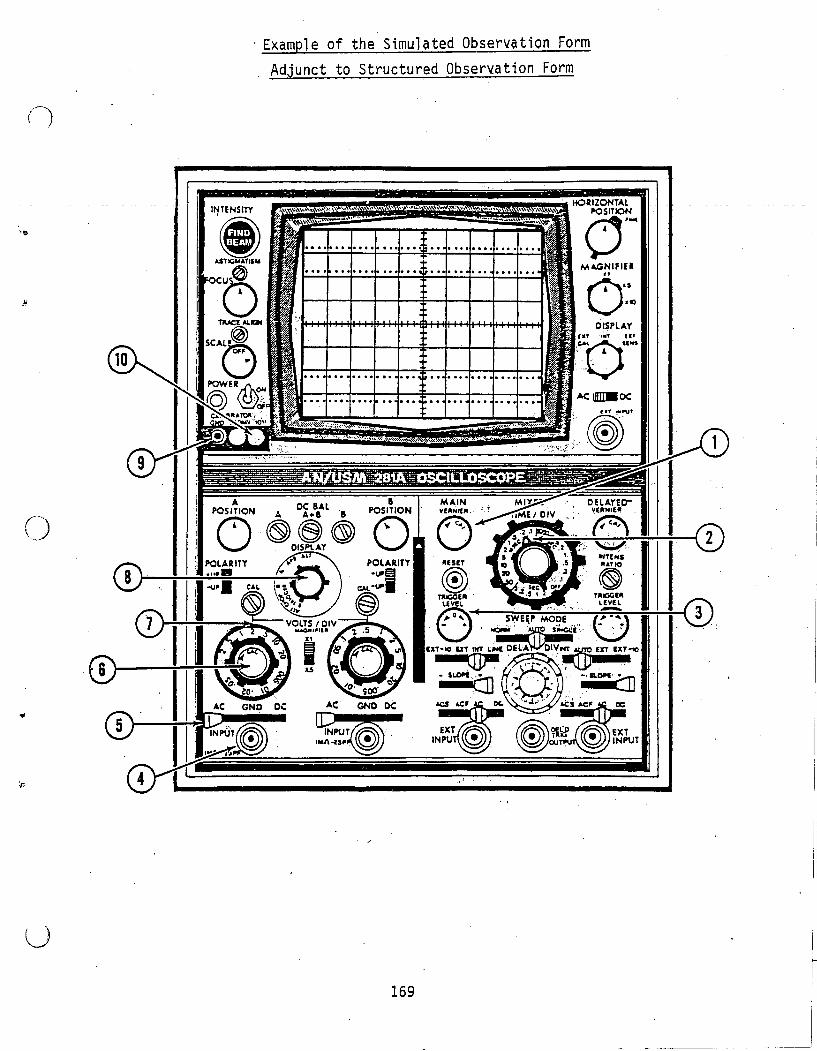
()
Example of the Simulated Observation FormAdjunct to Structured Observation Form
(~,.J
u
..."t....,:'/, ".litl: :'.j '''.'
At GND DC
169
.. HORIZONTAl
MAGNIFIER11
OIS
IC)
AC IJIIIII DC
. I
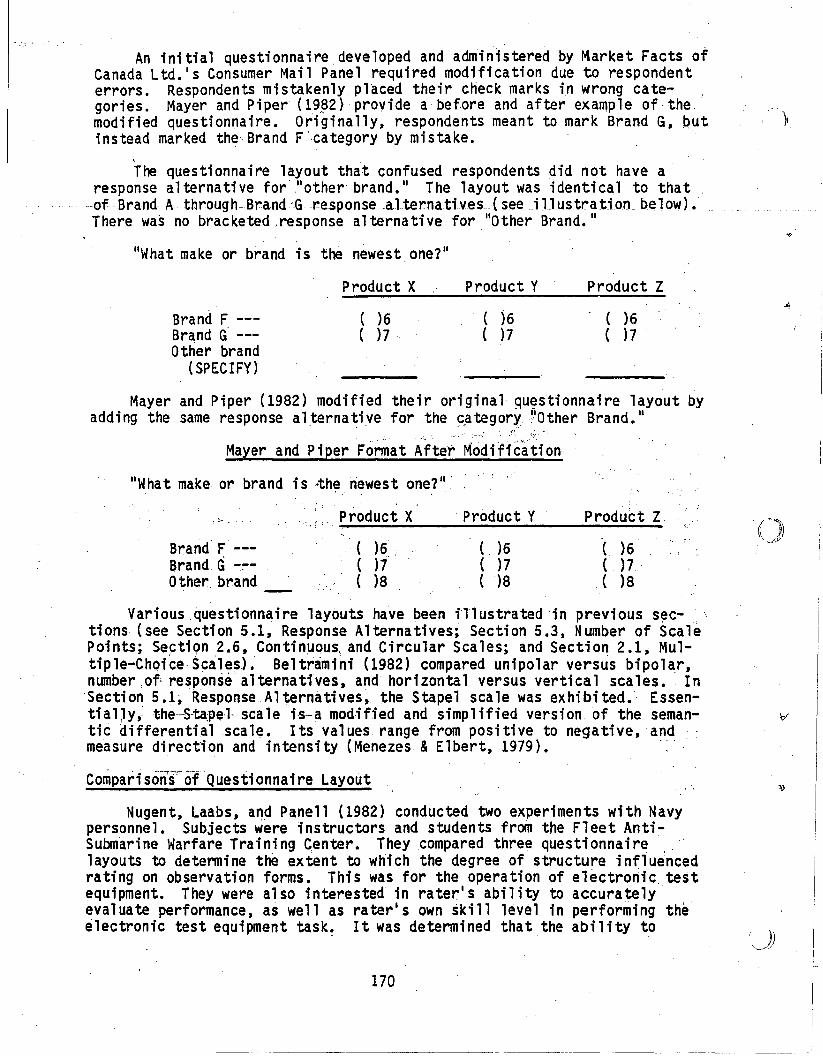
An initial questionnairedeveloped and administered by Market Facts ofCanada Ltd.ls Consumer Mail Panel required modification due to respondenterrors. Respondents mistakenly placed their check marks in wrong cate- ,goriest Mayer and Piper (19?2) provide a before and after example of the,modified questionnaire. Originally, respondents meant to mark Brand G, put ')1instead marked the Brand F ',category by mistake.
The questionnaire layout that confused respondents did not have aresponse alternative for "other' brand. II The layout was identical to that
... of Brand·· AthroughBrand'Gl"esponsealternatives (see;lJ ustrati on .. below).There was no bracketed ,response al ternative for "0ther Brand. II
"What make or brand is the newest one?"
Brand F --Brand G' --Other brand
(SPECIFY)
Product X
( )6( )7"
Product Y
( )6( )7
Product Z
( )6( )7
Mayer and Piper (1982) modified their original qu~stionnaire layout byadding the same response alternative for ,thec:a.tegor.),'~!OtherBrand. II
Mayer and Piper 'Fanna t After Mod ifi ca ti on
"What make or brand is ~he riewest one?".
~- . . Product X Product Y Product Z··;l
"
Brand F --- ( )6 " ( )6 ( )6BrandG -:~- (
" :( )7 ( )7)7
Other. brand ( )8 ( )8 ( )8
Various questionnaire layouts have been illustrated 'in previous sec- ,tions (see Section 5.1, Response Alternatives; Section 5.3, Number of ScalePoints; Se~ti9n 2.6~ Contin~ou~ and Circular Scales; and Section 2.1. Multiple-Choice Scales). Beltrami"i (1982) compared unipolar versus bipolar,number ,of re~ponse alternatives, and horizontal versus vertical scales. ' In
'Section 5.1, Response Alternatives, the Stapel scale was exhibited. EssentialJy.the-S-ta:pe-l-·scaleis-,a mod,ified and simplified version of the semantic differential scale. Its values range from positive to negative, andmeasure direction and intensity (Menezes &Elbert, 1979).
Comparisor,rs"of Questionnaire Layout
Nugent, Laabs, and Panell (1982) conducted two experiments wi th Navypersonnel. Subjects were instructors and students from the Fleet AntiSubmarine Warfare Training Center. They compared three questionnaire',layouts to detennine the extent to which the degree of structure influencedrating on observation forms. This was for the operation of electronic. testequipment. They were also interested in rater's abil ity to accurately·evaluate performance, as well as rater's own skill level in performing theelectronic test equipment task. It was detennined that the ability to
170
...._--_..._---
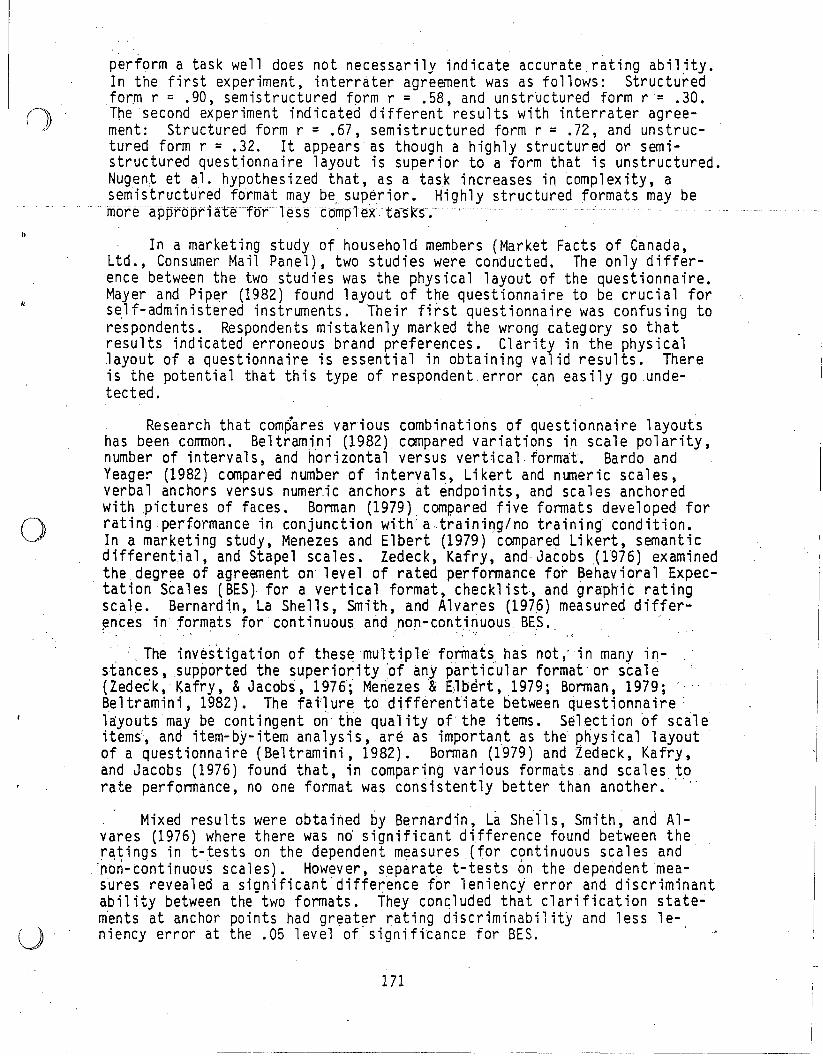
I>
o
perform a task well does not necessarily indicate accurate rating ability.Iri the first experiment, interra ter agreement was as follows: Structured
form r = .90, semistructured form r = .58, and unstructured form r'= .30.The second experiment indicated different results with interrater agreement: Structured form r = .67, semistructured form r = .72, and unstructured form r = .32. It appears as though a highly structured or semistructured questionnaire layout is superior to a form that is unstructured.Nugent et aL hypothesized that, as a task increases in complexity, asemistructured format may be. superior. Highly structured formats may bemore' approprialefotless c6mp'-ex~ta-Sks.
In a marketing study of household members (Market Facts of Canada,Ltd., Consumer Mail Panel), two studies were conducted. The only difference between the two studies was the physical layout of the questionnaire.Mayer and Piper (1982) found layout of the questionnaire to be crucial fors~lf-administered instruments. Their first questionnaire was confusing torespondents. Respondents mistakenly marked the wrong category so thatresults indicated erroneous brand preferences. Clarity in the physicallayout of a questionnaire is essential in obtaining valid results. Thereis the potential that this type of respondent, error can easily go unde-tected. '
Research that compares various combinations of questionnaire layoutshas been corrrnon. Beltramini (1982) compared variations in scale polarity,number of intervals, and horizontal versus vertica110rmat. Bardo andYeager (1982) compared number of intervals, Likert and numeric scales,verbal anchors versus nume~ic anchors at endpoints, and scales anchoredwith ,pictures of faces. Borman (1979). compared five formats developed forrating performance in conjunction with a-traini~g/no training condition.In a marketing study, Menezes and Elbert (1979) compared Likert, semanticdifferential, and Stapel scales. Zedeck, Kafry, and-Ja~obs(1~76) examinedthe degree of agreement on 1evel of rated performance for Behav iora1 Expectation Scales (BES) for a vertical format, checklist., andgraph"it ratingscal~. Bernardin, La Shells, Smith, and Alvares (1976) measured differ!=nces in formats for continuous and non-cont.inuous BES .
. ,';
., The inves'tigation of these mUltiple formats has not,' in many insian~es, supported the superio~ity ~~ any p~rti~~lar format or scale(Zedeck,Kafry, & Jacobs, 1976'; Meneies& E)lbert, 1979; Borman, 1979;Beltramini, 1982). The fan ure to differentiate between questionnaire ,'ayouts may be cont i ngent on the qua1i ty of the items. Sel.ect i on 'of scal eitem~, and item-by-item analysis, are as important as the. physical layoutof a questionnaire (Beltramini, 1982). Borman (1979) andZedeck, Kafry,and Jacobs (1976) found that, in comparing various formats and scales. ,t,orate performance, no one format was consistently better than another. .',
Mixed results were obtained by Bernardin, La She';ls,Smith, and Alvares (1976) where there was n6 significant difference found between ther~~ings in t-tests on the dependent measures (for c9ntinuous scales and'non-continuous scales). However, separate t-tests on the dependent measures revealed a significant difference for leniency error and discriminantability between the two formats. They concluded that clarification statem'ents at anchor points had grl;!ater rating discriminabil ity and less le-C-) niency error at the .05 level of' significance for BES.
171
- - _.--.- -'----------------------
Bardo and Yeager (1982) observed significant variations among theformats they tested. They found that. regardless of the number of intervals. Likert formats were consistently affected by response set. They
. defined response set as a psychometric measure where estimates of rel iability are inflated. and are a source of systematic error. Systematicerror is a potential problem for researchers where respondents consistentlyuse a response set. Respondents tended to rate Likert formats somewhathigher when they were labeled with anchors "strongly agree ll to "stronglydisagree. II There was an indication that increasing the number of scalelntervals····ab·ove·five··ma.y ····fricrease··th-e· -effects ··of·re·sponse·set~ltwas·
suggested that random:lyinverting the order of presentation of item andresponse a1terna ti ve may be useful to reduce response set effects.
Another approach to comparing formats was taken by Layne and Thompson(1981). They questioned whether respondents would react to the number ofitems or to the number of pages in a questionnaire using a Likert-typeresponse format. It was concluded that when 30 items were used. the numberof pages in which they were displayed (lor 3) made no difference. Thereturn rate for this study was only 27.75~ even with a follow-up letter.The use of a follow-up letter did not meaningfully increase the responserate.
Conclusions Regarding Questionnaire Layout
Research on questionnaire layout applied to performance evaluation.marketing. and educationr~vealed that no one questionnaire layout wassuperior to another. Evidence supporting anyone layout was sparse andinconsistent. Each questionnaire layout appears to have its own strengthsand weaknesses. No onequesti onnaire layout was consistently better or
.worse than another.' .
There is some evidence from the research of Nugent; Laabs. and Panell(1982) and Mayer and Piper (1982) that physical layout and degree of structuring for questions and format may elicit· different results. Emphasisneeds to be focused on a layout that is clear to respondents. Layoutshould support respondents in making ~ccurate responses to the intendedcategories.
. (
172 .
.._-- ....._...--_..- ..__._----._--
();...-:::
,1,,I )
''D
C)
u
7.2 BRANCHING
Description of Branching
In the design of a questionnaire, it may not be feasible or desirableto have every respondent answer all questions. The information requestedniay not be applicable to all respondents. The approach used to guideresporidents'throughaquestionnairetoappropria-tequestions,but not .necessarily all of the questions, has been identified differently by manyresearchers. Multiple terms used for such identifications have been: .branching, leading, routing, filter questions, and screen questions (Messmer & Seymour, 1982; Labaw, 1982; Backstrom & Hurchur-Cesar, 1981).
Screen or filter questions are used to determine how respondents areto be routed through the questionnaire. Some respondents are reta'inedthrough a sequence of questions, while other respondents move ahead and areeliminated from a set of questions (Backstrom &Hurchur-Ceasar, 1981).Branching requires sets of questions that are integrated instead of questions that would stand alone. Questions are established which will leadthe respondent to appropriate subgroups of questions (Labaw, 1982).
Depending on the research design, it is possible to' obtain, data onbranching and nonbranching conditions. One group of respondents receivesthe branching questionnaire condition, and the second group of respondentsreceives the questionnaire with no branching. This re.search, design is .sometimes used to compare the responses of individuals who 'are .knowledge';'able on a SUbject, and those individual s who are not know,ledgeable on asubject (Backstrom & Hurchur-Cesar, 1981). This may give some, indicationof how much a respondent is learning from the questions themselves, and howthe content of a question may be influencing the response to subsequentquestions. A second survey could be conducted for those respondents whoare found to be knowledgable on a SUbject. It is possible 'that the branching questionnaire could be used in lieu of a second questionnaire byfiltering and leading some respondents to more in-depth types of ,items. Theresponses to branching questionnaires can be compared to the responses tononbranching questionnaires. The comparison of these two types of questionnaires may assist the researcher in identifying items that requireconcise wordi'ng which is easy to understand. Branching questionnairesshould be pretested for clarification and understanding by respondents.
Examples of Branching
Bradburn and Sudman (1979) constructed a questionnaire for a Chicagocommunit¥ study. They measured the main services that the city provided,such as the quality of public schools, library and recreation facilities,police protection, and garbage collection. Following is an example of howthey used branching with questions pertaining to voting and transportation:
16. "What part of the day do you usually find most convenient to. vote - before 9 a.m., between 9 a.m. and noon, between noon
and 5 p.m., or after 5 p.m.7"IF NEVER VOTED, SKIP TO Q. 19.
173
ASK EVERYONE:19. "Transportation and traffic congestion are two of the major
problems of cities today. In general, would·You rate Chicago's pUblic transportation system good, fair, or poor?'
20. Is the, traffic noise where you live loud enough to botheryouc~h~n you are inside, or is it not a problem?
21. Do you thi nk that the Chi cago Pol i ce Department does a good,fair, or poor job of controlling traffic?
22. Have you··driven a car in Chicago in the last three years?IFNO,SKIP TO Q.29.11
In a draft questionnaire developed by Labaw (1982), branching was 'usedfor questions constructed- to mea·sure issues related to wills and estates.Respondents were asked whether they had a wi 11. Depending on thei.r answer(yes or no), they were branched to other appropriate questions. The nextquestion at the branch requested information as to the reasons they had forwri ti ng a will.
Comparisons of'Branching
In research performed by.Messmer and Seymour (1982), the effect ofbranching on item nonresponse was investigated. Initially 4,956 adultSUbjects received questionnaires, and 2,114 subjects submitted usablequestionnaires for analysis. The instrument consisted of 60. items w,;th 10branching opportunities. Nonresponse rate increased when branching was 'required. This finding was significant at the .05 level. Education levelwas not found to influence nonresponses to items associated with branching.They did determine that as the age of respondents increased above approximately 60 years, so did the proportion of item nonresponse. These findingsindicate that branching has the potential to increase item nonresponserates among older respondents.
Conclusions 'Regardfng 'Branchtng
Branching is used for questionnaires that are administered throughmail, interviews (face-to-face and telephone), and group administration.Researchers need to be careful in their selection of branching. It can beuseful. for reducing questionnaire completion time and/or interview time.Therefore, branching may be cost effective. Cost effectiveness associatedwith branching is greatest for questionnaires used in interviews. Branchi ngis-no-t-e.f-fec-t.i-ve-in-obtaini ng a 100 -percent response rate on all itemsfrom group-administered questionnaires or from mailed questionnaires.Questionnaires which incorporate branching, and are mailed out or receive agroup administration, may have a shortfall great enough so that investigators need to have a very good reason to employ this technique.
There are a1terna ti ves .to branchi ng, such as the desi gn of differentquestionnaire packages for the different categories of respondents. Anillustration of this approach was used in the Army Research Institute1stest of the Bradley Fighting Vehicle. Four separate questionnaires weredesigned: one for the driver, one for the track commander, one for thegunner, and one for the remaining personnel.
174
'II!!'
--_._-- -.-------'_._--- -------_._----~._--_.-'---~-------------_.'
In situations where the respondents are being interviewed, clearbranching instructions are required for the interviewer to make smoothtransitions between branches, and to eliminate the potential for a choppy
(~). interview. When questionnaires are mailed, branching appears to increase, ,i) the frequency of nonresponses. This is especially pronounced for older
respondents. Items immediately following a branch seem to have an increased rate' of nonresponse. 'This may be due to branching instructions.
'\II
()"\. .
, ,
u175
CHAPTER VIII
FUTURE RESEARCH-)
Introducti on
.This chapter .focuses.on.rec()l1Jl1endati ons. for futureresearchwhi chwerederived by combining information shortfalls identified from the! If'teratarereviews in Chapters II through VII with emerging measurement and computerbased technologies. Background issues in questionnaire research are summarized first to provide a backdrop for the recommendatjons. Emergingtechnologies are then summarized to highlight candidate means for improvingboth the efficiency and effectiveness of questionnaire design and administration for Army Operational Test and Evaluation (OT&E). Higher priorityresearch recommendations are then presented. These are areas wh~re research is expected to produce the most meaningful and timely benefits forArmy OT&E. Additional research recommendations are presented in AppendixD. .
Background Issues
Results from the experiments reviewed in Chapters I through VII arenot in all instances directly applicable for military use without furtherinvestigation. For example, even though some of the experiments usedmilitary personnel as subjects, the preponderance of,.e~periments used stu~ents
from universities and colleges. I~"most instances, there has been a lack(-~) of replication across studies. There has also been a lack of consensus as
-_../ to scale: selection, developmerttal procedures, quantitative analysis, andresponse characteristics.
One of the reasons that the field of questionnaire construction research has so many inconclusive results is that there has been a paucity ofsustained research. Methodological considerations for questionnaire con~
struction require a comprehensive series of experiments. Methodologicalunderstanding of questionnaire construction must have continuing researchinstead of. fragmentary research. Tacking questionnaire research on toother studies, ,to investigate occasional methodological issues relegatesquestionnaire construction issues to a continuing status of inconclusiveevidence.
Questionnaire construction research has not progressed evenly acrossprofessional fields. In the political arena, social psychologists, pol1-
~ tical sociologists, and political scientists seek reliable estimates ofconceptually valid attitudes in national surveys. To establish demographicand other strong correlates of expressed opinions, great rigor in questionnaire construction is used. Marketing is another area where attitudes,preferences, and perceptions must be reliably estimated by marketing re-
. searchers who use computers as a key tool. However, this has not been thecase for OT &E.
'U
177
Emerging Relevant Technologies
In 'the past few years, computer technologies have had a marked impacton many areas', including information gathering. Previously in questionnaire research, computers were used largely to grade standardized forms,and to collect and analyze experimental data. The role of the computer ischanging in the military, as well as in private and other public sectors ofsociety. The impact of computers in transforming questionnaire construc-
. tion,admjn;stration,andscoring is probably attributed primarily toeconomics. Microprocessor, accessory and software costs have c'ontlhUedtodecline (Koenig'; 1983; Matarazzo, 1983; Space, 1981). Combining this trendwith efficiencies that can result from computer utilization makes theapplication of computers to questionnaire research, development and appli,;"cation quite attractive.' '
Computers have brought' about many meaningful changes for questionnaireconstruction in the health sciences. Physicians, psychologists, and psy":'chiatrists now use structured interviews that are performed by computers.Computerized behavioral assessment instruments are being used to screen forproblems such as drugs and/or alcohol abuse~ and the potential for suicide.Psychological data also are being collected by computer which may be used'in diagnosing certain disorders~ For example, Space (1981) reported thework of Glaser and Collen (1972) where they' selected interview questionsusing theBayesian approach (computer adaptive testing) in the diagnosis ofdiabetes.' '
Much of the emphasis on computer testing has come from the Navy Personnel Research and Development Center where they have been. researching acompute'fiied'versl0n'oftheArmed Services Vocational Apti,tude Battery.The Pentagon's p'lan is to administer these tests at computer 'terminals, andto expand this computer testing capability so that eventually there may beup to lO,OOO'computerterminalsavailablefortesting by 1986 (Koenig,'1983). -:,', ,":, ' ' ",' ,
Adaptive testing is being investigated by the armed servi ces (Warm,1978). ,The :Armed Services Vocational Aptitude Battery is being developedfor computer-adaptive testing, by the ,Navy Personnel Research' and Develop-'ment Center (Koeni g, 1983) • :. Thi s type, of questi onnaire desi go also uses aBayesfan model 'as a foundation. Each time a question is asked', there is arec~l~Yl~1:.tQn Qfprobabilities so that the next item selected is based onthesubject's response to the previous item. This allows for estimatingthe respondent's future performance level as a way to select the next item.Th~ items are administered on a computer, and each respondent receives adffferentset of questions (Trollip &Anderson, 1982). Computer-adaptive,testi ng hasal so been known as adaptive testi ng, tai lored testi n9, stradaptivetesting~'f"exlleveitesting, item response ~heory, characteristic'curve 'theory" and 1a ten t trait theory. To the fi e1d of ques ti onna i reconstruction, adaptive testi~g has probably been the greatest breakthroughin the app1icationof· computers so far. Thomas Warm (1978) of the U.S.:Ooast Guard Institute states that IIItem Response Theory (IRT) is the most'significant development in psychometrics in many years. It is, perhaps, topsychometrics what Einstein's relativity theory is to physics. II
178
LJ.,)
---
(\, J.,-'
u
Adaptive testing requires a large sample for its development. Warm(1978) reports that Frederick M. Lord, Educational Testing Service, used asample size of over 100,000 subjects in 1965. It has been primarily usedas an'abili~ test with mUltiple choice questions. There have been othertypes of applications such as interviewing subjects for diagnosis ofdia-:betes. The armed forces are a leader in adaptive testing. Even so, cur~
rently this model does not appe'ar to be viable for OT&E because of~~~e.,F'<il,lt'large samples, and the lead time for development. ,::'"
'ThiS does notmeahthatthe're' are n'otmanycreati-ve" uses for computersin OT&E. For example, pilot workload has been assessed using th.~ Subjec-ti ve Workload Assessment Techni que (SWAT) (Shi ngledeckerT 1983). SWAT is, "based on additive conjoint measurement methodology where ordinal ratings"are obtained on variables (time load, mental effort load, and stress load)which are associated with the pilots' sUbjective feelings of workload. Theordinal ratings are combined into a one-dimensional s,cale that has intervalproperties. The ability to derive interval level data from ordinal leve.ldata is a major advantage of conjoint measurement. SWAT, is, being refinedand validated for g~neral applicability. This is especially, importantsi nce the development of subjecti ve measures has usuallY,b~en si tuationallyspecific. In mi;lny flight tests or OT&Es, the sUbjectiy~ ,I11~~,sures have beenselected only for face validity, ease of administratio.IJ:"anq minim~m intrusiveness. These instruments have not' always been a,ccoITIP,an1ec1:by validityor re1i abi 1ity data (Eggemei er, Crabtree, & La p oint,;t~~83;~ Eggemeier,McGhee, & Reid, 1983; Eggemeier, Crabtree, Zingg:"Reid" &.1 Shingledecker"1982; Reid, Eggemeier, & Nygren, 1982; Reid, Shingledecker, & Eggemeier,1981; Reid, S;hingledecker, Nygren, & Eggem,e;ier, 1981),. ",
One of ,t~~c, p(Jtential advantages of Usi;ng,,~omputers,i~',thesavlngs' of,time to cons'truct, questionnaires. 'M()roney (1984) has sugges,ted the d!!ve17opment of an interactive management, information, system witl,1 expert system ..capability. To ,reduce an investigator's til11e in determiningth~ appropriate specifications and standards in developing questionnaire's and' check"7,lists, an, aU~Ol11~,:te~"questionnaire generation sys'b!m could contain a data 'base cap'~bl~ (Jf'i'$~nerClting,a questionnaire. Aut0ltlated systems may l:>~aforerunne,~,ofj.,f'~ture questionnaire constru.ction because o,f constraints ',"placed uPP[I., i6.ves~igators for improved efficielJcyin develop,i;ng, ite.m~. ,This maYI>~.du~~.'to,.a~;s~bl~or decreasing pool of researchers,'and an;increasing number of systems requiring evaluation (Moroney,,19~4),. It~iscautioned that even automated systems would require prete~ting question-,naires, and item reduction for unidemensional and multidimensional scal;if)g~
Artif.icial In.telli,genc~' (AI) is another developmental area that may I'
have future valueinquE!~tionl1~iredesign and use. AI is being applied, ,1nindustry, government,a~~idefE!nse.'iEx.per-;systems (ES),as a form of AI",'have, been created with. powerful higher-order languages (HOLs). ,HOLs,excelat sYmbolic inference (Mcfrtins, 1984). Tasks are 'being identified' that ar~not too complex for ESs (Tate, 1984). Expert ,systems appear to be effec,;:, :tive for relatively simple applications.. Knowledge engineers are ~tternpt
ing ES which are less complex, and more practical and realistic than:inthepast.' There have been problems in coding expert systems for'reaJ-worldapplication since they are not easy to understand, debug, extend, or maintain. Rule-based paradigms have led to poor computational performance forES except for the most simplistic application (Martins, 1984).
179
A typical ES was developed by Teknowledge, 'Palo Alto, California forapplication of a structured selection system. A knowledge base is usedwhere there is a finite set of solutions. The act~al application was acatalog of equipment. The user could troubleshoot a complex piece ofequipment by selecting one of many diagnoses. Texas Instruments, Dallas,Texas is working on a Navy contract to develop future smart weapon systems.This,app,,lication of ES is expected to be a key to the Strategic ComputingInitlative program of the Defense Advanced Research Projects Agency (DARPA)(Veri ty, 1984).
T~~,,~rmExpert'Systein"may imply more capability than might exist.Knowledge engineers are trying to build software solutions to complicated'sy,s,te'm,pperations. The operations have been in part non-deterministic, andnot' 'closed':"end. ES is basically a data base and decision tree combined.Four,th generation computers are capable of integrating several d~cision
trees simultaneously with specialized mUltiprocessors (Myers, 1984).
Another innovative approach to questionnaires data collection wasproposed for survey research with a large subject pool which is geographically dispersed. Surveys have been conducted by using cable televisionsystems to pretest teJevision cOl111lercials. The television announcer perforllisthe role 'of the interviewer, and the respondents are surveyed viatelephone (Frankel, 1975). If researchers could apply computers as a feedback device along with the teleVision interviewing, it would be possible toobtain measurements of reactions instantaneously. There may be militaryapplication f'or this type ,of survey since there are times when large samplesizes are used wh,ich may b"e located in geographic~lly dispersed areas. TheAir FPtce and th¢' Navy haye ,already taken. steps to move in the direction ofqUick"r~sl>onse})n,suryeys(but not ,to the extent fIlentioned above) throught~e" use' of telephone 'surveys, (Chun, Fields~ & Friedman, 1975).
. i -. .. '.'
,T~,gt:'eater:,incorporationof compu'tersinto questionnaire construction has been reviewed for adaptive testing, interviews constructed on aBayesian model, Subjective Workload Assessment Technique, que"stionnairecO",struction systems with software capable: of some complex operations, anda' c'ombfned television-computer techniq'ue for large-scale, geographicallydispersed surveys. These are relatively new approaches to the applicationof computers in survey research. They are all in various developmentalstages and require further research for refinement.' "
p-rima~yc.Rese·ar·bh~Re'cOl1l11endati ons "
'priorities, 'have been established among' potential research topics asthEtY relate,to OT&E performed by the Army Research Institute, Fort Hood,Te~'as: "Priorities are. required, since' the resources available for surveyre:sear.qh are ,limfted., Topfcs were ident,ified which offer the, greatestpo,~en.t'ial for the en'hancememt of Fort Hood surveys.' Eight research recom-mell,qa;ti onshave been highlighted.' , :
These'recol111lendat10ns are associated with: (1) Scale developmentprocedures and analysis,' (2)'Procedural guides to item wording, (3) Subjective workload assessment methods, (4) Automated Portable Test System,(5) Cognitive complexity, (6) Behaviorally Anchored Rating Scales (BARS),(7) Item nonresponse, branching, and demographic characteristics, and (8) (~))
180
------"
'\)
)
Pictorial anchors. In addition, other recolTJ11endations for future researchare ordered according to chapter content, and may be found in Appendix D.
Selection Rationale for Research Recommendations
The eight recommendations selected for future research were identifiedfor their relevance and application to OT&E activities at Fort Hood •. Theyare proposed as research topics because of their potential for meaningfuj'I'"outcomes within a reasonable time frame. There has been a shift in re~'d
search focus.. J>l"eviousstudieswereconcerned. wi thvarJables such as:continuous scales and discrete scales, response alternatives, number ofscale points, type of scale format,etc. Because of conflicting research ..results, it appears as though different scale formats each have their pwn ..strengths and weaknesses. More recently, investigation of other variables"have focused on: survey developmental procedures, adaptive testing for- 'mulated as a computer survey, expert systems, and characteristics of respondents including their cognitive complexity. The eight research recommendations reported in this chapter are not ordered in a priority sequence.
• Sea 1e Deve1opmen t Procedures and Anal yses
Military survey research for the OT&E community needs to investigate ways to obtain more lead. time in survey development. Itemreduction and multidimensional scaling techniques have been used incommercial-industrial surveys which may be applicabJe for Armysurveys. This would be a vehicle to introduce scale developmentprocedures that would reduce the number of items used in fieldsurveys. For example, Malhotra (1981) designed a develo'pmentalprocedure that uses different anchors (adjectiv~s, adverb~, andphrases) to measure specific concepts. The scale dev~lopment. '.procedure includes item reduction, and measures of test reliabilityand validity. In conjunction with scale development procedures,statistical analyses may benefit· by comparing differe~t formuiasand statistical assumptions. In comparison.of a rank order,paired-comparison, and a Likert scale, data for test-retest re-· .liabilities varied depending on whether a Spearman rho or a Kendalltau was used (Reynolds &Jolly, 1980). '
.i'. .
• Procedural Guides to Item Wording !.'
I~/
There is no consensus among survey researchers as to. ho~ to word .items, and the tone o'f wording. The i nfl uence of word i ng is no:t· .really known. Procedures have been developed to identify $pecificwords tha~ could be used in an item (the Echo technique is an . ,example; see Section 4.2., Wording of Items and Tone of Wording).:Various procedures used to identify the use of specific words in anitem could be compared because the procedures may possiblY identifythe structure of the item itself. A method for selecting the item'wording requires development to ensure that respondents would only;be subjected to items they'can understand. Once the method wasidentified, it may be possible to incorporate the procedures anddecision-making processes into an expert system using higher~order
languages. Generation of items by an expert system would stillrequire pretesting and possible modification.
181
• Subjective Workload Assessment Methods
Assessment of workload ~s meaningful in OT&[. Continued researchis recommended for the general applicability of subjective workloadmeasurement. Subscale analyses used in this method require application to a variety of other types of tasks (Eggemeier, McGhee,&Reid, 1983). Specifically, future research with subjectiveworkload measurement must deal with operational applications ofbetween-subject designs. Common pretraining of subjects, andsubjects without commontra;ni ng, -,nay have an effect onlletweensubject desi g"ns •. Thi s method has been extensivefyinvestl ga.ted inthe laboratory to demonstrate its validity and reliability. Fieldapplications have been successfully completed in single-placeaircraft, multiple-place aircraft, and control room situations •.Researchers at Fort Hood could build upon the knowledge and methodsgained for programs that measure subjective workload. Subjectiveworkload assessment methods could be used to measure operatorworkload in Army systems.
• Automated Portable Test Systems
Administration of surveys could be conducted on a portable testsystem using a microprocessor which is user-friendly, and containsindependent power sources. Entering and collating responses can beperformed with accuracy and precision. It is possible to use sucha system simultaneously at various remote sites •. Information fromall locations can be communicated by external cartridge. Questionnaires can be constructed for this type of automated system.Preliminary development of such systems already has been done.
• Cognitive Complexity
Cognitive compatibility purports to enhance the psychometric quality of ratings when the questionnaire format'is compatible with thecognitive structure of the respondent. Cognitive complexity wasinvestigated in an industrial environment, and was shown to be arelevant variable in a rating task. When cognitive complexity wasinvestigated using college/university student samples, there was a'failure to replicate prevjous results. The contextual differences.'for the type of organization, and the characteristics of the'responden.ts,-may__.have effected the lack of replication. Moreresearch is needed to identify military demographic sample characteristics that'meaningfullyinfluence questionnaire results .
• Behaviorally Anchored Rating Scales (BARS)
BARS surveys may be useful in reduci ng subjectivi ty found in se1f-.report instruments. This type of scale has been shown to have thecapability of replacing self-report measures, and can be used formultiple purposes in addition to the original questionnaire product. It should only be used for large surveys. This may be auseful instrument to develop when mUltiple applications are required,. such as defining objectives, interviewing feedback ses-sions, and as a foundation for future training programs. BARS (.J".-.....1,55.j.
could be administered on a portable microprocessor. 7
182
()
()
..
u
• Item Nonresponse, Branching, and Demographic Characteristics
Branching offers considerable potential for survey efficiency.However, item nonresponse for questionnaires with branches mayjeopardize research results. The interaction and/or main effectfor item nonresponse, branching, and demographic characteristicsfor a military sample may be useful in developing new questionnaireformats.
• 'PictorialAnchors
The use of pictorial anchors has been subjected to limited investigation. This methodology could be extended to different typesof visually perceived stimuli. It is suggested for possible ap~
p11 ca ti on with subjects who may have problems wi thl i teracy • Avariation on the use of pictorial anchors would be the use of colorresponse alternatives, such as the Attitude Pollimeter. This is acolor bar in a housing. This nonverbal response alternative couldbe modified for use with computer graphics $0 that the respondentcould select a gradati9n in color between two color specturms: (see
. Section 2.6, Continuous and Circular Scales).
. ";' ;:.
183
-_ ..._----_.._..
BIBLIOGRAPHY
Aiken, L. R. (1978). Reliability, validity and veridicality of questionnaire items. Perceptual and Motor Skills, 47, 161-162.
Aiken, L. R. (1979). Relationships between the item difficulty and discrimination indexes. Educattonaland Psychological Measurement, 39,821":824.- , ~
Aiken, L. R. (1980). Content validity and reliability of single items orquestionnaires. Educational and Psychological Measurement, 43, 955959.
Aiken, L. R. (1982). Writing multiple-choice items to measure higher-ordereducational objectives. Educational and Psychological Measurement,~, 803-806.
Albaum, G., Best, R., & Hawkins, D. (1981). Continuous vs. discrete semantic differential rating scales. Psychological Reports, 49, 83-86.Continl,lous and Circular Scales -Semantic Differentia,l Scales
Allan, P., &Rosenberg, S. (1978, November). Formulating usable objectivesfQr manager performance appra i sa1. Personnel Journal;" 626-642.
_.:'.{
Andersen, E. B. (1982, Fall). Latent trait models and abjlity_parameter() estimation. Applied Psychological Measurement, ~(4'h 445-451..
Andrich, D. (1978, Fall). Scaling attitude items constructed and scored inthe Likert tradition. Educational and Psychological Measurement,~(3), 665-680.
Arima, J. K. (1980, May). ;...P.;.er;...,fPi0;.;.rm~an;.;,c~e;.,..;.v.;;;.s~. ~~;.....;;~,n..;;.;.;..;.~~~~~~cognitive abilities (Nate School. (DnC No. AD A090614)Ethnic BackgroundGender
Askegaard, L. D., &Umila, B. V. (1982, Fall). An empirical investigationof the applicability of multiple matrix sampling to the method of rankorder. Journal of Educational Measurement, li(3), 193-197.
Atkin, R. S., &Conlon, E. J. (1978, January). Behaviorally an~horedrating scales: Some theoretical issues. Academy of Management Review, 119-128.~viorally Anchored Rating Scales
Avery, R. D., & Hayle, J. C. (1974). A Guttman approach to the developmentof behaviorally based rating scales for systems analysts and programmer/analysts. Journal of Applied Psychology, ~, 61-68.
u185
Backstrom, C. H., & Hurchur-Cesar, G. (1981). Survey research. New York,·NY: John Wiley &Sons.BranchingIIDon l t Know ll CategoryInterviewi ngMultiple-Choice ScalesOpen-Ended Items and Closed-End ItemsPaired-Comparison ItemsRank Order ScalesResponse AlternativesSemantic Differential ScalesWording of Items and Tone of Wording
Barden, R. S. (1980, February). Behaviorally based performance appraisals.The Interna1 Auditor ,,36-43. '
Bardo, J. W. (1978). An exact probability test for Likert scales withunequal risponse probabilities •. Southern J~urnal of EducationalResearch, 11(3), 181-189.
Bardo, J. W., &Yeager, S. J. (1982). Consistency of response style acrosstypes of response formats. Perceptual and Motor Skills, 55, 307-310.Multiple-Choice ScalesQuestionnaire Layout,
Barker, D., & Ebel, R.L. (1982). A comparison of difficulty and discrimination values of selected true-false item types. ContemporaryEducational Psychology, 7, 35-40.Balanced Items -
.. . -,
Barker, M. S., & Hamovitch, M. (1983, January). Job-oriented basic skills(jobs) program: An evaluation (NPRDC T~ 83-5). San Diego, CA:. NavyPersonnel Research and Development Center. (DTIC No. AD A124150)
Bartlett, T. E., & Linden, L. R. (1974). Evaluating managerial personnel,OMEGA. The International Journal of Management Science, !(6), 815819.
Bass, A. R., &Turner, J. N.(1973). Ethnic group differences in relationships among criteria· of job performance. Journal of Applied Psycholo-gy-,- 57 ,-l01-109-. j,
Age - .Ethnic Background
, ,Beard, A. D. (1979). Bipolar scales with pictorial anchors: Some charac
. teristics and a method for their use. Applied Psychological Measurement, 3(4), 469-480 •.!1j)Olar Scales
..
u186
• tW--
()
..,
u
Beatty. R. "'I •• Schneier. C. E•• & Beatty. J. R. (1977). An empiricalinvestigation of ratee behavior frequency and ra'tee behavior changeusing behavioral expectation scales (BES). Personnel Psychology. 30.
-647-657. ---Behavioral Expectation Scales
Beaumont, J. G. (1982. October). System requirements for interactivetesting. International Journal of Man-Machine Studies, 17(3).-311-320. ---
Bechtel. G. G. (1980. February). A scaling model for surve~ monitoring.Evaluation Review. 4(1), 5-41.'
Bejar. I. I .• &Wingersky. M. S. (1982, Summer). A study of pre-equatingbased on item response theory. Applied Psychological Measurement •§.(3).309-325.
Beltramin;, R. F. (1982). Rating-scale variations and discriminability.Psychological Reports, 50. 299-302.MUltiple-choice Scales ---Number of Scale Points
, ~uestionnaire LayoutResponse Alternatives
Bendig, A. W. (1952a). A statistical report on a revision of the Miami,instructor rating sheet. Jolirnal of Educational Psychology, 11.:
, '423,-429.Response Alternatives
Bendig, A. W. (1952b). _The use of student rating scales in, the evaluation, ,,' ofins'tructors in i'ntroductory psychology. Journal of Educational, -, Psychology • .Q. 1~7-175.;, '
Response AlternatlVes ,-
Bendig. A. W. (1953). The reliability, of self-ratings as a function of theamount of verbal anchor,i-ng 'and the number of categories on the scale.Journal of Applied Psychology, 37. 38-4l.Response Alternatives ---
,:Be'riel ,D. C. R., & Benel. R. A.(t976). < A further note on sex differenceson the semantic differential. British Journal of Social ClinicalPsychology. 15, 437-439.Gender ---Semantic Differential Scales
Bernardin.H~J•• (l977).- Behavioral e~pectation scales versus sUlTJnated; rating scales: A fairer comparison. Journal of Applied Psychology.
62.422-427.mavi ora1 Expecta ti on Scales
Bernardin. H.J. (1978). Effects of rater training on leniency and haloerrors in student ratings of instructors. Journal of Applied Psychology. 63,301-308.
187
----_._~-----~--~------_._-----_!~-
J. J. (1982). Cognitive comBack to the drawing board?151-160.
Bernardin, H. J., Alvares, K. M., &Cranny, C. J. (1976). A recomparisonof behavioral expectation scales to summated scales. Journal ofApplied Psychology, ~(5), 564-570.
Bernardin, H. J., &Boetcher, R. (1976, August). The effects of ratertraining and cognitive com~lexity on psychometric error in ratings.Paper presented at the mee ing of the American Psychological Asso-ciation, Toronto.Cognitive Complexity
Bernardin, H. J~, Cardy, R. L., &Carlyle,plexity and appraisal effectiveness:Journal of Applied Psychology, 67(2),Cognitive Complexity -
Bernardin, H. J., &Kane, J. S. (1980). A second look at behavioral obser- ~
vation scales. Personnel Psychology, 33, 809-814., Behavioral Observation Scales -
Bernardin, H. J., La Shells, M. B., Smith, P.' C., &Alvares, K. M. (1976,February). Behavioral expectation scales: Effects of developmentalprocedures and formats. Journal of Applied Psychology, 61(1), 75-79.Behavioral Expectation Scales -Behaviorally Anchored Rating' ScalesQuestionnaire Layout
Bernard in, H. J., & Pence, . E. C. (1980). Effects of rater tra i ni ng:Creating new response sets and decreasing accuracy. Journal of.Ap-
. plied Psychology, ~, 60-66.' 0)Bernardin, H. J., &Smith, P. C. (1981). A clarification of some issues
regarding the development and use of behaviorally anchored ratingscales. Journal of Applied Psychology, 66(4), 458-463.Behaviorally Anchored Rating Scales - , ,
Bernardin, H. J." & Walter, C. S. (1977).' Effects of rater training anddiary-keeping on psychometric error in ratings. Journal of AppliedPsychology, 62(1), 64-69.Behavioral ExPectation ScalesBehaviorally Anchored Rating Scales
, Bickley, W. R. (1980, September). ~T~ra~l=-=·n~i~n~~~~..;.....;.,~~~~~~..;..;r=lation and evaluation of metho 0 ogy epor o. •Research Institute for the Behavioral and Social Sciences.Multiple-Choice Scales (AD A122 777)
Bieri, J. (1966). Cognitive complexity and personality development. In O.J. Harvey (Ed.), Experience, structure, and adaptability. New York:Springer.
Biggs, J. B. (1970). Persona·lity correlates of some dimensions of, studybehavior. Australian Journal of Psychology, g, 287-297."0 0n 't Know" Category
OJ
188
(J
'.,w
()
'"',
u
Birnbaum, M. H. (1981, March). Reason to avoid triangular designs innonmetric scaling. Perception and Psychophysics, 31.(3),291-293.
Blackburn, R. S. (1982, Spring). Multidimensional scaling and the organi- 'zational sciences. Journal of Management, !(l), 95-103.
Blanz, F., & Gheselli, E. E. (1972). This mixed-standard scale: A newrating system. Personnel Psychology, ~, 185-199.Cognitive ComplexityMixed Standard Scales
Blower, D. J. (1981, Augustj. Determinin visual acuity thresholds: ,Asimulation study of stimulus presentatl0n strategles A R- 2Pensacola,( FL: Naval Aerospace Medical Researchi,Labora~ory. Naval AirStation~ '(DTIC No. AD A111821) , ,MUltipl~~th6ic~ Scales
Boote, A'.'-$. (1981). Reliability testing of psychographic scales. Journalof Advertising Research, £1(5), 53-60.Number! o~ScaTe PointsResponse Alternatives
,Bordeleau, Y., & Turgeon, B. (1977). Comparison of 3 psychometric methodsused in attitude questionnaires. Canadian Journal of BehaviouralSci ence, ~(1), 26-36.
Borman, W. C. (1975). Effects of instruction to avoid halo error on reliability and,validjty of performance evaluation ratings.' Journal ofAp~1i ed Psycho:log,Y, 60, 556-560.Be aviorally AnchOrea-Rating Scales
Borman, W. C. (1977, Decembe~). Consistency of rating accuracy and ratingerrors in the judgment of human performance. Organizational Behaviorand Human Performance, ~(2), 238-252.
Borman, W. C.(l979). Format and training effects on rater accuracy andrater errors. Journal of Applied Psychology, 64, 410-421.Behaviorally Anchored Rating Scales --Cognitive ComplexityQuestionnaire Layout
189
)
Borman, W. C. (1981, June). Performance ratings: Comments on the state ofthe art. ~n Cecil J. Mullins, AFHRL Conference on HUman AppraisalProceedings. Reviewed and submitted for publlcatlon by Connle D.valentln, Jr., Chief, Force Acquisition Branch, Manpower and PersonnelDivision~'Air Force Human Resources Laboratory, AFHRL Technical Paper,81-20.'
Borman, W. C., &Dunnette, M. (1975). Behavior based versus task-oriented, performance ratings: An empirical' study. Journal of Applied Psy-chology~ 60,561-565. ,BehaviorarExpec;,tation ScalesResponse Alternatives
Bradburry, N. M., &SUdman, S. (1979). Improving interview method andquestionnaire design (3rd printing). San Francisco, CA: Jossey-BassPublishers.AgeBranchingEthnic, BackgroundInterviewi ngLength, of I tems and Number of ItemsOpen-Ended 'Items and Closed;'End Items,
Bradburn, N. M., Sudman, 5., Blair,'E., & Stocking, C. (1978, Sununer) •.Question threat and response bias. Publ icOpinion Quarterly, 42(2),221-234.,
, ,
Bradley, R. A. (1982, May). Paired COmjariSOns (FSU statistics Report No.',M615; ONR Technical Report No. 157. Tallahassee, FL: The Florida
State'University, Department of Statistics. (DTIC No. AD A123877)Pai red-Col1lJ)~ri son Items ' , ,
Brannon, R. ,(1981),. Current methodological issues in paper-and-pencilmeasuring instruments. Psychology of Women Quarterly, 5(4), 618-627.Gender -MUlti ple-Choi ce Scales
Brown, CurtisA. (1982, May)., The effect' of factor range on weight andscale values in a linear averagin'g model. Dissertation AbstractsInternational; g( 11-B).
Bruvold, W. H. (1977). Reconciliation of apparent nonequivalenceamonga1terna ti ve ra ti ng methods.Journa1 of App 1i ed Psycho.l ogy, 62 (1) ,111-115. - ,
Burns, A. C., &Harrison, C. (1979). A tes~ of the reliability of psy~chographics. Journal of Marketing Research, ~', 32-38.
190
0>
Butler, M. C., &Jones, A. P.t1979).The health 0plnl0n .urvey, reconsidered: DimensionaHty, reliability, and validity.' Journal ofClinical Psychology, ~t3), 554-559.
C> Carter, R. C., Kennedy, R. S.,Bittner, A. C., & Krause, M. (1981, July).Item recognition as a performance evaluation test for environmentalresearch. New orleans, LA: U.s. Naval Biodynamlcs Laboratory.
'Q.
for
()
Carter, R. C., Stone, D. A., & Bittnet, A. C. (1982).. Repeated measurements of manual dexterity applications and support of the two-processtheory. Ergonomi cs, .25 (9), 829-838.
,~ --- .. ~
Checklist: How effective is your management of personnel (1978, September). Focus on Employee Relati~ns, by· the Bank Personnel Divisionstaff of tHe Amerlcan Bankers Associations.
Christian, J. K·.;, åmann"W~ G. (1982.).·Comparison of computerizedversus 's'tandardi,zed-' feedback' an(accurate· versus inaccurate feedback.Psychological Reports, 22., 1067-1070.,
Chun, K., Fields, V~, &, F~iedma'ri,: S. '(1975, August). Military attitudinalsurveys: An overview~ In H. W. Sinaiko,& L. A. Broedling (Eds.),Perspecti ve'i-' on a'tti tude assessmen t:' Surveys and thei r a1terna tives.Manpower Research and Advlsory services, Smithsonian Institutl0n,prepare~)'ynderitheNavyManpowerR&D Program of the Office, of NavalResearch,' N00014. 67-A..0399".0006.Future Research . , , '"Interviewing
Church, F: (1983, June). Que·stionnaire construction manual for operationaltests and evaluation. Prepared for the Deputy Conunander of Tactics
~ and Test, 57th Fighter Weapons Wing/DT, Tactical Fighter'WeaponsCenter (TFWC), Nellis AFB, NV.InterviewingNumber of Scale PointsRank Order ScalesSemantic Differential 'Scales
u191
Division.MUltiple-Choice ScalesOpen-Ended Items and Closed-End Items
Cocanougher; A. B., & Ivancevich, J. M. (1978, July). "BARS" performancera ti ngfor sales-force personnel. .J'ournalof Marketing, 87-95.Behaviorally Anchored Rating Scales
Cole, N. (1973). On measuring the vocational interests of women. Journalof Counseling Psychology, 20, 105-112.Continuous and Circular ScaTes
Comrey, A. L., &Montag, I. (1982, Summer). Comparison of factor analyticresults with two-choice and seven-choice personality item formats.Applied Psychological Measurement, 6(3), 285-289.
;. Number of Scale Points. -
Cooper, W. H. (1981, September). Ubiquitous halo. Psychological Bulletin,90(2),218-244.
Cottle, C. E., & McKeown, B. (1980, January). The forced-free distinctionin Q technique: A note on unused categories.in the Q sort continuum.Operant SUbjectivity, "l(2), 58-63. \
Couch,' A.-, &Keniston,K. (1960). Yea sayers and nay sayers: Agreeingresponse set as a personality variable. Journal of Abnormal andSocial Psychology, 60, 151-174.Balanced Items ---
Craig, C. S.,& McCann, J. M. (1978). Item nonresponse in mail surveys:Extent and correlation. Journal of Marketing Research, }i, 285-289.Age
Cronbach, L. J. (1946). Response sets and test validity. Educational andPsychological Measurement, 6, 475-494.Sa1anced Items· . -
Cronbach, L. J. (1950). Further evidence on response sets and test design.Educatf6nal.andPsychological Measurement, 10, 3-31.-Ba-lancedltems ---
o.f sources, of bias len the
Cudeck, R. (1980, Summer). A comparative study of indices for internalconsistency. Journal of Educational Measurement, !L(2), 117-130.
192
()..'" .
I 0-
o
c.J
Dambrot, F. (1980, April). Test item order and academic ability, or shouldyou shuffle the test item deck? Teaching of Psychology, 7(2), 94-96.Order of Items -
Daniel, F. R., Jr., &Wagner, E. E. (1982). Differences among Hollandtypes as measured by the hand test: An attempt at construct validation. Educational and Psychological Measurement, 42, 1295-1301.
Daniel, W. W., Schott, B., Atkins, F. C., &Davis, A. (1982, Spring). Anadjustmentfornonresponse in sample surveys . Educational and Psychological Measurement, 42(1), 57-67.
Deaton, W. L., Glasnapp, D. R., & Poggio, J. P. (1980). Effects of itemcharacteristics on psychometric properties of forced choice scales.Educational and Psychological Measurement, 40, 599-610.. '" .'Sa1anced Items - .Multiple-Choice ScalesWording of Items and Tone of Wording
DeCotiis, T. A. (1977). An analysis of the external validity and appliedrelevance qf '.thr.eerating formats. Organizational Behavior and HumanPerformance, 1:2.;' 247-266.
DeCotiis, T. A. (1978). A critique and suggested revision of behavidrally .anchored rating scales developmenta'l procedures. Educational and Psychological Measurement, ,38, 681-690.
De Jung, J. E., &Kaplan, H. (1962). Some differential effects of race ofrater and combat attitUde. Journal of Applied Psychology, 46, 37.0~
374. -Ethnic Background
Devine, P. J. (1980, November). An investigation of the degree or correspondence among four methods of item bias analysis. DissertationAbstracts lri'ternati ona1, i!.( 5-B) • ..
Dickinson, T. L., &Zellinger, P. M. (1980). A comparison of behaviorallyancholjed rating and mixed standard scale formats. Journal of AppliedPsychology, 65(2), 147-154.Mixed standard' Scales
Dickson, J., & Albaul11, Go' (1977). A method for developing tailormade ..'semanti,c diffe~entials for specific marketing content areas. Journalof Marketing Research, 14, 87~91.
Bipolar Scales -Multiple-Choice ScaleSSemantic Differential Scales
Divgi, D. R. (1981). Model-free evaluation of equating and scaling;Applied Psychological Measurement, ~(2), 203-208.
193
I
Dolch, N.A. (1980).' Attitude measurement by semantic differential on abipolar scale. The Journal ,of Psychology, 105, 151-154.Bipolar Scales -Response Al ternati-vesSemantic'Differential Scales'
Dollard,J.A., Dixon, M. L., & McCann, P.H. (1980, September). Shipboardinstruction and train.in mana ement with com uter technology:app lcatlon PRO':'" R- - an Dlego, A: avy Personne ,and Development Center.Multiple~Choice ScalesMiddle'Scale Point Position:; i
Downs,' P. E. (1978)~ 'Mi~cellany: Testing the upgraded semantic differential. Journal of the Market Research Society, 20(2),99-103.Semantic Differential Scales - '
Downs,:S.~Farr, R. M~~ ,& Colbeck, L. (1978). Self-appraisal: A conver~ence of selection ahd guidance. Journal of Occupational Psychology,2.l, 271-278.
Orasgow,'F.(i982). Biased test items and differential validity. ·P.sychological BUlletin, 2£(2), 526-53l.
._ . ,Y.; ... l ....
Drasgow~, F~j1982, SUlI11!er,). Choice of test model for appropriateness'measurement. Applied Psychological Measurement, !(3),' 297-308.
Drasgow,' F., & Miller, H. E. (1982)., P'sychOmetric and substantive issuesin scale construction and validation.', Journal of Applied Psychology,6~ (3), 268-279. ' " " " " "
I'~""" ,\J!
Dziuban, C. D., & Shirkey, E. C.(1980)., Sampling adequacy and the semantic differential. Psychological Rep6rtsj 47, 351-357.Semantic Differential Scales ,,-
Eckblad, G.,(1980) •. ·The curvex: Simple order structure revealed in ratings of complexity, interestingness, and pleasantness. ScandinaVianJournal of Psychology, ~(1), 1-16.
Edvardsson, B. (1980). 'Effect' of reversal of response scales in a ques-"tionnai're. Perceptual and Motor Skills, 50, 1125-1126. ",
Edwards, M. R. (1981, August). ,Improving performance appraisal by usingmUlti-p'le appraisers. Indu'strial Management and Data Systems, 13-16.Paired-Comparison Items
Edwards, R. H~' (1981). Coefficients of effective length. Educational andPsychological Measurement,ll, 283-285. u)
194
;0:
Eggemeier, F. To, Crabtree, M. S., &,La Point, P. A. (1983, October). ,Theeffect of delayed report on ,subjective ratings of mental workload.Proceedings of the Human Factors Society 27th AnnualMeeting~:139-143.
Future Research '
Eggemeier, F. To, Crabtree, M. S., Zingg, J. J., Reid, G. B., & Shingledecker, C. A. (1982). Subjective workload assessment in a memoryupdate task. Proceedings of the Human Factors Society 26th AnnualMeeting, 643-647.Future Research
Eggemeier, F. T., McGhee, J. 'Z., & Reid, G. B. (1983, May). The effects ofvariations in task loading on sUbjective workload rating scales. Proceedings of the IEEE 1983 National Aerospace and Electronics Confer=--ence, Dayton, oR, 1099-lI05.", ',,''F'UtiTre Research
Eiser, J. R., & Osmon, B. E. (1978). Judgmental perspective and valueconnotations of response scale labels. Journal of Personality andSocial Psychology, 36(5), 491-497. ':. ','Ba1anced Items - .Bipolar Scales
Eiser, J. R., & Stroebe, W. (1972). Categorization and social. jUdgment.London: Academic Press.'
Eisler, H. (1982). On the nature of sUbjective scales.Journal of Psychology, 23(3) ~ 161-171.
,
Scandinavian'
()
! . J
Elithorn, A., Mornington', S., & Stavron, A.(1982). ',A:U1:om~'t~dpsYc'h6iogical testing:, Some principles and practice. International Journal ofMan-M~cliine,Studies,.!Z.(3) " 247-263.'
, ."...
Evaluating performance: ' A self-instruction unit (HRP-09020i2), (1979).,., 'Princeton ,NJ: Educ~tiona1 Testing service. ' ..
Fay, C. H.,& Latham, G. P. (1982). Effects of training and rating scaleson, ra ti ~g er...ors., Personne1 Psychology, 35 " ,105-116. ;; )Behavi.oral. ExpectatlonScales, ,:' . ',: 'Behavioral Observation Scales "
Ferber, R.(1966). Item nonresponse, in a consumer. survey. ,Public Opinion;,Q uarterl y, 30, 399-415. 'Age -
Finley, D.M. (1976, May'). The effects of scale continu,i,ty :and behavioralanchor specificity upon the psychometric prope_r~ies of performancerating scales. Dissertation Abstracts International, 36( 11-6). ,
Finley, D.' M., Osborn, H.G., Dubin, J. A., & Jeanneret,..i< R. ,(1977).:Behaviorally based rating scales: Effects of specific, anchors anddisguised scale continua. Personnel Psychology, 1Q, 659-669.Mixed Standard Scales
195
---------------_.~-- ---------
Finn, R. H. (1976). Concerning questionnaire quality and operationalutility. Catalog 'of Selected "Documents 'in Psychology, i, 32.
Fischer, G. H., & Formann, A. K. (1982, Fall). Some app1icationsof10gistic latent trait models with linear constraints on the parameters.Applied Psychological Measurement, !(4), 397-416.
Fivars, G. (1975). The critical incident technique: A bibliography. JSASCatal29 of Selected Documents in Psychology, 5,210.BeHavlora lObservationScales .
Flanagan, J. C. (1954). The critical incident technique. PsychologicalBUlletin, 51, 327-1358.Behaviora1lJbservation Scales
F1eishmann, U. (1981)-. 'Psychometric techniques and questionnaires for usein gerontopsychological investigations. International Journal ofRehabilitation Research, i(1), 96-97.
Ford, D. L. (1976, February). Predicting group decision strategies: The, , effect of rating~sca1e use bias on accuracy of prediction. Catalog of
S'e1ected Documents in Psychology, !(3).
Fowler, F. J. (1984). Survey research methods. Beverly Hills, CA: SagePub1i cati ons •
Fowler, F. J., & Mangione, 1'. W. (1983). The role of interviewing trainingand supervision in reducing interviewer effects on survey ,data. 'Proceedings 'of the American Sta.tistica1 Association Meeting, Survey rf.... -.)....'IResearch Methods Section, 124-128. " . . . Ii
Fralicx, R. D., & Raju, N. S. (1982). A comparison of five methods for. combining multiple criteria into a single composite. Educational and", 'Psychological "Measurement, B., 823-827.
Frankel, L. R. (1975, August). Restrictions to survey sampling legal,practical, ~nd ethical. In H. W. Sinaiko, & L.A. Broed1ing (Eds.),perspectives on attitude assessment:' Surveys and 'their alternatives."Manpower Research and Advisory services, Smithsonian Institution,prepared under the Navy Manpower R&D Program of the Office of NavalResearch (N00014.67-A-0399.0006).Future Research {"
Frederiksen, N., Jensen, 0., & Beaton, A. E. (1972). Prediction of organizational'behavior. New York: Pergamon Press, Inc.semantic Differential Scales
Friedman, B. A., & Cornelius, E. T. (1976). Effect of rater participationin scale constructi on on the psychcxnetri c, characteristi cs of tworating scale formats. Journal of 'Applied psychorogy, g(2), 2io-Z16.:BehaViorally A~chored Rating Scales ", , ,
I
Fullerton, J. T., & Holley, M. (1982). A new 'look at standard scale trans-formation. Psychological Reports, ~, 1148-1150.
196
...._ ..~-~_ ..~--_..._..~~~.~~.
Furnham, A., &Henderson, M. (1982). The good, the bad and the mad:Response bias in self-report measures. Personality and Indivi'dualDifferences, ~(3), 311-320.
Garner, W. R. (1960). Rating scales, discriminability, and informationtransmission. Psychological Review, 67, 343-352". I
Number of Scale Points -
Gay, L. R. (1980). The comparative effects of multiple-choice versusshort-answer tests on retenti on • Journal of Educatfona1 "Measurement,11.' 1), 45-50.
Gerow, J. R. (1980, April). Performance on achievement tests as a functionof the order of item difficulty. Teaching of Psychology, 7(2), 93-94.Order of Items -
)), ,
Gibbons, J. D., Olkin, I., &Sobel, M. (1979, September). A subset selection technique of scoring items on a mUltiple choice test. Psychometri ka, ii( 3), 259-270.
Gividen, G. M. (1973, February). Order of merit: Descriptive phrases for'questionnaires. Unpublished report, available from the ARt Field Unitat Fort Rood, TX.Middle Scale Point Position "
)
)
Glas~r, M. A., & Collen, M. F. (1972). Toward automated medical decis'ions.Computers and Biomedi ca1 Research, ,!, 180-189. ,",Future Research
Goodstadt, M. S., & Magid, S. (1977). When Thurstone and-Likert agree -- Aconfounding of methodologies." EducatfonC\land Psychological Meas"ure-ments, 37, 811:-818. ,.""- .
Graef, J., & Spence, 1. (1979; January). Using distance information in the,ldesign of large multidimensional scaling experiments. PsychologicalBulletin, ~(1), 60-66.
Green, B. F. (1981). A primer of testing. American Psychologist, ~nO),1001-1011.
; Multiple-Choice Scales
Groves, R. M. (1979). Actors and questions in telephone and personalinterview surveys. Publi'c 'Opi'ni'on Quarterly, 43, 190-205.Interviewing -Response Alternatives
Guilford, J. P. (1954). psychometric methods. New York: McGraw-Hill.Number of Scale Points
Guion, R. M. (1979, April). Principles of work sample testi"ng." IT. Anon-empirical taxonomy "of test"uses (TR-79~A8). Bowling Green, oR:Bowling Green state Omvers1ty. (OTIC No. AD A072446)Number of Scale Points
197
'~", '
Guion, R. M., & Ironson, G. H. (1983, February). Latent trait theory fororganizational research. Organizational Behavior and Human Performance, ~(1), 54-87.
Guttman, L. (1950)., The basis for" scalogram analysis. In S. A. Stauffer,et ale (Eds.), Measurement'and prediction. Princeton, NJ:' PrincetonUniversity Press.
Guttman, L. (1954). A new approach to' factor analysis: The radex. In P.Lazarfeld (Ed.), Mathematicalthi'nking'in'thesocialsciences~Glencoe, IL: Free' Press.Continuous and Circular Scales
Guttman, L. (1957)., Empi ri ca1 veri fi ca ti on of the radex structure of mental abilities and, personality traits. Educational and PsychologicalMeasurement, 17, 391-407. ,"-,~
Continuous an~Circular Scales
Hahn, J. E. (1981; March). A Monte Carlo stUdy of incomplete data designsand configurations in non-metric multidimensional scaling. Dissertation Abstracts 'International, 41(9-B).
Hambleton, R. K~, Mills, C. N., & Simon,R. (1983). Determining thelengths for criterion referenced tests. Journal of Educational Measurement, 2.Q.(l), 27-38.'
Hambleton, R. K., &van de~ Linden, W. J. (1982, Fall): Advances in itemresponse theory and applications: ' An introduction. Applied Psycho-logical Measurement, !(4), 373-378. (JI
Hamel, C. J., Braby, R., Terrell, W. R., & Thomas, G. (1983, January).Effectiveness 'of 'job 'traini'ng :materials based on three format models:
. A fteld 'evaluation (Technical Report 138). Orlando, FL: TrainingAnalysls and Evaluation Group, Department of the Navy.MUltiple-Choice Scales "
Hamelink, J., &Hamelink, J. (1980). A numeric plan for performance'apprai sal. Training 'and 'Development 'Journal, 34( 10), 88-89.
Hanmer, W. C., Kim, J. S•• Baird, L., & Bigoness, N.J. (1974). Race and-s-e-,,-ca-s-determinants of ratings by potential employers in a simulatedwork sampling task. Journal 'of Appli'ed Psychology, 59, 705-71I.Ethni c Backgroun~ -
Hardt, R. H., Eyde, L. D., Primoff, E. S., & TordY"G. R. (1978). The NewYork State Trooper job element examination. Albany, NY: New YorkPolice.Ethnic Background
Hartke, A. R. (1979, Fall). The development of conceptually independentsub-scales in'the measurement of attitudes. Educational and Psychological Measurement, l2.(3), 585-592.
II198
~..
Harvey, R. J. (1982, Apri.l). The future of pal"tial correlation as a meansto reduce halo in performance ratings. Journal of Applied Psychology,67(2},171-176 •..-
Hi~schman, E. C., &Wallendorf, M. R~ (1982). Free-~es~onse and card-sorttechni ques for assessi ng cogni ti ve content: Two studi es concerni ngt~eiJ'~,:stapj,rity., validity, and utility. Perceptual and Motor Skills,ii, 1095,~1110. . .
Holbrook, M~ B. ,(1977). Comparing multiattribute attitude models by optimal, scaling. Journal'of Consumer Research,4(3}, 165-171.
Holl and,P ~1W. (,+981, MarchL When 'are item response models consistentwith' observed data? psychometr1 ka ,46( I), .79-92.
Holzbach, R.L. (1978) •. Rater bias in performance ratings: Superior,se.1f-, and peer ratings. Journal of Appli'ed Psychology, 63(5), 579588 .•
Hom, P•. W~, O~ Nisi, A. S., Kinicki, A. J., & Bannister, B. D. (l982).Eff~<:,t~.~et:'ess of performance feedback from behavi ora lly .anchoredratin~,.s¢ales. "Journal 0f'Ap~1ied Psychology, £(5), 568...576.Behavl0rally Anchored Ratlng cales .
Horayangkura, V.·,(l~78, December}. Semantic dimensional structures: Amethodologic;a},apP,foach. Environment and Behavior, 10{4}, 555-584.
Hsu, L. M. (1979). A 'comparison of .three methods of scoring true-falsetests. Educati·onal:and· Psychological Measurement, 39, 785-790.
Hughes, G. D. (1975). Upgradingt~esemanticdi·fferential. . Journal of theMarketing Research Society, 17(1;}, 41-44.Semantic Differential Scales~'
Hulin, C. L. (1982, April). ' Some reflect.ions on general performance dimensions and halo rating error. Journal of Applied Psychology, £(2),165-170.
199
,.' !,
. ,
,\y!,;::.",~~;:;;,iD~aSgOW, F., & Komocar, J. (1980, July). Applications of,,""ri1;Sh!spOnse theory to analysis of attitude scale translations (80
;:P~J'~:r.champaign, IL: ' Department of Psychology, university of Illinois.,"(OTIC No. AD A087834)
-~:;',~:t);)tl::~';' ,~' ,.... ~; t
Hulin, C. L., Orasgow, F., & Komocar, J. (1982). Applications of itemresponse theory to analysis of attitude scale translations. Journalof Applied Psychology, g(6), 818-825. '
Hulin, C. L., Lissak, R. I.: &Orasgow; F. (1982, Summer). Recovery oftwo- and three-parame'ter 10gi sti c item characteri sti c curves: A MonteCarlo study. AppJied Psychological Measurement" !(3), 249-260.
Humphreys, M. A. (1982, Winter). Data collection effects on nonmetri.cmultidimensional scaling solutions. Educational and Psychological
'Measurement; 42(4),,1005-1022.
Hyman, H. H., Cobb, W. J., Feldman, J. J." Hart, C. W., '& Stember, C. H.(1954) • Interview; ng ';n 'social 'research ~ Chi cago: ~n; vel'S; ty of
'Chicago Press.Ethnic BackgroundInterviewing
Imad~, A. S., & London, M. (1979). Relationship-between SUbjects, scales,:and stimu 11 in research on soci a1 percepti ons. Perceptual and MotorSk;11s, 48, 691-697. "Ethnic Background
Innes, J. M. (1977). Extremity and ,"donlt know" sets in questionnaireresponse. British 'Journal 'of Social C1ini'cal Psychology, 16, 9-12."0 0n l t Know" category, ,; -
·Ir.onson, G. H., & Smith, P. C.' (l981, SulTlrier). Anchors away -- the stabil~ity. of meaning of anchors when their· location is changed. PersonnelPsycho1 ogy, l1.( 2), 249-262.·,:"
I~ancevich, .J. M. (1979;). Longitudinal study' of the effects of rater: "~'i';i
training o'n 'psychometric error in ratings. Journal of Ap'pliedrnpsy"':'tholoq'y, 64( 5)~ 502-508.' ,. -:;1,"'1';:'1""Behav-loranxpectati on Scales ",;" . ::"'t~1
Ivancevich, J. M. (1980). Behavioral expectation scales versusnohanchoredand trait rating sy~wms: A sales personnel application\ App'liedPsychologi cal. Measurement, 4(1), 131-133.Behavioral Expectation ScatesResp'onse A1 terna ti ves
Jacobs, R., Kafry, D., &Zedeck, S. (1980). Expectations of behaviorallyanchored rating scales. Personnel Psychology, 33, 595-640.Beh~viora lly Anchored Rati ng Sca les - ,. '.Cognitive Complexity
200
()'. "
.._----,-~,--- ---
0,
",'J
Jesteadt, 'W. (1980). ,An adaptive procedure for subjective judgments .. Perception and Psychophystcs~28, 85~88.
Multiple-Choice Scales --
Johnson, J. D. (1981). Effects of the order of presentation of evaluativedimensions for bipolar scales in four societje,s .. , The Journal ofSocial Psychology, 113, 21-27.Ba1anced I terns -,
, Bipolar Scales
Jones, A. P., Main, D. S.,Butler, M. C., & Johnson.: L;:':A., (l982). Narrative job descriptions as potentiaTsources of'~:O,~a,naiy~'is ratings •.Personnel Psychology,1§., 813-828. "V . ,
Kafry, D., Zedeck, S., & Jacobs, R. {1976L Short notes:::!:"'hesp~J~bilityof behavloral expectation scales as a function ofa,~Y'eropinetital cri-teria. Jc)urnal of Applied Psychology, &.1=-'4),519-522.,' .Behavi,or~l. Expe.ctation Scales
.~.. ~ '/'>".;/~"'~:-r' .\..
Kalton,G. (198;3L :'1"h'troduction to survey sampling:i:B:everly'Hills, CA:Sage PUblications. '"
Kane, J. S., &Bernardin, H. J. (1982). Behavioral observation scales andthe ev'al ua::tii on of· performance apprai sal effec tiVeness. Personnel Psy-cholo~y, 35; 635-641. . - ",: _:. ~;"
Behav10rar-Observation Scales. .J'
K~ne, J. S., & Lawler, E. E. (1979)~ Performance appraisal ~ffective~ess:Its assessment and determinants. In B.' Staw. (E?.f':), Research in organizational behavior (Vol. 1) (pp •.425-478). Gree'nwic,h, CT: JAI P·ress.
Katcher, B.L~,,& Bartlett, C.' J. {1979, Apr:nLR~ffn;errors of incons,istenCYLas a ,function of·dimensionalityof;behav.10ral anchors Re-'search Report N,P,. 84). College Park, MO: 'Untve.rsity of Maryland,
'" Depar1meritof Psychology. (OTIC No. AD A068922·):·Mixed Stan~ard Scales
~ :' ..
Kearney, W. J. (1976~ June). The value of behaviorally based performance~ appraisals. Business Horizons, 75-83. .
Kearney, 'W. J. (1979, January). Behaviorally anchored 'rating scalesMBO' s 'mi,ssing ingredient. Personnel Journal, ~(1), 20-25.Behaviorally Anchored Rating .ScalesMultiple-Choice Scales
Keaveny, T. J., & McCann, A. F. (1975). A comparison of behavioral expectation scales and graphic rating scaijes. Journal of Applied Psycholo-H' iQ., 695-703.
. 201
0',..
Kelly, .G.A. (1955). The psychology of personal constructs (Vol. 1). New"York £.;. Norton ·Press.Cogniti ve Compl ex; ty
Kennedy, R., Bittner, A.; Jr., Carter~ R., Krause, M., Harbeson, M., McCafferty, D., Pepper, R., & Wiker, S. (1981, July). Performance evaluation tests for environmental rese'arch (PETER): Collected papers(NBDL-80R008). New Orleans, LA: Naval ~iodynamics Laboratory. (OTICNo. 'AD Al11296) .
, Kennedy, R. S., Bittner, A. C., Jr., Harbeson, M. M.', & Jones, M•. B•. _..:.L1.9~81,November). persrectives in performance evaluation tests for environmental research PETER) (NBDL-803004). New Orleans, LA: Naval Biodynamics Laboratory. lDTIC No. AD Alll180)
Kennedy, R. S., Jones, M. B., & HarbesolJ, M. M. (1981, Novembe.r). Assess-:ing productivity and well-being in Navy workplaces. New Orleans, LA:U.S. Naval Biodynamics Laboratory. .
Kesselman, .G., Lopez, F. M., &Lopez, F. E. (1982). The development andvalidation of self-report scored in-,basket test in an assessmentcenter setting'. Publfc Personnel Managernent, .!.!..(3), 228-238.
Kiesler, C. A., Collins, B. EOf & Miller, N. (1969). Attitude change: Acritical analysis of theoretical approaches. New York: John Wiley &Sons, Inc., .Semantic Diff~rential Scales.
Kingstrom, P. O. (1979). The effects of rater":ratee interactions' and theformat of apprai sa1 interviews on ra ti ng characteri stics::'a:nu" :fe~'dback.Dissertation Abstracts, 39(10-B), 5114~ .... U{'';'''(;)lInterviewing - ',q,
Kingstrom,P. 0.,& Bass, A. R. (1981). Acriticalarr~Jls!isof·studies,comparing behaviorally anchored ratings'cales (B;A!RS:)k\~ndother,rating. formats. Personnel Psychology, 34, 263~289~.'" ::{:1;"; .. "
Beha,vi orallyAl1chored Ra, t,in.g Scalis .'
. K1i mo~~~."i~,;; "&i~ttn~4~n,,;;;~;;'X(iif~4i;,i;:~~~~~; r~:er~ri~erformance .ap-..........._..._Rra i'sal • Jour'riaJ;','of';:Ap,pl ted ;'Psychol:b9t'; ,.§i(4), 445-451. .
Klockars, A. J. (1979). Eval~ative confounding in the choice of bipolarscales. Psych'cflogi car "Repo\r;t~~';\ tIl:'775.Ba lanced ItemsBipolar ScalesSemantic Differential Scales
Klockars, A. J., King, D. W., &King, L. A. (1981). The dimensionality of'bipolar scales in self-description•. Appli~d Psichological Measurement, 5(2), 219-227.npol ar ScalesSemantic Differential Scales
Klores~ M. S. (1966). Rater bias in forced-distribution ratings. Person- c:»nel Psychology, ~, 411-421.Age
202
o
Koch, W. Rot & Reckase, M. D. (1978, June). A live tailored testinr comparison study of the one~ and. three- aramet;er: 10 istic mode1sRe-searc Report 8- • Co urn 1a ,MO:; D~p~r·tment 9 uca tl ona1 P~y-chology, Universi~ of Missouri. (DTIC No. AD A058528)
Koenig, R. (1983, April 18). Interest rises in testing by computer. TheWall Street Journal.Future Resear.ch
l~
Korschot, B. C. (1978, July-August). Quantitative evaluation of investmentresearch analysts. Fina:hcfa1 Analysts Journ.al,41-46.
Kowals'ki, R. (1984). AI and software engineering. Datamation, 30(18),92-102.
LAVM/RV OT II human factors assessmeht materials.U.S. Army Research Institute for the,.~~havioral and(ARI), HQ, TCATA, PERI -SH., ' "
Krohn, G. S. (1984) •Fort Hood, TX:Soci a1 Sci encesInterviewing.Number of Scale Points
.•..~
Krus, D. J., &Krus, P. H. (1977, Spring). Normal scaling>;6f the unidimensional dominance matrices: The domain referenced model. Educationaland Psycholog.i ca1 Measurement~ R(l}, 189-'193.
.': " ..
. r' . -f'.;-...
Labaw, P. (1980). Advanced questionnaire design (2nd ed.l., C'l!PlbrJl1ge,. MA:Abt Books.BranchingInterviewingOr,der;.Qf I ternsQuesti'onnai're LayoutWording of Items and Tone of Wording
oLahey, M. A., &Saal, F. E. (1981).
,compatibility theory of ratinggy, 6Q( 6), 706-715 •.~gnTEi've Complexity
.' , .. ' .",' ,r· .::; \!:' ~! ... .': ~ ,.; . ,
Evidence incompatible'wfth,a' cogni tivebehavior. Journal of Applied Psycholo-
.J :
Lamont, L•.;M., & Lundstrom, W. J. (1977, November). Identi fyi ng successfu 1industrj aT sal esmen by personal i ty and personal character; sti cs.Journal of Marketing Research, li, 517-529.
o
Lampert, S. I. (1979). The Attitude Pollimeter: A new attitude scalingdevi ce. Journal of Marketing Research, 16, 578-582.~e -Continuous and Circular ScalesEducation
Landy, F., & Farr, J. (1980). Performance rating. Psychological Bulle~in,
87, 72-107.AgeBehaviorally Anchored Rating Scales'Educati on,Ethnic BackgroundGenderResponse Alternatives
203
"';\::,:,: ;,""",'.; .
Lah;d~:i~,;"F;i~;¥:.i."~J:ij·~'th~·~(;:,,J::.,L.~ (1919). Scaling behavioral anchors. Applied:;j'iJ~'§Y:CW(j~]'Og:ljC~'~Y,Me'asu'rem:ent,l( 2), 193-200.
'BehaviorallY" Anchored Rating ScalesPa1r'ed-Comparison Scales
Land-Y':, F."J., Barnes-:-Farrell, J. L., Vance, R., J., & Steele, J. W. (1980).Statistical control of halo error in performance ratings. Journal ofApplied Psychology, ~(5),501-506. "
Landy, F.J., Farr, J.t., Saal ,F.E., & Freytag, W. R. (1976). Behavi orally anchored scales Tor rating the performance of police officers.Journal of Applied Psychology, 61(6), 750-758.Behaviorally Anchored Rating S,ciTes,
LandY,F. J., Vance, ~. J., & Barnes-Farrell, J. L. (1982, April). Statistical control of halo: A response. Journal of Applied Psychology"£(2),177-180.
La Rocco, J. M.,& Butler, M. C., (1977, December). Survey luestionnaires:More than meets the eye (77-57). San Diego, CA: Nava Health Research Center. (OTIC No. AD A100262)
, . '
Latham, G. P., Fay" 'C. H., & Saari,L. M. (1979). Th~ development ofbehavioral observa~ion scales for appraising the perfonnance of,foremen. Personnel Psychology, 32, 299-311.Behaviqral E,xpectati on ~,,9aliesBehavi ora1.Obse"rva.ti on:. ScaTes
Latham, G. P.', Saari, L. M.,:~ Fay, C. (1980). BOS, BES, and baloney:Raising kane with Bernard{n. ,Personnel Psychology, 33, 815-821. ,
.... - .'
Latham" G. P., &Wexley, K. N! (1977)~ ,Behavioral observation scales for" performance apprai sal purposes'. Personnel Psychology, 30, 255-268.
Behavioral Observation Scales' . -
La:!:ham, G. P., &Wexley, K. N. (1981). Increasing productivity throu~h
performance appraisal. Reading, MA: Addison-Wesley. ;:}?'
Layne, B. H., & Thompson, D.N. (1981'). Questionnaire page len,gt,h~,?,g, return rate. The Journal of Social Psychology, 113, 291-292~
, ,~. __ Leng tho of_J~lns ~n.d Number of' +~~s -Questionnaire Layout
?' ',,:, ·<~t~{·.. )
Lee, R., Malone, M., & Greco, S. (1981)~ MUltitrait.;.mul'ti.fIIethOd.:::mli'f"~irateranalysis of performance ratings for law enforcementJ)'e~sonneI~:',~.pour-
, nal of 'Applied Psychology, §.(5), 625-632. .. ", ';',1,1:;:''''"
Lee, R., Miller, K. J., & Graham, W. K. (1982)~ ,Corrections for restrictionoftange.arnt..~ttenua.tion' tn criteriqn-related va14dation studies.Journal of Applied' Psychology, £(5), 637";639. ' .
. I -
Levine, E. L., Flory, A., & Ash, R.A. (197:7). Self-assignment in personnel selection. Journal of Applied Psychology, 62(4), 428-435.Ethnic Background ---
204
Lienert, G. A., & Ra-atz, U. (198-·1;" Spri,ng). - Item homogeneity defined bymultivariate syrrmetry. Applied Psycholog1calMeasurement, ~(2),
263-269.
C) Link, S. W. -(1982, September).and partial information.
Correcting respP9s~ measures for guessingPsychological Bulletin, 92(2), 469-486.
/
',0
Lissitz, R. 101., &Green, S. B. (1975). Effect of the number of scalepoints on reliability: A Monte Carlo appr-oach. Journal of Applied'Psychology, 60, 10-13.Number of Scare Points
Locander, W. B., & Staples, W. A. (1978). Evaluati'n~fand motivating, salesmen with the BARS method. Industrial Marketing Management, 1., 43-48.Behaviorally Anchored Rating Scales
Lodge, M. (1981). Magnitude scaling: Quantitative measurement of opinions. Sage University 'Paper Series: Quantitativ~ App·lications in theSocial Sciences, ~.
n' ';':"''''''< '.~r; ", ," \..,,;.- ,,, .London, M., & Poplowski,'J. R. (1976). Effects of inforlT!a:tion~ on stereo-
typic development in performance appraisal andinterv,i~w. contexts.Journal of Applied Psychology, 61(2),199-205.Gender'
Lord, F. M. (1982, F'a11 ). ' Standard error of an ,equa ti'n"g" by'{~m' responsetheory. ApplTedPsycholagical Measurement, 2o(4}, 463"',472';.'
" . "" ::" "-:\,: :'1 i ,:";:'., ..::" ~~::,:.'.,::~' . .
Lund,'rl"Irgi's, Apri1). An alternative ·content meth,od"'f0ri~l{mwl~tid·i·mensfonalsea ling. Mul ti varia te Behavi ora1 Research,1Q.(.tr;-~18-1?~'1'9t:;Zf;;t:(: "
- ,
Mab,e, ~~'kr'; I'll ~ & Wes t, S. G. (1982). Val i di ty of ;sel·,f-,~"aluation of ''a:bn'fty:,.: A review and meta-analysis. Journal o~"'~~e~>i';d~'PSY'Chology,&1.'3), 280-296 • ,;",., , ::?i}'.~,>'" ","
Malhotra, N. A~ (1981). A scale to measure self-concepts; person concepts,and product concepts. Journal of 'Marketing Research;~~l2l~/456-464.
Future:,Research,Semarf~l~'pifferentia 1 Scales
Mann, I. T., Phillips,J. L., &Thomp~on, E. G. (1979). An examination ofmethodological issues relevant to the use and interpretation of the_~em~n~t~.,4tf.f~rential. Applied 'Psychological Measurement, 1,' 213-229.BipolarScale~' 'Semantic Differential Scales
Marascuilo, L. A., & Slaughter, R. E. (1981, Win~r). Statistical procedures for identifyfng possible sources of item bias based on -sub (x)-sup.;.2 statistics. Journal of Educational Measurement, 18(4), 229-248. -
Marshall, S. P. (1981). Sequential item selection: Optimal and heuristicpolicies. Journal of Mathel11atical Psychology, ~, 134-152.
205
Marttr:N2r'W'f~~S;~; (197a, May). Effe<;ts of scaling on the corretation coeffi9i'~ritiP Add-i.tional.J:QnsJderations.· Journal of Marketing Research, 12.,304'...;308.
Martins,··G. R.. (1984). The overselling of expert systems. Datamation,. 30(18), 76-80 ..
rliture Research
Perfor-
Matarazzo, J. D. (1983). Computerized psychological testing. Science,221, (4608).Future Research
Mathews, J. L., Wright, C. E., Yudowitch, K. L., Geddie, J. C., & Palmer,R. L. (1978, August). The 'percei"ved favorableness of selected scaleanchors and response alternatives (Technical Paper 319). Palo Alto,cA: operations Research Associates, and Alexandria, VA: U.S. ArmyResearch Institute for the Behavioral and Social Sciences. (DTIC No •.AD A061755)Middle Scale Point PositionResponse Alterna ti yes
Maul, T. L., & Parglllan, D'{1975). The. semantic differential as a psychometric instrument for behavioral research in sport. International'Jourma" iof,:Sp'ort Psychology,' .9( 1), 7~15'~
Semantic Differential Scales -
Mayer, C'. S.,,& Piper, C.(1982). A note on the importance of layout inself-adminis~red questionnaires. Journal of Marketing Research,19(3),390-391-~estionnaire Layout
Mayerberg, :C.'K ~, '& Bean, A. G. (1978, Fa fl). Two types of factors in theanalysis of semantic differential. attitude data. Applied Psychologi-cal Measurement, 1(4), 469-480. '. !'j ;·r<]r
• \ I' ~ \. .,
McBride, J. R., Sympson, J. B., Vale, C. D., Pine, S. M., &Bejar, I. I.(l9·77,<March):.., Appltcatfons,of', computerizedadapti-ve testin, (Research Report'77-l) • <'M; nneapoli s; MN :';- Depar'bnent of Psychoogy,Uni versity of Minn.~~9~~;;;~,.tQIIC No. AD A03~114)
McCormick, C. C., & Kavanagh, J. A. (1981). Scaling interpersonal checklist items to a circular modeL::Applied. Psychological Measurement,5(4),421-447. ' ;.~ontinuous and Circular Scales
206
-------_.~------_._-----_._--- ------------~--~-_._----
o
McDonald, R. P. (1981). The dimensi onality of1:ests and items. Bri ti shJournal of Mathematical and Statfstical psYchol02.l, 34(1), 100-117-
McDon'ald, R. P. (1982, Fall). Linear versus nonlinear models in i.temresponse theory. Applied Psychological Measurement, i(4), 379-396.
McFarland, S. G. (1981). Effects of question order on survey responses.Public Opinion Quarterly, 45, 208-215.Gender -Order of Items
'~ McIver, J.P., & Carmines, E. G. (1981). Unidimens1'onal scaling. SageUniversity Paper series on quantitative apPlications in the socialsciences, 07-024. Beverly Hills and London: Sage Publishers.Behavioral Expectation ScalesBehavioral OQservation ScalesMixed Standard ScalesMUltiple-Choice ScalesPaired~Comparison.ItemsRank Order Scales
I~
McKelvie, S. J. (1978),. Graphic rating scales -.- how many categories?British Journal of Psychology, 69; 185-202.Continuous and Circular Scales -Number ,of Scale' PointsSemantic Differential Scales
Mei se1s ,M. ,& Ford, L. H.( 1969) • Social desi rabiHty "rfi'sp,on'se set andsemantic differential jUdgments. Journal 'of Socialt'Psy-chology, .~'45-54. . '.' ;,,.., ;'ry" , ,.
Gender
MeHenbergh,'G. J'. (1982~' SUl1I11er). Contingency table mod~ls';for assessingitem bias. Journal of' EducatfOl1al Statistics, 2.(2)/'105-118.. .
Melzer, C. W., ~oeslag, J. H., &Schach, S. S. (1981). C~rrection ofitem-test cOr'rel.ations and attempts at improvin'g reproducibility inite~a.nAJysis:.An experimental approach. EducationaJand Psycho.10gical~:Mea:s'Urement~ .ll( 4), 979-990 •
.~ ~..-' ' ", ;"V":' .,,~.',' '.. ,'- .~. ><; ;'- • •
Menezes, D;', &E'lbert,- N. F. (1979). Alternative semantic scaling formatsfor meas'i.mingcstore image: An evaluation. Journal of MarketingResearch ,16(1),.~0-87•Quest; onnaITiftayoutResponse A1terrja~iv'es
. .
Meriwether, T. N. (1979 ,May). Developing a job· analysis based performanceappraisal system at the United States Military Academy: A new approach to forced-choice evaluation. Dissertation Abstracts International, ~(11-B).
Messick, D. M., &Van ~e Geer, J. P. (1981, November). A reversal paradox.Psychological Bulletin, 90(3), 582-593,'
207
r

. ;»,.,·.,x:~.'}\'~' ~i\~:":"':'~'~::~~""';';:';'~iPt~ ~'/;}:,~.~:;. ~,.~ I , I - " ':::<',)" . '.
""'. :,:.,'\.';::,~.: .".- ... 'Y \':·,' ..:·... i :
M'essme~;~i)i·~\:j·;l~,~,,~seyrnour, D. T. (1982 ~ SUl1l11er). The effects of branchi ng".',i~••::~~~"~;~T.;,;:t.e'sponse. Public Opinion Quarterly, 46(2), 270-277 •
. BranchingEdlJca ti on 1(')
-k..... ,.
,-' ,:
Meyer, H. H. (1980). Self-appraisal of job performance. Personnel Psychology, 1l, 291-295.
Miller, P. M. (1974). A note in sex differences on the sementic differen,ti al s. BritfshJo'urna1 of Social Cli "lca1 Psychology , .13', 33-36.Gender ---
Mokken, R. J., &Lewis, C. )(1982, Fall). A nonparametric approach to theanalysis of dichotomous item responses. Applied Psychological r~easurement, i(4), 417-430.
Mooney, G. R. (1981, September). An ana.lysis of rater error in rela~ion toratee job characteristics. Dissertation Abstracts International,42(3-B).- .. '
Moroney~W~ F. (1984). The use of checklists and guestionnaires duringsystem and eguipment test and evaluation. Shrivenham, E:ngland: J~ATO
Defense .Besearch Group Panel VIII Workshop, Applications of SystemsErgonomfcsto Weapon System Development, Royal ·Military College ofScience, Vol 1, C-59-C-68 •.F'uture Research,Mul tipl~""Ch9iceSca les:
. ' '; -, ..,' '" .':.'.. '. ~
Motowidlo, S. J ."~ &"Iformiil'i ~"W ~'C. (1977). Behavi orally anchored scales formeasuring morale in mili'tary units.· Journal of Applied Psychology,62( 2), 177-183.trehaviorall~ Anchored Rating ,Scales
. ~
,
Mueller, J. E. (1973). War, presidents and public opihion. New York:John Wiley & Sons •
"WQrdirtg :of Items and Tone of Wording
Mullins, C.J. (1981, June). AFHRL conference on ht.man appraisal: Proce~dings (AFHRL-TP-81-20). Brooks Alr Force Base, Tx: Manpower'an~l~
:.".P~.r:~Qnnel Division, Air Force Human Resources Laboratory. (DTIC .~Q.",,(/--.-.. -.- ... ··: ....--AD-,(nrtrs'S')-..-........··.. . .. ",.".. ..,'
Munson, J. M., & McIntyre~ S. H. (1979').'" Developi'rig. ;pract'ical pr.Qceduresfor the measurement of personalXl1.1uesi,n cross-cuJtura1 marke~i'ng.Journal of Marketing Research,,16~' 48-S2.Paired-Comparison Scales '77' . , ,
208
',:
if(' .
o
·0·····.~. ~ .. '
Murphy, K., Garc~a, M., Kerkar, S~, Martin, C., &B~lier, W. (1~82)·.Relationship between observational accuracy an9,~~f:uracy :in evaluatingperformance. Journal of Applied Psychol ogy,67 ;' 320-325.
Murphy, K. R. (1982, April).. Difficul ties in the stat·isti'ca 1 control of·halo. Journal of Applied Psychology, £(2), 16i.::i~i-,n
Murphy, K. R., Martin, C., ~ Garcia, M. (1982). Do ~~h~~~~ral observationscales measure observation? Journal of Applied Psychology, £(5),562-567.':.ii"i,:';,i'i ,:', ,
Behavioral Observation Scales. ""
Myczyk, J. P., & Gable, M. (1981). Unidimensional (glob~J);vs •. multidimensional composite perfonnance .appraisals of store ma~ifg~r$.~ ',. Journal ofAcademic- Marketin!] Science, !(3),. 191-205.;}::,'::;':',:,',. ,-
Myers, E. (1984). Business takes the fifth. Da:tamati,On;'i{~rt~§Jt,-;!:.~,,~;,~57.. Future Research .. ,.. ,;'; ...~;.
:~."
• , ".; "" "r.," .~: z:q,~~:f;· :~\t~:~~;Zi·XJ .~,
Neill, J. A., & Jackson, D. N. (1976, ·Spring). MiniIl14gtliJt!!.!tH)J.,9~!1C::;'f:i'i:\i:;.;~manalysis. ,Educational and Psychological Measurement, ,,36,{z1) , '123-134.
;; •.' ..' .';.' '?;\:; ,"'~:J(~\[~~':t~:~;" '. ,,'C.,',.Nemeroff, W. F., & Wexley~ K•. N:.< (1979). An explorati:Qni';onhlMi'~~i!\\~~Jf~;tjion
ships betweenperformaric:efeeqback interview charac::;te.rJ$:ti'.C::;~,'an!:!::::i nterv iew outcomes as percei ved by managers and subordiha'\teSio'i J,,;,:J.()urna 1of 0ccupati ona1 Psychology, 52. 25-34. ',"Interviewing ',' .' ." .. ',..;
11.:,";;!:L.·t;",._ 'iJ)!1~~.)·<{~.. t' ~
Nevo, B. (1980, SUl1lTler). Item analysis withsmall.,sall1pJ~~;.! 'A:ppl;;,edPsychologica,l Measurement, 1.(3),323-329.
""':"',' '," -~::;"i.·,:A-, :~:!;1'~Y' ,r:',.:~"·.}~:~~{~t;,:',~ \6",;./ ',~' . '.: . . .. ' ,. '\ ':~J:, ,-.i ..:... ,r,;.~. ,t.... _., :) ;' t .' ..," ~; !} -
Ng,' S;~·;.H,~j~,,;~(;·I9~-?r~<'txc~.Qo~:tng between the ranki,ng, and.r~&i):!g,r,p,rpQ~dur~.s forthe'cOmpar.iscmofvalues across c:ul tures ."European:;,Jourmilof ,Soci a1Psychology, 1'2(2), 169-172. . '" '.
Nortonj S. D.~ GU~)'tafs6n, D. P., & Foster, C. E.C!97,,7J.Ass,essment for 'management p.otenti aJ: ' Scale desi gn and deve1opmel1t,trai'n.i ng' ,effectsand rater/ratee sex effects. AcademyoT;ManagementJournal,20.';
.117-13l.Gend'er " ,'.. j
N~gent, W. A., Laabs,
avy
209
NUllt:;'C:~'i<H .• d1980, April). Design considerations for multidimensional"'Sc'a~t'{ng':' Behavior Research Methods and Instrumentation, 12(2),274-
280"~"'~"-' . " -
Nunna:l:lY,J. C. (1967). Psychometric theory. New York: McGraw-Hill.Number of Scale Points
Nunnally, J. C.,Leonard, L.C., & Wilson, W. H. (1977). Studies of voluntary, visual attention -- theory, methods, and p'sychometric issues.Applied Psychological Measurement, 1, 203-218.
Nygren, T. E. (1982, April). Conjoint ,measurement and conjoint scalin~;_ Ausers guide (AFAMRL-TR-82-22). Wright-Patterson Air Force Base, H:Air Force Aerospace Medical Research Laboratory, Aerospace MedicalDivision.
Oaster, T. R. F. (1982).' Index for diffe.rentiation of state and'traitscales with new stressor scales. ' Psychological Reports, i!.' 272.
Oborne, D. J. (1976). Examples of the use of rating scales in ergonomicsresearch.· Applied Ergonomics, 7(4), 201-204.C'qi'ltj'rmousandC;rcular Scales - ,
O'Neil,M~.J. (1979).· Estimati.ng the non-response bias due to refusals inte,':lephone: $!J..tv~y.~.~ PlJbl i c Opi ni on Quarterly', 43, 218-232.Age '. . . -EducationEth~i'C:"Ba.ckgY'ound .';
:' i'
'Orlich, D. C. (1978). De'sig'nJrig' sensible surveys. Pleasantville, NY:Redgrave-'Publ i shi ng,iCompany.Behavioral Observation ScalesInterviewingMul tip le-Choice ScalesOpen-Ended I terns and Closed-End I ternsRank Order Scales 'Wording of Items and Tone of Wording
Orpen, C. fi981). The ~ffect of examiner ethnicity on the job satisfactionresponses' of Blacks in conmunity surveys: A South African study •
............... __yQl!rn~lQf C()mmuni ty' Psycho logy" .2.( 1), 81-85.
Ory, J. C.(1982). Item p'lacement and wording effects on overall ratings., Educa'ti6na'1 and Psychol ogi ca1 Measurement, 42, '767-775. ,',;it>---.-Balance&'''-}tems .; ",;ii,yty'
Wotding'of Items and Tone of Wording
Osgood, C. E., Suci, G., & Tannenbaum, P. (1957). The measurement ofmeaning. Urbana, IL: University of Illinois Press.Bipol~r ScalesGendE!Y' .Semantic Differential Scales
210
----_._ .._._-------------- ---~-----------~-------~--
..
Palachek. A. D•.• & Kerin. R. A" (1980, AugustJ.,...Aiternative approaches tothe two-group concordance problem in brand preference rankings.~,;;,
Journal of Marketing Research. 386-389.
Parad~se, L. V., &Kottler, J. (1979, August). Use, of Q-factor analysisfor initial instrument validation. Psychological Reports, 45(1).139-143.
Parkinson, R. (1977, November) • Recipe for a realistic appraisalsystem~
Personnel Management, 37-40.
Parsons. C. K.. ,& HUlin, C. L. (1982). An empiti,~al,~.omparison of 'itemresponse theory and hierarchical factor analysis 'ill applications tothe measurement of job satisfaction. ,Journal of Applied Psychology,67(6).826-834.
Peabody. D. (1967). Trait inferences: Evaluative a'ridJ{~~~riptive aspects ..Journal ,of Personality and Social Psychology Monog~apht I, pp. 644.
. . . ~:.~ ;>·?·,t~:~~.T~'~ :Peterson. J. M. (1977. August). 'The influence offa\!Ql'7~pJEr~ontexton
questionnaire response. Dissertation Abstracts Internati,onal •381(2-A). 747.;:~,{;~(il~\·,'
Petz. B.. ,.&, Mayer~;'Q).\.J1977). Comparison between Thurstql'1~~'s ~a\'l Of Comparative"Judgmentsscale and the Sum of Totals scal~. Acta. In'stituti
PSYChO~,~9iCi,No,.' ~9-8~",5S-'~64.::;_'~~:":;::rf'\S~;$!~j';4'.;; '.
Presser. S. ~ & Schuman. H. (19'80). The measurement of a rn;t~dTe:· posi ti on in. attitude surveys. Public Opinion Quarterly. 44(1) •. tQ:~~~'
Education - ",r' h."
, Middle Scale Point Position i'" ! ,:
~ .. : ;..
Primoff. E. S. (1978. August). The use of self-assessm~rlts;:i-";examining.A paper presented at the 86th Annual convenbon of"lHe Am!2rlCan Psychological Association. Toronto. Ontario. Canada. , (NTIS No. PB-298606) , .
Pulako\s' •. ~'. ,o~:q.984. ~ay) •. The develoement of traini:ng.pro~rams to in-'. crease accuracy wlth dlfferent ratlng formats (84 ....2). ast Lanslng.
MI: Oepar'tirient of psycHo logy. Ml CHl gan state' Universi ty.
P'ursell,E'. D•• G~l11piqn, M. A., & Gaylord. S. R. (1980. November). Structured in,terviewing: Avoiding selection problems. Personnel Journal,907-912.
Pursell. ,E., D., Doss~j;t. D. L.. & Latham.G. P. (1980). Obtaining validpredictors by mHiimizing 'rating errors in the criterion. PersonnelPsychology.~. 91-97.
Range. L. M•• Anderson. H. N•• &Wesley. A. L. (1982, October).ty correlates of multiple choice answer-changing patterns.log i ca1 Reports. §l( 2). 523-527.
211
PersonaliPsycho-
R~~~~'i~,~0'G:;::'!,;(1980). The comparative validity of Likert, project-ive, and~j,!qHirf?ir:c'e'd::';choice indices of achie,vement motivation. The Journal' of
Soda'l Psychology, 111, 63-72.Mult1ple-Cholce scaleS
~ay, ~.;' J. (1982). The construct validity of balanced Likert scales.Journal of Social Psychology, 118, 141-142. 'Sa1anced Items -
The
A program to analyzeBehavior Re'se-ar'ch
Ray, J. J., & Bozek, R. S. (1979, June). NSCALE.II:, and score multi scale surveys and test batteries.
Methods and Instrumentation, 11(3),402.
Reid, G. B., Eggemeier, F. T., &Nygren, T. E. (1982)., An individualdifferences approach to SWAT scale development. Proceedings of theHuman Factors Society 26th Annual Meeting, 639-642. 'F'uture Research
Reid, G. B., Shingledecker, C. A., &Eggemeier, F. T~ (1981). Applicationof conjoint measurement to workload scale development. proceedings ,ofthe Human Factors Society 25th Annual Meeting" 522-526.Future ResearCh'
Reid~ G. B., Shingledecker, C. A., Nygren, T. E., &Eggemeier, ~. T. (1981,October). Development of multidimensional subjective measures of'wo'rkload''': Proceedings of the Internati:onal Conference on Cyberneticsand Society, sponsored by IEEE Systems, Man andCybernet;cs Society,Atlanta, GA, 403-406. ' , ;)',Future Research ""
Reynolds, T. J. (1976, June). The analysis of dominance matrices: Ex~,traction of unidimensional orders within a mUltidlmensional context(Technical Report No~ 3). Los Angeles, CA: ,Department of PSyc,hology"University of Southern California. (DTIC No. AD A029,450)' "
Reynolds, T. ,J. (198(, Fall). ERGO: A new approach to'multidimensionalitem analysis. Educational and Psychological Measurement, 41Cn,;~·643-659 • T::::i',~J'
, '
'Reynolds, T. J., & J'olly, J. P. (1980).evaluation of alternative methods.531-S36., 'Future Research'Paired-Compari son I ternsRank Order ScalesResponse Alternatives
212
'", -,,' \,.;"".
Measuri'ng personal values: ,AnJournal of:Marketing.'Research, .!1.,
,!o/I= .':'
()
:0
Ridgway, J., MacCullough, M. J., &Mills, H. E.~(1982). Some, exp~riencesin administering a psychometric test with a light pen and microc9mpu:"
. ter. IriternationalJournal of Man-Machine Studies, .!.?.(3) , 265-278., .
RigneY,J. W., Towne, D. M., Moran~ P. J., & Mishler, R. A. (1980, July).'Field evaluation of the generalized maintenance traine'r-simulator, II.AN/SpA-66 Radar Repeater (NPRDC TR~8-30-2). San Diego, cA: NavyPersonnel Research and Development Center.Rank Order Scales
Rizzo, W. A., & Frank, F. D. '(1977,' Fall). Influence of 'irrelevant cues'and alternate forms of graphic rating scales on the halo effect.Personnel Psychology, 1Q.(3) , 405-417.
'Robertson, 1. T., & Kando1a, R. S.(1982). Work sample tests: Validity,adverse impact and applicant reaction. Journal of Occupational Psychology, 55', 171-183.
Rokeach, M. (1973). The nature of values. New York: Free Press.Paired-Comparison Items
Roscoe, J. T. (1975). Fundamental research statistics for the behavioralsciences. New York: Holt, Rinehart, and Winston, Inc.Multiple-Choice Scales
Rose, G. L. (1978)." Sex effects'on effort at~ributions in' managerial,. performance eva1uat'i on.' Organfiatfo,nal Be'ha,,:iorahd' Hum~n ,Perfor
mance, 21, 367-378.Gender -
Rosinger, G., Myers, L. B., Levy,.G., Loa'r,M., Mohrman; S. A." & Stock, J.R•. (1982). Deve1opril.ent of behav1 ora11y based.. performance appra i sa1system. Personnel Psychology, 35, 75-88.Mixed Standard Scales,' - '
Rounds, J. B., Jr., Miller, T. W., & Dawis, R. V.(1978, Summer). Com-pcfrability of mU1tip'le rank order and paired compa,irison me,thods. /AppliediPsycho1ogical Measurement, £(3),415-422.
;<.F:; ·:'\~.l\r:·: d.·;·~i~. .' I \
Roy, J~ J'~ (1982),. Machieavellianism, forced-choice formats and the valid1ty,'of'''the F' scale: A rejoinder to Bloom. Journal of ClinicalPsychol ogy ,38( 4), 779-782.
Rudner, L. M., Getson, P. R., & Knight, D. L. (1980, Spring). A MonteCarlo, comparison, ,of seven biased, item detection techniques. Journalof Educati ona1 Measurement, .!L' 1), 1-10. ' ".' '
Rudner, L. M., Getson, P. R., & Knight, .0. L. (1980, Fall). Bia,sed itemdetection techniques., Journal of Educational Statistics, 5(2), 213-233. -
, '
Ryans, A. B., &Srinivasan, V. (1979, November). Improved method forcomparing rank~order preferences of two groups of consumers. Journalof Marketing Research, 16,583-587.- ,
213
---- '~-------'--.
Sa,al",.rh2E ." (1979). Mixed standard rating scale: A c;onsistent system forn;',!)~J'Il~ricallY coding inconsistent response combinations. ,Journal of,.:'Applied Psychology, 64(4),422-428. ' ~
CognltlVe c,omplexlty-' 1jt{·
Mixed Standard Scales
Saal, F. E., Downey, ~. G., & Lahey, M. A. (1980). Rating, the ratings:Assessing the psy.chometric quality of rating data. PsychologicalBulletin, 88(2), 413-428 •.
Saito, T. (1977, July). Multidimensional Thurstonian scaling with an,,·,--_·_~4
application to c.olor metrics. Japanese Psychological Research, 19(2),78-89. ---
Samejima, F. (1979, February). Constant information model: A new, promi si ng item characteri stic functi on (Research Report 79-1). Knoxville, TN: Department of Psychology, University of Tennessee. (OTICNo. AD A070090)
.!
Samejima, F. (1979, Oecem~er). A new family of models for the mUltiplechoice item (Rese~rch; Report 79-4). Knoxvl1le, TN: Department ofPsychology, University of Tennessee. (OTIC No. AD' A080350)
Sauser, W. I. (1979). A comparative evaluation of the effects of raterparticipation and rater training on characteristics of employee performance appraisal ratings and related mediating variables. Disser-ta ti on Abstracts I nterna ti ona1, 39 (10-B), 5116. .
Sauser, W. 1., & Pond, S. B.. (1981). Effects of rater training and par-'ticipation of cognitive complexity: An exploration of -Schneier'scognitive reinterpretation. Personnel Psychology, 34,563-577.Cognitive Complexity ---
Schaefer, B. A., Bavelas, 'J., & Bavelas, A~ (1980). Using echo techniqueto construct student~generated faCUlty evaluation questionnaires.T~aching of Psychology, 7(2), 83-86.WordJng of Items. and Tone of Wording'
Schaef~r,E.· S. (l961). Converging conceptual models for maternal behavior__,.,-'a,'lg:".f.or;-chi,lc1.,-b,ehayj.or,. In J. Glide~ell (Ed.), Parental attitudes and
cll.Hdi behavior. Spr,ingfield, IL: Thomas.ConttnuQusand'Circular Scales
SChae:ffer:;N:(1980). Eva,luatingrace-of-interviewer. effects in a' nati.onalsurvey. Sociological Methods, and Research, 8, 400-419.,Ethnic Background -Interviewing
Schein, V. E. (1973). The relationship between sex role stereotypes andrequisi te management characterj stfcs. JOurnal of App i i ed Psychology,57,95-100.'Gender
214
oSchertzer, C. B. (1982). Semantic properties of commonly used scaling
adjectives. Dissertation Abstracts International, 42(8-A), 3733.
Schmidt, F. L., 'Hunter, J •. E., & Pearlman, K. (1982). Progress in ,validitygeneralization: Comments on Callender and Osburn and further devel~
opments. Journal of App 1i ed Psychol ogy, .67 (6), 835-845.
Schmidt, F. L., & Johnson, R. H. (1973). Effect of race on peer ratings inan industrial setting. Journal of Applied Psychology, 57,237-241.Ethnic Background -
Schmitt, J. C.,& S,cheirer,C. J. (1977). The effect of item order onobjectiV~~~.:t~. Tl;!a..ching of Psychology, 4, 144-145.Order of Item!? -
Schnei er, C. E. (1977a). Operati ona1 uti 1i ty and psychometri c characteri stics of behavioral expectation scales: A cognitive reinterpretation.Journal'of Applied Psychology, 62(5), 541~548.
Behavioral Expectation ScalesBehaviorally Anchored Rating ScalesCognitive Complexity .Mixed Standard Scales
Schneier, C. E. ,(1977b). Multiple rater groups and 'performa,nce appraisal.PUbl.ic Personnel Management, ~(l), 13-20.
Schneier,C. E.~ & Beatty, R. W. ·(1979a).Integrating behaviorally-basedand effectiveness'-based methQds. The Personnel Administrator, 65-76.Behaviorally Anchored Rating Scales
Schnei~r, C. E., & Beatty, R. W. (1979b). Developing behaviorally anc~oredra:tingscales. The' Personnel Administrator, 59-68. -Be~'aY.;Qrally Anchored Rating Sea les .
Schneier, C.E.,& Beatty, R. W. (1979c). , Combining BARS and MBO: Usingan apprafsalsYs'tem to diagnose perfonnance problems. The PersonnelAdmi nistra"tor ,51'-60. 'Behaviorally Anchored Rating Scales
Schonemann, .P. H~ (1982, June). A metric for bounded response scales~
BUlletin of the Psychonomic Society, 2:2.(6), 317-319.
Schriesheim, C. A. (1981). The effect of groupi ng or randomi zed 'i tems onleniency response bias. Educational and Psychological Measurement,41,401-411.
215
---------._-- .~--
'. Schwab, O. ~., Heneman, H. H., & De Cotiis" T. A. (1975). Behaviorally" arichored rating scales: A'review ofthelitera;ture. Personnel Psy-'
-- ----'~c-fiOrogY; --2-8-~- 5tl9;;;562 ~
Scott, W. A. (1968). Attitude measurement. In G. Lindzey, & E. Aronson(Eds.), The handbook of social psychology. Reading, MA: AddisonWesley.
Sedlacek, W. E. (1977). Test bias and the elimination of racism. Journalof College Student Personnel, 18(1), 16-20.Ethn i c Bac kground --
216
""",
Schrf~~h~im, C~>A.J 1981). Leniency effects on convergent and di scrimi nantv~lid;ty;f,or .grouped questionnaire items:. A further investigation.
. Educa'ti ona1 and Psychological Measurement ,11,_ .1093-1099 .
SChriE!~R'~iJn, C. A., & Hill, K. O. (1981). Controlling acquiescence re- /1s'poh"se- bias by item reversals: The effect on questionnaire validity.Educational and Psychological Measurement, 11, 1101-1114.
Schroder, H. M. (19'71) •. Conceptual complexity and personality organiza-tion. In H.M. Schroder&P. Suedfeld (Eds e),Personali tytheory andinformation processing. New York: Ronald.
Schuman, H., &Converse, J. (1971). The effects of black and white interviewers in black responses in 1968. Public Opinion Quarterly, 35,44-68. --Ethnic BackgroundInterv iewi ng
Schuman~H., &Presser, S. ,(1981). Questions and answers in attitude'surveys: Ex eriments on uestion form, wording, 'and context. New
or : . ca emlC Press, ncoAgeBalanced Items1I0 0'n i t KnowllCategory
.Educa ti on .Ethnic BackgroundGender .Middle Scale Point PositionMUltiple-Choice ScalesOpen-Ended Items and Closed-End ItemsOrder of Items.Word i"g of I tel1'!S and Tone of. Wordi ng
Schutz; H. G., & Rucker', M•. H.(l975). A comparison o·f variableco'lfigurations across scale lengths: An empirical study. Organizational andPsychol 09i ca1 Measurement, 35, 319-324.Number of Scale Points ~
o
'.il!l
Segal, D. R., & Savell, J. M. (1975, August):. Research on race relationsin the U.S. Army: The multi~rriethod,matrix. In H. W. Sinciko, & L. A.Broedl ing (Eds.), Perspectives 6n' attitude assessment:, Surveys andtheir alternatives. Manpower Research and Advlsory Servlces, Sml.tfisonian Institution.,Ethnic Background
Shanker, P. (1977). Scaling trait-words by cross modality watching.Indian psychological Review, .!2..(1), 1-6.,'
Shannon, R. H. (1981a). The validity of task analytic ,information to humanperformance res'earch i,n unusual environments. In R. H. Shannon,' & R.C. Carter (Eds.), Task analysis and the ability,:\:requirements of tasks:Collected Papers (NBDL-81R009). New Orleansi- LA:,;,pNaval BiodynamicsLabora tory. .MUltiple-Choice Scales
.I
} i in'\--, ;Tas,k: a'na1ys; sand tHe
NewDI0'No.-AD A1U18l) ,
R. C. (1981, September).
shann6ri', R-. H~'(1981e).tery development.tory.-
Sheehy, G. (1981). Pathfinders. New York: William Morrow and Company,Inc.Length of Items and Number of Items
217 ,
----------------------
Physi ci an res'ponse rates toPublic Opinion Quarterly, 43,
A. (1983~ June). Behavioral and subjective workloado erational environments. AGARD-AMP Symposium: Sustained
lr peratlons: YS10 ogical and Performance Aspects~
1='1i"'"r',:) ResearchMUltiple-Choice Scales
Shosteck, H., & Fairweather, H. R. (1979).mail and personal interviews surveys.206-217. 'Interviewi ng
Si1verstein, A. B. (1980, ,Summer). Item intercorrelations, item-,testcorrelations, and test reliability. Educational and PsychologicalMeasurement, 40(2),' 353-355'.
Sinaiko, H. H., &Broedling, L~ A. (1975, August). ~erspectives on attitude assessment: Surveys and their alternatives - Proceedings of aconference (TR-2). Washington, DC: Smithsonian Institution.
Singh, A. C.,' & Bilsbu'ry, C. 0'. (1982).SPC (sequential pair comparisons).128-145.
Scaling subjective variables byBehavioura1 Psychotherapy, l:Q.( 2) ,
Sitton, L. R., Adams, I. G., & Anderson, H. N. (1980). Personality correlates of students' patterns of'chang,1ng:"an~wers on multiple-choicetests. Psychological Reports, 4];, 655-660'~ " ""
- .• ~" .. ,.!;' ...... ,,-,.> ·F~'.'~/;·;'·~': ;".;.' ,, "';'-:" .... :-\,,;,:..
Slater~ P. E. (1962). parent behavior and the personality ofth,e chi,ld.,Journal of Genetic Psychology~ 101, 53-68. ~~" 'Gontlnuous and Clrcular Scales ---
Smith~ K'. F., & Baldauf, R. B., Jr. (19'82).: Tt1e';:';~oncurr~.ntva;ldityof'self-rating with iryterviewer rating. in the:Affs,tra.:Tfah;,'second languageproficiency ratings scale. Educational a.rid Psychological Measurement,42, 1117-1124. ' ;:,'
Smith~ P. C., &Kendall, L. M. (1963). Retranslation of expectations: 'Anapproach to the construction of unambiguous anchors for rating scales.Journal of Applied Psychology~ 47,~149~155.
SeMv"iotar ExP(fctation Scales" ,-"Behaviorally Anchored Rating 'Scales
Smith, T. E. (1976, December). Scalable choice models. Journal of Mathematical Psychology, 14(3),239-243.
Smith, T. H. (1981). Qualifications to generalize absolutes: IIApproval ofhitting ll questions on the GSS. Public Opinion Quarterly, 45, 224-230.
, EducationGenderWording of Items and Tone of Wording
Soe,ken, K. L., & Macready, G. B. (1982, September). Respondents' perceivedprotection when using randomized response.', Psychological Bulletin, 'a'92(2),487-489."/
'218
-----,,--,,'
o
'~,',:O,""<"," "
Space, L. G. (1981). The computer as a·psychometrician. Behavior ResearchMethods &Instrumentation, 13(4), 595-606.Future Research --
Spector, P. E. (1976). Choosing response categories for summated 'ratingscales. Journal of Applied Psychology, ~(3), 374-375.
Spiers, P. A, &Pihl, R. O. (1976). The effect of study habits, personality, and order of presentation on success in an open-book objectiveexamination. Teaching of Psychology, 3, 33-34. .Order of Items -
Spies-Wood, E. (1980). Learned helplessness and item difficulty ordering.Psychologia Africana, 29-40.Order of I terns
Stager, P., & Paine, Te· G. (1980). Separation discrimination in asimulated air traffic control display. Human Factors, 22(S), 631-636 •
..,,: ;/ 'tv ~~;'
'Staples, W. B., & Locander, W. B. (1975). ' Behaviorally"a'l1chored scales: Anew tool for retail management evaluation and ,contrph Journal ofRetailing, 52(4)', 39-95. ,BehaviorallY-Anchored Rating Scales
i.' .'.
Steinheiser, F. H., Jr., Epstein, K. I., Mir.abella, A., & Macready, G. B.(19.78., AlJgu$t). Cri teri on-referenced testi ng: A, criti cal;, ana lys; s ofselected'models (Technical Paper 306). College Park,MD:, Oni.versityof Maryland. (OTIC No. AD· A061569)'> t;~,· ;-,1:,";
Stewart, A.L., Ware, J • E., Jr., & Brook, R.H ~ (l97h<J~iirfcH,LA study ofthe reliab"ility, validity, and precision' of scales':to;'m'ea.:sure 'chronicfunctionali"Jimitations due to poor health. Santa<Monicaj"CA: ,TheRandcorp,qra,tion. (OTIC No. AD A043261) ."
Stinson,.. 'J.;.&"Stokes, J. (1980, June). How to mUlti-appraise. ManagementToday;,:'43-53.. \ ,.",i,'
Stouffe~, S. A.(195S). COllll1unism', confonnity, and ch~il liberties., G~rq~,ti",¢J,ty , NY: Doubleday.', ',,',' .(.
Wording gf Items and Tone of Wording"', .,... .,
Strahan, R. F. (1980, October). More on averagingjudge~1 ratings: Determiningth~"tIllQ$t reliable composite. Journal of ConSUlting and Clini- ,cal Psycholo'gy, ~(5), 587-589.
Strahan, R. G. (1982). Assessing magni tude of effect from ran'k-ordercorrelation coefficients. Educational and Psychological Measurement,42(3), 763-765.
Strang, H. R. (1980). Effect of technically worded options on multiplechoice test performance. Journal of Educational Research, 73(5),262-265. -Wording of Items and Tone of Wording
219
~,\
!~'j;tti&~";Cat;ts"R. M. (1980). A comparison of two, three and'>--, J " ~"" ,l ~';.~.~"i\"'."':'~"".;;.'.~::--"",!r=' •• •
:,c~,,']9u'r,,:,,!=oii:e item tests glVen a flxed total number of'cholces. Edu-"l~;,'~~;t:f6narand Psychol og i cal Measurement, 40, 357-365.
, ., ,
Sympson, J. B., Weiss, D. J., & Ree, M.J. (1982, August). Predictivevalidity of conventional and adaptive tests in 'an Air Force traininenvironment AFHRL-TR-81-40. Mlnneapolls,'MN: Department 0 Psychology, ,University of Minnesota. (DTIC No. AD A1l903l),
Takane, 'Yo (1981, March). MUltidimensional successive categories scaling:A maximum likelihood method. Psychometrika, 46(1),9-28,.
. ~ ~
~;;, ,'.
Tate, P. (1984). 'The blo,ss,?"I~ngQf'EYr9P,~~r,'L~J:. Datamation, 30(18;),85 -:-88 • ., <>:.:' "',~:':,'y-. "",' - -
, Future Research ""d
Thompson, B. (1980). Compar1sonoftwo,strategie's for collecting Q-Sort" i
data. Psychological Reports,"''£, 541C7551.:,t'J
Thompson, J. A., & Wilson, S. L. (1982, Octo~er). Automat.ed psycholo'gicaltesting. International Journal of Man-Machine Studies, 17(3),279-289. -
~ 'j L; .f;'~; .' ~':':f,/t> :t i}1 ;,-~'.:~ ,}... . '~:," :-".~. -,t'" ... :.'.
Tatsuoka, K. (1979, July). Analytical test"theory,modellc'for:o:"time and;score(CERL Report E-8) • Urbana, IL :Computer;;C7BasedHEducatl on', ResearchLaboratory, University of I'llinois.", <or,lo'"-;"ij""""''<'''p011A016'&Oll'';),>', '.
. "'~;'i'-;;;~L ".\ . . ~:~;~K~j~.l~~~J:~;;t·-)(f'~'~::!:71i)~J~j,§>.-<:\ .,~.,. '.'
Tatsuoka, K. K., Birenbaum, M., Tatsuoka, 'M.M.q ~;~~ilJje';"~';'(T1981"August) •. Psychometric approach to error;"'analy~·t~,:oti{'r:'e'sponsepatternsof achievement tests. Catalog of Selected Docl.rilents il1,\Psychology,.11(58,)e,;"-
. Tatsuoka,K. K., &T~t's'uoka:~ M. M~ (1'982,j:tiW'j,:~,~;F'6:~':tectf6n;of'abertant. response patterns and their effect on dimensi ona 11 ty. Journal of
--.-.- '.-'--~E"du·ca-ti-o'n-a-l-S·tdtistics,I( 3), 215-231.
.~."..'JjJ
Self-appraisal rev1sited.PersonnelJournal,Teel, K. S. (1978,. July).... .364-367.
Thorton, G. C. (1980). Psychometric properties of self-appraisals of jobperformance. Personnel Psychology,.33, 263-271.
220
-,----~~_ ..__ .. ,_.-_.._-'---,-,--
oThurstone, L. L. (1927). A law of comparative jUdgment. Psychological
Review, 34, 273-286.. -
Thurstone, L. L. (1929). Fechner's law and the method.of equal-appearingintervals. Journal of Experimental Psychology, g, 214-224.
Towsend, J. W. (1979). A Guttman analysis ofsca'les developed by retranslation; D,issertation Abstracts Internation"aY,' 39(1l-B), 5621-5628.
Trollip, S. R. , & Andersofl, R.I .(1982). An adaptive private pilot certification exam. Aviation,'Space, and Environmental Medicine, 53(10),992-995.' -Future Research
.;,
.<!9 Turney, J. R., & ,Cohen, S. L. (1976, June). The development of a workenvironment questionnaire for the identification'·of;.organha·t;onalproblem areas in s~ecific Army work settinrs Ca.RI Technical Paper275). Arlington, A: U.S. Army Researchnstitute'for the Behavioral
"and Social Sciences. '(DTICNo. AD A028241)
Uh1aner, J., E.• , & D'rucker,' A. J. (1980). Mi 1i tary research on performance. criteria: 'A change of emphasis. Human Factors, 22(2r, 131-139.
" "·1,:"~\'.,t
Urry, V. W. (1977, August).. Tailored testing: A specbcul'ar ~uccess forlatent trait theory (TS-T7~2)., Washlngton, DC: U.S. C1Vl1 Serv1ceConmi sston;'" P~rsonne1 Research and Development C~n:ter.' (NTIS No. PB274 576i)' 0 • , • • .,' • •
to·····;1
~~:;. , .: '
Using behaviorally anchored rating scales (BARS) (1980). Small Business"Report\, JQ~19.
,,,;·~-:;~·"",·:;·,~_·}·..).f./·':·l-- ~,7'
An
Vance~'Rr:J., 'Kuhnert, K•.W., & rarr, J. L. (1978). Interv·iew judgments:Using external criteria to compare bahavioral and graphic scale rat~
i,~g~•.0rQanizational Be~avior and Human Performance, ll.~ 279-294.InterV·leWl ng '.' " , ,..' ~ " , "
Vale, C. D.:(198~, August). Design annd' implementa.tion· of a microcomputer-based adaptive testing system. Behavior Research Methods andInstrumentation,.ll(4), 399-406.
'~ .;- .-
Van Heerden, J., & Hoogstraten, J. (1980, February). Response, preferenceas a function of instructions in an unstructured questionnaire.Perceptual 'and Motor Skills, ~(l), 227-230.
Van Rijn, P. (1980, June). Self-assessment for personneloverview (Personnel Researc Report 8 -1Office of Personnel Management, PersonnelCenter, Alternatives Task Force. 'Ethnic Background
Verity,' J. W. (1984). AI tools arrive in force. Datamation, 19.(1S),44-S~.
Future Research
221
t~,ON:""
P. (1981). Ethnicity-of-interviewer effects onP~blic Opinion Quarterly, 45~ 245-249. '- .
""",,',,.,77.... '•. )., Reliability of the semantic differential undertions. Psychological Reports,'~, 583-586.
Scales~'ii~:~~:;~c Differential Scales
, ,,-;.,-,,, .
Volans, P. J. (1982, October) • Pros and cons of tailored testing: An. examination of issues highlighted by experience with an automated
testing system. International Journal of Man-Machine Studies, 17(3),301-304. -
Warm, T. A. (1978, December). A primer of item response theory (TechnicalReport 941278). Oklahoma City, OK: U.S. Coast Guard Institute.(DTIC No. AD A063072)Future Research
Warmke, D. L., &Billings, R. S. (1979). A comparison of training methodsfor altering the psychometric properties of experimental and administrative performance ratios. Journal of Applied Psychology, 64, 124~
131.' -
Wee~s,M. F•• &Moore, R.ethnic respondents.
, Ethnic Background. .Interviewing
~eiss,D. J. (1982, Fall). Improving measurement q'uality' and efficiencywith a4aptive theory. Applied Psychological Measurement, 2..'4), 473492.
Welch,S, •. ,-Cgmer,~ J.,,:,,& Steinman, M. (197'3). Interviewing in a t~exicanAQ1E!rjc:an'ic:ormllJni,~y:An,.j.J1vestigation of some potential sources ofre'~pc>n~'e'b{as';'"'Publ i c" 'OtHnion' Quarterly, R, 115-126.Ethnic BackgroundInterVieWi,ng,; :1:
---'-----:---We·l-sh-,J.-R-.('l97-7,,'February-)-•... An investigation into the sources of ·halo. error. Dissertation Abstracts International; 37(8-B), 4203.
. -. ,
__-,- .._~6~.~rY, R. J., "Sr., & Bartlett, C. J. (1982). The control of bias inrati.ngs: A theory of rating. Personnel Psychology, ~, 521-551-
White-Blackburn" G. Blackburn, I. C., & Lutzker, J. R. (19aO). Th(!i~ffect·sof objective versus subjective quiz items in a Psi cours(!.JeachingPsychology, L(3), 150-153. .:Y:
Whitely, S. E. (1977). Relationships in analogy items: A sema,rlticcomponent of a psychometric task. Educational and psycho1og;cal Measu'rement, ~, 725-739.
222
(J':\\ l':.~
"tf;
0;'
0).
...._._ ..... _ .._ ..._._.._----_._-~....__._--------~'
Ware, J. L, Jr. (1982). Con troll i ng 'forscale development. Journal of Applied
o
,i'
Wiegand, D. (1983). Present standardization of' test procedures for ergonomic test of tracked and wheeled vehicles of the Federal Armed ForcesGermany. Federal Armed Forces Proving Ground 41. Unpublished paper.
Wienclaw, R. A., & Hines, F. E. (1982, November). A model for determining. cost and. training effectiveness tradeoffs. Training Equipment Inter
service/Industry Training Equipmment Confe~ence, 405-416~
Multiple-Choice Scales
WilCOX, R.R~ ·U982,Sununer}.Boundson thek out of n reliability of atest, and an exact test for hierarchically related items. AppliedPsychological Measurement, !(3), 327-336.
Wilcox, R. R. (l982). Determining the length of multiple 'choice criterionreferenced tests when an answer-until-correct scoring procedures isused. Educational and Psychological Measurement~ ~, 1~9-794.
Williams, J. A. (1964). Interviewer-respondent interaction: A study ofbias" in the information interview. Sociometry, 27, 338-352.Interviewing
Wind, Y., &Lerner, D. (1979). On the measurement of purchase data:Surveys versus purchase diaries. Journal of Marketing Research, ~,39-47.
Winkler, J. D., Kanouse, D. E~, &acquiescence response set inPsychology, ~(5), 555-561.
Wise, S. L. (1982). A modified order-analysis procedure for determiningunidimens·ional item sets. Dissertation Abstracts International;.1!( 7-A} ~ 3121.
Wood, J. A.(l982).· The quantification of verbal anchors used to denoteoccurrences of frequency, amount, and, evaluation on five responsecategory Likert scales. Dissertation Abstracts International,43(2-A), 408~409.-
Y~dav, M. S., Govinda L R~, &Thomas, K. T. (1976). Some psychometricstudies in attitude scale construction. Psychological Studies, !!J1) ,1-11.
Young, F. W., &Levinsoh, J. R. (1974)~ Two special-purpose programs thatperform nonmetric mUlti~imensional scaling. Behavior Research Methodsand Instrumentati on, .2.(3) , 354-355.
Zanmuto, R., F., London,M., & Rowland,. K. M. (1982). Organization andrater di fferencesi n performance apprai sal s. Personnel Psychol ogy,l§., 643-658.
Zedeck, S. (1981). Behaviorally based performance appraisals. Aging and~, .!.'2), 89-100.
223
: . .
'i~(feCK')"':S,(:i:';'&:cascio W. F. (1982). Performance appraisal 'decisions as a:.:,,' "',,_:~._,·,,:\<;,.:">"i';,,_,,: _'~'~".,: ... \', 'r 'f', .'-' , •
Y".~.\:LJi,lh.9~19I1of rater training and purpose of the appraisal-Journal of,"')JApp'lfed psychologY,§1.(6), 752-758.
Zedeck, S., Jacobs, R~, & Kafry, D. (1976). Behavioral expectations:, Development of parallel forms and analysis of scale assumptions.
Journal of Applied Psychology, ~, 112-115.
Zedeck"S., & K,afry, D. (1977, April). Capturing rater policies for processing evaluation data. ,Organizational Behavior and Human Performance, ]!(2), 209-294.
o
Zedeck, S., Kafry, D., &Jacobs, R. (1976).in behavioral expectation evaluations.Human Performance, 17, 171-184.MUltiple-Choice Sca1e~
Questioi1Oaire Layout
224
Format 'and scoring variationsOrganizational Behavior and
··0·······,·.··~ ~ - .'.' ..,·.'o....c
-- ,._--------.,._..- " ...._--- -------~-------'-----------,-------_.. -----_.
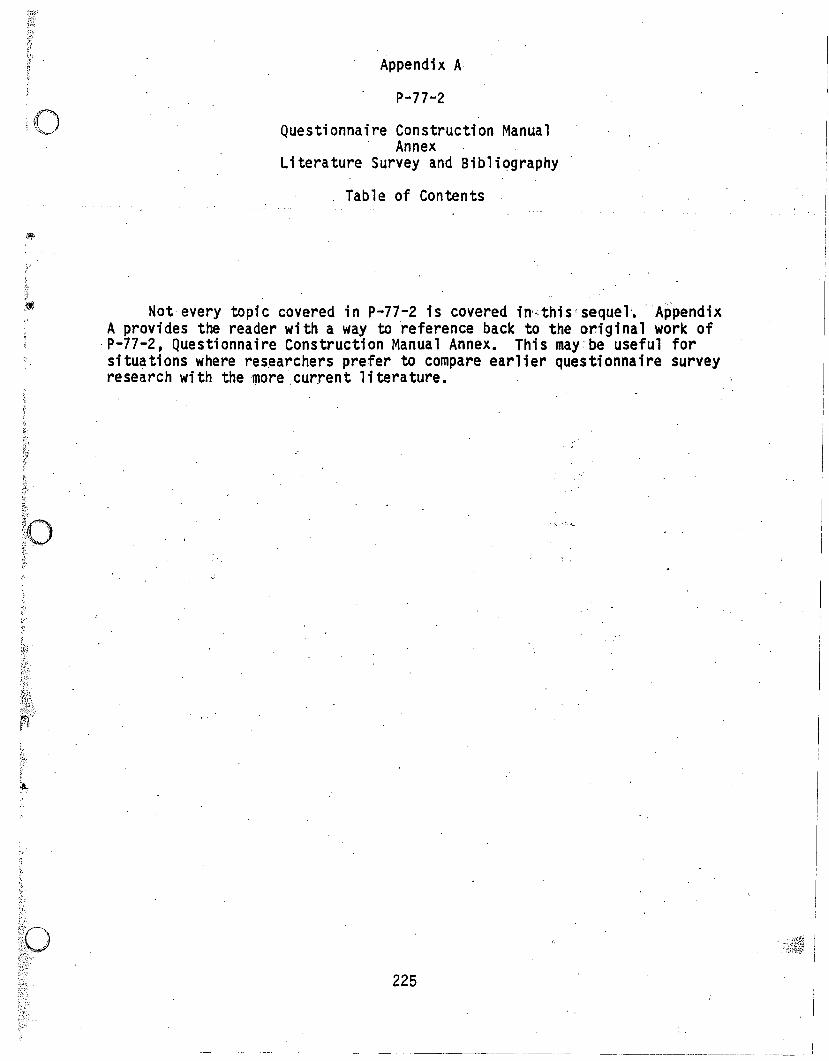
Appendix A
P-77-2
Questionnaire Construction ManualAnnex
Literature Survey and Bibliography
. Table of Contents
Not every topi c covered in p-n-2 is covered in·;,this'sequel. AppendixA provides the reader wi th a way to reference back to the ori gi na1 work ofP-77-2, Questionnaire Construction Manual Annex. This may be useful forsituations where res~archers prefer to compare earlier questionnaire surveyresearch with thelllore .cur.rent literature.
225
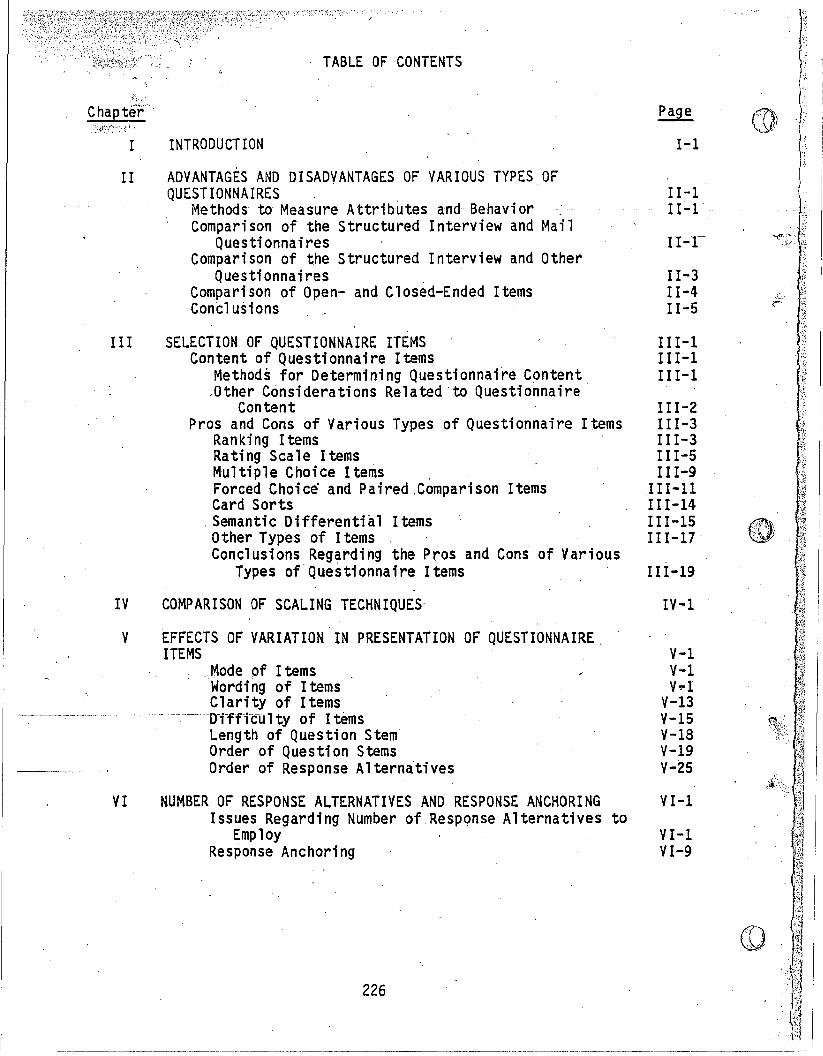
VI NUMBER OF RESPONSE ALTERNATIVES AND RESPONSE ANCHORINGIssues Regarding Number of Response Alternatives
EmployResponse Anchoring
Page
I-I
II-III-I'
11-1-
II-3II-4II-s
III-lIII-lIII-l
111-2III-3I II-3111-5111-9
III-llII 1-14II I-ISIII-17
III-19
IV-l
V-IV-IV~I
V-13V-ISV-18V-19V-2S
VI-Ito
VI-IVI-9
TABLE OF CONTENTS
INTRODUCTION
ADVANTAGES AND DISADVANTAGES OF VARIOUS TYPES OFQUESTIONNAIRES, ,
Methods to Measure Attributes and Behavi or ,Comparison of the Structured Interview and Mail
QuestionnairesComparison of the Structured Interview and Other
Questionnaires "Comparison of Open- and Closed-Ended ItemsConclusions
SELECTION OF QUESTIONNAIRE ITEMSContent of Questionnaire Items
Methods for Determining Questionnaire Content.Other Considerations Related to Questionnaire'
ContentPros and Cons of Various Types of Questionnaire Items
Ranking ItemsRa ti ng Scal e ItemsMUltiple Choice Items ,Forced Choice and Paired.Comparison Items,Card Sorts
, Semantic Differential ItemsOther Types of I terns 'Conclusions Regarding the Pros and Cons of Various
Types of Questionnaire Items
COMPARISON OF SCALING TECHNIQUES
EFFECTS OF VARIATION IN PRESENTATION OF QUESTIONNAIRE,ITEMS
,Mode of I terns'Word i"g of I ternsClarity of Items
- -----'-DTfffcUl ty of I ternsLength of Question StemOrder of Question StemsOrder of Response Alternatives
V
I
II
IV
III
Chapt€~'
CD, ,
226
-- ...._-- -----_.. --~-~---_..__._---~._-----._-_._-------_. __.-------_.. ------ -------
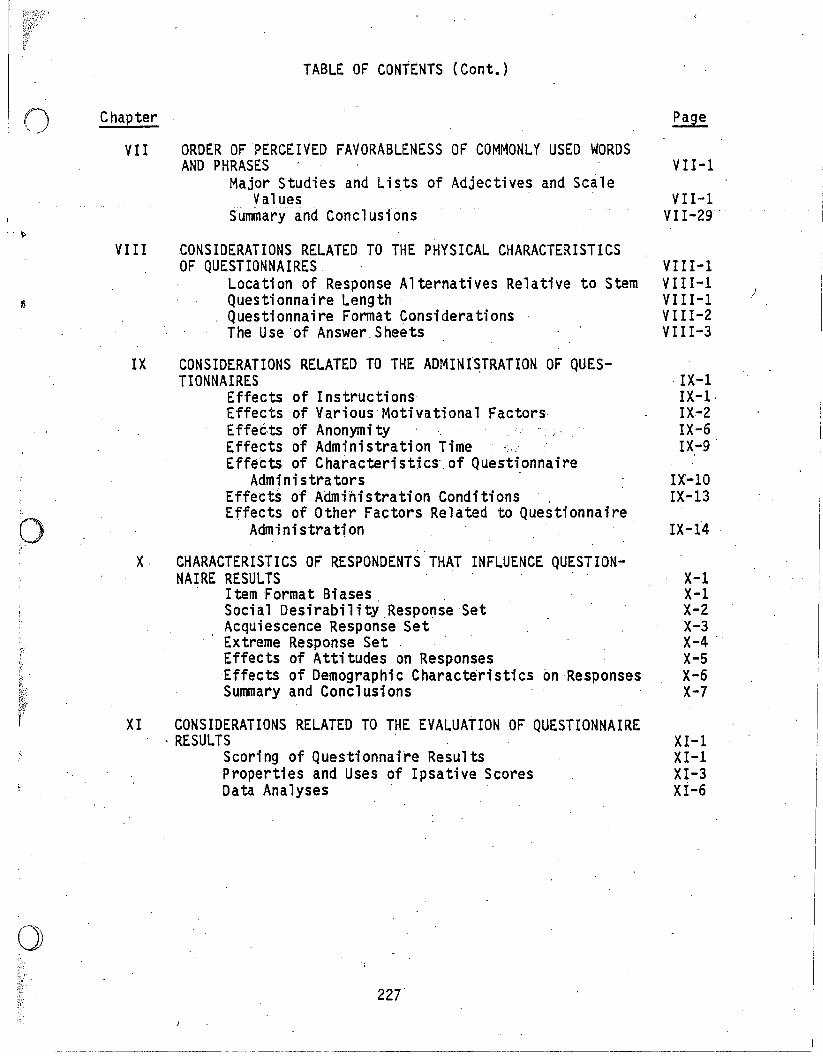
o
o
Chapter
VII
VIII
IX
TABLE OF CONtENTS (Cont.)
ORDER OF PERCEIVED FAVORABLENESS OF COMMONLY USED WORDSAND PHRASES
Major Studies and Lists of Adjectives and ScaleValues
Summary and Conclusions
CONSIDERATIONS RELATED TO THE PHYSICAL CHARACTERISTICSOF QUESTIONNAIRES
Location of Response Alternatives Relative to StemQuestionnaire LengthQuestionnaire Format ConsiderationsThe Use of Answer. Sheets
CONSIDERATIONS RELATED TO THE ADMINr~TRATION OF QUESTIONNAIRES
Effects of Instructi onsEffects of Various' Motivational FactorsEffec:ts of Anonymi tyEffects of Administration TimeEffects of Characteri st1 cs' of Questi onnai re
AdministratorsEffectso'f Administration ConditionsEffects of Other Factors Related to Questionnaire
Administration
VII-I
VII-IVn"29·
VIII-IVIII-IVIII-IVII 1-2VIII-3
. IX-IIX-I·IX-2IX-6IX-9
IX-IOIX-13
IX-14
)
\'.'i
X CHARACTERISTICS OF RESPONDENTS THAT INFLUENCE QUESTION-NAIRE RESULTS
Item Format BiasesSocial Desirability.Response SetAcquiescence Response SetExtreme Response SetEffects of Attitudes on ResponsesEffects of Demographic Characte'ristics on ResponsesSummary and Conclusions
XI CONSIDERATIONS RELATED TO THE EVALUATION OF QUESTIONNAIRE. RESULTS .
Scoring of Questionnai~e ResultsProperties and Uses of Ipsative ScoresData Analyses
227
X-IX-IX-2X-3X-4 .X-5X-6X-7
XI-IXI-IXI-3Xi-6
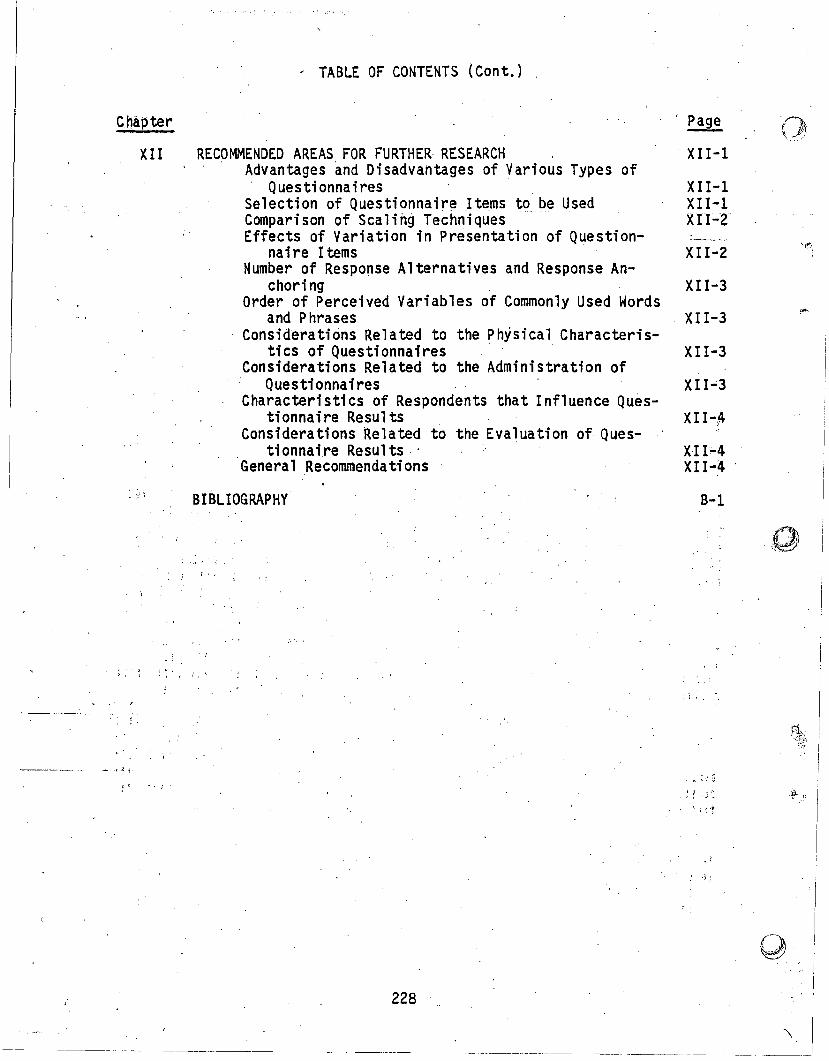
Chapter
XII
TABLE OF CONTENTS (Cont.)
RECOMMENDED AREAS FOR FURTHER· RESEARCHAdvantages and Disadvantages of Various Types of
QuestionnairesSelection of Questionnaire Items to be UsedComparison of Scaling TechniquesEffects of Variation in Presentation of Question
naire I ternsNumber of Response Alternatives and Response An
choringOrder of Perceived Variables of Commonly Used Words
and PhrasesConsiderations Related to the Physical, Characteris
tics of QuestionnairesConsiderations Related to the Administration of
QuestionnairesCharacteristics of Respondents that Influence Ques
tionnaire ResultsConsiderations Related to the Evaluation of Ques
tionnaire Results·-General Recommendations
BIBLIOGRAPHY
j' •
. Page
. XII-1
XII-1XII-1XII-Z
XII-2
XII-3
XII-3
XII-3
XII..:3
XII-4
XII-4XII-4
B-1
! ! \' ~ •, > i \ ',I i,'"
; .
___•__"., ........ .1~
, ;: . .. .~
228
'_~"'_------ ..--._... ---
, ..
.J,
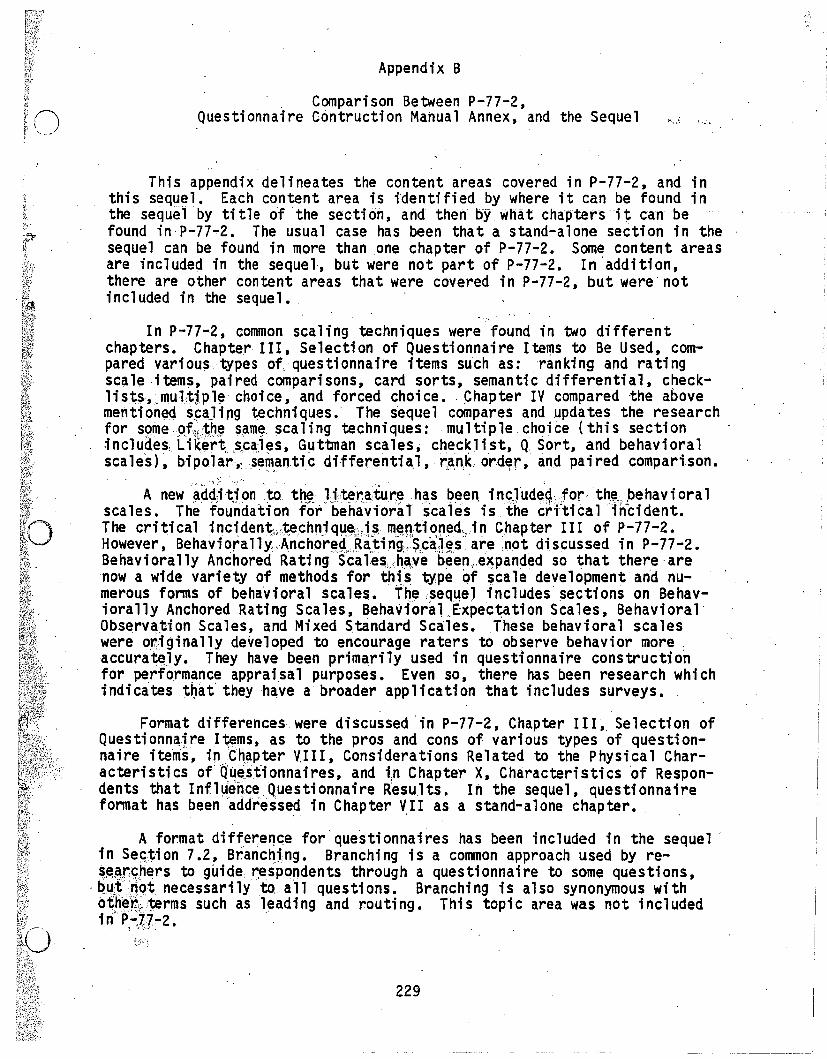
()
Appendix B
Comparison Between P-77-2,Questionnaire Contruction Manual Annex, and the Sequel /1',.1- ' .......
This appendix delineates the content areas covered in P-77-2, and inthis sequel. Each content area is identifiedbywhere it can be found inthe sequel by title of the section, and then by what chapters it can befound in'P-77-2. The usual case has been that a stand-alone section in thesequel can be found in more than one chapter of P-77-2. Some content areasare included in the sequel, but were not part of P-77-2. In 'addition,there are other content areas that were covered in P-77-2, but were notincluded in the sequel. '
In P-77-2, common scaling techniques were found in two differentchapters. Chapter III, Selection of Questionnaire Items to Be Used, compared various types of questionnaire items such as: 'ranking and ratingscale items, paired comparisons, card sorts, semantic differential, checklis,t$"mul'tjplechoice, and forced choice. Chapter IV' compared the abovement;9ned sca.J iOg 'techni ques.' The s'eque1 compares and updates the researchfor s9me9ft!!;~I:J~sam~ scaling techniques: multiple choice (this sectionincludes, Likert.scales, Guttman scales, checklist, Q: Sort, and behavioralscales), bipolar,;sein,~nticdifferential, r~.nk or.d~r, and paired comparison.
A newad~cition ,to t~ l;;,tera.ture. ha..s ~een. inc.}ude,~:tfor· th.~ .. ,behavioralscales. The foundation for behavioral scales is. the cdtical .incident.The critical incident!...~chniqu~l',j$ .. m~n.tio!1ed"in Chapter III of P-77-2.However, Behavioral1Y,.Ancho'r~.~.,.Ra~ting:::··~,caJ~s·· are ;oot discussed in P-77-2.Behaviorally Anchored Rating Scales;ha.;ve been"expanded so that there ,arenow a wide variety of methods for this type of scale development and numerous fonns of beha'vioral scales •. Th,l:! .seqljeJ includes sections on Behaviorally Anchored Rating Scales, Behavioral ,Expectation Scales, Behavioral'Observ~'tion Scales, and Mixed Standard Scales. These behavioral scaleswere orl'iginally developed to encourage raters to observe behavior more;accurate]Y. They have been primarily used in questionnaire constructionfor perf()rmance appraisa1 purposes. Even so, there has been research whi chindicates't,hat' theyha.ve a broader application that includes surveys. '
Format differences were discussed 'in P-77-2, Chapter III, Selection ofQuestionnaire Items, as to the pros and cons of various types of questionnaire items, inCh~pter V,III, Considerations Related to the Physical Characteri sti cs of ()qestionnaires, and in Chapter X, Characteri sti cs 'of Respondents that InflLJe'nce Questionnaire Results. In the sequel, questionnairefonnat has beenaddresse~ in Chapter VII as a stand-alone chapter. _
A format difference for'questionnaires has been included in the sequelin SeS'tion 7.2, Branching. Branching is a cOl'/l1lon approach used by re~~~,nShers to giJide, ~spol1dents through a questionnaire to some questions,
. Q.I.I~t.:I1Cl't necessarily to all questions. Branching is also synonymous withoth~:~.''l:erms such as leading and routing. This topic area was not includedin P,77:-2. ' --
'i ",:'.'---".
229
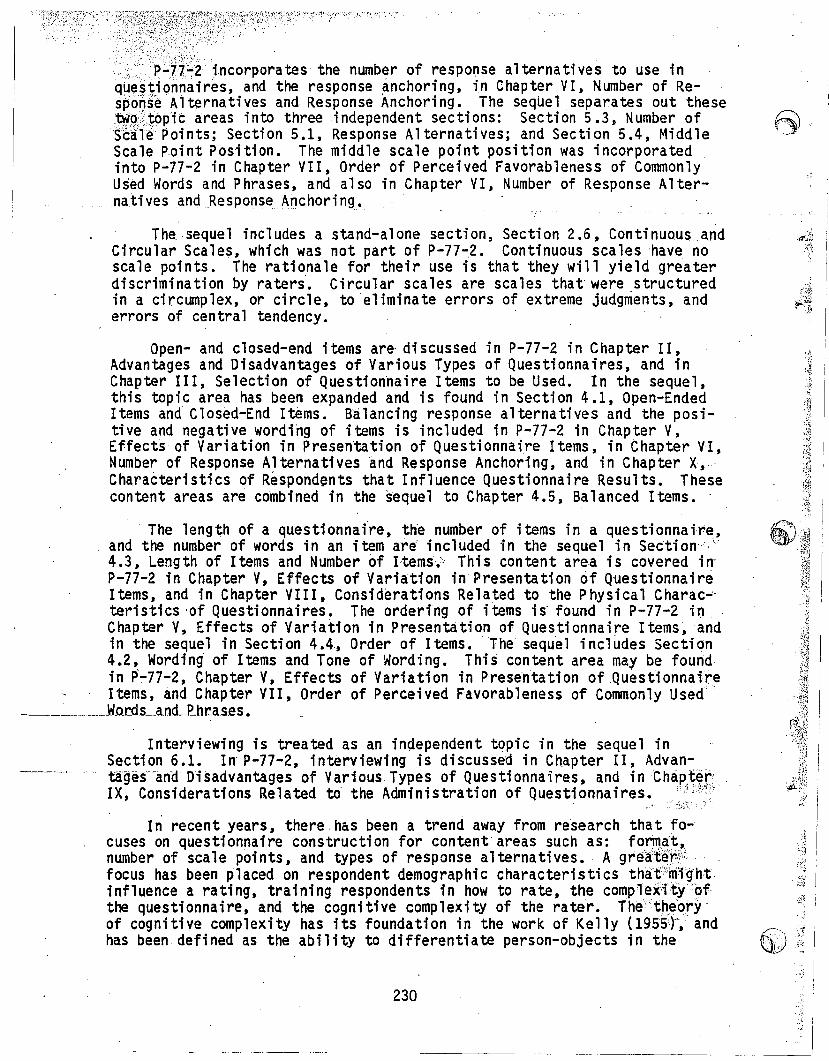
incorporates the number of response alternatives to use inres, and the response anchoring, in Chapter VI, Number of Re
terna ti yes and Response Anchori ng. The seqiJe1 ,separa tes out these.~~»,:T;;OPlt areas into three independent sections: Section 5 .3, Number of ~
oints; Section 5.1, Response Alternatives; and Section 5.4, Middle '.(J'Scale P,oint Position. The middle scale point position was incorporatedinto P-77-2 in Chapter VII, Order of Perceived Favorableness of CommonlyUsed Words and Phrases, and also in Chapter VI, Number of Response Alter-nati ves and Response Anchori ng. ' '
Interviewing is treated as an in~ependent tqpic in the sequel inSection 6.1. In P-77-2, interviewing is discussed in Chapter II, Advantages"and Disadvantages of Various Types of Questionnaires, and inChap.t~t·IX, Considerations Related to' the Administration of Questionnaires. i'i!""i'
, '
, The leng't:h of a questionnaire, the number of items in a questionnaire,and the number of words in an item are inclUded in the sequel in Section'4.3, Length of Items and Number of Items.' This content area is, covered in'P-77-2 in Chapter V, Effects of Variation in Presentation of QuestionnaireItems, and in Chapter VIII, Considerations Related to the Physical Charac-teristics 'of Questionnaires. The ordering of items is- found in P-77-2 in.Chapter V, Effects of Variation in Presentation of Questionnaire Items, andin the sequel in Section 4.4" Order of Items. 'The sequ'el includes Section4.2, Wording of Items and Tone of Wording. This content area may be foundin P'~77-2, Chapter V, Effects of Variation in Presentation of QuestionnaiteItems, and Chapter VII, Order of Perceived Favorableness of Commonly Used"
______...'.'._'JoI.OJ~.ds_and_P_hr.ases •
The, ,sequel includes a stand-alone section, Section 2.6, Continuous....andCircular Scales, which was not part of P-77~2. Continuous scales 'have noscale points. The rationale for their use is that they will yield greaterdiscrimination by raters'. Circular scales are scales that' were structuredin a circumplex, or circle, to 'eliminate errors of extreme judgments, anderrors of central tendency.
Open- and closed-end items are-discussed in P-77-2 in Chapter II,Advantages and Disadvantages of Various Types of Questionnaires, and inChapter III, Selection of Questionnaire Items to be Used. In the sequel,this topic area has been expanded and is found in Section 4.1, Open-EndedItems and Closed-End Items. B'alancing response alternatives and the positive and negative wording of items is included in P-77-2 in Chapter V,Effects of Variation in Presen'tation of Questionnaire Items, in Chapter VI,Number of Response Alternatives and Response Anchoring, and in Chapter X,·Characteristics of Respondents that Influence Questionnaire Results. Thesecontent areas are combined in the 'sequel to Chapter 4.5, Balanced Items •.
I n recent years, there, has been a trend away from research tha t focuses on questionnaire construction for content areas such as: fOrmat,.number of scale points, and types of response alternatives. A grea~~r~zfocus has been placed on respondent demographi c characteri sti cs that:"m,i'ght.influence a rating, training respondents in how to rate, the complex-ltYofthe questionnaire, and the cognitive complexity of the rater. The"-t~eOrY'
of cognitive complexity has its foundation in the work of Kelly (1955')', andhas been defined as the ability to differentiate person-objects in the
230
......._-._. --------_.._-,
t'.~1; i
" i, J
231
.' :: l' .:' ~"
':s~\~i~l environment. ,The sequel includes Sectfon 6.2, Cognitive Compl~xity.This topic is not covered in P-77-2.
Demographic characteri'stics that describe respondents in questionnaireconstruction have been divided into four sections :;n the sequel, and thesesections are:' Section 6.3, Education; Section 6.4, Ethnic,Background;Section 6.5, Gender; and Section 6.6, Age. These demographic characteristics are· found in P-77-2 in Chapter IX, Considerations Related to the
.Admin;stratiQn of Questionnaires, ~nd In Chapter X, Characteristics ofRespondents that! nfluenc'eQuestionnaire Results.
P-77-2 and the sequel both cover the same content areas in most Instances. There are some areas where there is not overlap. For example,P-77-2 does not include material 'on Behaviorally Anchored Rating Scales,Continuous and Circular Scales, and Cognitive Complexity, while the sequeldoes. The .sequel does, not include areas on Questionnaire Administrationand Evaluation of Questionnaire Results, which are included in P-77-2.(See ,Appendix C for an overview of content,areas covered by P-77-2 and thesequel.)
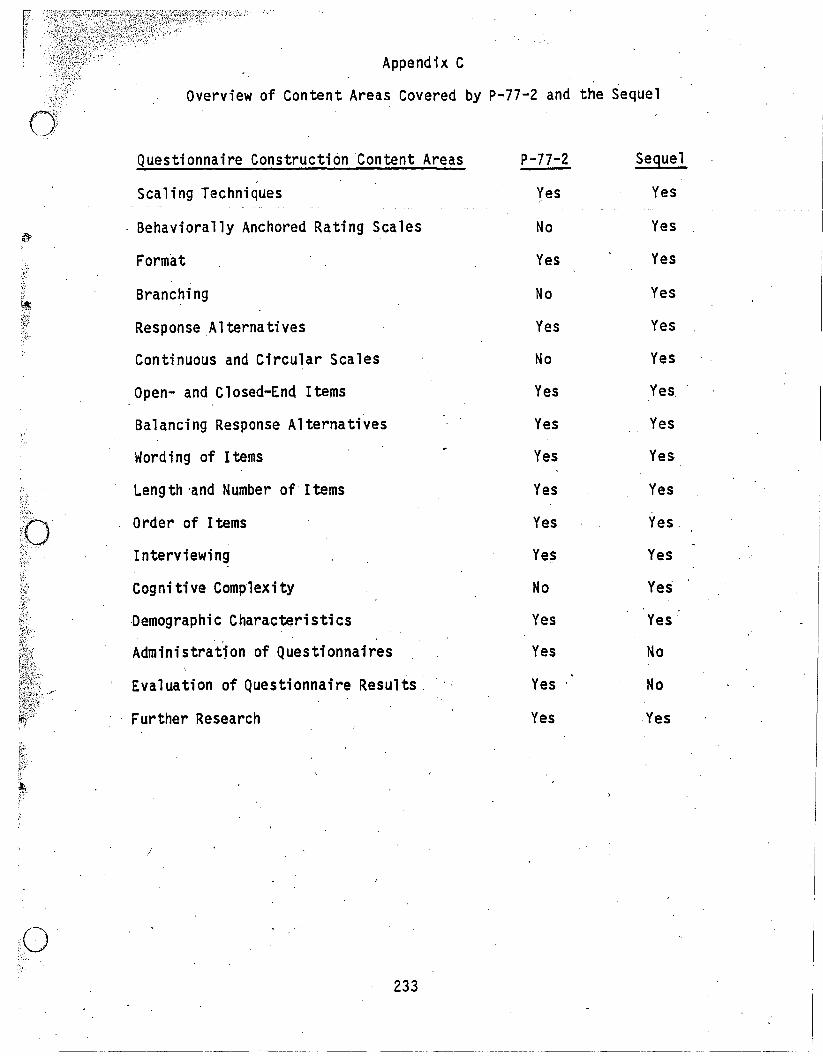
Appendix C
Overview of Content Areas Covered by P-77-2 and the Sequel
···.0:'.~. '.
Questionnaire Construction 'Content Areas
Scaling Techniques
Behaviorally Anchored Rating Scales
Format
Branching
Response .Alternatives
Continuous and Circular Scales
Open- and Closed-End Items
Balancing Response Alternatives
Wording of Items
Length 'and Number of Items
Order of I terns
Interviewing
Cognitive Complexity
·Demographi c Characteri sti cs
Administration of Questionnaires
Evaluation of Questionnaire Results.
Further Research
/
233
P-77-2
Yes
No
Yes
No
Yes
No
Yes
Yes
Yes
Yes
Yes
Yes
No
Yes
Yes
Yes
Yes
Seguel
Yes
Yes
Yes
Yes
Yes
Yes
Yes
Yes
Yes
Yes
Yes
Yes
Yes
Yes
No
No
Yes
---------_._~-------- ---------------~._-----_._--------
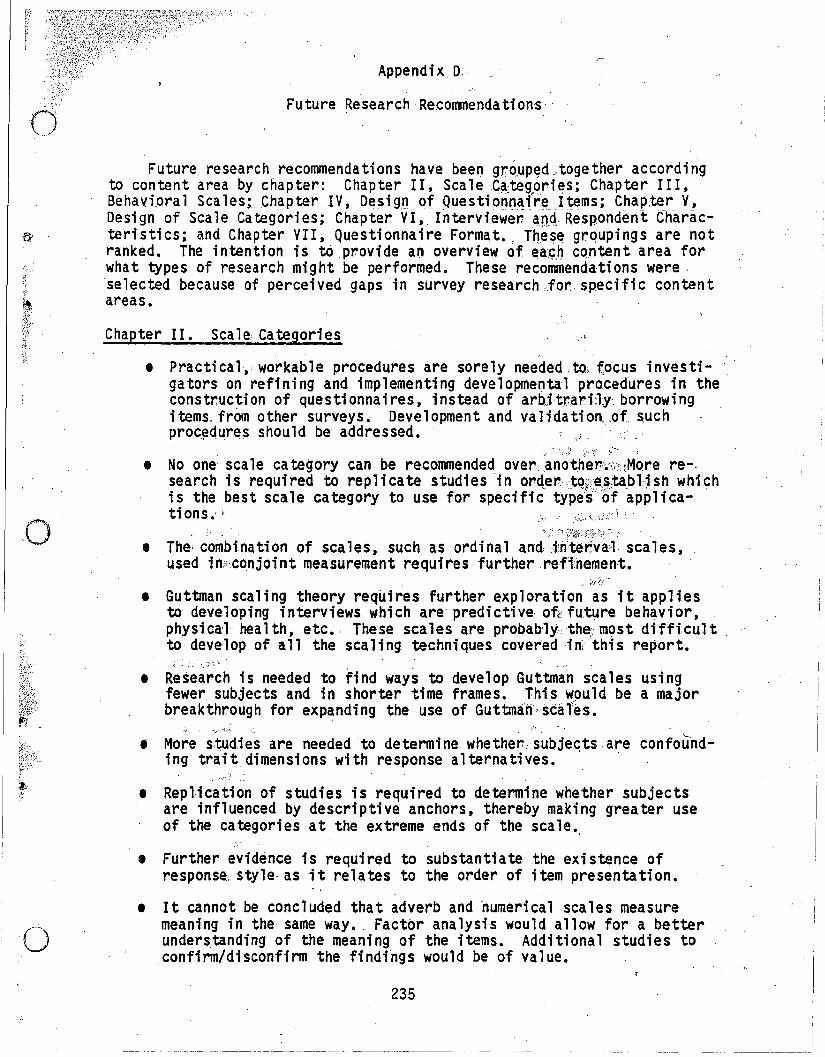
Appendix 0
Future Research Recommendations'
Future research recommendations have been grQuped .. together accordingto content area by chapter: Chapter II, Scale',C~;teg9ries; Chapter III,Behavioral Scales; Chapter IV,Design of Questionnai're Items; Chapter V,Design of Scale Categories; Chapter VI" Interviewer Cl.Qq Resp,ondent Charac-
~ , teristics; and Chapter VII, Questionnaire Format., These groupings are notranked. The intention is to provide an overview of ea.,9.h cQntent area forwhat types of research might be performed. These recommendations were,selected because of perceived gaps in survey research for specific contentareas.
Chapter I1. Sca1e Ca tegori es
• Practical, workable procedures are sorely needed ita:, f,ocus investi- ,gators on refining and implementing developmental proced'ures in theconstr:.uction of questionnaires, instead of arbJtr,ariJy. borrowingitems"frOm other surveys. Development and valtdation.,of ~uchproc~dures should be addressed. .,. ' ,"
• No one sca le ca tegory can be recommended over.anotl'ler~·r,,:::MQre re-.~earch is required to replicate studies ·in. orqer),tqU;~\~;tabl.is~ whi~h1S the best scale category to use for speclf1c types of appllca-ti ons.. " . ,';'
? ,',:' t.\£f':U%·}~';W~t-P.,!' .~.~'. '-:-
t The: combination of scales, such as ordinal and:'i't1'te~val scales,used in:: conjoint measurement requires further ne·fi:i1ement.
J ",-,,<
• Guttman scaling theory requires further exploration as it appliesto developing interviews which are predictive,ot,: fU ..ture beha.vior,physica'l health, etc. These scales are probably: the,: most difficult,to develop of all the scaling techniques coveredinithis report.
,:":;.-:.::.
• Research is needed to find ways to develop Guttman scales usingfewer subjects and in shorter time frames. This w.Quld be a majorbreakthrough for expanding the use of Guttmaifscales •
o
....:.:"'.,.::,
• More studies are needed to determine whethertsubje~ts,are confoUnd-ing trait dimensions with response alternatives.' ,
• Replication of studies is required to determine whether subjectsare influenced by descriptive anchors, thereby making greater useof the categories at the extreme ends of the scale.
• Further evidence is required to substantiate the existence ofresponse; style· as 'it relates to the order of item presentation.
• It cannot be concluded that adverb and numerical scales measuremeaning in the, same way. , Factor analysis would allow for a betterunderstanding of the meaning of the items. Additional studies to
,confirm/disconfi rm the fi ndings would be of va 1ue.
235
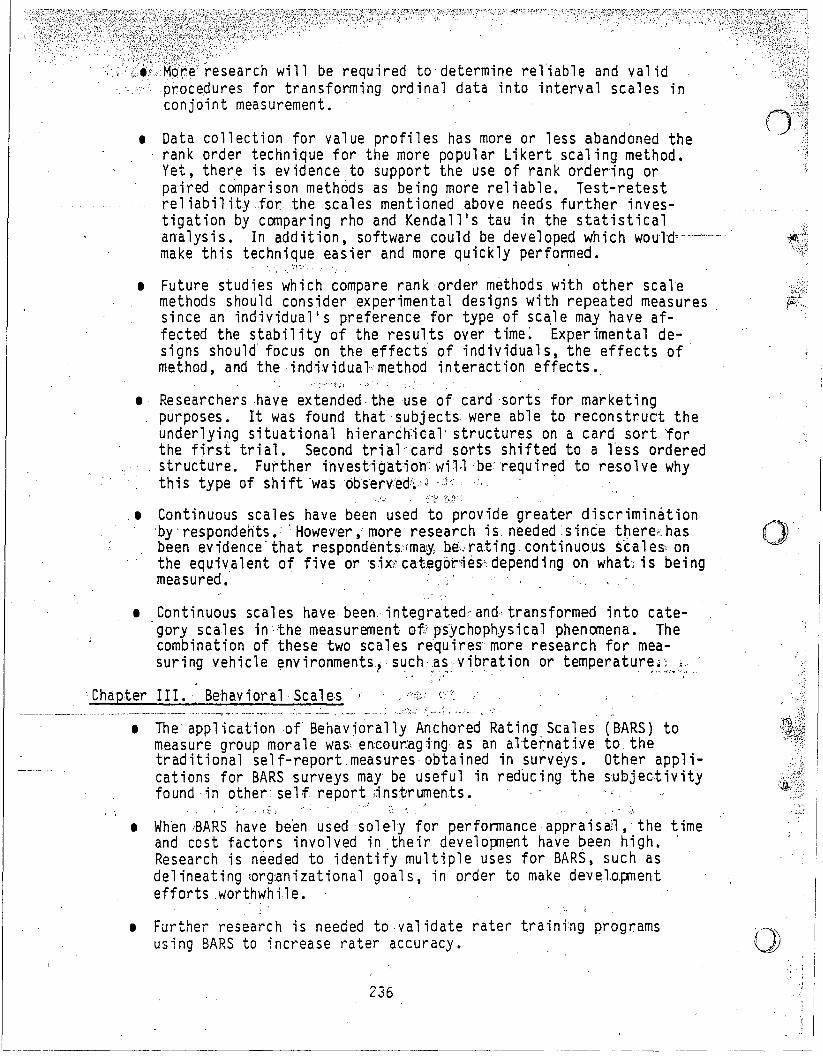
~esearch will be required to determine rel~able and validprocedures for transforming ordinal data into interval scales inconjoint measurement. .
• Data collection for value profiles has more or less abandoned therank' order technique for the more popular Likert scaling method.Yet, there is evidence to support the use of rank ordering orpaired comparison methods as being more reliable. Test-retestreliability for the scales mentioned above needs further investigation by comparing rho and Kendall·s tau in the statisticalanalysis. In addition, software could be developed which would""'---'"make this technique easier and more quickly performed.
:;,~ -....
• Future studies which compare rank'order methods with other scalemethods should consider experimental designs with repeated measures.since an individual's preference for type of sc~le may have affected the stability of the results over time~ Experimental designs should focus on the effects' of individual s, the effects ofmethod, and the individual'method interaction effects •.
• Researchers have extended· the use of' card sorts for marketingpurposes. It was found that subjects were able to reconstruct theunderlying situational hierarcliicalstructures on a card sort 'forthe first trial. Second trial"card sorts shifted to a less orderedstructure. Further invesMgatiotr win be: 'required to resolve whythis type of shift'wasobserv'ed;:~,l .,.j, " .
.• Continuous scales have been used to provide greater discriminationby-respondents.' 'Howev'er, more research is. needed since there~.has 0 .been ev idence that respondents:imay"be;crati ng, continuous seales':, onthe equivalent of five orsix;:categ6r.:ies':depending on what:; is beingmeasured •
• Continuous scales have been·integTated~and"transformed into category scales. in the measurement of" psychophysical phenomena •. Thecombination of these two scales requi,res' more research for measuring vehicle ~nYironments" such as vibration or temperatur~,~:,.;': ..
, . ~ .. ,,\
"f -
(B'ARS) toto. theOther applisuojec-tivity
;.;~;;.,:~;. :'. "" .. i ...' f ' •.•
• The application of Behaviorally Anchored Rating' Scalesmeasure group morale was, en'cour:agi'ng as'an alternativetraditional self-report,measures obtained in surveys.cations for BARS surveys may be useful in reducing thefound in other sel f report;,inst-ruments.
• Wh'en IBARS have been used sol ely for performance appra i san,' the timeand cost factors involved in ,their developm~nt have been high.Research is needed to identify multiple uses for BARS, such asdelineating (org:anizational goals, in order to make .develo,pmentefforts .worthwhile.
Chapter II 1. Behav iora1.Sca1e,s "---'--'---'~--'-"-'--"'" .•...._, ..... - .._-_.,--~---_., •__••..•.• ' -. --.. ....." ...,. .• - _ .•_- .... ~-' ••. --!- "'-'-' -- --- •• ,.~~.. ..,...
.. ~.
• Further research is needed to validate rater training programsusing BARS to increase rater accuracy. 11);\
V
236
(
• Further research is needed to investlgate the possible increase invalidity' for BARS when"mu1tip1e rater~'groups stipulate the dimensions of performance that ~ffects-th~fu~ ~
.-..'.,
• Most empiri~a1 research dealing witp p~rf9rmance evaluation sys-tems, such as Behavioral Expectation,S9a'~s~(BES), measures ,improvemen ts inatti tudes and performan;ce~'for short study peri ods ofless than one year. Longi tudi na 1 studies"'for'" the impact of BESover time would be, worthwhi 1ein estabHshihg' or disputing thelong-range resu 1ts that these systems hope;'to have.
• BES require further inve'stjgation as 'to behav'ior change" relationship to performance effecti veness, and, deve1 opmenta l' and scori ngprocedures. . ...: 'j,.,
• More studies are needed to test the effects of-various train.inginterventions on psychometric error:, and the useof;BES •
. . :,."., f:r
• Behavioral Observation Scales require more research't6 determinewhether these scales are'rea11y measuring simple observations orwhether they are measuri ng tra i t-1 i ke judgment· due>\"to'ira ter reca 11over tlme. . ' ~Jjt'5"
o
• Mixed Standard Scales (MSS) research should focus9.n{;~hei\ratingprocess and·· environment si nee the psychometric properi~1~$2iof thera ti ng' sca:1e st.-, may be i nf1 uenced by organi zati ona}:;r.ewafG!'practi cesand organizational climate. " ).t"M~~!,iY;;, <'.;:',
. . '- ~ .!~~l~;~:~:.;~:.~:'j\:~:,~ ~. i ,"
• MSS have been shown to ·be reliable and valid. Howev~r" ratersprefer. other scale types over MSS. Addi ti ona1 te~,ea',t!qnf~::ii:: neededto determine whether MSS are ,appropriate for use in operationaltest arid, eva1uati on (OT&E). , :%!:;iL:>'y
• Anchor items on MSS require investigation for possi:li1~ multidimen-sionality since this would yield inconsistent'rating's: ." .
Chapter IV~ ·:'Design of Questionnaire Items
• 'Further investigation is needed to substantiate'whether respondentswi th more educa ti on wi 11 answer open-ended arid closed-end forms 'consistently.' Respondents with less education; do not respondconsistently to these form differences. .,; ..;-i;f,r-
• There has not been consistent replication as.-:to the wording ofi terns and the tone of wording so that researchers have not beenable to predict when the items will be influenced by the wordingand which words will influence the results,•.'! MO.re research isneeded in this area.
II I
__~__,~.__....._~__._.__._...~_I237
• Researchers need to assess various procedures or methods as a wayto identify the use of specific words which are used in items.Such a method may have the potential to identify the structure ofthe i tern i tse1f.o
/i>i*~~~~;:)]~&~~!~~r:~~n~1s needed in the OT&E community to determine whether item\i;{i~~I~i!\}i;,H%;jt~,t":~\Ij:~~,jec!,miquesused in marketing surveys and behavioral scale
t would be applicable in .reduc:ing the number of itemsfi e ld , surveys.-
;" '. Methodol ogica 1 research for understandi ng why order effects occuris an important area for questionnaire construction res~arch ·to .examine. For example, it is assumed that separating two items byseveral or many others may eliminate a' known context effect.Furtheri nVestiga ti onahd grea terunderstandi ng of these issues isl" .
needed. . ~ ..
r)"\ ~
I More needs to be known about the usefulness of balancing anchors inconjuncti.o,n with what type of application the scale will have.
I Replication would be helpful to indicate whether items of greater'length will elicit responses toward the middle ·of the scales. Inaddition, replication is required to. determine whether items ofshort length elicit responses toward the positive end of the scale.
• Further rePlication,is,~ugg'~~tedfor long' items which are negative·ly worded to deterrilinewhether'they elicit responses toward themidrange of the scale.
. " .. "_'~""1"~~:'~ .. ' ".;~ ~:~.. , .,', . .
I More studies would be. desirab·let9, inves,tigate both positive a'nd. 'nega ti vei tems on,a Questi ol:lnai,re~" There has. been some evidence. that negatively worded items mayresu},t,i'riless accurate responses,
and reduc.e r~sp0rJse ·validity. . '
Chapter V. Design of Scale Categories,c,i.\.f'" {.
I There has been some evidence that formats which are easiest to ratewould be best for respondents whonave'lower levels of education.•Further research is needed to expJor~ this finding, and to identifywhich fOrmats those mig'ht be. ';'
I If responsealter,natives are sel~c~:g,,,i~9~pendent'of the item, anq.measured .for bands along the scale. d.imens ion ,. there may be thepossittility that response alterfl.~~iv,~ J~nkage t() the item may
__modify_the__s~n..dgr9c1~yig.:ti9.n 9.f.:'c~~ch response. The 1inkage of theresponse alternative to the item for variations in the standarddev i a ti on needs. further i nye,s ti gatjpn ..
I More studies would be useful in examining whether fully labeledscales yield'less skewed responses than scales anchored only at theextremes.· There has .been spme"eVidence that fully lapeled scalesachieved higher test-retest· correlations. This finding was observed with mar~et-segmentation studies, and would need investigation for generalizing to OT&E studles.
I There has been contradictor~ evidence that verbal anc~ors ~ay loweraccuracy in psychophysical task ratings. More thoroug,h and systematic research would be useful in establishing th~ effects ofverbal anchor; ng on' psychometri c cri teri a. ·for psychophysi ca1 tasks. ())
238
.:,.
o "
0··".··· .." '.
".,.P'
o
,-pictorial anchors .have been subjected to limited investigation.This methodology needs to be extended to'different types of visually perceived ·stimuli in OT&E.·
, There has been conflicting evidence reg~rding individuals who mayor may no.t respond to the "Don' t Know" category. One theory hasproposed that there is a unique constellation of traits whichdescribes individuals who "float" back and forth between the "Don'tKnow"response, and other response alternatives. "Floating" maynot have a single cause, ,although there is no model to'describe
.subjects who exhibi't this behavior. Additional investigation isneeded. ..
"''; .,;>,'
, Further studies are needed to identify the respondent characteristics and/or the processes involved in responses to the presence orabsence of a middle alternative.
Chapter VI. Interviewer and Respondent Characteristics
, More stud.ies would be useful to improve interview tectmiques whichare used in telephone surveys. Experimental variations of questionpresentation may be useful. . . .. "
, Military survey research that incorporates interv:iews needs toinvesti~fate ways to obtain more lead time in survey;"development,increase,;, respo,nse ra te.' for 1arge .peri od i c surveys;ii contro1Lstandardi zati on'· in: 'fie:ld" adini nfstra ti on, and .control' for$ r~'sp()n;se bi as ofpersonnel brought about by the infl uence of s'Uperfor's~1":
, More rese~~ch;i ~ needed on the effects of tnitQ':: pl~.i~'~~;:'on_ faceto-face; i nterv i ews.'Ii;""
• Toinvesti gate cogni tive complexi ty, the contextual differences forthe type' Of organi zati on, and the char~cterhtics{'of,'the respondents, might account for the failure to replicate:-prevdous results.Organizations other than institutions of high education may be amore appro'priate environment to investi gate whether cogni tivecomplexity is a relevant vari~ble in the ratihg'task~<iCognitivecomplexity issues should be investigated for OT&8" respondent populations'.'" ~,~
, Further rep 1i ca ti on is needed on the generali zabi 1i ty :of itemra ti ng by 1eve1 of educa ti on from the genera1 U. S., popu 1ati on :tomi.li tary personne 1• - .
• There may be an interaction among educational level of respondents,'response consistency in rating items" and:intensity' of feelingabout items. Investigation of t~i s i nteract:i oni s needed to rep 1i - .ca te previ ous research.";,
'" Educational level and item nonresponse may' be related; this areacould use more: research. This type of survey is difficult todesign since it ;-s challenging to obtain strategies for identifying~onrespondents.· .
239
'L .
+:I';'++le is known ,about the effect of education on question,,,,',rL;',;');';:;;':f,;.'';;ic:i,+h,,. :are ,designed for use in performance appraisaL Re
this area may be useful ;'
• There has not been consistency in findings for the impact of education and questionnaire construction. 'More research is needed onthe influence of combined relationships with other demographicvariables, as well as generalizability of these results to militarypersonnel.
• Results have been mixed as to 'ethnic background of raters assess·i·ng-·ratees on performance appraisal scales. Further research is neededfor the effect of same-race raters and different-race raters.
• Further re$earch may be required to determine the extent to whichself assessment can be used, and the influence of ethnic backgroundon self assessment.
• N~t enough is known regarding the impact of ethnic background onquestionn~ire construction. More studies for the influence ofethnic background and questionnaire construction would be useful indesigning and analyzing. these instruments.
• Review of the research relating to questionnaire construction andthe differentiation of response patterns by gender of respondentshas received mixed -results. Some studies have found differences in·rating by females and males, while other studies have not. Research is needed to identify interactions of gender, education~
age, and ethnic background. For example, investigation of itemcontent and gender may be useful since the content of an'item mayhave the potential to bias survey results where males and femaleshold different values. .
• .For opi ni on, sl,Jrveys'~ further' studies would be useful in exami ni ngthe influence of; age on item content to assess the historicalperspective of the dffferel1t groups.' . .
•. Nonresponses -to items followi ng a branch, and survey nonresponse',may be influenced by age and education of the ~espondent.. Repli- G
·--ca·t-i-on·-wou·ldbe beneficial in assessing this phenomenon as it isinfluenced by demographic characteristics of Army popUlations in'OT&E.
---"-'Chapter VII. 'Questionnaire Format
.• Evidence supporting anyone format was spar~e and inconsistent.More studies may be' useful in t dentifyi ng strengths and'weaknessesof different scale formats.. However, othermethodologi cal<;;ssuesmay have greater potential for research such as: Rigor of developmental procedures, preference of format by raters, matchingcharacteristi cs of rater and format, assessment of scori ng systems,and examination of different sampling techniques.
240
----'._-,.__.._-_.__... -_._._.....,_....,._---------
/
Ii;'
"r '"
0 ',o •• - ',.~. F
"-" .
o
'. A major implication for future research appears to be the, rea'ssessment of scale item selection. This could be approached in twQways. First, through a technique that would allow for-the word-i'ngof each item (e.g., the 'Ec~o method). Second~ item reductionprocedures that maintain contruct validity.
241
Related Documents