PHASE : I 2014 IMPLEMENTATION OF P&O MPPT BASED QUASI-Z-SOURCE INVERTER FED THREEPHASE INDUCTION MOTOR THESIS SUBMITTED IN PARTIAL FULFILLMENT OF THE REQUIREMENTS FOR THE AWARD OF THE DEGREE OF MASTER OF ENGINEERING IN POWER SYSTEMS ENGINEERING OF THE ANNA UNIVERSITY CHENNAI Submitted by SASITHARAN K R 1373113 PROJECT WORK DEPARTMENT OF ELECTRICAL ENGINEERING GOVERNMENT COLLEGE OF TECHNOLOGY (An Autonomous Institution affiliated to Anna University Chennai) COIMBATORE - 641 013

Welcome message from author
This document is posted to help you gain knowledge. Please leave a comment to let me know what you think about it! Share it to your friends and learn new things together.
Transcript
PHASE : I
2014
IMPLEMENTATION OF P&O
MPPT BASED QUASI-Z-SOURCE
INVERTER FED THREEPHASE
INDUCTION MOTOR
THESIS SUBMITTED IN PARTIAL FULFILLMENT OF
THE REQUIREMENTS FOR THE AWARD OF THE
DEGREE OF MASTER OF ENGINEERING
IN POWER SYSTEMS ENGINEERING
OF THE ANNA UNIVERSITY CHENNAI
Submitted by
SASITHARAN K R
1373113
Under the Guidance of
<< NAME OF THE GUIDE >>
PROJECT
WORK
DEPARTMENT OF ELECTRICAL ENGINEERING
GOVERNMENT COLLEGE OF TECHNOLOGY
(An Autonomous Institution affiliated to Anna University Chennai)
COIMBATORE - 641 013

ACKNOWLEDGEMENT
It gives me immense pleasure in expressing my profound gratitude to
Dr. V. LAKSHMI PRABHA M.E, Ph.D., Principal, Government College of
Technology for the facility made available for the progress and completion of
my thesis.
I am extremely thankful to Dr. N. DEVARAJAN M.E., Ph.D., Professor
and Head, Department of Electrical Engineering for the permission and
encouragement accorded to carry out this thesis work.
I would like to express my sincere thanks to my guide
Dr. K. RANJITH KUMAR M.E., Ph.D., Assistant Professor of Electrical
Engineering for his enthusiastic guidance and his invaluable help during the
entire period of my project work.
I also thank my Faculty advisor, Dr. E. LATHA MERCY M.E., Ph.D.,
Associate Professor, Department of Electrical Engineering for her support
during the course of the project work.
I also thank all the other teaching and non-teaching staff members of
the Department of Electrical Engineering and Electronics and Instrumentation
Engineering for their cooperation during my thesis work.
Above all, I thank the Almighty God for his gracious blessings for the
successful completion of my thesis.
Finally I would like to dedicate the whole work to my parents for the
everlasting love and constant encouragement given by them during the
period, even being miles apart.
SYNOPSIS
The objective of this project work is performance of three phase
induction motor such as torque-speed characteristics are analyzed with
Quasi-Z-source inverter with controlled from Maximum power point tracking
(MPPT) algorithm to controls the switching during shoot through and non-
shoot through states.
The Quasi-Z-source inverter (QZI) is a single stage Power converter
derived from the Z-source inverter topology. This employs an impedance
network which couples the source and the inverter to achieve voltage boost
and inversion.
Solar panels have a non-linear voltage-current (V-I) characteristics,
with a distinct maximum power point, which depends on the environmental
factors, such as temperature and irradiance. Maximum power point tracking
(MPPT) algorithm is used to obtain the maximum Power from solar PV system
and controls the inverter switching during shoot through and non-shoot
through states.
In this work, performance of three phase induction motor such as
torque-speed characteristics are analyzed with Quasi-Z-source inverter. The
modeling of induction motor, PV array, Quasi-Z-source Inverter and MPPT
algorithm have been simulated in MATLAB/Simulink environment.

CONTENTS
CHAPTER
NO.
TITLE PAGE NO.
ACKNOWLEDGEMENT i
SYNOPSIS ii
CONTENTS iii
LIST OF FIGURES vi
LIST OF ABBREVIATIONS viii
1. INTRODUCTION
1.1 GENERAL 1
1.2 LITEACTURE SERWAY 3
1.3 OBJECTIVE OF THE PROJECT 4
1.3 BLOCK DIAGRAM
1.3.1 CONVENTIONAL SYSTEM 4
1.3.2 PROPOSED SYSTEM 5
1.4 BLOCK DIAGRAM EXPLANATION 5
2. SOLAR POWER GENERATION
2.1 PHOTOVOLTAIC SYSTEM 7
2.2 CHARACTERISTICS OF PV MODULE 7
2.3 SOLAR PV MODULE 10
2.4 MPPT CONTROL
2.4.1 INTRODUCTION 13
2.4.2 PERTURB AND OBSERVE METHOD 14
3. QUASI-Z-SOURCE INVERTER
3.1 INTRODUCTION 16
3.2 QUASI-Z-SOURCE NETWORK 16
3.3 OPERATING PRINCIPLE AND EQUIVALENT
CIRCUIT OF QZI
3.3.1 ACTIVE MODE 17
3.3.2 SHOOT THROUGH MODE 18
4. THREE-PHASE INDUCTION MOTOR
4.1 INTRODUCTION 21
4.2 PRINCIPLE OF COMPONENTS 21
4.3 PRINCIPLE OF OPERATION 22
4.4 ROTATING FIELD AND INDUCEED VOLTAGE 24
4.5 RUNNING OPERATION 27
4.6 SPECIFICATIONS OF INDUCTION MOTOR 28
5. SIMULATION RESULTS
5.1 INTRODUCTION 29
5.2 SIMULATION PARAMETERS 29
5.3 SIMULATION RESULTS
5.3.1 SIMULATION DESIGH AND OUTPUTS FROM WITHOUT MPPT CONTOL TECHNIQUES
31
5.3.2 SIMULATION DESIGH AND OUTPUTS FROM WITH MPPT CONTOL TECHNIQUES
37
6. CONCLUSION 42
REFERANCES 43
LIST OF FIGURES
FIGURE NO
FIGURE NAME
PAGE NO
1.1 CONVENTIONAL SYSTEM 4
1.2 PROPOSED SYSTEM 5
2.1 PHOTOVOLTAIC EFFECTS ON SOLAR CELL 8
2.2 SOLAR ARRAY 8
2.3 TYPICAL CHARACTERISTICS CURVE OF A SOLAR
CELL
9
2.4 PV-CELL MODULE 10
2.5 I-V CURVE OF SOLAR CELL 12
2.6 P-V CURVE OF SOLAR CELL 12
2.7 SIGN OF dP/dV AT DIFFERENT POSITIONS OF THE
POWER CHARACTERISTIC
14
2.8 PERTURB AND OBSERVE ALFORITHEM FLOW
CHART
15
3.1 QUSAI-Z-SOURCE INVERTER 17
3.2 EQIVALENT CIRCUIT OF QZSI IN ACTIVE MODE 18
3.3 EQIVALENT CIRCUIT OF QZSI IN SHOOT-
THROUGH MODE
18
4.1 THREE-PHASE INDUCTION MOTOR 21
4.3 MOVEING MAGNET CUTTING ACROSS A
CONDUCTING LADDER
24
4.4 ELEMENTARY STATOR HAVING TERMINALS A, B,
C CONNECTED TO A THREE-PHASE SOURCE
25
4.5 AIR-GAP FLUX DENSITY DISTRIBUTION 25
5.1 PV MODULE WITH INDUCTION MOTOR
PERFORMANCE FROM WITHOUT MPPT CONTROL
TECHNIQUE
31
5.1.1 PV MODULE VOLTAGE SOURCE SIMULATION 32
DESIGN
5.1.2 PV MODULE VOLTAGE SOURCE OUTPUT
WAVEFORM
32
5.1.3 PV MODULE WITH QUASI-Z-SOURCE SIMULATION
DESIGN
33
5.1.4 PV MODULE WITH QUASI-Z-SOURCE VOLTAGE
OUTPUT WAVEFORM
33
5.1.5 PV MODULE WITH INVERTER SIMULATION
DESIGN
34
5.1.6 PV MODULE WITH INVERTER SIMULATION
VOLTAGE OUTPUT WAVEFORM
34
5.1.7 PV MODULE WITH INVERTER SIMULATION
CURRENT OUTPUT WAVEFORM
35
5.1.8 PV MODULE WITH INDUCTION MOTOR
SIMULATION DESIGN
35
5.1.9 PV MODULE WITH INDUCTION MOTOR SPEED-
TORQUE CHARACTERISTICS OF MECHANICAL
OUTPUT WAVEFORM
36
5.1.10 PV MODULE WITH STATOR CURRENT OUTPUT
WAVEFORM
36
5.2 PV MODULE WITH INDUCTION MOTOR
PERFORMANCE FROM WITH MPPT CONTROL
TECHNIGUE
37
5.2.1 PV MODULE WITH QUASI-Z-SOURCE SIMULATION
DESIGN WITH MPPT CONTROL
37
5.2.2 PV MODULE WITH QUASI-Z-SOURCE SIMULATION
VOLTAGE OUTPUT WAVEFORM
38
5.2.3 PV MODULE WITH INVERTER SIMLATION DESIGN 39
5.2.4 PV MODULE WITH INVERTER SIMULATION
VOLTAGE OUTPUT WAVEFORM
39
5.2.5 PV MODULE WITH INVERTER SIMULATION
CURRENT OUTPUT WAVEFORM
40
5.2.6 PV MODULE WITH INDUCTION MOTOR
SIMULATION WITH MPPT CONTROL TECHNIQUE
40
5.2.7 PV MODULE WITH INDUCTION MOTOR SPEED-
TORQUE CHARACTERISTICS OF MECHANICAL
OUTPUT WAVEFORM
41
5.2.8 PV MODULE WITH INDUCTION MOTOR STATOR
CURRENT OUTPUT WAVEFORM
41

LIST OF TABLES TABLE NO TABLE NAME PAGE NO
2.1 ELECTRICAL CHARACTERISTICS DATA OF PV
MODULE
13
4.1 INDUCTION MOTOR SPECIFICATIONS 28
5.1 QZI PARAMETER AND THEIR VALUES 29
5.2 PV PANEL PARAMETERS AND THEIR VALUES 30

LIST OF ABBREVIATIONS
PV PHOTO VOLTAIC
MPPT MAXIMUM POWER POINT
TRACKEING
V-I VOLTAGE-CURRENT
AC ALTERNATE CURRENT
DC DIRECT CURRENT
QZI QUASI-Z-SOURCE INVERTER
ZSI Z-SOURE INVERTER
P&O PERTURB AND OBSERVE
VSI VOLTAGE SOURCE INVERTER
CSI CURRENT SOURCE INVERTER
IM INDUCTION MOTOR
CHAPTER 1
INTRODUCTION
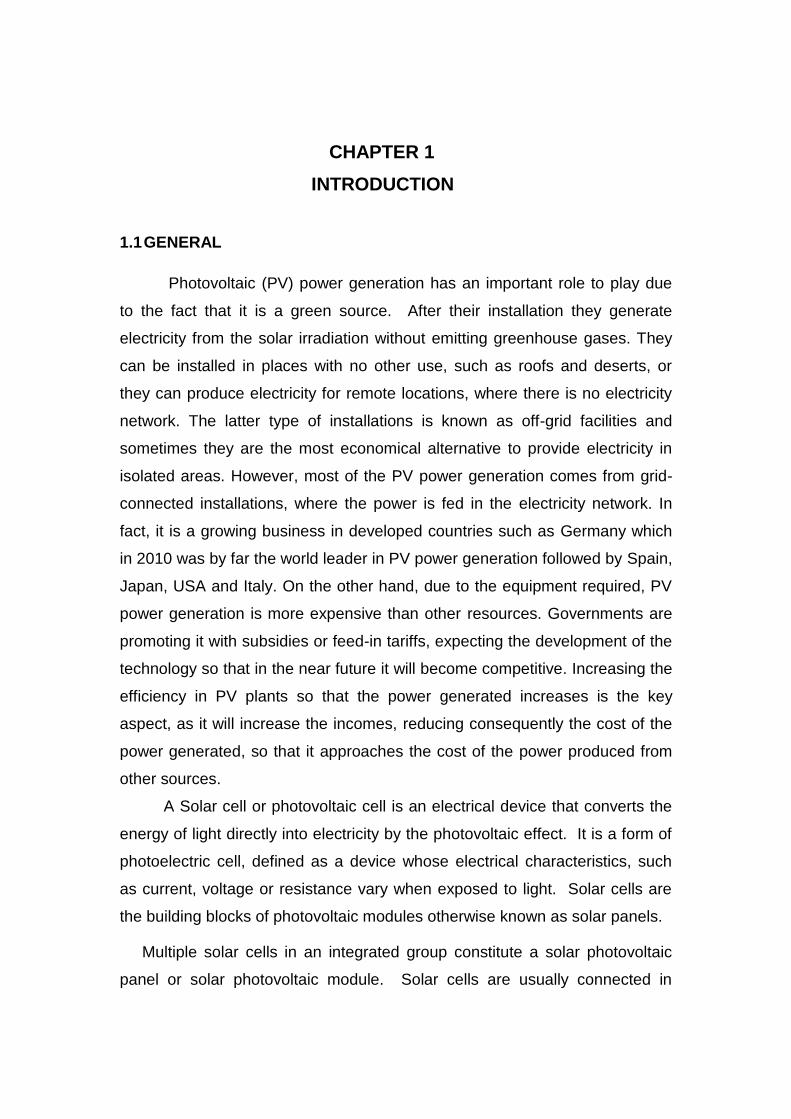
1.1 GENERAL
Photovoltaic (PV) power generation has an important role to play due
to the fact that it is a green source. After their installation they generate
electricity from the solar irradiation without emitting greenhouse gases. They
can be installed in places with no other use, such as roofs and deserts, or
they can produce electricity for remote locations, where there is no electricity
network. The latter type of installations is known as off-grid facilities and
sometimes they are the most economical alternative to provide electricity in
isolated areas. However, most of the PV power generation comes from grid-
connected installations, where the power is fed in the electricity network. In
fact, it is a growing business in developed countries such as Germany which
in 2010 was by far the world leader in PV power generation followed by Spain,
Japan, USA and Italy. On the other hand, due to the equipment required, PV
power generation is more expensive than other resources. Governments are
promoting it with subsidies or feed-in tariffs, expecting the development of the
technology so that in the near future it will become competitive. Increasing the
efficiency in PV plants so that the power generated increases is the key
aspect, as it will increase the incomes, reducing consequently the cost of the
power generated, so that it approaches the cost of the power produced from
other sources.
A Solar cell or photovoltaic cell is an electrical device that converts the
energy of light directly into electricity by the photovoltaic effect. It is a form of
photoelectric cell, defined as a device whose electrical characteristics, such
as current, voltage or resistance vary when exposed to light. Solar cells are
the building blocks of photovoltaic modules otherwise known as solar panels.
Multiple solar cells in an integrated group constitute a solar photovoltaic
panel or solar photovoltaic module. Solar cells are usually connected in

series in modules, creating an additive voltage. Connecting cells in parallel
yields a higher current. However shadow effects may cause substantial
power loss. In order to achieve maximum power output from the panel
Maximum Power Point Tracking (MPPT) Algorithms are used.
The efficiency of a PV plant is affected mainly by three factors:
The efficiency of the PV panel (between 8-15%)
The efficiency of the inverter (95-98 %)
The efficiency of the MPPT algorithm (which is over 98%).
Improving the efficiency of the PV panel and the inverter is not easy as it
depends on the technology available, it may require better components, which
can increase drastically the cost of the installation. Instead, improving the
tracking of the MPPT with new control algorithms is easier, not expensive and
can be done even in plants which are already in use by updating their control
algorithms, which would lead to an immediate increase in PV power
generation and consequently a reduction in its price.
MPPT algorithms are necessary because PV arrays have a non linear
voltage-current (V-I) characteristic with a unique point where the power
produced is maximum. This point depends on the temperature of the panels
and on the irradiance conditions. Both conditions change during the day and
are also different depending on the season of the year. Furthermore,
irradiation can change rapidly due to changing atmospheric conditions such
as clouds. It is very important to track the MPP accurately under all possible
conditions so that the maximum available power is always obtained.
Since the power output of the solar panel belong to low power level
applications, a converter is added to boost up the output according to the
requirement. The load connected can be either a DC load or an AC load. In
case of Ac load connection an inverter circuit is added next to the converter.
But in most cases, a resistor plays the role of a load.
1.2 LITEACTURE SURWAY
Revathy.R et al., 2014 suggested by to generate residential power
using low power input of renewable energy like solar along with two-stage
QZI, single phase isolation transformer, and a voltage doubler rectifier and
three phase induction motor. The proposed cascaded qZSI can be applied
to almost all dc/ac, ac/dc, ac/ac and dc/dc power conversion schemes can
be used in demanding applications as power conditioners for solar panel.
Sibirahman T.P et al., 2014 described by a multicell SL Z-source
inerter is controlled the speed of an induction motor. To adding an extra
boosting flexibility by keeping the number of active semiconductors
unchanged, voltage-type and current-type Z-source inverters were earlier
proposed order to increase the boosting gains, simple boost control
method is employed in Multicell Switched-Inductor.
Nisha K.C.R et al., 2013 suggested using of embedded EZ-source
inverter system as a single stage power conversion system concept for
adjustable speed drives in photovoltaic applications and open-loop and
closed-loop control strategy of embedded EZSI system are performed.
Savitha P.B et al., 2014 proposed efficient PV module base on single
diode equivalent circuit model using software and compared the simulated
model results with manufacture’s specifications like peak current, peak
voltage, open circuit voltage and short circuit current are analysed using
WEBEL SOLAR W2300 250W Monocrystalline module.
Jong-Hyoung Park et al., 2009 proposed in PV system using a QZSI
for power reduction and power stage can be reduced in addition of shoot-
through stage which is a characteristics of QZSI and track the maximum
power to controlled methods such as MPPT, Point of Common Coupling
current control. Then the MPPT control technique with a modified P&O
method, the PCC current control for the regulation of the dc-link capacitor
voltage and the PWM methods for the system are analyzed.
1.3 OBJECTIVE OF THE PROJECT
The solar panel’s efficiency is usually around 40-60% and it is not easy to
harvest the maximum power from the solar panel as it is dependent on
irradiation which is an unstable factor. Moreover the panel output further
reduces when dust, cloud or other factor deposit on the panel. Thus an
improved MPPT scheme is proposed to maximize the power output.
The Objective of the project,
To compare performance of the conventional system with
the proposed system.
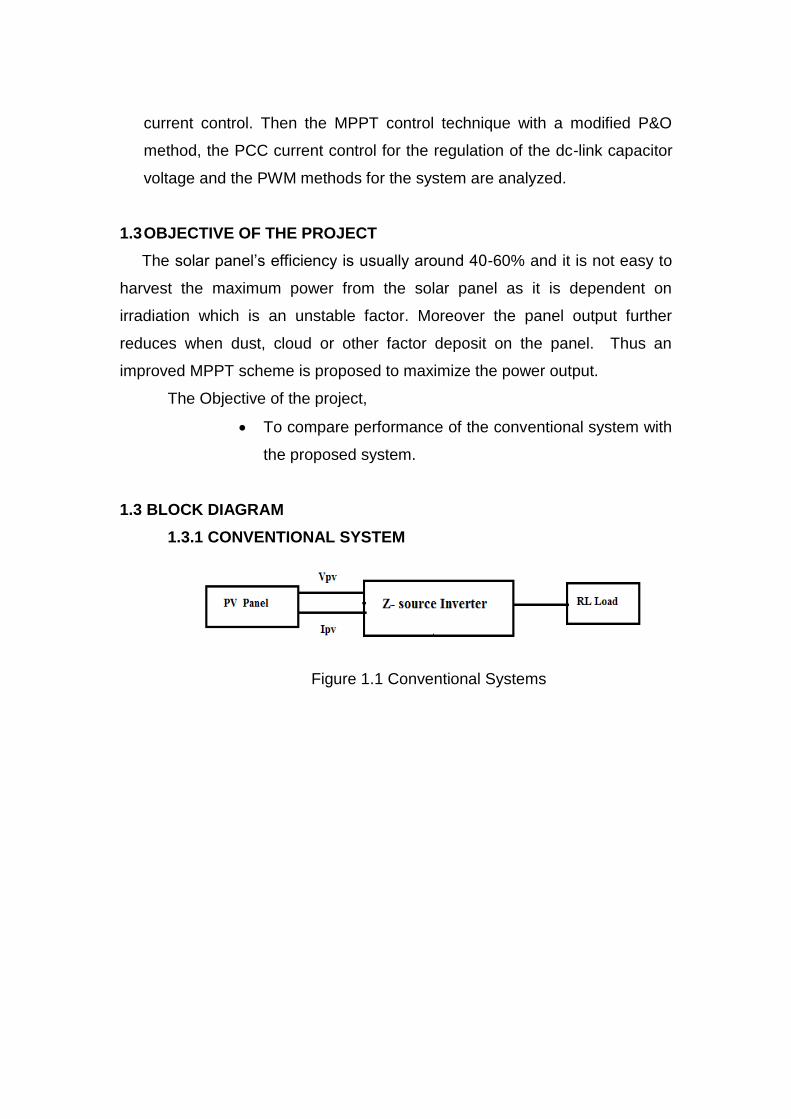
1.3 BLOCK DIAGRAM
1.3.1 CONVENTIONAL SYSTEM
Figure 1.1 Conventional Systems
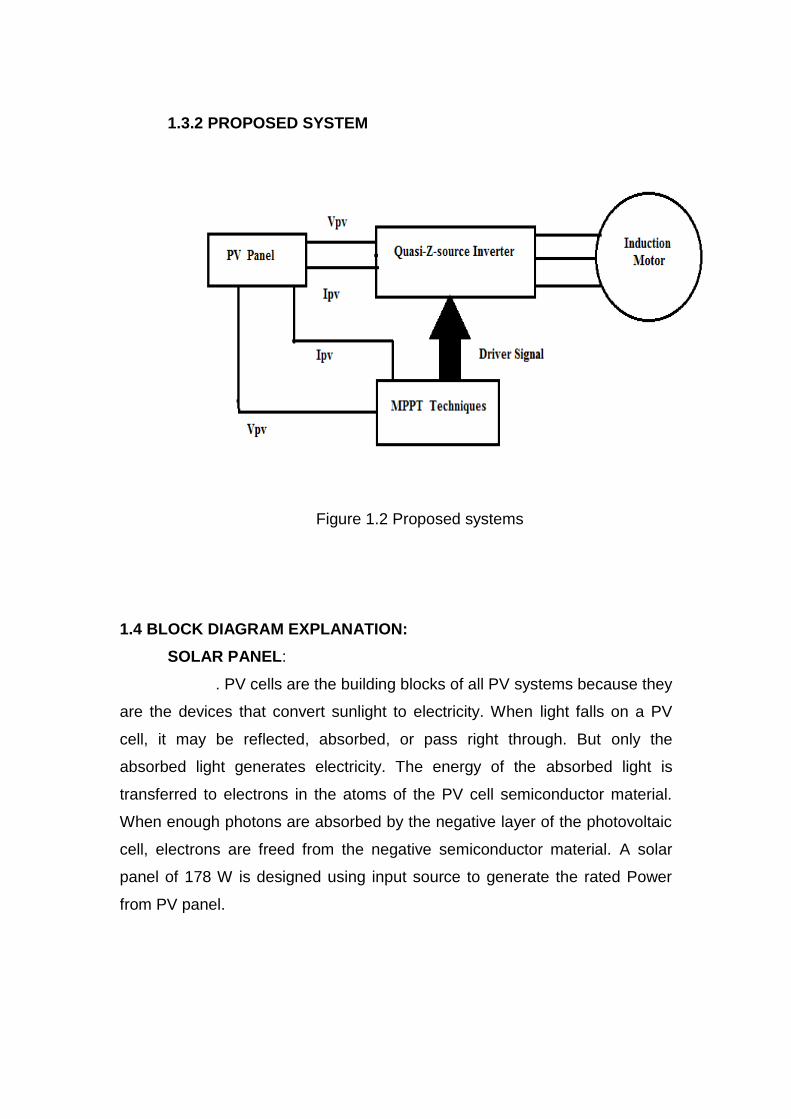
1.3.2 PROPOSED SYSTEM
Figure 1.2 Proposed systems
1.4 BLOCK DIAGRAM EXPLANATION:
SOLAR PANEL:
. PV cells are the building blocks of all PV systems because they
are the devices that convert sunlight to electricity. When light falls on a PV
cell, it may be reflected, absorbed, or pass right through. But only the
absorbed light generates electricity. The energy of the absorbed light is
transferred to electrons in the atoms of the PV cell semiconductor material.
When enough photons are absorbed by the negative layer of the photovoltaic
cell, electrons are freed from the negative semiconductor material. A solar
panel of 178 W is designed using input source to generate the rated Power
from PV panel.

QUASI-Z-SOURCE INVERTER:
Quasi-Z-Source Inverter (QZSI) acquires all the advantages of
traditional z-source inverter. The impedance network couples the source and
the inverter. The impedance network couples the source and the inverter to
achieve voltage boost and the inversion in a single stage. By using this new
topology, the inverter draws a constant current from the PV panels, causes
less EMI problems and reduced source stress compared to the traditional ZSI.
PERTURB AND OBSERVE MPPT:
The controller adjusts the voltage by a small amount from the
array and measures power; if the power increases, further adjustments in that
direction are tried until power no longer increases. This is called the Perturb
and Observe method. It is also called as Hill climbing method. Perturb and
Observe method may result in top-level efficiency, provided that a proper
predictive and adaptive hill climbing strategy is adopted.
LOAD:
The load used for an Induction motor. Squirrel cage type of
induction motor should be considered this type of load. Cost wise, it should be
very low. Maintains and constructions should be very simple. Performance is
better, compared through the other type of motors.
CHAPTER 2
SOLAR POWER GENERATION
2.1 PHOTOVOLTAIC SYSTEM
Photovoltaic (PV) cells, or solar cells, take advantage of the
photoelectric effect to produce electricity. PV cells are the building blocks of
all PV systems because they are the devices that convert sunlight to
electricity. When light falls on a PV cell, it may be reflected, absorbed, or pass
right through. But only the absorbed light generates electricity. The energy of
the absorbed light is transferred to electrons in the atoms of the PV cell
semiconductor material. When enough photons are absorbed by the negative
layer of the photovoltaic cell, electrons are freed from the negative
semiconductor material. Due to the manufacturing process of the positive
layer, these freed electrons naturally migrate to the positive layer creating a
voltage differential, similar to a household battery.
When the two layers are connected to an external load, they electrons
flow through the circuit creating electricity. Each individual solar energy cell
produces only 1-2 watts. To increase power output, cells are combined in a
weather-tight package called a solar module. These modules (from one to
several thousand) are then wired up in serial and/or parallel with one another,
into what's called a solar array, to create the desired voltage and amperage
output required by the given project. With their newfound energy, these
electrons escape from their normal positions in the atoms and become part of
the electrical flow, or current, in an electrical circuit. A special electrical
property of the PV cell provides the force, or voltage, needed to drive the
current through an external load, such as a light bulb.
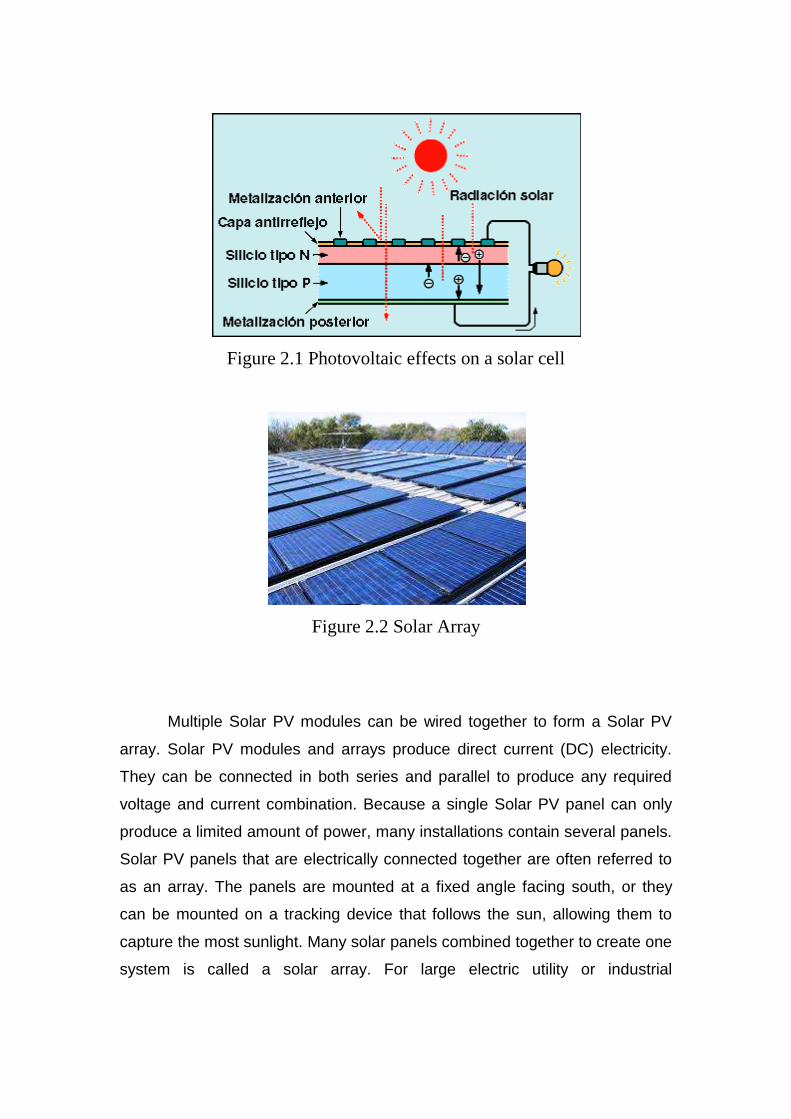
Figure 2.1 Photovoltaic effects on a solar cell
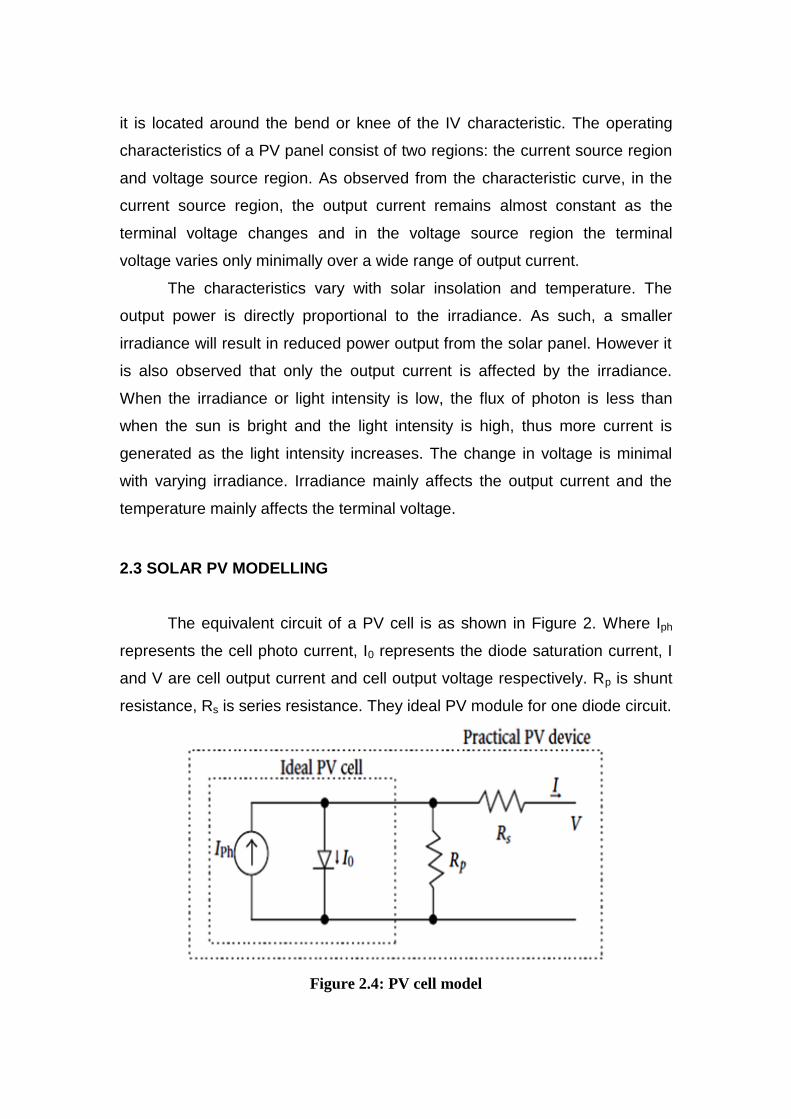
Figure 2.2 Solar Array
Multiple Solar PV modules can be wired together to form a Solar PV
array. Solar PV modules and arrays produce direct current (DC) electricity.
They can be connected in both series and parallel to produce any required
voltage and current combination. Because a single Solar PV panel can only
produce a limited amount of power, many installations contain several panels.
Solar PV panels that are electrically connected together are often referred to
as an array. The panels are mounted at a fixed angle facing south, or they
can be mounted on a tracking device that follows the sun, allowing them to
capture the most sunlight. Many solar panels combined together to create one
system is called a solar array. For large electric utility or industrial

applications, hundreds of solar arrays are interconnected to form a large
utility-scale PV system.
2.2 CHARACTERISTICS OF PV MODULE
The silicon solar cell gives output voltage of around 0.7 V under open
circuit condition. To get a higher output voltage many such cells are
connected in series. The typical characteristic curve of a PV solar cell is
shown below
Figure 2.3 Typical characteristic curve of a solar cell
The characteristic of a PV module is non-linear which makes it difficult
to determine the maximum power point. In order to extract maximum power
from the PV module, it must always be operated at or very close to where the
power is highest. This point is referred to as Maximum power point (MPP) and
it is located around the bend or knee of the IV characteristic. The operating
characteristics of a PV panel consist of two regions: the current source region
and voltage source region. As observed from the characteristic curve, in the
current source region, the output current remains almost constant as the
terminal voltage changes and in the voltage source region the terminal
voltage varies only minimally over a wide range of output current.
The characteristics vary with solar insolation and temperature. The
output power is directly proportional to the irradiance. As such, a smaller
irradiance will result in reduced power output from the solar panel. However it
is also observed that only the output current is affected by the irradiance.
When the irradiance or light intensity is low, the flux of photon is less than
when the sun is bright and the light intensity is high, thus more current is
generated as the light intensity increases. The change in voltage is minimal
with varying irradiance. Irradiance mainly affects the output current and the
temperature mainly affects the terminal voltage.
2.3 SOLAR PV MODELLING
The equivalent circuit of a PV cell is as shown in Figure 2. Where Iph
represents the cell photo current, I0 represents the diode saturation current, I
and V are cell output current and cell output voltage respectively. Rp is shunt
resistance, Rs is series resistance. They ideal PV module for one diode circuit.
Figure 2.4: PV cell model

The mathematical model of PV array for single diode circuit can be
represented by the following equation [1]:
A. Photo Current (Iph):
Iph depends on the solar irradiation and cell’s operating temperature
according to the below equation.
(2.1)
B. Reverse Saturation Current (Irs):
Reverse saturation current of PV system can be determined by the
given equation.
(2.2)
C. Diode Saturation Current (I0):
Saturation current of PV system varies with the cell temperature can be
determined by given equation.
(2.3)
D. output current (I):
The equation for output current of the PV system of single diode model
presented in Figure 1 is given by,
(2.4)
From the above equations,
Isc is cell’s short circuit current(A),K is the temperature
coefficient(0.0017A/K),Tc is the operating temperature(°C), Tref is the
reference temperature(°C), H is solar isolation (kW/m2), q is charge of electron
(1.6×10⁻¹⁹C), Voc is open circuit voltage(V), Ns is number of cells connected in
series(36), k is Boltzmann constant(1.38×10⁻²³ J/K), A is ideal factor(1.6), Ego
is band gap energy(1.1eV), Np is number of parallel connection of cell(1).
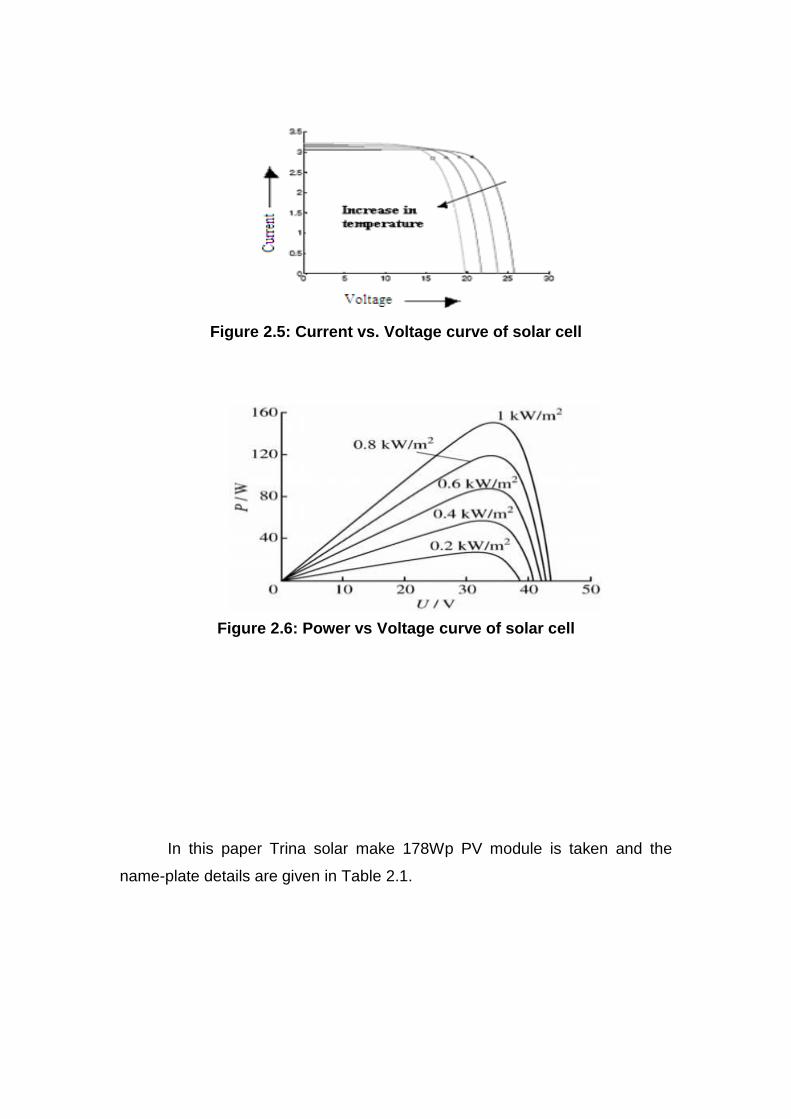
Figure 2.5: Current vs. Voltage curve of solar cell
Figure 2.6: Power vs Voltage curve of solar cell
In this paper Trina solar make 178Wp PV module is taken and the
name-plate details are given in Table 2.1.
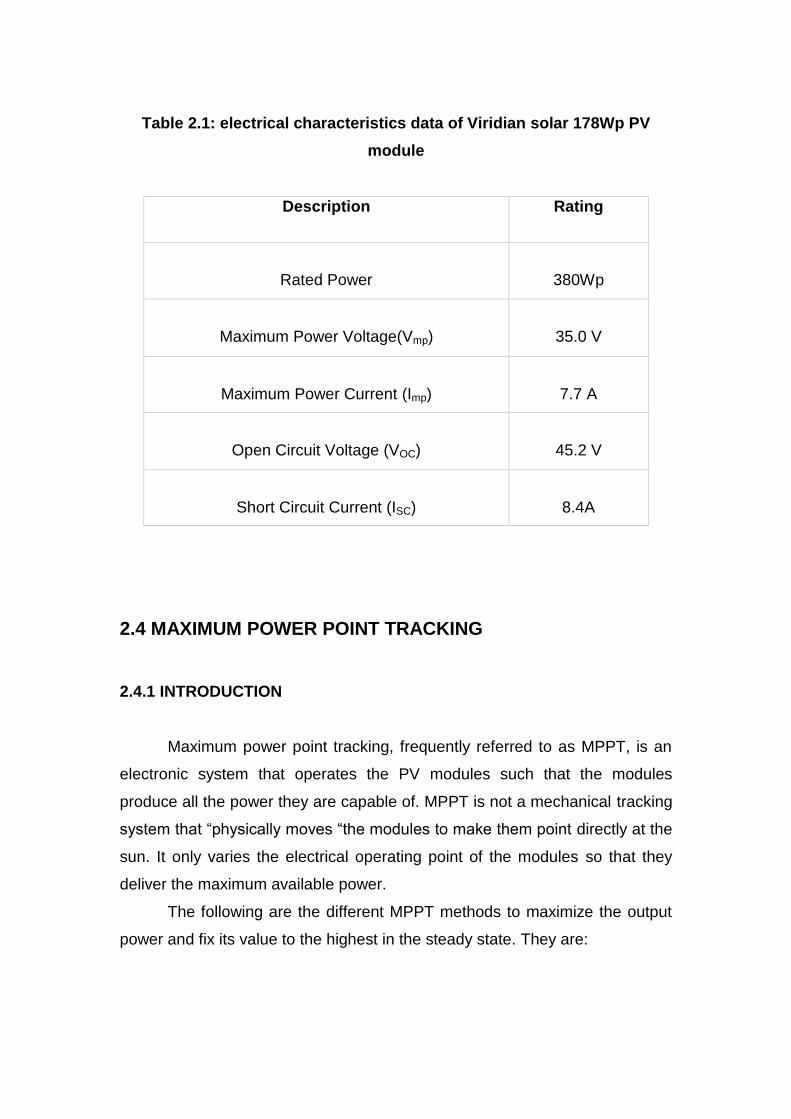
Table 2.1: electrical characteristics data of Viridian solar 178Wp PV
module
Description Rating
Rated Power
380Wp
Maximum Power Voltage(Vmp)
35.0 V
Maximum Power Current (Imp)
7.7 A
Open Circuit Voltage (VOC)
45.2 V
Short Circuit Current (ISC)
8.4A
2.4 MAXIMUM POWER POINT TRACKING
2.4.1 INTRODUCTION
Maximum power point tracking, frequently referred to as MPPT, is an
electronic system that operates the PV modules such that the modules
produce all the power they are capable of. MPPT is not a mechanical tracking
system that “physically moves “the modules to make them point directly at the
sun. It only varies the electrical operating point of the modules so that they
deliver the maximum available power.
The following are the different MPPT methods to maximize the output
power and fix its value to the highest in the steady state. They are:
1. Perturb and observe,
2. Incremental conductance,
3. Parasitic capacitance,
4. Voltage based peak power tracking,
5. Current based peak power tracking.
2.4.2 PERTURB AND OBSERVE METHOD
The controller adjusts the voltage by a small amount from the array and
measures power; if the power increases, further adjustments in that direction
are tried until power no longer increases. This is called the Perturb and
Observe method. It is also called as Hill climbing method. Perturb and
Observe method may result in top-level efficiency, provided that a proper
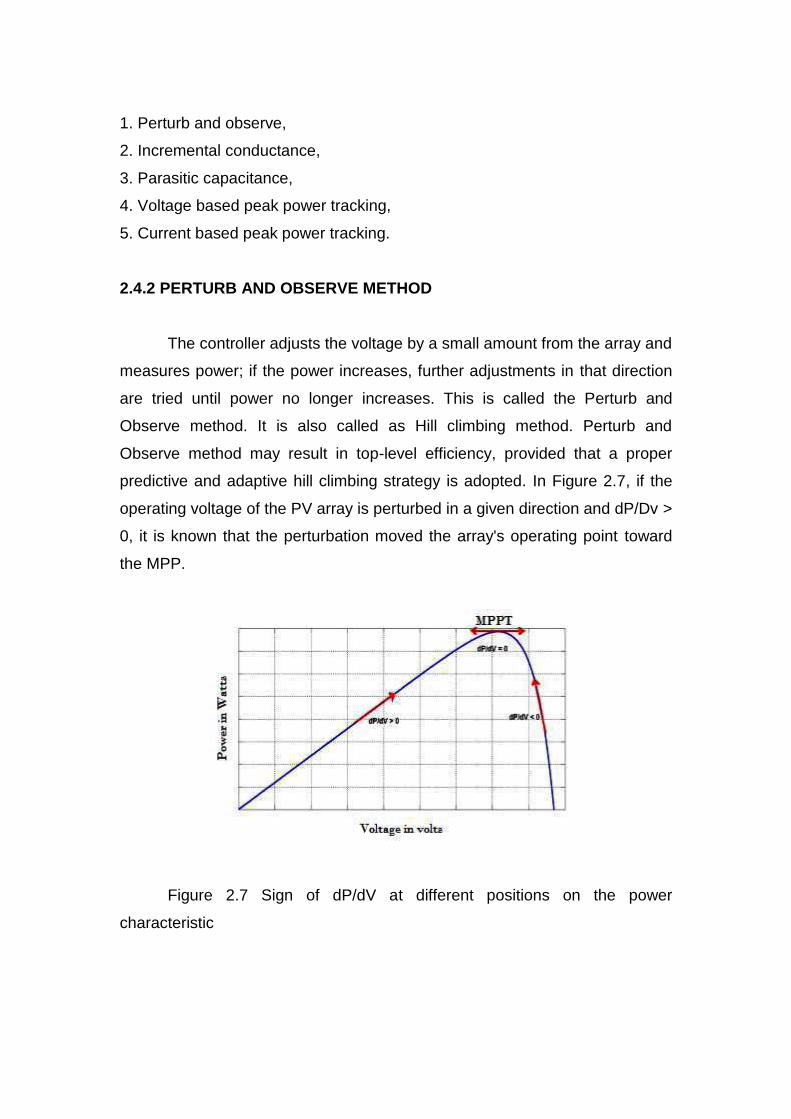
predictive and adaptive hill climbing strategy is adopted. In Figure 2.7, if the
operating voltage of the PV array is perturbed in a given direction and dP/Dv >
0, it is known that the perturbation moved the array's operating point toward
the MPP.
Figure 2.7 Sign of dP/dV at different positions on the power
characteristic
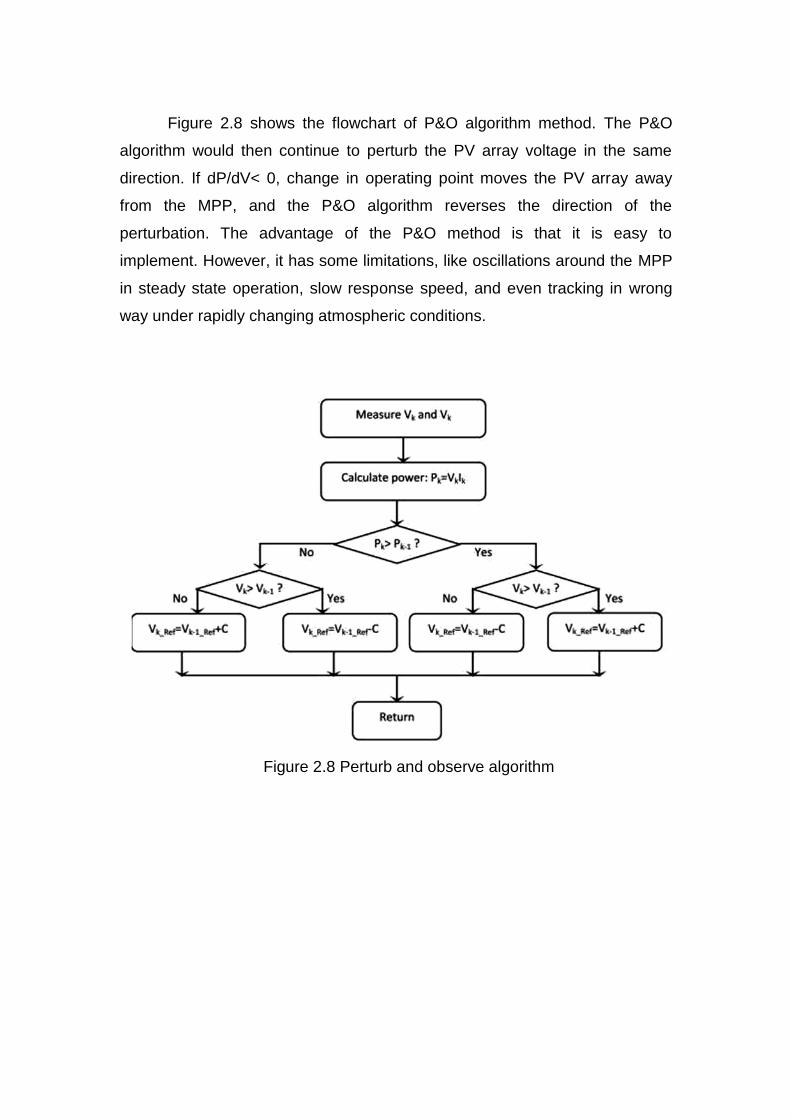
Figure 2.8 shows the flowchart of P&O algorithm method. The P&O
algorithm would then continue to perturb the PV array voltage in the same
direction. If dP/dV< 0, change in operating point moves the PV array away
from the MPP, and the P&O algorithm reverses the direction of the
perturbation. The advantage of the P&O method is that it is easy to
implement. However, it has some limitations, like oscillations around the MPP
in steady state operation, slow response speed, and even tracking in wrong
way under rapidly changing atmospheric conditions.
Figure 2.8 Perturb and observe algorithm
CHAPTER 3
QUASI-Z-SOURCE INVERTER
3.1 INTRODUCTION
The quasi z-source inverter (QZSI) is a single stage power converter derived
from the z-source inverter topology, employing a unique impedance network.
The conventional VSI and CSI suffer from the limitation that triggering two
switches in the same leg or phase leads to a source short and in addition, the
maximum obtainable output voltage cannot exceed the dc input, since they
are buck converters and can produce a voltage a voltage lower than the dc
input voltage. Both z-source inverters and quasi-z-source inverters overcome
these drawbacks; by utilizing several shoot-through zero states. A zero state
is produced when the upper three or lower three switches are fired
simultaneously to boost the output voltage. Sustaining the six permissible
active switching states of a VSI, the zero states can be partially or completely
replaced by the shoot through states depending upon the voltage boost
requirement.
Quasi-Z-Source Inverter (QZSI) acquires all the advantages of traditional z-
source inverter. The impedance network couples the source and the inverter.
The impedance network couples the source and the inverter to achieve
voltage boost and the inversion in a single stage. By using this new topology,
the inverter draws a constant current from the PV panels, causes less EMI
problems and reduced source stress compared to the traditional ZSI.
3.2 QZSI NETWORK
The QZSI circuit differs from that of a conventional ZSI in the LC impedance
network interface between the source and inverter. The unique LC and diode
network connected to the inverter bridge modify the operation of the circuit,
allowing the shoot-through state which is forbidden in traditional VSI. This
network will effectively protect the circuit from the damage when the shoot-
through occurs and by using the shoot-through state, the (quasi) Z-source
network boosts the dc-link voltage.

Figure 3.1 Quasi Z source Inverter
The impedance network of QZSI is a two port network. It consists of inductors
and capacitors connected as shown in figure. This network is employed to
provide an impedance source, coupling the converter to the load. The dc
source can be battery, diode rectifier, thyristor converter or PV array. The
QZSI topology is shown the figure 3.1.
3.3 OPERATING PRINCIPLE AND EQUIVALENT CIRCUIT OF QZSI
The two modes of operation of a quasi z-source inverter are:
(1) Non-shoot through mode (active mode).
(2) Shoot through mode.
3.3.1 ACTIVE MODE
In the non-shoot through mode, the switching pattern for the QZSI is
similar to that of a VSI. The inverter bridge, viewed from the DC side is
equivalent to a current source. , the input dc voltage is available as DC link
voltage input to the inverter, which makes the QZSI behave similar to a VSI.
Figure 3.2 Equivalent circuit of QZSI in Active mode
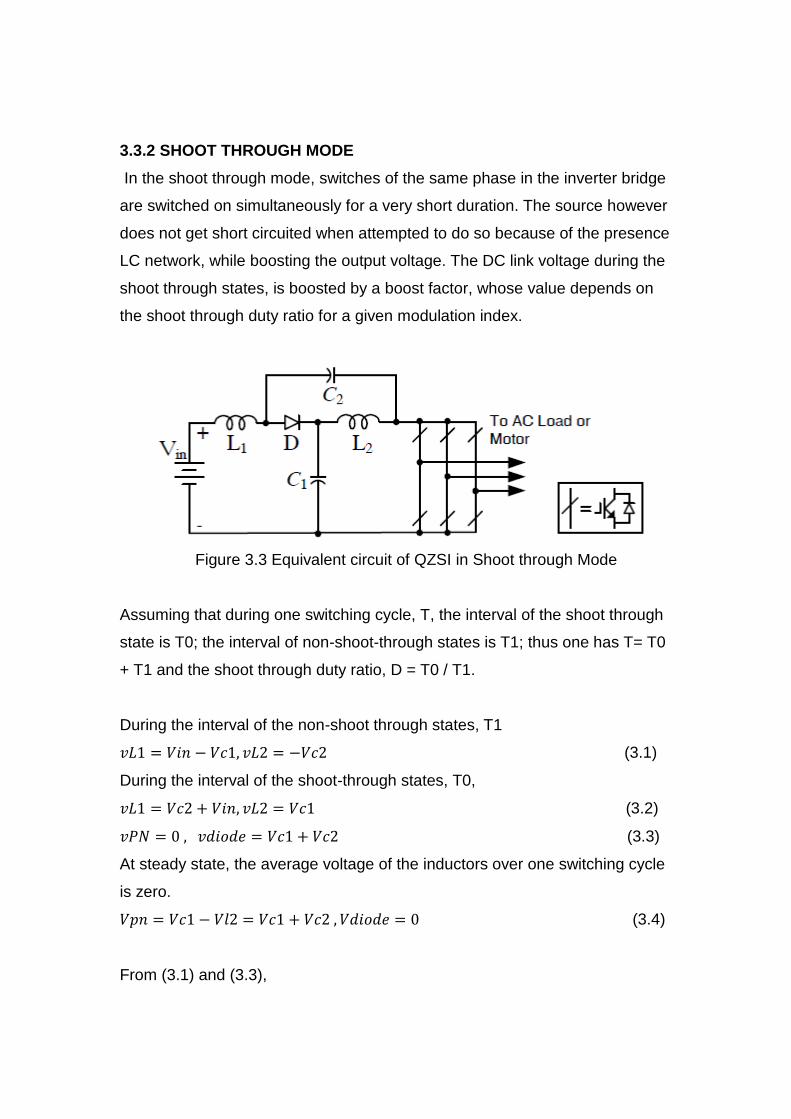
3.3.2 SHOOT THROUGH MODE
In the shoot through mode, switches of the same phase in the inverter bridge
are switched on simultaneously for a very short duration. The source however
does not get short circuited when attempted to do so because of the presence
LC network, while boosting the output voltage. The DC link voltage during the
shoot through states, is boosted by a boost factor, whose value depends on
the shoot through duty ratio for a given modulation index.
Figure 3.3 Equivalent circuit of QZSI in Shoot through Mode
Assuming that during one switching cycle, T, the interval of the shoot through
state is T0; the interval of non-shoot-through states is T1; thus one has T= T0
+ T1 and the shoot through duty ratio, D = T0 / T1.
During the interval of the non-shoot through states, T1
(3.1)
During the interval of the shoot-through states, T0,
(3.2)
(3.3)
At steady state, the average voltage of the inductors over one switching cycle
is zero.
(3.4)
From (3.1) and (3.3),
(3.5)
(3.6)
Thus,
(3.7)
From (3.4), (3.6) and (3.7), the peak dc-link voltage across the inverter bridge
is
(3.8)
Where B is boost factor of the QZSI. This is also the peak voltage across the
diode. The average current of the inductors L1, L2 can be calculated by the
system power rating P,
(3.9)
According to Kirchhoff’s current law and (3.9), we also can get that,
(3.10)
Hence QZSI inherits all the advantages of the ZSI. It can buck or boost a
voltage with a given boost factor. It is able to handle a shoot through state,
and therefore it is more reliable than the traditional VSI. It is unnecessary to
add a dead band into control schemes, which reduces the output distortion. In
addition, there are some unique merits of the QZSI when compared to the
ZSI.
CHAPTER 4
THREE PHASE INDUCTION MOTOR
4.1 INTRODUCTION
Three-phase induction motors are the motors most frequently
encountered in industry. They are simple, rugged, low-priced, and easy to
maintain. They run at essentially constant speed from zero to full-load. The
speed is frequently-dependent and, consequently, these motors are not easily
adapted to speed control. However, variable frequency electronic drives are
being used more and more to control the speed of commercial induction
motors.
4.2 PRINCIPAL COMPONENTS
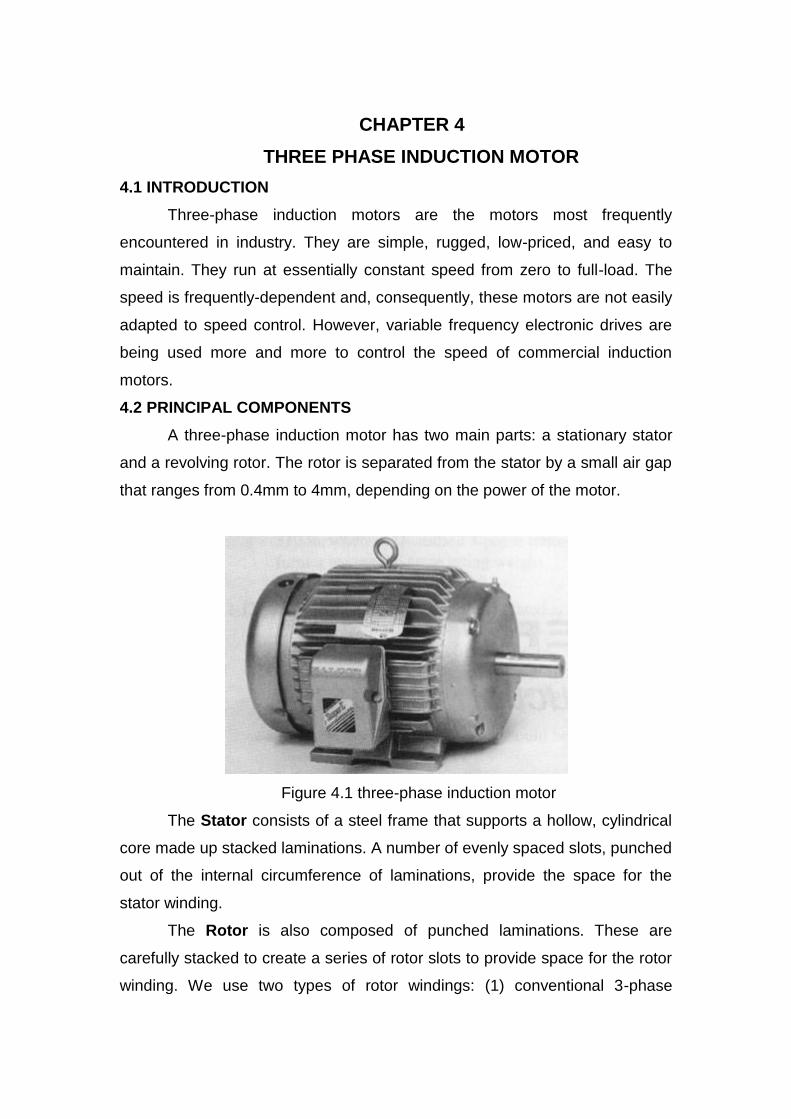
A three-phase induction motor has two main parts: a stationary stator
and a revolving rotor. The rotor is separated from the stator by a small air gap
that ranges from 0.4mm to 4mm, depending on the power of the motor.
Figure 4.1 three-phase induction motor
The Stator consists of a steel frame that supports a hollow, cylindrical
core made up stacked laminations. A number of evenly spaced slots, punched
out of the internal circumference of laminations, provide the space for the
stator winding.
The Rotor is also composed of punched laminations. These are
carefully stacked to create a series of rotor slots to provide space for the rotor
winding. We use two types of rotor windings: (1) conventional 3-phase
windings made of insulated wire and (2) squirrel-cage windings. The type of
windings gives rise to two maintains classes of motors: squirrel cage induction
motors (also called cage motors) and wound-rotor induction motors.
A Squirrel-cage rotor is composed of bare copper bars, slightly longer
then the rotor, which are pushed into the slots. The opposite ends are welded
to two copper end rings, so that all the bars are short-circuited together. The
entire construction resembles a squirrel cage, from which the name is derived.
In small and medium-sized motors, the bars and end-rings are made of
diecast aluminium, molded to form an integral block.
A Wound rotor has 3-phase windings, similar to the one of the stator.
The winding is uniformly distributed in the slots and is usually connected in 3
wire wye. The terminals are connected to three slip rings, which turn with the
rotor. The revolving slip-rings and associated stationary brushes enable us to
connect external resistors in serious with the rotor winding. The external
resistors are mainly used during the start up period; under normal running
conditions, the three brushes are short-circuited.
4.3 PRINCIPLE OF OPERATION
The operation of a 3-phase induction motor is based upon the
application of Faraday’s law and Lorentz force on a conductor. The behaviour
can readily be understood by means of the following example.
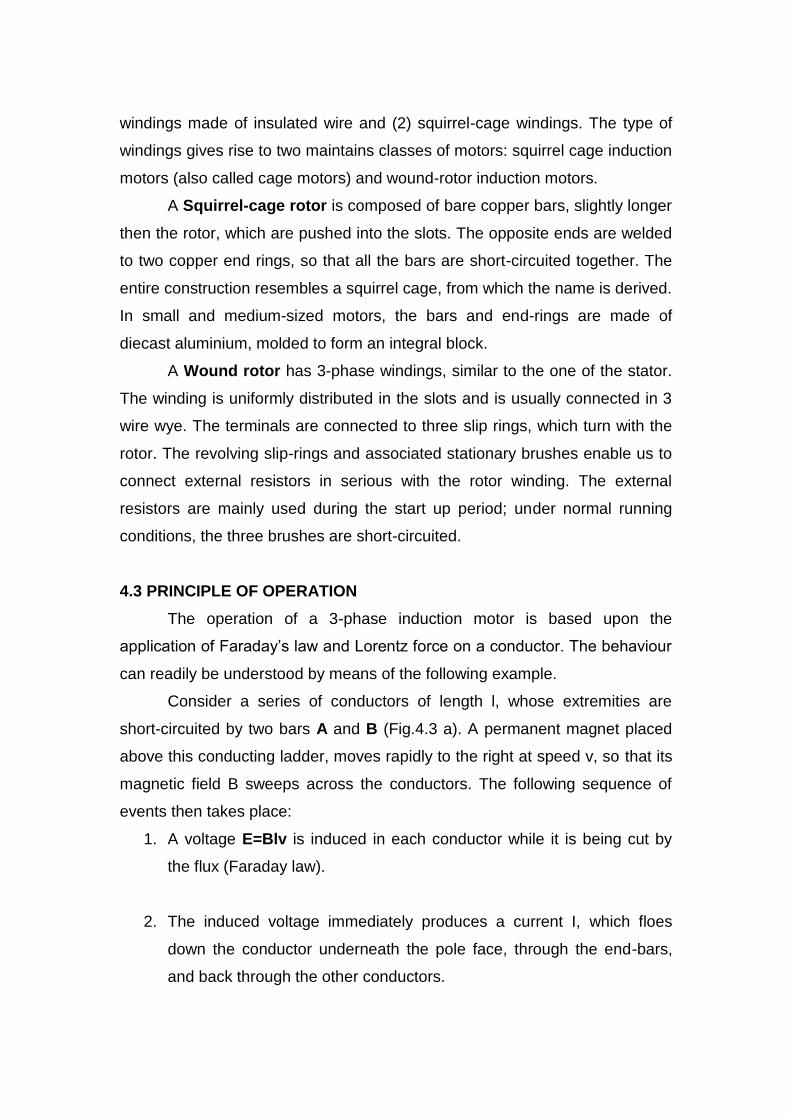
Consider a series of conductors of length l, whose extremities are
short-circuited by two bars A and B (Fig.4.3 a). A permanent magnet placed
above this conducting ladder, moves rapidly to the right at speed v, so that its
magnetic field B sweeps across the conductors. The following sequence of
events then takes place:
1. A voltage E=Blv is induced in each conductor while it is being cut by
the flux (Faraday law).
2. The induced voltage immediately produces a current I, which floes
down the conductor underneath the pole face, through the end-bars,
and back through the other conductors.
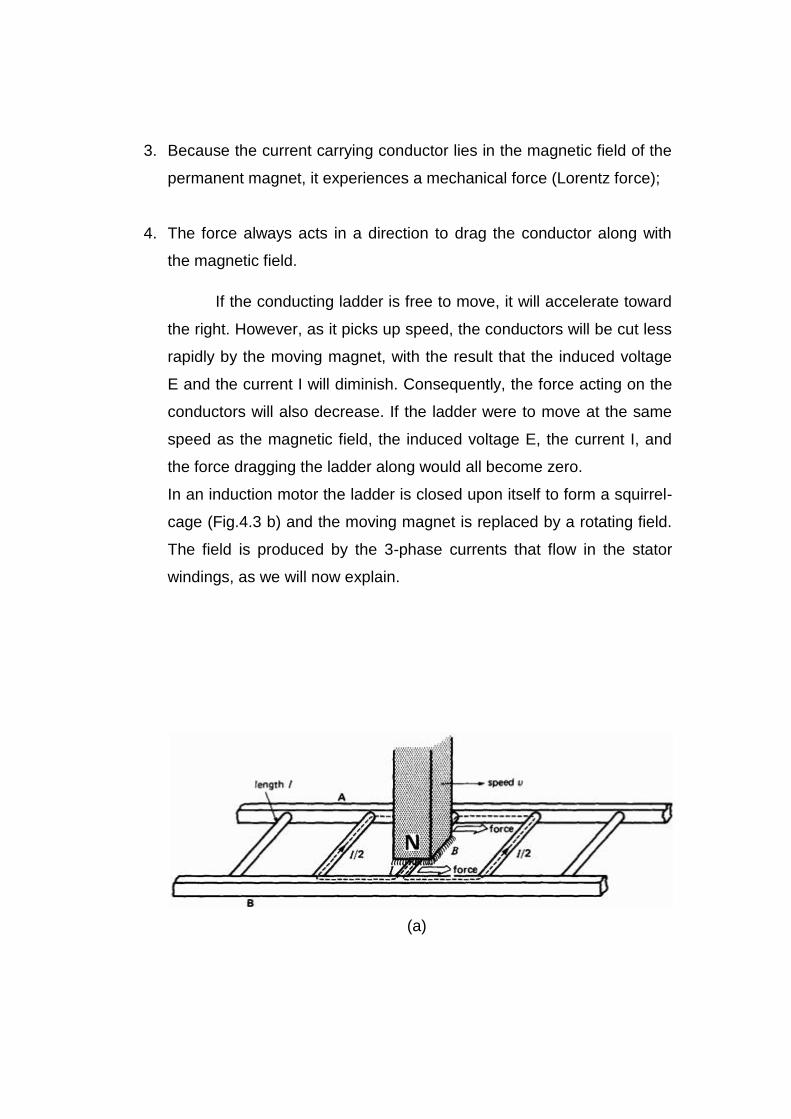
3. Because the current carrying conductor lies in the magnetic field of the
permanent magnet, it experiences a mechanical force (Lorentz force);
4. The force always acts in a direction to drag the conductor along with
the magnetic field.
If the conducting ladder is free to move, it will accelerate toward
the right. However, as it picks up speed, the conductors will be cut less
rapidly by the moving magnet, with the result that the induced voltage
E and the current I will diminish. Consequently, the force acting on the
conductors will also decrease. If the ladder were to move at the same
speed as the magnetic field, the induced voltage E, the current I, and
the force dragging the ladder along would all become zero.
In an induction motor the ladder is closed upon itself to form a squirrel-
cage (Fig.4.3 b) and the moving magnet is replaced by a rotating field.
The field is produced by the 3-phase currents that flow in the stator
windings, as we will now explain.
(a)

(b)
Figure.4.3 moving magnet cutting across a conducting ladder
4.4 THE ROTATING FIELD AND INDUCED VOLTAGES
Consider a simple stator having 6 salient poles, each of which
carries a coil having 5 turns (Fig.4.4.). coils that are diametrically
opposite are connected in series by means of three jumpers that
respectively connect terminals a-a, b-b, and c-c. This creates three
identical set of windings AN, BN, CN, which are mechanically spaced
at 120 degrees to each other. The two coils in each winding produce
magneto motive forces that act in the same direction.
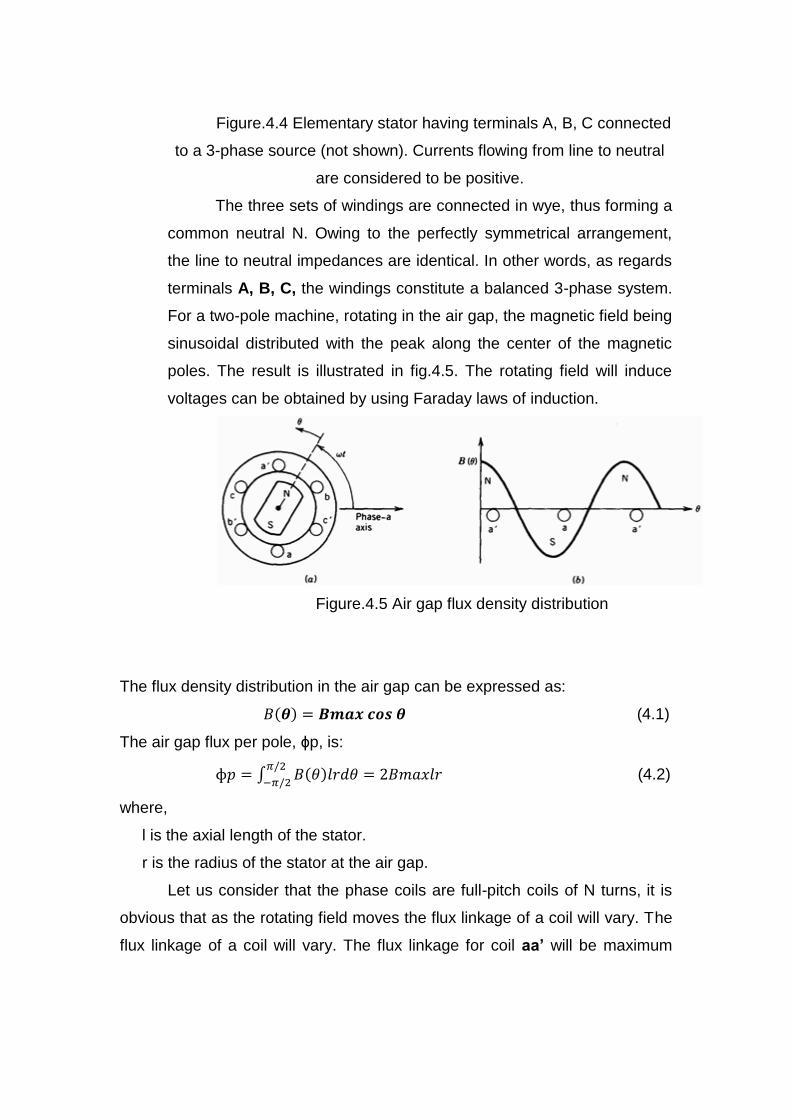
Figure.4.4 Elementary stator having terminals A, B, C connected
to a 3-phase source (not shown). Currents flowing from line to neutral
are considered to be positive.
The three sets of windings are connected in wye, thus forming a
common neutral N. Owing to the perfectly symmetrical arrangement,
the line to neutral impedances are identical. In other words, as regards
terminals A, B, C, the windings constitute a balanced 3-phase system.
For a two-pole machine, rotating in the air gap, the magnetic field being
sinusoidal distributed with the peak along the center of the magnetic
poles. The result is illustrated in fig.4.5. The rotating field will induce
voltages can be obtained by using Faraday laws of induction.
Figure.4.5 Air gap flux density distribution
The flux density distribution in the air gap can be expressed as:
(4.1)
The air gap flux per pole, ɸp, is:
(4.2)
where,
l is the axial length of the stator.
r is the radius of the stator at the air gap.
Let us consider that the phase coils are full-pitch coils of N turns, it is
obvious that as the rotating field moves the flux linkage of a coil will vary. The
flux linkage of a coil will vary. The flux linkage for coil aa’ will be maximum
and zero at the flux linkage λo will vary as the cosine of the angle
hence;
(4.3)
Therefore, the voltage induced in phase coli aa’ is obtained from faraday law
as:
(4.4)
The voltage induced in the other phase coils are also sinusoidal, but phase-
shifted from each other by 120 electrical degrees. Thus,
(4.5)
(4.6)
From equation (4.4), the rms value of the induced voltage is:
(4.7)
Where, f is the frequency in hertz. Equation (4.7) has the same form as
that for the induced voltage in transformers. However, ɸp in equation (4.7)
represents the flux per pole of the machine. Equation (4.7) shows the rms
voltage per phase. The N is the total number of series turns per phase with
the forming a concentrated full-pitch winding.
In an actual AC machine each phase winding is distributed in a number
of slots for better use if the iron and copper and to improve the waveform. For
such a distributed windings, the EMF induced in various coils placed in
different slots are not in time phase, and therefore the phasor sum of EMF is
less than their numerical sum when they are connected in series for the phase
winding. A reduction factor Kw, called the winding factor, must therefore be
applied. For most three-phase machine windings Kw is about 0.85 to 0.95.
therefore, for a distributed phase winding, the rms voltage per phase is
(4.8)
Where, Nph is the number of turns in series per phase.
4.5 RUNNING OPERATION
If the stator windings are connected to a three-phase supply and the
rotor circuit is closed, the induced voltages in the rotor windings produce rotor
currents that interact with the air gap field to produce torque. The rotor, if free
to do so, will then start rotating.
According the lens law, the rotor rotates in the direction of the rotating
field such that relative speed between the rotating field and the rotor windings
decreases. The rotor will eventually reach a steady-state speed n that is less
than the synchronous speed ns, at which the stator rotating field rotates in the
air gap. It is obvious that at n=ns, there will be no induced voltage and current
in the rotor circuit and hence no torque.
In a P-pole machine, one cycle of variation of the current will make the
mmf wave rotate by 2/P revolutions. The revolutions per minute n (rpm) of the
travelling wave in a P-pole machine for a frequency f cycles per second for
the currents are:
(4.9)
The difference between the rotor speed n and the synchronous speed ns, of
the rotating field is called the slip s and is defined as
(4.10)
4.6 SPECIFICATIONS OF INDUCTION MOTOR
In my thesis work, induction motor should be taken from load source
and torque-speed characteristics have been analysed from shoot through and
non-shoot through stages on Quasi-Z-source Inverter, then motor can be
performed. Following specifications should be specified from 1HP induction
motor.
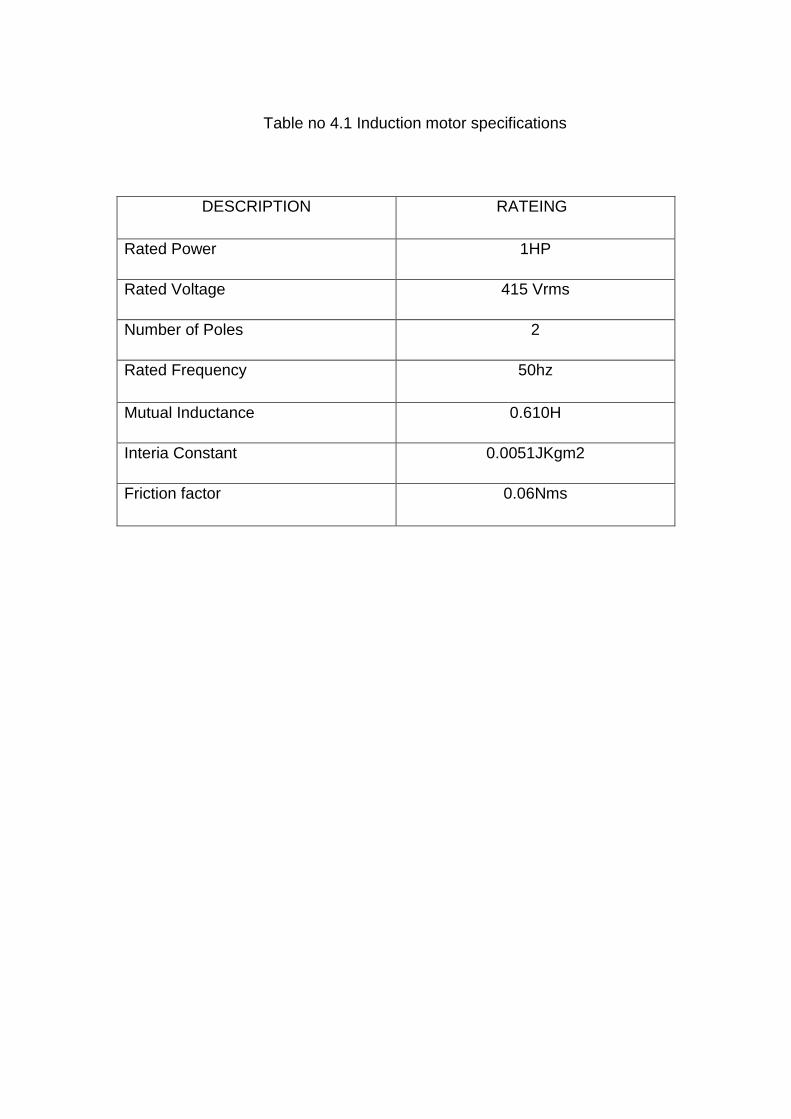
Table no 4.1 Induction motor specifications
DESCRIPTION RATEING
Rated Power 1HP
Rated Voltage 415 Vrms
Number of Poles 2
Rated Frequency 50hz
Mutual Inductance 0.610H
Interia Constant 0.0051JKgm2
Friction factor 0.06Nms
CHAPTER 5
SIMULATION RESULTS
5.1 INTRODUCTION
Traditionally, Quasi Z-source inverter by coupling the inverter circuit to
an Induction Motor. To performing, with and without stages controlled the
MPPT controller and speed-torque characteristics should be performed
through this two stages from PV module.
5.2 SIMULATION PARAMETERS
.Table 5.1 shows the parameters of Quasi- Z-source inverter and
corresponding values used in the simulation.
Table 5.1 Quasi-Z-source inverter Parameters and their values
PARAMETERS
VALUES
Magnetizing inductance
400mH
Capacitor
400 µF
Input Voltage
385 V
Output Frequency
50 Hz
Turn Ratio( )
2:1
Switching Frequency
5000 Hz
Output Load
1HP Induction Motor
.Table 5.2 shows the parameters of PV Module and corresponding
values used in the simulation.

Table 5.2 PV Panel parameter and their values
PARAMETERS
VALUES
Number of cells
75
Open circuit voltage ( )
45.2V
Short circuit Current ( )
8.4
Voltage at maximum power point ( )
35.0
Current at maximum power point ( )
7.7
Standard solar intensity
1000
Standard temperature
25
5.3 SIMULATION RESULTS
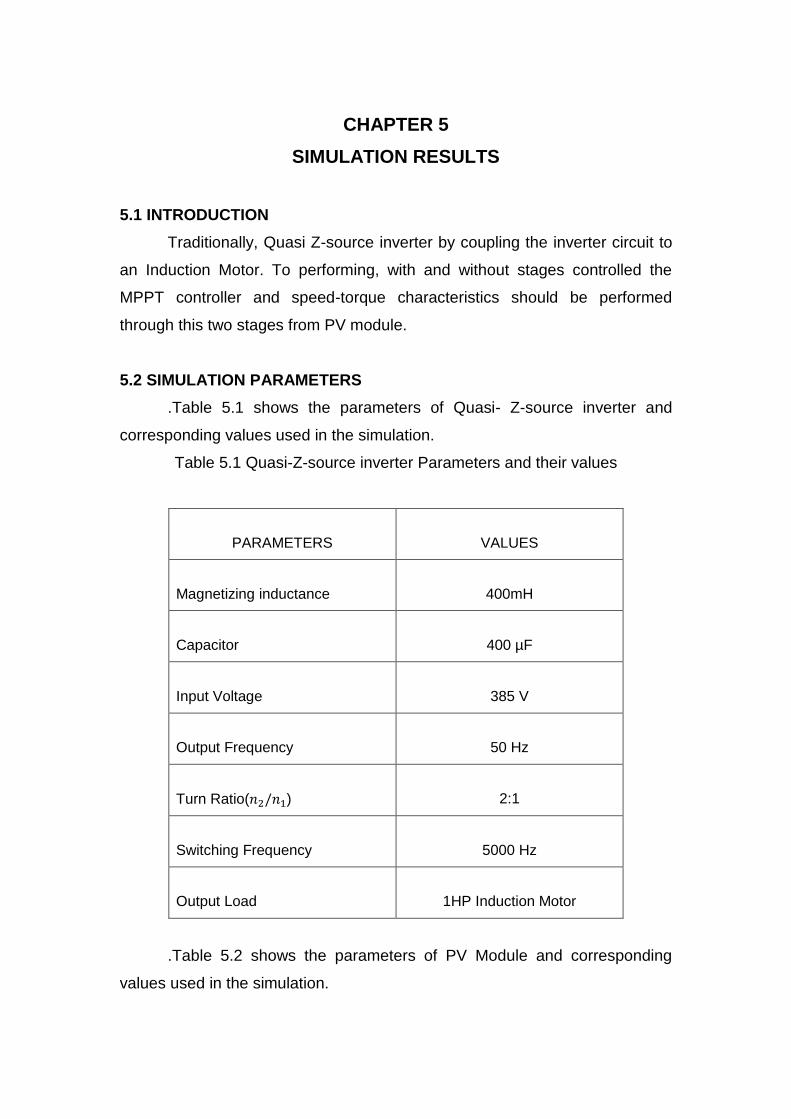
5.3.1 SIMULATION DESIGN AND OUTPUT’S FROM WITHOUT MPPT
CONTROL
Figure 5.1, shows the given PV diagram with simulation results should
be presented through the without MPPT control techniques from QZI fed
induction motor. Following simulation diagram should be analyzed with
without MPPT stage, PV systems voltage output waveform and quasi-z-
source inverter voltage output waveform, inverter voltage and current output
waveforms and speed-torque characteristics of induction motor and stator
performance of induction motor can be presented.
Figure.5.1 PV module with Induction Motor performance from without
MPPT

Figure.5.1.1 PV module voltage source simulation design
Figure.5.1.2 PV module voltage source output waveform

Figure.5.1.3 PV module with Quasi-Z-source simulation design
Figure.5.1.4 PV module with Quasi-Z-source voltage output
waveform
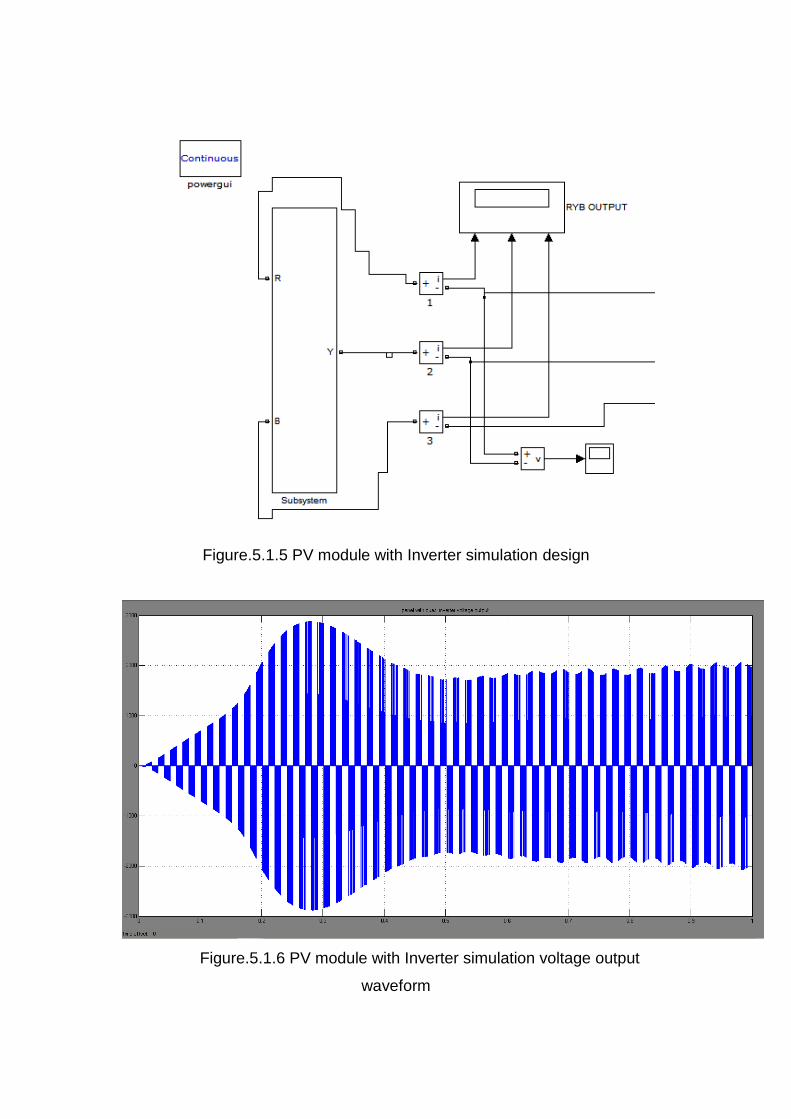
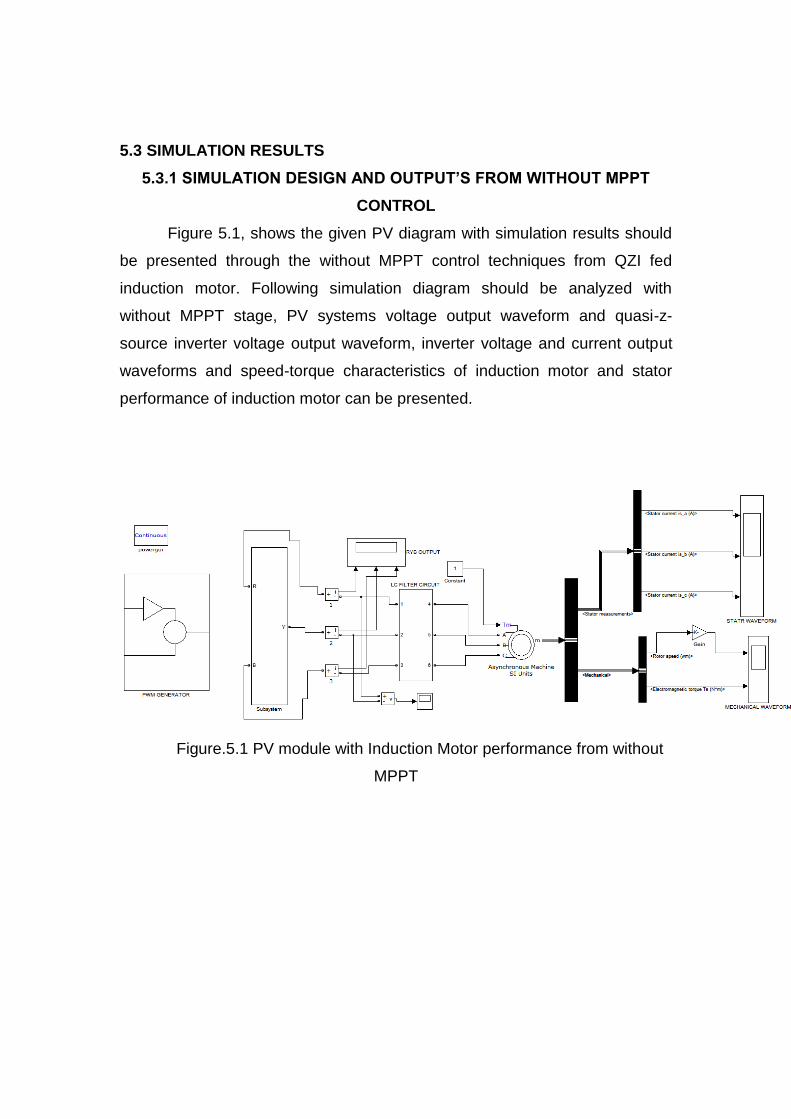
Figure.5.1.5 PV module with Inverter simulation design
Figure.5.1.6 PV module with Inverter simulation voltage output
waveform
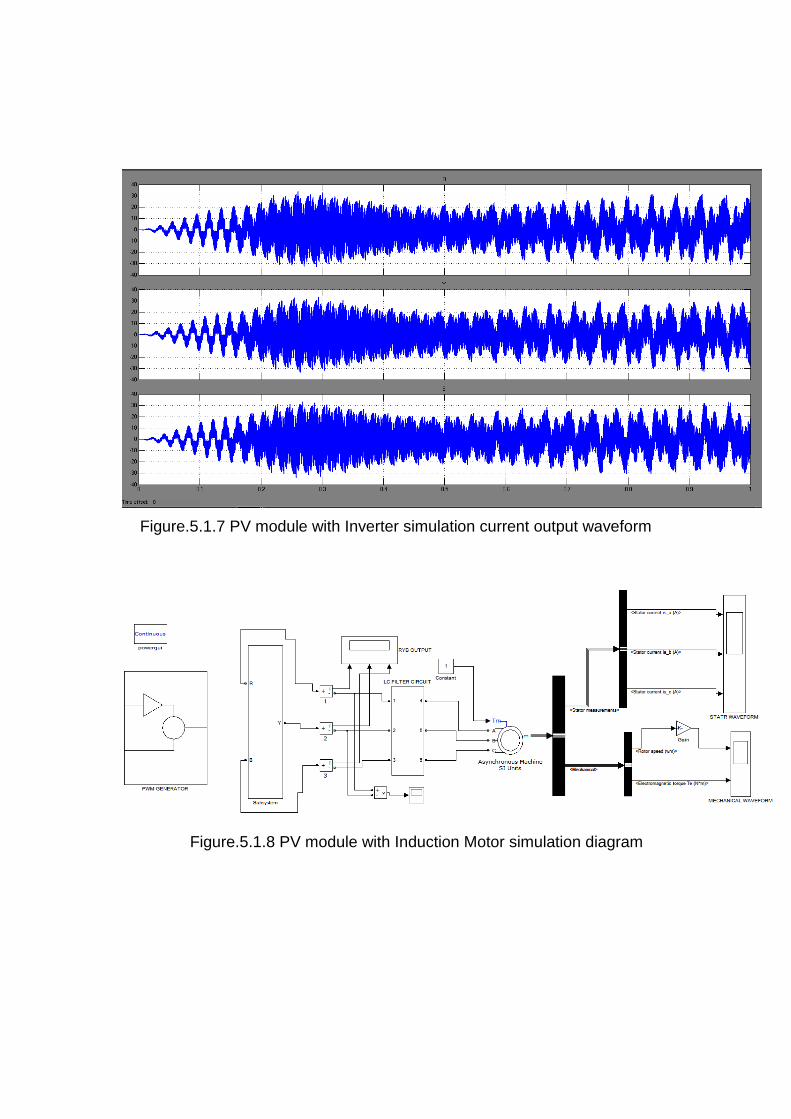
Figure.5.1.7 PV module with Inverter simulation current output waveform
Figure.5.1.8 PV module with Induction Motor simulation diagram
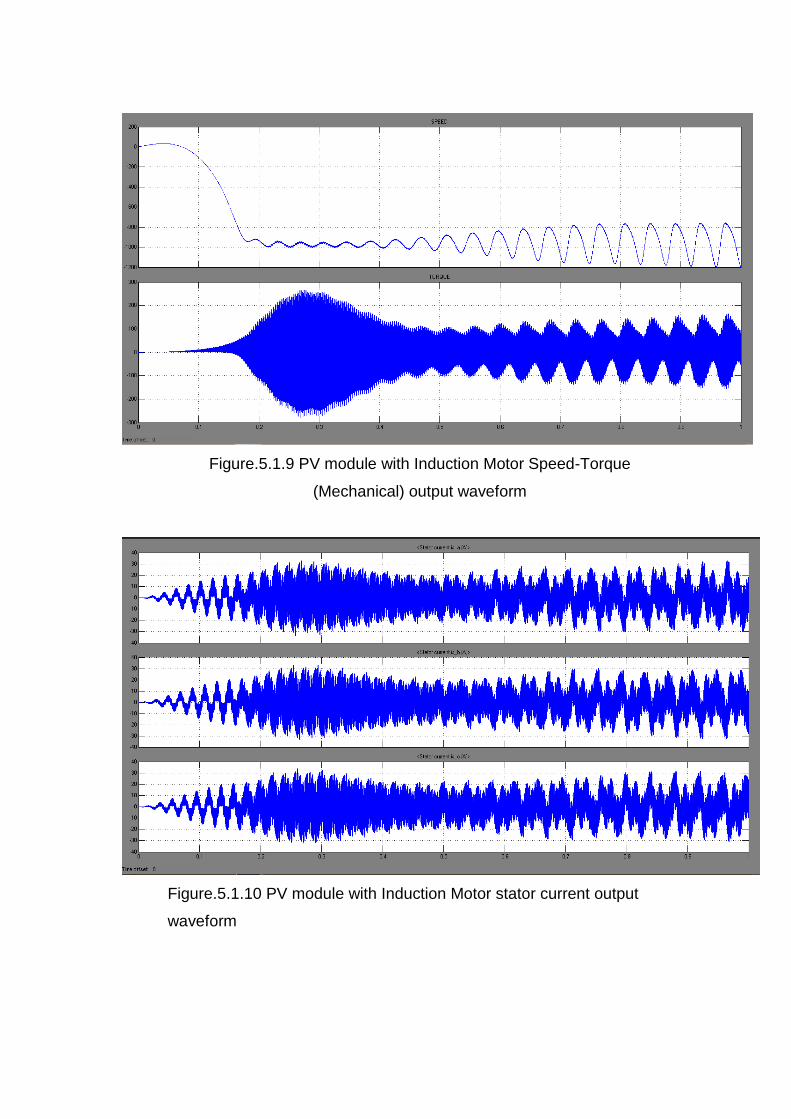
Figure.5.1.9 PV module with Induction Motor Speed-Torque
(Mechanical) output waveform
Figure.5.1.10 PV module with Induction Motor stator current output
waveform

5.3.2 SIMULATION DESIGN AND OUTPUT’S FROM WITH MPPT
CONTROL
Figure 5.2, shows the given PV diagram with simulation results should
be presented through with MPPT control techniques from QZI fed induction
motor. Following simulation diagram should be analyzed with MPPT stage,
PV systems voltage output waveform and quasi-z-source inverter voltage
output waveform, inverter voltage and current output waveforms and speed-
torque characteristics of induction motor and stator performance of induction
motor can be presented.
Figure.5.2 PV module with Induction Motor Performance from with
MPPT control
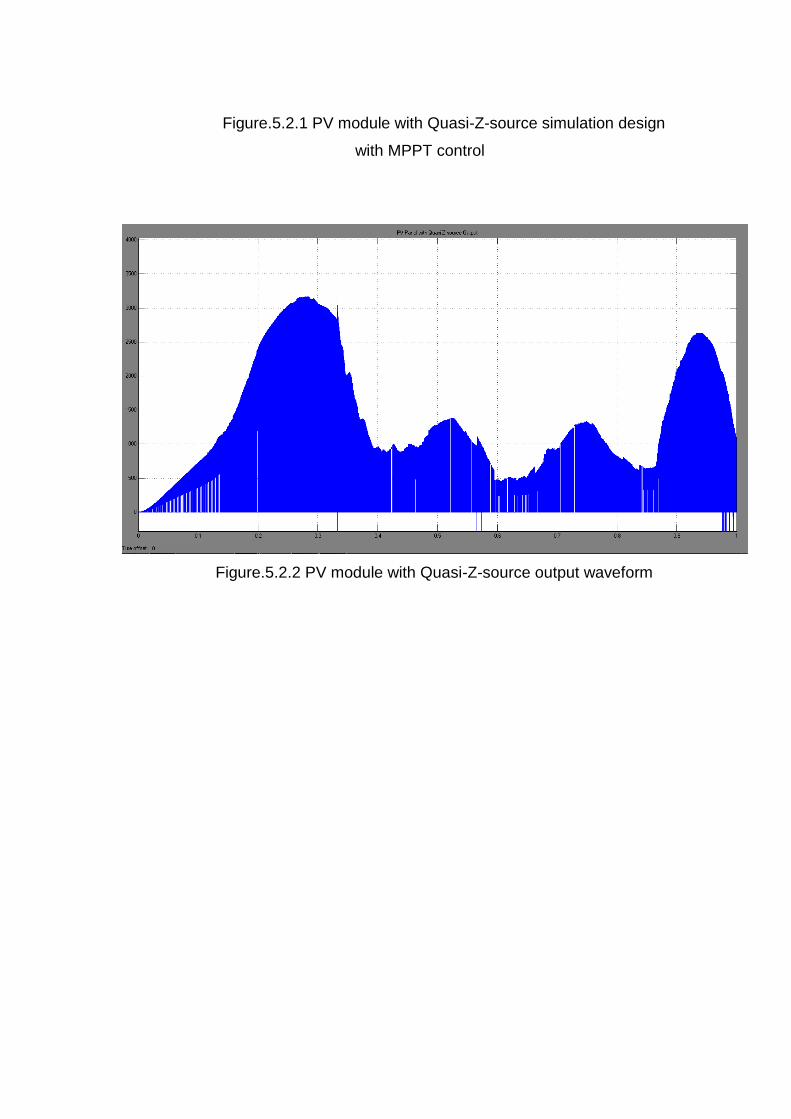
Figure.5.2.1 PV module with Quasi-Z-source simulation design
with MPPT control
Figure.5.2.2 PV module with Quasi-Z-source output waveform
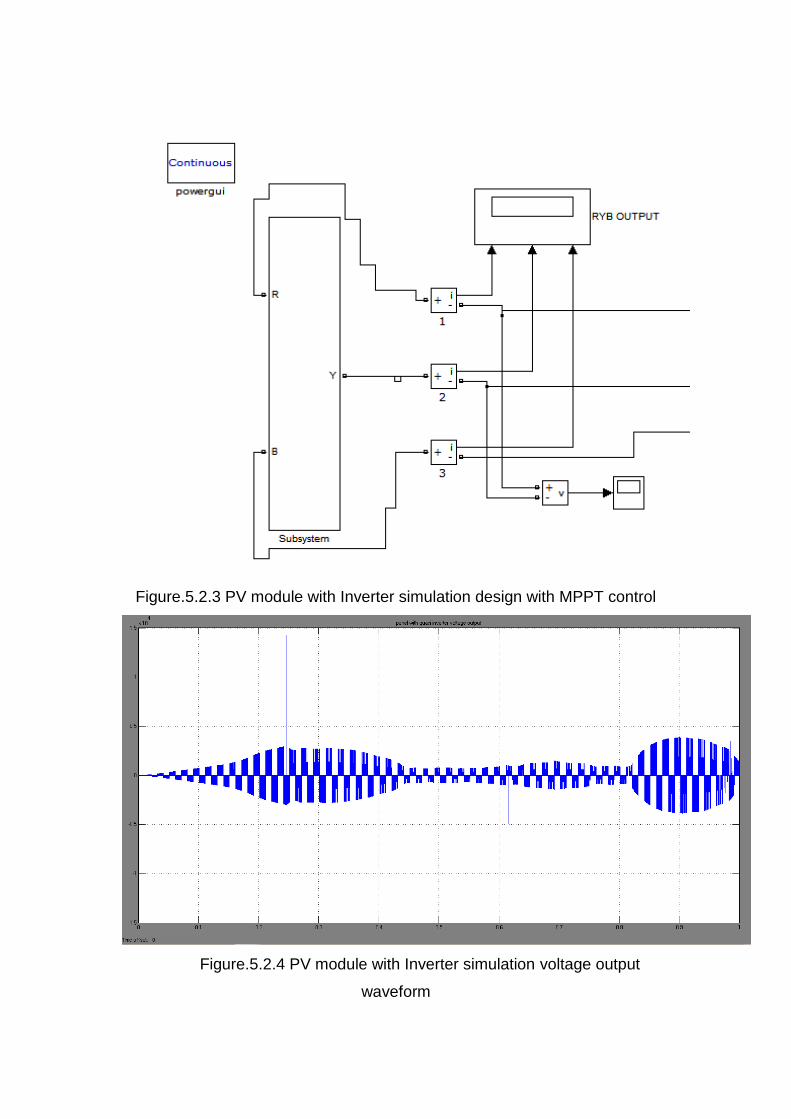
Figure.5.2.3 PV module with Inverter simulation design with MPPT control
Figure.5.2.4 PV module with Inverter simulation voltage output
waveform

Figure.5.2.5 PV module with Inverter simulation current output Waveform
Figure.5.2.6 PV module with Induction Motor simulation diagram
with MPPT control
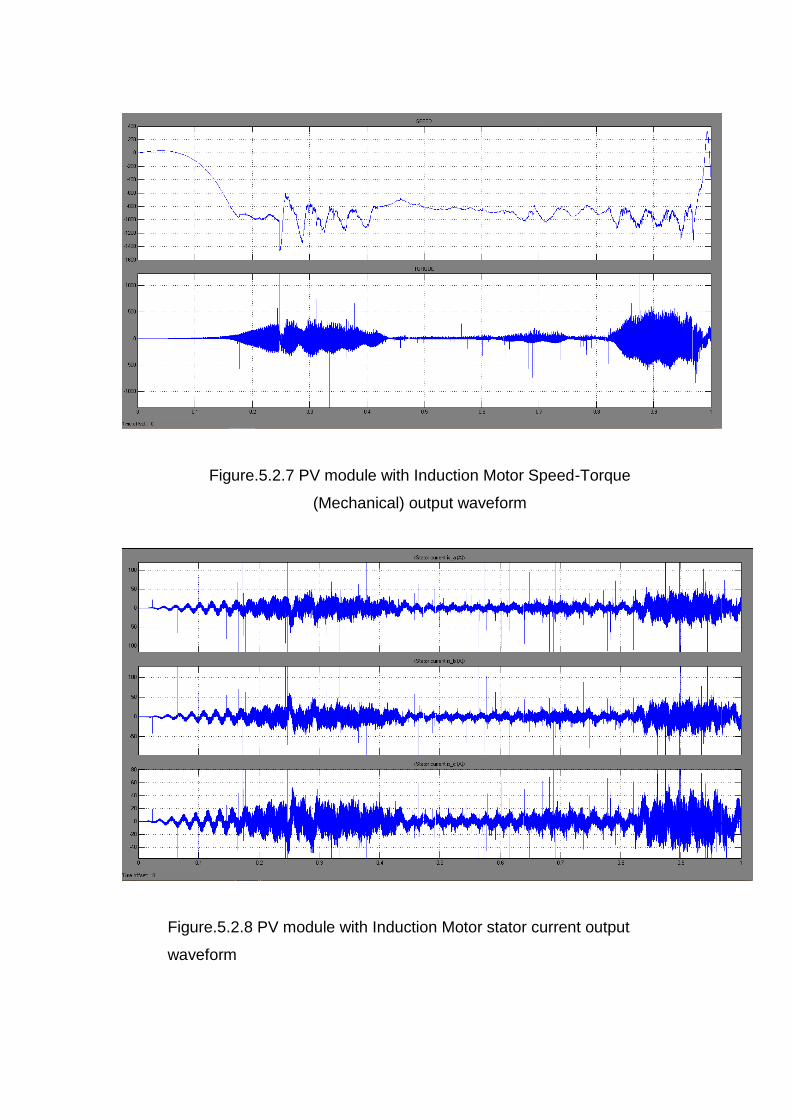
Figure.5.2.7 PV module with Induction Motor Speed-Torque
(Mechanical) output waveform
Figure.5.2.8 PV module with Induction Motor stator current output
waveform
CHAPTER 6
CONCLUSION
6.1 CONCLUSION
A detailed analysis on Quasi-Z-source inverter has been presented. It
employs a unique impedance network to couple the inverter main circuit to the
PV module; collected rated power will be operated from Induction Motor. The
operating principle and characteristics are analyzed.
This project focused on analysis of speed-torque characteristics of
three-phase induction motor with Quasi-Z-source. The modelling of induction
motor, PV array, and Quasi-Z-source Inverter and MPPT algorithm has been
simulated in MATLAB/Simulink environment.

REFERANCE PAPER
1. “Modeling of 250WP Photovoltaic Module and its Performance analysis
using MATLAB/Simulink”., Savith.P.B., Proceedings of IRF Journal
Conference, 23’rd March 2014.
2. “An energy stored Quasi-Z-source inverter using SVPWM
Techniques”., Dhanya.k.Thomas., International Journal of Electrical
Research., Vol.2,Issue.7,July 2014.
3. ”Modelling oh solar power based Quasi-Z-source inverter to supply
BLDC Motor”., Neethu Johnson., International Journal of Electrical
Research and Innovative., Vol.2, Issue.2, Feb-2014.
4. “Comparative study of P&O and Incremental Conduction MPPT
Algorithms”., I.William Christopher., AJER., Vol.2,Issue.12,2013.
5. “Three stage cascaded Quasi-Z-source inverter system for Renewable
applications”,. Nisha.K.C.R, International Journal of Electrical
Research, Vol.3,Issue.5, July 2013.
6. “A Comparison of Two MPPT Techniques for PV System in
MATLAB/Simulink”., Sangita s. Kondawar., IJERD., Vol.2,Issue.7,Aug
2013.
7. ”Digital simulation of current-fed Quasi-Z-source inverter”, Kishor.G,
International Journal of Electrical Research., Vol.3, Issue.4, AUG 2013.
8. “Power Conditioning System for a grid connected PV Power generation
using a Quasi-Z-source inverter”, Jong-Hysung Park., Journal of Power
Electronics., Vol.10, No.1, Jan 2010.
9. “Analysis of sinusoidal Pulse with modulation control strategies for
Quasi-Z-source inverter, Jani Das., International Journal of Electrical
Research., Vol.2, Issue.9, Sep 2013.
10. “Photo voltaic Power injected to the grid with Quasi-Z-source inverter”,
Gobi.M,. International Journal of Electrical Research, Vol.2, Issue.3,
May 2014.
11. “Closed loop controlled solar cell Power embedded EZ-source inverter
fed induction motor drives”., Nisha.K.C.R., ACJEE., International
Journal of Control System and Instrumentations., Vol.4,Issue.2,June
2013.
12. ”Comparison of MPPT Algorithms for DC-DC Converter based PV
Systems”., A.Pradeep Kumar yadav., International Journal of Electrical
Research., Vol.1,Issue.1,July 2012.
13. “Implementation of P&O MPPT of PV system with direct control method
using BULK and BUCK-BOOST Converters”., Ahmed M.Alallah., .,
International Journal of Electrical Research., Vol.1,Issue.1,Feb 2014.
14. “Multi-cell switched inductor Z source inverter fed induction motor”.,
Hareesh.A.,9’th international conference,.Vol.2,Issue.3,May 2014.
15. “New Perturb and Observe MPPT Algorithm and its validation using
Data from PV module”., Bikram Das., International Journal of Electrical
Research., Vol.2,Issue.7,July 2012.
Related Documents