THE ASTROPHYSICAL JOURNAL, 521 : 889È897, 1999 August 20 1999. The American Astronomical Society. All rights reserved. Printed in U.S.A. ( QUASI-SEPARATRIX LAYERS IN A REDUCED MAGNETOHYDRODYNAMIC MODEL OF A CORONAL LOOP LEONARDO J. MILANO,1 PABLO DMITRUK,2 CRISTINA H. MANDRINI,3 AND DANIEL O. GO MEZ3 Instituto de y del Espacio, CC. 67 Suc. 28, 1428 Buenos Aires, Argentina ; and Departamento de Facultad de Ciencias Exactas y Astronom•a F• sica F•sica, Naturales, Universidad de Buenos Aires, C. Universitaria, 1428 Buenos Aires, Argentina ; leo=iafe.uba.ar AND PASCAL DE MOULIN Observatoire de Paris, section Meudon, DASOP, URA 2080 (CNRS), F-92195 Meudon Principal Cedex, France Received 1998 August 21 ; accepted 1999 April 2 ABSTRACT We run a pseudospectral magnetohydrodynamic code to simulate reconnection between two Ñux tubes inside a solar coronal loop. We apply a stationary velocity Ðeld at one of the footpoints consisting of two vortices in such a way as to induce the development of a current layer and force the Ðeld lines to reconnect. During the process we Ðnd a remarkable coincidence between the location of the current layer and the location of quasi-separatrix layers, which are thin magnetic volumes where the Ðeld line connec- tivity changes abruptly. This result lends support to a scenario in which quasi-separatrix layers are the most likely locations for impulsive energy release in the solar corona. Another important result of this simulation is the observed transient of strong magnetohydrodynamic turbulence characterized by a k~3@2 energy spectrum. This transient reaches its peak activity in coincidence with a maximum in the energy dissipation rate, thus suggesting that the direct energy cascade associated with this turbulent transient plays a key role in enhancing energy dissipation in magnetic reconnection processes. Subject headings : MHD È Sun: corona È Sun: Ñares È Sun: magnetic Ðelds 1. INTRODUCTION Solar coronal loops are driven at their footpoints by the photospheric velocity Ðeld. Although the typical timescale for this driving action is relatively slow (about 1000 s), it can give rise to reconnection phenomena occurring on the much shorter time (10È100 s). These impulsive reconnec- Alfve n tion events involve changes in the magnetic topology and the formation of current sheets where the magnetic energy is efficiently dissipated. The basic picture of externally driven reconnection is that of two Ñux tubes pushed into one another along with the Ñuid in a quasi-ideal Ñow until they come close enough so that the electric current density in between, j \ $ ÂB, grows up dramatically, yielding to nonnegligible local Joule dissipation (gj2). Local loss of ideal conditions allows a rela- tive drift of magnetic Ðeld lines with respect to the Ñuid. As a result, after a short time (of the order of the local Alfven time) the magnetic tubes appear reconnected, that is, liter- ally connected in a new way, which is topologically di†erent from the initial conÐguration (see, e.g., Longcope & Strauss 1994a). In two dimensions the magnetic topology is fully deter- mined by the scalar magnetic potential a (where B \ $ In this approach, magnetic reconnection is associ- Â az ü ). ated with the presence of magnetic null points (X-points or Y -points) or Ðeld lines tangential to a boundary. Reconnec- tion occurs at separatrices, which are lines where the mag- netic Ðeld line mapping is discontinuous. Although the same analysis is possible in 2.5 dimensions, it has been shown that the addition of three-dimensional perturbations 1 Fellow of CONICET, Argentina. 2 Fellow of the University of Buenos Aires. 3 Member of the Carrera del Investigador CONICET, Cient•Ðco, Argentina. (Lau & Finn 1991) typically causes the disappearance of separatrices (Longcope & Strauss 1994b). The existence of this structural instability has lead to the investigation of di†erent approaches to extend the topological ideas intro- duced in two-dimensional models, but no consensus has yet been reached for a proper deÐnition of reconnection (see, e.g., Jardine 1991 ; Priest 1997). A promising way of quantifying topological changes has been proposed in terms of quasi-separatrix layers (QSLs) (Priest & 1995 ; et al. 1996a). QSLs are De moulin De moulin extremely thin layers where the gradient of the mapping of Ðeld lines from one portion to another of a boundary enclosing a magnetic volume is much larger than its stan- dard value (by several orders of magnitude). Reconnection without null points can then occur at QSLs, where there is a breakdown of ideal magnetohydrodynamics (MHD) and a change of connectivity of magnetic Ðeld lines. Priest & (1995) have proposed that this change of connec- De moulin tivity occurs where the Ðeld line velocities are much larger than the maximum plasma velocity (typically less than or of the order of the speed), so that the Ðeld lines are Alfve n forced to slip through the plasma. Analysis of solar Ñare observations in numerous cases has shown that the release of energy is linked to the presence of separatrices or QSLs (see Mandrini et al. 1997 and refer- ences therein). In these cases the photospheric magnetic Ðeld is extrapolated to the corona by means of either sub- photospheric sources or following a classical fast Fourier transform method (Alissandrakis 1981). On the other hand, QSLs have been found to be related to expected energy release sites in theoretical models of twisted Ñux tubes et al. 1996b) and in application of these to (De moulin observed Ðlaments (Aulanier et al. 1998). In this paper we compute for the Ðrst time QSLs for an MHD model of a coronal loop and study the relation between the location of QSLs and the region of high-energy dissipation inside this 889

Welcome message from author
This document is posted to help you gain knowledge. Please leave a comment to let me know what you think about it! Share it to your friends and learn new things together.
Transcript

THE ASTROPHYSICAL JOURNAL, 521 :889È897, 1999 August 201999. The American Astronomical Society. All rights reserved. Printed in U.S.A.(
QUASI-SEPARATRIX LAYERS IN A REDUCED MAGNETOHYDRODYNAMIC MODELOF A CORONAL LOOP
LEONARDO J. MILANO,1 PABLO DMITRUK,2 CRISTINA H. MANDRINI,3 AND DANIEL O. GO� MEZ3Instituto de y del Espacio, CC. 67 Suc. 28, 1428 Buenos Aires, Argentina ; and Departamento de Facultad de Ciencias Exactas yAstronom•� a F•� sica F•� sica,
Naturales, Universidad de Buenos Aires, C. Universitaria, 1428 Buenos Aires, Argentina ; leo=iafe.uba.ar
AND
PASCAL DE� MOULIN
Observatoire de Paris, section Meudon, DASOP, URA 2080 (CNRS), F-92195 Meudon Principal Cedex, FranceReceived 1998 August 21 ; accepted 1999 April 2
ABSTRACTWe run a pseudospectral magnetohydrodynamic code to simulate reconnection between two Ñux tubes
inside a solar coronal loop. We apply a stationary velocity Ðeld at one of the footpoints consisting oftwo vortices in such a way as to induce the development of a current layer and force the Ðeld lines toreconnect. During the process we Ðnd a remarkable coincidence between the location of the current layerand the location of quasi-separatrix layers, which are thin magnetic volumes where the Ðeld line connec-tivity changes abruptly. This result lends support to a scenario in which quasi-separatrix layers are themost likely locations for impulsive energy release in the solar corona. Another important result of thissimulation is the observed transient of strong magnetohydrodynamic turbulence characterized by a k~3@2energy spectrum. This transient reaches its peak activity in coincidence with a maximum in the energydissipation rate, thus suggesting that the direct energy cascade associated with this turbulent transientplays a key role in enhancing energy dissipation in magnetic reconnection processes.Subject headings : MHD È Sun: corona È Sun: Ñares È Sun: magnetic Ðelds
1. INTRODUCTION
Solar coronal loops are driven at their footpoints by thephotospheric velocity Ðeld. Although the typical timescalefor this driving action is relatively slow (about 1000 s), it cangive rise to reconnection phenomena occurring on the muchshorter time (10È100 s). These impulsive reconnec-Alfve� ntion events involve changes in the magnetic topology andthe formation of current sheets where the magnetic energy isefficiently dissipated.
The basic picture of externally driven reconnection is thatof two Ñux tubes pushed into one another along with theÑuid in a quasi-ideal Ñow until they come close enough sothat the electric current density in between, j \ $ Â B,grows up dramatically, yielding to nonnegligible local Jouledissipation (gj2). Local loss of ideal conditions allows a rela-tive drift of magnetic Ðeld lines with respect to the Ñuid. Asa result, after a short time (of the order of the local Alfve� ntime) the magnetic tubes appear reconnected, that is, liter-ally connected in a new way, which is topologically di†erentfrom the initial conÐguration (see, e.g., Longcope & Strauss1994a).
In two dimensions the magnetic topology is fully deter-mined by the scalar magnetic potential a (where B \ $
In this approach, magnetic reconnection is associ-Â azü ).ated with the presence of magnetic null points (X-points orY -points) or Ðeld lines tangential to a boundary. Reconnec-tion occurs at separatrices, which are lines where the mag-netic Ðeld line mapping is discontinuous. Although thesame analysis is possible in 2.5 dimensions, it has beenshown that the addition of three-dimensional perturbations
1 Fellow of CONICET, Argentina.2 Fellow of the University of Buenos Aires.3 Member of the Carrera del Investigador CONICET,Cient•� Ðco,
Argentina.
(Lau & Finn 1991) typically causes the disappearance ofseparatrices (Longcope & Strauss 1994b). The existence ofthis structural instability has lead to the investigation ofdi†erent approaches to extend the topological ideas intro-duced in two-dimensional models, but no consensus has yetbeen reached for a proper deÐnition of reconnection (see,e.g., Jardine 1991 ; Priest 1997).
A promising way of quantifying topological changes hasbeen proposed in terms of quasi-separatrix layers (QSLs)(Priest & 1995 ; et al. 1996a). QSLs areDe� moulin De� moulinextremely thin layers where the gradient of the mapping ofÐeld lines from one portion to another of a boundaryenclosing a magnetic volume is much larger than its stan-dard value (by several orders of magnitude). Reconnectionwithout null points can then occur at QSLs, where there is abreakdown of ideal magnetohydrodynamics (MHD) and achange of connectivity of magnetic Ðeld lines. Priest &
(1995) have proposed that this change of connec-De� moulintivity occurs where the Ðeld line velocities are much largerthan the maximum plasma velocity (typically less than or ofthe order of the speed), so that the Ðeld lines areAlfve� nforced to slip through the plasma.
Analysis of solar Ñare observations in numerous cases hasshown that the release of energy is linked to the presence ofseparatrices or QSLs (see Mandrini et al. 1997 and refer-ences therein). In these cases the photospheric magneticÐeld is extrapolated to the corona by means of either sub-photospheric sources or following a classical fast Fouriertransform method (Alissandrakis 1981). On the other hand,QSLs have been found to be related to expected energyrelease sites in theoretical models of twisted Ñux tubes
et al. 1996b) and in application of these to(De� moulinobserved Ðlaments (Aulanier et al. 1998). In this paper wecompute for the Ðrst time QSLs for an MHD model of acoronal loop and study the relation between the location ofQSLs and the region of high-energy dissipation inside this
889

890 MILANO ET AL. Vol. 521
loop. In °° 2 and 3 we describe the numerical simulationsthat we perform, with a brief presentation of the basic equa-tions and of the applied photospheric forcing. A descriptionof the results obtained from those simulations within theframe of reconnection theory is presented in ° 4. A deÐnitionof QSLs and a comparison with the results derived from oursimulations is presented in ° 5. In ° 6 we discuss our resultsand list the conclusions of this paper.
2. EQUATIONS FOR REDUCED MAGNETOHYDRODYNAMICS
The dynamics of a coronal loop with an initially uniformmagnetic Ðeld length L , and transverse sectionB \ B0 zü ,(2nl)] (2nl) can be modeled by the reduced magnetohydro-dynamic (RMHD) equations (see Strauss 1976 for a detailedderivation of these equations),
Lta \ vA L
zt] [t, a]] g+
M2 a , (1)
Ltw\ vA L
zj] [t, w][ [a, j]] l+
M2 w . (2)
In these equations, is the speed, l isvA \ B0/(4no)1@2 Alfve� nthe kinematic viscosity, g is the plasma resistivity, t(x, y, z,t) is the stream function, and a(x, y, z, t) is the vectorpotential. The quantities and are,w\ [+
M2 t j\[+
M2 a
respectively, the z-component of vorticity and electriccurrent density, where The nonlinear terms+
M2 \ L
xx] L
yy.
are Poisson brackets of the form [u, v]\ LxuL
yv[ L
yuL
xv.
Transverse velocity and magnetic Ðeld components aregiven by and¿\$ Â (tzü ) b \ $ Â (azü ).
3. NUMERICAL SIMULATIONS
To transform equations (1) and (2) into their dimension-less form, we choose l and L as the units for transverseand longitudinal distances, as the time unit, andtA 4 L /vAas the unit for the velocity and magnetic Ðelds.u04 l/tAThe dimensionless RMHD equations are
Lta \ L
zt] [t, a]] 1
S+
M2 a , (3)
Ltw\ L
zj] [t, w][ [a, j]] 1
R+
M2 w , (4)
where and For our simulations, R andS \ u0 l/g R\ u0 l/l.S are, respectively, good estimates of the kinetic (Su2T1@2l/l)and magnetic (Su2T1@2l/g) Reynolds numbers. Hereafter, wethus call R and S, respectively, the kinetic and magneticReynolds numbers. The spatial coordinates span the ranges0 ¹ x, y ¹ 2n and 0 ¹ z¹ 1.
We performed numerical simulations of equations (3) and(4) assuming periodic boundary conditions for both t and ain the x- and y-directions and given stream functions in thez\ 0 and z\ 1 planes, which represent the forcing of thephotospheric velocity Ðeld over the loop footpoints. Themagnetic vector potential and the stream function areexpanded in Fourier modes in each plane (x, y). The equa-tions for the coefficients and are time evolvedt
k(z, t) a
k(z, t)
using a second-order predictor-corrector scheme, and thenonlinear terms are evaluated following a dealiased (see23Canuto et al. 1988) pseudospectral technique (see alsoDmitruk, & DeLuca 1998)Go� mez,
To compute z-derivatives we use a Chebyshev collo-cation method, instead of the standard method of Ðnitedi†erences in a staggered regular grid (see, for instance,Strauss 1976). Gauss-Lobatto collocation points are used,
which are mostly concentrated near the boundaries. Themain advantage of this collocation technique is that wereach 99% accuracy with approximately half of the gridpoints required with a regularly spaced mesh. To test theaccuracy of our simulations, we check the balance of energyE and cross helicity H per unit loop length :
LtE\ vA L
zH [
P(gj2] lw2)d2x , (5)
LtH \ vA L
zE[ (g ] l)
Pw Æ j d2x , (6)
where
E(z, t) \ 12P
(u2] b2)d2x , (7)
H(z, t) \P
u Æ b d2x . (8)
Equations (5) and (6) are readily obtained from equations(1) and (2) for the case of periodic boundary conditions,both for an inÐnite or a truncated Fourier expansion. Notethat E(z, t) in equation (7) corresponds to the free energy perunit length of the loop. The total energy is obtained byadding to the right-hand side of equation (7) the contribu-tion of the main Ðeld, Since this last contributionvA2/2(2nl)2.is a constant in RMHD (which is not available fordissipation), we will disregard it and call E(z, t) the energy ofthe loop.
A set of numerical runs with the same boundary andinitial conditions but di†erent Reynolds numbers was per-formed. As a boundary condition at the z\ 1 and z\ 0planes (photospheric footpoints) we choose a stream func-tion of the form
t(x, y, 1, t) \ '0Gexp
C[ (x [ x1)2] (y [ y1)2
d2D
] expC
[ (x [ x2)2 ] (y [ y2)2d2
DH4 '(x, y) ,
t(x, y, 0, t) \ 0 , (9)
where and d \ 2n/7. The stream func-x1,2\ ^n/4 \ y1,2tion ' represents two parallel vortices of equal intensitycentered at and as shown in Figure 1. The(x1, y1) (x2, y2),initial condition is
t(x, y, z, 0) \ z'(x, y) , a(x, y, z, 0) \ 0 , (10)
that is, no transverse magnetic Ðeld and a linear inter-polation of the velocity Ðeld between its values at z\ 0 andz\ 1.
The strength of the forcing is given by the photosphericvelocity which corresponds to the rms value of theuph,velocity Ðeld applied at the moving boundary (z\ 1). Thenormalization factor in equation (9) is thus proportional'0to where is the photospheric turnovertA/tph, tph 4 l/uphtime. Another dimensionless parameter, which is relevant toa topological analysis of magnetic Ðeld lines (see ° 5) is theaspect ratio 2nl/L . Note that our footpoint motions aregiven by a stationary and nonrandom velocity Ðeld. In thisregard it is di†erent from other simulations of coronal loopdynamics, such as those performed by Galsgaard & Nord-lund (1996), Mikic, Schnack, & van Hoven (1989), or van
No. 2, 1999 MHD MODEL OF CORONAL LOOP 891
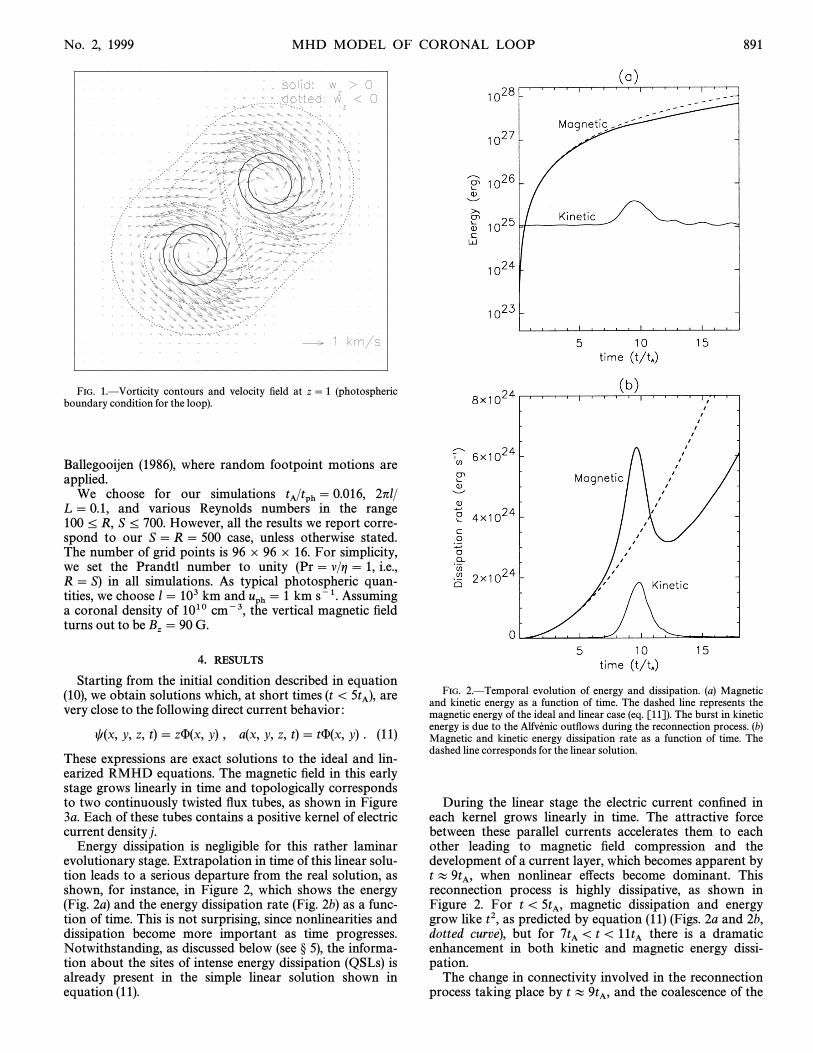
FIG. 1.ÈVorticity contours and velocity Ðeld at z\ 1 (photosphericboundary condition for the loop).
Ballegooijen (1986), where random footpoint motions areapplied.
We choose for our simulations 2nl/tA/tph\ 0.016,L \ 0.1, and various Reynolds numbers in the range100 ¹ R, S ¹ 700. However, all the results we report corre-spond to our S \ R\ 500 case, unless otherwise stated.The number of grid points is 96 ] 96 ] 16. For simplicity,we set the Prandtl number to unity (Pr\ l/g \ 1, i.e.,R\ S) in all simulations. As typical photospheric quan-tities, we choose l\ 103 km and km s~1. Assuminguph \ 1a coronal density of 1010 cm~3, the vertical magnetic Ðeldturns out to be G.B
z\ 90
4. RESULTS
Starting from the initial condition described in equation(10), we obtain solutions which, at short times are(t \ 5tA),very close to the following direct current behavior :
t(x, y, z, t)\ z'(x, y) , a(x, y, z, t)\ t'(x, y) . (11)
These expressions are exact solutions to the ideal and lin-earized RMHD equations. The magnetic Ðeld in this earlystage grows linearly in time and topologically correspondsto two continuously twisted Ñux tubes, as shown in Figure3a. Each of these tubes contains a positive kernel of electriccurrent density j.
Energy dissipation is negligible for this rather laminarevolutionary stage. Extrapolation in time of this linear solu-tion leads to a serious departure from the real solution, asshown, for instance, in Figure 2, which shows the energy(Fig. 2a) and the energy dissipation rate (Fig. 2b) as a func-tion of time. This is not surprising, since nonlinearities anddissipation become more important as time progresses.Notwithstanding, as discussed below (see ° 5), the informa-tion about the sites of intense energy dissipation (QSLs) isalready present in the simple linear solution shown inequation (11).
FIG. 2.ÈTemporal evolution of energy and dissipation. (a) Magneticand kinetic energy as a function of time. The dashed line represents themagnetic energy of the ideal and linear case (eq. [11]). The burst in kineticenergy is due to the outÑows during the reconnection process. (b)Alfve� nicMagnetic and kinetic energy dissipation rate as a function of time. Thedashed line corresponds for the linear solution.
During the linear stage the electric current conÐned ineach kernel grows linearly in time. The attractive forcebetween these parallel currents accelerates them to eachother leading to magnetic Ðeld compression and thedevelopment of a current layer, which becomes apparent by
when nonlinear e†ects become dominant. Thist B 9tA,reconnection process is highly dissipative, as shown inFigure 2. For magnetic dissipation and energyt \ 5tA,grow like t2, as predicted by equation (11) (Figs. 2a and 2b,dotted curve), but for there is a dramatic7tA \ t \ 11tAenhancement in both kinetic and magnetic energy dissi-pation.
The change in connectivity involved in the reconnectionprocess taking place by and the coalescence of thet B 9tA,
892 MILANO ET AL. Vol. 521
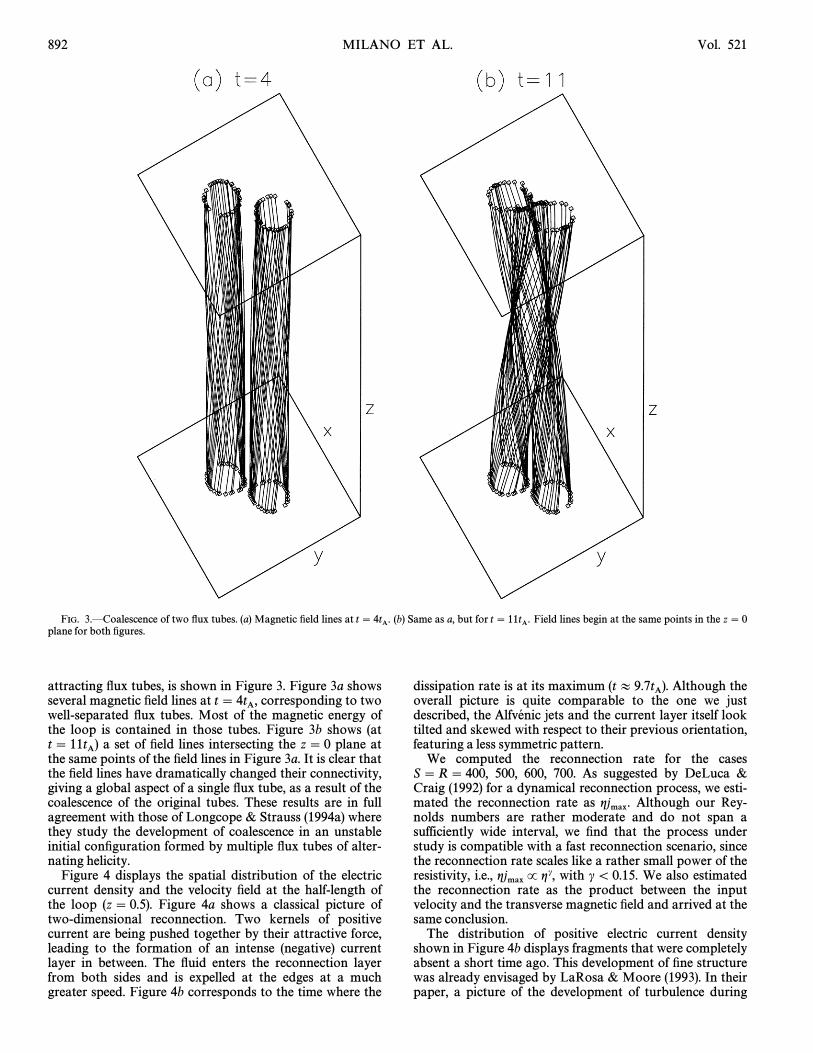
FIG. 3.ÈCoalescence of two Ñux tubes. (a) Magnetic Ðeld lines at (b) Same as a, but for Field lines begin at the same points in the z\ 0t \ 4tA. t \ 11tA.plane for both Ðgures.
attracting Ñux tubes, is shown in Figure 3. Figure 3a showsseveral magnetic Ðeld lines at corresponding to twot \ 4tA,well-separated Ñux tubes. Most of the magnetic energy ofthe loop is contained in those tubes. Figure 3b shows (at
a set of Ðeld lines intersecting the z\ 0 plane att \ 11tA)the same points of the Ðeld lines in Figure 3a. It is clear thatthe Ðeld lines have dramatically changed their connectivity,giving a global aspect of a single Ñux tube, as a result of thecoalescence of the original tubes. These results are in fullagreement with those of Longcope & Strauss (1994a) wherethey study the development of coalescence in an unstableinitial conÐguration formed by multiple Ñux tubes of alter-nating helicity.
Figure 4 displays the spatial distribution of the electriccurrent density and the velocity Ðeld at the half-length ofthe loop (z\ 0.5). Figure 4a shows a classical picture oftwo-dimensional reconnection. Two kernels of positivecurrent are being pushed together by their attractive force,leading to the formation of an intense (negative) currentlayer in between. The Ñuid enters the reconnection layerfrom both sides and is expelled at the edges at a muchgreater speed. Figure 4b corresponds to the time where the
dissipation rate is at its maximum Although the(t B 9.7tA).overall picture is quite comparable to the one we justdescribed, the jets and the current layer itself lookAlfve� nictilted and skewed with respect to their previous orientation,featuring a less symmetric pattern.
We computed the reconnection rate for the casesS \ R\ 400, 500, 600, 700. As suggested by DeLuca &Craig (1992) for a dynamical reconnection process, we esti-mated the reconnection rate as Although our Rey-gjmax.nolds numbers are rather moderate and do not span asufficiently wide interval, we Ðnd that the process understudy is compatible with a fast reconnection scenario, sincethe reconnection rate scales like a rather small power of theresistivity, i.e., with c\ 0.15. We also estimatedgjmaxP gc,the reconnection rate as the product between the inputvelocity and the transverse magnetic Ðeld and arrived at thesame conclusion.
The distribution of positive electric current densityshown in Figure 4b displays fragments that were completelyabsent a short time ago. This development of Ðne structurewas already envisaged by LaRosa & Moore (1993). In theirpaper, a picture of the development of turbulence during
No. 2, 1999 MHD MODEL OF CORONAL LOOP 893
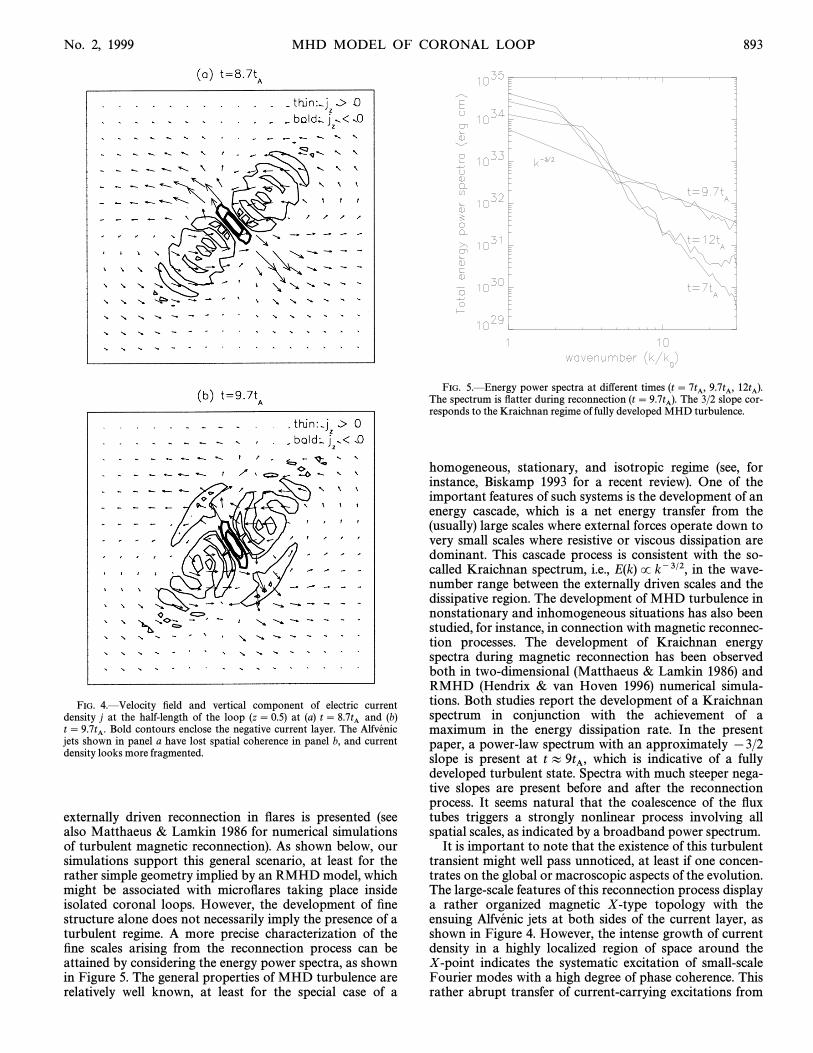
FIG. 4.ÈVelocity Ðeld and vertical component of electric currentdensity j at the half-length of the loop (z\ 0.5) at (a) and (b)t \ 8.7tABold contours enclose the negative current layer. Thet \ 9.7tA. Alfve� nicjets shown in panel a have lost spatial coherence in panel b, and currentdensity looks more fragmented.
externally driven reconnection in Ñares is presented (seealso Matthaeus & Lamkin 1986 for numerical simulationsof turbulent magnetic reconnection). As shown below, oursimulations support this general scenario, at least for therather simple geometry implied by an RMHD model, whichmight be associated with microÑares taking place insideisolated coronal loops. However, the development of Ðnestructure alone does not necessarily imply the presence of aturbulent regime. A more precise characterization of theÐne scales arising from the reconnection process can beattained by considering the energy power spectra, as shownin Figure 5. The general properties of MHD turbulence arerelatively well known, at least for the special case of a
FIG. 5.ÈEnergy power spectra at di†erent times (t \ 7tA, 9.7tA, 12tA).The spectrum is Ñatter during reconnection The 3/2 slope cor-(t \ 9.7tA).responds to the Kraichnan regime of fully developed MHD turbulence.
homogeneous, stationary, and isotropic regime (see, forinstance, Biskamp 1993 for a recent review). One of theimportant features of such systems is the development of anenergy cascade, which is a net energy transfer from the(usually) large scales where external forces operate down tovery small scales where resistive or viscous dissipation aredominant. This cascade process is consistent with the so-called Kraichnan spectrum, i.e., E(k) P k~3@2, in the wave-number range between the externally driven scales and thedissipative region. The development of MHD turbulence innonstationary and inhomogeneous situations has also beenstudied, for instance, in connection with magnetic reconnec-tion processes. The development of Kraichnan energyspectra during magnetic reconnection has been observedboth in two-dimensional (Matthaeus & Lamkin 1986) andRMHD (Hendrix & van Hoven 1996) numerical simula-tions. Both studies report the development of a Kraichnanspectrum in conjunction with the achievement of amaximum in the energy dissipation rate. In the presentpaper, a power-law spectrum with an approximately [3/2slope is present at which is indicative of a fullyt B 9tA,developed turbulent state. Spectra with much steeper nega-tive slopes are present before and after the reconnectionprocess. It seems natural that the coalescence of the Ñuxtubes triggers a strongly nonlinear process involving allspatial scales, as indicated by a broadband power spectrum.
It is important to note that the existence of this turbulenttransient might well pass unnoticed, at least if one concen-trates on the global or macroscopic aspects of the evolution.The large-scale features of this reconnection process displaya rather organized magnetic X-type topology with theensuing jets at both sides of the current layer, asAlfve� nicshown in Figure 4. However, the intense growth of currentdensity in a highly localized region of space around theX-point indicates the systematic excitation of small-scaleFourier modes with a high degree of phase coherence. Thisrather abrupt transfer of current-carrying excitations from
894 MILANO ET AL. Vol. 521
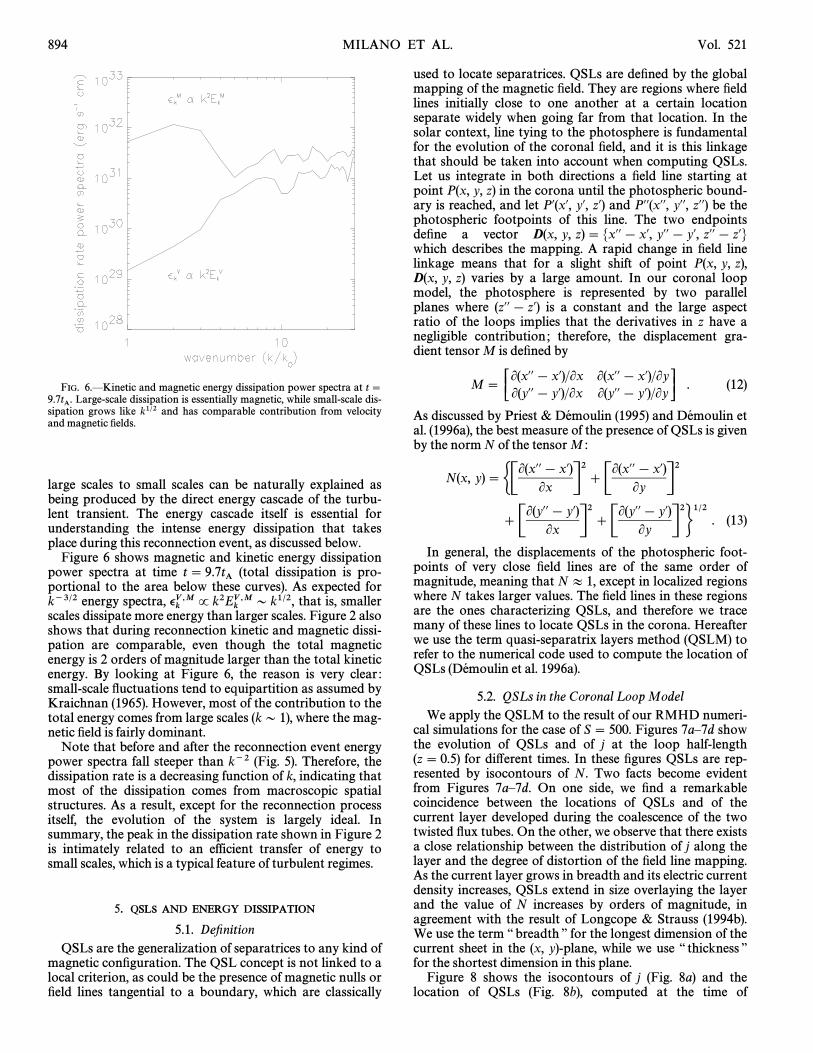
FIG. 6.ÈKinetic and magnetic energy dissipation power spectra at t \Large-scale dissipation is essentially magnetic, while small-scale dis-9.7tA.
sipation grows like k1@2 and has comparable contribution from velocityand magnetic Ðelds.
large scales to small scales can be naturally explained asbeing produced by the direct energy cascade of the turbu-lent transient. The energy cascade itself is essential forunderstanding the intense energy dissipation that takesplace during this reconnection event, as discussed below.
Figure 6 shows magnetic and kinetic energy dissipationpower spectra at time (total dissipation is pro-t \ 9.7tAportional to the area below these curves). As expected fork~3@2 energy spectra, that is, smallerv
kV,M P k2E
kV,MD k1@2,
scales dissipate more energy than larger scales. Figure 2 alsoshows that during reconnection kinetic and magnetic dissi-pation are comparable, even though the total magneticenergy is 2 orders of magnitude larger than the total kineticenergy. By looking at Figure 6, the reason is very clear :small-scale Ñuctuations tend to equipartition as assumed byKraichnan (1965). However, most of the contribution to thetotal energy comes from large scales (k D 1), where the mag-netic Ðeld is fairly dominant.
Note that before and after the reconnection event energypower spectra fall steeper than k~2 (Fig. 5). Therefore, thedissipation rate is a decreasing function of k, indicating thatmost of the dissipation comes from macroscopic spatialstructures. As a result, except for the reconnection processitself, the evolution of the system is largely ideal. Insummary, the peak in the dissipation rate shown in Figure 2is intimately related to an efficient transfer of energy tosmall scales, which is a typical feature of turbulent regimes.
5. QSLs AND ENERGY DISSIPATION
5.1. DeÐnitionQSLs are the generalization of separatrices to any kind of
magnetic conÐguration. The QSL concept is not linked to alocal criterion, as could be the presence of magnetic nulls orÐeld lines tangential to a boundary, which are classically
used to locate separatrices. QSLs are deÐned by the globalmapping of the magnetic Ðeld. They are regions where Ðeldlines initially close to one another at a certain locationseparate widely when going far from that location. In thesolar context, line tying to the photosphere is fundamentalfor the evolution of the coronal Ðeld, and it is this linkagethat should be taken into account when computing QSLs.Let us integrate in both directions a Ðeld line starting atpoint P(x, y, z) in the corona until the photospheric bound-ary is reached, and let P@(x@, y@, z@) and P@@(x@@, y@@, z@@) be thephotospheric footpoints of this line. The two endpointsdeÐne a vector D(x, y, z) \ Mx@@[ x@, y@@[ y@, z@@[ z@Nwhich describes the mapping. A rapid change in Ðeld linelinkage means that for a slight shift of point P(x, y, z),D(x, y, z) varies by a large amount. In our coronal loopmodel, the photosphere is represented by two parallelplanes where (z@@[ z@) is a constant and the large aspectratio of the loops implies that the derivatives in z have anegligible contribution ; therefore, the displacement gra-dient tensor M is deÐned by
M \<t>
L(x@@[ x@)/Lx L(x@@[ x@)/LyL(y@@[ y@)/Lx L(y@@[ y@)/Ly
=t?
. (12)
As discussed by Priest & (1995) and etDe� moulin De� moulinal. (1996a), the best measure of the presence of QSLs is givenby the norm N of the tensor M :
N(x, y) \GCL(x@@[ x@)
LxD2]
CL(x@@[ x@)Ly
D2
]CL(y@@[ y@)
LxD2 ]
CL(y@@[ y@)Ly
D2H1@2. (13)
In general, the displacements of the photospheric foot-points of very close Ðeld lines are of the same order ofmagnitude, meaning that N B 1, except in localized regionswhere N takes larger values. The Ðeld lines in these regionsare the ones characterizing QSLs, and therefore we tracemany of these lines to locate QSLs in the corona. Hereafterwe use the term quasi-separatrix layers method (QSLM) torefer to the numerical code used to compute the location ofQSLs et al. 1996a).(De� moulin
5.2. QSL s in the Coronal L oop ModelWe apply the QSLM to the result of our RMHD numeri-
cal simulations for the case of S \ 500. Figures 7aÈ7d showthe evolution of QSLs and of j at the loop half-length(z\ 0.5) for di†erent times. In these Ðgures QSLs are rep-resented by isocontours of N. Two facts become evidentfrom Figures 7aÈ7d. On one side, we Ðnd a remarkablecoincidence between the locations of QSLs and of thecurrent layer developed during the coalescence of the twotwisted Ñux tubes. On the other, we observe that there existsa close relationship between the distribution of j along thelayer and the degree of distortion of the Ðeld line mapping.As the current layer grows in breadth and its electric currentdensity increases, QSLs extend in size overlaying the layerand the value of N increases by orders of magnitude, inagreement with the result of Longcope & Strauss (1994b).We use the term ““ breadth ÏÏ for the longest dimension of thecurrent sheet in the (x, y)-plane, while we use ““ thickness ÏÏfor the shortest dimension in this plane.
Figure 8 shows the isocontours of j (Fig. 8a) and thelocation of QSLs (Fig. 8b), computed at the time of
No. 2, 1999 MHD MODEL OF CORONAL LOOP 895
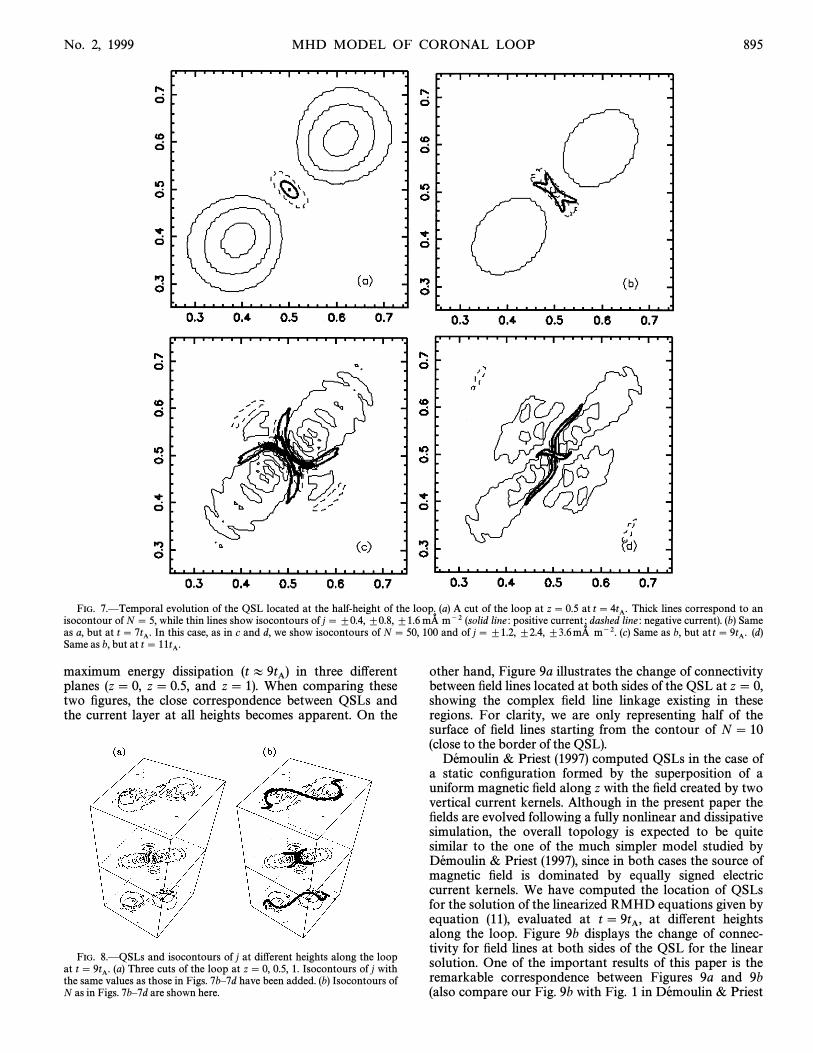
FIG. 7.ÈTemporal evolution of the QSL located at the half-height of the loop. (a) A cut of the loop at z\ 0.5 at Thick lines correspond to ant \ 4tA.isocontour of N \ 5, while thin lines show isocontours of j\ ^0.4, ^0.8, ^1.6 m~2 (solid line : positive current ; dashed line : negative current). (b) SamemA�as a, but at In this case, as in c and d, we show isocontours of N \ 50, 100 and of j\ ^1.2, ^2.4, ^3.6 m~2. (c) Same as b, but at (d)t \ 7tA. mA� t \ 9tA.Same as b, but at t \ 11tA.
maximum energy dissipation in three di†erent(t B 9tA)planes (z\ 0, z\ 0.5, and z\ 1). When comparing thesetwo Ðgures, the close correspondence between QSLs andthe current layer at all heights becomes apparent. On the
FIG. 8.ÈQSLs and isocontours of j at di†erent heights along the loopat (a) Three cuts of the loop at z\ 0, 0.5, 1. Isocontours of j witht \ 9tA.the same values as those in Figs. 7bÈ7d have been added. (b) Isocontours ofN as in Figs. 7bÈ7d are shown here.
other hand, Figure 9a illustrates the change of connectivitybetween Ðeld lines located at both sides of the QSL at z\ 0,showing the complex Ðeld line linkage existing in theseregions. For clarity, we are only representing half of thesurface of Ðeld lines starting from the contour of N \ 10(close to the border of the QSL).
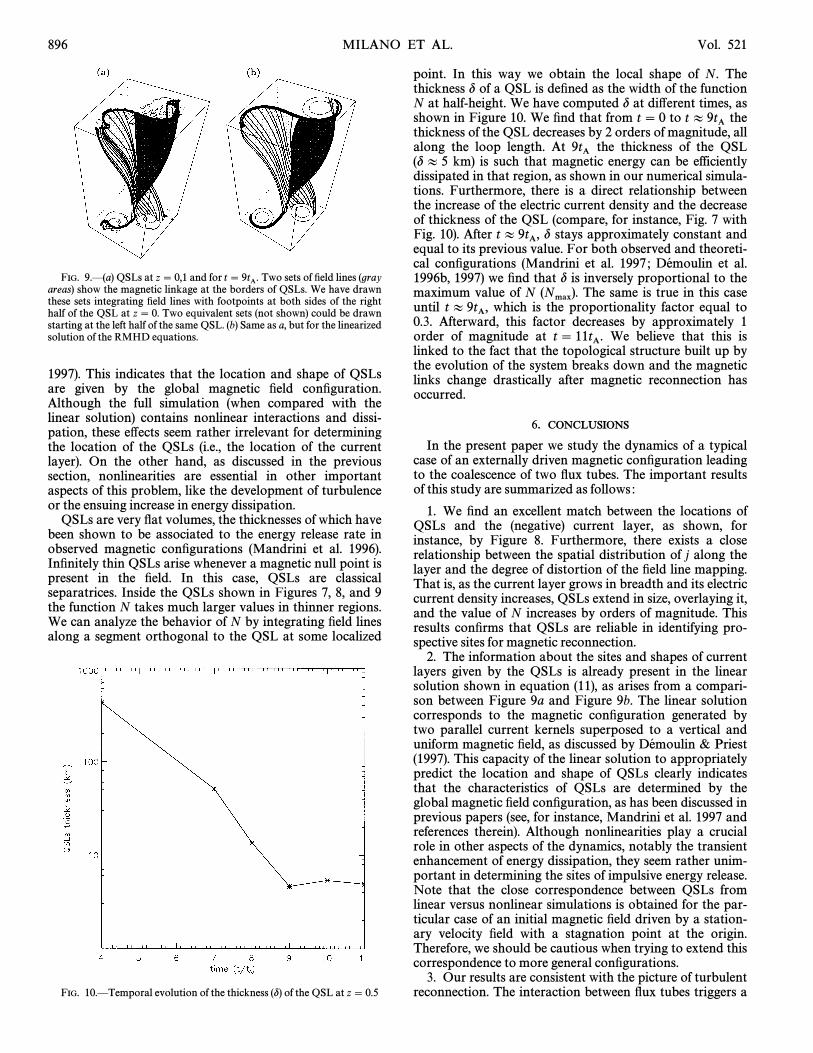
& Priest (1997) computed QSLs in the case ofDe� moulina static conÐguration formed by the superposition of auniform magnetic Ðeld along z with the Ðeld created by twovertical current kernels. Although in the present paper theÐelds are evolved following a fully nonlinear and dissipativesimulation, the overall topology is expected to be quitesimilar to the one of the much simpler model studied by
& Priest (1997), since in both cases the source ofDe� moulinmagnetic Ðeld is dominated by equally signed electriccurrent kernels. We have computed the location of QSLsfor the solution of the linearized RMHD equations given byequation (11), evaluated at at di†erent heightst \ 9tA,along the loop. Figure 9b displays the change of connec-tivity for Ðeld lines at both sides of the QSL for the linearsolution. One of the important results of this paper is theremarkable correspondence between Figures 9a and 9b(also compare our Fig. 9b with Fig. 1 in & PriestDe� moulin
896 MILANO ET AL. Vol. 521
FIG. 9.È(a) QSLs at z\ 0,1 and for Two sets of Ðeld lines (grayt \ 9tA.areas) show the magnetic linkage at the borders of QSLs. We have drawnthese sets integrating Ðeld lines with footpoints at both sides of the righthalf of the QSL at z\ 0. Two equivalent sets (not shown) could be drawnstarting at the left half of the same QSL. (b) Same as a, but for the linearizedsolution of the RMHD equations.
1997). This indicates that the location and shape of QSLsare given by the global magnetic Ðeld conÐguration.Although the full simulation (when compared with thelinear solution) contains nonlinear interactions and dissi-pation, these e†ects seem rather irrelevant for determiningthe location of the QSLs (i.e., the location of the currentlayer). On the other hand, as discussed in the previoussection, nonlinearities are essential in other importantaspects of this problem, like the development of turbulenceor the ensuing increase in energy dissipation.
QSLs are very Ñat volumes, the thicknesses of which havebeen shown to be associated to the energy release rate inobserved magnetic conÐgurations (Mandrini et al. 1996).InÐnitely thin QSLs arise whenever a magnetic null point ispresent in the Ðeld. In this case, QSLs are classicalseparatrices. Inside the QSLs shown in Figures 7, 8, and 9the function N takes much larger values in thinner regions.We can analyze the behavior of N by integrating Ðeld linesalong a segment orthogonal to the QSL at some localized
FIG. 10.ÈTemporal evolution of the thickness (d) of the QSL at z\ 0.5
point. In this way we obtain the local shape of N. Thethickness d of a QSL is deÐned as the width of the functionN at half-height. We have computed d at di†erent times, asshown in Figure 10. We Ðnd that from t \ 0 to thet B 9tAthickness of the QSL decreases by 2 orders of magnitude, allalong the loop length. At the thickness of the QSL9tA(d B 5 km) is such that magnetic energy can be efficientlydissipated in that region, as shown in our numerical simula-tions. Furthermore, there is a direct relationship betweenthe increase of the electric current density and the decreaseof thickness of the QSL (compare, for instance, Fig. 7 withFig. 10). After d stays approximately constant andt B 9tA,equal to its previous value. For both observed and theoreti-cal conÐgurations (Mandrini et al. 1997 ; et al.De� moulin1996b, 1997) we Ðnd that d is inversely proportional to themaximum value of N The same is true in this case(Nmax).until which is the proportionality factor equal tot B 9tA,0.3. Afterward, this factor decreases by approximately 1order of magnitude at We believe that this ist \ 11tA.linked to the fact that the topological structure built up bythe evolution of the system breaks down and the magneticlinks change drastically after magnetic reconnection hasoccurred.
6. CONCLUSIONS
In the present paper we study the dynamics of a typicalcase of an externally driven magnetic conÐguration leadingto the coalescence of two Ñux tubes. The important resultsof this study are summarized as follows :
1. We Ðnd an excellent match between the locations ofQSLs and the (negative) current layer, as shown, forinstance, by Figure 8. Furthermore, there exists a closerelationship between the spatial distribution of j along thelayer and the degree of distortion of the Ðeld line mapping.That is, as the current layer grows in breadth and its electriccurrent density increases, QSLs extend in size, overlaying it,and the value of N increases by orders of magnitude. Thisresults conÐrms that QSLs are reliable in identifying pro-spective sites for magnetic reconnection.
2. The information about the sites and shapes of currentlayers given by the QSLs is already present in the linearsolution shown in equation (11), as arises from a compari-son between Figure 9a and Figure 9b. The linear solutioncorresponds to the magnetic conÐguration generated bytwo parallel current kernels superposed to a vertical anduniform magnetic Ðeld, as discussed by & PriestDe� moulin(1997). This capacity of the linear solution to appropriatelypredict the location and shape of QSLs clearly indicatesthat the characteristics of QSLs are determined by theglobal magnetic Ðeld conÐguration, as has been discussed inprevious papers (see, for instance, Mandrini et al. 1997 andreferences therein). Although nonlinearities play a crucialrole in other aspects of the dynamics, notably the transientenhancement of energy dissipation, they seem rather unim-portant in determining the sites of impulsive energy release.Note that the close correspondence between QSLs fromlinear versus nonlinear simulations is obtained for the par-ticular case of an initial magnetic Ðeld driven by a station-ary velocity Ðeld with a stagnation point at the origin.Therefore, we should be cautious when trying to extend thiscorrespondence to more general conÐgurations.
3. Our results are consistent with the picture of turbulentreconnection. The interaction between Ñux tubes triggers a

No. 2, 1999 MHD MODEL OF CORONAL LOOP 897
strongly nonlinear process involving all spatial scales, asindicated by KraichnanÏs power spectrum shown in Figure5. During this turbulent transient, energy is transferred in acascade process to smaller scales where it is efficiently dissi-pated. The enhanced dissipation observed during the recon-nection process is not only restricted to the current layerpredicted by the QSLM, but also overshoots to its sur-roundings, where very Ðne structure is developed. It isimportant to stress that for the global or large-scale aspectsof the evolution, the existence of this turbulent transientmight pass unnoticed.
4. The overall characteristics of the turbulent reconnec-tion process discussed in this paper are quite consistent withthe scenario put forward by LaRosa & Moore (1993) todescribe the impulsive phase of solar Ñares. However,because of the geometrical assumptions implied by theRMHD equations, the present analysis should be associ-
ated with microÑares rather than Ñares. MicroÑares aretransient brightenings observed in soft X-rays, presumablytaking place inside single loops (see, for instance, Shimizu1995 for an extended observational analysis of these events).According to the present study, in order for a microÑare of1026È1027 ergs to occur inside a loop, a spatially coherentphotospheric velocity Ðeld should be applied to the loopfootpoints during times long enough to trigger thecoalescence process.
We acknowledge Ðnancial support from the University ofBuenos Aires (grant TX065/98) and CONICET (grants PEI105/98 and PEI 104/98). Economic support from ANPCYT(Argentina) and ECOS (France) through their Argentina-France cooperative science program (A97U01) is alsoacknowledged.
REFERENCESAlissandrakis, C. E. 1981, A&A, 100, 197Aulanier, G., P., van Driel-Gesztelyi, L., Mein, P., & DeForest,De� moulin,
C. 1998, A&A, 335, 309Biskamp, D. 1993, Nonlinear Magnetohydrodynamics (Cambridge : Cam-
bridge Univ. Press)Canuto, C., Hussaini, M. Y., Quarteroni, A., & Zang, T. A. 1988, Spectral
Methods in Fluid Dynamics (New York : Springer)DeLuca, E., & Craig, I. 1992, ApJ, 390, 679
P., L. G., Mandrini, C. H., J. C., & Rovira,De� moulin, Bagala� , He� noux,M. G. 1997, A&A, 325, 305
P., J. C., Priest, E. R., & Mandrini, C. H. 1996a, A&A,De� moulin, He� noux,308, 643
P., & Priest, E. R. 1997, Sol. Phys., 175, 123De� moulin,P., Priest, E. R., & Lonie, D. P. 1996b, J. Geophys. Res., 101,De� moulin,
7631Dmitruk, P., D. O., & DeLuca, E. E. 1998, ApJ, 505, 974Go� mez,Galsgaard, K., & Nordlund, A. 1996, J. Geophys. Res., 101, 13445Hendrix, D. L., & van Hoven, G. 1996, ApJ, 467, 887
Jardine, M. 1991, in Mechanisms of Chromospheric and Coronal Heating,ed. P. Ulmschneider, E. R. Priest, & R. Rosner (Berlin : Springer), 588
Kraichnan, R. H. 1965, Phys. Fluids, 8, 138Lau, Y. T., & Finn, J. M. 1991, ApJ, 366, 577LaRosa, T. N., & Moore, R. L. 1993, ApJ, 418, 912Longcope, D. W., & Strauss, H. R. 1994a, ApJ, 426, 742ÈÈÈ. 1994b, ApJ, 437, 851Mandrini, C. H., P., L. G., van Driel-Gesztelyi, L.,De� moulin, Bagala� ,
J. C., Schmieder, B., & Rovira, M. G. 1997, Sol. Phys., 174, 229He� noux,Mandrini, C. H., P., van Driel-Gesztelyi, L., Schmieder, B.,De� moulin,
Cauzzi, G., & Hofmann, A. 1996, Sol. Phys., 168, 115Matthaeus, W. H., & Lamkin, S. L. 1986, Phys. Fluids, 29, 2513Mikic, Z., Schnack, D., & van Hoven, G. 1989, ApJ, 338, 1148Priest, E. R. 1997, Phys. Plasmas, 4 (5), 1945Priest, E. R., & P. 1995, J. Geophys. Res., 100, 23443De� moulin,Shimizu, T. 1995, PASJ, 47, 251Strauss, H. 1976, Phys. Fluids 19, 134van Ballegooijen, A. 1986, ApJ, 311, 1001
Related Documents


