4Q 2018 CEE Quarterly Macro Research Strategy Research Credit Research

Welcome message from author
This document is posted to help you gain knowledge. Please leave a comment to let me know what you think about it! Share it to your friends and learn new things together.
Transcript

4Q
2018
CEE
Quarterly
Macro Research Strategy Research Credit Research
October 2018
September 2018 CEE Macro & Strategy Research
CEE Quarterly
UniCredit Research page 2 See last pages for disclaimer.
“Your Leading Banking Partner in Central and Eastern Europe”

October 2018
UniCredit Research page 3 See last pages for disclaimer.
September 2018 CEE Macro & Strategy Research
CEE Quarterly
Contents 4 A test of resilience
15 The drivers of EM capital flows
26 CEE Strategy: dip your toes in but mind the tide
32 CEEMEA FX: Near-term relief, but the coast is far from clear
90 Acronyms and abbreviations used in the CEE Quarterly
Countries
EU canditates and other countries
40 Bulgaria 68 Azerbaijan
44 Croatia 70 Bosnia and Herzegovina
48 Czech Republic 72 Kazakhstan
52 Hungary 74 Russia
56 Poland 78 Serbia
60 Romania 82 Turkey
64 Slovakia 86 Ukraine
66 Slovenia
Published on 27 September 2018
Erik F. Nielsen Group Chief Economist (UniCredit Bank London) 120 London Wall London EC2Y 5ET
Imprint: UniCredit Bank AG UniCredit Research Am Eisbach 4 D-80538 Munich
Supplier identification: www.research.unicredit.eu
Erik F. Nielsen, Group Chief Economist (UniCredit Bank, London) +44 207 826-1765, [email protected]
Dan Bucşa, Chief CEE Economist (UniCredit Bank, London) +44 207 826-7954, [email protected]
Artem Arkhipov, Head of Macroeconomic Analysis and Research Russia (UniCredit Russia) +7 495 258-7258 ext. -7558, [email protected]
Hrvoje Dolenec, Chief Economist (Zagrebačka banka) +385 1 6006-678, [email protected]
Dr. Ágnes Halász, Chief Economist, Head of Economics and Strategic Analysis Hungary (UniCredit Hungary) +36 1 301-1907, [email protected]
Ľubomír Koršňák, Chief Economist (UniCredit Bank Czech Republic and Slovakia) +42 12 4950-2427, [email protected]
Kiran Kowshik, EM FX Strategist (UniCredit Bank, London) +44 207 826-6080, [email protected]
Elia Lattuga, Cross Asset Strategist (UniCredit Bank, London) +44 207 826-1642, [email protected]
Mauro Giorgio Marrano, Senior CEE Economist (UniCredit Bank, Vienna) +43 50505-82712, [email protected]
Anca Maria Negrescu, Senior Economist (UniCredit Bank Romania) +40 21 200-1377, [email protected]
Kristofor Pavlov, Chief Economist (UniCredit Bulbank) +359 2 9269-390, [email protected]
Pavel Sobíšek, Chief Economist (UniCredit Bank Czech Republic and Slovakia) +420 955 960-716, [email protected]
Daniel Vernazza, Ph.D., Chief UK & Senior Global Economist (UniCredit Bank, London) +44 207 826-7805, [email protected]
Lubomir Mitov, Consultant (Lubomir Mitov is a Consultant for UniCredit Bank AG) [email protected]
October 2018
UniCredit Research page 4 See last pages for disclaimer.
September 2018 CEE Macro & Strategy Research
CEE Quarterly
A test of resilience Dan Bucşa, Chief CEE Economist (UniCredit Bank, London) +44 207 826-7954 [email protected]
■ Emerging market (EM) growth will depend more on domestic demand in 4Q18 and 2019 as global trade growth slows further.
■ Reliance on capital inflows, macroeconomic imbalances and diverse policy stances will lead to growth differentiation in EM in general and CEE in particular, at a time when financial conditions are expected to tighten in developed markets (DM).
■ At the same time, capital scarcity could stoke up contagion risks and affect financial stability across EM.
■ Mounting political risks add to uncertainty, with Turkey and Russia the most exposed in CEE.
■ EU-CEE and Serbia are likely to grow at around 4% in 2018 and 3.6% in 2019, supported by loose real monetary conditions and, in some cases, by fiscal easing.
■ Turkey faces a sharp recession next year, with GDP expected to fall by approximately 6.8%. An IMF agreement would help end the recession in mid-2019 and usher in a fast recovery.
■ If Turkey decides to weather the crisis on its own, the recession could be deeper and end only in 2020. Struggling to roll over external debt, companies and banks could face bigger problems in this risk scenario.
■ The Russian economy could expand by less than 2% this year and next amid low potential growth.
■ We expect rate hikes this year in Czechia, Russia and Turkey, with only the CNB continuing to tighten in 2019.
■ The NBH, NBP, NBR and NBS are likely to remain on hold this year and next, with inflation above target but inside target ranges.
■ The biggest inflationary risks for CEE are a stronger USD, higher oil prices and tight labor market conditions.
■ Bond performance will be affected in 4Q18 by heavy positioning in Russia and Czechia, large financing needs in Hungary and Romania, and limited scope for rallies in Poland and Serbia.
■ We prefer payers in the belly of the curve in Czechia and in short-term rates in Hungary, as well as FX forwards in Romania.
■ The potential release of Pastor Andrew Brunson could trigger a relief rally in Turkey. However, a lasting rally may require the opening of talks for external financial support.
1. Global trade weakness highlights EM dependency on foreign capital
EM facing a difficult 4Q18 as global trade slows again… …due to the risk of tariffs…
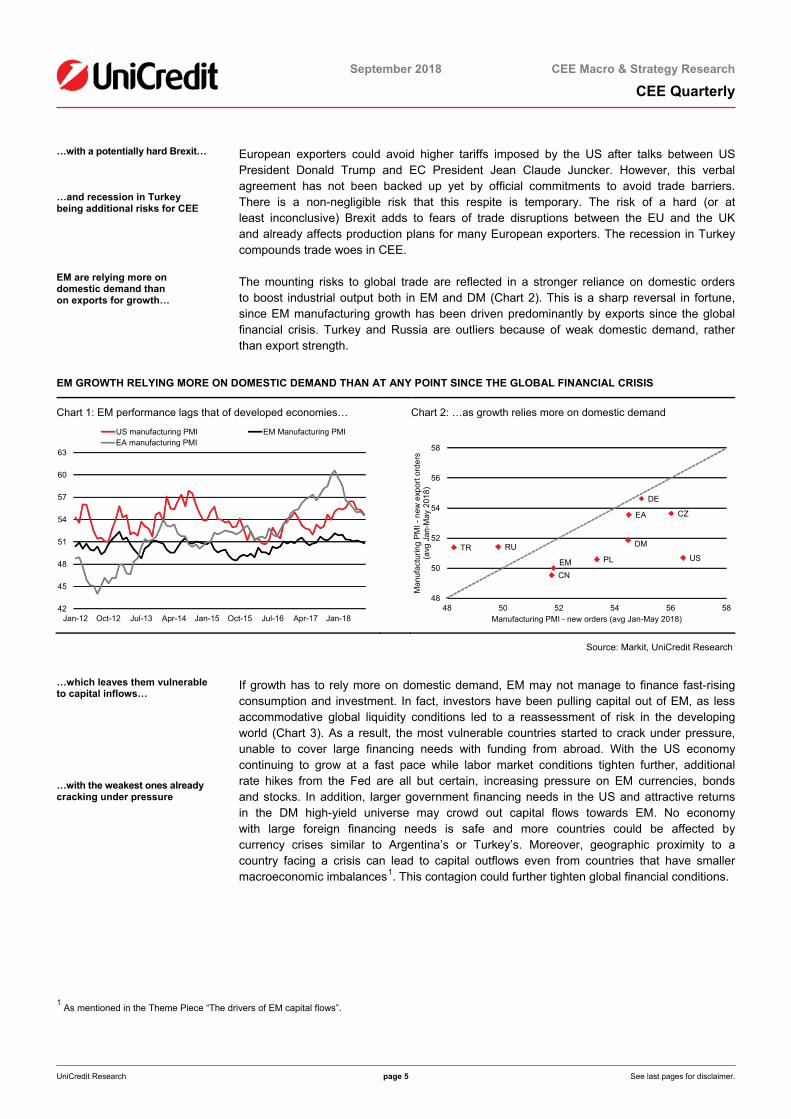
Emerging markets had a difficult 3Q18 and the situation is unlikely to improve in the last quarter of the year. The danger of trade wars is affecting global trade, on which most EM depend. While the US administration seems to focus on trade tariffs on China, other EM are not immune to spillover. Manufacturing PMIs fell more from recent peaks than in DM and this underlines the asymmetric impact that additional trade barriers have on EM (Chart 1). With USD 200bn in Chinese exports to the US hit by additional tariffs and protracted negotiations to renew NAFTA, the outlook for global trade has worsened. In September alone, UniCredit’s proprietary leading indicator gave up everything it gained over the summer.
October 2018
UniCredit Research page 5 See last pages for disclaimer.
September 2018 CEE Macro & Strategy Research
CEE Quarterly
…with a potentially hard Brexit… …and recession in Turkey being additional risks for CEE EM are relying more on domestic demand than on exports for growth…
European exporters could avoid higher tariffs imposed by the US after talks between US President Donald Trump and EC President Jean Claude Juncker. However, this verbal agreement has not been backed up yet by official commitments to avoid trade barriers. There is a non-negligible risk that this respite is temporary. The risk of a hard (or at least inconclusive) Brexit adds to fears of trade disruptions between the EU and the UK and already affects production plans for many European exporters. The recession in Turkey compounds trade woes in CEE.
The mounting risks to global trade are reflected in a stronger reliance on domestic orders to boost industrial output both in EM and DM (Chart 2). This is a sharp reversal in fortune, since EM manufacturing growth has been driven predominantly by exports since the global financial crisis. Turkey and Russia are outliers because of weak domestic demand, rather than export strength.
EM GROWTH RELYING MORE ON DOMESTIC DEMAND THAN AT ANY POINT SINCE THE GLOBAL FINANCIAL CRISIS
Chart 1: EM performance lags that of developed economies… Chart 2: …as growth relies more on domestic demand
42
45
48
51
54
57
60
63
Jan-12 Oct-12 Jul-13 Apr-14 Jan-15 Oct-15 Jul-16 Apr-17 Jan-18
US manufacturing PMI EM Manufacturing PMIEA manufacturing PMI
DM
EM
EA
DE
CZ
PLRUTR
CN
US
48
50
52
54
56
58
48 50 52 54 56 58
Man
ufac
turin
g P
MI -
new
exp
ort o
rder
s (a
vg J
an-M
ay 2
018)
Manufacturing PMI - new orders (avg Jan-May 2018)
Source: Markit, UniCredit Research
…which leaves them vulnerable to capital inflows… …with the weakest ones already cracking under pressure
If growth has to rely more on domestic demand, EM may not manage to finance fast-rising consumption and investment. In fact, investors have been pulling capital out of EM, as less accommodative global liquidity conditions led to a reassessment of risk in the developing world (Chart 3). As a result, the most vulnerable countries started to crack under pressure, unable to cover large financing needs with funding from abroad. With the US economy continuing to grow at a fast pace while labor market conditions tighten further, additional rate hikes from the Fed are all but certain, increasing pressure on EM currencies, bonds and stocks. In addition, larger government financing needs in the US and attractive returns in the DM high-yield universe may crowd out capital flows towards EM. No economy with large foreign financing needs is safe and more countries could be affected by currency crises similar to Argentina’s or Turkey’s. Moreover, geographic proximity to a country facing a crisis can lead to capital outflows even from countries that have smaller macroeconomic imbalances1. This contagion could further tighten global financial conditions.
1 As mentioned in the Theme Piece “The drivers of EM capital flows”.

October 2018
UniCredit Research page 6 See last pages for disclaimer.
September 2018 CEE Macro & Strategy Research
CEE Quarterly
Romania and Serbia are the most exposed countries in CEE if capital outflows from EM continue
Most CEE countries are cushioned by current account surpluses, with large extended basic balances (EBB)2 in all EU-CEE3 countries but Romania. In fact, Romania and Serbia stand out as the CEE countries with the largest C/A deficits after Turkey’s. While both managed to cover external shortfalls in the past, there is no guarantee that FDI will be large enough in the coming years. Romania’s notorious incapacity to absorb EU funds is unlikely to be resolved in 2019-20, with absorption expected to pick up only after the current EU budget period will end. While full-fledged currency crises may be averted since C/A deficits are manageable, FX reserve depletion is a risk for both countries, especially since central banks prefer supporting their overvalued currencies through FX interventions (Chart 4).
PORTFOLIO OUTFLOWS COULD LEAD TO LOWER FX RESERVES IF COUNTRIES TRY TO DEFEND CURRENCIES
Chart 3: Debt portfolio inflows slowed in 2018 Chart 4: The NBR and the NBS could deplete reserves
-0.6
-0.4
-0.2
0.0
0.2
0.4
0.6
0.8
1.0
1.2
1.4
Mar-13 Dec-13 Sep-14 Jun-15 Mar-16 Dec-16 Sep-17
CEE Latin America EM Asia w/o China Chinaquarterly flows(% of annual GDP)
-2.0
-1.6
-1.2
-0.8
-0.4
0.0
0.4
0.8
1.2
1.6
-5.0
-4.0
-3.0
-2.0
-1.0
0.0
1.0
2.0
3.0
4.0
Jan-13 Oct-13 Jul-14 Apr-15 Jan-16 Oct-16 Jul-17 Apr-18
Portfolio debt flows to CEE (% of GDP, rs)Foreign currency reserves - Romania (EUR bn, yoy change)Foreign currency reserves - Serbia (EUR bn, yoy change)
Source: IIF, IMF, NBR, NBS, UniCredit Research
2. Mounting political risks will pile pressure on EM economies Political risks flaring up around the globe
Turkey’s standoff with the US led to a currency crisis…
Besides economic woes, political tensions increased around the globe, from the eurozone to the Middle East and from the US to Russia. The higher probability of a hard Brexit, worries about fiscal easing in Italy and a more heated standoff between EU institutions and newer members like Hungary, Poland and Romania have dented risk appetite for EU-CEE financial assets over the summer. These risks are likely to persist in 4Q18, with others looming in 2019. One is cumbersome EU budget negotiations that could be even more complicated by next May’s EU parliamentary elections. As mentioned in our previous CEE Quarterly, EU-CEE stands to lose the most when EU funds will be allotted for 2021-274.
We predicted a bumpy ride for CEE in 3Q18 and it turned out to be a rollercoaster for the largest countries in the region. Turkey entered a full-blown currency crisis, while Russian assets were battered due to new sanctions.
Turkey’s macroeconomic imbalances are not new and were allowed to accumulate faster since 2012. The first-ever sanctions imposed by the US on a NATO ally were the trigger for a selloff that has been half a decade in the making. From here on, the adjustment will depend on how Turkish authorities address the shrinking access to external funding.
2 Current account (C/A) balance + EU fund inflows + foreign direct investment (FDI) 3 EU members in CEE. This publication refers to Bulgaria, Croatia, the Czech Republic, Hungary, Poland, Romania, Slovakia and Slovenia. 4 For details, please see “EU-CEE’s weak hand in EU budget negotiations”, CEE Quarterly 3Q 2018, p. 17-23.

October 2018
UniCredit Research page 7 See last pages for disclaimer.
September 2018 CEE Macro & Strategy Research
CEE Quarterly
…and will have to be resolved if Turkey wants to weather the crisis with foreign support
The specter of additional sanctions led to a selloff in Russian bonds
An IMF agreement would smooth deleveraging and the recession, stopping the capital hemorrhage (Chart 5) and ushering in a faster recovery.
In contrast, the recession is likely to be deeper and the impact on banks and companies longer-lasting and more detrimental if Turkey decides to weather the crisis on its own. Risks abound and could materialize before the end of this year. If Pastor Andrew Brunson, currently under arrest in Turkey, is not released following the 12 October hearing in his trial or his appeal to the Constitutional Court, the US could toughen sanctions against Turkey. Other contentious topics include Turkey’s purchase of S-400 missiles from Russia, the US’ collaboration with the People’s Protection Units (YPG)5 in Syria and Turkey’s economic and political ties to Iran.
Russia is facing a new round of sanctions – probably after 6 November, when mid-term elections are held in the US – and this threat has altered investor appetite since spring. Investors are bracing for potential restrictions on bond purchases in the primary market, while the probability of crippling sanctions on state-owned banks may be lower due to the damage they would inflict on Russia and the global economy6. Portfolio inflows may not recover as long as the threat of further measures is looming large, leading to additional outflows from sovereign bonds after a poor 2Q18 (Chart 6) and probably 3Q18. A new round of sanctions in April 2018, while limited in scope, proved to be the trigger for a strong correction, with outflows from Russian bonds comparable to those triggered by sanctions imposed in the aftermath of Crimea’s annexation. The effect was compounded by positioning, with Russia being one of the largest overweights in EM at the beginning of the year. Last year, foreign investors bought large amounts of OFZ, correctly identifying Russia as an EM that tends to decouple from its peers in times of trouble for developing markets.
TURKEY AND RUSSIA ARE AFFECTED BY LARGE CAPITAL OUTFLOWS
Chart 5: Turkey’s net FX reserves have fallen below USD 10bn
Chart 6: Outflows from Russian bonds are similar to other sanction episodes
0
20
40
60
80
100
120
Dec-08 Jan-10 Feb-11 Mar-12 Apr-13 May-14 Jun-15 Jul-16 Jul-17 Aug-18
OtherSDRGoldMinimum reserve requirements held in FXNet FX reserves (excluding bank reserves, gold, SDR)
FX reserves of the CBRT, USD bn
-10
-8
-6
-4
-2
0
2
4
6
8
10
Mar-09 Mar-10 Mar-11 Mar-12 Mar-13 Mar-14 Mar-15 Mar-16 Mar-17 Mar-18
Redemptions and coupons Secondary market transactionsPrimary market purchases
USD bn
Source: CBRT, CBR, UniCredit Research
5 Considered by Turkey a related organization to the Kurdistan Worker’s Party (PKK), which is listed as a terrorist organization by NATO, the US, the EU and Turkey. 6 We highlight just two potential consequences: 1. economic – higher commodity prices, with oil prices likely to spike and 2. financial – lower bond prices and a weaker RUB would affect the performance of US and western European investors in EM.
October 2018
UniCredit Research page 8 See last pages for disclaimer.
September 2018 CEE Macro & Strategy Research
CEE Quarterly
3. 2018-19 growth outlook: the receding tide that strands some boats A higher dependency on domestic demand will lead to growth differentiation in CEE EU-CEE will continue to grow above potential in 2019… …with risks stemming from tight labor markets and volatile private investment Capex is stronger where FDI in production capacities is large Further growth in real estate and EU-funded investment EU funds will add to growth in Poland and subtract from it in Hungary Czechia and Bulgaria have room to loosen fiscal policy… … in contrast to Romania, where growth will slow the most in EU-CEE Positive fiscal impulses in Croatia, Serbia and Slovenia
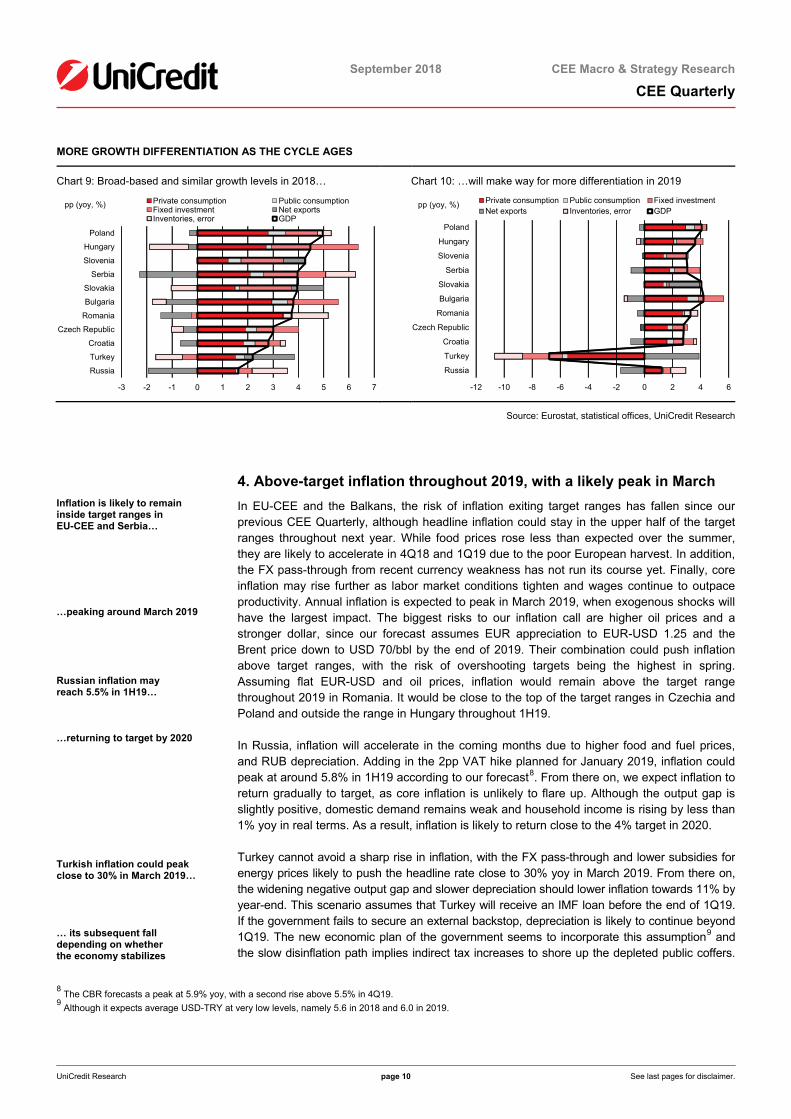
2018 could remain the only year in the current cycle when all CEE countries manage to grow at the same time. It also marks the transition to a cyclical downturn that traces the expected gradual slowdown in the US and Europe. However, weaker foreign demand is likely to lead to more differentiation than in previous years due to discrepancies in growth structure and potential, macroeconomic imbalances, monetary policy stances, public policies and access to foreign capital.
Most of the small, open economies in central Europe have enjoyed balanced growth in this cycle and a gradual slowdown in foreign demand will still allow them to grow above potential, at an average of 4% in 2018 and 3.6% in 2019. While domestic demand remains robust, EU-CEE faces two risks that may worsen in the coming years, namely an increasing deficit of labor and volatile private investment. Labor market conditions will continue to tighten, but unemployment rates may be close to bottoming out in most countries due to skill mismatches and low geographic mobility. These lead to regional discrepancies in unemployment that are unlikely to be leveled in the coming years.
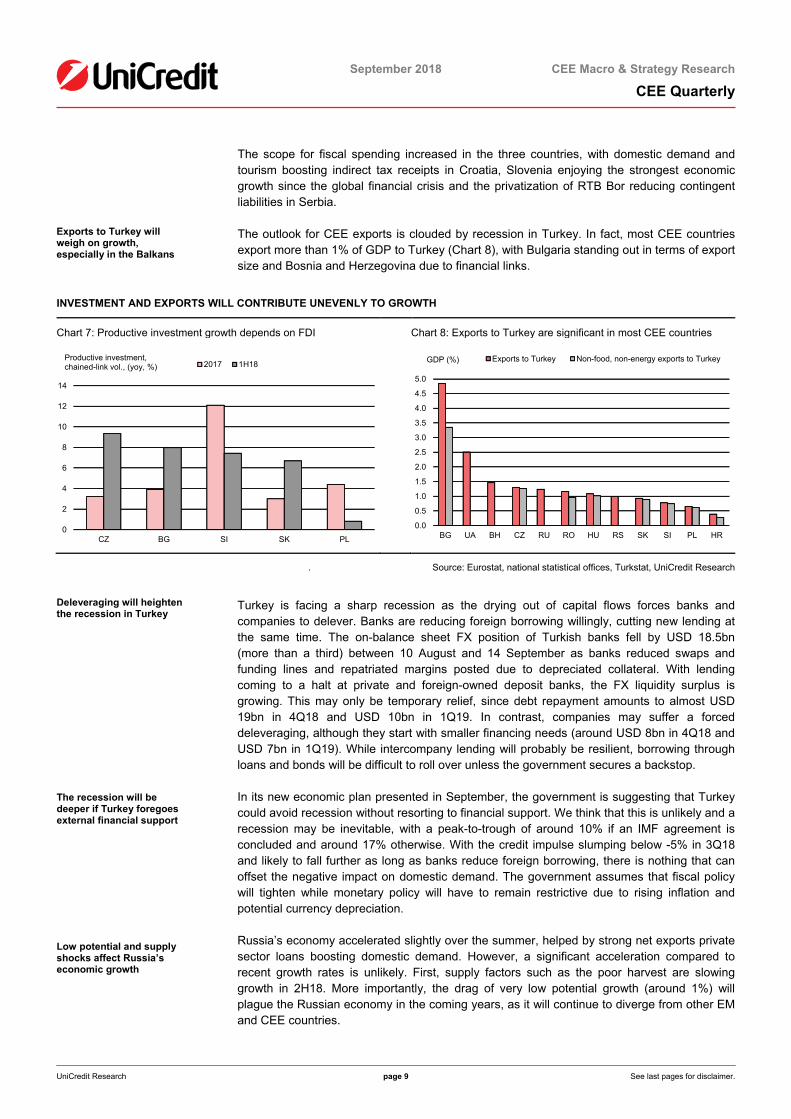
In line with official and private sector forecasts, we have been expecting capex to recover due to labor shortages and strong demand, both local and foreign. However, this has not been the case in all countries (Chart 7) and time is running out for a significant improvement in productive investment. Limited labor availability and poor skills may have actually dented intentions to invest in some countries, despite diminishing spare capacity and credit being the cheapest and easiest to access since the global financial crisis. Hungary, Slovakia and Slovenia will benefit from large foreign investment projects, but in countries without large-scale FDI (Poland, Romania), capex is growing slower than in the past. A harder-than-expected Brexit may prove a surprising boon as European companies move production from the UK to EU-CEE. This migration started more than a year ago and concerns mostly companies integrated in Europe’s manufacturing supply chains. However, it is too early to say whether Brexit-related investment will offset falling exports to the UK.
A mixed picture for capex contrasts with strong investment in construction and infrastructure, the latter financed mostly with EU funds. As the cycle ages, real estate prices continue to rise, with the Czech and Budapest markets being the strongest candidates for price bubbles. Hungary also stands out as the most diligent spender on EU-funded projects, to the extent that they will be unable to contribute to growth in coming years7, pushing GDP growth below 4%. The exact opposite is happening in Poland, where spending on EU-funded projects is picking up ahead of several rounds of elections.
Besides larger EU fund inflows, Czechia and Bulgaria have room to boost growth through fiscal spending, since both start with very small budget deficits. The positive fiscal impulse may have a stronger impact in Bulgaria, where growth is likely to remain the least volatile in CEE. The Czech economy, being the most open in the region, may be the hardest hit by slower growth in European demand.
However, none of the EU-CEE countries will experience a similar growth slowdown like Romania. The overreliance on consumption growth funded with public spending leaves no alternative growth drivers once the budget deficit exceeds 3% of GDP next year. Unless the government plans to run wider fiscal shortfalls, it may have to increase taxation in order to finance investment, which has been crowded out by wages and pensions for five years in a row.
Croatia, Serbia and Slovenia are in an earlier stage of the business cycle, having emerged in the past two years from sharp fiscal adjustments. All three are likely to grow above potential, with fiscal policy easing somewhat on the back of wage and pension increases.
7 For details, please see the country section on pages 54-55.
October 2018
UniCredit Research page 9 See last pages for disclaimer.
September 2018 CEE Macro & Strategy Research
CEE Quarterly
Exports to Turkey will weigh on growth, especially in the Balkans
The scope for fiscal spending increased in the three countries, with domestic demand and tourism boosting indirect tax receipts in Croatia, Slovenia enjoying the strongest economic growth since the global financial crisis and the privatization of RTB Bor reducing contingent liabilities in Serbia.
The outlook for CEE exports is clouded by recession in Turkey. In fact, most CEE countries export more than 1% of GDP to Turkey (Chart 8), with Bulgaria standing out in terms of export size and Bosnia and Herzegovina due to financial links.
INVESTMENT AND EXPORTS WILL CONTRIBUTE UNEVENLY TO GROWTH
Chart 7: Productive investment growth depends on FDI Chart 8: Exports to Turkey are significant in most CEE countries
0
2
4
6
8
10
12
14
CZ BG SI SK PL
2017 1H18Productive investment,chained-link vol., (yoy, %)
0.0
0.5
1.0
1.5
2.0
2.5
3.0
3.5
4.0
4.5
5.0
BG UA BH CZ RU RO HU RS SK SI PL HR
Exports to Turkey Non-food, non-energy exports to TurkeyGDP (%)
. Source: Eurostat, national statistical offices, Turkstat, UniCredit Research
Deleveraging will heighten the recession in Turkey The recession will be deeper if Turkey foregoes external financial support Low potential and supply shocks affect Russia’s economic growth
Turkey is facing a sharp recession as the drying out of capital flows forces banks and companies to delever. Banks are reducing foreign borrowing willingly, cutting new lending at the same time. The on-balance sheet FX position of Turkish banks fell by USD 18.5bn (more than a third) between 10 August and 14 September as banks reduced swaps and funding lines and repatriated margins posted due to depreciated collateral. With lending coming to a halt at private and foreign-owned deposit banks, the FX liquidity surplus is growing. This may only be temporary relief, since debt repayment amounts to almost USD 19bn in 4Q18 and USD 10bn in 1Q19. In contrast, companies may suffer a forced deleveraging, although they start with smaller financing needs (around USD 8bn in 4Q18 and USD 7bn in 1Q19). While intercompany lending will probably be resilient, borrowing through loans and bonds will be difficult to roll over unless the government secures a backstop.
In its new economic plan presented in September, the government is suggesting that Turkey could avoid recession without resorting to financial support. We think that this is unlikely and a recession may be inevitable, with a peak-to-trough of around 10% if an IMF agreement is concluded and around 17% otherwise. With the credit impulse slumping below -5% in 3Q18 and likely to fall further as long as banks reduce foreign borrowing, there is nothing that can offset the negative impact on domestic demand. The government assumes that fiscal policy will tighten while monetary policy will have to remain restrictive due to rising inflation and potential currency depreciation.
Russia’s economy accelerated slightly over the summer, helped by strong net exports private sector loans boosting domestic demand. However, a significant acceleration compared to recent growth rates is unlikely. First, supply factors such as the poor harvest are slowing growth in 2H18. More importantly, the drag of very low potential growth (around 1%) will plague the Russian economy in the coming years, as it will continue to diverge from other EM and CEE countries.
October 2018
UniCredit Research page 10 See last pages for disclaimer.
September 2018 CEE Macro & Strategy Research
CEE Quarterly
MORE GROWTH DIFFERENTIATION AS THE CYCLE AGES
Chart 9: Broad-based and similar growth levels in 2018… Chart 10: …will make way for more differentiation in 2019
-3 -2 -1 0 1 2 3 4 5 6 7
Russia
Turkey
Croatia
Czech Republic
Romania
Bulgaria
Slovakia
Serbia
Slovenia
Hungary
Poland
Private consumption Public consumptionFixed investment Net exportsInventories, error GDP
pp (yoy, %)
-12 -10 -8 -6 -4 -2 0 2 4 6
Russia
Turkey
Croatia
Czech Republic
Romania
Bulgaria
Slovakia
Serbia
Slovenia
Hungary
Poland
Private consumption Public consumption Fixed investmentNet exports Inventories, error GDP
pp (yoy, %)
Source: Eurostat, statistical offices, UniCredit Research
4. Above-target inflation throughout 2019, with a likely peak in March Inflation is likely to remain inside target ranges in EU-CEE and Serbia…
…peaking around March 2019 Russian inflation may reach 5.5% in 1H19… …returning to target by 2020 Turkish inflation could peak close to 30% in March 2019… … its subsequent fall depending on whether the economy stabilizes
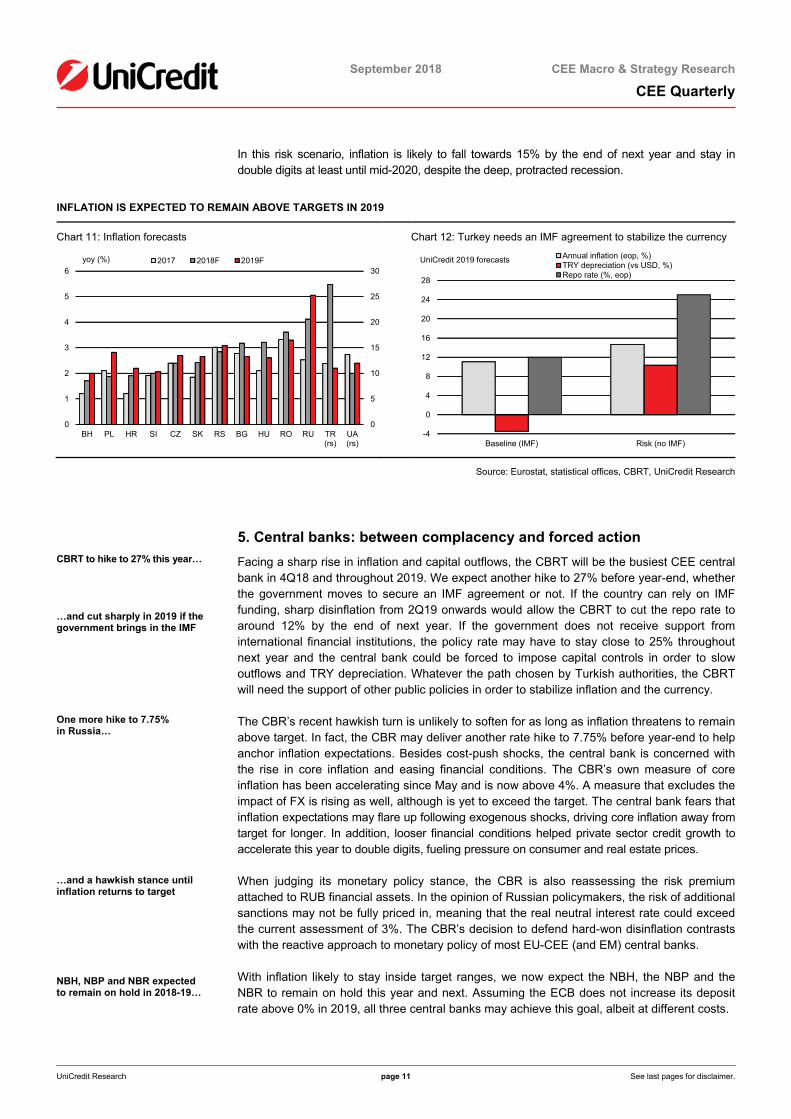
In EU-CEE and the Balkans, the risk of inflation exiting target ranges has fallen since our previous CEE Quarterly, although headline inflation could stay in the upper half of the target ranges throughout next year. While food prices rose less than expected over the summer, they are likely to accelerate in 4Q18 and 1Q19 due to the poor European harvest. In addition, the FX pass-through from recent currency weakness has not run its course yet. Finally, core inflation may rise further as labor market conditions tighten and wages continue to outpace productivity. Annual inflation is expected to peak in March 2019, when exogenous shocks will have the largest impact. The biggest risks to our inflation call are higher oil prices and a stronger dollar, since our forecast assumes EUR appreciation to EUR-USD 1.25 and the Brent price down to USD 70/bbl by the end of 2019. Their combination could push inflation above target ranges, with the risk of overshooting targets being the highest in spring. Assuming flat EUR-USD and oil prices, inflation would remain above the target range throughout 2019 in Romania. It would be close to the top of the target ranges in Czechia and Poland and outside the range in Hungary throughout 1H19.
In Russia, inflation will accelerate in the coming months due to higher food and fuel prices, and RUB depreciation. Adding in the 2pp VAT hike planned for January 2019, inflation could peak at around 5.8% in 1H19 according to our forecast8. From there on, we expect inflation to return gradually to target, as core inflation is unlikely to flare up. Although the output gap is slightly positive, domestic demand remains weak and household income is rising by less than 1% yoy in real terms. As a result, inflation is likely to return close to the 4% target in 2020.
Turkey cannot avoid a sharp rise in inflation, with the FX pass-through and lower subsidies for energy prices likely to push the headline rate close to 30% yoy in March 2019. From there on, the widening negative output gap and slower depreciation should lower inflation towards 11% by year-end. This scenario assumes that Turkey will receive an IMF loan before the end of 1Q19. If the government fails to secure an external backstop, depreciation is likely to continue beyond 1Q19. The new economic plan of the government seems to incorporate this assumption9 and the slow disinflation path implies indirect tax increases to shore up the depleted public coffers.
8 The CBR forecasts a peak at 5.9% yoy, with a second rise above 5.5% in 4Q19. 9 Although it expects average USD-TRY at very low levels, namely 5.6 in 2018 and 6.0 in 2019.
October 2018
UniCredit Research page 11 See last pages for disclaimer.
September 2018 CEE Macro & Strategy Research
CEE Quarterly
In this risk scenario, inflation is likely to fall towards 15% by the end of next year and stay in double digits at least until mid-2020, despite the deep, protracted recession.
INFLATION IS EXPECTED TO REMAIN ABOVE TARGETS IN 2019
Chart 11: Inflation forecasts Chart 12: Turkey needs an IMF agreement to stabilize the currency
0
5
10
15
20
25
30
0
1
2
3
4
5
6
BH PL HR SI CZ SK RS BG HU RO RU TR(rs)
UA(rs)
2017 2018F 2019Fyoy (%)
-4
0
4
8
12
16
20
24
28
Baseline (IMF) Risk (no IMF)
Annual inflation (eop, %)TRY depreciation (vs USD, %)Repo rate (%, eop)
UniCredit 2019 forecasts
Source: Eurostat, statistical offices, CBRT, UniCredit Research
5. Central banks: between complacency and forced action CBRT to hike to 27% this year… …and cut sharply in 2019 if the government brings in the IMF One more hike to 7.75% in Russia… …and a hawkish stance until inflation returns to target NBH, NBP and NBR expected to remain on hold in 2018-19…
Facing a sharp rise in inflation and capital outflows, the CBRT will be the busiest CEE central bank in 4Q18 and throughout 2019. We expect another hike to 27% before year-end, whether the government moves to secure an IMF agreement or not. If the country can rely on IMF funding, sharp disinflation from 2Q19 onwards would allow the CBRT to cut the repo rate to around 12% by the end of next year. If the government does not receive support from international financial institutions, the policy rate may have to stay close to 25% throughout next year and the central bank could be forced to impose capital controls in order to slow outflows and TRY depreciation. Whatever the path chosen by Turkish authorities, the CBRT will need the support of other public policies in order to stabilize inflation and the currency.
The CBR’s recent hawkish turn is unlikely to soften for as long as inflation threatens to remain above target. In fact, the CBR may deliver another rate hike to 7.75% before year-end to help anchor inflation expectations. Besides cost-push shocks, the central bank is concerned with the rise in core inflation and easing financial conditions. The CBR’s own measure of core inflation has been accelerating since May and is now above 4%. A measure that excludes the impact of FX is rising as well, although is yet to exceed the target. The central bank fears that inflation expectations may flare up following exogenous shocks, driving core inflation away from target for longer. In addition, looser financial conditions helped private sector credit growth to accelerate this year to double digits, fueling pressure on consumer and real estate prices.
When judging its monetary policy stance, the CBR is also reassessing the risk premium attached to RUB financial assets. In the opinion of Russian policymakers, the risk of additional sanctions may not be fully priced in, meaning that the real neutral interest rate could exceed the current assessment of 3%. The CBR’s decision to defend hard-won disinflation contrasts with the reactive approach to monetary policy of most EU-CEE (and EM) central banks.
With inflation likely to stay inside target ranges, we now expect the NBH, the NBP and the NBR to remain on hold this year and next. Assuming the ECB does not increase its deposit rate above 0% in 2019, all three central banks may achieve this goal, albeit at different costs.

October 2018
UniCredit Research page 12 See last pages for disclaimer.
September 2018 CEE Macro & Strategy Research
CEE Quarterly
…at the cost of more FX and interest rate volatility in Hungary… …a weaker PLN than previously expected…
…and interbank rates 0.5-1pp higher than the policy rate in Romania
Three more rate increases expected from the CNB
The NBH cleaned up its toolbox in September but kept its dovish bias intact. The Hungarian central bank is keen to revive SME lending and, by keeping short-term interest rates low, it is willing to accept higher interest and exchange rate volatility in return. The NBH benefits from a large extended basic balance (EBB) that it can either recycle into more HUF liquidity or leave on the market to support the HUF in times of stress.
We have changed our forecast for the NBP and now see the policy rate at 1.50% until the end of 2019, assuming that Polish inflation will remain below 3% and eurozone inflation around 1.5% for most of next year. This forecast is consistent with a higher path for EUR-PLN than in previous forecasts, despite the PLN being undervalued compared to peers when adjusted with unit labor costs.
The NBR almost announced the end of rate hikes in August. In its attempt to fulfill a double mandate (meeting the inflation target and keeping interest rates and the exchange rate in check), the Romanian central bank is likely to prioritize the latter. The NBR is hoping that inflation will return to the target range as domestic demand slows. However, the weakening EBB may require further FX interventions – and reserve depletion – to keep EUR-RON in check at a time when risk appetite for EM remains volatile. As a result, interbank interest rates could fluctuate between 3% and 3.5%, equivalent to 2-4 implicit rate hikes.
While the ECB could remain moderately dovish in 2019, the external environment may threaten the inflation targeting mandates of EU-CEE central banks in 2019 and beyond. Their complacency may pay off in 2019, but the risk of sharper rate hikes increases in 2020 if core inflation continues to rise towards the end of the business cycle.
The CNB, the only proactive central bank in EU-CEE, may add another 25bp to its key rate this year, followed by 50bp in 2019. While the risk of missing the inflation target is in line with the rest of central Europe, the CNB is also mindful of its financial stability mandate and is trying to cool off lending to prevent an unsustainable rise in house prices and offset the impact of tighter labor market conditions on household income and inflation.
The NBS is following in the footsteps of dovish central European central banks, remaining on hold while reflation continues. We expect the Serbian central bank to keep policy rates unchanged this year and next. However, pressure on the RSD could force it to hike sooner if there are outflows from portfolio investment and FDI fail to cover the C/A deficit.
CENTRAL BANKS POSTPONE TIGHTENING WHERE INFLATION IS INSIDE THE TARGET RANGE
Chart 13: Hikes expected in Czechia, Russia and Turkey… Chart 14: … but not elsewhere due to stable inflation in 2019
0
4
8
12
16
20
24
28
32
36
0
1
2
3
4
5
6
7
8
9
HU PL CZ RO RS RU UA (rs) TR (rs)
2018 Policy rate (eop) 2019 Policy rate (eop)
2018 3M interbank rate (Dec avg) 2019 3M interbank rate (Dec avg)%
-4.0
-3.0
-2.0
-1.0
0.0
1.0
2.0
3.0
4.0
5.0
6.0
Dec-15 Jun-16 Dec-16 Jun-17 Dec-17 Jun-18 Dec-18 Jun-19 Dec-19
HU inflation PL inflationRO inflation HU targetHU upper target limit PL & RO targetPL & RO upper target limit
yoy (%)
Forecasts from UniCredit Source: Eurostat, central banks, statistical offices, UniCredit Research

October 2018
UniCredit Research page 13 See last pages for disclaimer.
September 2018 CEE Macro & Strategy Research
CEE Quarterly
6. Markets outlook: limited attractiveness beyond payers Outflows from EM likely to continue, with temporary relief rallies possible The crisis in Turkey increases the probability of outflows from the rest of CEE
CEE bonds will be affected by significant macroeconomic risks in Turkey… …heavy positioning in Russia and Czechia… …large financing needs in Hungary and Romania…
Emerging markets will struggle to attract portfolio flows as long as US monetary policy will be tightened further. Our DM economists expect the Fed to stop hiking next summer, with the Fed funds rate peaking at 2.75-3% due to growing risks of an economic slowdown in the US. EM may find a temporary sweet spot with renewed capital inflows between the end of Fed hikes and the moment economic growth falls significantly below potential in the US. However, this may prove just a temporary respite in a longer cycle of portfolio outflows from EM.
We expect capital flows to continue in 4Q18, although the pace may slow compared to the summer. While lower risk aversion could encourage differentiation, CEE may not be immune, as mentioned in the special topic article “The drivers of EM capital flows”. Turkey’s currency crisis increases the probability of portfolio outflows from other countries in the region, even though they face far smaller macroeconomic imbalances, have better ratings and limited financial ties to Turkey. We find several pressure points throughout the region.
1. Significant macroeconomic risks. Turkish financial assets remain off limits, despite valuations looking attractive by now. While the release of Mr. Brunson may lead to a relief rally, large financing needs would eventually require an IMF agreement to ensure lasting performance. A good entry point would be Turkey’s opening of talks with international financial institutions thanks to the prospect of a more stable currency and falling interest rates and inflation from 2Q19 onwards.
2. Large overweights in foreign investor portfolios at risk of being wound down further. All CEE countries have seen the share of foreign bond ownership fall in recent months. However, Russia stands out, as foreign investors trimmed their holdings of OFZ by 13pp (in total fixed-coupon OFZ) since the beginning of the year. OFZ cheapened significantly over the summer and look very attractive from a valuation point of view, but the specter of additional sanctions could prevent a rally before year-end or later if the US threatens Russia with further restrictions.
The other country with large but falling foreign holdings of local-currency bonds is Czechia. Positioning is lighter than last year, but some investors may wait for the currency to appreciate more before closing their positions. With the central bank expected to hike again, the short-end of the curve is likely to sell off further. Meanwhile, local pension and investment funds will continue to support the long end, which outperformed the rest of the curve this year, despite tight valuation.
3. Significant financing needs before year-end. Hungary and Romania stand out, albeit for different reasons. In Hungary, spending on EU-funded projects has not been matched by disbursements and the Debt Management Agency will have to increase issuance to cover the gap. As a result, we expect pressure on both the short and the long end of the HGB curve, with a stronger correction likely in the shorter tenors. After widening more than other bonds, 5Y HGBs look the most attractive on the curve and more attractive than regional peers if the FX risk is hedged.
The cash budget deficit will exceed official forecasts in Romania as well, but due to larger-than-expected wage expenditure combined with disappointing revenue growth. That said, a sharp drop in inflation and an implicit FX hedge from central bank interventions will support ROMGBs in 4Q18 and at the beginning of 2019.
Foreign issuance can alleviate pressure on local issuance. After Hungary sold a 7Y bond for EUR 1bn, Romania is expected to follow suit, targeting around EUR 2bn.

October 2018
UniCredit Research page 14 See last pages for disclaimer.
September 2018 CEE Macro & Strategy Research
CEE Quarterly
…and limited rally potential in Poland and Serbia
4. Limited rally potential. POLGBs are well cushioned by small financing needs and large fiscal reserves. Moreover, the spread to Bunds is close to post-2009 levels and it can absorb small shocks in German yields. Yet besides meager appetite from foreign investors, POLGBs are also under pressure from currency volatility and a likely rise in inflation in 1Q19. The gradual return of demand from defined-contribution pension funds will support demand for POLGBs from 2H19 onwards.
Serbia concluded successfully the sale of 5Y and 10Y benchmark bonds. However, an illiquid secondary market and rising inflation will weigh on appetite.
OUTFLOWS FROM EM BONDS LED TO HIGHER YIELDS
Chart 15: Investors have been trimming their exposure to OFZ Chart 16: EM real yields have risen in reaction to low risk appetite
0
10
20
30
40
50
60
Dec-11 Sep-12 Jun-13 Mar-14 Dec-14 Sep-15 Jun-16 Mar-17 Dec-17
Foreign holdings of OFZ (% of marketable debt)Foreign holdings of OFZ (% of fixed-coupon OFZ)
-0.3
-0.2
-0.1
0.0
0.1
0.2
0.3
0.4
0.5
CZ MY KR RS HU PL PH MX SA TR IL RU TH ID BR RO
Current 1 year ago10Y real bond yield / 1y FX implied volatility (vs USD)
Source: CBR, Bloomberg, UniCredit Research
FX issuance limited to Romania and maybe Czechia and Poland ROMANI EUR are the most attractive EUR bonds in the region RUSSIA FX bonds likely to underperform ahead of sanctions Payers attractive in Czechia and Hungary… …FX forwards attractive in Romania
Besides Romania, only Poland and Czechia may tap the Eurobond market in 4Q18, the former if it wants to prefinance more of next year’s maturities. According to Ministry of Finance representatives, a EUR bond is more attractive than a USD one at the moment.
In the credit universe, we continue to prefer ROMANI EUR long-end bonds to regional peers. Even with a poorer fiscal outlook, Romania’s overall financing needs remain much smaller than in Hungary, Croatia or Poland, although ROMANI EUR yields now trade outside all regional peers. ROMANI EUR also trades outside ROMANI USD with longer maturities, with the Z-spread of ROMANI EUR 2035 more than 35bp higher than that of ROMANI USD 2048.
While RUSSIA USD and EUR bonds look attractive after the selloff, they could widen further if the next round of sanctions targets new issuance. That may prove an attractive buying opportunity provided that the threat of further restrictions falls sharply.
We continue to favor payers in CZK rates in the 3-5Y segment, with the 2Y having too big a rolldown. Payers in short-term HUF rates could perform better than in the belly if liquidity conditions tighten towards year-end. In contrast, we see limited scope for PLN rates to rise if the NBP remains on hold throughout next year, with the FRA curve pricing in less than one hike in the next 15 months. In Romania, FX forwards may be more attractive whenever EUR-RON falls towards the lower limit of the 4.60-70 range and short-term rates are around 3%. A better entry point could come at the start of next year, when RON rates may fall due to a larger liquidity surplus driven by public spending.

October 2018
UniCredit Research page 15 See last pages for disclaimer.
September 2018 CEE Macro & Strategy Research
CEE Quarterly
The drivers of EM capital flows Daniel Vernazza, Ph.D., Chief UK & Senior Global Economist (UniCredit Bank, London) +44 207 826-7805 [email protected]
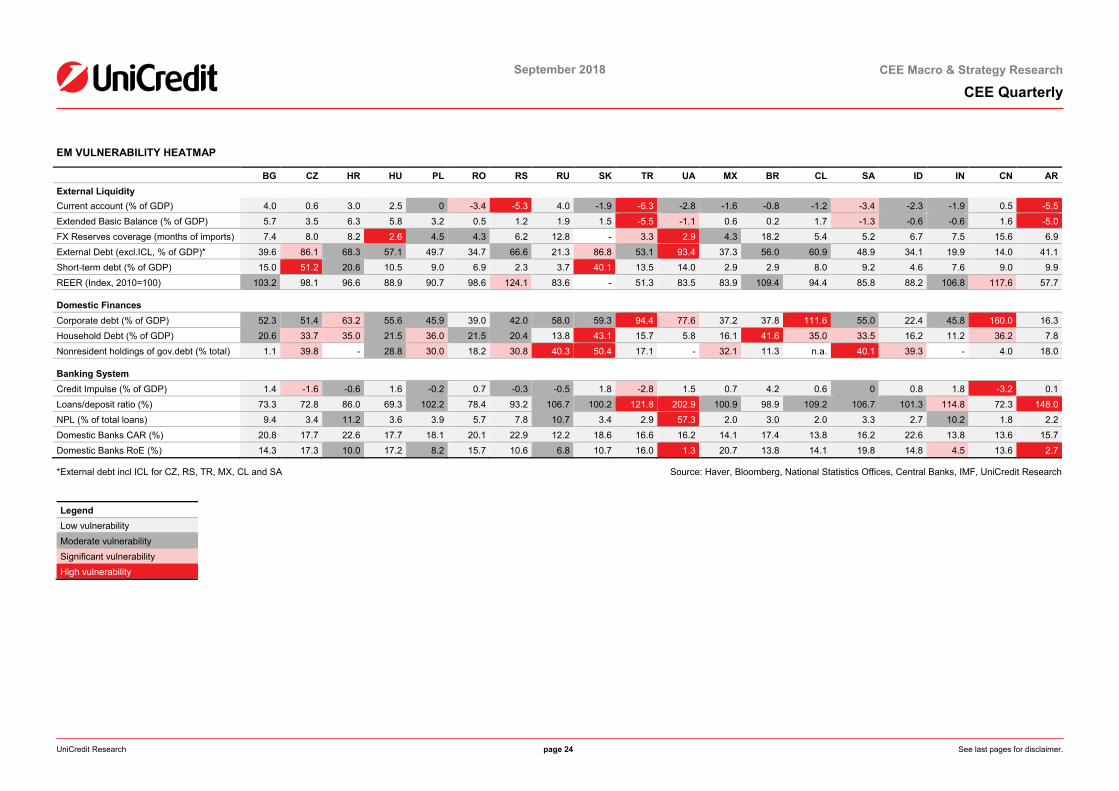
■ Several EM have experienced large falls in the value of their currencies in recent months, including Turkey, Argentina, and South Africa. This is the largely predictable result of weak fundamentals and large imbalances. The fear, however, is that contagion could result in otherwise healthy EM economies coming under pressure.
■ In this theme piece, we analyze the drivers of EM capital flows for a sample of 58 emerging and developed economies from 1Q86-2Q18. The long time series allows us to look at past EM crises such as the 1995 Mexican devaluation and the 1997 East Asian financial crisis.
■ Our main findings are: (1) Episodes of large foreign capital outflows are preceded by episodes of large capital inflows, with a lead of around three years; (2) Among domestic drivers of capital flows, large current account deficits are an important driver of both capital “stop” and “flight” episodes, creating the perfect storm; (3) Global factors are important in explaining large shifts in capital flows: for example, “stops” in foreign capital inflows are explained by higher risk aversion, tighter global monetary policy, and a stronger dollar; (4) Geographical contagion is extremely important in “stop” episodes; and (5) Domestic vulnerabilities in EM are more isolated this time around compared to in the lead up to the 1997 Asian financial crisis.
■ Our model predicts that the probability of Turkey experiencing the perfect storm of a “stop” and “flight” episode is below 20%. The main reason is that the global backdrop is still supportive. However, the outlook is less favorable: the major central banks are tightening monetary policy and the risks to global growth are skewed to the downside. Therefore, EM is likely to remain under pressure.
1. EM capital flow episodes
We look at past episodes of large capital inflows and outflows Our sample includes major EM crises
Several EM have experienced large falls in the value of their currencies in recent months, including Turkey, Argentina, and South Africa. This is the largely predictable result of weak fundamentals and large imbalances in these countries (see our heat map on page 24-25), as well as a less supportive global backdrop.
However, while weak fundamentals and large imbalances increase the vulnerability to capital outflows and “sudden stops”, it typically does not pinpoint the exact timing of a crisis. Indeed, the warning lights have been “flashing red” for the countries under pressure for some time. Also, the trigger for a crisis can differ: for example, the Turkey situation is different from Argentina, but there are factors that are common to both (e.g. large current account deficits). And, while this time around the imbalances are not generalized across EM, this does not mean that all is necessarily fine. Contagion effects can cause even healthy economies to come under pressure, through trade and financial linkages, or through a generalized selloff due to sentiment and/ or a liquidity squeeze.
In this theme piece, we seek to identify the triggers of episodes of large capital inflows and outflows by looking at the past. We look at a range of factors including global, domestic, and contagion factors. Our sample consists of 31 emerging markets and 27 developed economies from 1Q86-2Q18.10
10The sample includes 31 emerging markets (Argentina, Bangladesh, Bolivia, Brazil, Chile, Colombia, Croatia, Czech Republic, Estonia, Guatemala, Hungary, India, Indonesia, Latvia, Lithuania, Malaysia, Mexico, Nicaragua, Panama, Peru, Philippines, Poland, Romania, Russia, Slovakia, Slovenia, South Africa, Sri Lanka, Thailand, Turkey and Venezuela) and 27 developed economies (Australia, Austria, Belgium, Canada, Denmark, Finland, France, Germany, Greece, Hong Kong, Iceland, Ireland, Israel, Italy, Japan, Korea, Luxembourg Netherlands, New Zealand, Norway, Portugal, Singapore, Spain, Sweden, Switzerland, UK and US).

October 2018
UniCredit Research page 16 See last pages for disclaimer.
September 2018 CEE Macro & Strategy Research
CEE Quarterly
4 types of capital flow episodes: “surge”, “stop”, “flight”, and “retrench” “Surge” episodes precede “stop” episodes Capital flight
The sample includes major EM crises such as the 1995 Mexican devaluation and the 1997 East Asian financial crisis. The data on gross capital flows are from the IMF’s IFS database and is the sum of direct investment, portfolio flows and other flows. To begin with, we follow Forbes & Warnock (2011)11 and define 4 types of capital flow episodes:12
“SURGE”: a large capital inflow by foreigners
“STOP”: a large capital outflow by foreigners
“FLIGHT”: a large capital outflow by domestic residents
“RETRENCH”: a large capital inflow by domestic residents
Charts 1 and 2 display the share of EM countries in our sample experiencing each of the four types of episodes since 1Q86. “Stop” episodes occurred in the mid-1990s (the 1995 Mexican devaluation), late 1990s (the 1997 Asian financial crisis), and around the time of global recessions (early 90s, 2001 and the 2008/9 Global Financial Crisis). Interestingly, the share of “surge” episodes tends to lead the share of “stop” episodes, creating a boom-bust cycle. This is confirmed by formal statistical tests,13 and the maximum correlation occurs when “surge” episodes are lagged by three years (the correlation coefficient is a high 0.61). Ominously, the number of “surge” episodes increased in 2H14-1H16, perhaps sowing the seeds for the onset of the “stop” episodes now.
“Retrench” episodes tend to correlate well with “stop” episodes, which act as a stabilizing mechanism for EM countries as domestic residents repatriate capital at times when foreigners are withdrawing capital. The cyclical properties of “flight” episodes seem less clear cut: “flight” episodes spiked during EM-specific crises (1995 Mexican devaluation and the 1997 East Asian crisis), but dropped during the 2008/9 Global Financial Crisis.
CHART 1: OCCURRENCE OF ”SURGE” AND “STOP” EPISODES
CHART 2: OCCURRENCE OF “FLIGHT” AND “RETRENCH” EPISODES
0
0.1
0.2
0.3
0.4
0.5
0.6
0.7
0.8
1986 1990 1994 1998 2002 2006 2010 2014 2018
"Surge" "Stop"Share of EM countries in an episode
0
0.1
0.2
0.3
0.4
0.5
0.6
0.7
0.8
1986 1990 1994 1998 2002 2006 2010 2014 2018
"Flight" "Retrench"Share of EM countries in an episode
Source: IMF, UniCredit Research
11Forbes, Kristin J. & Warnock, Francis E. (2012), "Capital flow waves: Surges, stops, flight, and retrenchment," Journal of International Economics, Vol. 88(2), pp. 235-251. 12More specifically, a “surge” episode is defined as a period in which gross capital inflows exceed one (20-year rolling) standard deviation above their (20-year rolling) mean and two standard deviations above its (rolling) mean for at least one quarter of the period. A “stop” episode is defined as a period in which gross capital inflows exceed one (20-year rolling) standard deviation below their (20-year rolling) mean and two standard deviations below its (rolling) mean for at least one quarter of the period. “Flight” and “Retrench” episodes are defined analogously but for gross capital outflows. In all cases, an episode is only classified as such if it lasts for at least two consecutive quarters. 13A Granger causality test rejects the null hypothesis that the fraction of “surge” episodes does not Granger cause the fraction of “stop” episodes, while we cannot reject the null hypothesis that the fraction of “stop” episodes does not Granger cause the fraction of “surge” episodes. In other words, we can conclude that “surge” episodes come before “stop” episodes in time and not the other way around.
October 2018
UniCredit Research page 17 See last pages for disclaimer.
September 2018 CEE Macro & Strategy Research
CEE Quarterly
Descriptive statistics by episode
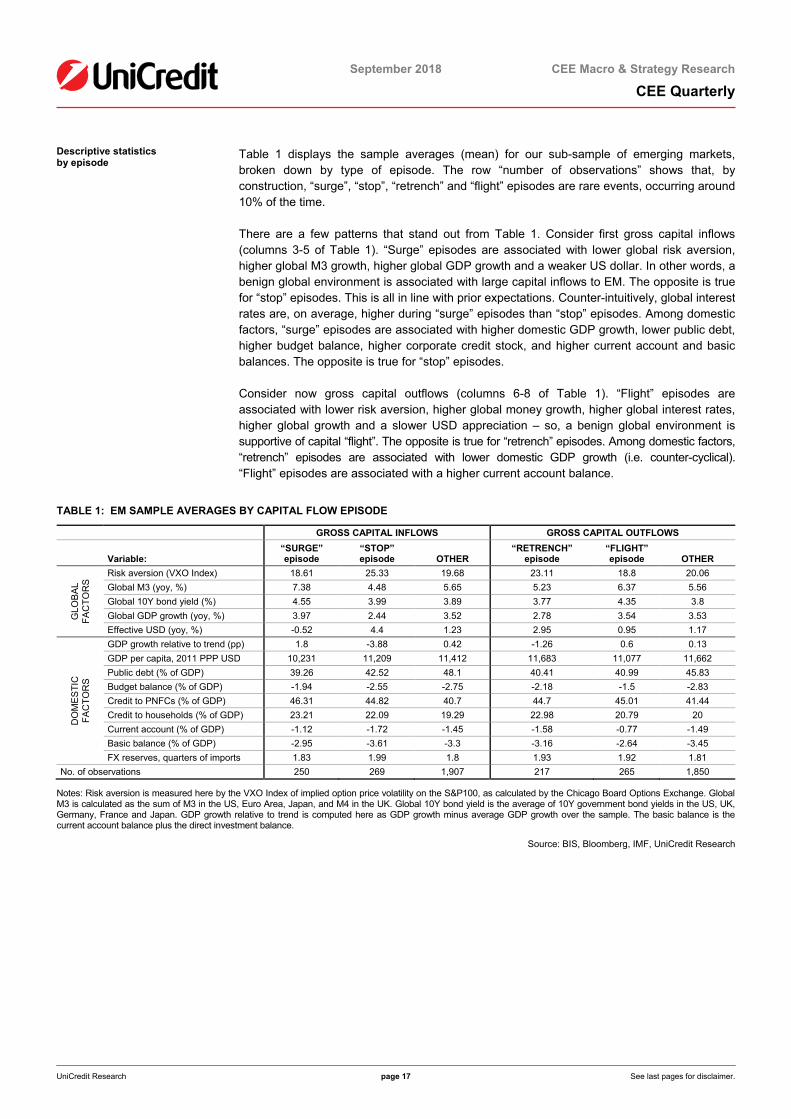
Table 1 displays the sample averages (mean) for our sub-sample of emerging markets, broken down by type of episode. The row “number of observations” shows that, by construction, “surge”, “stop”, “retrench” and “flight” episodes are rare events, occurring around 10% of the time.
There are a few patterns that stand out from Table 1. Consider first gross capital inflows (columns 3-5 of Table 1). “Surge” episodes are associated with lower global risk aversion, higher global M3 growth, higher global GDP growth and a weaker US dollar. In other words, a benign global environment is associated with large capital inflows to EM. The opposite is true for “stop” episodes. This is all in line with prior expectations. Counter-intuitively, global interest rates are, on average, higher during “surge” episodes than “stop” episodes. Among domestic factors, “surge” episodes are associated with higher domestic GDP growth, lower public debt, higher budget balance, higher corporate credit stock, and higher current account and basic balances. The opposite is true for “stop” episodes.
Consider now gross capital outflows (columns 6-8 of Table 1). “Flight” episodes are associated with lower risk aversion, higher global money growth, higher global interest rates, higher global growth and a slower USD appreciation – so, a benign global environment is supportive of capital “flight”. The opposite is true for “retrench” episodes. Among domestic factors, “retrench” episodes are associated with lower domestic GDP growth (i.e. counter-cyclical). “Flight” episodes are associated with a higher current account balance.
TABLE 1: EM SAMPLE AVERAGES BY CAPITAL FLOW EPISODE
GROSS CAPITAL INFLOWS GROSS CAPITAL OUTFLOWS
Variable: “SURGE” episode
“STOP” episode OTHER
“RETRENCH” episode
“FLIGHT” episode OTHER
GLO
BA
L FA
CTO
RS
Risk aversion (VXO Index) 18.61 25.33 19.68 23.11 18.8 20.06 Global M3 (yoy, %) 7.38 4.48 5.65 5.23 6.37 5.56 Global 10Y bond yield (%) 4.55 3.99 3.89 3.77 4.35 3.8 Global GDP growth (yoy, %) 3.97 2.44 3.52 2.78 3.54 3.53 Effective USD (yoy, %) -0.52 4.4 1.23 2.95 0.95 1.17
DO
ME
STI
C
FAC
TOR
S
GDP growth relative to trend (pp) 1.8 -3.88 0.42 -1.26 0.6 0.13 GDP per capita, 2011 PPP USD 10,231 11,209 11,412 11,683 11,077 11,662 Public debt (% of GDP) 39.26 42.52 48.1 40.41 40.99 45.83 Budget balance (% of GDP) -1.94 -2.55 -2.75 -2.18 -1.5 -2.83 Credit to PNFCs (% of GDP) 46.31 44.82 40.7 44.7 45.01 41.44 Credit to households (% of GDP) 23.21 22.09 19.29 22.98 20.79 20 Current account (% of GDP) -1.12 -1.72 -1.45 -1.58 -0.77 -1.49 Basic balance (% of GDP) -2.95 -3.61 -3.3 -3.16 -2.64 -3.45 FX reserves, quarters of imports 1.83 1.99 1.8 1.93 1.92 1.81
No. of observations 250 269 1,907 217 265 1,850
Notes: Risk aversion is measured here by the VXO Index of implied option price volatility on the S&P100, as calculated by the Chicago Board Options Exchange. Global M3 is calculated as the sum of M3 in the US, Euro Area, Japan, and M4 in the UK. Global 10Y bond yield is the average of 10Y government bond yields in the US, UK, Germany, France and Japan. GDP growth relative to trend is computed here as GDP growth minus average GDP growth over the sample. The basic balance is the current account balance plus the direct investment balance.
Source: BIS, Bloomberg, IMF, UniCredit Research

October 2018
UniCredit Research page 18 See last pages for disclaimer.
September 2018 CEE Macro & Strategy Research
CEE Quarterly
2. Identifying the drivers Regression analysis Contagion effects
“Surge” regression results
In order to move beyond the purely descriptive analysis above and towards quantifying the statistical and economic significance of factors driving capital flows, we will use regression analysis. We create indicator variables for each type of episode (“surge”, “stop”, “flight” and “retrench”) that take the value 1 if the country is experiencing that episode and 0 otherwise. We then regress the episode indicator variable on the set of global and domestic explanatory variables listed in Table 1.14
In addition, we also control for contagion effects in two ways: an indicator variable that takes the value 1 for country i if any other country j≠i located in the same geographic region15 as country i is experiencing an episode; and a variable to capture trade linkages for country i with those countries experiencing an episode, computed as the share of country i’s exports to countries experiencing an episode, expressed as a percent of country i’s nominal GDP. We perform the regression analysis for each type of episode in turn. All explanatory variables are lagged by one quarter to mitigate reverse causality.
Table 2 presents the regression output for the odds of a “surge” episode in our sub-sample of 31 EM countries. For explanatory purposes, the marginal effects reported in the table are expressed as an odds ratio that tells us how the ratio of the probability of a “surge” episode to the probability of no surge episode changes for a one-unit increase in the explanatory variable. Therefore, a value less than 1 means that the odds of a “surge” episode decrease as the explanatory variable increases, while a value greater than 1 means that the odds of a “surge” episode increase as the explanatory variable increases.
TABLE 2: ESTIMATING THE ODDS OF A “SURGE” EPISODE FOR EM COUNTRIES
DEPENDENT VARIABLE: “SURGE” DUMMY Variable: (1) (2) (3) (4)
GLO
BA
L FA
CTO
RS
Risk aversion (VXO Index) 0.95*** 0.95*** 1.00 1.01 Global M3 (yoy, %) 1.03*** 1.01 1.06** 1.04* Global 10Y bond yield (%) 1.13* 1.19** 1.16 1.18 Global GDP growth (yoy, %) 1.49*** 1.39*** 1.50*** 1.36** Effective USD (yoy, %) - 0.95* - -
DO
ME
STI
C
FAC
TOR
S
GDP growth relative to trend (pp) - - 1.06* 1.06* Public debt (% of GDP) - - 0.99 0.99 Budget balance (% of GDP) - - 1.34*** 1.27*** Current account (% of GDP) - - 0.98 0.98 FX reserves, quarters of imports - - 0.66 0.69
CO
NTA
GIO
N
FAC
TOR
S Geographical contagion - - - 1.63
Trade linkage - - 1.05***
Country dummies YES YES YES YES No. of observations 2,185 2,185 1,329 1,329
Notes: The table reports the odds ratio of the probability of a “surge” over the probability of no surge. Standard errors (not reported) are clustered at the country level. *** denotes statistical significance at the 1% level, ** significance at the 5% level, * significance at the 10% level. “Geographical contagion” is a dummy variable that takes the value 1 for country i at time t if another country j located in the same geographic region as country i is experiencing a “surge” episode at time t. “Trade linkage” for country I at time t is the share of country i’s exports to countries experiencing a “surge” episode at time t, expressed as a percent of country i’s GDP.
Source: UniCredit Research
14 The regression assumes the dependent variable has a cloglog distribution. 15 The regions are North America, Latin America, Western Europe, Eastern Europe, Asia and other. The other category includes just 2 countries: Israel and South Africa.
October 2018
UniCredit Research page 19 See last pages for disclaimer.
September 2018 CEE Macro & Strategy Research
CEE Quarterly
Column (1) of Table 2 shows the results when controlling only for global factors (risk aversion, M3 growth, 10Y yields, and GDP growth) and a full set of country dummies. The global factors are all statistically significant and, with the exception of 10Y bond yields, have the expected sign. More specifically, a 1 index point drop in the VXO index (i.e. lower risk aversion) increases the odds of a “surge” episode by 5%; a 1pp. rise in global M3 growth increases the odds of a “surge” episode by 3%; and a 1pp. rise in global real GDP growth increases the odds of a “surge” by almost 50%. Counterintuitively, global 10Y bond yields are positively associated with the odds of a “surge”, but the statistical significance is weak.
The estimates in column (2) additionally control for the growth rate of the effective US dollar index. The US dollar is statistically significant at the 10% level and a 1pp. depreciation of the dollar is associated with a 5% rise in the odds of a “surge” episode. However, controlling for the US dollar knocks out the significance of M3 growth, reflecting their strong negative correlation of -0.64.
Column (3) adds a number of domestic variables as additional controls. Only domestic GDP growth relative to its trend and the budget balance (as a % of GDP) are statistically significant. Also note that global risk aversion is no longer statistically significant after controlling for the domestic factors.
The final column of Table 2 adds the two controls for contagion effects: geographical and trade linkages. The geographical contagion variable is not statistically significant. The trade linkage variable is statistically significant with the expected sign; more specifically, a 1pp. increase in the share of exports with countries experiencing a “surge” episode increases the odds of experiencing a “surge” by 5%.
TABLE 3: ESTIMATING THE ODDS OF A “STOP” EPISODE FOR EM COUNTRIES
DEPENDENT VARIABLE: “STOP” DUMMY Variable: (1) (2) (3) (4)
GLO
BA
L FA
CTO
RS
Risk aversion (VXO Index) 1.04*** 1.03*** 1.06*** 1.04*** Global M3 (yoy, %) 0.97*** 1.00 0.99 0.98 Global 10Y bond yield (%) 1.04 0.99 0.95 0.96 Global GDP growth (yoy, %) 0.80*** 0.81*** 0.98 1.08 Effective USD (yoy, %) - 1.05** - -
DO
ME
STI
C
FAC
TOR
S
GDP growth relative to trend (pp) - - 0.88*** 0.90*** Public debt (% of GDP) - - 1.00 1.00 Budget balance (% of GDP) - - 1.04 1.06 Current account (% of GDP) - - 0.86*** 0.86*** FX reserves, quarters of imports - - 1.21 1.17
CO
NTA
GIO
N
FAC
TOR
S Geographical contagion - - - 2.93***
Trade linkage - - - 1.03
Country dummies YES YES YES YES No. of observations 2,396 2,396 1,411 1,395
Notes: The table reports the odds ratio of the probability of a “stop” over the probability of no stop. Standard errors (not reported) are clustered at the country level. *** denotes statistical significance at the 1% level, ** significance at the 5% level, * significance at the 10% level. “Geographical contagion” is a dummy variable that takes the value 1 for country i at time t if another country j located in the same geographic region as country i is experiencing a “stop” episode at time t. “Trade linkage” for country I at time t is the share of country i’s exports to countries experiencing a “stop” episode at time t, expressed as a percent of country i’s GDP.
Source: UniCredit Research

October 2018
UniCredit Research page 20 See last pages for disclaimer.
September 2018 CEE Macro & Strategy Research
CEE Quarterly
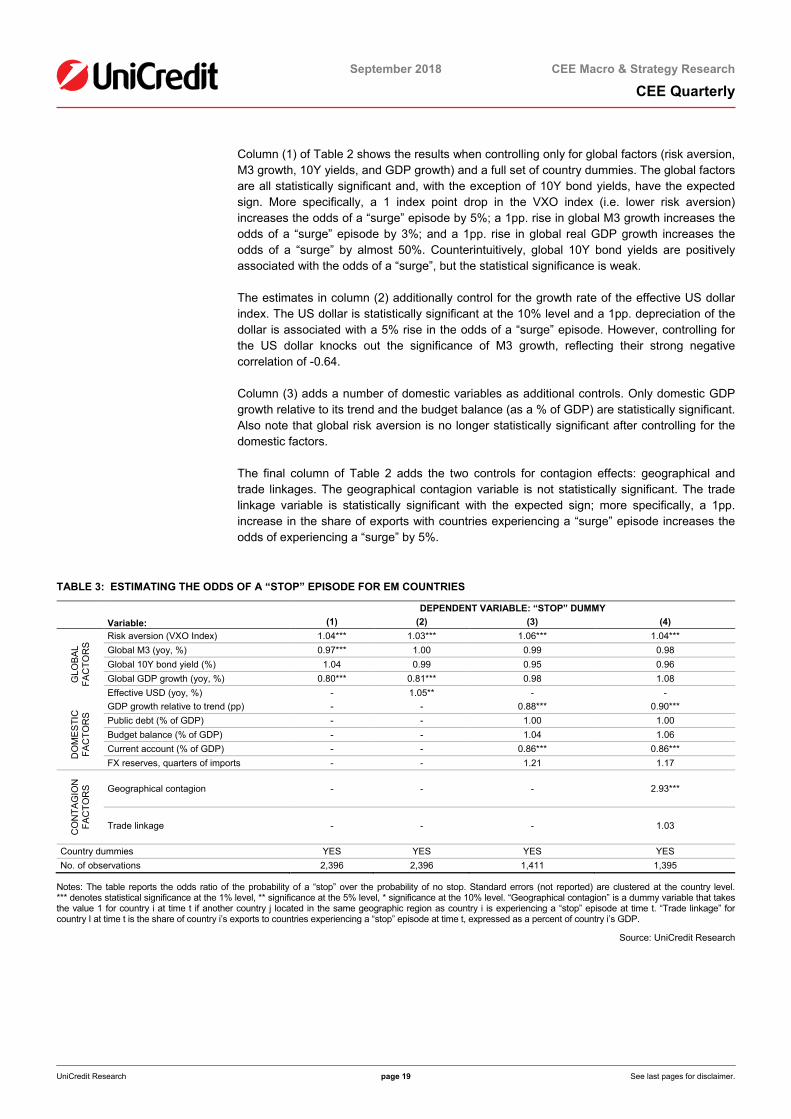
“Stop” regression results The current account matters
The focus of EM investors is often on “stop” episodes, because of the deeply negative impact such episodes have on the economy of an EM country. Table 3 displays the regression results for the factors driving “stop” episodes.
Column (1) shows that “stop” episodes are positively related to risk aversion, and negatively related to global M3 growth and global GDP growth. As expected, column (2) shows that US dollar appreciation increases the odds of a “stop” episode, and again it knocks-out the statistical significance of global M3 growth. Therefore, the recent appreciation of the US dollar, particularly since April, has increased the probability of “stop” episodes in EM.
The domestic factors in column (3) that are statistically significant are domestic GDP growth and the current account. They are economically significant too: a 1pp. drop in GDP growth increases the odds of a “stop” episode by 12%, and a 1pp. decrease in the current account balance (as a % of GDP) increase the odds of a “stop” by 14%. Controlling for the domestic factors knocks-out the statistical significance of global M3 growth, but the economic significance of global risk aversion increases and remains statistically significant. Finally, and importantly, the estimates in column (4) show that geographical contagion is an important factor in explaining “stop” episodes, but trade linkages are not. If another country in the same region experiences a “stop” episode, then it increases the odds of experiencing a “stop” by 3 times.
Charts 3 and 4 plot the fitted probability of a “stop” episode for Turkey and Argentina, respectively, from 1Q91 onwards. For Turkey, the model does a reasonable job of explaining “stop” episodes: it can explain the stops in 1995 and 2008-9 but struggles to explain the 2001 stop. For Argentina, the model explains correctly both the “stop” episodes in 2001-02 and 2008-09.
Our model predicts that the probability of Turkey experiencing the perfect storm of a “stop” and “flight” episode now is below 20%. There are two main reasons. First, the model captures a still benign global backdrop (the VXO Index is still relatively low, global growth still robust, and financial conditions in DM still easy) and misses the recent deterioration in Turkish macroeconomic data (the explanatory variables are lagged one quarter). Second, the sell-off in Turkey was triggered by political risks (mainly the stand-off with the US), which is not accounted for in the model.
CHART 3: PROBABILITY OF A “STOP” EPISODE IN TURKEY CHART 4: PROBABILITY OF A “STOP” EPISODE IN ARGENTINA
-0.1
0.1
0.3
0.5
0.7
0.9
1.1
1991 1994 1997 2000 2003 2006 2009 2012 2015 2018
"Stop" episode indicatorFitted value
Probability of a "stop" episode in Turkey
-0.1
0.1
0.3
0.5
0.7
0.9
1.1
1991 1994 1997 2000 2003 2006 2009 2012 2015 2018
"Stop" episode indicator
Fitted valueProbability of a "stop" episode in Argentina
Source: UniCredit Research
October 2018
UniCredit Research page 21 See last pages for disclaimer.
September 2018 CEE Macro & Strategy Research
CEE Quarterly
TABLE 4: ESTIMATING THE ODDS OF A “FLIGHT” EPISODE FOR EM COUNTRIES
DEPENDENT VARIABLE: “FLIGHT” DUMMY Variable: (1) (2) (3) (4)
GLO
BA
L FA
CTO
RS
Risk aversion (VXO Index) 0.96* 0.96* 0.97 0.97 Global M3 (yoy, %) 1.01 1.00 1.03 1.03 Global 10Y bond yield (%) 1.15*** 1.17*** 1.17 1.17* Global GDP growth (yoy, %) 0.95 0.94 0.92 0.88 Effective USD (yoy, %) - 0.99 - -
DO
ME
STI
C
FAC
TOR
S
GDP growth relative to trend (pp) - - 1.00 1.00 Public debt (% of GDP) -- - 1.00 1.00 Budget balance (% of GDP) - - 1.24*** 1.23*** Current account (% of GDP) - - 0.93* 0.93* FX reserves, quarters of imports - - 0.96 0.99
CO
NTA
GIO
N
FAC
TOR
S Geographical contagion - - - 1.11
Trade linkage - - - 1.03*
Country dummies YES YES YES YES No. of observations 2,193 2,193 1,373 1,373
Notes: The table reports the odds ratio of the probability of a “flight” over the probability of no flight. Standard errors (not reported) are clustered at the country level. *** denotes statistical significance at the 1% level, ** significance at the 5% level, * significance at the 10% level. “Geographical contagion” is a dummy variable that takes the value 1 for country i at time t if another country j located in the same geographic region as country i is experiencing a “flight” episode at time t. “Trade linkage” for country I at time t is the share of country i’s exports to countries experiencing a “flight” episode at time t, expressed as a percent of country i’s GDP.
Source: UniCredit Research
“Flight” regression results “Retrench” regression results
Domestic vulnerabilities in EM are more isolated this time
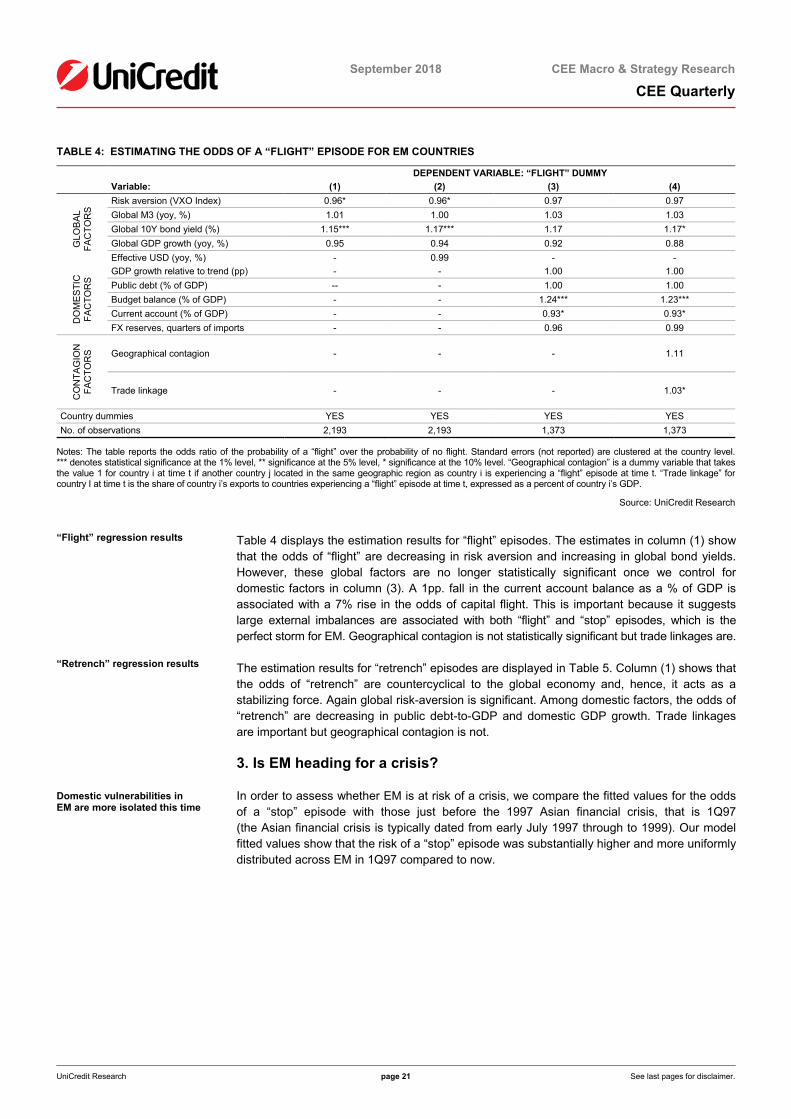
Table 4 displays the estimation results for “flight” episodes. The estimates in column (1) show that the odds of “flight” are decreasing in risk aversion and increasing in global bond yields. However, these global factors are no longer statistically significant once we control for domestic factors in column (3). A 1pp. fall in the current account balance as a % of GDP is associated with a 7% rise in the odds of capital flight. This is important because it suggests large external imbalances are associated with both “flight” and “stop” episodes, which is the perfect storm for EM. Geographical contagion is not statistically significant but trade linkages are.
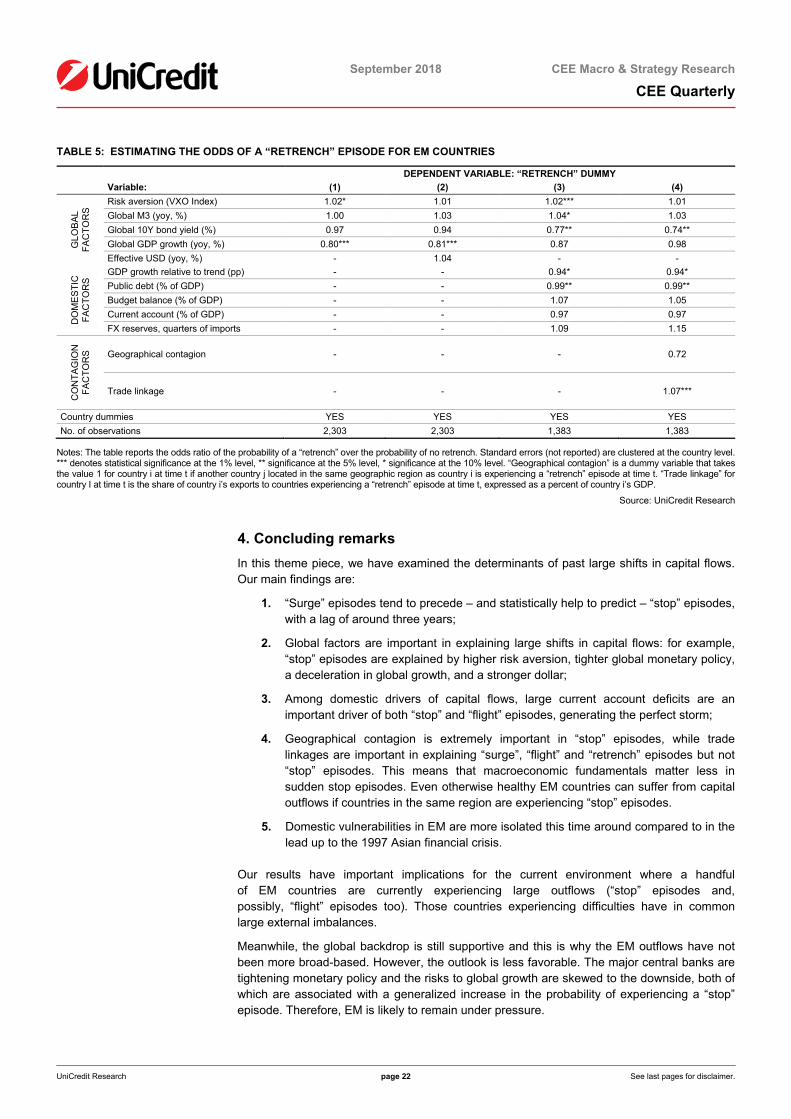
The estimation results for “retrench” episodes are displayed in Table 5. Column (1) shows that the odds of “retrench” are countercyclical to the global economy and, hence, it acts as a stabilizing force. Again global risk-aversion is significant. Among domestic factors, the odds of “retrench” are decreasing in public debt-to-GDP and domestic GDP growth. Trade linkages are important but geographical contagion is not.
3. Is EM heading for a crisis?
In order to assess whether EM is at risk of a crisis, we compare the fitted values for the odds of a “stop” episode with those just before the 1997 Asian financial crisis, that is 1Q97 (the Asian financial crisis is typically dated from early July 1997 through to 1999). Our model fitted values show that the risk of a “stop” episode was substantially higher and more uniformly distributed across EM in 1Q97 compared to now.
October 2018
UniCredit Research page 22 See last pages for disclaimer.
September 2018 CEE Macro & Strategy Research
CEE Quarterly
TABLE 5: ESTIMATING THE ODDS OF A “RETRENCH” EPISODE FOR EM COUNTRIES
DEPENDENT VARIABLE: “RETRENCH” DUMMY Variable: (1) (2) (3) (4)
GLO
BA
L FA
CTO
RS
Risk aversion (VXO Index) 1.02* 1.01 1.02*** 1.01 Global M3 (yoy, %) 1.00 1.03 1.04* 1.03 Global 10Y bond yield (%) 0.97 0.94 0.77** 0.74** Global GDP growth (yoy, %) 0.80*** 0.81*** 0.87 0.98 Effective USD (yoy, %) - 1.04 - -
DO
ME
STI
C
FAC
TOR
S
GDP growth relative to trend (pp) - - 0.94* 0.94* Public debt (% of GDP) - - 0.99** 0.99** Budget balance (% of GDP) - - 1.07 1.05 Current account (% of GDP) - - 0.97 0.97 FX reserves, quarters of imports - - 1.09 1.15
CO
NTA
GIO
N
FAC
TOR
S Geographical contagion - - - 0.72
Trade linkage - - - 1.07***
Country dummies YES YES YES YES No. of observations 2,303 2,303 1,383 1,383
Notes: The table reports the odds ratio of the probability of a “retrench” over the probability of no retrench. Standard errors (not reported) are clustered at the country level. *** denotes statistical significance at the 1% level, ** significance at the 5% level, * significance at the 10% level. “Geographical contagion” is a dummy variable that takes the value 1 for country i at time t if another country j located in the same geographic region as country i is experiencing a “retrench” episode at time t. “Trade linkage” for country I at time t is the share of country i’s exports to countries experiencing a “retrench” episode at time t, expressed as a percent of country i’s GDP.
Source: UniCredit Research
4. Concluding remarks
In this theme piece, we have examined the determinants of past large shifts in capital flows. Our main findings are:
1. “Surge” episodes tend to precede – and statistically help to predict – “stop” episodes, with a lag of around three years;
2. Global factors are important in explaining large shifts in capital flows: for example, “stop” episodes are explained by higher risk aversion, tighter global monetary policy, a deceleration in global growth, and a stronger dollar;
3. Among domestic drivers of capital flows, large current account deficits are an important driver of both “stop” and “flight” episodes, generating the perfect storm;
4. Geographical contagion is extremely important in “stop” episodes, while trade linkages are important in explaining “surge”, “flight” and “retrench” episodes but not “stop” episodes. This means that macroeconomic fundamentals matter less in sudden stop episodes. Even otherwise healthy EM countries can suffer from capital outflows if countries in the same region are experiencing “stop” episodes.
5. Domestic vulnerabilities in EM are more isolated this time around compared to in the lead up to the 1997 Asian financial crisis.
Our results have important implications for the current environment where a handful of EM countries are currently experiencing large outflows (“stop” episodes and, possibly, “flight” episodes too). Those countries experiencing difficulties have in common large external imbalances.
Meanwhile, the global backdrop is still supportive and this is why the EM outflows have not been more broad-based. However, the outlook is less favorable. The major central banks are tightening monetary policy and the risks to global growth are skewed to the downside, both of which are associated with a generalized increase in the probability of experiencing a “stop” episode. Therefore, EM is likely to remain under pressure.
October 2018
UniCredit Research page 23 See last pages for disclaimer.
September 2018 CEE Macro & Strategy Research
CEE Quarterly
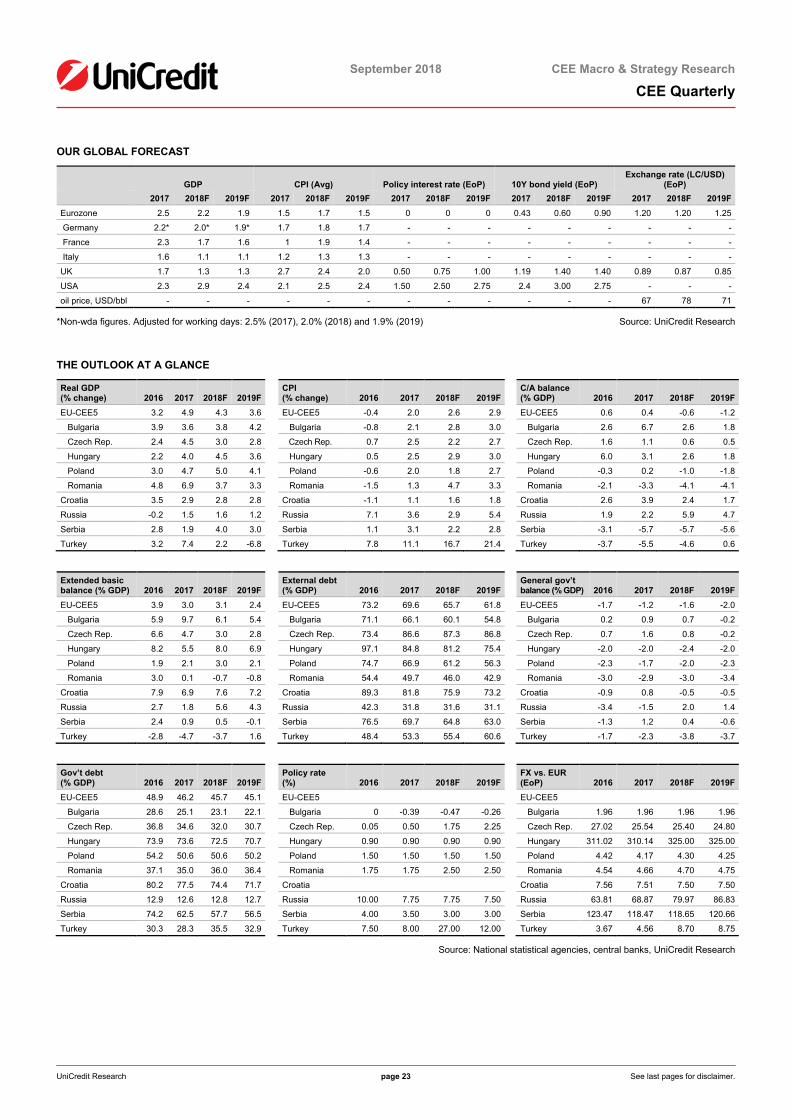
OUR GLOBAL FORECAST
GDP CPI (Avg) Policy interest rate (EoP) 10Y bond yield (EoP) Exchange rate (LC/USD)
(EoP) 2017 2018F 2019F 2017 2018F 2019F 2017 2018F 2019F 2017 2018F 2019F 2017 2018F 2019F Eurozone 2.5 2.2 1.9 1.5 1.7 1.5 0 0 0 0.43 0.60 0.90 1.20 1.20 1.25
Germany 2.2* 2.0* 1.9* 1.7 1.8 1.7 - - - - - - - - -
France 2.3 1.7 1.6 1 1.9 1.4 - - - - - - - - -
Italy 1.6 1.1 1.1 1.2 1.3 1.3 - - - - - - - - -
UK 1.7 1.3 1.3 2.7 2.4 2.0 0.50 0.75 1.00 1.19 1.40 1.40 0.89 0.87 0.85
USA 2.3 2.9 2.4 2.1 2.5 2.4 1.50 2.50 2.75 2.4 3.00 2.75 - - -
oil price, USD/bbl - - - - - - - - - - - - 67 78 71
*Non-wda figures. Adjusted for working days: 2.5% (2017), 2.0% (2018) and 1.9% (2019) Source: UniCredit Research
THE OUTLOOK AT A GLANCE
Real GDP (% change) 2016 2017 2018F 2019F
CPI (% change) 2016 2017 2018F 2019F
C/A balance (% GDP) 2016 2017 2018F 2019F
EU-CEE5 3.2 4.9 4.3 3.6
EU-CEE5 -0.4 2.0 2.6 2.9
EU-CEE5 0.6 0.4 -0.6 -1.2
Bulgaria 3.9 3.6 3.8 4.2
Bulgaria -0.8 2.1 2.8 3.0
Bulgaria 2.6 6.7 2.6 1.8
Czech Rep. 2.4 4.5 3.0 2.8
Czech Rep. 0.7 2.5 2.2 2.7
Czech Rep. 1.6 1.1 0.6 0.5
Hungary 2.2 4.0 4.5 3.6
Hungary 0.5 2.5 2.9 3.0
Hungary 6.0 3.1 2.6 1.8
Poland 3.0 4.7 5.0 4.1
Poland -0.6 2.0 1.8 2.7
Poland -0.3 0.2 -1.0 -1.8
Romania 4.8 6.9 3.7 3.3
Romania -1.5 1.3 4.7 3.3
Romania -2.1 -3.3 -4.1 -4.1
Croatia 3.5 2.9 2.8 2.8
Croatia -1.1 1.1 1.6 1.8
Croatia 2.6 3.9 2.4 1.7
Russia -0.2 1.5 1.6 1.2
Russia 7.1 3.6 2.9 5.4
Russia 1.9 2.2 5.9 4.7
Serbia 2.8 1.9 4.0 3.0
Serbia 1.1 3.1 2.2 2.8
Serbia -3.1 -5.7 -5.7 -5.6
Turkey 3.2 7.4 2.2 -6.8
Turkey 7.8 11.1 16.7 21.4
Turkey -3.7 -5.5 -4.6 0.6 Extended basic balance (% GDP) 2016 2017 2018F 2019F
External debt (% GDP) 2016 2017 2018F 2019F
General gov’t balance (% GDP) 2016 2017 2018F 2019F
EU-CEE5 3.9 3.0 3.1 2.4
EU-CEE5 73.2 69.6 65.7 61.8
EU-CEE5 -1.7 -1.2 -1.6 -2.0
Bulgaria 5.9 9.7 6.1 5.4
Bulgaria 71.1 66.1 60.1 54.8
Bulgaria 0.2 0.9 0.7 -0.2
Czech Rep. 6.6 4.7 3.0 2.8
Czech Rep. 73.4 86.6 87.3 86.8
Czech Rep. 0.7 1.6 0.8 -0.2
Hungary 8.2 5.5 8.0 6.9
Hungary 97.1 84.8 81.2 75.4
Hungary -2.0 -2.0 -2.4 -2.0
Poland 1.9 2.1 3.0 2.1
Poland 74.7 66.9 61.2 56.3
Poland -2.3 -1.7 -2.0 -2.3
Romania 3.0 0.1 -0.7 -0.8
Romania 54.4 49.7 46.0 42.9
Romania -3.0 -2.9 -3.0 -3.4
Croatia 7.9 6.9 7.6 7.2
Croatia 89.3 81.8 75.9 73.2
Croatia -0.9 0.8 -0.5 -0.5
Russia 2.7 1.8 5.6 4.3
Russia 42.3 31.8 31.6 31.1
Russia -3.4 -1.5 2.0 1.4
Serbia 2.4 0.9 0.5 -0.1
Serbia 76.5 69.7 64.8 63.0
Serbia -1.3 1.2 0.4 -0.6
Turkey -2.8 -4.7 -3.7 1.6
Turkey 48.4 53.3 55.4 60.6
Turkey -1.7 -2.3 -3.8 -3.7 Gov’t debt (% GDP) 2016 2017 2018F 2019F
Policy rate (%) 2016 2017 2018F 2019F
FX vs. EUR (EoP) 2016 2017 2018F 2019F
EU-CEE5 48.9 46.2 45.7 45.1
EU-CEE5
EU-CEE5
Bulgaria 28.6 25.1 23.1 22.1
Bulgaria 0 -0.39 -0.47 -0.26
Bulgaria 1.96 1.96 1.96 1.96
Czech Rep. 36.8 34.6 32.0 30.7
Czech Rep. 0.05 0.50 1.75 2.25
Czech Rep. 27.02 25.54 25.40 24.80
Hungary 73.9 73.6 72.5 70.7
Hungary 0.90 0.90 0.90 0.90
Hungary 311.02 310.14 325.00 325.00
Poland 54.2 50.6 50.6 50.2
Poland 1.50 1.50 1.50 1.50
Poland 4.42 4.17 4.30 4.25
Romania 37.1 35.0 36.0 36.4
Romania 1.75 1.75 2.50 2.50
Romania 4.54 4.66 4.70 4.75
Croatia 80.2 77.5 74.4 71.7
Croatia
Croatia 7.56 7.51 7.50 7.50
Russia 12.9 12.6 12.8 12.7
Russia 10.00 7.75 7.75 7.50
Russia 63.81 68.87 79.97 86.83
Serbia 74.2 62.5 57.7 56.5
Serbia 4.00 3.50 3.00 3.00
Serbia 123.47 118.47 118.65 120.66
Turkey 30.3 28.3 35.5 32.9
Turkey 7.50 8.00 27.00 12.00
Turkey 3.67 4.56 8.70 8.75
Source: National statistical agencies, central banks, UniCredit Research
September 2018
CEE Macro & Strategy Research
CEE Quarterly
UniCredit Research page 24 See last pages for disclaimer.
EM VULNERABILITY HEATMAP
BG CZ HR HU PL RO RS RU SK TR UA MX BR CL SA ID IN CN AR External Liquidity Current account (% of GDP) 4.0 0.6 3.0 2.5 0 -3.4 -5.3 4.0 -1.9 -6.3 -2.8 -1.6 -0.8 -1.2 -3.4 -2.3 -1.9 0.5 -5.5 Extended Basic Balance (% of GDP) 5.7 3.5 6.3 5.8 3.2 0.5 1.2 1.9 1.5 -5.5 -1.1 0.6 0.2 1.7 -1.3 -0.6 -0.6 1.6 -5.0 FX Reserves coverage (months of imports) 7.4 8.0 8.2 2.6 4.5 4.3 6.2 12.8 - 3.3 2.9 4.3 18.2 5.4 5.2 6.7 7.5 15.6 6.9 External Debt (excl.ICL, % of GDP)* 39.6 86.1 68.3 57.1 49.7 34.7 66.6 21.3 86.8 53.1 93.4 37.3 56.0 60.9 48.9 34.1 19.9 14.0 41.1 Short-term debt (% of GDP) 15.0 51.2 20.6 10.5 9.0 6.9 2.3 3.7 40.1 13.5 14.0 2.9 2.9 8.0 9.2 4.6 7.6 9.0 9.9 REER (Index, 2010=100) 103.2 98.1 96.6 88.9 90.7 98.6 124.1 83.6 - 51.3 83.5 83.9 109.4 94.4 85.8 88.2 106.8 117.6 57.7
Domestic Finances Corporate debt (% of GDP) 52.3 51.4 63.2 55.6 45.9 39.0 42.0 58.0 59.3 94.4 77.6 37.2 37.8 111.6 55.0 22.4 45.8 160.0 16.3 Household Debt (% of GDP) 20.6 33.7 35.0 21.5 36.0 21.5 20.4 13.8 43.1 15.7 5.8 16.1 41.6 35.0 33.5 16.2 11.2 36.2 7.8 Nonresident holdings of gov.debt (% total) 1.1 39.8 - 28.8 30.0 18.2 30.8 40.3 50.4 17.1 - 32.1 11.3 n.a. 40.1 39.3 - 4.0 18.0
Banking System Credit Impulse (% of GDP) 1.4 -1.6 -0.6 1.6 -0.2 0.7 -0.3 -0.5 1.8 -2.8 1.5 0.7 4.2 0.6 0 0.8 1.8 -3.2 0.1 Loans/deposit ratio (%) 73.3 72.8 86.0 69.3 102.2 78.4 93.2 106.7 100.2 121.8 202.9 100.9 98.9 109.2 106.7 101.3 114.8 72.3 148.0 NPL (% of total loans) 9.4 3.4 11.2 3.6 3.9 5.7 7.8 10.7 3.4 2.9 57.3 2.0 3.0 2.0 3.3 2.7 10.2 1.8 2.2 Domestic Banks CAR (%) 20.8 17.7 22.6 17.7 18.1 20.1 22.9 12.2 18.6 16.6 16.2 14.1 17.4 13.8 16.2 22.6 13.8 13.6 15.7 Domestic Banks RoE (%) 14.3 17.3 10.0 17.2 8.2 15.7 10.6 6.8 10.7 16.0 1.3 20.7 13.8 14.1 19.8 14.8 4.5 13.6 2.7
*External debt incl ICL for CZ, RS, TR, MX, CL and SA Source: Haver, Bloomberg, National Statistics Offices, Central Banks, IMF, UniCredit Research
Legend Low vulnerability Moderate vulnerability Significant vulnerability High vulnerability

September 2018
CEE Macro & Strategy Research
CEE Quarterly
UniCredit Research page 25 See last pages for disclaimer.
EM VULNERABILITY HEATMAP (CONTINUED)
BG CZ HR HU PL RO RS RU SK TR UA MX BR CL SA ID IN CN AR Policy Policy Rate, nominal (%) - 1.25 - 0.90 1.50 2.50 3.00 7.25 - 24.00 17.50 7.75 6.50 2.50 6.50 5.50 6.50 2.00 60.00 Real policy rate (%) - -1.3 - -2.5 -0.5 -2.6 0.4 4.6 - 5.2 7.8 2.7 2.2 -0.1 1.6 2.1 2.7 -0.1 19.0 Real Money market rate (%) - -0.9 -1.8 -3.2 -0.4 -2.0 0.5 4.9 -3.1 7.7 8.1 2.7 1.8 -0.8 1.4 3.6 3.6 1.7 7.9 Headline inflation (% yoy) 3.5 2.5 2.1 3.4 2.0 5.1 2.6 2.5 2.8 17.9 9.0 4.8 4.2 2.6 4.8 3.4 3.7 2.1 34.4 Core Inflation (% yoy) 2.4 2.5 0.5 2.3 0.9 2.7 1.1 2.4 3.2 17.3 8.7 3.6 2.6 1.9 4.3 3.5 5.7 1.8 31.2 GG Fiscal balance (% of GDP) 0.9 1.7 0.7 -3.7 -1.0 -3.7 0.9 0 -1.0 -2.1 0.2 -2.4 -7.3 -2.6 -3.6 -2.0 -3.3 -4.0 -4.5 GG Primary balance (% of GDP) 1.5 0.8 2.2 -3.7 0.5 -2.4 3.3 1.4 0.4 -0.1 0.5 0.2 1.3 -1.6 -0.2 -0.3 -0.2 -2.7 -2.4 Government Debt (% of GDP) 23.2 35.8 76.2 73.9 51.2 34.4 61.7 10.9 50.8 27.2 79.0 39.1 72.4 33.7 54.8 33.2 45.9 47.8 53.7
Markets External Debt Spread (10Y, bp)** 108.0 28.6 189.3 115.8 69.9 213.7 - 196.0 47.2 455.6 607.5 137.7 287.6 75.9 276.5 194.2 163.8 40.1 597.8 Local Currency Curve (5Y, %)*** 0 1.8 0.9 3.0 2.5 4.3 3.8 8.2 0.1 23.4 8.2 8.0 11.1 4.3 8.5 8.1 8.1 3.5 25.6 Local currency bond spread (2s10s, bp)**** 101.9 77.2 191.6 179.6 166.9 109.7 100.0 88.0 146.5 -639.0 73.5 12.2 327.3 70.0 140.7 40.4 16.9 49.3 -894.0 CDS (5Y, bp) 83.8 42.0 98.9 87.0 65.3 100.4 114.0 159.1 45.2 449.1 428.5 108.6 282.0 48.3 219.0 136.6 100.9 56.6 647.5 FX 3m implied volatility (%) - 4.5 4.0 5.8 5.5 3.1 - 14.6 - 27.2 - 12.6 24.3 12.3 18.3 9.5 8.0 5.4 21.4
Structural***** IBRD Doing Business 50 30 51 48 27 45 43 35 39 80 76 49 125 55 82 72 100 78 117 WEF Competitiveness Ranking 49 31 74 60 39 68 78 38 59 53 81 51 80 33 61 36 40 27 92 Unemployment (%) 4.8 2.3 10.3 3.6 3.6 4.2 15.5 4.6 6.6 10.2 9.7 3.5 12.3 7.3 27.2 5.1 6.4 5.0 9.2
**Spread between 10Y EUR government bond yields and the corresponding German government bond yields for BG, HR, HU, PL, RO. For CZ, the spread refers to the 5Y yield. For the other countries, the spread is computed with respect to US government bond yields ***Data for UA refer to the generic USD bond. Data for HR refer to the 4Y bond ****Data for UA refer to the generic USD bond. Data for CL refer SA to the spread between 8Y and 2Y bond and 9Y and 2Y bond respectively. Data for HU refer to spread between 10Y and 3Y bond. *****BRD and WEF indicators for 2018 Source: Haver, Bloomberg, National Statistics Offices, Central Banks, IMF, UniCredit Research
Legend Low vulnerability Moderate vulnerability Significant vulnerability High vulnerability

October 2018
September 2018
CEE Macro & Strategy Research
CEE Quarterly
UniCredit Research page 26 See last pages for disclaimer.
CEE Strategy: dip your toes in but mind the tide Elia Lattuga, Cross Asset Strategist (UniCredit Bank, London) +44 207 826-1642 [email protected]
■ EM assets continued to underperform in 3Q, but returns were a tad less negative than in 2Q and very diversified across countries. Some portfolio reallocation within EM was probably at play, and more recently the performance started to improve. However, the medium-term outlook for EM assets remains very challenging, with idiosyncratic risks compounding tighter financing conditions on global markets.
■ Investors have been reducing exposure to EM assets since April, reducing by 40% the increase in allocation recorded since 2016. Across bond funds, retail and local-currency bond funds accounted for most of the outflows. Especially in these fund categories, positioning is now rather light, which lowers the bar for some stabilization.
■ Issuance from the EM region slowed down significantly in 3Q compared to previous years and there might be some catch-up in 4Q if market conditions allow. Changing market dynamics might make USD issuance relatively more attractive than (swapped) EUR issuance over coming quarters.
Silver linings in the aggregate negative performance 3Q was another difficult quarter for EM assets. Risks to global growth increased, as markets
remained volatile, albeit a tad more benevolent than in 2Q, exposing long-known structural vulnerabilities across the EM world. US government bond performance was not a headwind to EM: the 10Y yield rose towards 3.10%, breaking the 2.80-3.0% channel that prevailed since February. Shorter maturities continued to move north, pricing in a continuation of the ongoing tightening of monetary policy in the US. Meanwhile, riskier segments of the US fixed income market delivered a positive performance, thanks to tightening in credit spreads. Moreover, while implied volatility on US equities remained very low, the S&P500 posted new highs. In this environment, broad EM equity and bond indices underperformed the aforementioned US-centric asset classes.
Behind the underperformance of EM indices we saw very diversified returns across countries. The negative performance of broad bond indices in 3Q was due to a limited number of outliers, countries with known imbalances, characterized by suboptimal policies, political risk and/or hit by sanctions. For those, carry has not been nearly enough to offset the widening credit spread or the depreciating currency.

October 2018
September 2018
CEE Macro & Strategy Research
CEE Quarterly
UniCredit Research page 27 See last pages for disclaimer.
ANOTHER DIFFICULT QUARTER FOR EM ASSETS (TOTAL RETURN IN USD)
WHEN SELECTION MATTERS (TOTAL RETURN FOR 3Q IN USD, HARD AND LOCAL-CURRENCY DENOMINATED BONDS, ALL MATURITIES)
-10%
-5%
0%
5%
10%
15%
EM LCbonds
EM USDbonds
UST US HY MSCI EM S&P500
3Q 2Q 1Q 4Q17 3Q17 2Q17 1Q17
-35
-30
-25
-20
-15
-10
-5
0
5
10
BP HR HU CZ HU PD RO RU RS TU
EUR USD Loc
Source: Bloomberg, UniCredit Research
A large number of countries delivered flat or positive performance, which for selected CEE countries was especially good: hard-currency denominated bonds (EUR or USD) returned over 3% for Romania, Hungary and Croatia, while 5-7Y ROMGBs delivered over 4% (in local currency). Turkey and, to a lesser extent, Russia were a drag on the region’s performance.
All in all, some portfolio reallocation within the EM universe was probably at play and this limited the losses on the asset class. Moreover, in aggregate terms, the performance of EM assets has shown some signs of recovery as of late, breaking the negative momentum for both equities and fixed income exposure. This, per se, offers little comfort, considering that similar recoveries proved short-lived back in July and August (they were most likely due to short covering). Lingering uncertainty over the course of fiscal and monetary policy in Turkey, political risk in LatAm, economic sanctions and tariffs remain a threat to risk appetite. Global growth has peaked and financial conditions are slowly but steadily tightening across major economies. In this respect, global factors compound idiosyncratic risks, increasing challenges and the risk of contagion for EM assets.
DISSECTING PERFORMANCE IN THE REGION (USD DENOMINATED)
SOME IMPROVEMENT AS OF LATE (RESCALED PERFORMANCE)
-40
-35
-30
-25
-20
-15
-10
-5
0
5
10
TU AR RU SA BZ PH ID CO CL MA PE SK TH CZ IS PD HU MX RO
Currency TR
-5.0
0.0
5.0
10.0
15.0
20.0
25.0
-5.0
-2.5
0.0
2.5
5.0
7.5
10.0
Jun 17 Sep 17 Dec 17 Mar 18 Jun 18 Sep 18
HC LC MSCI EM (rs)
Source: Bloomberg, UniCredit Research

October 2018
September 2018
CEE Macro & Strategy Research
CEE Quarterly
UniCredit Research page 28 See last pages for disclaimer.
Dipping toes back into EM bonds Outflows from EM dedicated bond funds accelerated at the turn of 2Q and continued at a
similar pace for most of 3Q, until very recently when they showed signs of stabilization. Over 3Q, EM bond funds lost another USD 4bn (according to EPFR), taking YTD net flows to a negative USD 3bn. Most of the bleeding happened on active exposure, which is somewhat consistent with the diversified performance recorded across EM bonds discussed above. The risk of passive funds starting to experience large outflows, triggering an indiscriminate selloff, has been averted for the time being. It was by and large retail funds that faced the largest outflows (USD 6.5bn in 3Q), while ca. USD 2bn was added by institutional funds. Hence, a USD 25bn gap in net flows has opened up between retail and institutional funds. Moreover, while most of the outflows recorded earlier this year hit hard-currency rather than local-currency bond funds, over the past four months the pace of withdrawal from the latter accelerated. Three quarters into 2018, the two-fund categories stand very close in terms of YTD flows in the (negative) USD 1.5-2.5bn area.
The very recent positive flow into EM bond funds marked a reversal of the recent trend. It was mostly due to inflows into institutional and passive funds targeting both local and hard currency bond funds. This is definitely good news but still too little to suggest that the tide has turned for EM bond funds. As mentioned above, the macroeconomic and market outlook remain uncertain for EM countries, so some stabilization on the flow side, while reducing the need to keep liquidity balances high, would provide some respite for these assets.
In order to design possible scenarios for flows into 4Q we consider: 1. Long-term trends in flows into EM assets and global positioning, 2. Macro-based models for bond fund flows, and 3. Developments in net flows over past episode of prolonged withdrawals.
BOND FUND FLOWS (YTD CUMULATED FLOWS, USD BN)
A LONGER-TERM PERSPECTIVE (CUMULATED FLOWS FROM 2004, USD BN)
-15
-10
-5
0
5
10
15
20
Jan-18 Feb-18 Mar-18 Apr-18 May-18 Jun-18 Jul-18 Aug-18 Sep-18
HC LC Active Passive Institutional Retail Total
-80
-40
0
40
80
120
160
-40
-20
0
20
40
60
80
Jan-04 Jan-06 Jan-08 Jan-10 Jan-12 Jan-14 Jan-16 Jan-18
LC Retail Total (rs)
Source: EPFR, Bloomberg and UniCredit Research
1. Long-term trends of flows into EM assets and global positioning
Over the past two quarters, global portfolios (mutual funds and ETFs) have reduced about 40% of their increase in exposure since 2016, when allocation to EM hit its lowest post financial crisis level. Equity funds were especially hit, but the adjustment was sizable on bond exposure too. In both cases, EM exposure appears rather underweight.
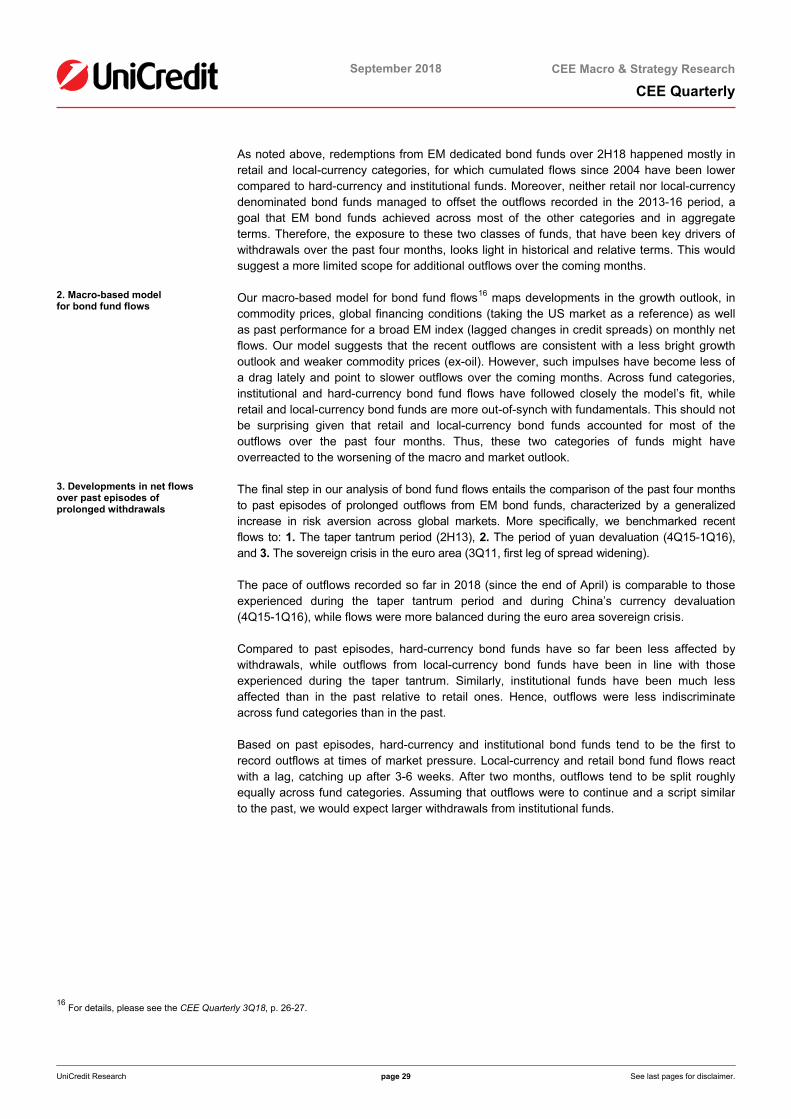
October 2018
September 2018
CEE Macro & Strategy Research
CEE Quarterly
UniCredit Research page 29 See last pages for disclaimer.
As noted above, redemptions from EM dedicated bond funds over 2H18 happened mostly in retail and local-currency categories, for which cumulated flows since 2004 have been lower compared to hard-currency and institutional funds. Moreover, neither retail nor local-currency denominated bond funds managed to offset the outflows recorded in the 2013-16 period, a goal that EM bond funds achieved across most of the other categories and in aggregate terms. Therefore, the exposure to these two classes of funds, that have been key drivers of withdrawals over the past four months, looks light in historical and relative terms. This would suggest a more limited scope for additional outflows over the coming months.
2. Macro-based model for bond fund flows
Our macro-based model for bond fund flows16 maps developments in the growth outlook, in commodity prices, global financing conditions (taking the US market as a reference) as well as past performance for a broad EM index (lagged changes in credit spreads) on monthly net flows. Our model suggests that the recent outflows are consistent with a less bright growth outlook and weaker commodity prices (ex-oil). However, such impulses have become less of a drag lately and point to slower outflows over the coming months. Across fund categories, institutional and hard-currency bond fund flows have followed closely the model’s fit, while retail and local-currency bond funds are more out-of-synch with fundamentals. This should not be surprising given that retail and local-currency bond funds accounted for most of the outflows over the past four months. Thus, these two categories of funds might have overreacted to the worsening of the macro and market outlook.
3. Developments in net flows over past episodes of prolonged withdrawals
The final step in our analysis of bond fund flows entails the comparison of the past four months to past episodes of prolonged outflows from EM bond funds, characterized by a generalized increase in risk aversion across global markets. More specifically, we benchmarked recent flows to: 1. The taper tantrum period (2H13), 2. The period of yuan devaluation (4Q15-1Q16), and 3. The sovereign crisis in the euro area (3Q11, first leg of spread widening).
The pace of outflows recorded so far in 2018 (since the end of April) is comparable to those experienced during the taper tantrum period and during China’s currency devaluation (4Q15-1Q16), while flows were more balanced during the euro area sovereign crisis.
Compared to past episodes, hard-currency bond funds have so far been less affected by withdrawals, while outflows from local-currency bond funds have been in line with those experienced during the taper tantrum. Similarly, institutional funds have been much less affected than in the past relative to retail ones. Hence, outflows were less indiscriminate across fund categories than in the past.
Based on past episodes, hard-currency and institutional bond funds tend to be the first to record outflows at times of market pressure. Local-currency and retail bond fund flows react with a lag, catching up after 3-6 weeks. After two months, outflows tend to be split roughly equally across fund categories. Assuming that outflows were to continue and a script similar to the past, we would expect larger withdrawals from institutional funds.
16 For details, please see the CEE Quarterly 3Q18, p. 26-27.
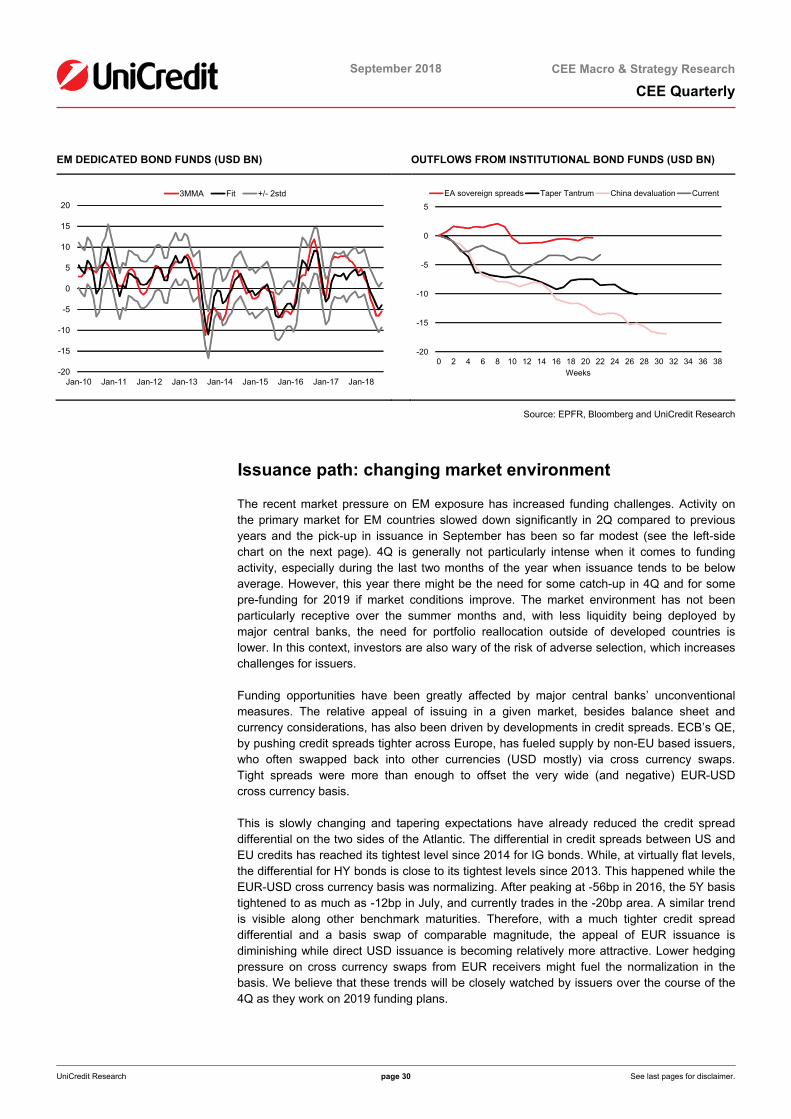
October 2018
September 2018
CEE Macro & Strategy Research
CEE Quarterly
UniCredit Research page 30 See last pages for disclaimer.
EM DEDICATED BOND FUNDS (USD BN) OUTFLOWS FROM INSTITUTIONAL BOND FUNDS (USD BN)
-20
-15
-10
-5
0
5
10
15
20
Jan-10 Jan-11 Jan-12 Jan-13 Jan-14 Jan-15 Jan-16 Jan-17 Jan-18
3MMA Fit +/- 2std
-20
-15
-10
-5
0
5
0 2 4 6 8 10 12 14 16 18 20 22 24 26 28 30 32 34 36 38Weeks
EA sovereign spreads Taper Tantrum China devaluation Current
Source: EPFR, Bloomberg and UniCredit Research
Issuance path: changing market environment The recent market pressure on EM exposure has increased funding challenges. Activity on
the primary market for EM countries slowed down significantly in 2Q compared to previous years and the pick-up in issuance in September has been so far modest (see the left-side chart on the next page). 4Q is generally not particularly intense when it comes to funding activity, especially during the last two months of the year when issuance tends to be below average. However, this year there might be the need for some catch-up in 4Q and for some pre-funding for 2019 if market conditions improve. The market environment has not been particularly receptive over the summer months and, with less liquidity being deployed by major central banks, the need for portfolio reallocation outside of developed countries is lower. In this context, investors are also wary of the risk of adverse selection, which increases challenges for issuers.
Funding opportunities have been greatly affected by major central banks’ unconventional measures. The relative appeal of issuing in a given market, besides balance sheet and currency considerations, has also been driven by developments in credit spreads. ECB’s QE, by pushing credit spreads tighter across Europe, has fueled supply by non-EU based issuers, who often swapped back into other currencies (USD mostly) via cross currency swaps. Tight spreads were more than enough to offset the very wide (and negative) EUR-USD cross currency basis.
This is slowly changing and tapering expectations have already reduced the credit spread differential on the two sides of the Atlantic. The differential in credit spreads between US and EU credits has reached its tightest level since 2014 for IG bonds. While, at virtually flat levels, the differential for HY bonds is close to its tightest levels since 2013. This happened while the EUR-USD cross currency basis was normalizing. After peaking at -56bp in 2016, the 5Y basis tightened to as much as -12bp in July, and currently trades in the -20bp area. A similar trend is visible along other benchmark maturities. Therefore, with a much tighter credit spread differential and a basis swap of comparable magnitude, the appeal of EUR issuance is diminishing while direct USD issuance is becoming relatively more attractive. Lower hedging pressure on cross currency swaps from EUR receivers might fuel the normalization in the basis. We believe that these trends will be closely watched by issuers over the course of the 4Q as they work on 2019 funding plans.

October 2018
September 2018
CEE Macro & Strategy Research
CEE Quarterly
UniCredit Research page 31 See last pages for disclaimer.
EM SSA ISSUANCE (EQUIVALENT OF USD BN)
HY SPREAD DIFFERENTIALS (USD VS. EUR) AND EUR-USD XCCY BASIS
0
5
10
15
20
25
30
35
40
45
Jan Feb Mar Apr May Jun Jul Aug Sep Oct Nov Dec
2018 2017 2016 2015
-60
-50
-40
-30
-20
-10
0
10-50
0
50
100
150
200
250
300
Jan-13 Oct-13 Jul-14 Apr-15 Jan-16 Oct-16 Jul-17 Apr-18
EU-US HY OAS differential EUR-USD XCCY 5Y (rs)
Source: Bond Radar, Bloomberg, UniCredit Research

<date>
September 2018 CEE Macro & Strategy Research
CEE Quarterly
UniCredit Research page 32 See last pages for disclaimer.
CEEMEA FX: Near-term relief, but the coast is far from clear Views in a nutshell
Kiran Kowshik, EM FX Strategist (UniCredit Bank, London) +44 207 826-6080 [email protected]
1. In this section, we present our view using several charts that aim to “tell the story”, with succinct text.
2. Our main conviction: the EMFX relief being seen is unlikely to last. The continued decline in industrial commodities amid the sharp Chinese credit slowdown from 1H18 are red flags that suggest ongoing headwinds for the remainder of 2018.
3. With financial conditions relatively easy, the Fed will stay on its tightening course for now. Together with increased UST issuance, EM currencies with weak external positions and/or worsening fiscal positions will remain in the firing line. An overstretched long USD position will provide only limited respite.
4. RON has weak fiscal and external balances but has held in well given the NBR’s FX intervention. This seems unsustainable and we will look to buy EUR-RON via forwards in early 2019 waiting for onshore liquidity to become looser.
5. RUB has the exact opposite i.e. strong fiscal and external balances, but is likely to remain under pressure. Sanctions risk still very much alive ahead of the November mid-term elections and will likely see further position-adjustment. USD-RUB should plot a broad 65.00 -70.00 range. At current levels, USD-RUB is a buy.
6. HUF, CZK and PLN all have good FX fundamentals, but the conditions are not there for continuous appreciation; for this we require healthy global trade growth to help these small, open economy currencies. Look to buy on dips in EUR-CE3 crosses playing for modest upside.
7. The TRY will be subject to competing forces of high real rates, political risks, C/A compression as well as sizeable external payments in the months ahead. But we err on the bearish side.

<date>
September 2018 CEE Macro & Strategy Research
CEE Quarterly
UniCredit Research page 33 See last pages for disclaimer.
1. EMFX: yes it’s a relief rally, but nothing more than that There are a number of triggers for this bounce in EMFX
We view the recent bounce in EMFX as a respite within a broader downward trend, but concede that the bounce could last for much of October. As far as we can tell, the stabilization has been driven by a number of triggers including, but not limited to: 1. a big downward surprise in US August core CPI (13 September), 2. rising expectations of additional Chinese fiscal stimulus, 3. stabilization in the prices of some industrial metals, like copper (related to 2), 4. a “buy the rumor, sell the fact” response to the imposition of fresh US tariffs on Chinese goods (10% on USD 200bn), and 5. realization that investors are now heavily long the USD.
However, none of the reasons are compelling enough to turn the needle on EM, in our view
However, in our view the reasons listed above are not compelling enough to change the bearish narrative for EM currencies in the months ahead. For example, while the August CPI negative surprise was the largest since 1Q17 (when the USD peaked), in contrast to back then right now EM growth is weakening. Furthermore, the Fed has placed just as much importance on asset price inflation (and financial conditions). Similarly, it seems quite unlikely that Chinese policy makers will provide that much support to the economy as was the case previously.
The external environment remains poor for EM currencies
Global trade volume growth has been slowing for the past several months, while trackers of EM growth also have been slowing down (chart 1). The imposition of tariffs and the ongoing trade impasse between the US and China are likely to keep uncertainty elevated, which in turn will weigh on business investment, which is the most import-intensive part of GDP. EM manufacturing sentiment and industrial commodity prices have both come under pressure (chart 2).
The overstretched speculative USD position could provide an offset… …but we are less convinced
There is no doubt that there has been a big switch from a large underweight in the USD among the speculative investor base to a large overweight position from March to September (chart 3). However, there is less evidence that longer-term investors, such as real money investors, have cut EM risk in a big way and have turned long the USD. For instance, new allocations to global EM equities from the US mutual fund industry have flattened out from June-September, but haven’t gone outright short EM and long USD as seen at various points from 2014-16 (chart 4). That, in turn, implies that there may be scope for USD buying as EM exposure is reduced.
The large USD rally until August has so far only erased the frothiness in EMFX valuations…
And while the USD speculative position has gone from “extreme short” to “extreme long” over the past six months, the resultant USD rally – with BBDXY index gaining 7% at its peak in mid-August – has only wiped off the “froth” over EMFX. Indeed, for the bulk of Sep-17-Mar-18, we were concerned that EMFX had failed to appreciate in trade-weighted terms. We found the rally could only be explained by a very weak USD. This was one important reason that led us to adopt a cautious EMFX stance back in March (see CEEMEA FX: our likes and dislikes in 2Q, pages 31-36, 2Q18 CEE Quarterly) and an outright bearish bias in June (see CEEMEA FX: marking to market our 2Q views, pages 31-37, 3Q18 CEE Quarterly).
…and for the remainder of 2018 weak commodity prices or a slowing China will be the dominant driver (even with a lackluster USD)
While the subsequent sharp rally in the USD in recent months has eliminated the gap (chart 5), we are still not at a point where the USD is pulling EMFX down more than what some fundamentals (as indicated, for example, by the RIND index) would suggest. In other words, EMFX is not trading at a discount when you factor in the behavior of industrial commodity prices, as was the case back in November 2016 when EMFX was trading at a discount. Instead, with the gap now closed, both series are falling in sympathy. And many drivers, most importantly the evolution of Chinese credit growth (chart 6), suggest headwinds will likely remain in place for the remainder of 2018.
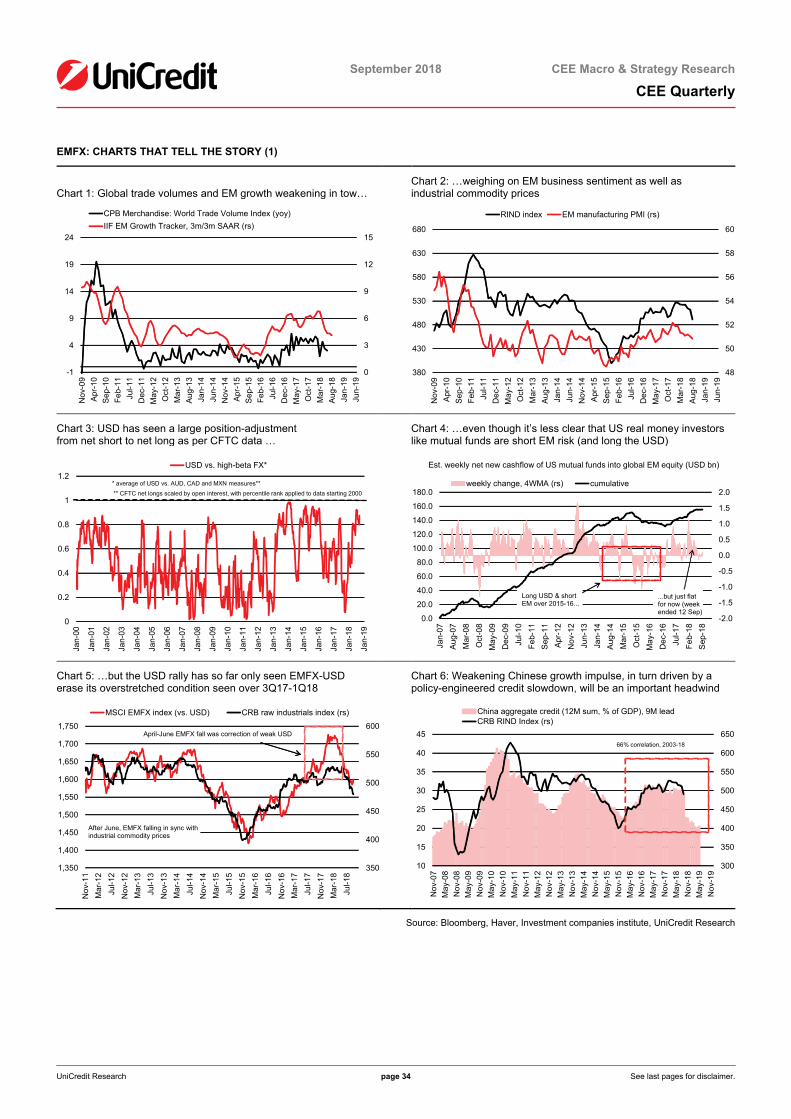
<date>
September 2018 CEE Macro & Strategy Research
CEE Quarterly
UniCredit Research page 34 See last pages for disclaimer.
EMFX: CHARTS THAT TELL THE STORY (1)
Chart 1: Global trade volumes and EM growth weakening in tow…
Chart 2: …weighing on EM business sentiment as well as industrial commodity prices
0
3
6
9
12
15
-1
4
9
14
19
24
Nov
-09
Apr
-10
Sep
-10
Feb-
11Ju
l-11
Dec
-11
May
-12
Oct
-12
Mar
-13
Aug
-13
Jan-
14Ju
n-14
Nov
-14
Apr
-15
Sep
-15
Feb-
16Ju
l-16
Dec
-16
May
-17
Oct
-17
Mar
-18
Aug
-18
Jan-
19Ju
n-19
CPB Merchandise: World Trade Volume Index (yoy)IIF EM Growth Tracker, 3m/3m SAAR (rs)
48
50
52
54
56
58
60
380
430
480
530
580
630
680
Nov
-09
Apr
-10
Sep
-10
Feb-
11Ju
l-11
Dec
-11
May
-12
Oct
-12
Mar
-13
Aug
-13
Jan-
14Ju
n-14
Nov
-14
Apr
-15
Sep
-15
Feb-
16Ju
l-16
Dec
-16
May
-17
Oct
-17
Mar
-18
Aug
-18
Jan-
19Ju
n-19
RIND index EM manufacturing PMI (rs)
Chart 3: USD has seen a large position-adjustment from net short to net long as per CFTC data …
Chart 4: …even though it’s less clear that US real money investors like mutual funds are short EM risk (and long the USD)
0
0.2
0.4
0.6
0.8
1
1.2
Jan-
00
Jan-
01
Jan-
02
Jan-
03
Jan-
04
Jan-
05
Jan-
06
Jan-
07
Jan-
08
Jan-
09
Jan-
10
Jan-
11
Jan-
12
Jan-
13
Jan-
14
Jan-
15
Jan-
16
Jan-
17
Jan-
18
Jan-
19
USD vs. high-beta FX*
* average of USD vs. AUD, CAD and MXN measures**** CFTC net longs scaled by open interest, with percentile rank applied to data starting 2000
-2.0
-1.5
-1.0
-0.5
0.0
0.5
1.0
1.5
2.0
0.0
20.0
40.0
60.0
80.0
100.0
120.0
140.0
160.0
180.0
Jan-
07A
ug-0
7M
ar-0
8O
ct-0
8M
ay-0
9D
ec-0
9Ju
l-10
Feb-
11S
ep-1
1A
pr-1
2N
ov-1
2Ju
n-13
Jan-
14A
ug-1
4M
ar-1
5O
ct-1
5M
ay-1
6D
ec-1
6Ju
l-17
Feb-
18S
ep-1
8
weekly change, 4WMA (rs) cumulative
Est. weekly net new cashflow of US mutual funds into global EM equity (USD bn)
Long USD & short EM over 2015-16...
...but just flat for now (weekended 12 Sep)
Chart 5: …but the USD rally has so far only seen EMFX-USD erase its overstretched condition seen over 3Q17-1Q18
Chart 6: Weakening Chinese growth impulse, in turn driven by a policy-engineered credit slowdown, will be an important headwind
350
400
450
500
550
600
1,350
1,400
1,450
1,500
1,550
1,600
1,650
1,700
1,750
Nov
-11
Mar
-12
Jul-1
2N
ov-1
2M
ar-1
3Ju
l-13
Nov
-13
Mar
-14
Jul-1
4N
ov-1
4M
ar-1
5Ju
l-15
Nov
-15
Mar
-16
Jul-1
6N
ov-1
6M
ar-1
7Ju
l-17
Nov
-17
Mar
-18
Jul-1
8
MSCI EMFX index (vs. USD) CRB raw industrials index (rs)
April-June EMFX fall was correction of weak USD
After June, EMFX falling in sync with industrial commodity prices
300
350
400
450
500
550
600
650
10
15
20
25
30
35
40
45
Nov
-07
May
-08
Nov
-08
May
-09
Nov
-09
May
-10
Nov
-10
May
-11
Nov
-11
May
-12
Nov
-12
May
-13
Nov
-13
May
-14
Nov
-14
May
-15
Nov
-15
May
-16
Nov
-16
May
-17
Nov
-17
May
-18
Nov
-18
May
-19
Nov
-19
China aggregate credit (12M sum, % of GDP), 9M leadCRB RIND Index (rs)
66% correlation, 2003-18
Source: Bloomberg, Haver, Investment companies institute, UniCredit Research
<date>
September 2018 CEE Macro & Strategy Research
CEE Quarterly
UniCredit Research page 35 See last pages for disclaimer.
2. EMFX: external backdrop as well as fundamentals less compelling Basic balances in EM have been deteriorating for several EM…
While over 2016-17 we argued that external balances had improved substantially compared to 2013, the direction has been for a deterioration. Indeed, our cross EM country measure of basic balances – including both the current account and sticky flows like FDI – has been weakening ahead of the resultant depreciation in EMFX (chart 7). The picture is similar if we also consider portfolio flows in the equation (chart 8).
For many EM, it was weak growth as well as the sharp fall in energy prices that led to improved external balances But that may be reversing
An important reason for the worsening in external balances is that the forces that drove an improvement in the balance in the first place are not proving sustainable. More specifically for the original club of “fragile five” countries, which included Turkey, South Africa, Brazil, India and Indonesia. For most countries, the bulk of improvement in trade balances came from declining import growth. However, trends are deteriorating once again as imports outpace exports. An important culprit for this is simply higher energy prices. In this sense, the rise in energy prices has been a negative and has actually hurt EM’s external balances (chart 9). This is not true for all countries; with the exception of Romania most CEEMEA countries – such as Hungary, Czech Republic as well as Russia run healthy trade surpluses (chart 10). Poland, on the other hand, does not really have the support of the trade balance.
Global liquidity is set to tighten further
The Fed began to reduce the size of its balance sheet at the end of 2017 following several years of QE, while our economists expect the ECB to end its asset purchase program at the end of this year. However, what is important is that the US is also implementing a very large fiscal expansion, and the increased issuance of US Treasuries will continue to draw liquidity from global markets. Indeed, the Governor of the Reserve Bank of India, Urjit Patel, in a letter to the FT back in early June warned of the negative impacts on EM of such actions, reasoning that the Fed should ease on the pedal of balance sheet reduction to account for the impact of the deficit so as to ease the impact on emerging markets (See FT piece here).
The bar still appears quite high for the Fed to provide a dovish surprise that benefits EM
But it seems quite unlikely that the Fed will adjust its monetary policy strategy. Recent experience shows that the Fed has been willing to step back from the normalization pedal when markets faced significant turmoil. This was the case in 3Q13 when the Fed decided to hold off from its action of “tapering”. It was also the case in 3Q15 when risky assets fell globally (principally due to the CNY devaluation). That said, in the two aforementioned periods, trouble abroad tended to spill over to US asset prices, which in turned resulted in US financial conditions tightening. However, this time around, US financial conditions remain relatively easy (chart 11). The bar for the Fed, therefore, remains higher than before and we are unlikely to get a dovish surprise that helps EM.
Tightening global liquidity conditions to weigh on currencies with weak fundamentals
With global liquidity having tightened, the pattern for 2018 (so far) has been for currencies of countries having sizeable current account deficits and/or weak fiscal balances to be most vulnerable (chart 12). This includes first and foremost the BRL, TRY, ARS, ZAR, and COP, followed by the IDR, INR, and MXN. On the other hand, the likes of RUB, CZK, HUF, PLN in CEEMEA and the KRW, TWD and MYR in Asia have healthier external balances and fiscal positions. However, there are two interesting outliers in CEEMEA, i.e., the RUB and the RON. The RON has held in much better with NBR FX intervention providing support, whereas the RUB has been impacted by concerns of new sanctions coming from the US.

<date>
September 2018 CEE Macro & Strategy Research
CEE Quarterly
UniCredit Research page 36 See last pages for disclaimer.
EMFX: CHARTS THAT TELL THE STORY (2)
Chart 7: EM balance of payments (C/A + FDI) flows consistent with depreciation in EM currencies…
Chart 8: …as are the overall flows when portfolio investments are added
0.0
0.5
1.0
1.5
2.0
2.5
3.0
-20.0
-15.0
-10.0
-5.0
0.0
5.0
10.0
15.0
Mar
-06
Oct
-06
May
-07
Dec
-07
Jul-0
8Fe
b-09
Sep
-09
Apr
-10
Nov
-10
Jun-
11Ja
n-12
Aug
-12
Mar
-13
Oct
-13
May
-14
Dec
-14
Jul-1
5Fe
b-16
Sep
-16
Apr
-17
Nov
-17
Jun-
18Ja
n-19
Aug
-19
EMFX NEER (%, yoy)EM basic balance (4Q sum, % of GDP, rs)
-0.5
0.0
0.5
1.0
1.5
2.0
2.5
3.0
3.5
-20.0
-15.0
-10.0
-5.0
0.0
5.0
10.0
15.0
Mar
-06
Oct
-06
May
-07
Dec
-07
Jul-0
8Fe
b-09
Sep
-09
Apr
-10
Nov
-10
Jun-
11Ja
n-12
Aug
-12
Mar
-13
Oct
-13
May
-14
Dec
-14
Jul-1
5Fe
b-16
Sep
-16
Apr
-17
Nov
-17
Jun-
18Ja
n-19
Aug
-19
EMFX NEER (%, yoy) EM broad basic balance (4Q sum, % GDP, rs)
Chart 9: Trade balances of the “fragile five” countries weakening as imports pick up. Higher oil prices not helping.
Chart 10: Meanwhile, trade balances of CE3 countries have come off, but remain at surplus levels
-7
-5
-3
-1
1
3
5
7
0
5
10
15
20
25
Dec
-05
Jul-0
6Fe
b-07
Sep
-07
Apr
-08
Nov
-08
Jun-
09Ja
n-10
Aug
-10
Mar
-11
Oct
-11
May
-12
Dec
-12
Jul-1
3Fe
b-14
Sep
-14
Apr
-15
Nov
-15
Jun-
16Ja
n-17
Aug
-17
Mar
-18
Oct
-18
Exports Imports Trade balance (rs)
all series 12M sums, % of GDPavg of the fragile five of INR, IDR, TRY, ZAR and BRL
-3
-1
1
3
5
7
9
11
13
15
0
10
20
30
40
50
60
70
80
Dec
-05
Jul-0
6Fe
b-07
Sep
-07
Apr
-08
Nov
-08
Jun-
09Ja
n-10
Aug
-10
Mar
-11
Oct
-11
May
-12
Dec
-12
Jul-1
3Fe
b-14
Sep
-14
Apr
-15
Nov
-15
Jun-
16Ja
n-17
Aug
-17
Mar
-18
Oct
-18
Exports Imports Trade balance (rs)
all series 12M sums, % of GDPavg of the CE3 countries of PLN, HUF and CZK
Chart 11: US financial conditions still loose; we are still quite far from the Fed turning dovish on a negative feedback loop via EM like in 2013 or 2015
Chart 12: Scale of YTD declines in EMFX inversely correlated with “twin” balances, so far. In CEEMEA, RUB and RON are exceptions
-1.0
-0.8
-0.6
-0.4
-0.2
0.0
0.2
0.4
-100.0-80.0-60.0-40.0-20.0
0.020.040.060.080.0
100.0
Jul-1
2
Nov
-12
Mar
-13
Jul-1
3
Nov
-13
Mar
-14
Jul-1
4
Nov
-14
Mar
-15
Jul-1
5
Nov
-15
Mar
-16
Jul-1
6
Nov
-16
Mar
-17
Jul-1
7
Nov
-17
Mar
-18
Jul-1
8
Nov
-18
US 10Y TIPS real yieldChicago Fed US financial conditions index (rs)
Fed slowed pace ofnormalisation in 2013 and 2015....
US financial conditionslooser this time around
-45
-40
-35
-30
-25
-20
-15
-10
-5
0
5
10
-10 -8 -6 -4 -2 0 2 4Twin deficits, % of GDP
Year
to d
ate
retu
rn v
s. U
SD
, %.
MXN
TRY
RUB
CZKILS
HUF
PLNCOP
RONIDR
INR
BRL
ZARCLP
Source: Bloomberg, Haver, UniCredit Research

<date>
September 2018 CEE Macro & Strategy Research
CEE Quarterly
UniCredit Research page 37 See last pages for disclaimer.
3. The 4Q game plan in CEEMEA FX USD-RUB is a buy below the 65.00 as sanctions risk dominates otherwise good FX fundamentals
Given Russia’s good budget position and C/A surplus, the RUB ought to have fared better over the past month. Admittedly, the major reason for the weakening of the currency has been markets pricing in the risk of fresh US sanctions, following those already delivered in April. This can be seen in the blowout in Russia sovereign CDS relative to similarly rated Indonesia and Colombia sovereign CDS (chart 13). And we find that this relative credit-risk premia was quite correlated with the underperformance of the RUB compared with other relevant EM currencies (chart 13).
Sanctions risk will likely come back to haunt the RUB ahead of November mid-term elections A democratic win in the US Senate would hurt the RUB further. Timing a RUB rebound is increasingly tricky
In other words, keeping in mind the strong FX fundamentals, it is likely that the still live risk of additional sanctions coming in November sees risk premia flare up, keeping the RUB a relative underperformer in EMFX. We do believe that, once there is more clarity on the degree of sanctions, the RUB should perform better. The problem, however, is that it is unclear when the clarity will come. Should the democrats win the Senate in the mid-term elections, the US stance could become even harsher towards Russia going forward. In other words, the RUB still faces weakening pressure as markets re-focus on sanctions closer to November. At levels below 65.00 on USD-RUB, we prefer selling the currency ahead of November.
The RON has held in well so far on NBR’s FX intervention But this is an unsustainable strategy, making EUR-RON longs attractive as we enter 2019
On the other hand, the RON has been rock steady in recent months despite having a weak budget and current account position. Our own view had been that the currency should hold steady over 3Q as the NBR intervenes to maintain stability to limit FX pass-through to inflation, but could shift strategy once inflation declined. We expect the central bank to work to keep the currency stable for the remainder of the year as inflation leaks lower. That said, once onshore liquidity normalizes in early 2019 and implied yields decline, we think it would make sense to positioning long via EUR-RON forwards positioning for a weaker RON in 2019.
While CE3 FX has good external balances, we don’t expect consistent appreciation trends to develop with global trade volumes slowing We would look to buy on dips in EUR-HUF, EUR-PLN and EUR-CZK dips near 320, 4.25 and 25.50 respectively
Within the CE3 (Hungary, Poland and the Czech Republic), we have for long preferred the CZK given the cleaner undervaluation signal as well as the more hawkish CNB. That said, in an environment of slowing global trade volume growth, we think currencies of small, open economies will face modest weakening pressures. CZK and HUF very much fall into this camp, although historically we find the PLN to be more sensitive to shifts in global trade volume growth (chart 16). We think that at current levels near 25.50, EUR-CZK is a buy. Similarly, our preference would be to buy EUR-PLN and EUR-HUF at 4.25 and 320, respectively, looking for a modest 3% upside for the remainder of the year. Indeed, history shows that it is quite normal for CEE currencies to see modest downside moves in an environment of slowing growth momentum for the eurozone (chart 17).
For the TRY, we are bearish but are not positioning now given offsetting forces at play
Finally, we keeping a bearish bias for the TRY, penciling in 7.25 by year-end, but hold off from positioning. There are too many moving parts and offsetting forces at play (see Turkey section for more details). Following the CBRT hike, (ex-post) real rates currently stand at +600bp, high in the sample of EM currently. Furthermore, the trial of US pastor Brunson is scheduled for 12 October and expectations of a positive development has increased (though even here, risk-reward does not favor a long TRY position). But on the negative side, there are large maturities of bank debt coming due (USD 20bn over November-December) and we assume rollover ratios will be lower. Real policy rates will likely go back into negative territory around November as inflation rebounds (unless the CBRT hikes further).
But the continued drawdown in FX reserves points to fragility
The C/A deficit has likely collapsed, and typically a lower deficit usually means lower FX demand and a stronger local currency. But the reasoning is less clear cut for Turkey where the adjustment has been forced by a sudden stop. Note that despite the lower USD-TRY in September, Turkey is still drawing down FX reserves (chart 18) which, in turn, points to ongoing weakness in the external accounts. Eventually, we believe an IMF agreement may be required for the TRY to develop a stronger recovery.

<date>
September 2018 CEE Macro & Strategy Research
CEE Quarterly
UniCredit Research page 38 See last pages for disclaimer.
EMFX: CHARTS THAT TELL THE STORY (3)
Chart 13: Russian risk premia blew out relative to similarly rated credits, like Indonesia and Colombia, after April
Chart 14: The relative credit risk was quite correlated with the RUB’s underperformance
0
10
20
30
40
50
60
70
0
200
400
600
800
1,000
1,200
1,400
Jan-
18Ja
n-18
Jan-
18Fe
b-18
Feb-
18M
ar-1
8M
ar-1
8A
pr-1
8A
pr-1
8M
ay-1
8M
ay-1
8Ju
n-18
Jun-
18Ju
l-18
Jul-1
8Ju
l-18
Aug
-18
Aug
-18
Sep
-18
Sep
-18
Oct
-18
Search: "RUSSIA" & "SANCTIONS" Story Count (5D sum, 5dma)Sanctions risk premia via CDS* (bp, rs)
*Russia 5Y USD sovereign CDS over that for similarlyrated Indonesia and Colombia
0
10
20
30
40
50
6087
88
89
90
91
92
93
94
95
Mar
-18
Mar
-18
Apr
-18
Apr
-18
May
-18
May
-18
Jun-
18
Jun-
18
Jul-1
8
Jul-1
8
Aug
-18
Aug
-18
Aug
-18
Sep
-18
Sep
-18
Oct
-18
RUB vs. IDR:COP basketSanctions risk premia via CDS* (bp, rs inverted scale)
correlation = 77%
less risk premia, stronger RUB
more risk premia, weaker RUB
* 5Y CDS for Russia – average 5Y CDS for Indonesia and Columbia
Chart 15: RON: Support from FX intervention may run its course at some point
Chart 16: CEEMEA FX: degree of openness vs. sensitivity to global trade growth
0.0
2.0
4.0
6.0
8.0
10.0
12.0
14.0
16.0
0.00.51.01.52.02.53.03.54.04.55.0
Jan-
98D
ec-9
8N
ov-9
9O
ct-0
0S
ep-0
1A
ug-0
2Ju
l-03
Jun-
04M
ay-0
5A
pr-0
6M
ar-0
7Fe
b-08
Jan-
09D
ec-0
9N
ov-1
0O
ct-1
1S
ep-1
2A
ug-1
3Ju
l-14
Jun-
15M
ay-1
6A
pr-1
7M
ar-1
8Fe
b-19
EUR-RON Reserves Import cover ratio (rs)
TRY
PLN
RONRUB
CZK
HUF
0
10
20
30
40
50
60
70
0 50 100 150 200
corre
latio
n of
NE
ER
yoy
with
glo
bal t
rade
(v
olum
e gr
owth
, yoy
, %)
openness (exports+imports/GDP, %)
Chart 17: Weakening German manufacturing orders flag modest PLN downside
Chart 18: TRY: Despite a better tone, weaker USD and a likely compressed C/A deficit in September, Turkey was still drawing down FX reserves
88
90
92
94
96
98
100
102
104
-10
-5
0
5
10
15
20
Sep
-10
Feb-
11Ju
l-11
Dec
-11
May
-12
Oct
-12
Mar
-13
Aug
-13
Jan-
14Ju
n-14
Nov
-14
Apr
-15
Sep
-15
Feb-
16Ju
l-16
Dec
-16
May
-17
Oct
-17
Mar
-18
Aug
-18
Jan-
19
Germany Manufacturing Orders (yoy, 3MMA, 4M lead)PLN NEER (3MMA, rs)
71% correlation, 2010-present
-20
-15
-10
-5
0
5
10
1-Ja
n15
-Jan
29-J
an12
-Feb
26-F
eb12
-Mar
26-M
ar9-
Apr
23-A
pr7-
May
21-M
ay4-
Jun
18-J
un2-
Jul
16-J
ul30
-Jul
13-A
ug27
-Aug
10-S
ep24
-Sep
8-O
ct22
-Oct
5-N
ov19
-Nov
3-D
ec17
-Dec
31-D
ec
2017 2010-16 average 2018USD bn
reserve depletion being seen even into Septemberdespite a likely closing of the C/A deficit
Source: Bloomberg, Haver, UniCredit Research

<date>
September 2018 CEE Macro & Strategy Research
CEE Quarterly
UniCredit Research page 39 See last pages for disclaimer.
Countries

<date>
September 2018 CEE Macro & Strategy Research
CEE Quarterly
UniCredit Research page 40 See last pages for disclaimer.
Bulgaria Baa2 stable/BBB- positive/BBB stable*
Outlook A pickup in investment will provide a welcome boost to growth at a moment when exports are likely to lose some steam with demand in some key trading partners forecasted to slow down. The fallout from the crisis in Turkey will be significant, but manageable and limited to the trade channel, as Bulgaria’s vulnerability indicators remain at very comfortable levels. Fiscal policy is set to shift from growth neutral this year to moderately stimulative next year, supporting growth in 2019.
Strategy BGARIA EUR bonds continue to look expensive compared to regional peers, but may be cushioned in risk-off episodes by scarcity. BGARIA EUR 38 is the most attractive bond on the curve from a Z-spread perspective.
Author: Kristofor Pavlov, Chief Economist (UniCredit Bulbank)
KEY DATES/EVENTS
■ Oct/Nov: 2019 Government Budget
■ 3 Oct, 14 Nov, 7 Dec: GDP data (revised data for 2017,
3Q18 flash estimate, 3Q18 structure)
■ 19 Oct, 19 Nov, 18 Dec: Balance of payments
■ 15 Oct, 14 Nov, 12 Dec: CPI inflation
GDP GROWTH FORECAST
yoy (%)
3.6
3.9 3.6 3.8 4.2
-3
-1
1
3
5
7
9
2015 2016 2017 2018F 2019F
Private consumption Public consumptionFixed Investments Net ExportInventories GDP, real growth
INFLATION FORECAST
-3
-2
-1
0
1
2
3
4
Dec-15 Dec-16 Dec-17 Dec-18 Dec-19
yoy (%)
Source: NSI, UniCredit Research
MACROECONOMIC DATA AND FORECASTS
2015 2016 2017 2018F 2019F GDP (EUR bn) 45.3 48.1 50.4 53.8 57.6
Population (mn) 7.2 7.1 7.1 7.0 7.0
GDP per capita (EUR) 6,330 6,777 7,153 7,665 8,259
Real economy, yoy change (%) GDP 3.6 3.9 3.6 3.8 4.2
Private Consumption 4.5 3.5 4.8 4.5 4.6
Fixed Investment 2.7 -6.6 3.8 10.5 9.0
Public Consumption 1.4 2.2 3.2 4.1 5.1
Exports 5.7 8.1 4.0 3.8 3.6
Imports 5.4 4.5 7.2 5.5 5.2
Monthly wage, nominal (EUR) 449 485 542 591 644
Real wage, change (%) 7.6 8.8 9.8 6.2 6.0
Unemployment rate (%) 9.1 7.6 6.2 5.3 4.8
Fiscal accounts (% of GDP) Budget balance -1.6 0.2 0.9 0.7 -0.2
Primary balance -0.7 1.1 1.7 1.3 0.4
Public debt 25.7 28.6 25.1 23.1 22.1
External accounts Current account balance (EUR bn) 0 1.2 3.4 1.4 1.0
Current account balance/GDP (%) 0 2.6 6.7 2.6 1.8
Extended basic balance/GDP (%) 7.8 5.9 9.7 6.1 5.4
Net FDI (% of GDP) 4.9 1.3 2.1 2.2 2.3
Gross foreign debt (% of GDP) 74.0 71.1 66.1 60.1 54.8
FX reserves (EUR bn) 20.3 23.9 23.7 25.3 26.9
Months of imports, goods & services 8.0 9.4 8.1 8.1 8.0
Inflation/Monetary/FX CPI (pavg) -0.8 -0.8 2.1 2.8 3.0
CPI (eop) 0.1 0.1 2.8 3.2 2.7
Central bank reference rate (eop) 0.01 0 -0.39 -0.47 -0.26
USD/BGN (eop) 1.79 1.86 1.63 1.63 1.56
EUR/BGN (eop) 1.96 1.96 1.96 1.96 1.96
USD/BGN (pavg) 1.76 1.77 1.73 1.64 1.59
EUR/BGN (pavg) 1.96 1.96 1.96 1.96 1.96
Real effective exchange rate, 2000=100 136.9 136.1 138.5 145.9 150.2
Change (%) -2.1 -0.6 1.8 5.3 3.0
Source: Eurostat, NSI, BNB, MoF, UniCredit Research
*Long-term foreign currency credit rating provided by Moody’s, S&P and Fitch, respectively

<date>
September 2018 CEE Macro & Strategy Research
CEE Quarterly
UniCredit Research page 41 See last pages for disclaimer.
Investment to give the economy a fresh impetus The shift in the composition of growth from consumption to investment continues The Turkish economy looks poised for a recession, which will hit Bulgarian exports Fiscal policy is likely to shift from growth neutral in 2018 to moderately stimulative in 2019 Housing construction shifted to a higher gear
Spurred by synchronized recoveries in consumption and investment, the economy expanded by 3.4% yoy in 2Q18, a tad weaker than both the 3.7% average reported during the preceding four quarters and our call for 3.8% real GDP growth. On the positive side, the composition of GDP growth continued shifting from consumption to investment, which is a welcome transformation that will make the ongoing expansion more balanced and lasting, if policy makers are successful in preventing another unsustainable increase in real estate prices.
The recent weakness of the Turkish economy has spurred contagion concerns. Indeed, Bulgaria looks vulnerable, with slightly less than 8% of last year’s goods exports going to Turkey. The decline was already visible in the first seven months so far this year when exports to Turkey dropped a hefty 25.4% yoy. Our baseline macro scenario for Turkey envisages that this trend will persist in the rest of 2018 and 2019, before reversing in 2020 when growth is expected to rebound. Apart from the negative effect via the trade channel, the fallout from Turkish problems should be limited, as Bulgaria’s vulnerability indicators are at very comfortable levels, which should limit spillover via financial and any other contagion channel. Nevertheless, the size of the export contraction will be strong enough to trigger a slight downward revision to our growth projection for this year to 3.8% (from previously 4.0%).
Encouraged by constantly improving tax collection, the government has announced plans to raise public sector wages next year. This should help to address understaffing and underpayment in some parts of the public sector such as health care, defense, and particularly education, where the situation looks most alarming. The size of the increases will vary by sector and is likely to be around 10% on average, with the exception of education, where the government will stick to its already existing commitment for a 20% rise. The planned spending increase is equivalent to an additional 1.0% of GDP and, given its size, it should provide a solid boost to incomes and consumption next year, despite the advanced stage of the ongoing recovery. Therefore, we revised upward our real GDP growth forecast for next year to 4.2% from the 3.9% forecasted three months ago.
Public investment spending rose to 1.6% of FY GDP for the first seven months of the year, after tumbling to its lowest level in the same period in 2017 (1.0%). Manufacturing companies have continued to channel part of their savings into new plant and equipment, as capacity utilization reached a record high in 3Q18 (see lhs chart), while investment in transport equipment is likely to post another hefty rise, after newly registered light commercial vehicles increased 32.4% yoy in 1H18 (see rhs chart). But it was housing construction that contributed the most to the investment expansion in 1H18.
CAPACITY UTILIZATION INDEX CLIMBED TO A NEW HIGH … …WHILE INVESTMENT IN TRANSPORT EQUIPMENT IS LIKELY TO POST ANOTHER SOLID RISE THIS YEAR
404550556065707580859095
100
3Q00 1Q02 3Q03 1Q05 3Q06 1Q08 3Q09 1Q11 3Q12 1Q14 3Q15 1Q17 3Q18
Capacity utilization in manufacturing industry
3Q1877.1
1Q0776.5
0
100
200
300
400
500
600
700
800
Dec-10 Sep-11 Jun-12 Mar-13 Dec-13 Sep-14 Jun-15 Mar-16 Dec-16 Sep-17 Jun-18
Number of new Light Commercial Vehicles up to 3.5t in BulgariaLinear (Number of new Light Commercial Vehicles up to 3.5t in Bulgaria)Trend
Source: Eurostat, ACEA, UniCredit Research

<date>
September 2018 CEE Macro & Strategy Research
CEE Quarterly
UniCredit Research page 42 See last pages for disclaimer.
We see a stronger credit impulse this year than we forecasted previously Bulgaria is the first non-euro zone member to seek joining the banking union Euro adoption will provide an important policy anchor Inflation increased to 3.5% in August, driven by a combination of factors Inflation looks set to ease slightly later this year, but creep up again in 2019
Even stronger growth is likely in 2H18 and in 2019, underpinned by rising real estate prices and a surge in new construction permits, as demand for both residential and commercial real estate looks far from satiated. Favorable financing conditions also helped investment. Credit growth accelerated to 6.0% yoy in July (see lhs chart), which will likely prove even stronger when adjusted for NPL sales, which are set to hit a fresh high as banks are preparing for the new stress tests and AQR due next year.
In August, the government approved a roadmap to euro adoption. On top of the pledge to reduce corruption and organized crime, which, in our view, remain the Achilles heal of the economy, the roadmap contains commitments to improve the performance in several important areas. These include: strengthening banks, and the supervision of the non-banking financial sector in close cooperation with the ECB, improving the insolvency and anti-money laundering framework, as well as the governance of state-owned enterprises. Progress in all these areas, if and when achieved, should open the way for Bulgaria to join simultaneously both ERM II and the Banking Union. The agreement signed in June with the finance ministers of EA member states and the ECB sets a one-year horizon, during which these commitments should be met before the ECB assesses the progress and considers Bulgaria’s ERM II entry.
The commitments to reduce corruption and organized crime and reform the judiciary are not new, but their inclusion in the June memorandum is important, because by linking them to the country’s euro adoption aspirations, they become policy anchors with increased pressure to perform. The commitment to improve financial sector supervision is also not new, but the need to comply with Banking Union requirements will accelerate the process and make it more transparent. To ensure a smooth transition into the Banking Union, the ECB will carry out an AQR and stress test for the local banking sector. These are planned to take place in the course of 2019 and will be based on banks’ financial performance at the end of 2018.
Inflation accelerated, touching 3.5% in August, while core inflation climbed to a 7-year high (2.5% yoy) at the same time. This reflects a combination of factors. Exogenous factors played an important role, mainly higher energy prices (first and second-round effects), as well as firmer food prices, as bad weather affected the harvest of some fruits and vegetables during the summer. At the same time, demand-side related factors also contributed to higher inflation so far this year, as both wages and credit feed into core inflation, albeit with a lag.
We expect inflation to ease slightly later this year, but to start creeping up again in 2019. Energy price inflation will soon start receding in yoy terms as the base effect is vanishing. Food price increases however are not over yet, as more time will be needed for the recent surge in unprocessed food costs to feed through into the prices of processed food. Demand-side related factors are forecasted to add more pressure on core prices. Consequently, we forecast 2.8% average headline inflation in 2018 and 3.0% in 2019, while average core inflation is seen to rise to 2.1% in 2018 and further to 2.7% in 2019 (see rs chart).
AFTER A PROLONGED PERIOD OF WEAKNESS, CREDIT GROWTH IS ON A RISE
HEADLINE INFLATION TO EASE SLIGHTLY
-15
-10
-5
0
5
10
15
Jul-14 Jan-15 Jul-15 Jan-16 Jul-16 Jan-17 Jul-17 Jan-18 Jul-18
yoy (%) Growth on outstanding loans, adjusted with the effect from the reclassification of BNP Paribas from non-bank financial company in to a bank branch
-3.0
-1.5
0.0
1.5
3.0
4.5
6.0
Dec-14 Dec-15 Dec-16 Dec-17 Dec-18 Dec-19
Contribution of energy prices Contribution of food pricesContribution of core CPI Inflation (CPI, yoy)%
Source: BNB, NSI, UniCredit Research
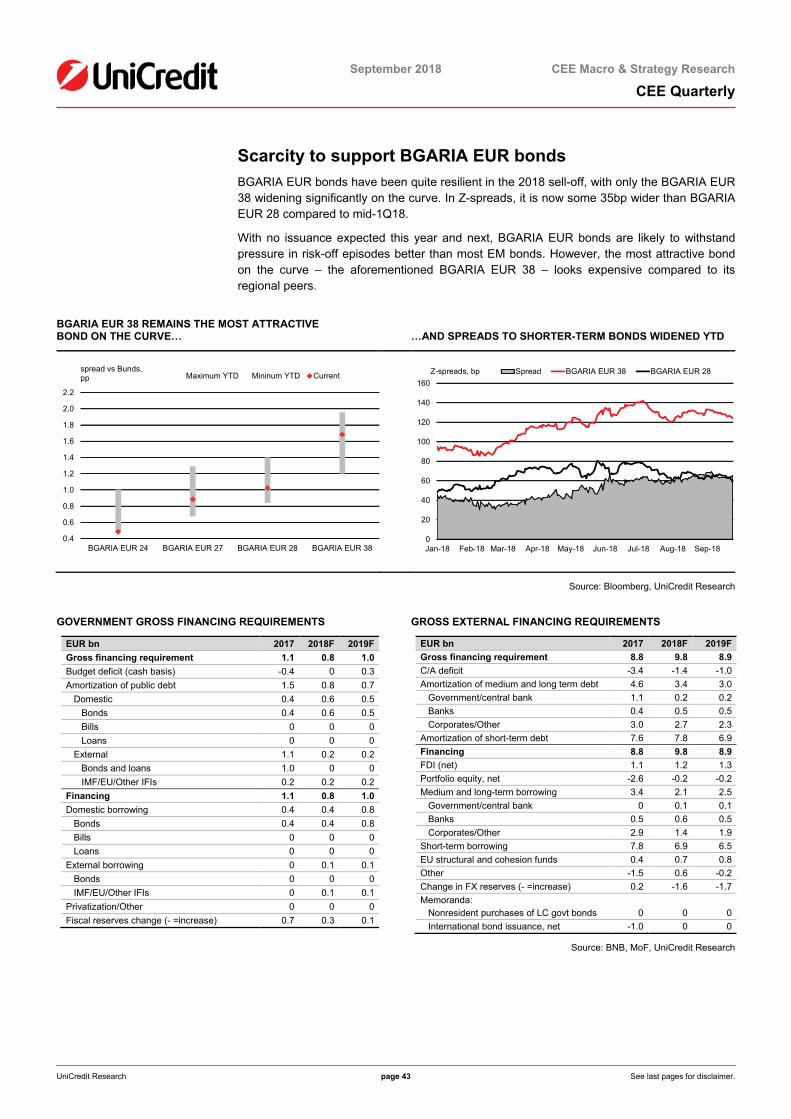
<date>
September 2018 CEE Macro & Strategy Research
CEE Quarterly
UniCredit Research page 43 See last pages for disclaimer.
Scarcity to support BGARIA EUR bonds
BGARIA EUR bonds have been quite resilient in the 2018 sell-off, with only the BGARIA EUR 38 widening significantly on the curve. In Z-spreads, it is now some 35bp wider than BGARIA EUR 28 compared to mid-1Q18.
With no issuance expected this year and next, BGARIA EUR bonds are likely to withstand pressure in risk-off episodes better than most EM bonds. However, the most attractive bond on the curve – the aforementioned BGARIA EUR 38 – looks expensive compared to its regional peers.
BGARIA EUR 38 REMAINS THE MOST ATTRACTIVE BOND ON THE CURVE…
…AND SPREADS TO SHORTER-TERM BONDS WIDENED YTD
0.4
0.6
0.8
1.0
1.2
1.4
1.6
1.8
2.0
2.2
BGARIA EUR 24 BGARIA EUR 27 BGARIA EUR 28 BGARIA EUR 38
Maximum YTD Mininum YTD Currentspread vs Bunds, pp
0
20
40
60
80
100
120
140
160
Jan-18 Feb-18 Mar-18 Apr-18 May-18 Jun-18 Jul-18 Aug-18 Sep-18
Spread BGARIA EUR 38 BGARIA EUR 28Z-spreads, bp
Source: Bloomberg, UniCredit Research
GOVERNMENT GROSS FINANCING REQUIREMENTS
GROSS EXTERNAL FINANCING REQUIREMENTS
EUR bn 2017 2018F 2019F Gross financing requirement 1.1 0.8 1.0 Budget deficit (cash basis) -0.4 0 0.3 Amortization of public debt 1.5 0.8 0.7 Domestic 0.4 0.6 0.5 Bonds 0.4 0.6 0.5 Bills 0 0 0 Loans 0 0 0 External 1.1 0.2 0.2 Bonds and loans 1.0 0 0 IMF/EU/Other IFIs 0.2 0.2 0.2 Financing 1.1 0.8 1.0 Domestic borrowing 0.4 0.4 0.8 Bonds 0.4 0.4 0.8 Bills 0 0 0 Loans 0 0 0 External borrowing 0 0.1 0.1 Bonds 0 0 0 IMF/EU/Other IFIs 0 0.1 0.1 Privatization/Other 0 0 0 Fiscal reserves change (- =increase) 0.7 0.3 0.1
EUR bn 2017 2018F 2019F Gross financing requirement 8.8 9.8 8.9 C/A deficit -3.4 -1.4 -1.0 Amortization of medium and long term debt 4.6 3.4 3.0 Government/central bank 1.1 0.2 0.2 Banks 0.4 0.5 0.5 Corporates/Other 3.0 2.7 2.3 Amortization of short-term debt 7.6 7.8 6.9 Financing 8.8 9.8 8.9 FDI (net) 1.1 1.2 1.3 Portfolio equity, net -2.6 -0.2 -0.2 Medium and long-term borrowing 3.4 2.1 2.5 Government/central bank 0 0.1 0.1 Banks 0.5 0.6 0.5 Corporates/Other 2.9 1.4 1.9 Short-term borrowing 7.8 6.9 6.5 EU structural and cohesion funds 0.4 0.7 0.8 Other -1.5 0.6 -0.2 Change in FX reserves (- =increase) 0.2 -1.6 -1.7 Memoranda: Nonresident purchases of LC govt bonds 0 0 0 International bond issuance, net -1.0 0 0
Source: BNB, MoF, UniCredit Research

<date>
September 2018 CEE Macro & Strategy Research
CEE Quarterly
UniCredit Research page 44 See last pages for disclaimer.
Croatia Ba2 stable/BB+ positive/BB+ positive*
Outlook Recent developments suggest that GDP growth will remain more or less stable at around 2.8% in 2018 and 2019. The composition of growth will change, however, as net exports are replaced by domestic demand and private consumption by investment. However, the slowdown in private consumption will be gradual, supported by a new package of tax cuts currently in the pipeline, The proposed tax cuts also mean some moderation in public revenue growth which, given current expenditure plans, is likely to result in modest even though slightly wider fiscal deficits.
Strategy CROATI bonds have tightened excessively compared to their better-rated regional peers.
Author: Hrvoje Dolenec, Chief Economist (Zagrebačka banka)
KEY DATES/EVENTS
■ 22 Oct: EDP Report
■ 28 Nov: 3Q GDP Flash Estimate
■ 30 Nov: Detailed 3Q GDP Release
■ 7 Dec: Rating update by Fitch
■ 1H Dec: Budget approval for 2019
GDP GROWTH FORECAST
-2
-1
0
1
2
3
4
2015 2016 2017 2018F 2019F
Private Consumption Government ConsumptionInvestment InventoriesNet Exports GDP
INFLATION FORECAST
-3
-2
-1
0
1
2
3
4
5
6
Jan-09 Jan-10 Jan-11 Jan-12 Jan-13 Jan-14 Jan-15 Jan-16 Jan-17 Jan-18 Jan-19
Source: Eurostat, CNB, CBS, UniCredit Research
MACROECONOMIC DATA AND FORECASTS
EUR bn 2015 2016 2017 2018F 2019F GDP (EUR bn) 44.6 46.7 49.0 51.5 53.8
Population (mn) 4.2 4.2 4.1 4.1 4.0
GDP per capita (EUR) 10,617 11,177 11,878 12,597 13,287
Real economy, change (%) GDP 2.4 3.5 2.9 2.8 2.8
Private Consumption 1.0 3.4 3.6 3.2 2.8
Fixed Investment 3.8 6.5 3.8 4.7 6.7
Public Consumption -1.0 0.7 2.7 2.3 2.2
Exports 9.4 5.6 6.4 4.3 4.0
Imports 9.2 6.2 8.1 5.8 6.0
Monthly gross wage, nominal (EUR) 1,000 1,029 1,080 1,137 1,181
Real wage, change (%) 1.8 3.0 2.8 3.2 2.2
Unemployment rate (%) 16.3 13.1 11.2 9.6 9.1
Fiscal accounts (% of GDP) Budget balance -3.4 -0.9 0.8 -0.5 -0.5
Primary balance 0 2.1 3.4 2.0 1.6
Public debt 83.7 80.2 77.5 74.4 71.7
External accounts Current account balance (EUR bn) 2.0 1.2 1.9 1.2 0.9
Current account balance/GDP (%) 4.5 2.6 3.9 2.4 1.7
Extended basic balance/GDP (%) 5.8 7.9 6.9 7.6 7.2
Net FDI (% of GDP) 0.5 4.1 2.5 3.1 3.3
Gross foreign debt (% of GDP) 101.7 89.3 81.8 75.9 73.2
FX reserves (EUR bn) 13.7 13.5 15.7 17.0 18.5
Months of imports, goods & services 8.0 7.6 7.8 7.9 7.9
Inflation/Monetary/FX CPI (pavg) -0.5 -1.1 1.1 1.6 1.8
CPI (eop) -0.6 0.2 1.2 1.9 2.2
3M money market rate (Dec avg) 1.24 0.82 0.55 0.50 0.55
USD/FX (eop) 6.99 7.17 6.27 6.25 6.00
EUR/FX (eop) 7.64 7.56 7.51 7.50 7.50
USD/FX (pavg) 6.86 6.81 6.62 6.18 6.04
EUR/FX (pavg) 7.61 7.53 7.46 7.42 7.43
Real effective exchange rate, 2000=100 103.8 103.8 103.9 104.2 104.1
Change (%) -1.3 0 0.1 0.3 -0.1
Source: Eurostat, CNB, CBS, UniCredit Research
*Long-term foreign currency credit rating provided by Moody’s, S&P and Fitch, respectively

<date>
September 2018
CEE Macro & Strategy Research
CEE Quarterly
UniCredit Research page 45 See last pages for disclaimer.
Fiscal position benefiting from growth, risks not yet gone GDP growth continues the pattern when it exited recession on net exports and domestic private consumption GDP performance compatible with our projections of growth of 2.8% in both 2018 and 2019… …finding more support in investment ad domestic driver of growth
Recent performance reveals at least three trends driving short-term growth… …changing the structure of industry contribution from “traditional” to “new” industries, deceleration in growth of tourism and acceleration in construction sector
Croatia’s economy continues to enjoy the same growth mix that helped it recover since 2015: strong export growth, both of goods and services, accompanied by gradually firming private consumption. The former has been driven by solid external demand, especially in the eurozone, and Croatia’s EU accession. The latter has been rooted in rising employment, stronger wage growth and a series of tax cuts that have supported the disposable income of households. These include two rounds of changes in the income tax system (in 2015 and 2017), which lowered the tax burden for individuals by increasing non-taxable income, changing tax rates and raising the income threshold subject to a lower tax rate.
Growth in 1H 2018, at 2.7% yoy, is compatible with our previous projections, although the composition has changed, with an ongoing positive contribution of exports but weaker-than-anticipated investment. On the other hand, private consumption is proving stronger than expected. Looking forward, we still foresee investment to accelerate in 2H18 and 2019, based on the large number of signed contracts for EU funding yet to be implemented and the improved investment climate, with the Economic Sentiment Index near all-time highs. Private consumption should remain more resilient, meanwhile, with recent plans for a new tax package for 2019 likely to provide another boost to disposable income. Nevertheless, we expect growth to remain at 2.8% in both 2018 and 2019, as external demand eases following the moderation of growth in the eurozone.
Developments so far in 2018 point to at least three trends that will drive GDP growth in the near term. First, industrial production is showing some weakness, rooted in some “traditional industries” – oil refining, shipbuilding and chemical sector. Shipbuilding is, beside lower capacity in most shipyards, significantly impacted by increasing difficulties in Uljanik, the only shipyard that avoided restructuring prior to EU accession and might have to be restructured now or end up in bankruptcy. Chemical industry weaknesses are mostly linked to Petrokemija, a majority state-owned producer of inputs for agriculture (fertilizers, animal feed supplements), which needs another capital injection this year, while still searching for a strategic partner for its business. The service sectors (including ICT and professional services) have been expanding at an above-average pace. Second, tourism growth is decelerating due to capacity limitations in the peak season and the recovery in some other Mediterranean competitors. Third, construction growth is starting to accelerate, benefiting from rising demand and real estate prices. Construction should significantly benefit also from the infrastructure projects funded by the EU, but, at the same time, faces major labor shortages due to stepped-up emigration to nearby eurozone countries (mostly Austria and Germany).
INVESTMENT CLIMATE INDICES REMAIN CLOSE TO ALL-TIME HIGHS…
...BUT DIFFERENT TRENDS ARE SEEN AMONG THE SECTORS
70
80
90
100
110
120
130
-60
-50
-40
-30
-20
-10
0
10
20
30
May-08 Aug-09 Nov-10 Feb-12 May-13 Aug-14 Nov-15 Feb-17 May-18
ESI.INDU ESI.SERV ESI.RETA ESI.BUIL ESI (r.s.)
50
60
70
80
90
100
110
1Q08 1Q09 1Q10 1Q11 1Q12 1Q13 1Q14 1Q15 1Q16 1Q17 1Q18
GVA
(201
8=10
0)
Manufacturing Construction Trade and TourismICT Professional
Source: Crostat, European Commission, UniCredit Research

<date>
September 2018
CEE Macro & Strategy Research
CEE Quarterly
UniCredit Research page 46 See last pages for disclaimer.
Labor market continues to recover but… …as unemployment declines imbalances become more transparent Solid GDP growth is beneficial for the fiscal performance, with rising revenues and restrained expenditures… …with a few risks that create pressure on the expenditure performance Despite those risks, authorities are attempting to cut the tax burden, seizing on improved fiscal position and the supporting business environment… …watching carefully on the risk sources.
On the other hand, the combination of local economic recovery and emigration of working-age population to the EU is improving labor-market metrics. Employment, even though still some 6% below the pre-crisis level (measured by the number of employees), is rising at an annual pace of some 2%. Unemployment is decreasing much faster, given the shrinking labor force, resulting in the lowest unemployment rate since the 1990s – currently well below 9%. Despite these improvements, significant structural imbalances remain, with Croatia having one of the lowest employment and participation rates in the EU – especially when combined with a shortage of workers in some sectors (e.g. in expanding tourism, construction and ICT) despite an unemployment level well above its CEE peers.
The solid growth performance was beneficial for public finances. Available year-to-date data on the government budget outturn signals revenues are still rising faster than expenditures. Following last year’s performance, it might result in a very mild deficit or even a surplus in the general government budget in 2018. However, this wouldn’t be possible if based only on growth in revenues. In 2018, authorities benefited also from lower interest expenditures and spending on subsidies (to shipyards, railways and agriculture), compensating partially for growth in the wage bill. That said, such a final outcome is not guaranteed due to risks we see in two segments. First is recurrent – the annual financial gap that is inherent in the health care sector in the amount of 0.4-0.5% of GDP. The second stems from the financial woes of the Uljanik shipyard. In the past few years, authorities have provided guarantees to the shipbuilding sector, creating contingent liabilities in case of the shipyard’s’ poor performance. It seems that recent events may induce one-off expenditure of roughly 0.15% of GDP if other, less likely, solutions are not found. Even so, Uljanik is far from a final resolution as the government intervened and stepped in to discuss options with remaining buyers and potential strategic partners to join the effort of company restructuring. Therefore, it leads us to stick to our deficit forecast of a 0.5% of GDP in 2018.
For 2019, we expect the same deficit of 0.5% of GDP. Although we have a positive view of the revenue performance, it should actually become restrained. The government has presented for public discussion a proposal for a package of new tax changes. It aims to reduce the tax burden (including different contributions charged with the salary). It is proposed that two different contributions will be fully cut (also simplifying the procedure of salary calculation), implement a lower VAT rate on some consumer basket items, and increase the income bracket charged with lower (of two) income tax rates. However, the net effect of these measures in 2019 could be around 0.2% of GDP in terms of revenues as there is a catch in the package. The proposal is to also raise the contribution for health care from salaries from 15% to 16.5%, reducing the existing gap in health sector funding. However, two longer-term issues persist, namely the sustainability of the healthcare system that can be addressed only through a deeper reform and the very large tax burden on companies, which weighs on growth.
GOVERNMENT INTENDS TO CUT THE TAX BURDEN, BUT…
…CURRENT SPENDING IS PUSHING GENERAL GOVERNMENT TO A MILD DEFICIT
33.5
34.0
34.5
35.0
35.5
36.0
36.5
37.0
37.5
38.0
38.5
2010 2011 2012 2013 2014 2015 2016 2017 2018F 2019F
Tax burden(% of GDP)
-10
-8
-6
-4
-2
0
2
4
6
2010 2011 2012 2013 2014 2015 2016 2017 2018F 2019F
% of GDP Balance Primary Balance Structural Balance
Source: Crostat, Eurostat, central bank, MoF, UniCredit Research

<date>
September 2018
CEE Macro & Strategy Research
CEE Quarterly
UniCredit Research page 47 See last pages for disclaimer.
Unattractive valuation for CROATI bonds
CROATI bond spreads have narrowed since the beginning of the year. While a likely resolution for Agrokor and good economic and fiscal performance may have warranted lower spreads, we think that the tightening has been excessive on the back of strong demand from local money managers. As a result, bonds look expensive compared to regional peers.
The best comparison is with ROMANI bonds of similar maturities. Both CROATI EUR and USD bonds are now trading inside comparable ROMANI bonds, although Croatia is a sub-investment grade credit and the country’s financing needs are larger than Romania’s (in percent of GDP) due to public debt being more than twice larger in Croatia than in Romania (74.4% of GDP vs 36% of GDP).
Among CROATI EUR bonds, CROATI EUR 27 has a higher cash price, but looks more attractive both as a spread to Bunds and in Z-spreads, since the yield pick-up for CROATI EUR 28 and 30 is too small.
TIGHT CROATI EUR SPREADS VS. BUNDS CROATI EUR TOO EXPENSIVE COMPARED TO ROMANI EUR
0.0
0.5
1.0
1.5
2.0
2.5
3.0
CROATI EUR22
CROATI EUR25
CROATI EUR27
CROATI EUR28
CROATI EUR30
Maximum YTD Mininum in YTD CurrentSpread vs Bunds, pp
-100
-50
0
50
100
150
200
250
Feb-18 Mar-18 Apr-18 May-18 Jun-18 Jul-18 Aug-18 Sep-18
Spread CROATI EUR 30
ROMANI EUR 30Z-spreads, bp
Source: Bloomberg, UniCredit Research
GOVERNMENT GROSS FINANCING REQUIREMENTS
GROSS EXTERNAL FINANCING REQUIREMENTS
EUR bn 2017 2018F 2019F Gross financing requirement 9.8 7.8 8.3 Budget deficit -0.4 0.3 0.3 Amortization of public debt 10.2 7.5 8.1 Domestic 7.7 6.0 5.9 Bonds 1.3 0.8 1.0 Bills 3.9 2.4 3.9 Loans 2.5 2.8 1.0 External 2.5 1.5 2.2 Bonds and loans 2.4 1.4 2.1 IMF/EU/Other IFIs 0.1 0.1 0.1 Financing 9.8 7.8 8.3 Domestic borrowing 7.0 4.5 6.4 Bonds 2.3 1.4 1.4 Bills 3.9 2.4 3.9 Loans 0.8 0.8 1.2 External borrowing 2.6 1.1 1.5 Bonds 2.5 1.0 1.4 IMF/EU/Other IFIs 0.1 0.1 0.1 Privatization/Other 0.2 2.2 0.4
Source: BNB, MoF, UniCredit Research
EUR bn 2017 2018F 2019F Gross financing requirement 12.8 12.3 10.0 C/A deficit -1.9 -1.2 -0.9 Amortization of medium and long term debt 7.9 5.3 4.5 Government/central bank 2.5 1.5 2.2 Banks 1.0 0.5 0.5 Corporates/Other 4.4 3.3 1.8 Amortization of short-term debt 6.9 8.2 6.4 Government/central bank 4.4 4.0 3.6 Banks 1.5 3.0 1.6 Corporates/Other 1.0 1.2 1.2 Financing 12.8 12.3 10.0 FDI (net) 1.3 1.6 1.8 Portfolio equity, net -0.3 0.5 0.8 Medium and long-term borrowing 5.7 3.8 3.8 Government/central bank 2.6 1.1 1.5 Banks 1.0 1.0 0.8 Corporates/Other 2.1 1.7 1.5 Short-term borrowing 6.5 6.4 3.5 EU structural and cohesion funds 0.3 1.0 1.1 Other 1.6 0.3 0.5 Change in FX reserves (- = increase) -2.2 -1.3 -1.5 Memoranda: Nonresident purchases of LC govt bonds n.a. n.a. n.a. International bond issuance, net 1.2 0.3 0.2

<date>
September 2018
CEE Macro & Strategy Research
CEE Quarterly
UniCredit Research page 48 See last pages for disclaimer.
Czech Republic A1 positive/AA- stable/AA- stable*
Outlook 2018 GDP growth is projected at 3.0%, a half percentage point lower than three months ago, which is more due to 1H18 downward revisions than to a changing outlook. We maintain our 2.8% forecast for 2019. Various imbalances are set to persist as a legacy of the past fast-speed growth, with the labor market in particular facing a growing shortage that fuels wage pressure. Fiscal policy may turn expansionary in 2019. The fifth hike of this year is likely to come in 4Q18 and the central bank may hike twice more to 2.25% in 2019 on the back of above-target inflation.
Strategy The CZGB curve is likely to bear-flatten further and the 2-10Y yield spread could fall below 50bp.
Author: Pavel Sobíšek, Chief Economist (UniCredit Bank Czech Republic and Slovakia)
KEY DATES/EVENTS
■ 5-6 Oct: Local and Senate elections
■ 9 Oct, 9 Nov, 10 Dec: CPI
■ 12 Oct: rating review from Moody’s
■ 1 Nov, 20 Dec: CNB policy meetings
■ 14 Nov, 30 Nov: GDP (flash, structure)
GDP GROWTH FORECAST
-2
0
2
4
6
2014 2015 2016 2017 2018F 2019F
Consumption Gross capital
Export GDP (yoy, %)Contribution to GDP (pp)
INFLATION FORECAST
-1
0
1
2
3
4
5
Jan-17 Jul-17 Jan-18 Jul-18 Jan-19 Jul-19
CPI PPI
Source: CZSO, UniCredit Research
MACROECONOMIC DATA AND FORECASTS
EUR bn 2015 2016 2017 2018F 2019F GDP (EUR bn) 168.5 176.3 191.9 208.9 223.5
Population (mn) 10.5 10.6 10.6 10.6 10.7
GDP per capita (EUR) 15,984 16,687 18,117 19,675 20,984
Real economy, change (%) GDP 5.4 2.4 4.5 3.0 2.8
Private Consumption 3.7 3.6 4.4 4.0 3.4
Fixed Investment 10.4 -3.3 3.7 6.4 4.0
Public Consumption 1.9 2.7 1.3 2.4 2.0
Exports 6.2 4.1 7.2 4.2 3.5
Imports 6.9 2.6 6.3 5.3 4.0
Monthly wage, nominal (EUR) 975 1,027 1,120 1,254 1,366
Real wage, change (%) 2.9 3.7 3.6 6.0 3.9
Unemployment rate (%) 6.5 5.5 4.2 3.2 3.2
Fiscal accounts (% of GDP) Budget balance -0.6 0.7 1.6 0.8 -0.2
Primary balance 0.4 1.7 2.4 1.6 0.6
Public debt 40.0 36.8 34.6 32.0 30.7
External accounts Current account balance (EUR bn) 0.4 2.7 2.1 1.3 1.1
Current account balance/GDP (%) 0.2 1.6 1.1 0.6 0.5
Extended basic balance/GDP (%) 1.4 6.6 4.7 3.0 2.8
Net FDI (% of GDP) -1.1 3.9 2.7 1.9 1.8
Gross foreign debt (% of GDP) 67.8 73.4 86.6 87.3 86.8
FX reserves (EUR bn) 59.2 81.3 123.4 124.0 126.0
Months of imports, goods & services 5.6 7.7 10.7 10.1 9.6
Inflation/Monetary/FX CPI (pavg) 0.3 0.7 2.5 2.2 2.7
CPI (eop) 0.1 2.0 2.4 2.4 2.7
Central bank target 2.0 2.0 2.0 2.0 2.0
Central bank reference rate (eop) 0.05 0.05 0.50 1.75 2.25
3M money market rate (Dec avg) 0.29 0.28 0.75 1.95 2.40
USD/FX (eop) 24.82 25.64 21.29 21.17 19.84
EUR/FX (eop) 27.03 27.02 25.54 25.40 24.80
USD/FX (pavg) 24.60 24.43 23.38 21.25 20.33
EUR/FX (pavg) 27.28 27.03 26.33 25.50 25.00
Real effective exchange rate, 2000=100 137.2 140.5 145.7 151.1 156.5
Change (%) 0.8 2.4 3.7 3.7 3.6
Source: Eurostat, CZSO, CNB, UniCredit Research
*Long-term foreign currency credit rating provided by Moody’s, S&P and Fitch, respectively
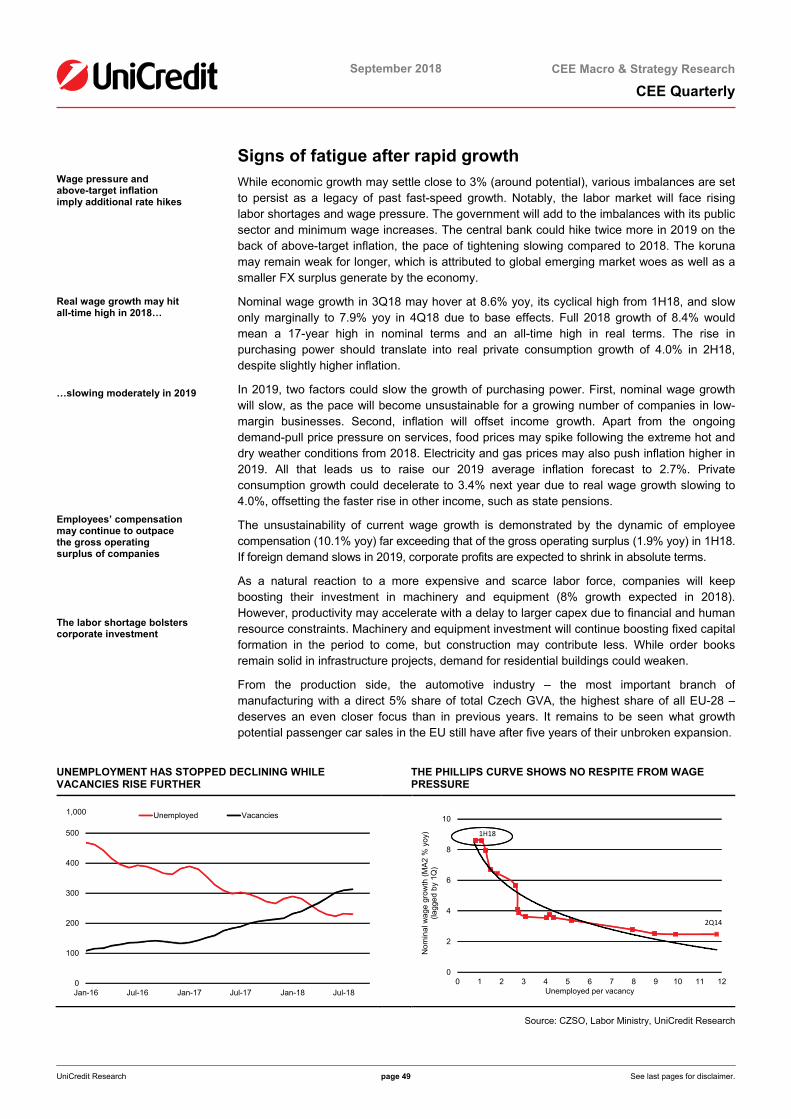
<date>
September 2018
CEE Macro & Strategy Research
CEE Quarterly
UniCredit Research page 49 See last pages for disclaimer.
Signs of fatigue after rapid growth Wage pressure and above-target inflation imply additional rate hikes Real wage growth may hit all-time high in 2018… …slowing moderately in 2019 Employees’ compensation may continue to outpace the gross operating surplus of companies The labor shortage bolsters corporate investment
While economic growth may settle close to 3% (around potential), various imbalances are set to persist as a legacy of past fast-speed growth. Notably, the labor market will face rising labor shortages and wage pressure. The government will add to the imbalances with its public sector and minimum wage increases. The central bank could hike twice more in 2019 on the back of above-target inflation, the pace of tightening slowing compared to 2018. The koruna may remain weak for longer, which is attributed to global emerging market woes as well as a smaller FX surplus generate by the economy.
Nominal wage growth in 3Q18 may hover at 8.6% yoy, its cyclical high from 1H18, and slow only marginally to 7.9% yoy in 4Q18 due to base effects. Full 2018 growth of 8.4% would mean a 17-year high in nominal terms and an all-time high in real terms. The rise in purchasing power should translate into real private consumption growth of 4.0% in 2H18, despite slightly higher inflation.
In 2019, two factors could slow the growth of purchasing power. First, nominal wage growth will slow, as the pace will become unsustainable for a growing number of companies in low-margin businesses. Second, inflation will offset income growth. Apart from the ongoing demand-pull price pressure on services, food prices may spike following the extreme hot and dry weather conditions from 2018. Electricity and gas prices may also push inflation higher in 2019. All that leads us to raise our 2019 average inflation forecast to 2.7%. Private consumption growth could decelerate to 3.4% next year due to real wage growth slowing to 4.0%, offsetting the faster rise in other income, such as state pensions.
The unsustainability of current wage growth is demonstrated by the dynamic of employee compensation (10.1% yoy) far exceeding that of the gross operating surplus (1.9% yoy) in 1H18. If foreign demand slows in 2019, corporate profits are expected to shrink in absolute terms.
As a natural reaction to a more expensive and scarce labor force, companies will keep boosting their investment in machinery and equipment (8% growth expected in 2018). However, productivity may accelerate with a delay to larger capex due to financial and human resource constraints. Machinery and equipment investment will continue boosting fixed capital formation in the period to come, but construction may contribute less. While order books remain solid in infrastructure projects, demand for residential buildings could weaken.
From the production side, the automotive industry – the most important branch of manufacturing with a direct 5% share of total Czech GVA, the highest share of all EU-28 – deserves an even closer focus than in previous years. It remains to be seen what growth potential passenger car sales in the EU still have after five years of their unbroken expansion.
UNEMPLOYMENT HAS STOPPED DECLINING WHILE VACANCIES RISE FURTHER
THE PHILLIPS CURVE SHOWS NO RESPITE FROM WAGE PRESSURE
0
100
200
300
400
500
Jan-16 Jul-16 Jan-17 Jul-17 Jan-18 Jul-18
Unemployed Vacancies1,000
0
2
4
6
8
10
0 1 2 3 4 5 6 7 8 9 10 11 12
Nom
inal
wag
e gr
owth
(MA
2 %
yoy
)(la
gged
by
1Q)
Unemployed per vacancy
2v14
1H18
Source: CZSO, Labor Ministry, UniCredit Research

<date>
September 2018
CEE Macro & Strategy Research
CEE Quarterly
UniCredit Research page 50 See last pages for disclaimer.
GDP forecast revised to 3.0% for 2018, remaining unchanged at 2.8% for 2019
The positive carry may be a more important factor for koruna strength than economic fundaments
We expect one more repo rate hike in 2018 and two more in 2019
Generous indexation of public wages and pensions will make 2019 fiscal policy expansive and pose longer-term risks
Therefore, we expect total fixed capital formation to slow to 4.0% in 2019 from 10.6% yoy in 1H18. Overall GDP growth for 2018 is projected a half percentage point lower at 3.0% than three months ago, which is more due to downward revisions for 1H18 than a changing outlook. We maintain our 2.8% forecast for 2019.
Eighteen months since the end of CNB interventions, the koruna is firmer versus the EUR by less than 6%, which is at odds with what the market and the CNB expected back then. A negative sentiment on emerging markets is a widely accepted explanation for the CZK’s poorer performance. However, we point out that changing fundamentals may play a role as well. Notably, the current account surplus has been shrinking, with the 2018 consensus forecast halved compared to six months ago. Hence, the economy does less to ease a relative lack of FX on the local market created by CNB interventions. In line with market consensus, we forecast EUR-CZK gradually dropping to 24.8 by the end of 2019. This may stem from the koruna’s positive carry rather than economic fundamentals, meaning that appreciation may be prone to corrections amid swings in risk appetite.
The recent limited reaction of EUR-CZK to a widening carry leaves the CNB space to continue tightening monetary policy. Another 25bp repo rate hike this year is likely. For 2019, we assume two 25bp hikes to bring the repo rate to 2.25%. This would be 25bp below our previous call but still above the CNB’s assumed rate trajectory which looks consistent with pausing the hiking cycle at 1.75%. The reason for our expectation of more tightening is that we stay less upbeat on CZK appreciation than the CNB, which predicts 2019-end EUR-CZK value at 24.3. Risks to our interest rate call are probably symmetric, with the EU’s economic outlook and ECB policy steps being the main factors. The CNB may adjust its monetary policy decisions depending on their impact on EUR-CZK.
The local and Senate elections to be held on 5 and 6 October may be of minor significance in terms of their immediate impact on parliamentary politics. However, they have influence on the 2019 state budget draft. With the government coalition’s aim to please voters, public sector wages and pensions are subject to generous indexations, adding 1.2% of GDP to budget expenditure compared to 2018. While the expected surplus of 0.8% of GDP in 2018 leaves public finance on a strong footing, we see two risks in the government’s approach to spending. First, the indexation makes the spending hike a permanent burden, boosting non-discretionary spending. Second, securing resources for the hike is based on the assumption that the tax income annual dynamic will exceed nominal GDP growth in both 2018 and 2019. In fact, tax income was growing faster than economic output already in 2016 and 2017, but that was for specific reasons such as a structural shift of GDP towards consumption and a one-off income hike following the enforcement of measures against tax evasion. Neither is likely to be repeated in 2019. As a result, fiscal policy is set to be expansive and public finance may slip back into a small deficit.
2018 WILL BE THE THIRD YEAR OF WAGES GROWING FASTER THAN PROFITS
TAX INCOME IS PROJECTED BY MOF TO GROW FASTER THAN GDP IN 2018-19
-2
0
2
4
6
8
10
12
2012 2013 2014 2015 2016 2017 1H18
Compensation of employees Gross operating incomeyoy (%)
80
85
90
95
100
105
110
115
2003 2005 2007 2009 2011 2013 2015 2017 2019
Tax income Nominal GDPIndex (yoy)
*2018-19 forecasts from the Ministry of Finance. Source: Czech Ministry of Finance, UniCredit Research

<date>
September 2018
CEE Macro & Strategy Research
CEE Quarterly
UniCredit Research page 51 See last pages for disclaimer.
The CZGB curve could bear-flatten further EUR-CZK will struggle to decline… …but may be less volatile than regional peers Additional rate hikes may outpace the widening in longer-term yields… …leading to a flatter CZGB curve
Poor CZK performance translated YTD into disappointing returns for short EUR-CZK positions, despite 100bp in rate increases. As a result, positioning remained heavily skewed towards long CZK, hampering a further rally. The situation is unlikely to change before year-end due to the low risk appetite for EM. A widening gap between the CNB and the ECB could eventually lead to limited appreciation next year. At the same time, the hawkish CNB may help EUR-CZK to be less volatile than EUR-HUF and EUR-PLN this year and next.
The short end of the CZK curve is likely to rise further as the CNB continues tightening and the market is pricing in 50bp in additional hikes. While the long end remains vulnerable to changes in risk appetite due to tight spreads to core eurozone bonds, corrections may prove temporary as local demand for long-term bonds remains strong and net supply may be limited by much tighter fiscal policy compared to other central European countries. As a result, we expect the CZGB curve to bear-flatten further, with the 2Y-10Y spread narrowing below 50bp. Any widening in the 2Y-10Y spread is a good entry point into flattening trades.
LONG CZK POSITIONS HAVE BEEN MORE STABLE THAN EXPECTED
CZGB 2S10S COULD FLATTEN BELOW 50BP
-20
0
20
40
60
80
100
Nov-13 Aug-14 May-15 Feb-16 Nov-16 Aug-17 May-18
Bonds held by foreign investorsBank deposits at the CNBFX reserves
EUR bn, change since FX floor was introduced (Nov 2013)
0.0
0.5
1.0
1.5
2.0
2.5
3.0
3.5
Aug-15 Feb-16 Aug-16 Feb-17 Aug-17 Feb-18 Aug-18
Hungary 3s10s spread Poland 2s10s spreadRomania 2s10s spread Czech Republic 2s10s spreadpp
Source: CNB, Bloomberg, UniCredit Research
GOVERNMENT GROSS FINANCING REQUIREMENTS
GROSS EXTERNAL FINANCING REQUIREMENTS
EUR bn 2017 2018F 2019F Gross financing requirement 8.9 14.7 13.9 Budget deficit 0.2 2.0 2.0 Amortization of public debt 8.6 12.7 11.9 Domestic 8.6 10.7 11.9 Bonds 8.5 9.9 9.7 Bills 0.2 0.7 2.0 Loans 0 0.2 0.2 External 0 2.0 0 Bonds and loans 0 2.0 0 IMF/EU/Other IFIs 0 0 0 Financing 8.9 14.7 13.9 Domestic borrowing 8.7 12.6 13.8 Bonds 7.8 10.5 11.7 Bills 0.7 2.0 2.0 Loans 0.2 0.1 0.1 External borrowing 0.1 2.1 0.1 Bonds 0 2.0 0 IMF/EU/Other IFIs 0.1 0.1 0.1 Privatization/Other 0 0 0
Source: CNB, CZSO, MoF, UniCredit Research
EUR bn 2017 2018F 2019F Gross financing requirement 100.1 107.8 111.8 C/A deficit -2.1 -1.3 -1.1 Amortization of medium and long term debt 12.1 11.4 8.9 Government/central bank 7.8 7.5 5.0 Banks 2.9 1.4 2.6 Corporates/Other 1.5 2.5 1.4 Amortization of short-term debt 90.0 97.7 104.0 Government/central bank 4.0 5.8 6.0 Banks 57.2 59.1 63.0 Corporates/Other 28.8 32.8 35.0 Financing 100.1 107.8 111.8 FDI (net) 5.1 3.9 4.0 Portfolio equity, net 10.2 5.0 0 Medium and long-term borrowing 17.7 9.0 6.6 Government/central bank 13.4 5.2 2.6 Banks 2.9 1.4 2.6 Corporates/Other 1.5 2.5 1.4 Short-term borrowing 106.9 88.4 101.1 EU structural and cohesion funds 2.1 2.1 2.2 Other 0 0 0 Change in FX reserves (- = increase) -42.0 -0.6 -2.0 Memoranda: Nonresident purchases of LC govt bonds 5.6 -2.4 -2.4 International bond issuance, net 0 0 0
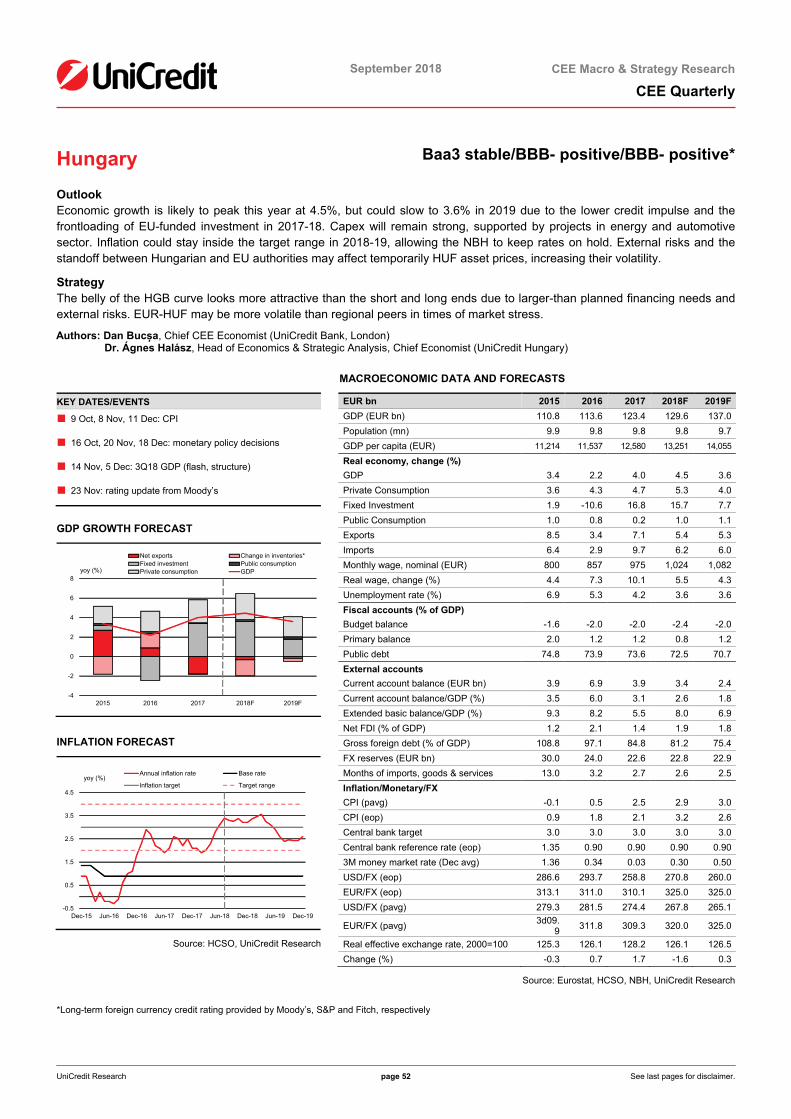
<date>
September 2018
CEE Macro & Strategy Research
CEE Quarterly
UniCredit Research page 52 See last pages for disclaimer.
Hungary Baa3 stable/BBB- positive/BBB- positive*
Outlook Economic growth is likely to peak this year at 4.5%, but could slow to 3.6% in 2019 due to the lower credit impulse and the frontloading of EU-funded investment in 2017-18. Capex will remain strong, supported by projects in energy and automotive sector. Inflation could stay inside the target range in 2018-19, allowing the NBH to keep rates on hold. External risks and the standoff between Hungarian and EU authorities may affect temporarily HUF asset prices, increasing their volatility.
Strategy The belly of the HGB curve looks more attractive than the short and long ends due to larger-than planned financing needs and external risks. EUR-HUF may be more volatile than regional peers in times of market stress.
Authors: Dan Bucșa, Chief CEE Economist (UniCredit Bank, London) Dr. Ágnes Halász, Head of Economics & Strategic Analysis, Chief Economist (UniCredit Hungary)
KEY DATES/EVENTS
■ 9 Oct, 8 Nov, 11 Dec: CPI
■ 16 Oct, 20 Nov, 18 Dec: monetary policy decisions
■ 14 Nov, 5 Dec: 3Q18 GDP (flash, structure)
■ 23 Nov: rating update from Moody’s
GDP GROWTH FORECAST
-4
-2
0
2
4
6
8
2015 2016 2017 2018F 2019F
yoy (%)
Net exports Change in inventories*Fixed investment Public consumptionPrivate consumption GDP
INFLATION FORECAST
-0.5
0.5
1.5
2.5
3.5
4.5
Dec-15 Jun-16 Dec-16 Jun-17 Dec-17 Jun-18 Dec-18 Jun-19 Dec-19
Annual inflation rate Base rate
Inflation target Target rangeyoy (%)
Source: HCSO, UniCredit Research
MACROECONOMIC DATA AND FORECASTS
EUR bn 2015 2016 2017 2018F 2019F GDP (EUR bn) 110.8 113.6 123.4 129.6 137.0 Population (mn) 9.9 9.8 9.8 9.8 9.7 GDP per capita (EUR) 11,214 11,537 12,580 13,251 14,055
Real economy, change (%) GDP 3.4 2.2 4.0 4.5 3.6 Private Consumption 3.6 4.3 4.7 5.3 4.0 Fixed Investment 1.9 -10.6 16.8 15.7 7.7 Public Consumption 1.0 0.8 0.2 1.0 1.1 Exports 8.5 3.4 7.1 5.4 5.3 Imports 6.4 2.9 9.7 6.2 6.0 Monthly wage, nominal (EUR) 800 857 975 1,024 1,082 Real wage, change (%) 4.4 7.3 10.1 5.5 4.3 Unemployment rate (%) 6.9 5.3 4.2 3.6 3.6 Fiscal accounts (% of GDP) Budget balance -1.6 -2.0 -2.0 -2.4 -2.0 Primary balance 2.0 1.2 1.2 0.8 1.2 Public debt 74.8 73.9 73.6 72.5 70.7 External accounts Current account balance (EUR bn) 3.9 6.9 3.9 3.4 2.4 Current account balance/GDP (%) 3.5 6.0 3.1 2.6 1.8 Extended basic balance/GDP (%) 9.3 8.2 5.5 8.0 6.9 Net FDI (% of GDP) 1.2 2.1 1.4 1.9 1.8 Gross foreign debt (% of GDP) 108.8 97.1 84.8 81.2 75.4 FX reserves (EUR bn) 30.0 24.0 22.6 22.8 22.9 Months of imports, goods & services 13.0 3.2 2.7 2.6 2.5 Inflation/Monetary/FX CPI (pavg) -0.1 0.5 2.5 2.9 3.0 CPI (eop) 0.9 1.8 2.1 3.2 2.6 Central bank target 3.0 3.0 3.0 3.0 3.0 Central bank reference rate (eop) 1.35 0.90 0.90 0.90 0.90 3M money market rate (Dec avg) 1.36 0.34 0.03 0.30 0.50 USD/FX (eop) 286.6 293.7 258.8 270.8 260.0 EUR/FX (eop) 313.1 311.0 310.1 325.0 325.0 USD/FX (pavg) 279.3 281.5 274.4 267.8 265.1
EUR/FX (pavg) 3d09.9 311.8 309.3 320.0 325.0
Real effective exchange rate, 2000=100 125.3 126.1 128.2 126.1 126.5 Change (%) -0.3 0.7 1.7 -1.6 0.3
Source: Eurostat, HCSO, NBH, UniCredit Research
*Long-term foreign currency credit rating provided by Moody’s, S&P and Fitch, respectively

<date>
September 2018
CEE Macro & Strategy Research
CEE Quarterly
UniCredit Research page 53 See last pages for disclaimer.
The economy shrugs off political noise Best-ever economic situation contrasts with worst-ever political position in the EU GDP growth expected at 4.5% in 2018 and 3.5% in 2019
The C/A surplus will narrow due to higher imports, most of them investment-driven
The credit impulse may contribute less to growth in 2019… … with the FGS Fix trying to offset this effect EU-funded investment will reach full allotment in the coming years
Hungary is facing a paradoxical year: the economy is at its strongest, with growth likely to peak in 2018 after the government front-loaded a significant part of EU fund allotment in 2017-18. At the same time, the country’s position in the EU is the weakest since accession. While politics could play a greater role in the medium term, short-term growth is likely to shrug off the impact of deepening disagreements between Hungarian and European authorities.
The economy continues to enjoy its best year on record, although the expected 2018 growth rate of 4.5% is unlikely to be repeated in coming years. The diminishing risk of higher tariffs imposed by the US on car imports from Europe leaves the door open for strong industrial production and export growth in the coming quarters, boosted from the end of August 2018 by Audi’s new production facility and the return to three production shifts.
With demand from the EU expected to slow gradually in 2019, Hungarian exports could still rise around 5.5% next year, slowing below 5% in 2020. Despite robust export growth, the C/A surplus is likely to fall below 3% of GDP in 2018-19 as domestic demand continues to rise strongly. Private consumption will rely more on imports due to a poor harvest and households taking advantage of negative real interest rates to borrow more. In addition, investment will boost imports, with the construction beginning in 2018 for the fifth reactor of the Paks nuclear power plant and in 2019 for the sixth reactor, BMW expected to start building its new EUR 1bn factory in 2H1917 and spending on EU-funded projects continuing apace.
Besides the weaker momentum in external demand, the credit impulse and lower investment backed by EU funds could lead to slower growth in 2019 and beyond. While new lending continues to grow at a fast pace, the change in new lending is slowing. To mitigate the diminishing impact of credit on growth, the NBH will introduce the Funding for Growth Scheme (FGS) Fix from January 2019. Under this new FGS phase, banks will be able to borrow up to HUF 1.0tn from the central bank at zero cost and disburse new investment loans to SMEs at a maximum cost of 2.5% and maturities of 3-10Y.
Finally, public investment will subtract from growth due to the exhaustion of Hungary’s allotment of EU funds, unless the ESA deficit increases significantly. The government increased spending on EU-funded projects to 3.4% of expected 2018 GDP in 8M18. Even if Hungary stops EU-funded projects until the end of the year, the amount left to spend in 2019-20 out of the structural and investment fund allocation is around 3.5% of average GDP or less than 1.8% of GDP per year in the next two years, compared to 4.0% of GDP in 2017 and 2.9% of GDP in 8M18.
THE CREDIT IMPULSE POINTS TO SLOWER DOMESTIC DEMAND GROWTH
SPENDING ON EU-FUNDED PROJECTS IS OUTPACING EU TRANSFERS
-20
-15
-10
-5
0
5
10
-20
-15
-10
-5
0
5
10
2005 2007 2009 2011 2013 2015 2017
Change in new credit extended (pp of GDP)Private consumption & GCF (% yoy, rs)
-1,200
-900
-600
-300
0
300
600
900
1,200
1,500
1,800
-40
-30
-20
-10
0
10
20
30
40
50
60
1Q09 1Q10 1Q11 1Q12 1Q13 1Q14 1Q15 1Q16 1Q17 1Q18
EU fund inflows - government (EUR mn, rs)Construction - infrastructure (yoy, %)
Source: HCSO, NBH, Ministry of Finance, UniCredit Research
17 According to BMW officials, the factory will start production in 2023.

<date>
September 2018
CEE Macro & Strategy Research
CEE Quarterly
UniCredit Research page 54 See last pages for disclaimer.
Larger-than-expected cash budget deficit in 2018 due to low EU fund disbursements… …lead to a temporary liquidity shortage Inflation could exceed the 3% target until the end of 1H19… …or longer if EUR-USD and oil prices remain flat…
…but the NBH will remain on hold this year and next The stand-off with European institutions may lead to temporary fluctuations in asset prices No rating upgrade expected this year and next
The 2018 cash budget deficit may be around 5% of GDP, exceeding the planned cash shortfall by 1.6% of GDP due to EU-fund disbursements of just HUF 183bn in 8M18 (or 13.2% of spending on EU-funded projects). There are three important consequences. First, official financing needs may increase at a time when appetite for EM debt remains low. Second, other types of public expenditure could be crowded out if missing EU transfers cannot be fully replaced by borrowed funds. Third, state-owned banks could remain starved of liquidity. As a result, short- term interest rates may come under renewed pressure. While the NBH wishes to keep short-term interest rates low, it did not increase the volume of HUF liquidity provided via FX swaps since 1Q18, probably to avoid excessive HUF depreciation. Even if the monetary policy stance is less accommodative than in the past, liquidity conditions will remain much looser than in the region, considering the widening positive output gap and expected inflation.
Inflation is likely to stay inside the 2-4% target range in 2018-19, although it may exceed the 3% central target in 1H19. The four most important factors that could keep inflation elevated are excise duty hikes, the FX pass-through, higher core inflation amid tight labor-market conditions and higher food prices due to the poor harvest. While inflation could fall in 2Q19 under our assumptions18, flat EUR-USD and oil prices would keep inflation above 3% in 2019.
We expect the NBH to remain on hold in 2018-19, unless risk aversion increases to the point where the inflation targeting mandate is threatened. With short-term rates varying between 0.15% and the policy rate of 0.9% depending on liquidity conditions and risk appetite, the HUF and longer-term rates could reflect most of the additional risk premium that markets attach to EM financial asset prices. As a result, we expect EUR-HUF to move to a higher 320-30 range until the end of 2019. An exit on any of the sides may be attractive to trade. The NBH tidied up its toolbox without changing the policy framework19.
Politics could also put pressure on HUF asset prices this year and next. After the EU Parliament voted to recommend opening procedures against Hungary under Article 7 of the Treaty of the EU (TEU), we expect Hungarian authorities to ignore any mitigating measures suggested by the EC. As a result, a vote on Article 7.1 of the TEU could follow a similar vote on Poland, but probably not sooner than March 2019. Hungary can rely on its Visegrad ally to veto a loss of voting rights in the EU Council under Article 7.2 of the TEU. Even so, markets could react whenever tension rises between EU institutions and Budapest. Hungary is unlikely to receive new rating upgrades this year or next as political noise and the slower decline in public debt due to larger-than-expected public spending take their toll.
THE PHILLIPS CURVE IS STEEPENING AS LABOR MARKET CONDITIONS TIGHTEN
THE NBH HAS NOT INCREASED ITS HUF INJECTIONS SINCE 1Q18
1.0
1.5
2.0
2.5
3.0
3.5
3.0 4.0 5.0 6.0 7.0 8.0
HIC
P in
flatio
n ex
clud
ing
ener
gy,
unpr
oces
sed
food
and
tax
effe
cts
(yoy
, %)
Unemployment rate (%)
-0.04-0.020.000.020.040.060.080.100.120.140.160.180.00
500.00
1,000.00
1,500.00
2,000.00
2,500.00
Jan-17 Mar-17 Jun-17 Sep-17 Dec-17 Feb-18 May-18 Aug-18
1Y 6M3M 1M1W BUBOR 1W (%, inverted, rs)
FX swaps providing HUF(HUF bn)
Source: HCSO, NBH, Eurostat, UniCredit Research
18 Please see page 7 for details. 19 For details, please see the EEMEA Macro Flash – “The National Bank of Hungary sticks to tried and tested instruments” published on 18 September.
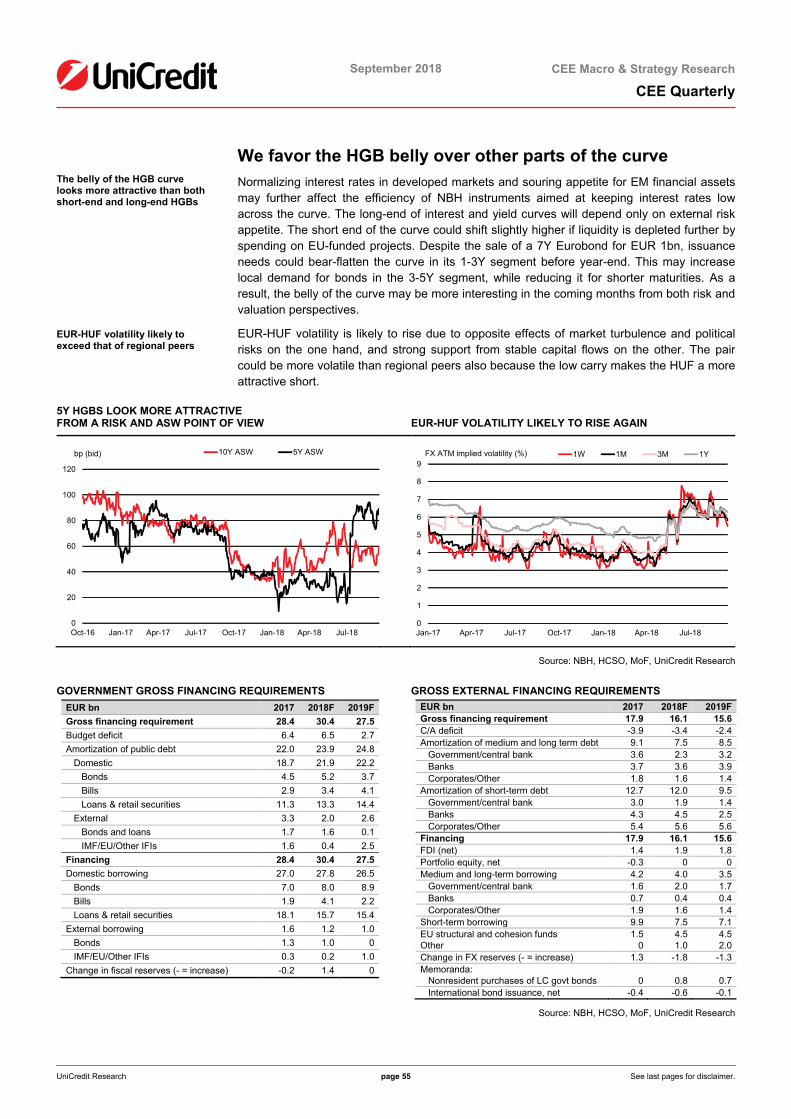
<date>
September 2018
CEE Macro & Strategy Research
CEE Quarterly
UniCredit Research page 55 See last pages for disclaimer.
We favor the HGB belly over other parts of the curve The belly of the HGB curve looks more attractive than both short-end and long-end HGBs
EUR-HUF volatility likely to exceed that of regional peers
Normalizing interest rates in developed markets and souring appetite for EM financial assets may further affect the efficiency of NBH instruments aimed at keeping interest rates low across the curve. The long-end of interest and yield curves will depend only on external risk appetite. The short end of the curve could shift slightly higher if liquidity is depleted further by spending on EU-funded projects. Despite the sale of a 7Y Eurobond for EUR 1bn, issuance needs could bear-flatten the curve in its 1-3Y segment before year-end. This may increase local demand for bonds in the 3-5Y segment, while reducing it for shorter maturities. As a result, the belly of the curve may be more interesting in the coming months from both risk and valuation perspectives.
EUR-HUF volatility is likely to rise due to opposite effects of market turbulence and political risks on the one hand, and strong support from stable capital flows on the other. The pair could be more volatile than regional peers also because the low carry makes the HUF a more attractive short.
5Y HGBS LOOK MORE ATTRACTIVE FROM A RISK AND ASW POINT OF VIEW
EUR-HUF VOLATILITY LIKELY TO RISE AGAIN
0
20
40
60
80
100
120
Oct-16 Jan-17 Apr-17 Jul-17 Oct-17 Jan-18 Apr-18 Jul-18
10Y ASW 5Y ASWbp (bid)
0
1
2
3
4
5
6
7
8
9
Jan-17 Apr-17 Jul-17 Oct-17 Jan-18 Apr-18 Jul-18
1W 1M 3M 1YFX ATM implied volatility (%)
Source: NBH, HCSO, MoF, UniCredit Research
GOVERNMENT GROSS FINANCING REQUIREMENTS GROSS EXTERNAL FINANCING REQUIREMENTS EUR bn 2017 2018F 2019F Gross financing requirement 28.4 30.4 27.5 Budget deficit 6.4 6.5 2.7 Amortization of public debt 22.0 23.9 24.8 Domestic 18.7 21.9 22.2 Bonds 4.5 5.2 3.7 Bills 2.9 3.4 4.1 Loans & retail securities 11.3 13.3 14.4 External 3.3 2.0 2.6 Bonds and loans 1.7 1.6 0.1 IMF/EU/Other IFIs 1.6 0.4 2.5 Financing 28.4 30.4 27.5 Domestic borrowing 27.0 27.8 26.5 Bonds 7.0 8.0 8.9 Bills 1.9 4.1 2.2 Loans & retail securities 18.1 15.7 15.4 External borrowing 1.6 1.2 1.0 Bonds 1.3 1.0 0 IMF/EU/Other IFIs 0.3 0.2 1.0 Change in fiscal reserves (- = increase) -0.2 1.4 0
EUR bn 2017 2018F 2019F Gross financing requirement 17.9 16.1 15.6 C/A deficit -3.9 -3.4 -2.4 Amortization of medium and long term debt 9.1 7.5 8.5 Government/central bank 3.6 2.3 3.2 Banks 3.7 3.6 3.9 Corporates/Other 1.8 1.6 1.4 Amortization of short-term debt 12.7 12.0 9.5 Government/central bank 3.0 1.9 1.4 Banks 4.3 4.5 2.5 Corporates/Other 5.4 5.6 5.6 Financing 17.9 16.1 15.6 FDI (net) 1.4 1.9 1.8 Portfolio equity, net -0.3 0 0 Medium and long-term borrowing 4.2 4.0 3.5 Government/central bank 1.6 2.0 1.7 Banks 0.7 0.4 0.4 Corporates/Other 1.9 1.6 1.4 Short-term borrowing 9.9 7.5 7.1 EU structural and cohesion funds 1.5 4.5 4.5 Other 0 1.0 2.0 Change in FX reserves (- = increase) 1.3 -1.8 -1.3 Memoranda: Nonresident purchases of LC govt bonds 0 0.8 0.7 International bond issuance, net -0.4 -0.6 -0.1
Source: NBH, HCSO, MoF, UniCredit Research
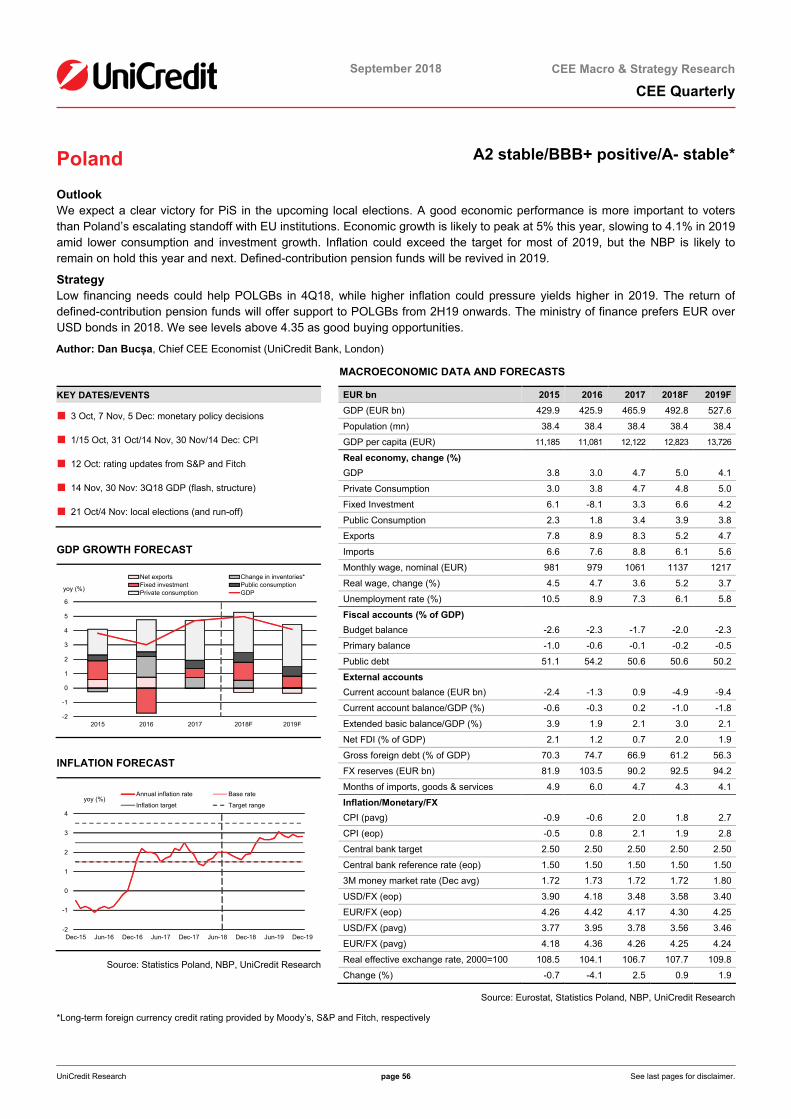
<date>
September 2018
CEE Macro & Strategy Research
CEE Quarterly
UniCredit Research page 56 See last pages for disclaimer.
Poland A2 stable/BBB+ positive/A- stable*
Outlook We expect a clear victory for PiS in the upcoming local elections. A good economic performance is more important to voters than Poland’s escalating standoff with EU institutions. Economic growth is likely to peak at 5% this year, slowing to 4.1% in 2019 amid lower consumption and investment growth. Inflation could exceed the target for most of 2019, but the NBP is likely to remain on hold this year and next. Defined-contribution pension funds will be revived in 2019.
Strategy Low financing needs could help POLGBs in 4Q18, while higher inflation could pressure yields higher in 2019. The return of defined-contribution pension funds will offer support to POLGBs from 2H19 onwards. The ministry of finance prefers EUR over USD bonds in 2018. We see levels above 4.35 as good buying opportunities.
Author: Dan Bucșa, Chief CEE Economist (UniCredit Bank, London)
KEY DATES/EVENTS
■ 3 Oct, 7 Nov, 5 Dec: monetary policy decisions
■ 1/15 Oct, 31 Oct/14 Nov, 30 Nov/14 Dec: CPI
■ 12 Oct: rating updates from S&P and Fitch
■ 14 Nov, 30 Nov: 3Q18 GDP (flash, structure)
■ 21 Oct/4 Nov: local elections (and run-off)
GDP GROWTH FORECAST
-2
-1
0
1
2
3
4
5
6
2015 2016 2017 2018F 2019F
yoy (%)
Net exports Change in inventories*Fixed investment Public consumptionPrivate consumption GDP
INFLATION FORECAST
-2
-1
0
1
2
3
4
Dec-15 Jun-16 Dec-16 Jun-17 Dec-17 Jun-18 Dec-18 Jun-19 Dec-19
Annual inflation rate Base rate
Inflation target Target rangeyoy (%)
Source: Statistics Poland, NBP, UniCredit Research
MACROECONOMIC DATA AND FORECASTS
EUR bn 2015 2016 2017 2018F 2019F GDP (EUR bn) 429.9 425.9 465.9 492.8 527.6
Population (mn) 38.4 38.4 38.4 38.4 38.4
GDP per capita (EUR) 11,185 11,081 12,122 12,823 13,726
Real economy, change (%) GDP 3.8 3.0 4.7 5.0 4.1
Private Consumption 3.0 3.8 4.7 4.8 5.0
Fixed Investment 6.1 -8.1 3.3 6.6 4.2
Public Consumption 2.3 1.8 3.4 3.9 3.8
Exports 7.8 8.9 8.3 5.2 4.7
Imports 6.6 7.6 8.8 6.1 5.6
Monthly wage, nominal (EUR) 981 979 1061 1137 1217
Real wage, change (%) 4.5 4.7 3.6 5.2 3.7
Unemployment rate (%) 10.5 8.9 7.3 6.1 5.8
Fiscal accounts (% of GDP) Budget balance -2.6 -2.3 -1.7 -2.0 -2.3
Primary balance -1.0 -0.6 -0.1 -0.2 -0.5
Public debt 51.1 54.2 50.6 50.6 50.2
External accounts Current account balance (EUR bn) -2.4 -1.3 0.9 -4.9 -9.4
Current account balance/GDP (%) -0.6 -0.3 0.2 -1.0 -1.8
Extended basic balance/GDP (%) 3.9 1.9 2.1 3.0 2.1
Net FDI (% of GDP) 2.1 1.2 0.7 2.0 1.9
Gross foreign debt (% of GDP) 70.3 74.7 66.9 61.2 56.3
FX reserves (EUR bn) 81.9 103.5 90.2 92.5 94.2
Months of imports, goods & services 4.9 6.0 4.7 4.3 4.1
Inflation/Monetary/FX CPI (pavg) -0.9 -0.6 2.0 1.8 2.7
CPI (eop) -0.5 0.8 2.1 1.9 2.8
Central bank target 2.50 2.50 2.50 2.50 2.50
Central bank reference rate (eop) 1.50 1.50 1.50 1.50 1.50
3M money market rate (Dec avg) 1.72 1.73 1.72 1.72 1.80
USD/FX (eop) 3.90 4.18 3.48 3.58 3.40
EUR/FX (eop) 4.26 4.42 4.17 4.30 4.25
USD/FX (pavg) 3.77 3.95 3.78 3.56 3.46
EUR/FX (pavg) 4.18 4.36 4.26 4.25 4.24
Real effective exchange rate, 2000=100 108.5 104.1 106.7 107.7 109.8
Change (%) -0.7 -4.1 2.5 0.9 1.9
Source: Eurostat, Statistics Poland, NBP, UniCredit Research
*Long-term foreign currency credit rating provided by Moody’s, S&P and Fitch, respectively

<date>
September 2018 CEE Macro & Strategy Research
CEE Quarterly
UniCredit Research page 57 See last pages for disclaimer.
Poland returns to the polls at peak growth PiS well placed to win local elections
Poland faces the first Article 7 vote in the history of the EU… …as its standoff with EU institutions intensifies
The government’s focus on redistribution is paying off… …although household incomes are likely to grow at a slower pace in 2019 Economic immigration is rising
Local elections scheduled for 21 October (with a run-off on 4 November) will be the first electoral test for the Law and Justice (PiS) government. With economic growth expected at around 5% this year and household income up by more than 11% in real terms since the 2015 election, the governing party is favored to strengthen its hold on power. While the opposition coalition formed by the Civic Platform (PO) and Nowoczesna may retain control of local administration in major cities, opinion polls show that PiS could end up ruling most of Poland’s 16 provinces. However, the fickle Polish electorate could change its allegiance in the two-year election period that lies ahead20. Even though growth is likely to stay above potential in 2019-20, it will slow from here, adding to political risks to PiS’ election success.
Poland may be the first EU country subject to an Article 7 vote in the EU Council after the EU Parliament voted in favor of the procedure. 23 heads of state are needed to back Article 7.1 and the vote could take place early next year. While Hungary will veto Article 7.2 to prevent Poland’s loss of voting rights in the Council, EU institutions could keep pressure on Warsaw due to the judicial overhaul that undermines the independence of judges and prosecutors. With the Supreme Court calling for the European Court of Justice to rule on the dismissal and appointment of judges in the Supreme Court and members in the National Judiciary Council, the government may face the stark choice of ignoring ECJ rulings or backtracking on some of the most important measures it implemented, namely the subordination of courts to parliament and the minister of justice.
The strong economic performance remains PiS’ trump card in upcoming elections. Broad-based GDP growth will be the highest in CEE this year and next, relying more on domestic demand strength than its EU-CEE neighbors, which are more dependent on exports. Government programs like the 500+ and labor shortages led to rapid income growth, improving living standards for most of the population. Moreover, the government intends to continue redistribution in 2019, when the minimum wage will increase by 7.1% to almost 50% of average wage (one of the highest weights in Europe), financed by removing the cap on social security contributions (currently at a gross wage of PLN 127,890 per year). Even so, private consumption could contribute less to growth in 2019 due to slower real wage growth in the private sector. Higher inflation will offset part of nominal wage hikes. In addition, the number of Ukrainian workers is likely to rise further, lowering the average wage rise and increasing remittances abroad. 40% of companies employing more than 250 people currently hire Ukrainian workers and 30% are looking to increase migrant employment21.
POLAND’S MINIMUM WAGE WILL BE ONE OF THE HIGHEST IN CEE IN 2019
EXPECTATIONS SHOW THAT ECONOMIC GROWTH HAS PEAKED
0
12
24
36
48
60
0
200
400
600
800
1,000
RU BG RS TR RO HU HR CZ SK PL SI
Minimum wage (EUR equivalent)
Minimum wage (% of avg. wage, rs)
-40.0 -20.0 0.0 20.0 40.0 60.0
Manufacturing (SA)
Construction (SA)
Retail trade (SA)
Transport and storage (SA)
Accommodation and catering (SA)
Finance and insurance (NSA)
Real estate (NSA)
Difference between maximum and minimum since 2008Difference between maximum in 2018 and current level (red: current < max)
Expectations for future activity (balance of answers, %)
Source: Eurostat, UniCredit Research
20 Poland faces three rounds of elections: for EU Parliament on 26 March 2019, for Parliament in November 2019 at the latest and presidential in April-May 2020. 21 According to an employment barometer published by the HR firm Personnel Services and quoted by CEEMarketWatch.
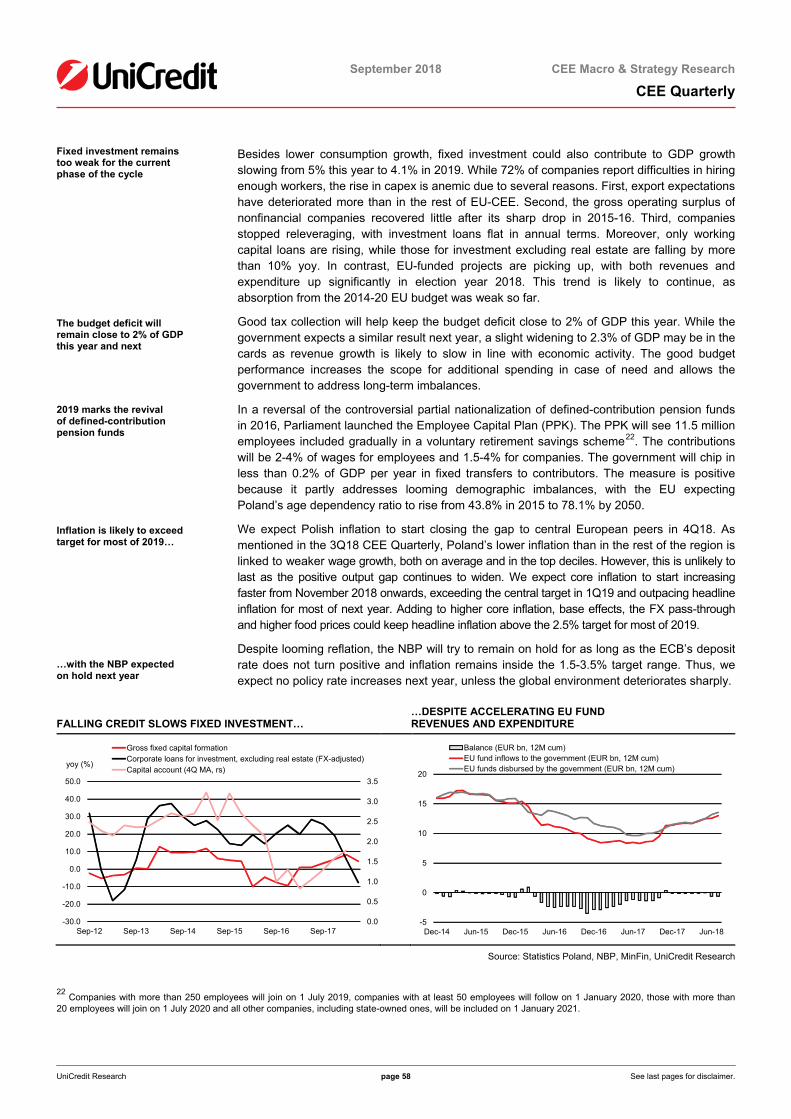
<date>
September 2018 CEE Macro & Strategy Research
CEE Quarterly
UniCredit Research page 58 See last pages for disclaimer.
Fixed investment remains too weak for the current phase of the cycle The budget deficit will remain close to 2% of GDP this year and next
2019 marks the revival of defined-contribution pension funds
Inflation is likely to exceed target for most of 2019… …with the NBP expected on hold next year
Besides lower consumption growth, fixed investment could also contribute to GDP growth slowing from 5% this year to 4.1% in 2019. While 72% of companies report difficulties in hiring enough workers, the rise in capex is anemic due to several reasons. First, export expectations have deteriorated more than in the rest of EU-CEE. Second, the gross operating surplus of nonfinancial companies recovered little after its sharp drop in 2015-16. Third, companies stopped releveraging, with investment loans flat in annual terms. Moreover, only working capital loans are rising, while those for investment excluding real estate are falling by more than 10% yoy. In contrast, EU-funded projects are picking up, with both revenues and expenditure up significantly in election year 2018. This trend is likely to continue, as absorption from the 2014-20 EU budget was weak so far.
Good tax collection will help keep the budget deficit close to 2% of GDP this year. While the government expects a similar result next year, a slight widening to 2.3% of GDP may be in the cards as revenue growth is likely to slow in line with economic activity. The good budget performance increases the scope for additional spending in case of need and allows the government to address long-term imbalances.
In a reversal of the controversial partial nationalization of defined-contribution pension funds in 2016, Parliament launched the Employee Capital Plan (PPK). The PPK will see 11.5 million employees included gradually in a voluntary retirement savings scheme22. The contributions will be 2-4% of wages for employees and 1.5-4% for companies. The government will chip in less than 0.2% of GDP per year in fixed transfers to contributors. The measure is positive because it partly addresses looming demographic imbalances, with the EU expecting Poland’s age dependency ratio to rise from 43.8% in 2015 to 78.1% by 2050.
We expect Polish inflation to start closing the gap to central European peers in 4Q18. As mentioned in the 3Q18 CEE Quarterly, Poland’s lower inflation than in the rest of the region is linked to weaker wage growth, both on average and in the top deciles. However, this is unlikely to last as the positive output gap continues to widen. We expect core inflation to start increasing faster from November 2018 onwards, exceeding the central target in 1Q19 and outpacing headline inflation for most of next year. Adding to higher core inflation, base effects, the FX pass-through and higher food prices could keep headline inflation above the 2.5% target for most of 2019.
Despite looming reflation, the NBP will try to remain on hold for as long as the ECB’s deposit rate does not turn positive and inflation remains inside the 1.5-3.5% target range. Thus, we expect no policy rate increases next year, unless the global environment deteriorates sharply.
FALLING CREDIT SLOWS FIXED INVESTMENT…
…DESPITE ACCELERATING EU FUND REVENUES AND EXPENDITURE
0.0
0.5
1.0
1.5
2.0
2.5
3.0
3.5
-30.0
-20.0
-10.0
0.0
10.0
20.0
30.0
40.0
50.0
Sep-12 Sep-13 Sep-14 Sep-15 Sep-16 Sep-17
Gross fixed capital formationCorporate loans for investment, excluding real estate (FX-adjusted)Capital account (4Q MA, rs)
yoy (%)
-5
0
5
10
15
20
Dec-14 Jun-15 Dec-15 Jun-16 Dec-16 Jun-17 Dec-17 Jun-18
Balance (EUR bn, 12M cum)EU fund inflows to the government (EUR bn, 12M cum)EU funds disbursed by the government (EUR bn, 12M cum)
Source: Statistics Poland, NBP, MinFin, UniCredit Research
22 Companies with more than 250 employees will join on 1 July 2019, companies with at least 50 employees will follow on 1 January 2020, those with more than 20 employees will join on 1 July 2020 and all other companies, including state-owned ones, will be included on 1 January 2021.
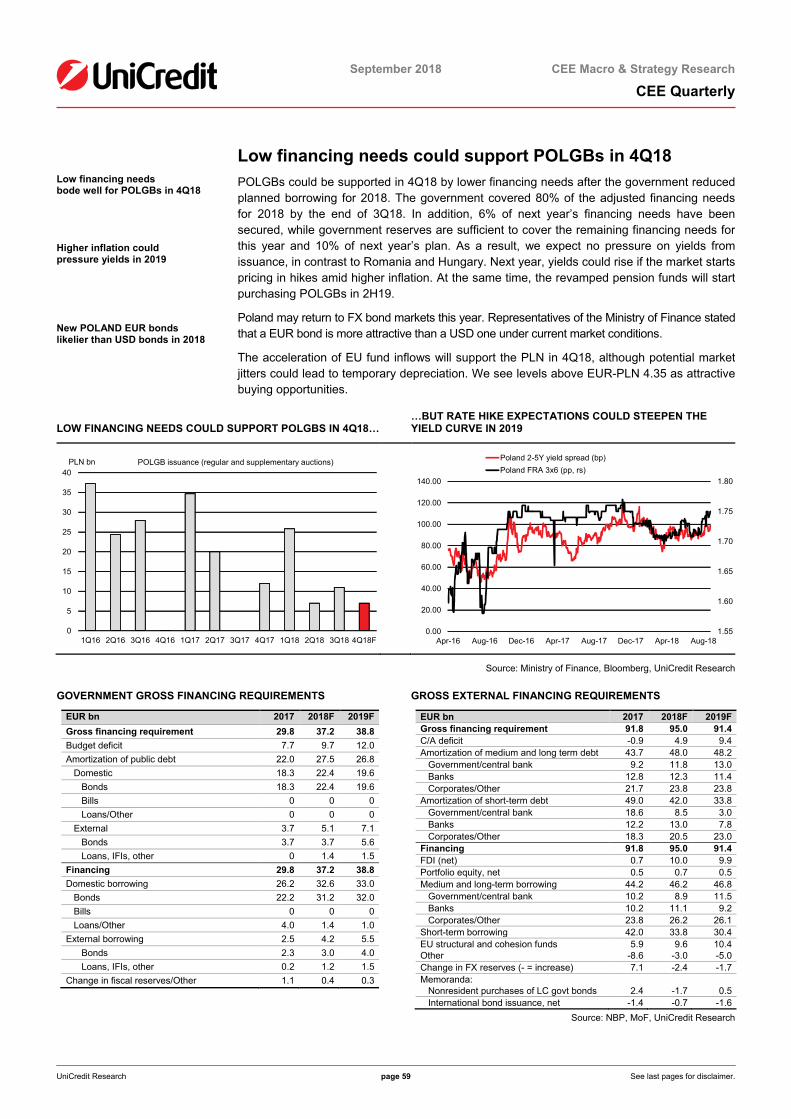
<date>
September 2018 CEE Macro & Strategy Research
CEE Quarterly
UniCredit Research page 59 See last pages for disclaimer.
Low financing needs could support POLGBs in 4Q18 Low financing needs bode well for POLGBs in 4Q18 Higher inflation could pressure yields in 2019 New POLAND EUR bonds likelier than USD bonds in 2018
POLGBs could be supported in 4Q18 by lower financing needs after the government reduced planned borrowing for 2018. The government covered 80% of the adjusted financing needs for 2018 by the end of 3Q18. In addition, 6% of next year’s financing needs have been secured, while government reserves are sufficient to cover the remaining financing needs for this year and 10% of next year’s plan. As a result, we expect no pressure on yields from issuance, in contrast to Romania and Hungary. Next year, yields could rise if the market starts pricing in hikes amid higher inflation. At the same time, the revamped pension funds will start purchasing POLGBs in 2H19.
Poland may return to FX bond markets this year. Representatives of the Ministry of Finance stated that a EUR bond is more attractive than a USD one under current market conditions.
The acceleration of EU fund inflows will support the PLN in 4Q18, although potential market jitters could lead to temporary depreciation. We see levels above EUR-PLN 4.35 as attractive buying opportunities.
LOW FINANCING NEEDS COULD SUPPORT POLGBS IN 4Q18…
…BUT RATE HIKE EXPECTATIONS COULD STEEPEN THE YIELD CURVE IN 2019
0
5
10
15
20
25
30
35
40
1Q16 2Q16 3Q16 4Q16 1Q17 2Q17 3Q17 4Q17 1Q18 2Q18 3Q18 4Q18F
POLGB issuance (regular and supplementary auctions)PLN bn
1.55
1.60
1.65
1.70
1.75
1.80
0.00
20.00
40.00
60.00
80.00
100.00
120.00
140.00
Apr-16 Aug-16 Dec-16 Apr-17 Aug-17 Dec-17 Apr-18 Aug-18
Poland 2-5Y yield spread (bp)Poland FRA 3x6 (pp, rs)
Source: Ministry of Finance, Bloomberg, UniCredit Research
GOVERNMENT GROSS FINANCING REQUIREMENTS
GROSS EXTERNAL FINANCING REQUIREMENTS
EUR bn 2017 2018F 2019F Gross financing requirement 29.8 37.2 38.8 Budget deficit 7.7 9.7 12.0 Amortization of public debt 22.0 27.5 26.8 Domestic 18.3 22.4 19.6 Bonds 18.3 22.4 19.6 Bills 0 0 0 Loans/Other 0 0 0 External 3.7 5.1 7.1 Bonds 3.7 3.7 5.6 Loans, IFIs, other 0 1.4 1.5 Financing 29.8 37.2 38.8 Domestic borrowing 26.2 32.6 33.0 Bonds 22.2 31.2 32.0 Bills 0 0 0 Loans/Other 4.0 1.4 1.0 External borrowing 2.5 4.2 5.5 Bonds 2.3 3.0 4.0 Loans, IFIs, other 0.2 1.2 1.5 Change in fiscal reserves/Other 1.1 0.4 0.3
EUR bn 2017 2018F 2019F Gross financing requirement 91.8 95.0 91.4 C/A deficit -0.9 4.9 9.4 Amortization of medium and long term debt 43.7 48.0 48.2 Government/central bank 9.2 11.8 13.0 Banks 12.8 12.3 11.4 Corporates/Other 21.7 23.8 23.8 Amortization of short-term debt 49.0 42.0 33.8 Government/central bank 18.6 8.5 3.0 Banks 12.2 13.0 7.8 Corporates/Other 18.3 20.5 23.0 Financing 91.8 95.0 91.4 FDI (net) 0.7 10.0 9.9 Portfolio equity, net 0.5 0.7 0.5 Medium and long-term borrowing 44.2 46.2 46.8 Government/central bank 10.2 8.9 11.5 Banks 10.2 11.1 9.2 Corporates/Other 23.8 26.2 26.1 Short-term borrowing 42.0 33.8 30.4 EU structural and cohesion funds 5.9 9.6 10.4 Other -8.6 -3.0 -5.0 Change in FX reserves (- = increase) 7.1 -2.4 -1.7 Memoranda: Nonresident purchases of LC govt bonds 2.4 -1.7 0.5 International bond issuance, net -1.4 -0.7 -1.6
Source: NBP, MoF, UniCredit Research
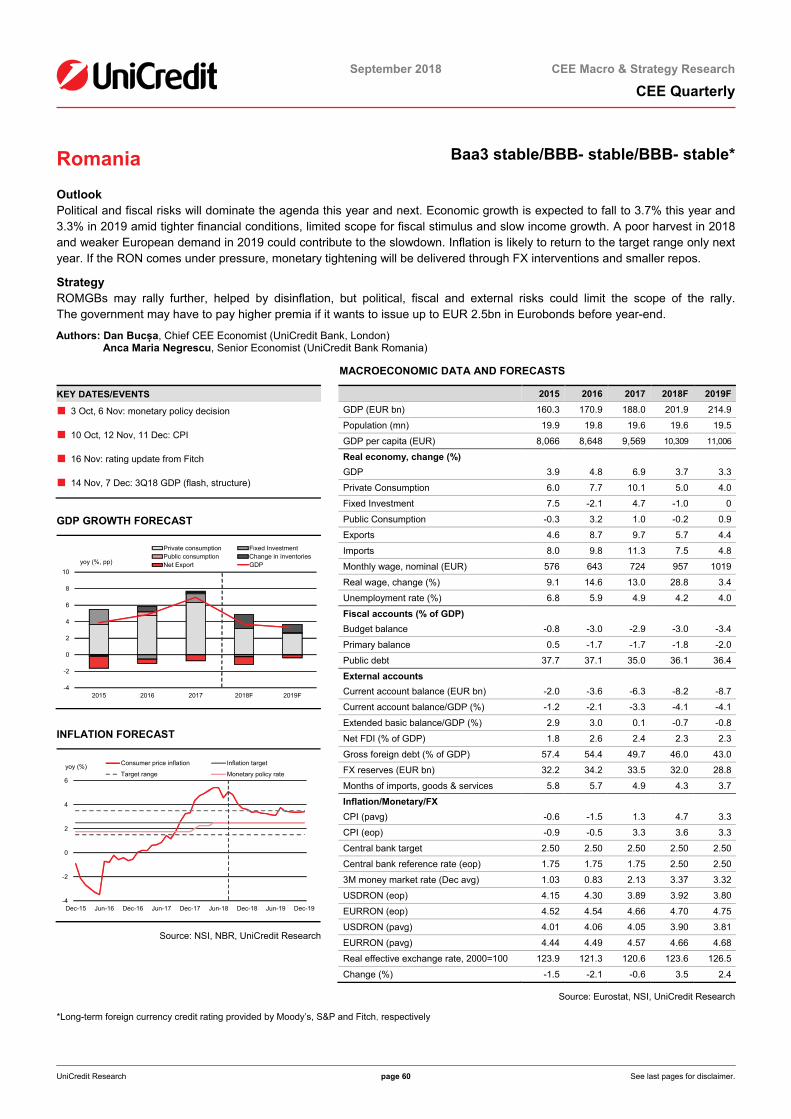
<date>
September 2018 CEE Macro & Strategy Research
CEE Quarterly
UniCredit Research page 60 See last pages for disclaimer.
Romania Baa3 stable/BBB- stable/BBB- stable*
Outlook Political and fiscal risks will dominate the agenda this year and next. Economic growth is expected to fall to 3.7% this year and 3.3% in 2019 amid tighter financial conditions, limited scope for fiscal stimulus and slow income growth. A poor harvest in 2018 and weaker European demand in 2019 could contribute to the slowdown. Inflation is likely to return to the target range only next year. If the RON comes under pressure, monetary tightening will be delivered through FX interventions and smaller repos.
Strategy ROMGBs may rally further, helped by disinflation, but political, fiscal and external risks could limit the scope of the rally. The government may have to pay higher premia if it wants to issue up to EUR 2.5bn in Eurobonds before year-end.
Authors: Dan Bucșa, Chief CEE Economist (UniCredit Bank, London) Anca Maria Negrescu, Senior Economist (UniCredit Bank Romania)
KEY DATES/EVENTS
■ 3 Oct, 6 Nov: monetary policy decision
■ 10 Oct, 12 Nov, 11 Dec: CPI
■ 16 Nov: rating update from Fitch
■ 14 Nov, 7 Dec: 3Q18 GDP (flash, structure)
GDP GROWTH FORECAST
-4
-2
0
2
4
6
8
10
2015 2016 2017 2018F 2019F
Private consumption Fixed InvestmentPublic consumption Change in inventoriesNet Export GDPyoy (%, pp)
INFLATION FORECAST
-4
-2
0
2
4
6
Dec-15 Jun-16 Dec-16 Jun-17 Dec-17 Jun-18 Dec-18 Jun-19 Dec-19
Consumer price inflation Inflation target
Target range Monetary policy rateyoy (%)
Source: NSI, NBR, UniCredit Research
MACROECONOMIC DATA AND FORECASTS
2015 2016 2017 2018F 2019F GDP (EUR bn) 160.3 170.9 188.0 201.9 214.9
Population (mn) 19.9 19.8 19.6 19.6 19.5
GDP per capita (EUR) 8,066 8,648 9,569 10,309 11,006
Real economy, change (%) GDP 3.9 4.8 6.9 3.7 3.3
Private Consumption 6.0 7.7 10.1 5.0 4.0
Fixed Investment 7.5 -2.1 4.7 -1.0 0
Public Consumption -0.3 3.2 1.0 -0.2 0.9
Exports 4.6 8.7 9.7 5.7 4.4
Imports 8.0 9.8 11.3 7.5 4.8
Monthly wage, nominal (EUR) 576 643 724 957 1019
Real wage, change (%) 9.1 14.6 13.0 28.8 3.4
Unemployment rate (%) 6.8 5.9 4.9 4.2 4.0
Fiscal accounts (% of GDP) Budget balance -0.8 -3.0 -2.9 -3.0 -3.4
Primary balance 0.5 -1.7 -1.7 -1.8 -2.0
Public debt 37.7 37.1 35.0 36.1 36.4
External accounts Current account balance (EUR bn) -2.0 -3.6 -6.3 -8.2 -8.7
Current account balance/GDP (%) -1.2 -2.1 -3.3 -4.1 -4.1
Extended basic balance/GDP (%) 2.9 3.0 0.1 -0.7 -0.8
Net FDI (% of GDP) 1.8 2.6 2.4 2.3 2.3
Gross foreign debt (% of GDP) 57.4 54.4 49.7 46.0 43.0
FX reserves (EUR bn) 32.2 34.2 33.5 32.0 28.8
Months of imports, goods & services 5.8 5.7 4.9 4.3 3.7
Inflation/Monetary/FX CPI (pavg) -0.6 -1.5 1.3 4.7 3.3
CPI (eop) -0.9 -0.5 3.3 3.6 3.3
Central bank target 2.50 2.50 2.50 2.50 2.50
Central bank reference rate (eop) 1.75 1.75 1.75 2.50 2.50
3M money market rate (Dec avg) 1.03 0.83 2.13 3.37 3.32
USDRON (eop) 4.15 4.30 3.89 3.92 3.80
EURRON (eop) 4.52 4.54 4.66 4.70 4.75
USDRON (pavg) 4.01 4.06 4.05 3.90 3.81
EURRON (pavg) 4.44 4.49 4.57 4.66 4.68
Real effective exchange rate, 2000=100 123.9 121.3 120.6 123.6 126.5
Change (%) -1.5 -2.1 -0.6 3.5 2.4
Source: Eurostat, NSI, UniCredit Research
*Long-term foreign currency credit rating provided by Moody’s, S&P and Fitch, respectively

<date>
September 2018 CEE Macro & Strategy Research
CEE Quarterly
UniCredit Research page 61 See last pages for disclaimer.
A hot autumn ahead Politics will dominate the agenda this autumn…
…with Romania facing Article 7 procedures due to the judicial overhaul The prospect of elections may delay the judicial overhaul desired by PSD head Liviu Dragnea GDP growth could slow to 3.7% in 2018 and 3.3% in 2019… …amid tighter financial conditions and limited fiscal stimulus
After a scorching end of the summer, the Romanian government is facing a hot autumn. On the political front, the assault on judicial independence and the mishandling of August street protests will further marginalize the Romanian governing coalition in the EU. On the economic front, a reality check following an unsustainable spending spree cannot be avoided. Thus, Romania’s decline from star performer to problem child in the EU will continue.
On the political front, EU institutions are expected to increase pressure on Romanian authorities to overturn recent blows to judicial independence, highlighted by the Venice Commission. Thus, Romania is likely to follow Poland and Hungary on the list of EU countries facing Article 7 procedures, although the European Parliament may vote to trigger such procedures only next spring at the earliest. The use of force, tear gas and rubber bullets to quell street protests in August further isolated the governing coalition in the EU. Despite pressure from their European political groups, the Social Democrats (PSD) and the Liberal Democrats (ALDE) are likely to pursue their agenda for the time being.
Backed by the Constitutional Court, the government removed the head of the National Anticorruption Directorate, Laura Codruța Kövesi, while Parliament voted to reduce the range of punishable corruption crimes and of evidence that prosecutors can use in court. These measures may not suffice to keep PSD President Liviu Dragnea out of jail and he may attempt a third government reshuffle to advance his agenda. However, Mr. Dragnea’s desire for a hasty overhaul of past court sentences and court independence may not be palatable for PSD and ALDE politicians who are considering a run in next year’s presidential election. Their aversion to dramatic actions in a prolonged election cycle weakens Mr. Dragnea’s position and increases the risk of disagreements in the governing coalition. The quality of governance is also affected, lacking major reforms and focus on long-term policies.
Political noise is drowning out alarm signals coming from the economy. Economic growth is slowing, with our forecast of 3.7% for this year and 3.3% in 2019 facing downside risks. The extraordinary buildup in inventories during 1H18 – when they accounted for most of the growth – cannot be repeated. At the same time, private consumption growth should slow from here as the scope for public wage and pension increases narrowed substantially. In addition, financial conditions are tightening. The inflationary fiscal expansion of 2017-18 is likely to leave lending rates higher for longer, slowing credit growth with the help of tighter prudential regulation from the NBR. The government is facing a stark choice: it either reduces public spending to cap the budget deficit at 3% of GDP or faces a further tightening in financial conditions. The latter scenario is likelier.
FINANCIAL CONDITIONS ARE EXPECTED TO TIGHTEN FURTHER
PUBLIC INVESTMENT WILL CONTINUE TO SHRINK AS A PERCENT OF GDP
-20
-10
0
10
20
30
40
50
60
Dec-15 Jun-16 Dec-16 Jun-17 Dec-17 Jun-18
Corporate lending Mortgage lending
Consumer lending
change in lending standards over the previous 3M,balance, + = tightening
0
1
2
3
4
5
6
7
2014 2015 2016 2017 2018F 2019F
Capital expenditure EU fundsGDP (%)
Source: NBR, MoF, NSI, UniCredit Research

<date>
September 2018 CEE Macro & Strategy Research
CEE Quarterly
UniCredit Research page 62 See last pages for disclaimer.
The government faces the choice of cutting expenditure… …or breaching the budget deficit threshold of 3% of GDP… …that would lead to higher borrowing costs for the economy… …adding to labor shortages and lower competitiveness in slowing GDP growth The RON receives little support from stable capital flows… …and the NBR could continue FX interventions… …that would tighten monetary conditions further Inflation could return to the target range in 2019 if EUR-USD rises and oil prices fall
In the first case, the government will be forced to reduce expenditure if it wants to lower the deficit, since just one of the potential measures aimed at improving tax collection has been implemented23. Public investment has been cut for five consecutive years, but the scope for compressing it further is very limited. As a result, public transfers should be cut as well, but this may be difficult to achieve in election years 2019-20. If budget deficits exceed 3% of GDP, the government may struggle to finance additional needs at a time when the appetite for EM bonds is low. Without the backing of portfolio inflows, financial conditions would tighten further, likely slowing GDP growth to close to or below 3% in 2019-20.
Higher borrowing costs and scarce labor in services, manufacturing and construction will weigh on private sector businesses. Even top-performing sectors like trade, industry and IT services are likely to grow at a slower pace in 2019. Although the poor harvest will support food retail, lower consumer lending is likely to weigh on sales of durable goods. Diminishing cost competitiveness due to fast wage growth and the overvalued RON may affect industrial output, despite a boost late next year from a large, new white-goods factory. In contrast to the rest of central Europe, higher borrowing costs, lower wealth transfers to real estate and poor EU fund absorption may slow output growth in construction.
The weak harvest spells trouble for the C/A deficit in 2H18 and 1H19, offsetting the expected slowdown in non-food import growth. Thus, the external shortfall could remain close to 4% of GDP this year and next, too large to be covered by FDI and EU fund inflows. Structural and investment fund payments from the EU slowed in the summer as the government cut infrastructure spending. A quick recovery is unlikely and we adjust our expectations for structural and investment fund inflows to EUR 2.0bn (1.0% of GDP) in 2018, keeping our rather optimistic forecast of EUR 2.2bn (1.0% of GDP) for 2019. As a result, the RON could come under pressure whenever portfolio flows weaken. We expect the NBR to resume indirect FX interventions in such a scenario.
Although the NBR stopped short of announcing the end of the hiking cycle, we believe that further monetary tightening is unavoidable if fiscal and political risks remain high. However, this tightening may be delivered by pushing ROBOR rates to 3.5% or higher through interventions in the FX market and by limiting repos24. We expect inflation at 3.6% at the end of this year and 3.3% at the end of 2019 if EUR-USD rises to 1.25 and the Brent price falls to USD 70/bbl. Assuming constant EUR-USD and oil prices, inflation will remain outside the target range throughout 2019. Additional inflationary risks stem from rising food and core prices, as well as potential ad-hoc increases in regulated prices used to cover unforeseen fiscal shortfalls.
GRAIN EXPORTS ARE LIKELY TO FALL WITH PRODUCTION* THE RON IS OVERVALUED COMPARED TO REGIONAL PEERS
-60
-40
-20
0
20
40
60
80
100
120
2011 2012 2013 2014 2015 2016 2017 2018E
Grain production (EUR bn, constant 2005 prices)Grain exports (mn tons, 12M cum to June of next year, rs)
yoy (%)
0.80
0.85
0.90
0.95
1.00
1.05
1.10
1.15
Mar-09 Sep-10 Mar-12 Sep-13 Mar-15 Sep-16 Mar-18
CZK HUF PLN RONULC-based REER, 1 = 2009,decline = appreciation
*2018 production forecast from the European Commission Source: EC, Eurostat, NBR, NSI, UniCredit Research
23 For details, please see the 3Q18 CEE Quarterly “A moment of reckoning”, pages 61-62. Electronic cash registries are compulsory since 1 September. 24 For details, please see the EEMEA Macro Flash “The National Bank of Romania (almost) announces the end of the tightening cycle” from 6 August.

<date>
September 2018 CEE Macro & Strategy Research
CEE Quarterly
UniCredit Research page 63 See last pages for disclaimer.
A temporary ROMGB rally with many risks in tow ROMGBs could rally until 1Q19 if risks remain contained Selling the RON via forwards could pay off from 1Q19 onwards The government will try to sell EUR bonds up to EUR 2bn this year
While ROMGB yields should follow inflation lower, a further rally may be curtailed by fiscal, political and/or external risks. EUR-RON could be capped at 4.70 for as long as inflation remains outside the target range. Limited depreciation is possible next year, with the ceiling moved to EUR-RON 4.80 if inflation does not threaten to exit the target range.
Interbank interest rates could rise again before year-end if the RON comes under pressure. They are likely to fall in January-February 2019 since the central bank cannot sterilize all government spending at the end of the year. That may prove a good point to take profit on ROMGBs and go long EUR-RON via forwards.
The Romanian government still has up to EUR 2.5bn in Eurobonds to sell before year-end. With the fiscal buffer more than halving this year to approximately EUR 2bn, the MinFin may have to pay a higher issuance premium and limit maturities due to low appetite for EM bonds. A retap of ROMANI EUR 2030 is possible.
AS EXPECTED, REAL ROMGB YIELDS ARE STARTING TO TURN POSITIVE
POOR LIQUIDITY CONDITIONS FORCE THE NBR TO OFFER RON VIA REPOS
-4
-2
0
2
4
6
8
10
Mar-11 Jun-12 Sep-13 Dec-14 Mar-16 Jun-17 Sep-18 Dec-19
ROMGB 3Y yield ROMGB 5Y yieldROMGB 10Y yield Inflation rate%
0.0
3.0
6.0
9.0
12.0
15.0
18.0
21.0
24.0Nov-13 Jul-14 Mar-15 Nov-15 Jul-16 Mar-17 Nov-17 Jul-18
0.0
0.5
1.0
1.5
2.0
2.5
3.0
3.5
4.0
4.5
Repo (RON bn, daily avg., rs) Credit facility (RON bn, daily avg., rs)1W deposits (RON bn, daily avg., rs) Deposit facilityROBOR 3M (%) EURRON 3M Fwd Implied (%)
Source: NBR, NSI, Bloomberg, UniCredit Research
GOVERNMENT GROSS FINANCING REQUIREMENTS GROSS EXTERNAL FINANCING REQUIREMENTS EUR bn 2017 2018F 2019F Gross financing requirement 12.9 14.2 16.1 Budget deficit 5.3 5.9 7.3 Amortization of public debt 7.6 8.3 8.7 Domestic 6.4 5.5 6.2 Bonds 3.5 3.5 3.9 Bills 2.6 1.8 2.0 Loans 0.3 0.2 0.3 External 1.2 2.9 2.5 Bonds and loans 0 1.5 1.5 IMF/EU/Other IFIs 1.2 1.4 1.0 Financing 12.9 14.2 16.1 Domestic borrowing 8.6 8.3 11.1 Bonds 6.7 6.2 9.0 Bills 1.8 2.0 2.0 Loans 0.1 0.1 0.1 External borrowing 3.5 5.0 4.2 Bonds 2.8 4.5 3.5 IMF/EU/Other IFIs 0.7 0.5 0.7 Privatization/Other 0 0 0 Fiscal reserve change (- = increase) 0.8 1.0 0.7
EUR bn 2017 2018F 2019F Gross financing requirement 33.4 35.9 35.3 C/A deficit 6.3 8.2 8.7 Amortization of medium and long term debt 15.8 15.0 13.3 Government/central bank 3.7 4.7 3.9 Banks 4.7 2.1 1.9 Corporates/Other 7.4 8.2 7.4 Amortization of short-term debt 11.3 12.7 13.3 Financing 33.4 35.9 35.3 FDI (net) 4.6 4.7 4.9 Portfolio equity, net 0.1 0.1 0.1 Medium and long-term borrowing 13.7 13.4 12.2 Government/central bank 4.5 5.6 5.3 Banks 3.3 2.0 1.7 Corporates/Other 5.9 5.7 5.2 Short-term borrowing 12.3 14.2 12.8 EU structural and cohesion funds 2.0 2.0 2.2 Change in FX reserves (- = increase) 0.7 1.5 3.1 Memoranda: Nonresident purchases of LC govt bonds 0.2 1.2 1.4 International bond issuance, net 2.8 3.0 2.0
Source: Eurostat, NBR, NSI, MoF, UniCredit Research

<date>
September 2018 CEE Macro & Strategy Research
CEE Quarterly
UniCredit Research page 64 See last pages for disclaimer.
Slovakia A2 positive/A+ stable/A+ stable*
Outlook Economic growth is expected to accelerate to 3.9% in 2018 and 4.1% in 2019, benefitting from larger production capacity in the car industry that may offset the cyclical slowdown in European demand in 2019. The C/A deficit will start to narrow, helped by car exports from 2H18 onwards and may close by the end of 2020. Labor market conditions will remain tight, supporting wage growth and household spending. Inflation could remain anchored close to 2.5% due to food and core prices, offsetting part of nominal wage growth. Fiscal goals are less ambitious than in the past, relying mostly on budget revenues being lifted by strong economic growth, while public spending may rise due to approaching elections.
Author: Ľubomír Koršňák, Chief Economist (UniCredit Bank Czech Republic and Slovakia)
KEY DATES/EVENTS
■ 11 Oct, 9 Nov, 11 Dec – Industrial production
■ 15 Oct, 14 Nov, 14 Dec - CPI
■ 14 Nov – flash 3Q18 GDP
■ 7 Dec – 3Q18 GDP structure
GDP GROWTH FORECAST
-2
-1
0
1
2
3
4
5
6
2014 2015 2016 2017 2018F 2019F
Domestic demand Net export GDPyoy (%, pp)
INFLATION FORECAST
-1.5
-1.0
-0.5
0.0
0.5
1.0
1.5
2.0
2.5
3.0
3.5
Jan-14 Nov-14 Sep-15 Jul-16 May-17 Mar-18 Jan-19 Nov-19
yoy (%)
Source: SOSR, UniCredit Research
MACROECONOMIC DATA AND FORECASTS
EUR bn 2015 2016 2017 2018F 2019F GDP (EUR bn) 78.9 81.2 85.0 90.5 96.5 Population (mn) 5.4 5.4 5.4 5.4 5.4 GDP per capita (EUR) 14,546 14,943 15,639 16,642 17,755 Real economy, change (%) GDP 3.9 3.3 3.4 3.9 4.1 Private Consumption 2.3 2.6 3.7 2.9 2.6 Fixed Investment 19.8 -8.3 3.2 9.5 0.7 Public Consumption 5.4 1.6 0.2 1.0 1.5 Exports 6.4 6.2 4.3 6.5 6.7 Imports 8.4 3.7 3.9 5.7 5.0 Monthly wage, nominal (EUR) 883 912 954 1,014 1,082 Real wage, change (%) 3.3 3.8 3.4 3.7 3.9 Unemployment rate (%) 11.5 9.6 8.1 6.4 6.1 Fiscal accounts (% of GDP) Budget balance -2.7 -2.2 -1.0 -0.8 -0.2
Primary balance -1.0 -0.6 0.4 0.6 1.2
Public debt 52.3 51.8 50.9 49.2 46.9
External accounts Current account balance (EUR bn) -1.4 -1.2 -1.8 -1.6 -0.5
Current account balance/GDP (%) -1.7 -1.5 -2.1 -1.8 -0.6
Extended basic balance/GDP (%) 1.9 -0.1 0.9 1.7 2.1
Net FDI (% of GDP) 0.1 -0.6 2.0 2.5 1.7
Gross foreign debt (% of GDP) 85.2 90.9 110.8 104.8 98.4
FX reserves (EUR bn) EUR EUR EUR EUR EUR
Months of imports, goods & services - - - - -
Inflation/Monetary/FX CPI (pavg) -0.3 -0.5 1.3 2.5 2.6 CPI (eop) -0.5 0.2 1.9 2.4 2.7 Central bank target EUR EUR EUR EUR EUR
Central bank reference rate (eop) EUR EUR EUR EUR EUR
3M money market rate (Dec avg) EUR EUR EUR EUR EUR
USD/FX (eop) EUR EUR EUR EUR EUR
EUR/FX (eop) EUR EUR EUR EUR EUR
USD/FX (pavg) EUR EUR EUR EUR EUR
EUR/FX (pavg) EUR EUR EUR EUR EUR
Real effective exchange rate, 2000=100 166.5 166.4 164.5 165.3 166.3
Change (%) -1.8 0.0 -1.2 0.5 0.6
Source: Eurostat, SORS, UniCredit Research
*Long-term foreign currency credit rating provided by Moody’s, S&P and Fitch, respectively
<date>
September 2018 CEE Macro & Strategy Research
CEE Quarterly
UniCredit Research page 65 See last pages for disclaimer.
All about cars Economic growth may accelerate driven by the car industry
Labor market conditions to remain tight… …mainly in western Slovakia
Inflation does not offset nominal wage growth Fiscal goals unchanged, approaching elections will boost public spending Busy election calendar in the next two years Politics remains a main domestic risk… …while trade wars are the biggest external risk
Economic growth is set to remain close to 4% in 2019, with car production leading the way. Additional production capacity is expected to offset lower demand for existing models caused by the cyclical slowdown in European car sales. The new car plant of Jaguar Land-Rover (JLR) is scheduled to start production in 4Q18. This may postpone the business cycle peak to mid-2019 or later in Slovakia. As a result, exports will take over next year as the main growth driver, narrowing the C/A deficit and eliminating it by the end of 2020, if the US does not impose higher tariffs on car imports from the EU. In 2019, the growth of private investment and imports will be affected by the end of the JLR investment, which will be only partially offset by recovering public investment.
Labor market conditions will remain tight, especially in western Slovakia. The local labor market is affected by structural imbalances, being split in two. In the western part of the country, where car producers are clustered, there is a labor force problem and the unemployment rate is 2-4%. In contrast, the unemployment rate is close to 10% in the south and eastern Slovakia. The unemployed are poorly trained, have low mobility and most have been out of a job for a long time. Moreover, the labor market in south and eastern Slovakia shows signs of a cyclical slowdown: unemployment is falling at a slower pace and job vacancy rates have peaked. This may prevent a further decline in the country-wide unemployment rate, which could stabilize at just above 6% in 2019 and beyond, although wage pressure and demand for employees from abroad will increase. Nevertheless, Slovakia will remain a net exporter of labor.
Inflation is expected to offset only part of nominal income growth, moving just above 2.5% in 2019. Core prices will continue to accelerate, driven by dynamic wage growth, while the poor harvest will add pressure on food prices. On the other hand, approaching elections may prevent a full transition of higher market energy prices into regulated utility prices for households (electricity, heat, and gas).
The budget deficit is set to decline in coming years, with a balanced budget expected in 2020 and public debt declining below the debt brake threshold of 48% of GDP in 2019, solely on the back of higher budget revenues amid strong growth. No policy change scenario would balance the budget deficit one year earlier. General elections scheduled for spring 2020 are likely to lead to a boost in public spending. The governing coalition has already proposed an increase in wages for all public employees by 10% in both 2019 and 2020. Additional rounds of social security measures are very likely. Recently proposed measures tend to burden the business sector. For example, the tax-free mandatory voucher for domestic holiday trips introduced in 2019 will divide costs between employers (55%) and employees (45%).
Domestic politics stabilized recently. The new government led by Peter Pellegrini has a stable majority in Parliament. Any turmoil that could lead to early elections may be prevented by the election of constitutional judges – 9 out of 13 judges are going to be replaced by Parliament at the beginning of 2019. After that, early elections cannot be ruled out as the coalition may try to prevent the emergence of a party led by current President Andrej Kiska, that could prove a main contender in the parliamentary elections expected in spring 2020. The popular Mr. Kiska will not run in presidential elections expected in spring 2019, but intends to stay in politics. The contender pool for presidential elections is wide, led by Robert Mistrík, candidate of the strongest opposition party, Freedom and Solidarity (SaS). However, the ruling SMER-SD will nominate a candidate only by late autumn. Meanwhile, municipal elections that will take place on 10 November 2018 may not reflect a true image of parties’ national support, as their result depends mostly on the popularity of local politicians.
Risks to the economic outlook are skewed to the downside. Domestic risks are related mainly to poor EU-fund absorption for public investment and to fiscal policy. Main external risks are rising protectionism in the US and a potentially hard Brexit, both mostly through their impact on the automotive sector. Contagion from Turkey may affect the economy only indirectly.

<date>
September 2018 CEE Macro & Strategy Research
CEE Quarterly
UniCredit Research page 66 See last pages for disclaimer.
Slovenia Baa1 stable/A+ positive/A- stable*
Outlook GDP growth is likely to remain solid in 2018 (4.3%), although the latest data introduce some downside risk to our GDP forecast. Growth is likely to slow further to 3% in 2019 due to lower domestic demand growth and a smaller contribution of net exports. The new commitment package to sell NLB approved by the European Commission bodes well for the sale of the state bank. A fragmented parliament led to a five-party coalition short of a parliamentary majority. This bodes ill for government stability and the reform agenda. Despite the reduction of political uncertainty in the short term, government bond yield spreads vs. German Bunds might still widen. The main risk is loose fiscal policy in a context of weak risk appetite for EM financial assets, rising political and economic risk in the eurozone, and the end of ECB bond purchases.
Author: Mauro Giorgio Marrano, Senior CEE Economist (UniCredit Bank, Vienna)
KEY DATES/EVENTS
■ 30 Nov: 3Q18 GDP
■ 10 Oct, 9 Nov, 10 Dec: Industrial production
■ 2 Nov: sovereign rating update from Moody’s
GDP GROWTH FORECAST
-2
-1
0
1
2
3
4
5
6
7
8
2015 2016 2017 2018F 2019F
Household Consumption Government ConsumptionInvestments InventoriesNet Exports GDP Growth
yoy (%)
INFLATION FORECAST
-1.5
-1.0
-0.5
0.0
0.5
1.0
1.5
2.0
2.5
3.0
Dec-14 Jun-16 Dec-17 Jun-19
yoy (%)
Source: SURS, UniCredit Research
MACROECONOMIC DATA AND FORECASTS
2015 2016 2017 2018F 2019F GDP (EUR bn) 38.9 40.4 43.0 45.7 48.0
Population (mn) 2.1 2.1 2.1 2.1 2.1
GDP per capita (EUR) 18,836 19,547 20,816 22,105 23,214
Real economy, change (%) GDP 2.3 3.1 4.9 4.3 3.0
Private Consumption 2.3 3.9 1.9 2.3 2.6
Fixed Investment -1.6 -3.7 10.7 9.3 7.5
Public Consumption 2.4 2.7 0.5 2.7 1.3
Exports 5.0 6.4 10.7 8.8 6.2
Imports 4.7 6.6 10.3 8.8 6.8
Monthly wage, nominal (EUR) 1,556 1,584 1,626 1,677 1,727
Real wage, change (%) 1.4 2.0 1.1 1.1 0.9
Unemployment rate (%) 9.0 8.0 6.6 5.7 5.3
Fiscal accounts (% of GDP) Budget balance -2.9 -1.9 0.0 0.2 0.4
Primary balance 0.4 1.1 2.5 2.6 2.7
Public debt 82.6 78.5 73.6 70.0 67.5
External accounts Current account balance (EUR bn) 1.8 2.2 3.1 2.9 3.0
Current account balance/GDP (%) 4.5 5.5 7.2 6.3 6.1
Extended basic balance/GDP (%) 9.3 7.9 8.4 8.4 8.2
Net FDI (% of GDP) 3.3 2.1 1.0 1.5 1.6
Gross foreign debt (% of GDP) 120.0 111.0 101.9 98.1 95.4
FX reserves (EUR bn) 0.8 0.7 0.7 0.8 0.8
Months of imports, goods & services
Inflation/Monetary/FX CPI (pavg) -0.8 -0.2 1.6 2.0 2.1
CPI (eop) -0.6 0.6 1.9 2.0 2.1
Source: SURS, Eurostat, UniCredit Research
*Long-term foreign currency credit rating provided by Moody’s, S&P and Fitch, respectively

<date>
September 2018 CEE Macro & Strategy Research
CEE Quarterly
UniCredit Research page 67 See last pages for disclaimer.
Risk of wider bond yield spreads Some downside risks to our GDP forecast for 2018
New commitment package for NLB bodes well for privatization of the state bank A new coalition government has reduced short-term political uncertainty… …but still holds risks of wider bond spreads
The economic environment has remained relatively favorable with still solid GDP growth, a good fiscal performance, and tighter labor market conditions. Political uncertainty diminished, as five parties agreed to form a coalition government. There are two focus points for the remainder of 2018 and for 2019. First, the latest economic indicators introduced some risks to our GDP forecasts. Second, bond yield spreads vs. German Bunds might widen, with the main risk being loose fiscal policy in a context of weak risk appetite for EM financial assets, political and economic risk in the eurozone, and the ECB ending bond purchases.
GDP growth is likely to remain solid in 2018 (4.3%), although lower than in 2017 (4.9%) mainly due to a lower contribution from net exports and investment. The latest data, however, introduced some downside risk to our forecasts. First, after peaking at 6.0% yoy in 4Q17 and slowing to 4.6% yoy in 1Q18, GDP growth slowed further in 2Q18 to 3.8% yoy, somewhat more than we had expected (4.2% yoy). While the deceleration in 1Q18 was mainly driven by weaker exports, in 2Q18 it was mainly related to weaker consumption (1.1% yoy vs. 3.4% yoy in 1Q18), in part related to a high base in retail sales in 2Q17, and inventories (which subtracted almost 1 pp from growth). Second, some of the first monthly economic indicators for 3Q18 showed some further deterioration. The economic sentiment indicator and consumer confidence declined further, probably hit by the risk of global trade wars and local political noise. On the other hand, industrial production growth remained solid. Assuming demand in Europe slows only gradually and higher tariffs between the US and the EU are avoided, the Slovenian economy should enjoy robust, above-potential growth. Looking at 2019, the expected growth slowdown mirrors that in the eurozone and will likely be driven by both net exports and domestic demand.
The new commitment package for NLB submitted by Slovenian authorities in July, and approved by the European Commission, bodes well for the privatization of the state-owned bank. The package includes the commitment to sell 50% plus one share by the end of 2018 and to reduce the Slovenian government’s stake in the bank to 25% plus one share by the end of 2019. The most important aspect is that, if Slovenia does not respect the deadlines, a divesture trustee will be appointed to take over the sales process. This should prevent further delays in selling NLB, but increases the risk of privatization receipts falling short of government expectations.
The agreement on a new government has reduced political uncertainty, at least in the short term. Almost three months after the National Assembly elections, five parties agreed to form a center-left coalition government with Marjan Šarec, leader of the eponymous list (LMS), as prime minister. The five coalition parties include LMS, the Social Democrats (SD), the previous prime minister’s party Modern Centre Party (SMC), the pensioners’ party (DeSus) and the Party of Alenka Bratušek. Despite the large number of parties, the coalition has only 43 seats in parliament, short of a majority of 46 MPs. Therefore, the government has to rely on the support of representatives of the national communities and the Left. The fragmented parliament bodes ill for the long-term stability of the government and its effectiveness in implementing necessary reforms, especially in health care and pensions.
While political uncertainty has diminished, government bond yield spreads vs. German Bunds might still widen. The main risk is that such a large coalition of political parties with different agendas might run loose fiscal policy that would lead to a higher structural deficit and hamper the reduction of public debt. This comes at a time when the market remains difficult due to external factors, with weak risk appetite for EM financial assets, rising political and economic risk in the eurozone, and the end of ECB bond purchases. A clear commitment from the new government to prudent fiscal policy would help to contain the risk of bond spreads widening.
On the fiscal front, the small public surpluses in 2018 and 2019 (0.2% and 0.4% of GDP) should allow public debt to fall further to below 70% by the end of 2019, barring the risk of looser fiscal policies mentioned above. In terms of issuance, we expect the ministry of finance to issue around EUR 2.5-3.0bn in 2019, in light of two large redemptions (EUR 1.1bn of a EUR-denominated bond, and EUR 1.2bn of a USD-denominated bond).
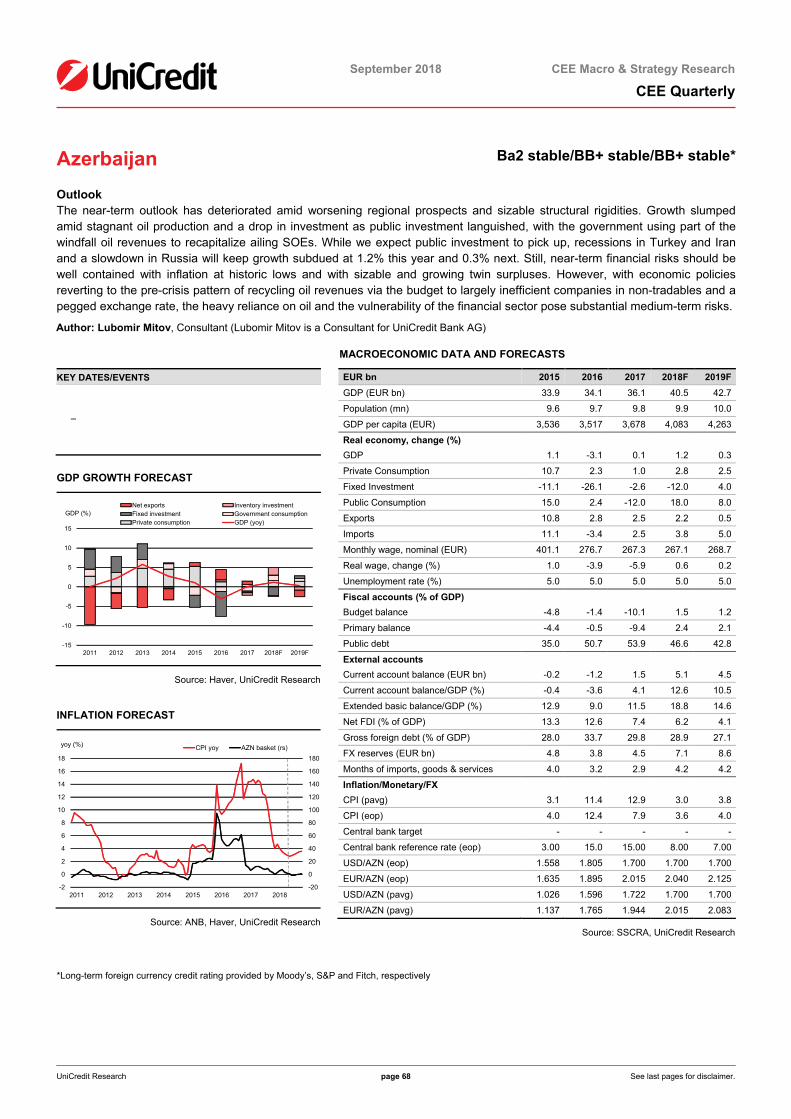
<date>
September 2018 CEE Macro & Strategy Research
CEE Quarterly
UniCredit Research page 68 See last pages for disclaimer.
Azerbaijan Ba2 stable/BB+ stable/BB+ stable*
Outlook The near-term outlook has deteriorated amid worsening regional prospects and sizable structural rigidities. Growth slumped amid stagnant oil production and a drop in investment as public investment languished, with the government using part of the windfall oil revenues to recapitalize ailing SOEs. While we expect public investment to pick up, recessions in Turkey and Iran and a slowdown in Russia will keep growth subdued at 1.2% this year and 0.3% next. Still, near-term financial risks should be well contained with inflation at historic lows and with sizable and growing twin surpluses. However, with economic policies reverting to the pre-crisis pattern of recycling oil revenues via the budget to largely inefficient companies in non-tradables and a pegged exchange rate, the heavy reliance on oil and the vulnerability of the financial sector pose substantial medium-term risks.
Author: Lubomir Mitov, Consultant (Lubomir Mitov is a Consultant for UniCredit Bank AG)
KEY DATES/EVENTS
–
GDP GROWTH FORECAST
-15
-10
-5
0
5
10
15
2011 2012 2013 2014 2015 2016 2017 2018F 2019F
Net exports Inventory investmentFixed investment Government consumptionPrivate consumption GDP (yoy)
GDP (%)
Source: Haver, UniCredit Research
INFLATION FORECAST
-20
0
20
40
60
80
100
120
140
160
180
-2
0
2
4
6
8
10
12
14
16
18
2011 2012 2013 2014 2015 2016 2017 2018
CPI yoy AZN basket (rs)yoy (%)
Source: ANB, Haver, UniCredit Research
MACROECONOMIC DATA AND FORECASTS
EUR bn 2015 2016 2017 2018F 2019F GDP (EUR bn) 33.9 34.1 36.1 40.5 42.7
Population (mn) 9.6 9.7 9.8 9.9 10.0
GDP per capita (EUR) 3,536 3,517 3,678 4,083 4,263
Real economy, change (%) GDP 1.1 -3.1 0.1 1.2 0.3
Private Consumption 10.7 2.3 1.0 2.8 2.5
Fixed Investment -11.1 -26.1 -2.6 -12.0 4.0
Public Consumption 15.0 2.4 -12.0 18.0 8.0
Exports 10.8 2.8 2.5 2.2 0.5
Imports 11.1 -3.4 2.5 3.8 5.0
Monthly wage, nominal (EUR) 401.1 276.7 267.3 267.1 268.7
Real wage, change (%) 1.0 -3.9 -5.9 0.6 0.2
Unemployment rate (%) 5.0 5.0 5.0 5.0 5.0
Fiscal accounts (% of GDP) Budget balance -4.8 -1.4 -10.1 1.5 1.2
Primary balance -4.4 -0.5 -9.4 2.4 2.1
Public debt 35.0 50.7 53.9 46.6 42.8
External accounts Current account balance (EUR bn) -0.2 -1.2 1.5 5.1 4.5
Current account balance/GDP (%) -0.4 -3.6 4.1 12.6 10.5
Extended basic balance/GDP (%) 12.9 9.0 11.5 18.8 14.6
Net FDI (% of GDP) 13.3 12.6 7.4 6.2 4.1
Gross foreign debt (% of GDP) 28.0 33.7 29.8 28.9 27.1
FX reserves (EUR bn) 4.8 3.8 4.5 7.1 8.6
Months of imports, goods & services 4.0 3.2 2.9 4.2 4.2
Inflation/Monetary/FX CPI (pavg) 3.1 11.4 12.9 3.0 3.8
CPI (eop) 4.0 12.4 7.9 3.6 4.0
Central bank target - - - - -
Central bank reference rate (eop) 3.00 15.0 15.00 8.00 7.00
USD/AZN (eop) 1.558 1.805 1.700 1.700 1.700
EUR/AZN (eop) 1.635 1.895 2.015 2.040 2.125
USD/AZN (pavg) 1.026 1.596 1.722 1.700 1.700
EUR/AZN (pavg) 1.137 1.765 1.944 2.015 2.083
Source: SSCRA, UniCredit Research
*Long-term foreign currency credit rating provided by Moody’s, S&P and Fitch, respectively

<date>
September 2018 CEE Macro & Strategy Research
CEE Quarterly
UniCredit Research page 69 See last pages for disclaimer.
Increasing challenges Despite high oil prices, the outlook has deteriorated… …due both to regional economic problems… …as well as domestic policies
At the same time, booming oil revenues pushed the C/A into a large surplus Fiscal policy remained restrictive… …which, together with a fixed AZN, helped reduce inflation to record lows Even so, the policy rate has been left unchanged… …tightening monetary conditions and limiting bank lending
The focus of monetary policy has shifted to ANZ anchoring…
…with FX surpluses saved in the National Oil Fund We expect growth to pick up in the remainder of the year… …but slow next year due to recessions in Iran and Turkey
Inflation will pick up a bit but remain below target… …with large C/A surpluses saved in the State Oil Fund… …with no impact on monetary policy and slight fiscal easing We see no immediate threats to financial stability… …but growth potential remains weak over the medium term Structural rigidities, vested interests and poor education constrain nonoil growth… …as do weak banks and poor financial intermediation Signs of a return to pre-crisis policies could be risky… …and limit room for maneuver in case of an oil price shock
Despite high oil prices, the near-term outlook has deteriorated, due both to external and domestic factors. Externally, recessions in Iran and, more recently, in Turkey, and a renewed slowdown in Russia, have brought growth to a halt. Domestically, the decision to use a large part of the windfall oil revenues to recapitalize ailing SOEs has caused a drop in public investment, slowing growth in the nonoil sector. This, along with stagnating oil production, cut yoy growth to just 0.2% in January-July. (Part of the slowdown reflects the impact of a blackout in July. However, even taking the latter into account, GDP growth was around 1%).
On the positive side, rising windfall oil revenue pushed the C/A to a 15% of GDP surplus in January-June. The improvement in state finances was much smaller. The general government shifted to a slight surplus in January-July from a moderate deficit a year ago as part of the 11% real yoy increase in revenue (equivalent to 2.8% of GDP) was used to boost current spending and recapitalize SOEs. The latter, however, did not add to demand, leaving fiscal policy tighter. This, along with sluggish demand and an effectively fixed AZN, helped reduce yoy inflation to as low as 2.8% in July from 12.9% at the end of last year. (Much of this slowdown reflected the lapse of the base effect of the sharp AZN depreciation in 2016).
Despite the fall in inflation, the policy rate has been left unchanged at 10% since June, down from 15% at the start of the year. In real terms, the policy rate rose to 7.2% in July from 2% at the end of 2017. With deposit and lending rates remaining virtually unchanged, monetary conditions have tightened considerably. Not surprisingly, bank lending has stagnated, after halving in nominal terms during 2015-17, despite ample bank liquidity.
The focus of monetary policy seems to have shifted back to exchange rate anchoring. The AZN has been unchanged since the start of the year, even though the terms of trade gains ought to have led to its appreciation, with FX surpluses directed to the State Oil Fund. Its assets rose by USD 2.6bn in January-June, matching the C/A surplus.
Looking forward, we expect growth to regain some momentum in the remainder of the year as public investment accelerates. On the other hand, the deteriorating economic situation in the region will weigh on growth, especially next year as Iran and Turkey slip into deep recessions. Therefore, we have revised downward our growth projection from 2% to 1.2% for this year and from 3% to 0.3% next year.
Inflation is likely to have bottomed out in the summer and looks likely to accelerate to 3.6% by yearend and 4% next year, still below the 6-8% target range, contained by the cautious policy stance and ANZ stability. The latter will be helped by a C/A surplus exceeding 10% of GDP and even larger extended basic balances. These, however, will continue to be accumulated in the State Oil Fund, with no material impact on monetary policy. Fiscal policy is likely to be expansionary next year, but only slightly, cutting the surplus from 1.5% to 1.2% of GDP.
While we see no near-term threats to financial stability given sizable buffers and the improved oil price outlook, the poor growth potential and the heavy reliance on oil are major challenges and pose significant medium-term risks. With oil production bound by capacity constraints and set to decline over time, and no signs of the reforms needed to unlock nonoil growth, medium-term growth remains constrained at about 2%, even with the expected rise in gas production.
The nonoil growth potential is limited by the dominance of SOEs and politically connected vested interests that stifle completion and entrepreneurship. Nonoil growth depends mostly on recycling oil revenues, which are directed mainly to non-tradables, while poor education constrains higher value-added activities. Poor financial intermediation and the weak and still not fully restructured banking system are another constraint and a significant risk.
Finally, signs of a return to budget redistribution of the oil revenues and reliance on the AZN peg could lead to the emergence of the same behavior patterns of risky lending and excessive FX risk that led to the 2014-15 crisis. Moreover, such policy moves would limit scope for maneuver if oil prices drop, exacerbating the fallout as occurred in 2014-15.

<date>
September 2018 CEE Macro & Strategy Research
CEE Quarterly
UniCredit Research page 70 See last pages for disclaimer.
Bosnia and Herzegovina B3 stable/B stable/not rated*
Outlook – The acceleration of growth in the rest of the year, driven by strong exports and private consumption, should result in GDP growth of 2.9%. This is somewhat lower than in our previous forecast due to the unexpectedly weak 1Q and the renewed delays in IMF financing which is likely to cause a delay in some investment projects into 2019. Exports and private consumption should remain the main contributors to growth in 2019, when we expect real GDP to increase 3.2%, supported by a marked pickup in investment in infrastructure projects, assuming IMF lending resumes. Downside risks are significant, however, stemming from the uncertainties related to the general and presidential elections scheduled for 7 October, and the possible difficulties in forming new governments at the federal and state level, as well as the uncertainty related to future disbursements under the IMF EFF program. In any case, essential reforms leading to the improvement of the business environment, institutional setup and labor market functioning in such circumstances seem likely to be put on hold until viable solutions for the complex political situation are found.
Authors: Hrvoje Dolenec, Chief Economist (Zagrebačka banka) Nenad Golac, Senior Economist (Zagrebačka banka)
KEY DATES/EVENTS
■ 7 Oct: General Elections
■ 10 Dec: GDP 3Q 2018 preliminary data
■ 20 Dec: Foreign trade November 2018
■ 21 Dec: Industrial Production November 2018
■ 21 Dec: Balance of payments 3Q 2018
GDP GROWTH FORECAST
-10
-5
0
5
10
15
20
4Q12
1Q13
2Q13
3Q13
4Q13
1Q14
2Q14
3Q14
4Q14
1Q15
2Q15
3Q15
4Q15
1Q16
2Q16
3Q16
4Q16
1Q17
2Q17
3Q17
4Q17
1Q18
2Q18
3Q18
yoy (growth rate, %) Industrial production Merchandise exportsMerchandise imports
INFLATION FORECAST
-2.0
-1.5
-1.0
-0.5
0.0
0.5
1.0
1.5
2.0
2.5
Dec
-13
Mar
-14
Jun-
14S
ep-1
4D
ec-1
4M
ar-1
5Ju
n-15
Sep
-15
Dec
-15
Mar
-16
Jun-
16S
ep-1
6D
ec-1
6M
ar-1
7Ju
n-17
Sep
-17
Dec
-17
Mar
-18
Jun-
18S
ep-1
8D
ec-1
8M
ar-1
9Ju
n-19
Sep
-19
Dec
-19
CPI (%, yoy)
Source: Agency for statistics, UniCredit Research
MACROECONOMIC DATA AND FORECASTS
EUR bn 2015 2016 2017F 2018F 2019F GDP (EUR bn) 14.62 15.29 16.05 16.77 17.58 Population (mn) 3.52 3.51 3.50 3.48 3.46 GDP per capita (EUR) 4154 4357 4591 4818 5081 Real economy, change (%) GDP 3.1 3.1 2.6 2.9 3.2 Monthly wage, nominal (EUR) 659 665 676 694 715 Real wage, change (%) 1.0 2.0 0.3 1.2 1.4 Unemployment rate (%) 43.2 41.7 38.4 36.0 34.0 Fiscal accounts (% of GDP) Budget balance -0.2 0.3 2.1 1.2 0.3 Primary balance 0.6 1.2 3.0 2.1 1.1 Public debt 45.5 43.7 40.6 38.9 38.1 External accounts Current account balance (EUR bn) -0.796 -0.742 -0.773 -0.946 -1.055 Current account balance/GDP (%) -5.4 -4.9 -4.8 -5.6 -6.0 Extended basic balance/GDP (%) -2.5 -2.3 -1.7 -2.3 -2.3 Net FDI (% of GDP) 1.7 1.6 2.1 2.4 2.8 Gross foreign debt (% of GDP) 62.9 62.5 61.2 60.9 60.4 FX reserves (EUR bn) 4.4 4.9 5.4 5.8 6.3 Months of imports, goods & services 6.8 7.3 7.3 7.2 7.2 Inflation/Monetary/FX CPI (pavg) -1.0 -1.1 1.3 1.5 1.6 CPI (eop) -1.3 0.3 1.2 1.7 2.0 1M money market rate (Dec avg) -0.21 -0.37 -0.37 -0.37 -0.19 USD/FX (eop) 1.79 1.86 1.63 1.63 1.56 EUR/FX (eop) 1.96 1.96 1.96 1.96 1.96 USD/FX (pavg) 1.76 1.77 1.74 1.63 1.59 EUR/FX (pavg) 1.96 1.96 1.96 1.96 1.96
Source: Agency for statistics, CBBH , UniCredit Research
*Long-term foreign currency credit rating provided by Moody’s, S&P and Fitch, respectively

<date>
September 2018 CEE Macro & Strategy Research
CEE Quarterly
UniCredit Research page 71 See last pages for disclaimer.
Acceleration in growth threatened by political uncertainty GDP growth for 2017 was revised down from 3.0% to 2.6% and just 2.0% yoy in 1Q18… …but this was due primarily to huge downside revision in two services sectors… …but activity in the rest of the economy remains solid, driven by strong exports, private consumption and, to a lesser extent, investment
Prospects for 2019 looked favorable a few months ago… …with the expected approval of the second review of the IMF EFF program unlocking significant foreign financing… …but two political decisions ahead of elections led the IMF to halt lending
Our GDP growth forecast for 2018 revised down to 2.9% from 3.1%... …and from 3.4% to 3.2% for 2019, due to the uncertainty linked to the possible delay in forming a new government… …and further delays in resumption of IMF lending Fiscal position is improving, with public debt likely to fall below 39% of GDP The C/A deficit is expected to widen to 5.6% of GDP, less than expected, but the bulk should be financed by FDI and IFI financing
2017 GDP growth was revised to 2.6% from 3.0% due to unusually large downside revisions in estimated gross value added in professional, scientific and technical activities and administrative and support service sectors. It seems that the same factor (very low level of estimated activity in those two sectors), left real GDP growth in 1Q18 at just 2.0% yoy, despite a very strong seasonally adjusted quarterly pace of 1.0%. However, judging by available high-frequency data, not much has changed in real sector activity, which continued expanding at a solid pace this year, driven by the strong export performance and buoyant private consumption. Industrial production keeps rising at a solid pace, up by 3.3% yoy in January-July. Export growth remained in the double-digit area, rising 11.8% yoy in the first seven months of the year, while retail trade (a proxy for private consumption) increased a solid 7.4% in real terms in the same period. The strong expansion in private consumption is the result of strongly rising households’ real disposable income, afforded by a 2.7% yoy rise in employment and 1.1% yoy growth in real wages in 1H18. Transportation and storage, as well as tourism, also recorded a strong performance in 1H18 (+6.9% and +15.3% yoy, respectively). Construction has fared worse, meanwhile, despite a jump in residential construction in 1H18, with 44.8% more completed dwellings in comparison with the same period of last year. Total construction, however, rose merely 0.9% yoy in 2Q18, down from the already weak 1.6% in 1Q18. Civil engineering works, a good indicator of investment activity, finally started performing slightly better; after several years of declines and a mere 0.5% yoy increase in 1Q18, they rose 1.1% in 2Q18.
Prospects for 2019 looked very favorable just a few months ago, with the expected resumption of IMF financing in the very short term, following a one year-delayed completion of the first review of the EFF program in February and the positive statement issued after the end of the IMF’s last mission in May. It seemed that the economic program remains on track and the approval of the second review would be on the agenda during the summer. This would not only unlock the disbursement of an additional EUR 38mn, but also encourage other IFIs and official bilateral creditors to continue supporting important infrastructure projects. However, at the beginning of the summer, two unexpected events prevented such a positive outcome. The first one was the decision of the government of the Federation B&H to considerably increase payments to demobilized war veterans, yielding to mass public protests. The second one was the almost simultaneous announcement from the government of another entity, Republika Srpska, of an increase in public sector wages. The IMF Board immediately halted the approval procedure and postponed the disbursement of the pending tranche until a detailed assessment is completed of the implications of these decisions on the sustainability of the EFF program.
An even bigger problem is the fact that this IMF decision came just several months before the presidential and parliamentary elections set for 7 October. Under such circumstances, we do not expect that the situation will change until after the election and the formation of new governments on all levels. Therefore, we revised our 2018 real GDP growth forecast from 3.1% to 2.9%, presuming that at least some of the planned infrastructure projects will be postponed. As the risk related to the ability of political participants to reach a viable solution in such a complex political situation is significant, we have also revised our previous 3.4% GDP growth forecast downwards to 3.2%. It is likely that IMF financing will not be resumed at the very beginning of 2019, keeping in mind possible delays in forming new governments after the elections. It also seems that essential reforms in the country are likely to slow down until those uncertainties are overcome. In such an environment, the improved fiscal position, with the general government likely to have a 1.2% of GDP surplus this year, is a positive development, enabling public debt to ease below 39% of GDP. Although the C/A deficit is expected to widen from 4.8% in 2017 to 5.6% of GDP this year, this deterioration is likely to be less pronounced than previously expected, given the delay of some investment in the heavily import-dependent economy. External risks should be contained, given that the bulk of the C/A deficit should be covered by FDI inflows and still available IFIs financing.

<date>
September 2018 CEE Macro & Strategy Research
CEE Quarterly
UniCredit Research page 72 See last pages for disclaimer.
Kazakhstan Baa3 stable/BBB- stable/BBB stable *
Outlook After a strong start of the year thanks to a jump in oil output with the launch of the Kashagan field, the expansion has lost steam as of late amid slowing growth and trade disputes with Russia. Despite high oil prices, the C/A remains in deficit due to a surge in income payments, as does the general government. The KZT has come under renewed depreciation pressure, preventing inflation from slowing and prompting the NBK to keep interest rates on hold. With the one-off effect of the Kashagan launch waning and growth outside energy constrained by structural problems and limited scope for policy support, GDP growth looks set to slip to 3% next year from 3.5% this year and 4% in 2017. While near-term risks are well contained given sizable buffers, the medium-term outlook is less favorable, with growth set to decelerate further amid widespread structural rigidities, stagnant bank lending and lingering concerns about the banking system, whose restructuring and cleanup have yet to be completed.
Author: Lubomir Mitov, Consultant (Lubomir Mitov is a Consultant for UniCredit Bank AG)
KEY DATES/EVENTS
■ 2 Oct, 1 Nov, 4 Dec: CPI
■ 29 Dec: 3Q Balance of payments
■ 15 Oct, 3 Dec: Key rate decision
■ 16-19 Nov 26-27 Dec: 3Q18 GDP (flash, structure)
GDP GROWTH FORECAST
-8-6-4-202468
101214
2010 2011 2012 2013 2014 2015 2016 2017 2018F 2019F
Private consumption Government consumptionFixed investment Inventory investmentNet exports Real GDP
GDP (%)
Source: Haver, UniCredit Research
INFLATION FORECAST
-20
0
20
40
60
80
100
120
0
2
4
6
8
10
12
14
16
18
20
Jan-
14
Apr
-14
Jul-1
4
Oct
-14
Jan-
15
Apr
-15
Jul-1
5
Oct
-15
Jan-
16
Apr
-16
Jul-1
6
Oct
-16
Jan-
17
Apr
-17
Jul-1
7
Oct
-17
Jan-
18
Apr
-18
CPI Core CPI NEER (rs)yoy (%)
Source: NBK, UniCredit Research
MACROECONOMIC DATA AND FORECASTS
EUR bn 2015 2016 2017 2018F 2019F GDP (EUR bn) 158.0 121.3 139.4 136.4 134.8 Population (mn) 17.7 17.9 18.2 18.4 18.6 GDP per capita (EUR) 8941 6768 7676 7417 7240 Real economy, change (%) GDP 1.0 0.9 4.0 3.5 3.0 Private Consumption 1.8 1.2 1.5 2.8 2.0 Fixed Investment 4.2 3.0 4.0 3.5 3.0 Public Consumption 5.5 2.5 2.1 2.8 2.0 Exports -4.1 -4.5 2.2 7.0 2.0 Imports -0.1 -2.0 45.0 3.5 5.0 Monthly wage, nominal (EUR) 500.3 379.4 406.9 386.5 377.8 Real wage, change (%) -2.1 -0.9 -2.1 2.0 2.8 Unemployment rate (%) 5.0 4.9 4.8 4.7 4.7 Fiscal accounts (% of GDP) Budget balance -6.3 -4.1 -7.4 -2.2 -1.5 Primary balance -5.6 -2.9 -6.0 -1.3 -0.6 Public debt 23.4 25.7 27.1 26.5 25.5 External accounts Current account balance (EUR bn) -4.7 -8.1 -4.8 -3.8 -1.4 Current account balance/GDP (%) -2.9 -6.6 -3.4 -2.8 -1.1 Extended basic balance/GDP (%) -1.3 5.4 -0.7 -0.4 0.3 Net FDI (% of GDP) 1.6 12.1 2.7 2.4 1.4 Gross foreign debt (% of GDP) 92.5 128.5 97.9 102.0 100.9 FX reserves (EUR bn)1 18.4 19.2 15.3 15.5 15.8 Months of imports, goods & services 6.3 5.3 4.1 3.5 3.4 Inflation/Monetary/FX CPI (pavg) 6.6 14.7 7.4 6.5 6.0 CPI (eop) 13.6 8.5 7.1 6.3 5.8 Central bank target - - 6-8 5-7 4-6 Central bank reference rate (eop) 16.0 12.0 10.3 9.0 8.0 USD/KZT(eop) 339 333 331 390 380 EUR/KZT (eop) 371 349 395 468 475 USD/KZT (pavg) 228 342 325 355 383 EUR/KZT (pavg) 252 377 370 422 471
Source: ARKS, Haver, UniCredit Research
*Long-term foreign currency credit rating provided by Moody’s, S&P and Fitch, respectively

<date>
September 2018 CEE Macro & Strategy Research
CEE Quarterly
UniCredit Research page 73 See last pages for disclaimer.
An oil-driven rebound unlikely to last The oil-related rebound in growth has been short-lived… …leaving GDP growth on a downward path Growth has been driven by exports…
…while domestic demand has remained subdued Large FDI income payments left the C/A in a small deficit… …while capital flows turned negative… …causing FX reserves to fall The KZT fell vs. the USD, but firmed in real terms, hurting competitiveness, especially vs. the CIS KZT weakness has halted disinflation… …prompting the NBK to leave interest rates on hold Growth is likely to ease during the rest of the year and in 2019 With inflation unlikely to abate soon, the NBK is likely to remain cautious… …and fiscal policy neutral as the government saves most of the windfall oil revenues Large buffers have increased resilience to external shocks Key risks are the slowdown in Russia and global risk aversion Medium-term challenges are plentiful… …with the low nonoil growth potential a key issue… …and unlocking credit by completing bank restructuring a key step to boost growth other than in oil production
A rebound in oil production and in exports provided a significant, albeit short-lived, boost to the economy. While oil output rose 7% yoy and natural gas production 4% in January-July, the pace of expansion has slowed as the impact of the launch of the Kashagan field has begun to wane. At the same time, growth in manufacturing has slipped, with real GDP growth on course to slow to 3.3% yoy in 3Q from perhaps 3.6% in 2Q18 and 4.1% in 1Q.
Growth this year has been driven by exports, which surged 10% yoy in volume terms in 1H18, before moderating to 4-5% in 3Q. Domestic demand firmed much less, as gains in private consumption were offset by a drop in government consumption and stagnant investment. Fiscal policy has been restrictive, with non-interest spending declining in real terms yoy.
Despite surging exports and oil prices, the C/A remained in deficit, albeit at 2% of GDP, half as large as in 2017. This deficit was due to a 60% yoy surge in FDI-related income payments, mostly reinvested earnings. Excluding these, the C/A was in a large surplus. Meanwhile, FDI inflows turned negative in 1H18 (excluding reinvested earnings) as Kashagan work wound down. Along with portfolio outflows and net repayments of foreign debt, this led to slight decreases in both official FX reserves and the assets of the National Fund of Kazakhstan.
FX outflows, along with rising global risk aversion, have led to marked depreciation pressure. The KZT has weakened 15% vs. the USD since the start of the year, but in real trade-weighted terms, the currency has appreciated slightly due to the weakness of the RUB and the TRY. This has posed a dual challenge to the authorities as, while the nominal depreciation has sustained price pressure, competiveness in the nonoil sector has suffered, especially vs. Russia. As a result, disinflation has come to a halt, with headline inflation hovering at around 6% and core inflation rising since April. Even though this is within the NBK’s 5-7% range, the central bank has been cautious, keeping its policy rate on hold since June at 9%.
Looking forward, we expect growth to moderate further during the remainder of the year and more so next, as the impact of Kashagan dissipates, global trade slows, and global risk appetite weakens. However, with oil prices likely to be somewhat higher than previously assumed, we left our growth projections unchanged at 3.5% for this year and 3% for next.
With exchange rate pressures likely to linger through 2019 given the deteriorating external environment, inflation will remain near its current level, prompting the NBK to remain cautious. We expect no change in the policy stance this year and only cautious easing next year, and this only if external conditions allow. Nevertheless, monetary easing is unlikely to provide much support to growth given weak financial intermediation and with bank lending constrained by the still unresolved banking system problems. Fiscal policy is likely to remain neutral, in the meantime, with the government likely to save any extra oil revenues rather than spend them.
Large fiscal and FX buffers and policies much more conservative than during the oil price boom have left Kazakhstan in a much better position to cope with rising global risks than before. Global risk aversion and the weak growth outlook in the rest of the CIS (especially Russia) are the main near-term challenges. However, with Kazakhstan’s borrowing needs (excluding intercompany loans) small, the ongoing deterioration in global risk appetite is unlikely to pose financial risks, although bond prices and the KZT will remain under pressure.
However, medium-term challenges are plentiful. Key among these is the dependence of the nonoil economy on the recycling of oil revenues via the budget, which, along with significant structural impediments, has constrained growth outside oil. Without reinvigorating the latter, the economy remains susceptible to future oil shocks. Among the key immediate concerns is the need to complete the cleaning up of the banking system. At a minimum, this would require a resolution of the bad loans of the recently merged Kazkommerz-Halyk bank, as well as a comprehensive asset quality review to assuage doubts about other smaller banks. Without these steps, bank lending is unlikely to recover, weighing on nonoil investment and growth.

<date>
September 2018 CEE Macro & Strategy Research
CEE Quarterly
UniCredit Research page 74 See last pages for disclaimer.
Russia Ba1/BBB-/BBB-*
Outlook Growing risk aversion and stepped-up US sanctions have weighed on Russian markets despite otherwise strong fundamentals. A weaker RUB and a series of one-off shocks will push inflation well above target, prompting the CBR to shift towards tightening and halt FX purchases under the fiscal rule. With market volatility unlikely to ease, and increased risks prompting a revision of the neutral rate, the easing cycle is over, with a few more hikes likely in the coming months. Growth will remain lackluster in line with potential, with significant fiscal and structural reform challenges over the medium term.
Strategy While bond valuation is attractive, the prospect of new sanctions affects demand and may lead to further outflows.
Author: Artem Arkhipov, Head of Macroeconomic Analysis and Research Russia (UniCredit Russia)
KEY DATES/EVENTS
■ Oct: Submission of the three-year budget
■ 26 Oct, 14 Dec: MPC meeting
■ 18-23 of every month: short-term statistical overview
GDP GROWTH FORECAST
-10
-5
0
5
10
2015 2016 2017 2018F 2019F
yoy (%) Personal Consumption Public ConsumptionFixed Capital Formation InventoriesNet export Gross Domestic Product
INFLATION FORECAST
0%
5%
10%
15%
20%
Jan-12 Jan-13 Jan-14 Jan-15 Jan-16 Jan-17 Jan-18 Jan-19
Headline CPI Key CBR rate Target CPI
Source: CBR, Rosstat, UniCredit Research
MACROECONOMIC DATA AND FORECASTS
EUR bn 2015 2016 2017 2018F 2019F GDP (EUR bn) 1,226 1,155 1,398 1,290 1,248 Population (mn) 146.5 146.8 146.9 147.0 147.0 GDP per capita (EUR) 8,367 7,868 9,516 8,780 8,488 Real economy, change (%) GDP -2.5 -0.2 1.5 1.6 1.2 Private Consumption -9.4 -2.8 3.4 2.9 2.4 Fixed Investment -11.2 0.8 4.3 2.6 2.4 Public Consumption -3.1 0.9 0.4 0.5 0.5 Exports 3.7 3.2 5.1 4.7 3.2 Imports -25.1 -3.6 17.4 13.5 9.8 Monthly wage, nominal (EUR) 500 493 593 564 554 Real wage, change (%) -9.0 0.8 3.4 4.7 2.7 Unemployment rate (%) 5.6 5.5 5.2 5.0 4.9 Fiscal accounts (% of GDP) Budget balance -2.4 -3.4 -1.5 2.0 1.4 Primary balance -1.7 -2.7 -0.7 2.9 2.2 Public debt 13.1 12.9 12.6 12.8 12.7 External accounts Current account balance (EUR bn) 61.0 22.0 31.3 75.8 58.6 Current account balance/GDP (%) 5.0 1.9 2.2 5.9 4.7 Extended basic balance/GDP (%) 3.9 2.7 1.8 5.6 4.3 Net FDI (% of GDP) -1.1 0.8 -0.4 -0.3 -0.4 Gross foreign debt (% of GDP) 38.8 42.3 31.8 31.6 31.1 FX reserves (EUR bn) 293.2 301.9 291.3 310.4 316.5 Months of imports, goods & services 13.9 15.1 12.1 11.7 11.0 Inflation/Monetary/FX CPI (pavg) 15.6 7.1 3.6 2.9 5.4 CPI (eop) 12.9 5.3 2.5 4.1 5.1 Central bank target - - 4.0 4.0 4.0 Central bank reference rate (eop) 11.00 10.0 7.75 7.75 7.50 3M money market rate (Dec avg) 11.9 10.6 8.1 8.0 7.7 3M money market rate (year avg) 13.8 11.1 9.4 8.0 7.8 USD/RUB (eop) 72.9 60.7 57.6 66.6 69.5 EUR/RUB (eop) 79.7 63.8 68.9 80.0 86.8 USD/RUB (pavg) 61.3 67.2 58.3 62.7 67.1 EUR/RUB (pavg) 68.0 74.4 65.9 74.6 82.4 Real effective exchange rate, 2000=100 174.7 175.9 200.8 183.7 177.5
Change (%) -14.5 0.7 14.2 -8.5 -3.4
Source: CBR, Rosstat, UniCredit Research
*Long-term foreign currency credit rating provided by Moody’s, S&P and Fitch respectively

<date>
UniCredit Research page 75 See last pages for disclaimer.
September 2018
CEE Macro & Strategy Research
CEE Quarterly
Domestic and external risks challenge strong fundamentals Market sentiment towards Russia has deteriorated markedly despite otherwise sound economic fundamentals
Inflation risks have increased due to RUB weakness, the VAT hike next year and rising food and fuel prices Geopolitical tensions will keep the RUB under pressure… …with USD-RUB likely to fluctuate within the 66-69.5 range through 2019 The September 25bp policy rate hike seems like a preventive step… …but further tightening looks likely…, …with another hike likely before yearend
During the past few months, market sentiment towards Russia has deteriorated markedly despite otherwise sound economic fundamentals (twin surpluses, ample FX reserves, low debt burden, and high oil prices). This has been caused by tightened US sanctions and increased global risk aversion vs. EM. As a result, foreign investors have sold about USD 8bn of Russian local currency bonds since March, cutting foreign exposure to ca. 26% – the lowest since early 2016. Capital outflows surged to USD 26.5bn ytd, much higher than a year ago. As a result, the RUB has depreciated by 18% ytd against the USD, and 7.3% in trade weighted terms.
This depreciation has significantly reinforced inflation expectations. Even though headline inflation was below target at just above 3% in August, trend inflation (stripped of the exchange rate impact) has been on the rise since March and has already approached the 4% level according to the CBR. Inflation expectations have also been reinforced by a number of ad-hoc factors. Most important among these is the upcoming VAT increase, from 18% to 20% from the start of next year, which could add 1-1.5pp to inflation. When and how price pressures would recede will depend on the potential secondary impact of this one-off shock on prices. Furthermore, food and fuel prices, which were disinflationary in the past, will now add to inflation, as this year’s harvest will be weaker, global food and oil prices are rising, and the RUB depreciated. Food prices have risen 16% ytd as a result, and fuel prices 38%.
Additional sources of concern for the CBR are the uncertain geopolitical situation and heightened global volatility. A new round of US sanctions is highly likely in November (although their severity is unclear for now), weighing on Russian assets. While the future steps by the US administration are highly uncertain, no substantial easing of sanctions can be expected in the foreseeable future. In addition, given the deteriorating sentiment towards EM, the RUB will not return to pre-August levels, even assuming no additional major shocks from the US sanctions. We expect the USD-RUB to fluctuate within the 66-69.5 range throughout 2019. Should sentiment worsen, the RUB could depreciate further in a gradual manner.
These considerations have led the CBR to turn more hawkish despite soft economic growth. The easing cycle is over, with the policy stance shifting towards a tightening bias. Although the 25bp hike of the policy rate to 7.5% in September’s meeting should be seen more as a preventive step, the expected inflation dynamics and elevated volatility have sharply raised the probability of rate hikes in the next 12 months or so. Moreover, the CBR is contemplating revising up its earlier estimate of the “neutral” policy rate (which already shifted from 2% to 3% in real terms) to take account of increased risks. That, combined with inflation above 5.5% next year, implies rate hikes. With this in mind, our base- line scenario is for another increase in the key rate later this year. In case market volatility intensifies or persists, the CBR might hike rates more decisively, by at least 0.5pp to contain the potential impact.
RUSSIAN ASSETS HAVE COME UNDER INTENSE PRESSURE
NON-RESIDENT SHARE IN LOCAL CURRENCY RUSSIAN GOVERNMENT DEBT*
6.0%
6.5%
7.0%
7.5%
8.0%
8.5%
9.0%
9.5%
10.0%
50.0
55.0
60.0
65.0
70.0
75.0
Jul-17 Jan-18 Jul-18
RUB (rs) OFZ 10Y*
0%
10%
20%
30%
40%
2013 2014 2015 2016 2017 2018* - adjusted for marketable securities
Source: CBR, Ministry of Finance, Bloomberg, UniCredit Research
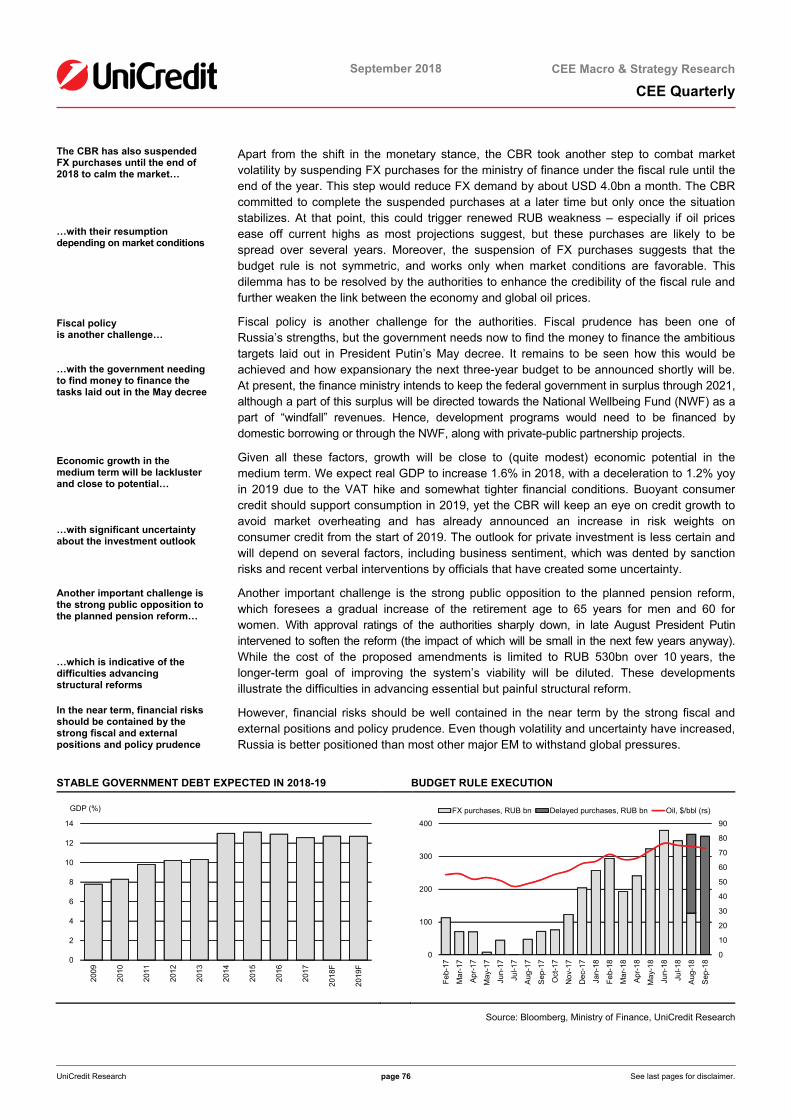
<date>
UniCredit Research page 76 See last pages for disclaimer.
September 2018
CEE Macro & Strategy Research
CEE Quarterly
The CBR has also suspended FX purchases until the end of 2018 to calm the market… …with their resumption depending on market conditions Fiscal policy is another challenge… …with the government needing to find money to finance the tasks laid out in the May decree Economic growth in the medium term will be lackluster and close to potential… …with significant uncertainty about the investment outlook
Another important challenge is the strong public opposition to the planned pension reform… …which is indicative of the difficulties advancing structural reforms In the near term, financial risks should be contained by the strong fiscal and external positions and policy prudence
Apart from the shift in the monetary stance, the CBR took another step to combat market volatility by suspending FX purchases for the ministry of finance under the fiscal rule until the end of the year. This step would reduce FX demand by about USD 4.0bn a month. The CBR committed to complete the suspended purchases at a later time but only once the situation stabilizes. At that point, this could trigger renewed RUB weakness – especially if oil prices ease off current highs as most projections suggest, but these purchases are likely to be spread over several years. Moreover, the suspension of FX purchases suggests that the budget rule is not symmetric, and works only when market conditions are favorable. This dilemma has to be resolved by the authorities to enhance the credibility of the fiscal rule and further weaken the link between the economy and global oil prices.
Fiscal policy is another challenge for the authorities. Fiscal prudence has been one of Russia’s strengths, but the government needs now to find the money to finance the ambitious targets laid out in President Putin’s May decree. It remains to be seen how this would be achieved and how expansionary the next three-year budget to be announced shortly will be. At present, the finance ministry intends to keep the federal government in surplus through 2021, although a part of this surplus will be directed towards the National Wellbeing Fund (NWF) as a part of “windfall” revenues. Hence, development programs would need to be financed by domestic borrowing or through the NWF, along with private-public partnership projects.
Given all these factors, growth will be close to (quite modest) economic potential in the medium term. We expect real GDP to increase 1.6% in 2018, with a deceleration to 1.2% yoy in 2019 due to the VAT hike and somewhat tighter financial conditions. Buoyant consumer credit should support consumption in 2019, yet the CBR will keep an eye on credit growth to avoid market overheating and has already announced an increase in risk weights on consumer credit from the start of 2019. The outlook for private investment is less certain and will depend on several factors, including business sentiment, which was dented by sanction risks and recent verbal interventions by officials that have created some uncertainty.
Another important challenge is the strong public opposition to the planned pension reform, which foresees a gradual increase of the retirement age to 65 years for men and 60 for women. With approval ratings of the authorities sharply down, in late August President Putin intervened to soften the reform (the impact of which will be small in the next few years anyway). While the cost of the proposed amendments is limited to RUB 530bn over 10 years, the longer-term goal of improving the system’s viability will be diluted. These developments illustrate the difficulties in advancing essential but painful structural reform.
However, financial risks should be well contained in the near term by the strong fiscal and external positions and policy prudence. Even though volatility and uncertainty have increased, Russia is better positioned than most other major EM to withstand global pressures.
STABLE GOVERNMENT DEBT EXPECTED IN 2018-19 BUDGET RULE EXECUTION
0
2
4
6
8
10
12
14
2009
2010
2011
2012
2013
2014
2015
2016
2017
2018
F
2019
F
GDP (%)
0
10
20
30
40
50
60
70
80
90
0
100
200
300
400
Feb-
17
Mar
-17
Apr
-17
May
-17
Jun-
17
Jul-1
7
Aug
-17
Sep
-17
Oct
-17
Nov
-17
Dec
-17
Jan-
18
Feb-
18
Mar
-18
Apr
-18
May
-18
Jun-
18
Jul-1
8
Aug
-18
Sep
-18
FX purchases, RUB bn Delayed purchases, RUB bn Oil, $/bbl (rs)
Source: Bloomberg, Ministry of Finance, UniCredit Research

<date>
UniCredit Research page 77 See last pages for disclaimer.
September 2018
CEE Macro & Strategy Research
CEE Quarterly
Limited demand before a potential new round of sanctions
While OFZ look cheap after the recent sell-off, the risk of additional sanctions may keep investors away at least until US authorities deliver the next round of penalties. These may arrive only after US mid-term elections, scheduled for 6 November.
If sanctions also affect new OFZ issuance, besides FX borrowing, we expect the Ministry of Finance to segregate existing bonds from new issues by using different ISINs. An initial sell-off could give way to a later rally in existing bonds thanks to scarcity, attractive valuation, supportive macroeconomic trends and limited sensitivity to EM woes. We would expect the long end to gradually outperform the belly of the OFZ curve in this situation.
RUSSIA USD bonds find themselves in the same situation, with looming sanctions reducing appetite. Assuming valuation remains in line with the current one, post-sanctions we would prefer RUSSIA USD 26 to its USD 27 and USD 29 peers thanks to more attractive valuation.
RUB OFZ SPREADS WIDENED FURTHER OVER THE SUMMER
RUSSIA USD 26 LOOKS MORE ATTRACTIVE THAN ITS CURVE NEIGHBORS
-0.50
0.00
0.50
1.00
1.50
2.00
2.50
3.00
3M 6M 1Y 2Y 3Y 4Y 5Y 7Y 8Y 10Y 15Y 20Y
Current -3M -6M -1YSpread over 3M XCCY swap (pp)
0.0
50.0
100.0
150.0
200.0
250.0
300.0
RUSSIAUSD 26
RUSSIAUSD 27
RUSSIAUSD 29
RUSSIAUSD 42
RUSSIAUSD 43
RUSSIAUSD 47
Maximum YTD Mininum YTD CurrentZ-spreads, bp
Source:UniCredit Research
GOVERNMENT GROSS FINANCING REQUIREMENTS
GROSS EXTERNAL FINANCING REQUIREMENTS
EUR bn 2017 2018F 2019F Gross financing requirement 40.9 -9.7 -0.8 Budget deficit 20.3 -26.4 -17.1 Amortization of public debt 20.6 16.8 16.4 Domestic 14.7 8.5 10.0 Bonds 9.6 8.5 9.3 Bills 0 0 0 Loans 5.1 0 0.6 External 5.9 8.3 6.4 Bonds and loans 5.9 8.3 6.4 IMF/EU/Other IFIs 0 0 0 Financing 40.9 -9.7 -0.8 Domestic borrowing 31.5 12.2 18.0 Bonds 26.7 11.6 15.1 Bills 0 0 0 Loans 4.8 0.5 2.9 External borrowing 6.2 0 0 Bonds 6.2 0 0 IMF/EU/Other IFIs 0 0 0 Privatization/Other 0.3 0 0 Sovereign Funds 2.9 -21.8 -18.8
EUR bn 2017 2018F 2019F Gross financing requirement 101.4 41.5 20.3 C/A deficit -31.3 -75.8 -58.6 Amortization of medium and long term debt 87.4 76.0 45.9 Government/central bank 11.1 1.3 2.8 Banks 11.2 18.9 11.8 Corporates/Other 65.1 55.9 31.3 Amortization of short-term debt 45.2 41.2 33.0 Financing 101.4 41.5 20.3 FDI (net) -6.1 -4.0 -5.0 Portfolio equity, net -7.1 -3.5 -3.2 Medium and long-term borrowing 87.0 47.6 29.5 Government/central bank 6.2 0 0 Banks 10.6 5.7 3.0 Corporates/Other 70.2 41.9 26.6 Short-term borrowing 41.2 33.0 29.7 Other -3.4 -4.3 -2.5 Change in FX reserves (- = increase) -10.2 -27.3 -28.2 Memoranda: Nonresident purchases of LC govt bonds 10.8 -8 0 International bond issuance, net -4.9 -1.3 -2.8
Source: CBR, Rosstat, MoF, UniCredit Research

<date>
September 2018 CEE Macro & Strategy Research
CEE Quarterly
UniCredit Research page 78 See last pages for disclaimer.
Serbia Ba3 stable/BB stable/BB stable*
Outlook
Serbia is approaching the end of 2018 with a favorable environment for reforms. We revised up our GDP growth forecast for 2018 from 3.3% to 4.0% to reflect stronger-than-expected growth in 1H18. A small budget surplus in 2018 and a small deficit in 2019 will help public debt to fall further. The new IMF program and EU accession negotiations could bode well for the implementation of reforms. We expect the National Bank of Serbia to remain on hold due to reflation, solid growth and low appetite for EM assets. EUR-USD will likely remain below 120 in 2018 but could see some moderate depreciation in 2019.
Strategy Foreign investors are unlikely to purchase significant amounts of SERBGBs, at least until new benchmark bonds are offered next year. A Eurobond could be issued next year only if FX reserves are depleted rapidly.
Authors: Mauro Giorgio Marrano, Senior CEE Economist (UniCredit Bank, Vienna)
KEY DATES/EVENTS
■ 8 Oct, 8 Nov, 6 Dec: NBS monetary policy meetings
■ 31 Oct, 20 Nov: 3Q18 GDP (flash, structure)
■ 12 Oct, 13 Nov, 9 Dec: CPI inflation
■ 9 Nov: sovereign rating update from Fitch
■ 14 Dec: sovereign rating update from S&P
GDP GROWTH FORECAST
-3
-2
-1
0
1
2
3
4
5
6
7
2015 2016 2017 2018F 2019F
Inventories and discrepancy Net exportsGross fixed capital formation Public consumptionPrivate consumption GDP
yoy (%, pp of GDP)
INFLATION FORECAST
0
1
2
3
4
5
6
Dec-15 Jun-16 Dec-16 Jun-17 Dec-17 Jun-18 Dec-18 Jun-19 Dec-19
Headline inflation Inflation targetTarget range Core inflation
yoy (%)
Source: SORS, UniCredit Research
MACROECONOMIC DATA AND FORECASTS
EUR bn 2015 2016 2017 2018F 2019F GDP (EUR bn) 33.5 34.6 36.8 40.1 42.3 Population (mn) 7.1 7.1 7.0 7.0 6.9 GDP per capita (EUR) 4,719 4,905 5,238 5,736 6,085 Real economy, change (%) GDP 0.8 2.8 1.9 4.0 3.0 Private Consumption 0.5 1.0 1.8 2.9 2.5 Fixed Investment 5.6 5.1 6.2 12.0 8.1 Public consumption -1.5 2.2 1.0 2.9 2.0 Exports 10.2 12.0 9.8 7.8 6.6 Imports 9.3 9.0 10.7 9.4 6.4 Monthly wage, nominal (EUR) 506 515 533 575 604 Real wage, change (%) -1.8 2.6 -1.1 2.8 2.6 Unemployment rate (%) 18.2 15.9 14.1 13.2 12.4 Fiscal accounts (% of GDP) Budget balance -3.7 -1.3 1.2 0.4 -0.6 Primary balance -0.5 1.8 3.9 2.6 1.8 Public debt 76.1 74.2 62.5 57.7 56.5 External accounts Current account balance (EUR bn) -1.2 -1.1 -2.1 -2.3 -2.4 Current account balance (% of GDP) -3.7 -3.1 -5.7 -5.7 -5.6 Extended basic balance/GDP (%) 1.7 2.4 0.9 0.5 -0.1 Net FDI (% of GDP) 5.4 5.5 6.6 6.2 5.4 Gross foreign debt (% of GDP) 78.3 76.5 69.7 64.8 63.0 FX reserves (EUR bn) 11.2 11.1 10.4 11.1 11.2 Months of imports, goods & services 7.2 6.8 5.6 5.2 4.8 Inflation/Monetary/FX CPI (pavg) 1.4 1.1 3.1 2.2 2.8 CPI (eop) 1.6 1.5 3.0 2.8 3.1 Central bank target 4.0 4.0 3.0 3.0 3.0 Central bank reference rate (eop) 4.50 4.00 3.50 3.00 3.00 3M money market rate (Dec avg) 3.86 3.45 3.09 3.10 3.60 USD/FX (eop) 111.2 117.1 99.1 98.9 96.5 EUR/FX (eop) 121.6 123.5 118.5 118.7 120.7 USD/FX (pavg) 108.8 111.3 107.8 98.9 96.8 EUR/FX (pavg) 120.8 123.1 121.4 118.3 118.7
Source: Bloomberg, Eurostat, SORS, NBS, Public Debt Agency, UniCredit Research
*Long-term foreign currency credit rating provided by Moody’s, S&P and Fitch, respectively
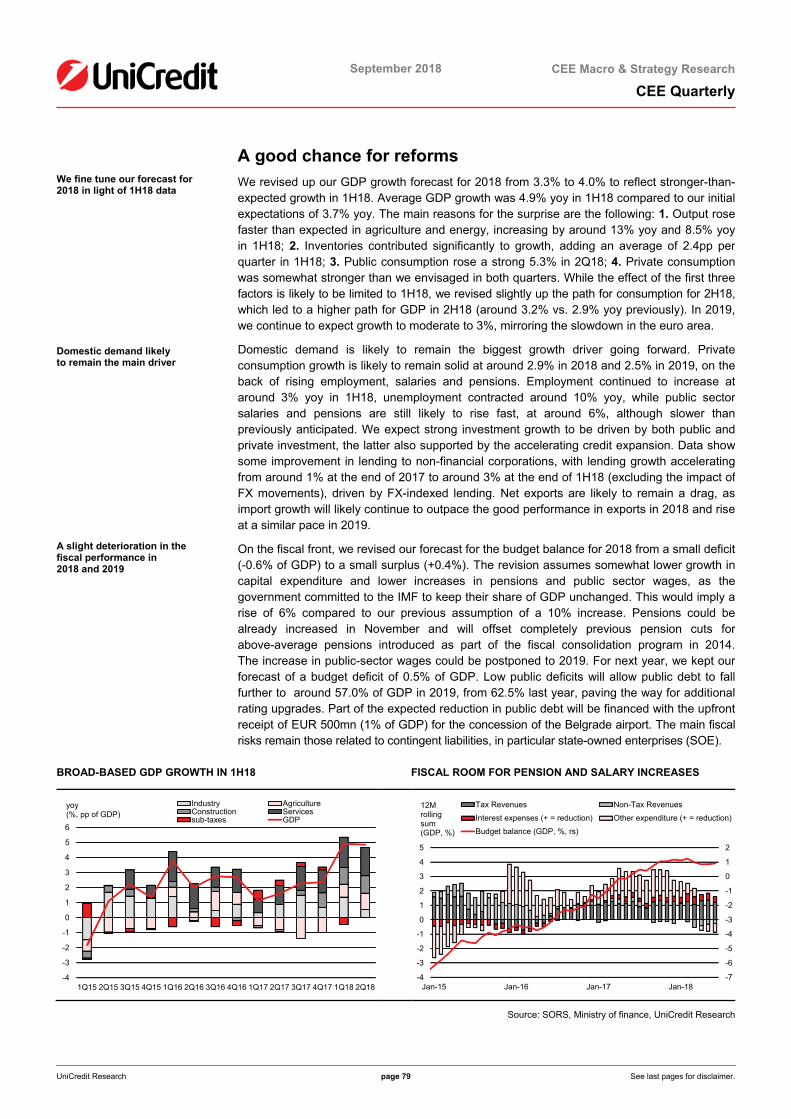
<date>
September 2018
CEE Macro & Strategy Research
CEE Quarterly
UniCredit Research page 79 See last pages for disclaimer.
A good chance for reforms We fine tune our forecast for 2018 in light of 1H18 data Domestic demand likely to remain the main driver A slight deterioration in the fiscal performance in 2018 and 2019
We revised up our GDP growth forecast for 2018 from 3.3% to 4.0% to reflect stronger-than-expected growth in 1H18. Average GDP growth was 4.9% yoy in 1H18 compared to our initial expectations of 3.7% yoy. The main reasons for the surprise are the following: 1. Output rose faster than expected in agriculture and energy, increasing by around 13% yoy and 8.5% yoy in 1H18; 2. Inventories contributed significantly to growth, adding an average of 2.4pp per quarter in 1H18; 3. Public consumption rose a strong 5.3% in 2Q18; 4. Private consumption was somewhat stronger than we envisaged in both quarters. While the effect of the first three factors is likely to be limited to 1H18, we revised slightly up the path for consumption for 2H18, which led to a higher path for GDP in 2H18 (around 3.2% vs. 2.9% yoy previously). In 2019, we continue to expect growth to moderate to 3%, mirroring the slowdown in the euro area.
Domestic demand is likely to remain the biggest growth driver going forward. Private consumption growth is likely to remain solid at around 2.9% in 2018 and 2.5% in 2019, on the back of rising employment, salaries and pensions. Employment continued to increase at around 3% yoy in 1H18, unemployment contracted around 10% yoy, while public sector salaries and pensions are still likely to rise fast, at around 6%, although slower than previously anticipated. We expect strong investment growth to be driven by both public and private investment, the latter also supported by the accelerating credit expansion. Data show some improvement in lending to non-financial corporations, with lending growth accelerating from around 1% at the end of 2017 to around 3% at the end of 1H18 (excluding the impact of FX movements), driven by FX-indexed lending. Net exports are likely to remain a drag, as import growth will likely continue to outpace the good performance in exports in 2018 and rise at a similar pace in 2019.
On the fiscal front, we revised our forecast for the budget balance for 2018 from a small deficit (-0.6% of GDP) to a small surplus (+0.4%). The revision assumes somewhat lower growth in capital expenditure and lower increases in pensions and public sector wages, as the government committed to the IMF to keep their share of GDP unchanged. This would imply a rise of 6% compared to our previous assumption of a 10% increase. Pensions could be already increased in November and will offset completely previous pension cuts for above-average pensions introduced as part of the fiscal consolidation program in 2014. The increase in public-sector wages could be postponed to 2019. For next year, we kept our forecast of a budget deficit of 0.5% of GDP. Low public deficits will allow public debt to fall further to around 57.0% of GDP in 2019, from 62.5% last year, paving the way for additional rating upgrades. Part of the expected reduction in public debt will be financed with the upfront receipt of EUR 500mn (1% of GDP) for the concession of the Belgrade airport. The main fiscal risks remain those related to contingent liabilities, in particular state-owned enterprises (SOE).
BROAD-BASED GDP GROWTH IN 1H18 FISCAL ROOM FOR PENSION AND SALARY INCREASES
-4
-3
-2
-1
0
1
2
3
4
5
6
1Q15 2Q15 3Q15 4Q15 1Q16 2Q16 3Q16 4Q16 1Q17 2Q17 3Q17 4Q17 1Q18 2Q18
Industry AgricultureConstruction Servicessub-taxes GDP
yoy (%, pp of GDP)
-7
-6
-5
-4
-3
-2
-1
0
1
2
-4
-3
-2
-1
0
1
2
3
4
5
Jan-15 Jan-16 Jan-17 Jan-18
Tax Revenues Non-Tax Revenues
Interest expenses (+ = reduction) Other expenditure (+ = reduction)
Budget balance (GDP, %, rs)
12M rolling sum(GDP, %)
Source: SORS, Ministry of finance, UniCredit Research

<date>
September 2018
CEE Macro & Strategy Research
CEE Quarterly
UniCredit Research page 80 See last pages for disclaimer.
The new IMF program could bode well for reforms EU accession: two additional chapters and focus on Kosovo Inflation likely to accelerate further NBS: further cuts not warranted
EUR-RSD to remain below 120 in 2018, with some moderate depreciation in 2019
In July, the IMF Executive Board approved the new IMF program for Serbia – a Policy Coordination Instrument (PCI). The program is a welcome development, as it signals the commitment of the country to implementing reforms. The reform agenda is dense and aims to address various structural weaknesses of the economy, although for some reforms the time horizon remains quite vague. Among the planned reforms, the low-hanging fruit is in public debt management, public investment, tax collection and the alignment of supervision legislation with EU standards. The least-likely reforms concern SOEs.25 On a positive note, the Chinese company Zijin Mining Group Co. acquired 63% stake in the state-owned copper mine and smelter RTB Bor, paving the way for smaller contingent liabilities for the government.
Regarding the EU accession process, Serbia opened two additional chapters, for a total of 14 out of 35. The main focus, however, is on normalizing relations with Kosovo. This is considered by EU institutions as a pre-requisite for EU accession. In July, Serbian President Aleksandar Vučić proposed Kosovo’s partition along ethnic lines. While the proposal was initially rejected by Kosovo President Hashim Thaçi, and also faced internal opposition in Serbia, in recent weeks Mr. Thaçi, EU Commissioner for Neighborhood Policy and Enlargement, Johannes Hahn, and US authorities showed more openness to such a solution. Negotiations will continue in the coming months, with some EU and Balkan leaders expressing fear that a redrawing of borders in Kosovo may upset the fragile equilibrium achieved in Bosnia and Herzegovina through the Dayton agreement.
After reaching 2.6% in August, we expect inflation to accelerate further in 2H18, but to remain below the 3% target this year, on the assumption that the Brent oil price will be USD 74/bbl at the end of 2018. Reflation could be driven by food prices and higher core inflation amid a closing output gap. In 2019, we expect inflation around the 3% target, in the absence of significant supply-side shocks.
In light of the inflation outlook, good economic growth, and poor appetite for EM assets, we expect the NBS to keep its policy rate unchanged at 3.00%. Additional cuts below the inflation target are not warranted if the economy manages to eliminate the remaining slack by the end of this year. Given Serbia’s large current account deficit, larger capital outflows from EM could force the NBS to start raising rates next year.
EUR-RSD is likely to remain below 120 in 2018, but could depreciate moderately in 2019. While RSD appears overvalued at the current level, it may be supported by solid FDI inflows covering the C/A deficit this year and by FX-indexed lending. Support from these factors might moderate slightly in 2H19 if global and domestic growth slow down, leading to moderate depreciation. A more pronounced slowdown in Europe or larger capital outflows from EM would either trigger more depreciation or FX interventions and higher interest rates.
STRONG FDI INFLOWS CONTINUES EUR-RSD LIKELY TO REMAIN BELOW 120 IN 2018
2
3
4
5
6
7
8
Jan-
14
May
-14
Sep
-14
Jan-
15
May
-15
Sep
-15
Jan-
16
May
-16
Sep
-16
Jan-
17
May
-17
Sep
-17
Jan-
18
May
-18
Current acocunt defict FDI12M rolling sum (GDP, %)
Source: NBS, SORS, Bloomberg, UniCredit Research
25 For details, please see the note EEMEA Macro Flash “Serbia: the new IMF program – a matter of political will”, published on 26 July.

<date>
September 2018
CEE Macro & Strategy Research
CEE Quarterly
UniCredit Research page 81 See last pages for disclaimer.
Little investor interest until the end of the year
With issuance on the 5Y and 10Y benchmarks approaching an end, investor interest in SERBGBs is likely to weaken at least until new benchmark bonds are offered next year. Low secondary-market liquidity could limit foreign purchases of SERBGBs. The overvalued currency and rising inflation also reduce the attractiveness of RSD bonds. For investors who already own SERBGs, the carry remains attractive as long as the EUR does not depreciate against the USD.
The expected upfront payment on the airport concession cancels the need for Eurobond issuance this year. Similar to 2018, the government may try to cover most financing needs on the local market in 2019, resorting to Eurobonds only if FX reserves are depleted quickly.
CHART INFLATION AND YIELDS AT ISSUANCE, 5Y AND 10Y CHART WITH FINANCING NEEDS COVERED SO FAR
0
1
2
3
4
5
6
Jan-18 May-18 Sep-18 Jan-19 May-19 Sep-19
Inflation rate 5Y yield (at issuance) 10Y yield (at issuance)%
0.0
0.5
1.0
1.5
2.0
2.5
3.0
3.5
Issued Needs until year-end Government deposits at theNBS (Aug 2018)
EUR RSDEUR bn
Source: NBS, Ministry of Finance, Public Debt Agency, SORS, UniCredit Research
GOVERNMENT GROSS FINANCING REQUIREMENTS
GROSS EXTERNAL FINANCING REQUIREMENTS
EUR bn 2017 2018F 2019F Gross financing requirement 3.2 3.0 3.2 Budget deficit -0.4 -0.2 0.2 Amortization of public debt 3.6 3.2 3.0 Domestic 2.9 2.4 2.3 Bonds 2.6 2.2 2.2 Bills 0.3 0.2 0.1 External 0.7 0.8 0.7 Bonds and loans 0.7 0.8 0.7 IMF/EU/Other IFIs 0 0 0 Financing 3.2 3.0 3.2 Domestic borrowing 3.0 2.7 3.2 Bonds 2.8 2.5 3.0 Bills 0.2 0.2 0.2 External borrowing 0.9 0.8 0.6 Bonds 0 0 0 IMF/EU/Other IFIs 0.5 0.4 0.3 Other 0.4 0.4 0.3 Fiscal reserves change (- =increase) -0.7 -0.5 -0.6
EUR bn 2017 2018F 2019F Gross financing requirement 4.5 5.4 5.0 C/A deficit 2.1 2.3 2.4 Amortization of medium and long term debt 1.7 2.2 1.8 Government/central bank 1.0 1.1 0.7 Banks 0.2 0.4 0.4 Corporates/Other 0.5 0.7 0.7 Amortization of short-term debt 0.7 0.9 0.8 Banks 0.6 0.8 0.7 Corporates/Other 0.1 0.1 0.1 Financing 4.5 5.4 5.0 FDI (net) 2.4 2.5 2.3 Medium and long-term borrowing 1.6 2.7 2.4 Government/central bank 0.9 1.6 1.7 Banks 0.2 0.4 0.3 Corporates/Other 0.5 0.7 0.5 Short-term borrowing 0.5 0.9 0.4 Change in FX reserves (- = increase) -0.1 -0.7 -0.1 Memoranda: Nonresident purchases of LC govt bonds -0.9 0.2 0.4 International bond issuance, net -0.7 -0.8 -0.7
Source: Bloomberg, NBS, Ministry of Finance, Public Debt Agency, SORS, UniCredit Research
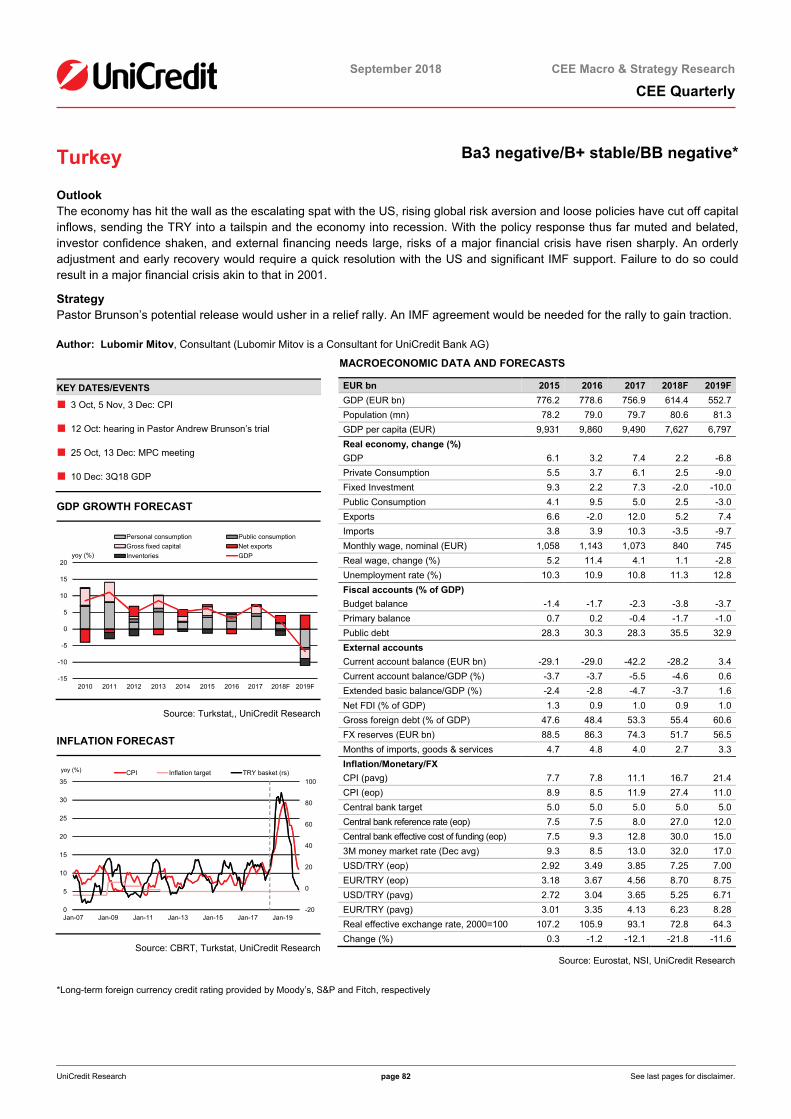
<date>
September 2018 CEE Macro & Strategy Research
CEE Quarterly
UniCredit Research page 82 See last pages for disclaimer.
Turkey Ba3 negative/B+ stable/BB negative*
Outlook The economy has hit the wall as the escalating spat with the US, rising global risk aversion and loose policies have cut off capital inflows, sending the TRY into a tailspin and the economy into recession. With the policy response thus far muted and belated, investor confidence shaken, and external financing needs large, risks of a major financial crisis have risen sharply. An orderly adjustment and early recovery would require a quick resolution with the US and significant IMF support. Failure to do so could result in a major financial crisis akin to that in 2001.
Strategy Pastor Brunson’s potential release would usher in a relief rally. An IMF agreement would be needed for the rally to gain traction.
Author: Lubomir Mitov, Consultant (Lubomir Mitov is a Consultant for UniCredit Bank AG)
KEY DATES/EVENTS
■ 3 Oct, 5 Nov, 3 Dec: CPI
■ 12 Oct: hearing in Pastor Andrew Brunson’s trial
■ 25 Oct, 13 Dec: MPC meeting
■ 10 Dec: 3Q18 GDP
GDP GROWTH FORECAST
-15
-10
-5
0
5
10
15
20
2010 2011 2012 2013 2014 2015 2016 2017 2018F 2019F
Personal consumption Public consumptionGross fixed capital Net exportsInventories GDPyoy (%)
Source: Turkstat,, UniCredit Research
INFLATION FORECAST
-20
0
20
40
60
80
100
0
5
10
15
20
25
30
35
Jan-07 Jan-09 Jan-11 Jan-13 Jan-15 Jan-17 Jan-19
CPI Inflation target TRY basket (rs)yoy (%)
Source: CBRT, Turkstat, UniCredit Research
MACROECONOMIC DATA AND FORECASTS
EUR bn 2015 2016 2017 2018F 2019F GDP (EUR bn) 776.2 778.6 756.9 614.4 552.7 Population (mn) 78.2 79.0 79.7 80.6 81.3 GDP per capita (EUR) 9,931 9,860 9,490 7,627 6,797 Real economy, change (%) GDP 6.1 3.2 7.4 2.2 -6.8 Private Consumption 5.5 3.7 6.1 2.5 -9.0 Fixed Investment 9.3 2.2 7.3 -2.0 -10.0 Public Consumption 4.1 9.5 5.0 2.5 -3.0 Exports 6.6 -2.0 12.0 5.2 7.4 Imports 3.8 3.9 10.3 -3.5 -9.7 Monthly wage, nominal (EUR) 1,058 1,143 1,073 840 745 Real wage, change (%) 5.2 11.4 4.1 1.1 -2.8 Unemployment rate (%) 10.3 10.9 10.8 11.3 12.8 Fiscal accounts (% of GDP) Budget balance -1.4 -1.7 -2.3 -3.8 -3.7 Primary balance 0.7 0.2 -0.4 -1.7 -1.0 Public debt 28.3 30.3 28.3 35.5 32.9 External accounts Current account balance (EUR bn) -29.1 -29.0 -42.2 -28.2 3.4 Current account balance/GDP (%) -3.7 -3.7 -5.5 -4.6 0.6 Extended basic balance/GDP (%) -2.4 -2.8 -4.7 -3.7 1.6 Net FDI (% of GDP) 1.3 0.9 1.0 0.9 1.0 Gross foreign debt (% of GDP) 47.6 48.4 53.3 55.4 60.6 FX reserves (EUR bn) 88.5 86.3 74.3 51.7 56.5 Months of imports, goods & services 4.7 4.8 4.0 2.7 3.3 Inflation/Monetary/FX CPI (pavg) 7.7 7.8 11.1 16.7 21.4 CPI (eop) 8.9 8.5 11.9 27.4 11.0 Central bank target 5.0 5.0 5.0 5.0 5.0 Central bank reference rate (eop) 7.5 7.5 8.0 27.0 12.0 Central bank effective cost of funding (eop) 7.5 9.3 12.8 30.0 15.0 3M money market rate (Dec avg) 9.3 8.5 13.0 32.0 17.0 USD/TRY (eop) 2.92 3.49 3.85 7.25 7.00 EUR/TRY (eop) 3.18 3.67 4.56 8.70 8.75 USD/TRY (pavg) 2.72 3.04 3.65 5.25 6.71 EUR/TRY (pavg) 3.01 3.35 4.13 6.23 8.28 Real effective exchange rate, 2000=100 107.2 105.9 93.1 72.8 64.3 Change (%) 0.3 -1.2 -12.1 -21.8 -11.6
Source: Eurostat, NSI, UniCredit Research
*Long-term foreign currency credit rating provided by Moody’s, S&P and Fitch, respectively

<date>
September 2018
CEE Macro & Strategy Research
CEE Quarterly
UniCredit Research page 83 See last pages for disclaimer.
Challenging days ahead The downside risks we have warned about materialized The economy has hit the wall While the roots of the calamity are entirely domestic… …external factors have triggered the August meltdown Capital inflows reversed… …sending the TRY sharply down and causing a steep drop in FX reserves The CBRT finally hiked interest rates sharply in September… …and the government came up with a fiscal adjustment program… …which seems overoptimistic and short on details A major adjustment is underway… …with the economy slipping into recession and the C/A shifting to a surplus The near-term outlook is challenging… ...given heavy external debt repayments, especially by banks
Turkey’s economy has hit the wall. The downside risks we have been warning about for months have materialized, sending the TRY into a free-fall and the economy into recession. While the roots for this calamity are entirely domestic (policies aimed at growth at any price financed by foreign borrowing), several external factors have come together to trigger the meltdown in August. Key among these are the escalating standoff with the US over the fate of pastor Andrew Brunson held in Turkey on espionage charges, and mounting global risk aversion that cut capital flows to EM. These have rattled investors already uneasy about the lax policy and statements by President Erdogan seen as undermining CBRT independence.
Capital inflows, already sharply down in June-July, reversed in August. Preliminary data point to a net outflow of some USD 10bn in August, causing a USD 7.5nb loss of reserves – a pace that cannot be sustained for more than a few months. The TRY nosedived, weakening roughly 30% during August alone, and bond yields surged to highs not seen since 2003.
After initial hesitancy, the CBRT hiked its policy rate by 650bp in September to 24%, triggering a brief rally. However, this step, which would have made all the difference in the world a couple of months ago, is unlikely in itself to shore up confidence and stabilize markets. A broader policy adjustment is needed to address the underlying dislocations. The authorities are aware of this, and in the new economic program announced recently acknowledges the slowdown and the need of fiscal retrenchment. The program implies that Turkey will try to weather the turbulence on its own, but appears to be based on too optimistic assumptions in our view and lack details on specific measures and financing sources for the state and the private sector.
Meanwhile, the economy has been adjusting under market pressure. Confidence has collapsed since June and the credit impulse has turned strongly negative as banks have cut foreign borrowing. All this suggests that the economy likely entered recession in 3Q18. Inflation surged to 18% in September, with the worst yet to come as the TRY depreciation feeds through into prices. The C/A deficit likely shifted to a large surplus in August as imports slumped due to the drop in the TRY and the lack of financing.
The near-term outlook is challenging. With odds for a quick resolution of the spat with the US poor and global sentiment vs. EM unlikely to improve, private capital inflows are unlikely to recover. At the same time, repayments of medium and long-term debt amount to USD 33bn during September-December, with USD 3bn in Eurobonds falling due in October. Including short-term obligations, external debt repayments amount to USD 179bn during the next 12 months, the bulk of which (some USD 77bn) by domestic banks.
ECONOMIC ACTIVITY HAS WEAKENED SHARPLY…
…AS THE C/A MOVES TO SURPLUS AND FOREIGN FINANCING DRIED UP
4042444648505254565860
70
80
90
100
110
120
130
140
150
160
Jan-
15M
ar-1
5M
ay-1
5Ju
l-15
Sep
-15
Nov
-15
Jan-
16M
ar-1
6M
ay-1
6Ju
l-16
Sep
-16
Nov
-16
Jan-
17M
ar-1
7M
ay-1
7Ju
l-17
Sep
-17
Nov
-17
Jan-
18M
ar-1
8M
ay-1
8Ju
l-18
Real sector confidence Export volumes (sa)
Import volumes (sa) PMI (rs)
Index 2013=100
-15
-10
-5
0
5
10
15
Jan-
18
Feb-
18
Mar
-18
Apr
-18
May
-18
Jun-
18
Jul-1
8
Aug
-18
Sep
-18
Oct
-18
Nov
-18
Dec
-18
Jan-
19
Feb-
19
Mar
-19
Apr
-19
May
-19
Jun-
19
Other Borrowing, netEquity net C/AChange in reserves
USD bn
Source: Turkstat, UniCredit Research
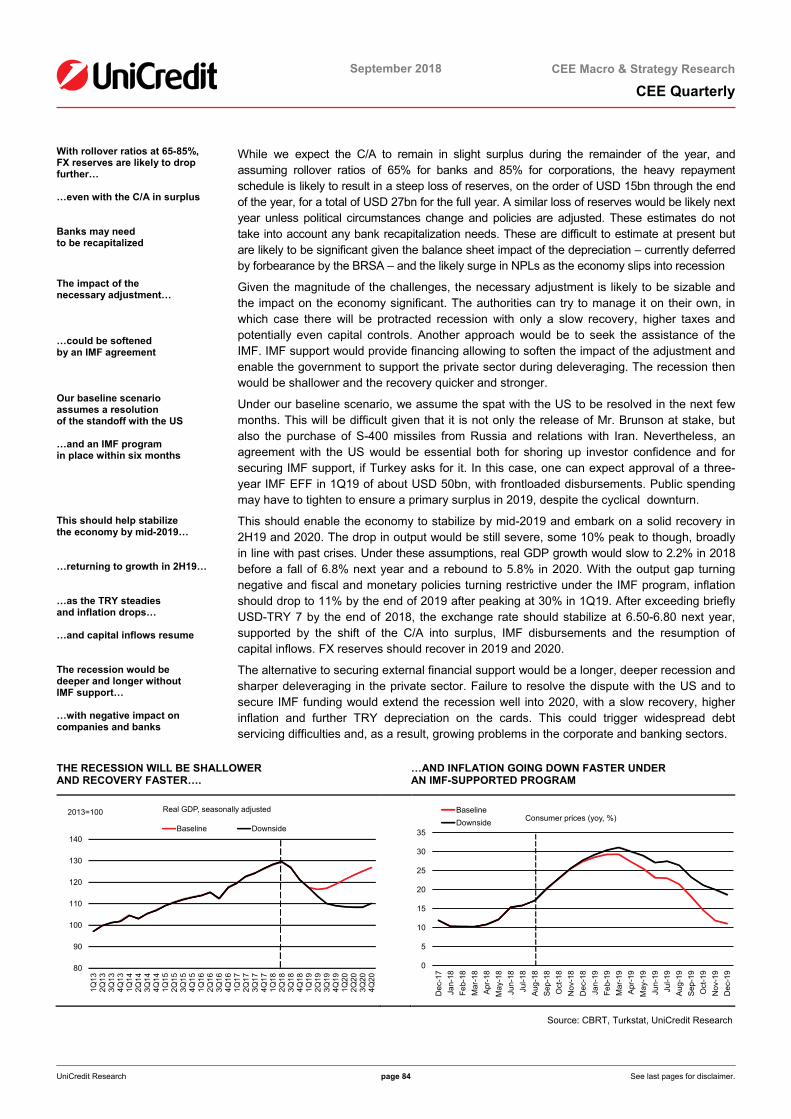
<date>
September 2018
CEE Macro & Strategy Research
CEE Quarterly
UniCredit Research page 84 See last pages for disclaimer.
With rollover ratios at 65-85%, FX reserves are likely to drop further… …even with the C/A in surplus Banks may need to be recapitalized
The impact of the necessary adjustment…
…could be softened by an IMF agreement Our baseline scenario assumes a resolution of the standoff with the US …and an IMF program in place within six months This should help stabilize the economy by mid-2019… …returning to growth in 2H19… …as the TRY steadies and inflation drops… …and capital inflows resume The recession would be deeper and longer without IMF support… …with negative impact on companies and banks
While we expect the C/A to remain in slight surplus during the remainder of the year, and assuming rollover ratios of 65% for banks and 85% for corporations, the heavy repayment schedule is likely to result in a steep loss of reserves, on the order of USD 15bn through the end of the year, for a total of USD 27bn for the full year. A similar loss of reserves would be likely next year unless political circumstances change and policies are adjusted. These estimates do not take into account any bank recapitalization needs. These are difficult to estimate at present but are likely to be significant given the balance sheet impact of the depreciation – currently deferred by forbearance by the BRSA – and the likely surge in NPLs as the economy slips into recession
Given the magnitude of the challenges, the necessary adjustment is likely to be sizable and the impact on the economy significant. The authorities can try to manage it on their own, in which case there will be protracted recession with only a slow recovery, higher taxes and potentially even capital controls. Another approach would be to seek the assistance of the IMF. IMF support would provide financing allowing to soften the impact of the adjustment and enable the government to support the private sector during deleveraging. The recession then would be shallower and the recovery quicker and stronger.
Under our baseline scenario, we assume the spat with the US to be resolved in the next few months. This will be difficult given that it is not only the release of Mr. Brunson at stake, but also the purchase of S-400 missiles from Russia and relations with Iran. Nevertheless, an agreement with the US would be essential both for shoring up investor confidence and for securing IMF support, if Turkey asks for it. In this case, one can expect approval of a three-year IMF EFF in 1Q19 of about USD 50bn, with frontloaded disbursements. Public spending may have to tighten to ensure a primary surplus in 2019, despite the cyclical downturn.
This should enable the economy to stabilize by mid-2019 and embark on a solid recovery in 2H19 and 2020. The drop in output would be still severe, some 10% peak to though, broadly in line with past crises. Under these assumptions, real GDP growth would slow to 2.2% in 2018 before a fall of 6.8% next year and a rebound to 5.8% in 2020. With the output gap turning negative and fiscal and monetary policies turning restrictive under the IMF program, inflation should drop to 11% by the end of 2019 after peaking at 30% in 1Q19. After exceeding briefly USD-TRY 7 by the end of 2018, the exchange rate should stabilize at 6.50-6.80 next year, supported by the shift of the C/A into surplus, IMF disbursements and the resumption of capital inflows. FX reserves should recover in 2019 and 2020.
The alternative to securing external financial support would be a longer, deeper recession and sharper deleveraging in the private sector. Failure to resolve the dispute with the US and to secure IMF funding would extend the recession well into 2020, with a slow recovery, higher inflation and further TRY depreciation on the cards. This could trigger widespread debt servicing difficulties and, as a result, growing problems in the corporate and banking sectors.
THE RECESSION WILL BE SHALLOWER AND RECOVERY FASTER….
…AND INFLATION GOING DOWN FASTER UNDER AN IMF-SUPPORTED PROGRAM
80
90
100
110
120
130
140
1Q13
2Q13
3Q13
4Q13
1Q14
2Q14
3Q14
4Q14
1Q15
2Q15
3Q15
4Q15
1Q16
2Q16
3Q16
4Q16
1Q17
2Q17
3Q17
4Q17
1Q18
2Q18
3Q18
4Q18
1Q19
2Q19
3Q19
4Q19
1Q20
2Q20
3Q20
4Q20
Real GDP, seasonally adjusted
Baseline Downside
2013=100
0
5
10
15
20
25
30
35
Dec
-17
Jan-
18Fe
b-18
Mar
-18
Apr
-18
May
-18
Jun-
18Ju
l-18
Aug
-18
Sep
-18
Oct
-18
Nov
-18
Dec
-18
Jan-
19Fe
b-19
Mar
-19
Apr
-19
May
-19
Jun-
19Ju
l-19
Aug
-19
Sep
-19
Oct
-19
Nov
-19
Dec
-19
Consumer prices (yoy, %)BaselineDownside
Source: CBRT, Turkstat, UniCredit Research

<date>
September 2018
CEE Macro & Strategy Research
CEE Quarterly
UniCredit Research page 85 See last pages for disclaimer.
Waiting for thaw
At the time of writing this Quarterly, the market is looking for a thaw in Turkey’s stand-off with the US. Investors stopped selling TURKGBs as they are hoping for the release of Mr. Brunson on 12 October, which would be a first necessary step. However, a relief rally may not gain traction if Turkey does not secure external support to weather the upcoming external debt repayments. We expect the almost USD 32bn in external debt maturities due in 4Q18 and the USD 17bn in 1Q19 (excluding trade credits and funding from subsidiaries abroad) to be covered without support. Banks are piling up FX liquidity and are reducing aggressively their on-balance sheet net FX liabilities. However, Turkey may need external support so that external debt repayments of more than USD 27bn are covered smoothly in 2Q19.
Thus, a rally may gain traction if Turkish authorities open discussions with the IMF and other IFIs. If this happens, rate cuts supported by falling inflation from 2Q19 onwards would help Turkish financial asset prices.
IN SEPTEMBER, FOREIGN INVESTORS SLOWED THEIR SALES OF TURKGBS
SINCE AUGUST, BANKS HAVE BEEN REDUCING SHARPLY THEIR ON-BALANCE SHEET NET FX LIABILITES
0.0
2.0
4.0
6.0
8.0
10.0
12.0
14.0
Mar-13 Mar-14 Mar-15 Mar-16 Mar-17 Mar-18
2018 2019 2020 20212022 2023 2024 20252026 2027 2028
TURKGB holdings of foreing investors (other than banks), TRY bn
-30.0
-20.0
-10.0
0.0
10.0
20.0
30.0
Dec-13 Sep-14 Jun-15 Mar-16 Dec-16 Sep-17 Jun-18
Public depo banks Bal Sheet Net FX PositionPublic depo banks Off-Balance Sheet Net FX PositionPrivate depo banks Bal Sheet Net FX PositionPrivate depo banks Off-Balance Sheet Net FX PositionForeign depo banks Bal Sheet Net FX PositionForeign depo banks Off-Balance Sheet Net FX Position
USD bn
Source: CBRT, UniCredit Research
GOVERNMENT GROSS FINANCING REQUIREMENTS
GROSS EXTERNAL FINANCING REQUIREMENTS
EUR bn 2017 2018F 2019F Gross financing requirement 38.5 40.9 31.8 Budget deficit 17.6 23.5 20.3 Amortization of public debt 20.8 17.5 11.5 Domestic 14.6 11.4 6.1 Bonds 14.0 11.4 6.1 Bills 0.6 0 0 Loans 0 0 0 External 6.2 6.1 5.4 Bonds and loans 2.8 4.2 3.6 IMF/EU/Other IFIs 3.4 1.8 1.8 Financing 38.5 40.9 31.8 Domestic borrowing 30.2 32.5 21.8 Bonds 30.2 32.5 21.8 Bills 0 0 0 Loans 0 0 0 External borrowing 10.3 3.8 8.4 Bonds 8.5 3.4 0 IMF/EU/Other IFIs 1.8 0.4 8.4 Privatization/Other -2.0 4.6 1.6
EUR bn 2017 2018F 2019F Gross financing requirement 195.2 199.1 136.7 C/A deficit 42.2 28.2 -3.4 Amortization of medium and long term debt 60.9 70.9 49.9 Government/central bank 6.7 6.1 5.4 Banks 35.8 50.3 26.3 Corporates/Other 18.4 14.6 18.2 Amortization of short-term debt 92.0 99.9 90.2 Financing 195.2 199.1 136.7 FDI (net) 7.2 5.4 5.6 Portfolio equity, net 3.0 -2.8 -1.0 Medium and long-term borrowing 74.2 64.8 50.4 Government/central bank 10.3 3.8 11.7 Banks 40.2 43.7 20.3 Corporates/Other 23.7 17.3 18.4 Short-term borrowing 99.9 90.2 83.2 EU structural and cohesion funds Other 3.6 19.0 4.5 Change in FX reserves (- = increase) 7.3 22.5 -6.1 Memoranda: Nonresident purchases of LC govt bonds 6.4 -2.8 1.2 International bond issuance, net 12.0 -7.2 -7.5
Source: BNB, MoF, UniCredit Research

<date>
September 2018
CEE Macro & Strategy Research
CEE Quarterly
UniCredit Research page 86 See last pages for disclaimer.
Ukraine Caa3 positive/B- stable/B- stable*
Outlook Strongly expansionary policies helped boost growth a bit, but at the expense of deteriorating fiscal and C/A balances. With reforms on hold due to growing political discord and rampant populism ahead of the 2019 twin elections, the IMF program remains suspended. This, along with deteriorating sentiment vs. EM and growing worries about the outcome of the May presidential election, rattled investor confidence and shut off access to capital markets. External financing pressures have intensified and are likely to rise further, unless the IMF program is resumed before it expires in April or is replaced by a new one. IMF support is essential for unlocking official financing and access to capital markets, but the odds for this look poor ahead of elections, leaving the UAH under pressure, with renewed exchange market restrictions and debt servicing difficulties possible.
Author: Lubomir Mitov, Consultant (Lubomir Mitov is a Consultant for UniCredit Bank AG)
KEY DATES/EVENTS
■ 30 Oct, 30 Nov, 29 Dec: Balance of payments
■ 14 Nov, 19 Dec: GDP (flash, structure)
■ 9 Oct, 9 Nov, 10 Dec: CPI
■ 25 Oct, 13 Dec: Monetary policy decisions
GDP GROWTH FORECAST
-30
-25
-20
-15
-10
-5
0
5
10
15
20
2015 2016 2017 2018F 2019F
Private consumption Public consumptionGross fixed capital formation Net exportsInventory investment GDP (yoy)GDP (%)
Source: Ukrstat, UniCredit Research
INFLATION FORECAST
-20
0
20
40
60
80
100
120
140
160
180
-10
0
10
20
30
40
50
60
70
Jan-13 Nov-13 Sep-14 Jul-15 May-16 Mar-17 Jan-18 Nov-18 Sep-19
LC-CPI NEER (rs)yoy (%)
Source: NBU, Ukrstat, UniCredit Research
MACROECONOMIC DATA AND FORECASTS
EUR bn 2015 2016 2017 2018F 2019F GDP (EUR bn) 81.2 84.4 99.1 103.1 96.7
Population (mn) 42.8 42.3 41.9 41.5 41.2
GDP per capita (EUR) 1,900 1,994 2,366 2,483 2,347
Real economy, change (%) GDP -9.8 2.4 2.5 3.0 2.5
Private Consumption -19.8 2.7 8.4 4.6 3.8
Fixed Investment -9.2 20.4 19.2 14.0 6.0
Public Consumption 1.7 -0.5 3.3 1.0 1.5
Exports -13.2 -1.8 3.5 3.1 3.2
Imports -16.7 9.3 12.8 8.1 5.9
Monthly wage, nominal (EUR) 173 183 236 272 260
Real wage, change (%) -18.9 8.5 19.7 12.6 2.9
Unemployment rate (%) 9.6 9.7 9.8 9.6 9.6
Fiscal accounts (% of GDP) Budget balance -4.5 -7.7 -5.9 -5.5 -5.1
Primary balance 0 -3.6 -2.1 -2.0 -1.2
Public debt 84.8 82.6 79.7 78.8 79.0
External accounts Current account balance (EUR bn) 1.5 -1.2 -1.8 -5.0 -5.0
Current account balance/GDP (%) 1.8 -1.4 -1.9 -4.8 -5.2
Extended basic balance/GDP (%) 6.2 2.2 -0.3 -3.7 -4.2
Net FDI (% of GDP) 4.4 3.6 1.5 1.1 1.0
Gross foreign debt (% of GDP) 132.1 121.7 104.0 92.9 97.7
FX reserves (EUR bn) 11.8 13.9 15.0 11.9 9.8
Months of imports, goods & services 2.7 3.0 3.1 2.1 1.6
Inflation/Monetary/FX CPI (pavg) 48.7 13.9 14.5 11.0 11.8
CPI (eop) 43.3 12.4 13.7 10.0 12.0
Central bank target – – – – –
Central bank reference rate (eop) 22.0 14.0 14.5 14.0 12.0
3M money market rate (Dec avg) 19.0 15.0 14.5 15.0 12.5
USD/UAH (eop) 23.44 27.30 27.50 29.00 32.50
EUR/UAH (eop) 23.03 26.93 31.49 32.88 40.00
USD/UAH (pavg) 21.93 25.61 26.60 27.40 32.00
EUR/UAH (pavg) 24.26 28.30 30.09 32.63 39.30
Real effective exchange rate, 2000=100 80.1 78.4 82.0 87.4 87.5
Change (%) 0.6 -2.1 4.5 6.7 0.1
Source: NBU, Ukrstat, UniCredit Research
*Long-term foreign currency credit rating provided by Moody’s, S&P and Fitch, respectively
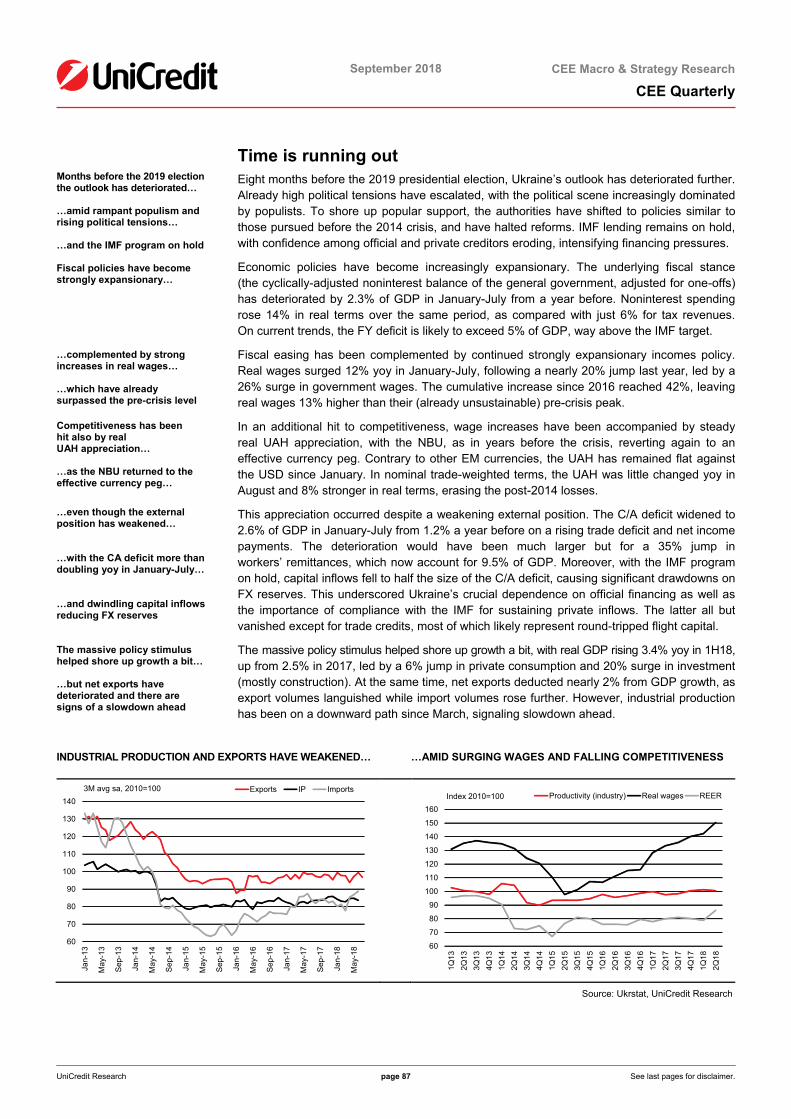
<date>
September 2018
CEE Macro & Strategy Research
CEE Quarterly
UniCredit Research page 87 See last pages for disclaimer.
Time is running out Months before the 2019 election the outlook has deteriorated… …amid rampant populism and rising political tensions… …and the IMF program on hold Fiscal policies have become strongly expansionary…
…complemented by strong increases in real wages… …which have already surpassed the pre-crisis level Competitiveness has been hit also by real UAH appreciation… …as the NBU returned to the effective currency peg…
…even though the external position has weakened… …with the CA deficit more than doubling yoy in January-July… …and dwindling capital inflows reducing FX reserves The massive policy stimulus helped shore up growth a bit… …but net exports have deteriorated and there are signs of a slowdown ahead
Eight months before the 2019 presidential election, Ukraine’s outlook has deteriorated further. Already high political tensions have escalated, with the political scene increasingly dominated by populists. To shore up popular support, the authorities have shifted to policies similar to those pursued before the 2014 crisis, and have halted reforms. IMF lending remains on hold, with confidence among official and private creditors eroding, intensifying financing pressures.
Economic policies have become increasingly expansionary. The underlying fiscal stance (the cyclically-adjusted noninterest balance of the general government, adjusted for one-offs) has deteriorated by 2.3% of GDP in January-July from a year before. Noninterest spending rose 14% in real terms over the same period, as compared with just 6% for tax revenues. On current trends, the FY deficit is likely to exceed 5% of GDP, way above the IMF target.
Fiscal easing has been complemented by continued strongly expansionary incomes policy. Real wages surged 12% yoy in January-July, following a nearly 20% jump last year, led by a 26% surge in government wages. The cumulative increase since 2016 reached 42%, leaving real wages 13% higher than their (already unsustainable) pre-crisis peak.
In an additional hit to competitiveness, wage increases have been accompanied by steady real UAH appreciation, with the NBU, as in years before the crisis, reverting again to an effective currency peg. Contrary to other EM currencies, the UAH has remained flat against the USD since January. In nominal trade-weighted terms, the UAH was little changed yoy in August and 8% stronger in real terms, erasing the post-2014 losses.
This appreciation occurred despite a weakening external position. The C/A deficit widened to 2.6% of GDP in January-July from 1.2% a year before on a rising trade deficit and net income payments. The deterioration would have been much larger but for a 35% jump in workers’ remittances, which now account for 9.5% of GDP. Moreover, with the IMF program on hold, capital inflows fell to half the size of the C/A deficit, causing significant drawdowns on FX reserves. This underscored Ukraine’s crucial dependence on official financing as well as the importance of compliance with the IMF for sustaining private inflows. The latter all but vanished except for trade credits, most of which likely represent round-tripped flight capital.
The massive policy stimulus helped shore up growth a bit, with real GDP rising 3.4% yoy in 1H18, up from 2.5% in 2017, led by a 6% jump in private consumption and 20% surge in investment (mostly construction). At the same time, net exports deducted nearly 2% from GDP growth, as export volumes languished while import volumes rose further. However, industrial production has been on a downward path since March, signaling slowdown ahead.
INDUSTRIAL PRODUCTION AND EXPORTS HAVE WEAKENED… …AMID SURGING WAGES AND FALLING COMPETITIVENESS
60
70
80
90
100
110
120
130
140
Jan-
13
May
-13
Sep
-13
Jan-
14
May
-14
Sep
-14
Jan-
15
May
-15
Sep
-15
Jan-
16
May
-16
Sep
-16
Jan-
17
May
-17
Sep
-17
Jan-
18
May
-18
Exports IP Imports3M avg sa, 2010=100
60
70
80
90
100
110
120
130
140
150
160
1Q13
2Q13
3Q13
4Q13
1Q14
2Q14
3Q14
4Q14
1Q15
2Q15
3Q15
4Q15
1Q16
2Q16
3Q16
4Q16
1Q17
2Q17
3Q17
4Q17
1Q18
2Q18
Productivity (industry) Real wages REERIndex 2010=100
Source: Ukrstat, UniCredit Research

<date>
September 2018
CEE Macro & Strategy Research
CEE Quarterly
UniCredit Research page 88 See last pages for disclaimer.
UAH stability and deferred administered price hikes have helped slow inflation a bit…
…but underlying price pressures remain strong The policy stance is unlikely to change before next October… …as political tensions mount …along with geopolitical ones The halting of the IMF program has become a key issue… …as it has blocked other official financing… …and shut access to markets This would be a problem given surging borrowing needs… …putting the UAH and debt sustainability under pressure We think agreement will be reached eventually on a scaled-down IMF SBA… …unlocking additional funding and helping to avoid distress in 2019 This will kick the can down the road… …but won’t ease medium-term debt sustainability concerns A sustained return to capital markets is unlikely without a major shift in policies… …with risks heavily tilted to the downside
While UAH stability and the deferral of administered price adjustments helped slow inflation to 9% yoy in August from 13.7% in 2017, price pressures remain significant, with core inflation only slightly lower at 8.7%. Moreover, seasonally adjusted mom inflation has been on the rise since May, pointing to renewed yoy acceleration once the base effect lapses in October.
Looking forward, we do not expect a change in the policy stance, certainly not until after the May 2019 election, but most likely not until after the October 2019 parliamentary election, with the ferociousness of the political infighting likely only to intensify and appetite for reforms absent. Domestic political tensions have been reinforced by rising tensions with the separatist controlled areas as well as with Russia. Under these conditions, two issues will determine the near-term outlook – the fate of the IMF program and the outcome of the presidential election.
The fate of the IMF program has become a key issue as the authorities’ initial belief that the existing buffers would be sufficient to carry them through the election proved incorrect. The halting of IMF lending effectively ended all other official financing which, combined with the global deterioration in sentiment towards EM, shut off Ukraine from capital markets. Moreover, with the IMF EFF expiring next April, the authorities risk not only to miss the USD 1.8bn in IMF disbursements, but also to extend the halt of all other financing into 2019.
This would be a problem, with gross borrowing requirements of USD 13bn, as repayments to the IMF jump to USD 1.7bn, and bond repayments of USD 1.8bn. It is unclear how these will be refinanced, and with FX reserves likely to dip below USD 15bn this year and to just USD 10bn by 2019, UAH will come under intense pressure as debt sustainability worries mount.
However, for the IMF to resume lending, the authorities must implement exactly the reforms they have been trying to avoid – most notably a sharp hike in the natural gas price, as well as to reverse the fiscal easing. We think that eventually the government and the IMF will reach a compromise - perhaps in the form of a scaled-down follow-up standby arrangement -- that would unlock a further USD 1.5bn in EU and other IFI funding and enable the government to return to the bond market and refinance or swap some of the repayments due in 2019-20.
While such an approach would kick the can down the road, it would not reduce medium-term debt sustainability concerns. Financing needs are set to rise further to more than USD 20bn a year in 2023-23. Refinancing these would require sustained bond issuance, even in the case of a follow-up IMF program.
This looks unlikely given current policies. A major change in policies is needed to reassure investors but, most importantly, also to boost competitiveness and growth to the 4-5% needed from 2-3% at present and spur exports, without which the C/A deficit will remain large and growing. Risks look heavily tilted to the downside for now, especially if the next president and parliament turn out even more populist and less reform-minded than the current one.
THE C/A IS SET TO DETERIORATE AS CAPITAL INFLOWS SLUMP
…INTENSIFY DEBT SERVICING PRESSURES AS DEBT REPAYMENTS RISE
-20
-15
-10
-5
0
5
10
15
20
25
2010 2011 2012 2013 2014 2015 2016 2017 2018F 2019F
Official Financing EquityResident Capital Private borrowingC/A Change in reservesUSD bn
0
5
10
15
20
25
2019 2020 2021 2022 2023 2024 2025 2026
C/A deficit private gov loans IMF BondsUSD bn
Source: NBU, IMF, Bloomberg, UniCredit Research
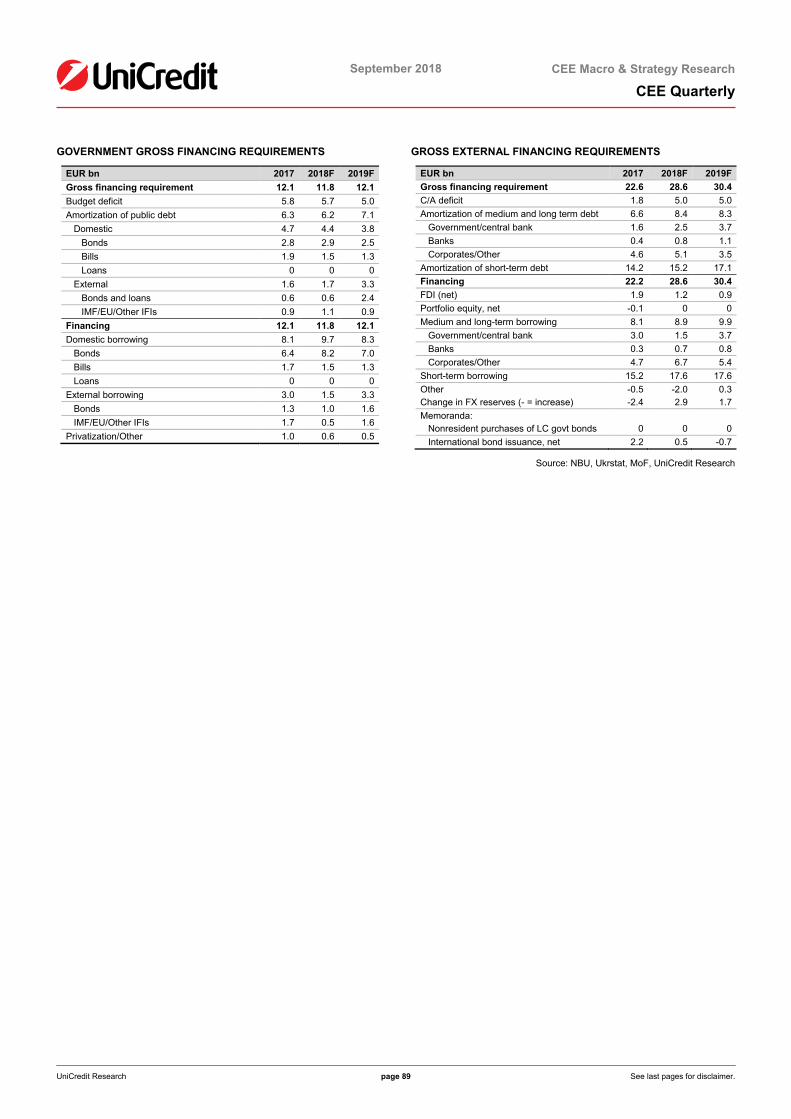
<date>
September 2018
CEE Macro & Strategy Research
CEE Quarterly
UniCredit Research page 89 See last pages for disclaimer.
GOVERNMENT GROSS FINANCING REQUIREMENTS
GROSS EXTERNAL FINANCING REQUIREMENTS
EUR bn 2017 2018F 2019F Gross financing requirement 12.1 11.8 12.1 Budget deficit 5.8 5.7 5.0 Amortization of public debt 6.3 6.2 7.1 Domestic 4.7 4.4 3.8 Bonds 2.8 2.9 2.5 Bills 1.9 1.5 1.3 Loans 0 0 0 External 1.6 1.7 3.3 Bonds and loans 0.6 0.6 2.4 IMF/EU/Other IFIs 0.9 1.1 0.9 Financing 12.1 11.8 12.1 Domestic borrowing 8.1 9.7 8.3 Bonds 6.4 8.2 7.0 Bills 1.7 1.5 1.3 Loans 0 0 0 External borrowing 3.0 1.5 3.3 Bonds 1.3 1.0 1.6 IMF/EU/Other IFIs 1.7 0.5 1.6 Privatization/Other 1.0 0.6 0.5
EUR bn 2017 2018F 2019F Gross financing requirement 22.6 28.6 30.4 C/A deficit 1.8 5.0 5.0 Amortization of medium and long term debt 6.6 8.4 8.3 Government/central bank 1.6 2.5 3.7 Banks 0.4 0.8 1.1 Corporates/Other 4.6 5.1 3.5 Amortization of short-term debt 14.2 15.2 17.1 Financing 22.2 28.6 30.4 FDI (net) 1.9 1.2 0.9 Portfolio equity, net -0.1 0 0 Medium and long-term borrowing 8.1 8.9 9.9 Government/central bank 3.0 1.5 3.7 Banks 0.3 0.7 0.8 Corporates/Other 4.7 6.7 5.4 Short-term borrowing 15.2 17.6 17.6 Other -0.5 -2.0 0.3 Change in FX reserves (- = increase) -2.4 2.9 1.7 Memoranda: Nonresident purchases of LC govt bonds 0 0 0 International bond issuance, net 2.2 0.5 -0.7
Source: NBU, Ukrstat, MoF, UniCredit Research
October 2018
UniCredit Research page 90 See last pages for disclaimer.
September 2018
CEE Macro & Strategy Research
CEE Quarterly
Acronyms and abbreviations used in the CEE Quarterly
■ BNB – Bulgarian National Bank
■ C/A – current account
■ CBR – Central Bank of Russia
■ CBRT –Central Bank of the Republic of Turkey
■ CE – Central Europe
■ CEE – Central and Eastern Europe
■ CNB – Czech National Bank
■ DM – developed markets
■ EA – euro area
■ EC – European Commission
■ ECB – European Central Bank
■ EDP – Excessive Deficit Procedure of the European Commission
■ EM – emerging markets
■ EMU – European Monetary Union
■ EU – European Union
■ FCL – Flexible Credit Line (from the IMF)
■ FDI – foreign direct investment
■ IFI – international financial institutions
■ IMF – International Monetary Fund
■ MoF – Ministry of finance
■ NBH – National Bank of Hungary
■ NBP – National Bank of Poland
■ NBR – National Bank of Romania
■ NBS – National Bank of Serbia
■ NBU – National Bank of Ukraine
■ PLL – Precautionary and Liquidity Line (from the IMF)
■ PM – prime minister
■ PPP – public – private partnership
■ qoq – quarter on quarter
■ sa – seasonally adjusted
■ SBA – Stand-by Arrangement (with the IMF)
■ SOE – state-owned enterprise
■ WB – World Bank
■ yoy – year on year
■ ytd – year to date
October 2018
UniCredit Research page 91
September 2018
CEE Macro & Strategy Research
CEE Quarterly
Legal Notices Glossary A comprehensive glossary for many of the terms used in the report is available on our website: link Disclaimer Our recommendations are based on information obtained from, or are based upon public information sources that we consider to be reliable but for the completeness and accuracy of which we assume no liability. All estimates and opinions and projections and forecasts included in the report represent the independent judgment of the analysts as of the date of the issue unless stated otherwise. This report may contain links to websites of third parties, the content of which is not controlled by UniCredit Bank. No liability is assumed for the content of these third-party websites. We reserve the right to modify the views expressed herein at any time without notice. Moreover, we reserve the right not to update this information or to discontinue it altogether without notice. This analysis is for information purposes only and (i) does not constitute or form part of any offer for sale or subscription of or solicitation of any offer to buy or subscribe for any financial, money market or investment instrument or any security, (ii) is neither intended as such an offer for sale or subscription of or solicitation of an offer to buy or subscribe for any financial, money market or investment instrument or any security nor (iii) as an advertisement thereof. The investment possibilities discussed in this report may not be suitable for certain investors depending on their specific investment objectives and time horizon or in the context of their overall financial situation. The investments discussed may fluctuate in price or value. Investors may get back less than they invested. Changes in rates of exchange may have an adverse effect on the value of investments. Furthermore, past performance is not necessarily indicative of future results. In particular, the risks associated with an investment in the financial, money market or investment instrument or security under discussion are not explained in their entirety. This information is given without any warranty on an "as is" basis and should not be regarded as a substitute for obtaining individual advice. Investors must make their own determination of the appropriateness of an investment in any instruments referred to herein based on the merits and risks involved, their own investment strategy and their legal, fiscal and financial position. As this document does not qualify as an investment recommendation or as a direct investment recommendation, neither this document nor any part of it shall form the basis of, or be relied on in connection with or act as an inducement to enter into, any contract or commitment whatsoever. Investors are urged to contact their bank's investment advisor for individual explanations and advice. Neither UniCredit Bank AG, UniCredit Bank AG London Branch, UniCredit Bank AG Milan Branch, UniCredit Bank AG Vienna Branch, UniCredit Bank Austria AG, UniCredit Bulbank, Zagrebačka banka d.d., UniCredit Bank Czech Republic and Slovakia, ZAO UniCredit Bank Russia, UniCredit Bank Czech Republic and Slovakia Slovakia Branch, UniCredit Bank Romania, UniCredit Bank AG New York Branch nor any of their respective directors, officers or employees nor any other person accepts any liability whatsoever (in negligence or otherwise) for any loss howsoever arising from any use of this document or its contents or otherwise arising in connection therewith. This analysis is being distributed by electronic and ordinary mail to investors, who are expected to make their own investment decisions without undue reliance on this publication, and may not be redistributed, reproduced or published in whole or in part for any purpose. Responsibility for the content of this publication lies with: UniCredit Group and its subsidiaries are subject to regulation by the European Central Bank a) UniCredit Bank AG (UniCredit Bank, Munich or Frankfurt), Arabellastraße 12, 81925 Munich, Germany, (also responsible for the distribution pursuant to §34b WpHG). The company belongs to UniCredit Group. Regulatory authority: “BaFin“ – Bundesanstalt für Finanzdienstleistungsaufsicht, Marie-Curie-Str. 24-28 , 60439 Frankfurt, Germany. b) UniCredit Bank AG London Branch (UniCredit Bank, London), Moor House, 120 London Wall, London EC2Y 5ET, United Kingdom. Regulatory authority: “BaFin“ – Bundesanstalt für Finanzdienstleistungsaufsicht, Marie-Curie-Str. 24-28, 60439 Frankfurt, Germany and subject to limited regulation by the Financial Conduct Authority, 12 Endeavour Square, London E20 1JN, United Kingdom and Prudential Regulation Authority 20 Moorgate, London, EC2R 6DA, United Kingdom. Further details regarding our regulatory status are available on request. c) UniCredit Bank AG Milan Branch (UniCredit Bank, Milan), Piazza Gae Aulenti, 4 - Torre C, 20154 Milan, Italy, duly authorized by the Bank of Italy to provide investment services. Regulatory authority: “Bank of Italy”, Via Nazionale 91, 00184 Roma, Italy and Bundesanstalt für Finanzdienstleistungsaufsicht, Marie-Curie-Str. 24-28, 60439 Frankfurt, Germany. d) UniCredit Bank AG Vienna Branch (UniCredit Bank, Vienna), Rothschildplatz 1, 1020 Vienna, Austria Regulatory authority: Finanzmarktaufsichtsbehörde (FMA), Otto-Wagner-Platz 5, 1090 Vienna, Austria and subject to limited regulation by the “BaFin“ – Bundesanstalt für Finanzdienstleistungsaufsicht, Marie-Curie-Str. 24-28, 60439 Frankfurt, Germany. Details about the extent of our regulation by the Bundesanstalt für Finanzdienstleistungs-aufsicht are available from us on request. e) UniCredit Bank Austria AG (Bank Austria), Rothschildplatz 1, 1020 Vienna, Austria Regulatory authority: Finanzmarktaufsichtsbehörde (FMA), Otto-Wagner-Platz 5, 1090 Vienna, Austria f) UniCredit Bulbank, Sveta Nedelya Sq. 7, BG-1000 Sofia, Bulgaria Regulatory authority: Financial Supervision Commission (FSC), 16 Budapeshta str., 1000 Sofia, Bulgaria g) Zagrebačka banka d.d., Trg bana Josipa Jelačića 10, HR-10000 Zagreb, Croatia Regulatory authority: Croatian Agency for Supervision of Financial Services, Miramarska 24B, 10000 Zagreb, Croatia h) UniCredit Bank Czech Republic and Slovakia, Želetavská 1525/1, 140 92 Praga 4, Czech Republic Regulatory authority: CNB Czech National Bank, Na Příkopě 28, 115 03 Praga 1, Czech Republic i) ZAO UniCredit Bank Russia (UniCredit Russia), Prechistenskaya nab. 9, RF-119034 Moscow, Russia Regulatory authority: Federal Service on Financial Markets, 9 Leninsky prospekt, Moscow 119991, Russia j) UniCredit Bank Czech Republic and Slovakia, Slovakia Branch, Šancova 1/A, SK-813 33 Bratislava, Slovakia Regulatory authority: CNB Czech National Bank, Na Příkopě 28, 115 03 Praha 1, Czech Republic and subject to limited regulation by the National Bank of Slovakia, Imricha Karvaša 1, 813 25 Bratislava, Slovakia. Regulatory authority: National Bank of Slovakia, Imricha Karvaša 1, 813 25 Bratislava, Slovakia k) UniCredit Bank Romania, Bucharest 1F Expozitiei Boulevard, 012101 Bucharest 1, Romania Regulatory authority: National Bank of Romania, 25 Lipscani Street, 030031, 3rd District, Bucharest, Romania l) UniCredit Bank AG New York Branch (UniCredit Bank, New York), 150 East 42nd Street, New York, NY 10017 Regulatory authority: “BaFin“ – Bundesanstalt für Finanzdienstleistungsaufsicht, Marie-Curie-Str. 24-28, 60439 Frankfurt, Germany and New York State Department of Financial Services, One State Street, New York, NY 10004-1511 POTENTIAL CONFLICTS OF INTEREST UniCredit S.p.A. acts as a Specialist or a Primary Dealer in government bonds issued by the Italian or Greek Treasury, and as market maker in government bonds issued by the Spain or Portuguese Treasury. Main tasks of the Specialist are to participate with continuity and efficiency to the governments' securities auctions, to contribute to the efficiency of the secondary market through market making activity and quoting requirements and to contribute to the management of public debt and to the debt issuance policy choices, also through advisory and UniCredit Bank AG research activities. UniCredit S.p.A. Registered Office in Rome: Via Alessandro Specchi, 16 - 00186 Roma Head Office in Milan: Piazza Gae Aulenti 3 - Tower A - 20154 Milano, Registered in the Register of Banking Groups and Parent Company of the UniCredit Banking Group, with. cod. 02008.1; Cod. ABI 02008.1 - Competent Authority: Commissione Nazionale per le Società e la Borsa (CONSOB)”. UniCredit Bank AG acts as a Specialist or Primary Dealer in government bonds issued by the German or Austrian Treasury. Main tasks of the Specialist are to participate with continuity and efficiency to the governments' securities auctions, to contribute to the efficiency of the secondary market through market making activity and quoting requirements and to contribute to the management of public debt and to the debt issuance policy choices, also through advisory and research activities. ANALYST DECLARATION The author’s remuneration has not been, and will not be, geared to the recommendations or views expressed in this study, neither directly nor indirectly. ORGANIZATIONAL AND ADMINISTRATIVE ARRANGEMENTS TO AVOID AND PREVENT CONFLICTS OF INTEREST To prevent or remedy conflicts of interest, UniCredit Bank AG, UniCredit Bank AG London Branch, UniCredit Bank AG Milan Branch, UniCredit Bank AG Vienna Branch, UniCredit Bank Austria AG, UniCredit Bulbank, Zagrebačka banka d.d., UniCredit Bank Czech Republic and Slovakia, ZAO UniCredit Bank Russia, UniCredit Bank Czech Republic and Slovakia Slovakia Branch, UniCredit Bank Romania, UniCredit Bank AG New York Branch have established the organizational arrangements required from a legal and supervisory aspect, adherence to which is monitored by its compliance department. Conflicts of interest arising are managed by legal and physical and non-physical barriers (collectively referred to as “Chinese Walls”) designed to restrict the flow of information between one area/department of UniCredit Bank AG, UniCredit Bank AG London Branch, UniCredit Bank AG Milan Branch, UniCredit Bank AG Vienna Branch, UniCredit Bank Austria AG, UniCredit Bulbank, Zagrebačka banka d.d., UniCredit Bank Czech Republic and Slovakia, ZAO UniCredit Bank Russia, UniCredit Bank Czech Republic and Slovakia Slovakia Branch, UniCredit Bank Romania, UniCredit Bank AG New York Branch, and

October 2018
UniCredit Research page 92
September 2018
CEE Macro & Strategy Research
CEE Quarterly
another. In particular, Investment Banking units, including corporate finance, capital market activities, financial advisory and other capital raising activities, are segregated by physical and non-physical boundaries from Markets Units, as well as the research department. In the case of equities execution by UniCredit Bank AG Milan Branch, other than as a matter of client facilitation or delta hedging of OTC and listed derivative positions, there is no proprietary trading. Disclosure of publicly available conflicts of interest and other material interests is made in the research. Analysts are supervised and managed on a day-to-day basis by line managers who do not have responsibility for Investment Banking activities, including corporate finance activities, or other activities other than the sale of securities to clients. ADDITIONAL REQUIRED DISCLOSURES UNDER THE LAWS AND REGULATIONS OF JURISDICTIONS INDICATED You will find a list of further additional required disclosures under the laws and regulations of the jurisdictions indicated on our website http://www.cib-unicredit.com/research-disclaimer. Notice to Austrian investors: This publication is only for distribution to professional clients as defined in article 66 WAG (2018). Notice to investors in Bosnia and Herzegovina: This report is intended only for clients of UniCredit in Bosnia and Herzegovina who are institutional investors (Institucionalni investitori) in accordance with Article 2 of the Law on Securities Market of the Federation of Bosnia and Herzegovina and Article 2 of the Law on Securities Markets of the Republic of Srpska, respectively, and may not be used by or distributed to any other person. This document does not constitute or form part of any offer for sale or subscription for or solicitation of any offer to buy or subscribe for any securities and neither this document nor any part of it shall form the basis of, or be relied on in connection with or act as an inducement to enter into, any contract or commitment whatsoever. Notice to Brazilian investors: The individual analyst(s) responsible for issuing this report represent(s) that: (a) the recommendations herein reflect exclusively the personal views of the analysts and have been prepared in an independent manner, including in relation to UniCredit Group; and (b) except for the potential conflicts of interest listed under the heading “Potential Conflicts of Interest” above, the analysts are not in a position that may impact on the impartiality of this report or that may constitute a conflict of interest, including but not limited to the following: (i) the analysts do not have a relationship of any nature with any person who works for any of the companies that are the object of this report; (ii) the analysts and their respective spouses or partners do not hold, either directly or indirectly, on their behalf or for the account of third parties, securities issued by any of the companies that are the object of this report; (iii) the analysts and their respective spouses or partners are not involved, directly or indirectly, in the acquisition, sale and/or trading in the market of the securities issued by any of the companies that are the object of this report; (iv) the analysts and their respective spouses or partners do not have any financial interest in the companies that are the object of this report; and (v) the compensation of the analysts is not, directly or indirectly, affected by UniCredit’s revenues arising out of its businesses and financial transactions. UniCredit represents that: except for the potential conflicts of interest listed under the heading “Potential Conflicts of Interest” above, UniCredit, its controlled companies, controlling companies or companies under common control (the “UniCredit Group”) are not in a condition that may impact on the impartiality of this report or that may constitute a conflict of interest, including but not limited to the following: (i) the UniCredit Group does not hold material equity interests in the companies that are the object of this report; (ii) the companies that are the object of this report do not hold material equity interests in the UniCredit Group; (iii) the UniCredit Group does not have material financial or commercial interests in the companies or the securities that are the object of this report; (iv) the UniCredit Group is not involved in the acquisition, sale and/or trading of the securities that are the object of this report; and (v) the UniCredit Group does not receive compensation for services rendered to the companies that are the object of this report or to any related parties of such companies. Notice to Canadian investors: This communication has been prepared by UniCredit Bank AG, which does not have a registered business presence in Canada. This communication is a general discussion of the merits and risks of a security or securities only, and is not in any way meant to be tailored to the needs and circumstances of any recipient. The contents of this communication are for information purposes only, therefore should not be construed as advice and do not constitute an offer to sell, nor a solicitation to buy any securities. Notice to Cyprus investors: This document is directed only at clients of UniCredit Bank who are persons falling within the Second Appendix (Section 2, Professional Clients) of the law for the Provision of Investment Services, the Exercise of Investment Activities, the Operation of Regulated Markets and other Related Matters, Law 144(I)/2007 and persons to whom it may otherwise lawfully be communicated who possess the experience, knowledge and expertise to make their own investment decisions and properly assess the risks that they incur (all such persons together being referred to as “relevant persons”). This document must not be acted on or relied on by persons who are not relevant persons or relevant persons who have requested to be treated as retail clients. Any investment or investment activity to which this communication related is available only to relevant persons and will be engaged in only with relevant persons. This document does not constitute an offer or solicitation to any person to whom it is unlawful to make such an offer or solicitation. Notice to Hong Kong investors: This report is intended for Institutional Professional Investors as defined in paragraph (a) to (h) in Part 1 Schedule 1 of the Hong Kong Securities and Futures Ordinance (‘SFO”) and is distributed in Hong Kong by UniCredit Bank AG, Hong Kong branch which is a registered institution under the SFO. It may not be reproduced, or used by or further distributed to any other person, in whole or in part, for any purpose. This report does not constitute or form part of an offer or solicitation of any offer to buy or sell any securities, nor should it or any part of it form the basis of, or be relied upon in connection with, any contract or commitment whatsoever. By accepting this report, the recipient represents and warrants that it is entitled to receive such report in accordance with, and on the basis of, the restrictions set out in this “Disclaimer” section, and agrees to be bound by those restrictions. Notice to investors in Ivory Coast: The information contained in the present report have been obtained by Unicredit Bank AG from sources believed to be reliable, however, no express or implied representation or warranty is made by Unicredit Bank AG or any other person as to the completeness or accuracy of such information. All opinions and estimates contained in the present report constitute a judgement of Unicredit Bank AG as of the date of the present report and are subject to change without notice. They are provided in good faith but without assuming legal responsibility. This report is not an offer to sell or solicitation of an offer to buy or invest in securities. Past performance is not an indicator of future performance and future returns cannot be guaranteed, and there is a risk of loss of the initial capital invested. No matter contained in this document may be reproduced or copied by any means without the prior consent of Unicredit Bank AG. Notice to New Zealand investors: This report is intended for distribution only to persons who are “wholesale clients” within the meaning of the Financial Advisers Act 2008 (“FAA”) and by receiving this report you represent and agree that (i) you are a “wholesale client” under the FAA (ii) you will not distribute this report to any other person, including (in particular) any person who is not a “wholesale client” under the FAA. This report does not constitute or form part of, in relation to any of the securities or products covered by this report, either (i) an offer of securities for subscription or sale under the Securities Act 1978 or (ii) an offer of financial products for issue or sale under the Financial Markets Conduct Act 2013. Notice to Omani investors: This communication has been prepared by UniCredit Bank AG. UniCredit Bank AG does not have a registered business presence in Oman and does not undertake banking business or provide financial services in Oman and no advice in relation to, or subscription for, any securities, products or financial services may or will be consummated within Oman. The contents of this communication are for the information purposes of sophisticated clients, who are aware of the risks associated with investments in foreign securities and neither constitutes an offer of securities in Oman as contemplated by the Commercial Companies Law of Oman (Royal Decree 4/74) or the Capital Market Law of Oman (Royal Decree 80/98), nor does it constitute an offer to sell, or the solicitation of any offer to buy non-Omani securities in Oman as contemplated by Article 139 of the Executive Regulations to the Capital Market Law (issued vide CMA Decision 1/2009). This communication has not been approved by and UniCredit Bank AG is not regulated by either the Central Bank of Oman or Oman’s Capital Market Authority. Notice to Pakistani investors: Investment information, comments and recommendations stated herein are not within the scope of investment advisory activities as defined in sub-section I, Section 2 of the Securities and Exchange Ordinance, 1969 of Pakistan. Investment advisory services are provided in accordance with a contract of engagement on investment advisory services concluded with brokerage houses, portfolio management companies, non-deposit banks and the clients. The distribution of this report is intended only for informational purposes for the use of professional investors and the information and opinions contained herein, or any part of it shall not form the basis of, or be relied on in connection with or act as an inducement to enter into, any contract or commitment whatsoever. Notice to Polish Investors: This document is intended solely for professional clients as defined in Art. 3.39b of the Trading in Financial Instruments Act of 29 July 2005 (as amended). The publisher and distributor of the document certifies that it has acted with due care and diligence in preparing it, however, assumes no liability for its completeness and accuracy. This document is not an advertisement. It should not be used in substitution for the exercise of independent judgment. Notice to Serbian investors: This analysis is only for distribution to professional clients (profesionalni klijenti) as defined in article 172 of the Law on Capital Markets. Notice to UK investors: This communication is directed only at clients of UniCredit Bank who (i) have professional experience in matters relating to investments or (ii) are persons falling within Article 49(2)(a) to (d) (“high net worth companies, unincorporated associations, etc.”) of the United Kingdom Financial Services and Markets Act 2000 (Financial Promotion) Order 2005 or (iii) to whom it may otherwise lawfully be communicated (all such persons together being referred to as “relevant persons”). This communication must not be acted on or relied on by persons who are not relevant persons. Any investment or investment activity to which this communication relates is available only to relevant persons and will be engaged in only with relevant persons.
ENP e 18/4
October 2018
UniCredit Research page 93
September 2018
CEE Macro & Strategy Research
CEE Quarterly
Banking network
UniCredit Group CEE banking network – Headquarters
Azerbaijan Yapi Kredi Azerbaijan Yasamal District, Jafar Jabbarlı Str., 32/12, AZ 1065, Baku/Azerbaijan Phone +994 12 497 77 95 E-mail: [email protected] www.yapikredi.com.az/
Bosnia and Herzegovina UniCredit Bank d.d. Kardinala Stepinca - bb, BH-88000 Mostar Phone: +387 33 222 999 E-mail: [email protected] www.unicreditbank.ba
UniCredit Bank Banja Luka Marije Bursac 7, BA-78000 Banja Luka Phone: +387 80 051 051 E-mail: [email protected] www.unicreditbank-bl.ba
Bulgaria UniCredit Bulbank Sveta Nedelya Sq. 7, BG-1000 Sofia Phone: +359 70 01 84 84 www.unicreditbulbank.bg
Croatia Zagrebačka banka d.d. Trg bana Josipa Jelačića 10 HR-10000 Zagreb Phone: +385 1 6104 169 E-mail: [email protected] www.zaba.hr
Czech Republic UniCredit Bank Želetavská 1525/1 CZ-140 94 - Prague 4 Phone: +420 955 911 111 E-mail: [email protected] www.unicreditbank.cz
Hungary UniCredit Bank Szabadság square 5-6, H-1054 Budapest, Phone: +36 1 301 12 71 E-mail: [email protected] www.unicreditbank.hu
Romania UniCredit Bank 1F, Blvd. Expozitiei RO-012101 Bucharest 1 Phone: +40 21 200 2200 E-mail: [email protected] www.unicredit.ro
Russia UniCredit Bank Prechistenskaya nab. 9, RF-119034 Moscow Phone: +7 495 258 7258 E-mail: [email protected] www.unicreditbank.ru
Serbia UniCredit Bank Rajiceva 27-29, RS-11000 Belgrade Phone: +381 11 3204 500 E-mail: [email protected] www.unicreditbank.rs
Slovakia UniCredit Bank Sǎncova 1/A, SK-813 33 Bratislava Phone: +421 2 4950 1111 www.unicreditbank.sk
Slovenia UniCredit Bank Šmartinska Cesta 140, SI-1000 Ljubljana Phone: +386 1 5876 600 E-mail: [email protected] www.unicreditbank.si
Turkey Yapı Kredi Yapı Kredi Plaza D Blok, Levent, TR-34330 Istanbul Phone: +90 212 339 70 00 www.yapikredi.com.tr

October 2018
UniCredit Research page 94
September 2018
CEE Macro & Strategy Research
CEE Quarterly
Contacts for entering into a business relationship with UniCredit’s corporate banking network (UniCredit International Centers)
UniCredit International Center CEE Roberto Poliak Phone: +43 50505 51030 E-mail: [email protected] E-mail: [email protected]
UniCredit International Center Austria Martin Zojer Phone: +43 50505 42748 E-mail: martin.zojer@ unicreditgroup.at
UniCredit International Center Germany Dr. Andreas Wagner Phone: +49 89 378 20141 E-mail: [email protected]
UniCredit International Center Italy Alessandro Paoli Tel: +39 02 8681 6748 E-mail: [email protected]
Azerbaijan Orhan Gültekin Phone: +994 12 49 77 795 E-mail: [email protected]
Bosnia and Herzegovina UniCredit Bank d.d. Berna Hadžimujagić Phone: +387 33 491 990 Email: [email protected]
UniCredit Bank a.d. Banja Luka Boris Dragić Phone: +387 51 243 320 Email: [email protected]
Bulgaria Emiliano Steinfl Phone: +359 2 930 97 19 E-mail: [email protected]
Croatia Roberta Cupic Phone: +385 1 6305 029 E-mail: [email protected]
Czech Republic Guido Filippi Phone: +420 955961524 E-mail: [email protected]
Hungary Raluca Popescu-Goglea Phone: +36 1301 1207 E-mail: [email protected]
Romania Andrea D’Alessandro Phone: +4 021 200 1616 E-mail: [email protected]
Russia Fabrizio Rollo Phone: +7 495 723 7126 E-mail: [email protected]
Serbia Luciano Bellan Phone: +381 11 3028 645 E-mail: [email protected]
Slovakia Guido Filippi Phone: +420 725 991 407 E-mail: [email protected]
Slovenia Natasa Markov Phone: +386 1 5876 874 E-mail: [email protected]
Turkey Fabio Bini Phone: +90 212 339 7988 E-mail: [email protected]

October 2018
UniCredit Research page 95
September 2018
CEE Macro & Strategy Research
CEE Quarterly
UniCredit Research* CEE Macro & Strategy Research
Erik F. Nielsen Group Chief Economist Global Head of CIB Research +44 207 826-1765 [email protected]
Dr. Ingo Heimig Head of Research Operations & Regulatory Control +49 89 378-13952 [email protected]
Head of Macro Research Heads of Strategy Research
Marco Valli Head of Macro Research Chief European Economist +39 02 8862-0537 [email protected]
Dr. Philip Gisdakis Co-Head of Strategy Research Head of Credit Strategy Research +49 89 378-13228 [email protected]
EEMEA Economics Research
Dan Bucşa Chief CEE Economist +44 207 826-7954 [email protected]
Mauro Giorgio Marrano Senior CEE Economist +43 50505-82712 [email protected]
Artem Arkhipov Head, Macroeconomic Analysis and Research, Russia +7 495 258-7258 [email protected]
Anna Bogdyukevich, CFA Russia +7 495 258-7258 ext. 11-7562 [email protected]
Hrvoje Dolenec Chief Economist, Croatia +385 1 6006 678 [email protected]
Dr. Ágnes Halász Chief Economist, Head, Economics and Strategic Analysis, Hungary +36 1 301-1907 [email protected]
Ľubomír Koršňák Chief Economist, Slovakia +421 2 4950 2427 [email protected]
Anca Maria Negrescu Senior Economist, Romania +40 21 200-1377 [email protected]
Kristofor Pavlov Chief Economist, Bulgaria +359 2 9269-390 [email protected]
Pavel Sobíšek Chief Economist, Czech Republic +420 955 960-716 [email protected]
EM FX Strategy Research Cross Asset Strategy Research Global Economics Research
Kiran Kowshik +44 207 826-6080 [email protected]
Elia Lattuga +44 207 826-1642 [email protected]
Daniel Vernazza, Ph.D., Chief UK & Senior Global Economist (UniCredit Bank, London) +44 207 826-7805 [email protected]
UniCredit Research, Corporate & Investment Banking, UniCredit Bank AG, Am Eisbach 4, D-80538 Munich, [email protected] Bloomberg: UCCR, Internet: www.research.unicredit.eu CEE 18/7
*UniCredit Research is the joint research department of UniCredit Bank AG (UniCredit Bank, Munich or Frankfurt), UniCredit Bank AG London Branch (UniCredit Bank, London), UniCredit Bank AG Milan Branch (UniCredit Bank, Milan), UniCredit Bank New York (UniCredit Bank, New York), UniCredit Bank AG Vienna Branch (UniCredit Bank, Vienna), UniCredit Bank Austria AG (Bank Austria), UniCredit Bulbank, Zagrebačka banka d.d., UniCredit Bank Czech Republic and Slovakia, ZAO UniCredit Bank Russia (UniCredit Russia), UniCredit Bank Romania.
Related Documents