Quarterly Statistical Digest August 2004 Volume 13, No. 3

Welcome message from author
This document is posted to help you gain knowledge. Please leave a comment to let me know what you think about it! Share it to your friends and learn new things together.
Transcript
QuarterlyStatistical
Digest
August 2004Volume 13, No. 3

The Statistical Digest is a quarterly publication of The Central Bank of The Bahamas, prepared by The Research Department for issue in February, May, August and November. The first issue, Volume I, No. 3 (August, 1992), replaced the former Quarterly Review which was last published for March 1992. All correspondence pertaining to the Digest should be addressed to:
The Manager Research Department
The Central Bank of The Bahamas P. O .Box N-4868 Nassau, Bahamas
email address: [email protected]
website address: www.centralbankbahams.com
GENERAL NOTES
The following symbols and conventions are used: 1. n.a. : not available 2. p : provisional data 3. -- : nil 4. B$ Bahamian dollars 5. F/C Foreign Currency 6 * See notes to tables 7 YTD Year to date 8 . . . Not specified Users should note that: a. Data in tables are subject to periodic revisions as more updated information becomes available. b. Due to rounding, the sum of separate items may differ from the totals shown. Acknowledgement
The Central Bank of The Bahamas wishes to express its appreciation for the assistance received from The Ministry of Finance, The Ministry of Agriculture, The Ministry of Tourism, Commercial Banks, Other Local Financial Institutions, the Public Corporations, the Department of Statistics, and other government and private sector agencies in the compilation of the data.
(iii)
CONTENTS
Page No.
GENERAL NOTES
SECTION 1 MONETARY AUTHORITY
Table 1.1 Central Bank of The Bahamas: Assets 1 1.2 Central Bank of The Bahamas: Liabilities 2 1.3 Factors Affecting External Reserves 3 1.4 Central Bank of The Bahamas: Notes in Circulation 4 1.5 Central Bank of The Bahamas: Coins in Circulation 5 SECTION 2 BANKING SYSTEM
Table 2.1 Financial Survey 6 2.2 Monetary Survey 7 2.3 Money Supply 8 2.4 Factors Affecting Money Supply 9 2.5 Bank Deposits by Depositors (All Currencies) 10 2.6 Bank Deposits by Depositors (Bahamian Dollars) 11 2.7 Distribution of Bank Credit (All Currencies) 12 2.8 Summary of Bank Consumer Installment Credit 14 2.9 Summary of Bank Liquidity 15 2.10 Profit and Loss Accounts of Banks in The Bahamas 16 2.11 Banks and Trust Companies Licenced in The Bahamas 17 CHART 2.1 Banks and Trust Companies Licenced in The Bahamas 18
SECTION 3 COMMERCIAL BANKS
Table 3.1 Commercial Banks: Domestic Assets 19 3.2 Commercial Banks: Domestic Liabilities 20 3.3 Commercial Banks: Foreign Assets 21 3.4 Commercial Banks: Foreign Liabilities 22 3.5 Commercial Banks: Total Deposits by Depositors (All Currencies) 23 3.6 Commercial Banks: Demand Deposits by Depositors (All Currencies) 24 3.7 Commercial Banks: Savings Deposits by Depositors (All Currencies) 25 3.8 Commercial Banks: Fixed Deposits by Depositors (All Currencies) 26 3.9 Commercial Banks: Fixed Deposits by Maturity 27 3.10 Commercial Banks: Overdrafts and Loans by Maturity 28 3.11 Commercial Banks: Sectoral Distribution of Credit (Bahamian Dollars) 29 3.12 Commercial Banks: Sectoral Distribution of Credit (Foreign Currency) 31 3.13 Commercial Banks: Consumer Instalment Credit-Debt Outstanding 33 3.14 Commercial Banks: Consumer Instalment Credit-Repayment 34 3.15 Commercial Banks: Consumer Instalment Credit-New Credit 35 3.16 Profit and Loss Accounts of Commercial Banks in The Bahamas 36 3.17 Commercial Banks: Statutory Liquidity 37 3.18 Commercial Banks: Liquid Assets 38 3.19 Commercial Banks: Foreign Exchange Transactions 39 3.20 Commercial Banks: Clearings 40
(iv)
SECTION 4 OTHER LOCAL FINANCIAL INSTITUTIONS
Table 4.1 Other Local Financial Institutions: Assets 41 4.2 Other Local Financial Institutions: Liabilities 42 4.3 Other Local Financial Institutions: Total Deposits by Depositors 43 4.4 Other Local Financial Institutions: Demand Deposits 44 4.5 Other Local Financial Institutions: Savings Deposits 45 4.6 Other Local Financial Institutions: Fixed Deposits 46 4.7 Other Local Financial Institutions: Fixed Deposits by Maturity 47 4.8 Other Local Financial Institutions: Overdrafts and Loans by Maturity 48 4.9 Other Local Financial Institutions: Sectoral Distribution of Credit (B$) 49 4.10 Other Local Financial Institutions: Consumer Instalment Credit-Debt Outstanding 51 4.11 Other Local Financial Institutions: Consumer Instalment Credit-Repayment 52 4.12 Other Local Financial Institutions: Consumer Instalment Credit-New Credit 53 4.13 Profit and Loss Accounts of Savings and Loans in The Bahamas 54 4.14 Other Local Financial Institutions: Statutory Liquidity 55 4.15 Other Local Financial Institutions: Liquid Assets 56 SECTION 5 OTHER FINANCIAL INSTITUTIONS
Table 5.1 Bahamas Development Bank: Assets 57 5.2 Bahamas Development Bank: Liabilities 58 5.3 Bahamas Development Bank: Sectoral Distribution of Credit 59 5.4 Post Office Savings Bank: Assets and Liabilities 60 SECTION 6 INTEREST RATES
Table 6.1 Selected Interest Rates 61 6.2 Commercial Banks: Loan Rates 62 6.3 Commercial Banks: Deposit Rates 63 6.4 Other Local Financial Institutions: Loan and Deposit Rates 64 6.5 Comparative Treasury Bills and Bank Rates 65 SECTION 7 PUBLIC FINANCE
Table 7.1 Central Government: Operations and Financing 66 7.2 Central Government: Current Revenue 68 7.3 Central Government: Expenditure by Economic Classification 70 7.4 Central Government: Expenditure by Functional Classification 72 SECTION 8 PUBLIC DEBT
Table 8.1 Central Government: National Debt 74 8.2 Central Government: Treasury Bills 76 8.3 Central Government: Long-term Securities 77 8.4 Central Government: Long-term Securities by Maturity 78 8.5 Public Corporations: Debt Operations 79 8.6 Public Sector: Foreign Currency Debt Operations 81 SECTION 9 INTERNATIONAL TRADE AND PAYMENTS
Table 9.1 Balance of Payments 83 9.2 External Trade 85 9.3 Exports by Commodity Group 86 9.4 Imports by Commodity Group 87 9.5 Non-oil Exports by Country and Region 88
(v)
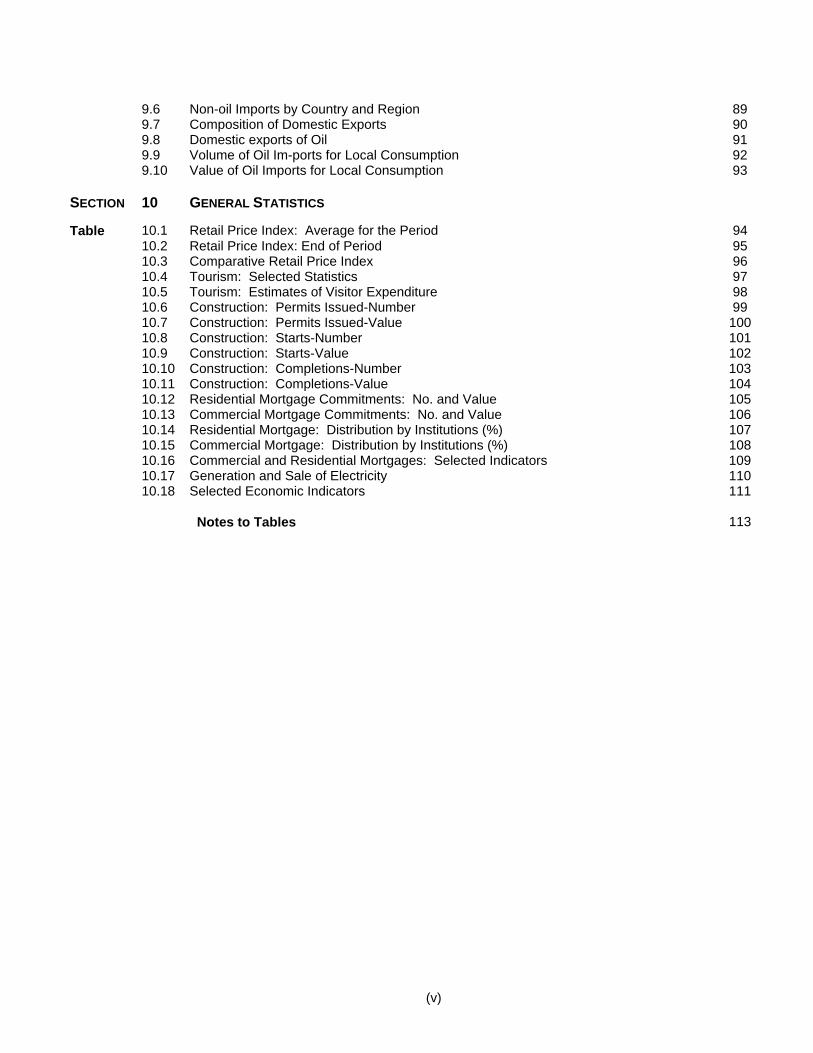
9.6 Non-oil Imports by Country and Region 89 9.7 Composition of Domestic Exports 90 9.8 Domestic exports of Oil 91 9.9 Volume of Oil Im-ports for Local Consumption 92 9.10 Value of Oil Imports for Local Consumption 93 SECTION 10 GENERAL STATISTICS
Table 10.1 Retail Price Index: Average for the Period 94 10.2 Retail Price Index: End of Period 95 10.3 Comparative Retail Price Index 96 10.4 Tourism: Selected Statistics 97 10.5 Tourism: Estimates of Visitor Expenditure 98 10.6 Construction: Permits Issued-Number 99 10.7 Construction: Permits Issued-Value 100 10.8 Construction: Starts-Number 101 10.9 Construction: Starts-Value 102 10.10 Construction: Completions-Number 103 10.11 Construction: Completions-Value 104 10.12 Residential Mortgage Commitments: No. and Value 105 10.13 Commercial Mortgage Commitments: No. and Value 106 10.14 Residential Mortgage: Distribution by Institutions (%) 107 10.15 Commercial Mortgage: Distribution by Institutions (%) 108 10.16 Commercial and Residential Mortgages: Selected Indicators 109 10.17 Generation and Sale of Electricity 110 10.18 Selected Economic Indicators 111 Notes to Tables 113
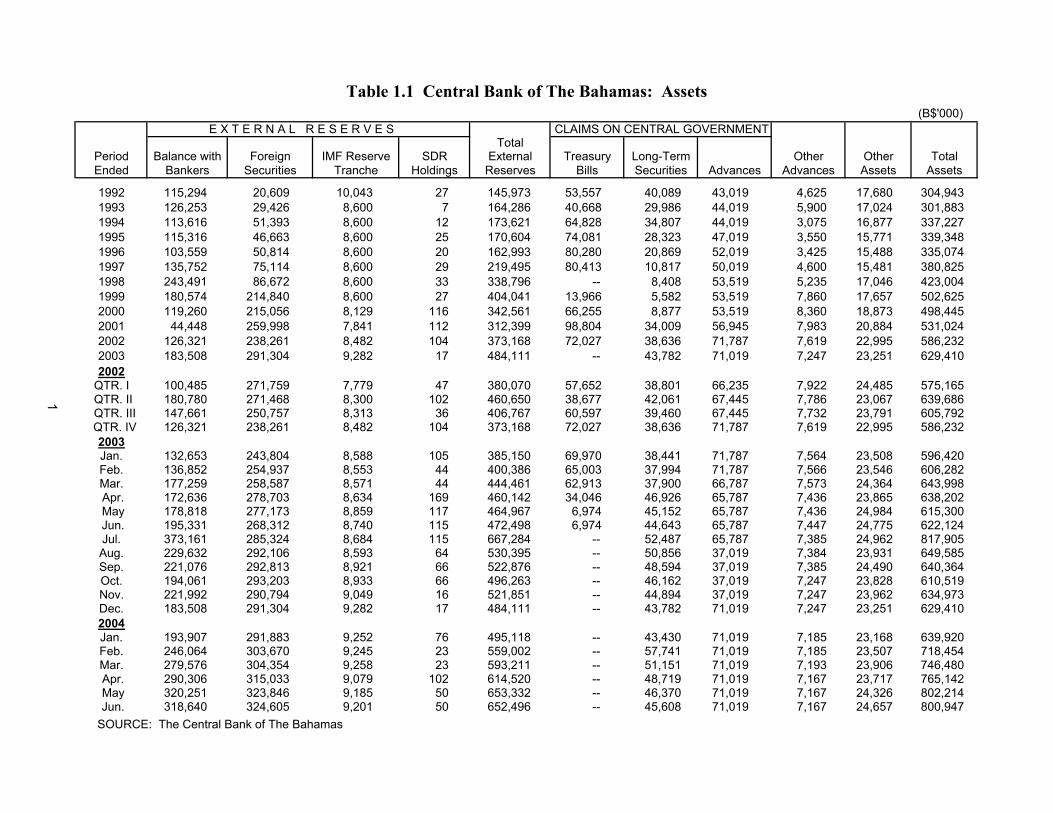
(B$'000)E X T E R N A L R E S E R V E S CLAIMS ON CENTRAL GOVERNMENT
TotalPeriod Balance with Foreign IMF Reserve SDR External Treasury Long-Term Other Other TotalEnded Bankers Securities Tranche Holdings Reserves Bills Securities Advances Advances Assets Assets
1992 115,294 20,609 10,043 27 145,973 53,557 40,089 43,019 4,625 17,680 304,9431993 126,253 29,426 8,600 7 164,286 40,668 29,986 44,019 5,900 17,024 301,8831994 113,616 51,393 8,600 12 173,621 64,828 34,807 44,019 3,075 16,877 337,2271995 115,316 46,663 8,600 25 170,604 74,081 28,323 47,019 3,550 15,771 339,3481996 103,559 50,814 8,600 20 162,993 80,280 20,869 52,019 3,425 15,488 335,0741997 135,752 75,114 8,600 29 219,495 80,413 10,817 50,019 4,600 15,481 380,8251998 243,491 86,672 8,600 33 338,796 -- 8,408 53,519 5,235 17,046 423,0041999 180,574 214,840 8,600 27 404,041 13,966 5,582 53,519 7,860 17,657 502,6252000 119,260 215,056 8,129 116 342,561 66,255 8,877 53,519 8,360 18,873 498,4452001 44,448 259,998 7,841 112 312,399 98,804 34,009 56,945 7,983 20,884 531,0242002 126,321 238,261 8,482 104 373,168 72,027 38,636 71,787 7,619 22,995 586,2322003 183,508 291,304 9,282 17 484,111 -- 43,782 71,019 7,247 23,251 629,4102002
QTR. I 100,485 271,759 7,779 47 380,070 57,652 38,801 66,235 7,922 24,485 575,165 QTR. II 180,780 271,468 8,300 102 460,650 38,677 42,061 67,445 7,786 23,067 639,686
QTR. III 147,661 250,757 8,313 36 406,767 60,597 39,460 67,445 7,732 23,791 605,792 QTR. IV 126,321 238,261 8,482 104 373,168 72,027 38,636 71,787 7,619 22,995 586,232
2003Jan. 132,653 243,804 8,588 105 385,150 69,970 38,441 71,787 7,564 23,508 596,420Feb. 136,852 254,937 8,553 44 400,386 65,003 37,994 71,787 7,566 23,546 606,282Mar. 177,259 258,587 8,571 44 444,461 62,913 37,900 66,787 7,573 24,364 643,998
Apr. 172,636 278,703 8,634 169 460,142 34,046 46,926 65,787 7,436 23,865 638,202 May 178,818 277,173 8,859 117 464,967 6,974 45,152 65,787 7,436 24,984 615,300 Jun. 195,331 268,312 8,740 115 472,498 6,974 44,643 65,787 7,447 24,775 622,124
Jul. 373,161 285,324 8,684 115 667,284 -- 52,487 65,787 7,385 24,962 817,905Aug. 229,632 292,106 8,593 64 530,395 -- 50,856 37,019 7,384 23,931 649,585Sep. 221,076 292,813 8,921 66 522,876 -- 48,594 37,019 7,385 24,490 640,364Oct. 194,061 293,203 8,933 66 496,263 -- 46,162 37,019 7,247 23,828 610,519Nov. 221,992 290,794 9,049 16 521,851 -- 44,894 37,019 7,247 23,962 634,973Dec. 183,508 291,304 9,282 17 484,111 -- 43,782 71,019 7,247 23,251 629,4102004Jan. 193,907 291,883 9,252 76 495,118 -- 43,430 71,019 7,185 23,168 639,920Feb. 246,064 303,670 9,245 23 559,002 -- 57,741 71,019 7,185 23,507 718,454Mar. 279,576 304,354 9,258 23 593,211 -- 51,151 71,019 7,193 23,906 746,480
Apr. 290,306 315,033 9,079 102 614,520 -- 48,719 71,019 7,167 23,717 765,142 May 320,251 323,846 9,185 50 653,332 -- 46,370 71,019 7,167 24,326 802,214 Jun. 318,640 324,605 9,201 50 652,496 -- 45,608 71,019 7,167 24,657 800,947
SOURCE: The Central Bank of The Bahamas
Table 1.1 Central Bank of The Bahamas: Assets
1
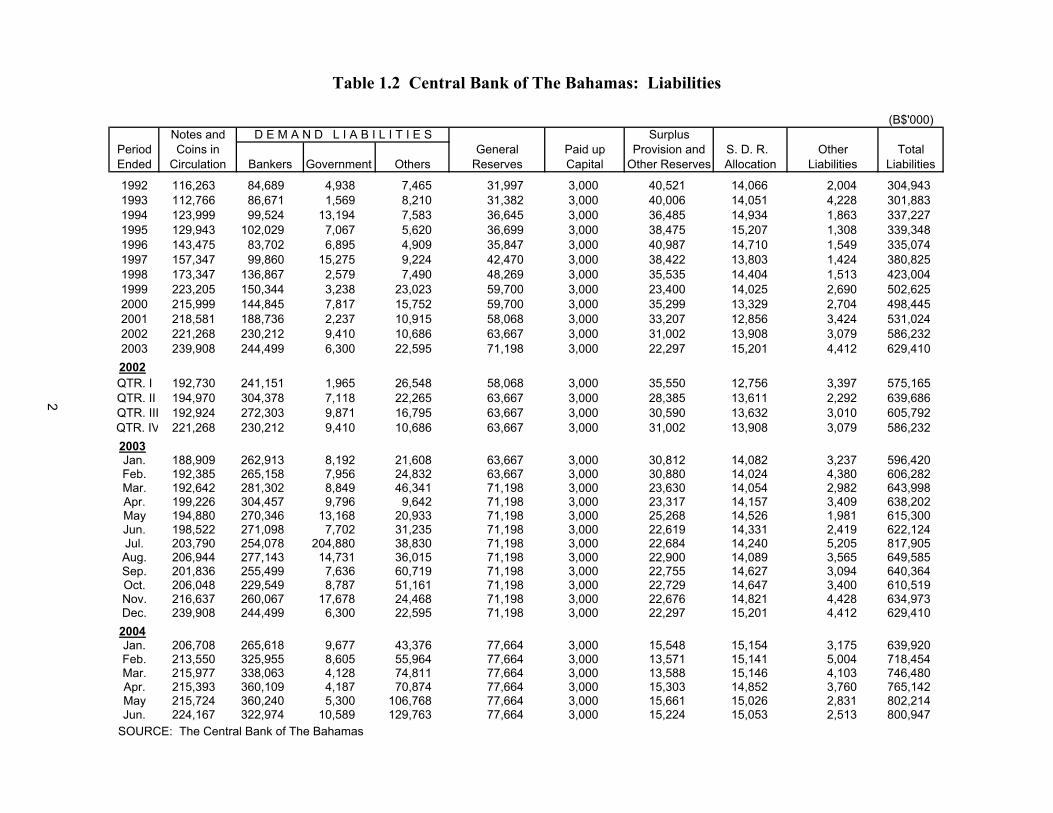
(B$'000)Notes and D E M A N D L I A B I L I T I E S Surplus
Period Coins in General Paid up Provision and S. D. R. Other TotalEnded Circulation Bankers Government Others Reserves Capital Other Reserves Allocation Liabilities Liabilities
1992 116,263 84,689 4,938 7,465 31,997 3,000 40,521 14,066 2,004 304,9431993 112,766 86,671 1,569 8,210 31,382 3,000 40,006 14,051 4,228 301,8831994 123,999 99,524 13,194 7,583 36,645 3,000 36,485 14,934 1,863 337,2271995 129,943 102,029 7,067 5,620 36,699 3,000 38,475 15,207 1,308 339,3481996 143,475 83,702 6,895 4,909 35,847 3,000 40,987 14,710 1,549 335,0741997 157,347 99,860 15,275 9,224 42,470 3,000 38,422 13,803 1,424 380,8251998 173,347 136,867 2,579 7,490 48,269 3,000 35,535 14,404 1,513 423,0041999 223,205 150,344 3,238 23,023 59,700 3,000 23,400 14,025 2,690 502,6252000 215,999 144,845 7,817 15,752 59,700 3,000 35,299 13,329 2,704 498,4452001 218,581 188,736 2,237 10,915 58,068 3,000 33,207 12,856 3,424 531,0242002 221,268 230,212 9,410 10,686 63,667 3,000 31,002 13,908 3,079 586,2322003 239,908 244,499 6,300 22,595 71,198 3,000 22,297 15,201 4,412 629,4102002QTR. I 192,730 241,151 1,965 26,548 58,068 3,000 35,550 12,756 3,397 575,165
QTR. II 194,970 304,378 7,118 22,265 63,667 3,000 28,385 13,611 2,292 639,686 QTR. III 192,924 272,303 9,871 16,795 63,667 3,000 30,590 13,632 3,010 605,792 QTR. IV 221,268 230,212 9,410 10,686 63,667 3,000 31,002 13,908 3,079 586,232
2003Jan. 188,909 262,913 8,192 21,608 63,667 3,000 30,812 14,082 3,237 596,420Feb. 192,385 265,158 7,956 24,832 63,667 3,000 30,880 14,024 4,380 606,282Mar. 192,642 281,302 8,849 46,341 71,198 3,000 23,630 14,054 2,982 643,998 Apr. 199,226 304,457 9,796 9,642 71,198 3,000 23,317 14,157 3,409 638,202 May 194,880 270,346 13,168 20,933 71,198 3,000 25,268 14,526 1,981 615,300 Jun. 198,522 271,098 7,702 31,235 71,198 3,000 22,619 14,331 2,419 622,124Jul. 203,790 254,078 204,880 38,830 71,198 3,000 22,684 14,240 5,205 817,905Aug. 206,944 277,143 14,731 36,015 71,198 3,000 22,900 14,089 3,565 649,585Sep. 201,836 255,499 7,636 60,719 71,198 3,000 22,755 14,627 3,094 640,364Oct. 206,048 229,549 8,787 51,161 71,198 3,000 22,729 14,647 3,400 610,519Nov. 216,637 260,067 17,678 24,468 71,198 3,000 22,676 14,821 4,428 634,973Dec. 239,908 244,499 6,300 22,595 71,198 3,000 22,297 15,201 4,412 629,4102004Jan. 206,708 265,618 9,677 43,376 77,664 3,000 15,548 15,154 3,175 639,920Feb. 213,550 325,955 8,605 55,964 77,664 3,000 13,571 15,141 5,004 718,454Mar. 215,977 338,063 4,128 74,811 77,664 3,000 13,588 15,146 4,103 746,480 Apr. 215,393 360,109 4,187 70,874 77,664 3,000 15,303 14,852 3,760 765,142 May 215,724 360,240 5,300 106,768 77,664 3,000 15,661 15,026 2,831 802,214 Jun. 224,167 322,974 10,589 129,763 77,664 3,000 15,224 15,053 2,513 800,947
SOURCE: The Central Bank of The Bahamas
Table 1.2 Central Bank of The Bahamas: Liabilities
2
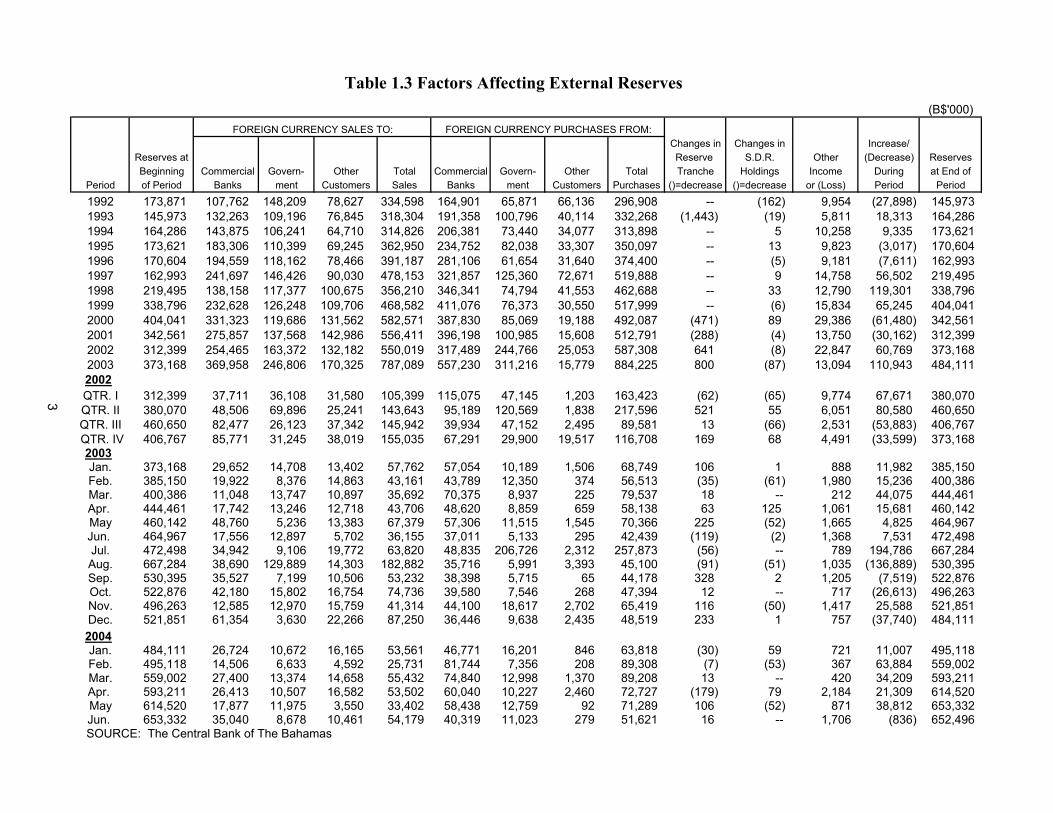
(B$'000)FOREIGN CURRENCY SALES TO: FOREIGN CURRENCY PURCHASES FROM:
Changes in Changes in Increase/Reserves at Reserve S.D.R. Other (Decrease) ReservesBeginning Commercial Govern- Other Total Commercial Govern- Other Total Tranche Holdings Income During at End of
Period of Period Banks ment Customers Sales Banks ment Customers Purchases ()=decrease ()=decrease or (Loss) Period Period
1992 173,871 107,762 148,209 78,627 334,598 164,901 65,871 66,136 296,908 -- (162) 9,954 (27,898) 145,9731993 145,973 132,263 109,196 76,845 318,304 191,358 100,796 40,114 332,268 (1,443) (19) 5,811 18,313 164,2861994 164,286 143,875 106,241 64,710 314,826 206,381 73,440 34,077 313,898 -- 5 10,258 9,335 173,6211995 173,621 183,306 110,399 69,245 362,950 234,752 82,038 33,307 350,097 -- 13 9,823 (3,017) 170,6041996 170,604 194,559 118,162 78,466 391,187 281,106 61,654 31,640 374,400 -- (5) 9,181 (7,611) 162,9931997 162,993 241,697 146,426 90,030 478,153 321,857 125,360 72,671 519,888 -- 9 14,758 56,502 219,4951998 219,495 138,158 117,377 100,675 356,210 346,341 74,794 41,553 462,688 -- 33 12,790 119,301 338,7961999 338,796 232,628 126,248 109,706 468,582 411,076 76,373 30,550 517,999 -- (6) 15,834 65,245 404,0412000 404,041 331,323 119,686 131,562 582,571 387,830 85,069 19,188 492,087 (471) 89 29,386 (61,480) 342,5612001 342,561 275,857 137,568 142,986 556,411 396,198 100,985 15,608 512,791 (288) (4) 13,750 (30,162) 312,3992002 312,399 254,465 163,372 132,182 550,019 317,489 244,766 25,053 587,308 641 (8) 22,847 60,769 373,1682003 373,168 369,958 246,806 170,325 787,089 557,230 311,216 15,779 884,225 800 (87) 13,094 110,943 484,1112002QTR. I 312,399 37,711 36,108 31,580 105,399 115,075 47,145 1,203 163,423 (62) (65) 9,774 67,671 380,070QTR. II 380,070 48,506 69,896 25,241 143,643 95,189 120,569 1,838 217,596 521 55 6,051 80,580 460,650QTR. III 460,650 82,477 26,123 37,342 145,942 39,934 47,152 2,495 89,581 13 (66) 2,531 (53,883) 406,767 QTR. IV 406,767 85,771 31,245 38,019 155,035 67,291 29,900 19,517 116,708 169 68 4,491 (33,599) 373,168
2003Jan. 373,168 29,652 14,708 13,402 57,762 57,054 10,189 1,506 68,749 106 1 888 11,982 385,150Feb. 385,150 19,922 8,376 14,863 43,161 43,789 12,350 374 56,513 (35) (61) 1,980 15,236 400,386Mar. 400,386 11,048 13,747 10,897 35,692 70,375 8,937 225 79,537 18 -- 212 44,075 444,461Apr. 444,461 17,742 13,246 12,718 43,706 48,620 8,859 659 58,138 63 125 1,061 15,681 460,142 May 460,142 48,760 5,236 13,383 67,379 57,306 11,515 1,545 70,366 225 (52) 1,665 4,825 464,967Jun. 464,967 17,556 12,897 5,702 36,155 37,011 5,133 295 42,439 (119) (2) 1,368 7,531 472,498Jul. 472,498 34,942 9,106 19,772 63,820 48,835 206,726 2,312 257,873 (56) -- 789 194,786 667,284Aug. 667,284 38,690 129,889 14,303 182,882 35,716 5,991 3,393 45,100 (91) (51) 1,035 (136,889) 530,395Sep. 530,395 35,527 7,199 10,506 53,232 38,398 5,715 65 44,178 328 2 1,205 (7,519) 522,876Oct. 522,876 42,180 15,802 16,754 74,736 39,580 7,546 268 47,394 12 -- 717 (26,613) 496,263Nov. 496,263 12,585 12,970 15,759 41,314 44,100 18,617 2,702 65,419 116 (50) 1,417 25,588 521,851Dec. 521,851 61,354 3,630 22,266 87,250 36,446 9,638 2,435 48,519 233 1 757 (37,740) 484,1112004Jan. 484,111 26,724 10,672 16,165 53,561 46,771 16,201 846 63,818 (30) 59 721 11,007 495,118Feb. 495,118 14,506 6,633 4,592 25,731 81,744 7,356 208 89,308 (7) (53) 367 63,884 559,002Mar. 559,002 27,400 13,374 14,658 55,432 74,840 12,998 1,370 89,208 13 -- 420 34,209 593,211Apr. 593,211 26,413 10,507 16,582 53,502 60,040 10,227 2,460 72,727 (179) 79 2,184 21,309 614,520 May 614,520 17,877 11,975 3,550 33,402 58,438 12,759 92 71,289 106 (52) 871 38,812 653,332Jun. 653,332 35,040 8,678 10,461 54,179 40,319 11,023 279 51,621 16 -- 1,706 (836) 652,496
SOURCE: The Central Bank of The Bahamas
Table 1.3 Factors Affecting External Reserves
3
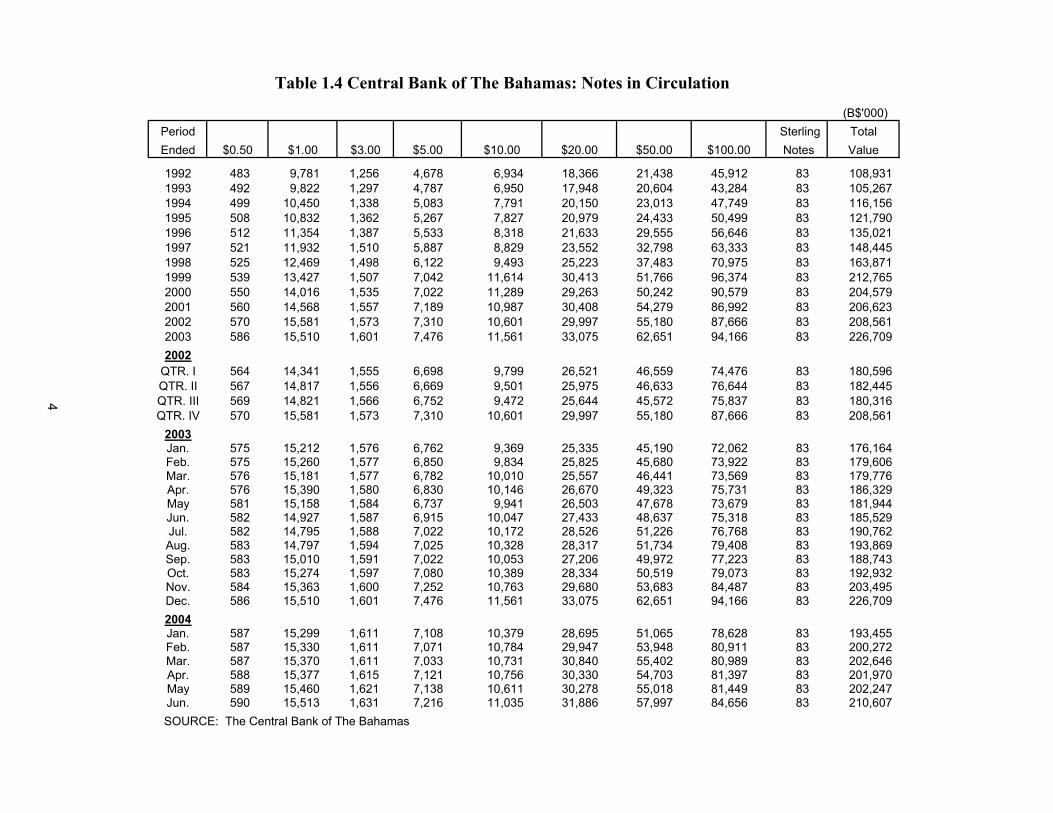
Table 1.4 Central Bank of The Bahamas: Notes in Circulation
(B$'000)Period Sterling TotalEnded $0.50 $1.00 $3.00 $5.00 $10.00 $20.00 $50.00 $100.00 Notes Value
1992 483 9,781 1,256 4,678 6,934 18,366 21,438 45,912 83 108,9311993 492 9,822 1,297 4,787 6,950 17,948 20,604 43,284 83 105,2671994 499 10,450 1,338 5,083 7,791 20,150 23,013 47,749 83 116,1561995 508 10,832 1,362 5,267 7,827 20,979 24,433 50,499 83 121,7901996 512 11,354 1,387 5,533 8,318 21,633 29,555 56,646 83 135,0211997 521 11,932 1,510 5,887 8,829 23,552 32,798 63,333 83 148,4451998 525 12,469 1,498 6,122 9,493 25,223 37,483 70,975 83 163,8711999 539 13,427 1,507 7,042 11,614 30,413 51,766 96,374 83 212,7652000 550 14,016 1,535 7,022 11,289 29,263 50,242 90,579 83 204,5792001 560 14,568 1,557 7,189 10,987 30,408 54,279 86,992 83 206,6232002 570 15,581 1,573 7,310 10,601 29,997 55,180 87,666 83 208,5612003 586 15,510 1,601 7,476 11,561 33,075 62,651 94,166 83 226,7092002
QTR. I 564 14,341 1,555 6,698 9,799 26,521 46,559 74,476 83 180,596QTR. II 567 14,817 1,556 6,669 9,501 25,975 46,633 76,644 83 182,445QTR. III 569 14,821 1,566 6,752 9,472 25,644 45,572 75,837 83 180,316QTR. IV 570 15,581 1,573 7,310 10,601 29,997 55,180 87,666 83 208,561
2003Jan. 575 15,212 1,576 6,762 9,369 25,335 45,190 72,062 83 176,164Feb. 575 15,260 1,577 6,850 9,834 25,825 45,680 73,922 83 179,606Mar. 576 15,181 1,577 6,782 10,010 25,557 46,441 73,569 83 179,776Apr. 576 15,390 1,580 6,830 10,146 26,670 49,323 75,731 83 186,329May 581 15,158 1,584 6,737 9,941 26,503 47,678 73,679 83 181,944Jun. 582 14,927 1,587 6,915 10,047 27,433 48,637 75,318 83 185,529Jul. 582 14,795 1,588 7,022 10,172 28,526 51,226 76,768 83 190,762Aug. 583 14,797 1,594 7,025 10,328 28,317 51,734 79,408 83 193,869Sep. 583 15,010 1,591 7,022 10,053 27,206 49,972 77,223 83 188,743Oct. 583 15,274 1,597 7,080 10,389 28,334 50,519 79,073 83 192,932Nov. 584 15,363 1,600 7,252 10,763 29,680 53,683 84,487 83 203,495Dec. 586 15,510 1,601 7,476 11,561 33,075 62,651 94,166 83 226,7092004Jan. 587 15,299 1,611 7,108 10,379 28,695 51,065 78,628 83 193,455Feb. 587 15,330 1,611 7,071 10,784 29,947 53,948 80,911 83 200,272Mar. 587 15,370 1,611 7,033 10,731 30,840 55,402 80,989 83 202,646Apr. 588 15,377 1,615 7,121 10,756 30,330 54,703 81,397 83 201,970May 589 15,460 1,621 7,138 10,611 30,278 55,018 81,449 83 202,247Jun. 590 15,513 1,631 7,216 11,035 31,886 57,997 84,656 83 210,607
SOURCE: The Central Bank of The Bahamas
4
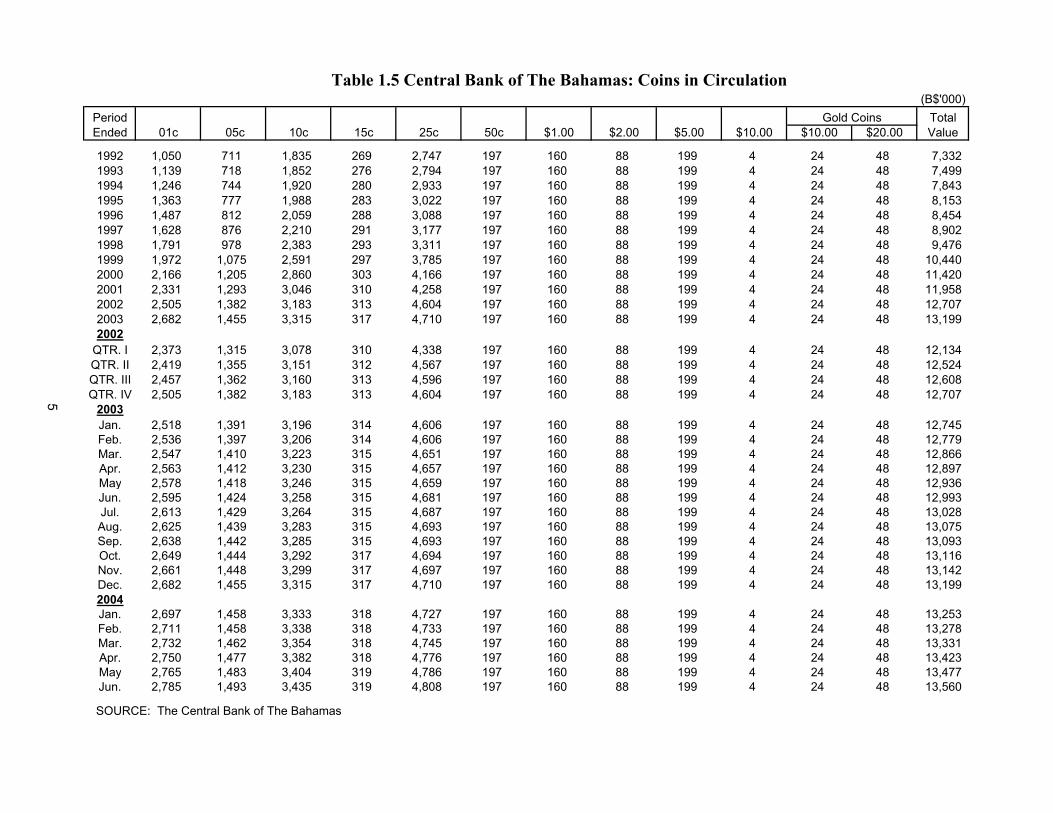
Table 1.5 Central Bank of The Bahamas: Coins in Circulation(B$'000)
Period Gold Coins TotalEnded 01c 05c 10c 15c 25c 50c $1.00 $2.00 $5.00 $10.00 $10.00 $20.00 Value
1992 1,050 711 1,835 269 2,747 197 160 88 199 4 24 48 7,3321993 1,139 718 1,852 276 2,794 197 160 88 199 4 24 48 7,4991994 1,246 744 1,920 280 2,933 197 160 88 199 4 24 48 7,8431995 1,363 777 1,988 283 3,022 197 160 88 199 4 24 48 8,1531996 1,487 812 2,059 288 3,088 197 160 88 199 4 24 48 8,4541997 1,628 876 2,210 291 3,177 197 160 88 199 4 24 48 8,9021998 1,791 978 2,383 293 3,311 197 160 88 199 4 24 48 9,4761999 1,972 1,075 2,591 297 3,785 197 160 88 199 4 24 48 10,4402000 2,166 1,205 2,860 303 4,166 197 160 88 199 4 24 48 11,4202001 2,331 1,293 3,046 310 4,258 197 160 88 199 4 24 48 11,9582002 2,505 1,382 3,183 313 4,604 197 160 88 199 4 24 48 12,7072003 2,682 1,455 3,315 317 4,710 197 160 88 199 4 24 48 13,1992002
QTR. I 2,373 1,315 3,078 310 4,338 197 160 88 199 4 24 48 12,134QTR. II 2,419 1,355 3,151 312 4,567 197 160 88 199 4 24 48 12,524QTR. III 2,457 1,362 3,160 313 4,596 197 160 88 199 4 24 48 12,608QTR. IV 2,505 1,382 3,183 313 4,604 197 160 88 199 4 24 48 12,707
2003Jan. 2,518 1,391 3,196 314 4,606 197 160 88 199 4 24 48 12,745Feb. 2,536 1,397 3,206 314 4,606 197 160 88 199 4 24 48 12,779Mar. 2,547 1,410 3,223 315 4,651 197 160 88 199 4 24 48 12,866Apr. 2,563 1,412 3,230 315 4,657 197 160 88 199 4 24 48 12,897May 2,578 1,418 3,246 315 4,659 197 160 88 199 4 24 48 12,936Jun. 2,595 1,424 3,258 315 4,681 197 160 88 199 4 24 48 12,993Jul. 2,613 1,429 3,264 315 4,687 197 160 88 199 4 24 48 13,028Aug. 2,625 1,439 3,283 315 4,693 197 160 88 199 4 24 48 13,075Sep. 2,638 1,442 3,285 315 4,693 197 160 88 199 4 24 48 13,093Oct. 2,649 1,444 3,292 317 4,694 197 160 88 199 4 24 48 13,116Nov. 2,661 1,448 3,299 317 4,697 197 160 88 199 4 24 48 13,142Dec. 2,682 1,455 3,315 317 4,710 197 160 88 199 4 24 48 13,1992004Jan. 2,697 1,458 3,333 318 4,727 197 160 88 199 4 24 48 13,253Feb. 2,711 1,458 3,338 318 4,733 197 160 88 199 4 24 48 13,278Mar. 2,732 1,462 3,354 318 4,745 197 160 88 199 4 24 48 13,331Apr. 2,750 1,477 3,382 318 4,776 197 160 88 199 4 24 48 13,423May 2,765 1,483 3,404 319 4,786 197 160 88 199 4 24 48 13,477Jun. 2,785 1,493 3,435 319 4,808 197 160 88 199 4 24 48 13,560
SOURCE: The Central Bank of The Bahamas
5
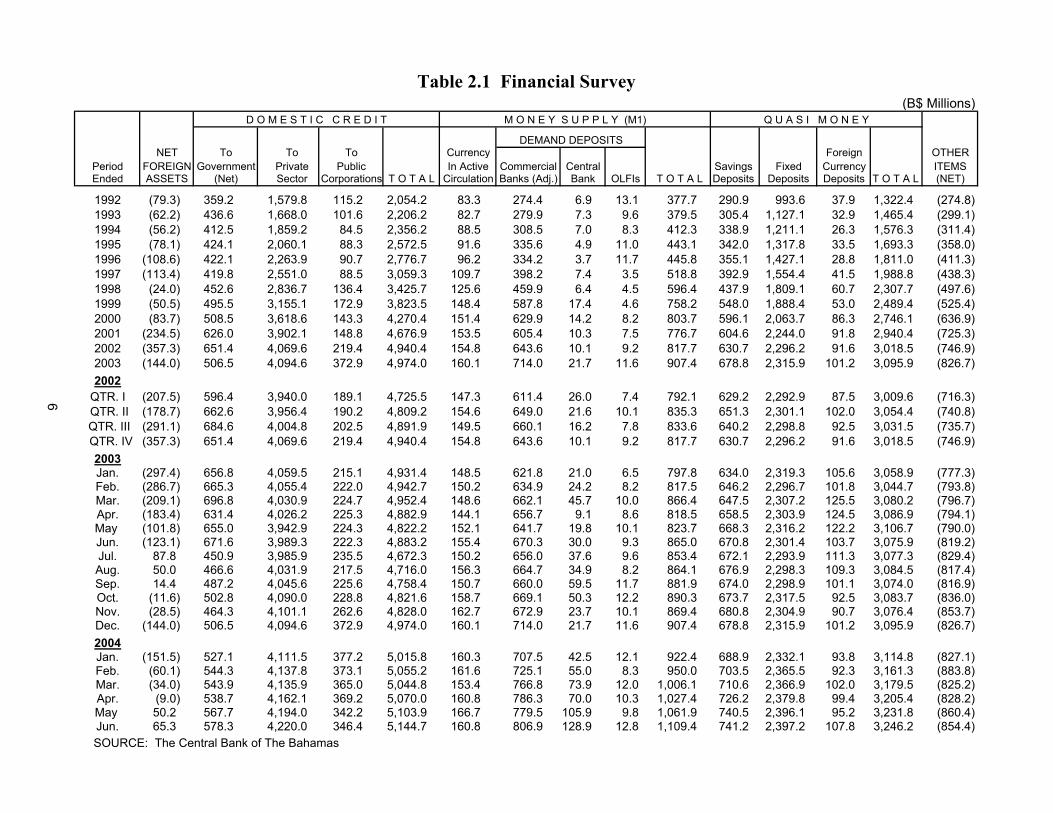
(B$ Millions)D O M E S T I C C R E D I T M O N E Y S U P P L Y (M1) Q U A S I M O N E Y
DEMAND DEPOSITS NET To To To Currency Foreign OTHER
Period FOREIGN Government Private Public In Active Commercial Central Savings Fixed Currency ITEMSEnded ASSETS (Net) Sector Corporations T O T A L Circulation Banks (Adj.) Bank OLFIs T O T A L Deposits Deposits Deposits T O T A L (NET)
1992 (79.3) 359.2 1,579.8 115.2 2,054.2 83.3 274.4 6.9 13.1 377.7 290.9 993.6 37.9 1,322.4 (274.8)1993 (62.2) 436.6 1,668.0 101.6 2,206.2 82.7 279.9 7.3 9.6 379.5 305.4 1,127.1 32.9 1,465.4 (299.1)1994 (56.2) 412.5 1,859.2 84.5 2,356.2 88.5 308.5 7.0 8.3 412.3 338.9 1,211.1 26.3 1,576.3 (311.4)1995 (78.1) 424.1 2,060.1 88.3 2,572.5 91.6 335.6 4.9 11.0 443.1 342.0 1,317.8 33.5 1,693.3 (358.0)1996 (108.6) 422.1 2,263.9 90.7 2,776.7 96.2 334.2 3.7 11.7 445.8 355.1 1,427.1 28.8 1,811.0 (411.3)1997 (113.4) 419.8 2,551.0 88.5 3,059.3 109.7 398.2 7.4 3.5 518.8 392.9 1,554.4 41.5 1,988.8 (438.3)1998 (24.0) 452.6 2,836.7 136.4 3,425.7 125.6 459.9 6.4 4.5 596.4 437.9 1,809.1 60.7 2,307.7 (497.6)1999 (50.5) 495.5 3,155.1 172.9 3,823.5 148.4 587.8 17.4 4.6 758.2 548.0 1,888.4 53.0 2,489.4 (525.4)2000 (83.7) 508.5 3,618.6 143.3 4,270.4 151.4 629.9 14.2 8.2 803.7 596.1 2,063.7 86.3 2,746.1 (636.9)2001 (234.5) 626.0 3,902.1 148.8 4,676.9 153.5 605.4 10.3 7.5 776.7 604.6 2,244.0 91.8 2,940.4 (725.3)2002 (357.3) 651.4 4,069.6 219.4 4,940.4 154.8 643.6 10.1 9.2 817.7 630.7 2,296.2 91.6 3,018.5 (746.9)2003 (144.0) 506.5 4,094.6 372.9 4,974.0 160.1 714.0 21.7 11.6 907.4 678.8 2,315.9 101.2 3,095.9 (826.7)2002
QTR. I (207.5) 596.4 3,940.0 189.1 4,725.5 147.3 611.4 26.0 7.4 792.1 629.2 2,292.9 87.5 3,009.6 (716.3) QTR. II (178.7) 662.6 3,956.4 190.2 4,809.2 154.6 649.0 21.6 10.1 835.3 651.3 2,301.1 102.0 3,054.4 (740.8) QTR. III (291.1) 684.6 4,004.8 202.5 4,891.9 149.5 660.1 16.2 7.8 833.6 640.2 2,298.8 92.5 3,031.5 (735.7) QTR. IV (357.3) 651.4 4,069.6 219.4 4,940.4 154.8 643.6 10.1 9.2 817.7 630.7 2,296.2 91.6 3,018.5 (746.9)
2003Jan. (297.4) 656.8 4,059.5 215.1 4,931.4 148.5 621.8 21.0 6.5 797.8 634.0 2,319.3 105.6 3,058.9 (777.3)Feb. (286.7) 665.3 4,055.4 222.0 4,942.7 150.2 634.9 24.2 8.2 817.5 646.2 2,296.7 101.8 3,044.7 (793.8)Mar. (209.1) 696.8 4,030.9 224.7 4,952.4 148.6 662.1 45.7 10.0 866.4 647.5 2,307.2 125.5 3,080.2 (796.7)Apr. (183.4) 631.4 4,026.2 225.3 4,882.9 144.1 656.7 9.1 8.6 818.5 658.5 2,303.9 124.5 3,086.9 (794.1)May (101.8) 655.0 3,942.9 224.3 4,822.2 152.1 641.7 19.8 10.1 823.7 668.3 2,316.2 122.2 3,106.7 (790.0)Jun. (123.1) 671.6 3,989.3 222.3 4,883.2 155.4 670.3 30.0 9.3 865.0 670.8 2,301.4 103.7 3,075.9 (819.2)Jul. 87.8 450.9 3,985.9 235.5 4,672.3 150.2 656.0 37.6 9.6 853.4 672.1 2,293.9 111.3 3,077.3 (829.4)Aug. 50.0 466.6 4,031.9 217.5 4,716.0 156.3 664.7 34.9 8.2 864.1 676.9 2,298.3 109.3 3,084.5 (817.4)Sep. 14.4 487.2 4,045.6 225.6 4,758.4 150.7 660.0 59.5 11.7 881.9 674.0 2,298.9 101.1 3,074.0 (816.9)Oct. (11.6) 502.8 4,090.0 228.8 4,821.6 158.7 669.1 50.3 12.2 890.3 673.7 2,317.5 92.5 3,083.7 (836.0)Nov. (28.5) 464.3 4,101.1 262.6 4,828.0 162.7 672.9 23.7 10.1 869.4 680.8 2,304.9 90.7 3,076.4 (853.7)Dec. (144.0) 506.5 4,094.6 372.9 4,974.0 160.1 714.0 21.7 11.6 907.4 678.8 2,315.9 101.2 3,095.9 (826.7)2004Jan. (151.5) 527.1 4,111.5 377.2 5,015.8 160.3 707.5 42.5 12.1 922.4 688.9 2,332.1 93.8 3,114.8 (827.1)Feb. (60.1) 544.3 4,137.8 373.1 5,055.2 161.6 725.1 55.0 8.3 950.0 703.5 2,365.5 92.3 3,161.3 (883.8)Mar. (34.0) 543.9 4,135.9 365.0 5,044.8 153.4 766.8 73.9 12.0 1,006.1 710.6 2,366.9 102.0 3,179.5 (825.2)Apr. (9.0) 538.7 4,162.1 369.2 5,070.0 160.8 786.3 70.0 10.3 1,027.4 726.2 2,379.8 99.4 3,205.4 (828.2)May 50.2 567.7 4,194.0 342.2 5,103.9 166.7 779.5 105.9 9.8 1,061.9 740.5 2,396.1 95.2 3,231.8 (860.4)Jun. 65.3 578.3 4,220.0 346.4 5,144.7 160.8 806.9 128.9 12.8 1,109.4 741.2 2,397.2 107.8 3,246.2 (854.4)
SOURCE: The Central Bank of The Bahamas
Table 2.1 Financial Survey
6
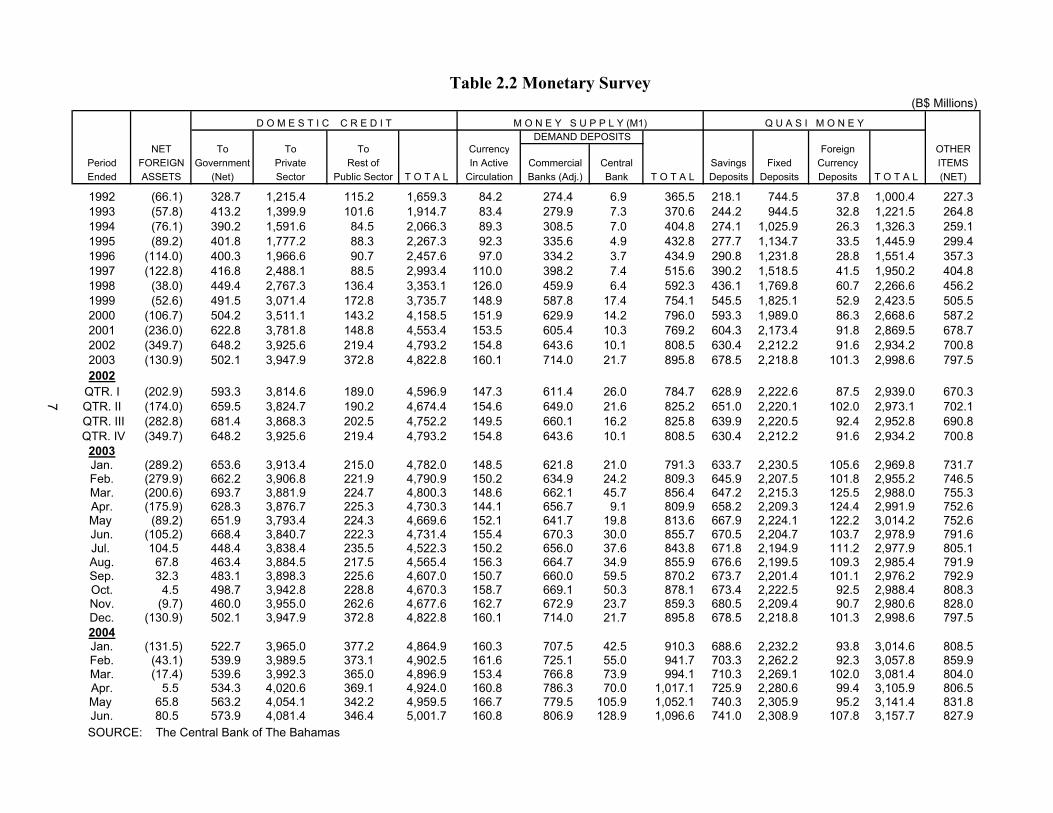
(B$ Millions)D O M E S T I C C R E D I T M O N E Y S U P P L Y (M1) Q U A S I M O N E Y
DEMAND DEPOSITS NET To To To Currency Foreign OTHER
Period FOREIGN Government Private Rest of In Active Commercial Central Savings Fixed Currency ITEMSEnded ASSETS (Net) Sector Public Sector T O T A L Circulation Banks (Adj.) Bank T O T A L Deposits Deposits Deposits T O T A L (NET)
1992 (66.1) 328.7 1,215.4 115.2 1,659.3 84.2 274.4 6.9 365.5 218.1 744.5 37.8 1,000.4 227.31993 (57.8) 413.2 1,399.9 101.6 1,914.7 83.4 279.9 7.3 370.6 244.2 944.5 32.8 1,221.5 264.81994 (76.1) 390.2 1,591.6 84.5 2,066.3 89.3 308.5 7.0 404.8 274.1 1,025.9 26.3 1,326.3 259.11995 (89.2) 401.8 1,777.2 88.3 2,267.3 92.3 335.6 4.9 432.8 277.7 1,134.7 33.5 1,445.9 299.41996 (114.0) 400.3 1,966.6 90.7 2,457.6 97.0 334.2 3.7 434.9 290.8 1,231.8 28.8 1,551.4 357.31997 (122.8) 416.8 2,488.1 88.5 2,993.4 110.0 398.2 7.4 515.6 390.2 1,518.5 41.5 1,950.2 404.81998 (38.0) 449.4 2,767.3 136.4 3,353.1 126.0 459.9 6.4 592.3 436.1 1,769.8 60.7 2,266.6 456.21999 (52.6) 491.5 3,071.4 172.8 3,735.7 148.9 587.8 17.4 754.1 545.5 1,825.1 52.9 2,423.5 505.52000 (106.7) 504.2 3,511.1 143.2 4,158.5 151.9 629.9 14.2 796.0 593.3 1,989.0 86.3 2,668.6 587.22001 (236.0) 622.8 3,781.8 148.8 4,553.4 153.5 605.4 10.3 769.2 604.3 2,173.4 91.8 2,869.5 678.72002 (349.7) 648.2 3,925.6 219.4 4,793.2 154.8 643.6 10.1 808.5 630.4 2,212.2 91.6 2,934.2 700.82003 (130.9) 502.1 3,947.9 372.8 4,822.8 160.1 714.0 21.7 895.8 678.5 2,218.8 101.3 2,998.6 797.52002
QTR. I (202.9) 593.3 3,814.6 189.0 4,596.9 147.3 611.4 26.0 784.7 628.9 2,222.6 87.5 2,939.0 670.3QTR. II (174.0) 659.5 3,824.7 190.2 4,674.4 154.6 649.0 21.6 825.2 651.0 2,220.1 102.0 2,973.1 702.1
QTR. III (282.8) 681.4 3,868.3 202.5 4,752.2 149.5 660.1 16.2 825.8 639.9 2,220.5 92.4 2,952.8 690.8 QTR. IV (349.7) 648.2 3,925.6 219.4 4,793.2 154.8 643.6 10.1 808.5 630.4 2,212.2 91.6 2,934.2 700.8
2003Jan. (289.2) 653.6 3,913.4 215.0 4,782.0 148.5 621.8 21.0 791.3 633.7 2,230.5 105.6 2,969.8 731.7Feb. (279.9) 662.2 3,906.8 221.9 4,790.9 150.2 634.9 24.2 809.3 645.9 2,207.5 101.8 2,955.2 746.5Mar. (200.6) 693.7 3,881.9 224.7 4,800.3 148.6 662.1 45.7 856.4 647.2 2,215.3 125.5 2,988.0 755.3Apr. (175.9) 628.3 3,876.7 225.3 4,730.3 144.1 656.7 9.1 809.9 658.2 2,209.3 124.4 2,991.9 752.6May (89.2) 651.9 3,793.4 224.3 4,669.6 152.1 641.7 19.8 813.6 667.9 2,224.1 122.2 3,014.2 752.6Jun. (105.2) 668.4 3,840.7 222.3 4,731.4 155.4 670.3 30.0 855.7 670.5 2,204.7 103.7 2,978.9 791.6
Jul. 104.5 448.4 3,838.4 235.5 4,522.3 150.2 656.0 37.6 843.8 671.8 2,194.9 111.2 2,977.9 805.1Aug. 67.8 463.4 3,884.5 217.5 4,565.4 156.3 664.7 34.9 855.9 676.6 2,199.5 109.3 2,985.4 791.9Sep. 32.3 483.1 3,898.3 225.6 4,607.0 150.7 660.0 59.5 870.2 673.7 2,201.4 101.1 2,976.2 792.9Oct. 4.5 498.7 3,942.8 228.8 4,670.3 158.7 669.1 50.3 878.1 673.4 2,222.5 92.5 2,988.4 808.3Nov. (9.7) 460.0 3,955.0 262.6 4,677.6 162.7 672.9 23.7 859.3 680.5 2,209.4 90.7 2,980.6 828.0Dec. (130.9) 502.1 3,947.9 372.8 4,822.8 160.1 714.0 21.7 895.8 678.5 2,218.8 101.3 2,998.6 797.52004Jan. (131.5) 522.7 3,965.0 377.2 4,864.9 160.3 707.5 42.5 910.3 688.6 2,232.2 93.8 3,014.6 808.5Feb. (43.1) 539.9 3,989.5 373.1 4,902.5 161.6 725.1 55.0 941.7 703.3 2,262.2 92.3 3,057.8 859.9Mar. (17.4) 539.6 3,992.3 365.0 4,896.9 153.4 766.8 73.9 994.1 710.3 2,269.1 102.0 3,081.4 804.0Apr. 5.5 534.3 4,020.6 369.1 4,924.0 160.8 786.3 70.0 1,017.1 725.9 2,280.6 99.4 3,105.9 806.5May 65.8 563.2 4,054.1 342.2 4,959.5 166.7 779.5 105.9 1,052.1 740.3 2,305.9 95.2 3,141.4 831.8Jun. 80.5 573.9 4,081.4 346.4 5,001.7 160.8 806.9 128.9 1,096.6 741.0 2,308.9 107.8 3,157.7 827.9
SOURCE: The Central Bank of The Bahamas
Table 2.2 Monetary Survey
7
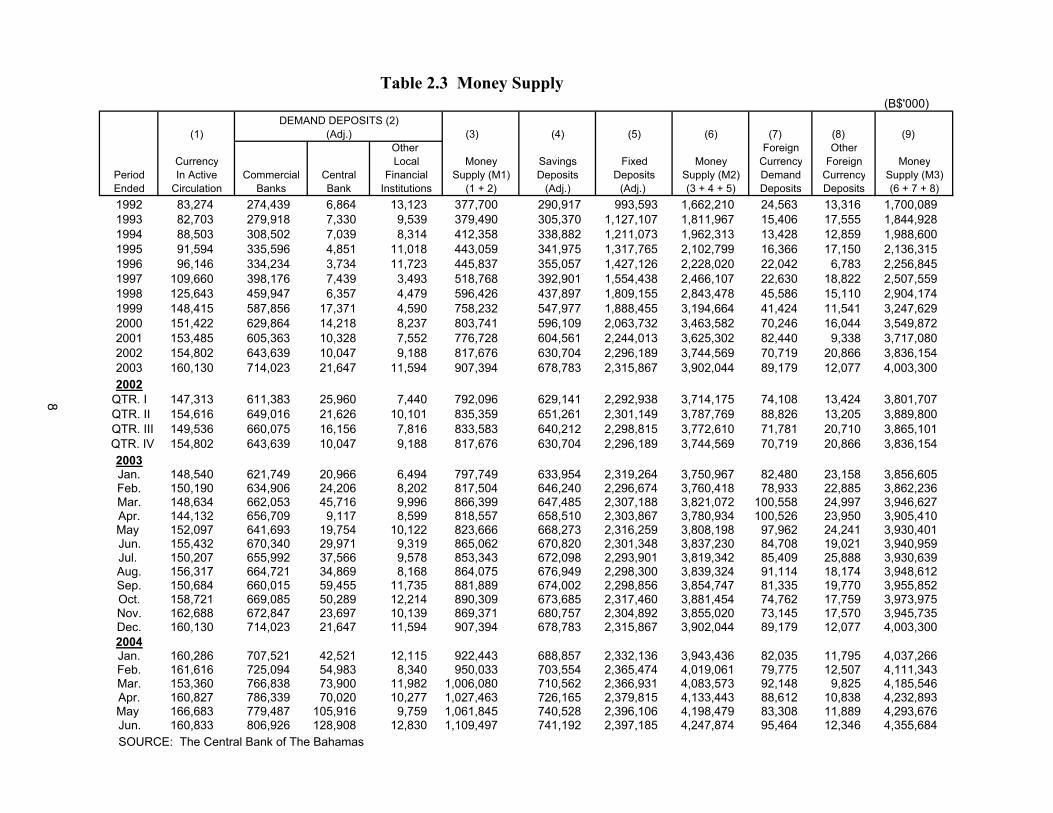
Table 2.3 Money Supply (B$'000)
DEMAND DEPOSITS (2) (1) (Adj.) (3) (4) (5) (6) (7) (8) (9)
Other Foreign Other Currency Local Money Savings Fixed Money Currency Foreign Money
Period In Active Commercial Central Financial Supply (M1) Deposits Deposits Supply (M2) Demand Currency Supply (M3)Ended Circulation Banks Bank Institutions (1 + 2) (Adj.) (Adj.) (3 + 4 + 5) Deposits Deposits (6 + 7 + 8)1992 83,274 274,439 6,864 13,123 377,700 290,917 993,593 1,662,210 24,563 13,316 1,700,0891993 82,703 279,918 7,330 9,539 379,490 305,370 1,127,107 1,811,967 15,406 17,555 1,844,9281994 88,503 308,502 7,039 8,314 412,358 338,882 1,211,073 1,962,313 13,428 12,859 1,988,6001995 91,594 335,596 4,851 11,018 443,059 341,975 1,317,765 2,102,799 16,366 17,150 2,136,3151996 96,146 334,234 3,734 11,723 445,837 355,057 1,427,126 2,228,020 22,042 6,783 2,256,8451997 109,660 398,176 7,439 3,493 518,768 392,901 1,554,438 2,466,107 22,630 18,822 2,507,5591998 125,643 459,947 6,357 4,479 596,426 437,897 1,809,155 2,843,478 45,586 15,110 2,904,1741999 148,415 587,856 17,371 4,590 758,232 547,977 1,888,455 3,194,664 41,424 11,541 3,247,6292000 151,422 629,864 14,218 8,237 803,741 596,109 2,063,732 3,463,582 70,246 16,044 3,549,8722001 153,485 605,363 10,328 7,552 776,728 604,561 2,244,013 3,625,302 82,440 9,338 3,717,0802002 154,802 643,639 10,047 9,188 817,676 630,704 2,296,189 3,744,569 70,719 20,866 3,836,1542003 160,130 714,023 21,647 11,594 907,394 678,783 2,315,867 3,902,044 89,179 12,077 4,003,3002002
QTR. I 147,313 611,383 25,960 7,440 792,096 629,141 2,292,938 3,714,175 74,108 13,424 3,801,707 QTR. II 154,616 649,016 21,626 10,101 835,359 651,261 2,301,149 3,787,769 88,826 13,205 3,889,800
QTR. III 149,536 660,075 16,156 7,816 833,583 640,212 2,298,815 3,772,610 71,781 20,710 3,865,101 QTR. IV 154,802 643,639 10,047 9,188 817,676 630,704 2,296,189 3,744,569 70,719 20,866 3,836,154
2003Jan. 148,540 621,749 20,966 6,494 797,749 633,954 2,319,264 3,750,967 82,480 23,158 3,856,605Feb. 150,190 634,906 24,206 8,202 817,504 646,240 2,296,674 3,760,418 78,933 22,885 3,862,236Mar. 148,634 662,053 45,716 9,996 866,399 647,485 2,307,188 3,821,072 100,558 24,997 3,946,627Apr. 144,132 656,709 9,117 8,599 818,557 658,510 2,303,867 3,780,934 100,526 23,950 3,905,410May 152,097 641,693 19,754 10,122 823,666 668,273 2,316,259 3,808,198 97,962 24,241 3,930,401
Jun. 155,432 670,340 29,971 9,319 865,062 670,820 2,301,348 3,837,230 84,708 19,021 3,940,959 Jul. 150,207 655,992 37,566 9,578 853,343 672,098 2,293,901 3,819,342 85,409 25,888 3,930,639
Aug. 156,317 664,721 34,869 8,168 864,075 676,949 2,298,300 3,839,324 91,114 18,174 3,948,612Sep. 150,684 660,015 59,455 11,735 881,889 674,002 2,298,856 3,854,747 81,335 19,770 3,955,852Oct. 158,721 669,085 50,289 12,214 890,309 673,685 2,317,460 3,881,454 74,762 17,759 3,973,975Nov. 162,688 672,847 23,697 10,139 869,371 680,757 2,304,892 3,855,020 73,145 17,570 3,945,735Dec. 160,130 714,023 21,647 11,594 907,394 678,783 2,315,867 3,902,044 89,179 12,077 4,003,3002004Jan. 160,286 707,521 42,521 12,115 922,443 688,857 2,332,136 3,943,436 82,035 11,795 4,037,266Feb. 161,616 725,094 54,983 8,340 950,033 703,554 2,365,474 4,019,061 79,775 12,507 4,111,343Mar. 153,360 766,838 73,900 11,982 1,006,080 710,562 2,366,931 4,083,573 92,148 9,825 4,185,546Apr. 160,827 786,339 70,020 10,277 1,027,463 726,165 2,379,815 4,133,443 88,612 10,838 4,232,893May 166,683 779,487 105,916 9,759 1,061,845 740,528 2,396,106 4,198,479 83,308 11,889 4,293,676
Jun. 160,833 806,926 128,908 12,830 1,109,497 741,192 2,397,185 4,247,874 95,464 12,346 4,355,684 SOURCE: The Central Bank of The Bahamas
8
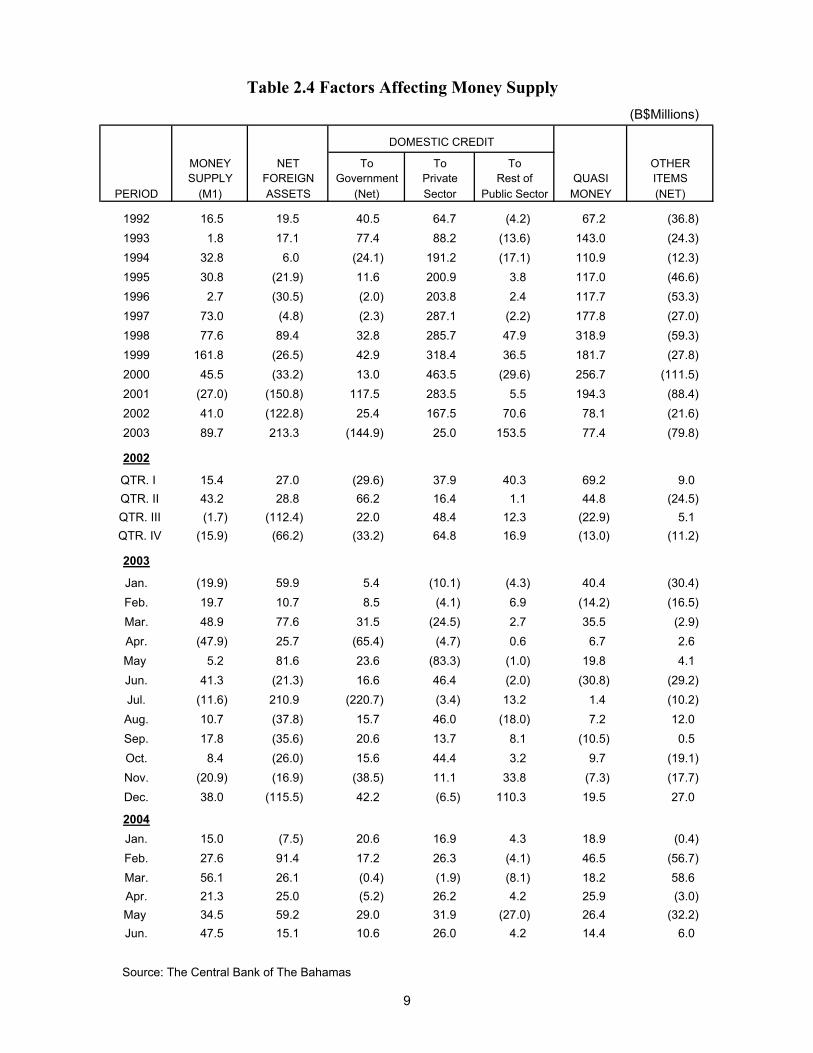
(B$Millions)
DOMESTIC CREDIT
MONEY NET To To To OTHERSUPPLY FOREIGN Government Private Rest of QUASI ITEMS
PERIOD (M1) ASSETS (Net) Sector Public Sector MONEY (NET)
1992 16.5 19.5 40.5 64.7 (4.2) 67.2 (36.8)1993 1.8 17.1 77.4 88.2 (13.6) 143.0 (24.3)1994 32.8 6.0 (24.1) 191.2 (17.1) 110.9 (12.3)1995 30.8 (21.9) 11.6 200.9 3.8 117.0 (46.6)1996 2.7 (30.5) (2.0) 203.8 2.4 117.7 (53.3)1997 73.0 (4.8) (2.3) 287.1 (2.2) 177.8 (27.0)1998 77.6 89.4 32.8 285.7 47.9 318.9 (59.3)1999 161.8 (26.5) 42.9 318.4 36.5 181.7 (27.8)2000 45.5 (33.2) 13.0 463.5 (29.6) 256.7 (111.5)2001 (27.0) (150.8) 117.5 283.5 5.5 194.3 (88.4)2002 41.0 (122.8) 25.4 167.5 70.6 78.1 (21.6)2003 89.7 213.3 (144.9) 25.0 153.5 77.4 (79.8)
2002
QTR. I 15.4 27.0 (29.6) 37.9 40.3 69.2 9.0 QTR. II 43.2 28.8 66.2 16.4 1.1 44.8 (24.5) QTR. III (1.7) (112.4) 22.0 48.4 12.3 (22.9) 5.1 QTR. IV (15.9) (66.2) (33.2) 64.8 16.9 (13.0) (11.2)
2003
Jan. (19.9) 59.9 5.4 (10.1) (4.3) 40.4 (30.4)Feb. 19.7 10.7 8.5 (4.1) 6.9 (14.2) (16.5)Mar. 48.9 77.6 31.5 (24.5) 2.7 35.5 (2.9)Apr. (47.9) 25.7 (65.4) (4.7) 0.6 6.7 2.6May 5.2 81.6 23.6 (83.3) (1.0) 19.8 4.1Jun. 41.3 (21.3) 16.6 46.4 (2.0) (30.8) (29.2)Jul. (11.6) 210.9 (220.7) (3.4) 13.2 1.4 (10.2)Aug. 10.7 (37.8) 15.7 46.0 (18.0) 7.2 12.0Sep. 17.8 (35.6) 20.6 13.7 8.1 (10.5) 0.5Oct. 8.4 (26.0) 15.6 44.4 3.2 9.7 (19.1)Nov. (20.9) (16.9) (38.5) 11.1 33.8 (7.3) (17.7)Dec. 38.0 (115.5) 42.2 (6.5) 110.3 19.5 27.0
2004Jan. 15.0 (7.5) 20.6 16.9 4.3 18.9 (0.4)Feb. 27.6 91.4 17.2 26.3 (4.1) 46.5 (56.7)Mar. 56.1 26.1 (0.4) (1.9) (8.1) 18.2 58.6Apr. 21.3 25.0 (5.2) 26.2 4.2 25.9 (3.0)May 34.5 59.2 29.0 31.9 (27.0) 26.4 (32.2)Jun. 47.5 15.1 10.6 26.0 4.2 14.4 6.0
Source: The Central Bank of The Bahamas
Table 2.4 Factors Affecting Money Supply
9
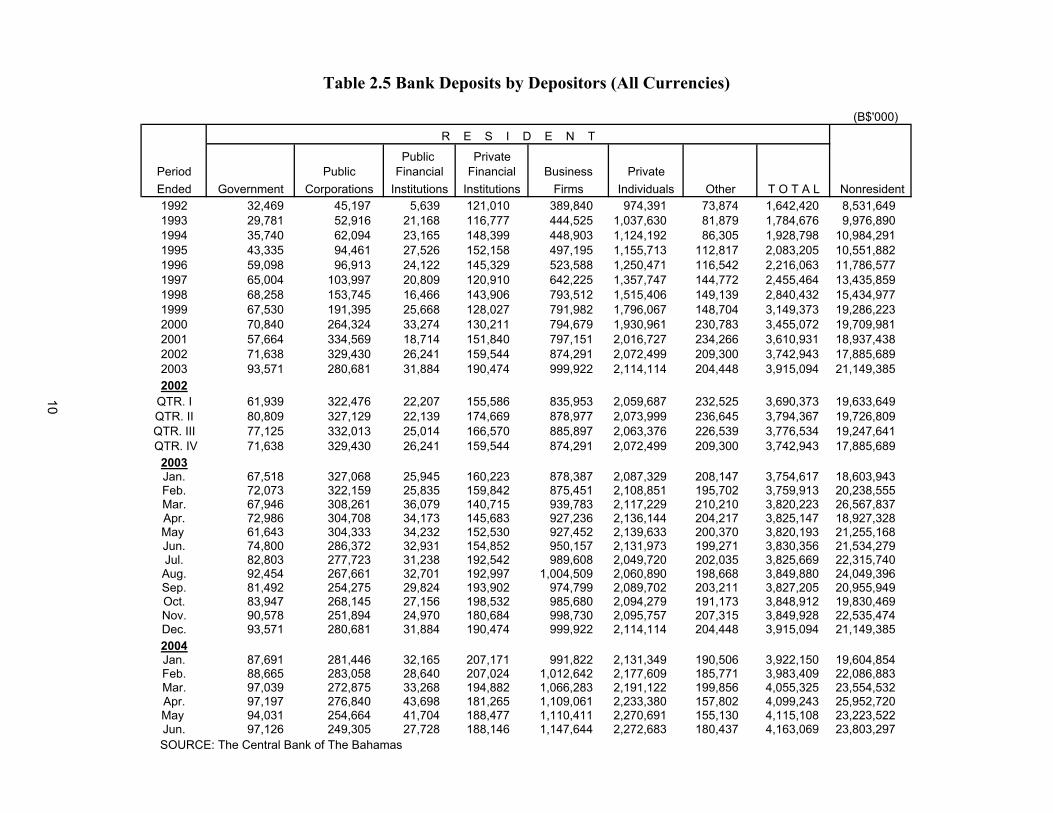
(B$'000)R E S I D E N T
Public PrivatePeriod Public Financial Financial Business Private Ended Government Corporations Institutions Institutions Firms Individuals Other T O T A L Nonresident1992 32,469 45,197 5,639 121,010 389,840 974,391 73,874 1,642,420 8,531,6491993 29,781 52,916 21,168 116,777 444,525 1,037,630 81,879 1,784,676 9,976,8901994 35,740 62,094 23,165 148,399 448,903 1,124,192 86,305 1,928,798 10,984,2911995 43,335 94,461 27,526 152,158 497,195 1,155,713 112,817 2,083,205 10,551,8821996 59,098 96,913 24,122 145,329 523,588 1,250,471 116,542 2,216,063 11,786,5771997 65,004 103,997 20,809 120,910 642,225 1,357,747 144,772 2,455,464 13,435,8591998 68,258 153,745 16,466 143,906 793,512 1,515,406 149,139 2,840,432 15,434,9771999 67,530 191,395 25,668 128,027 791,982 1,796,067 148,704 3,149,373 19,286,2232000 70,840 264,324 33,274 130,211 794,679 1,930,961 230,783 3,455,072 19,709,9812001 57,664 334,569 18,714 151,840 797,151 2,016,727 234,266 3,610,931 18,937,4382002 71,638 329,430 26,241 159,544 874,291 2,072,499 209,300 3,742,943 17,885,6892003 93,571 280,681 31,884 190,474 999,922 2,114,114 204,448 3,915,094 21,149,3852002
QTR. I 61,939 322,476 22,207 155,586 835,953 2,059,687 232,525 3,690,373 19,633,649QTR. II 80,809 327,129 22,139 174,669 878,977 2,073,999 236,645 3,794,367 19,726,809QTR. III 77,125 332,013 25,014 166,570 885,897 2,063,376 226,539 3,776,534 19,247,641 QTR. IV 71,638 329,430 26,241 159,544 874,291 2,072,499 209,300 3,742,943 17,885,689
2003Jan. 67,518 327,068 25,945 160,223 878,387 2,087,329 208,147 3,754,617 18,603,943Feb. 72,073 322,159 25,835 159,842 875,451 2,108,851 195,702 3,759,913 20,238,555Mar. 67,946 308,261 36,079 140,715 939,783 2,117,229 210,210 3,820,223 26,567,837Apr. 72,986 304,708 34,173 145,683 927,236 2,136,144 204,217 3,825,147 18,927,328May 61,643 304,333 34,232 152,530 927,452 2,139,633 200,370 3,820,193 21,255,168Jun. 74,800 286,372 32,931 154,852 950,157 2,131,973 199,271 3,830,356 21,534,279Jul. 82,803 277,723 31,238 192,542 989,608 2,049,720 202,035 3,825,669 22,315,740Aug. 92,454 267,661 32,701 192,997 1,004,509 2,060,890 198,668 3,849,880 24,049,396Sep. 81,492 254,275 29,824 193,902 974,799 2,089,702 203,211 3,827,205 20,955,949Oct. 83,947 268,145 27,156 198,532 985,680 2,094,279 191,173 3,848,912 19,830,469Nov. 90,578 251,894 24,970 180,684 998,730 2,095,757 207,315 3,849,928 22,535,474Dec. 93,571 280,681 31,884 190,474 999,922 2,114,114 204,448 3,915,094 21,149,3852004Jan. 87,691 281,446 32,165 207,171 991,822 2,131,349 190,506 3,922,150 19,604,854Feb. 88,665 283,058 28,640 207,024 1,012,642 2,177,609 185,771 3,983,409 22,086,883Mar. 97,039 272,875 33,268 194,882 1,066,283 2,191,122 199,856 4,055,325 23,554,532Apr. 97,197 276,840 43,698 181,265 1,109,061 2,233,380 157,802 4,099,243 25,952,720May 94,031 254,664 41,704 188,477 1,110,411 2,270,691 155,130 4,115,108 23,223,522Jun. 97,126 249,305 27,728 188,146 1,147,644 2,272,683 180,437 4,163,069 23,803,297
SOURCE: The Central Bank of The Bahamas
Table 2.5 Bank Deposits by Depositors (All Currencies)
10
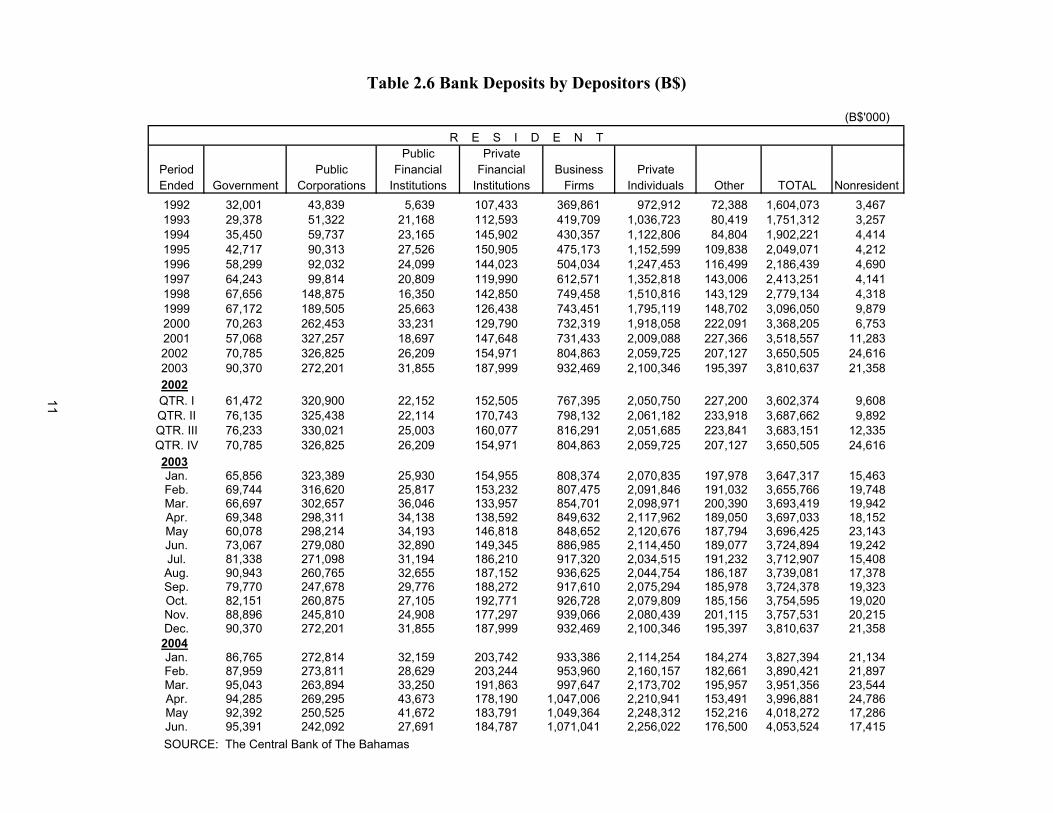
(B$'000)
R E S I D E N TPublic Private
Period Public Financial Financial Business PrivateEnded Government Corporations Institutions Institutions Firms Individuals Other TOTAL Nonresident1992 32,001 43,839 5,639 107,433 369,861 972,912 72,388 1,604,073 3,4671993 29,378 51,322 21,168 112,593 419,709 1,036,723 80,419 1,751,312 3,2571994 35,450 59,737 23,165 145,902 430,357 1,122,806 84,804 1,902,221 4,4141995 42,717 90,313 27,526 150,905 475,173 1,152,599 109,838 2,049,071 4,2121996 58,299 92,032 24,099 144,023 504,034 1,247,453 116,499 2,186,439 4,6901997 64,243 99,814 20,809 119,990 612,571 1,352,818 143,006 2,413,251 4,1411998 67,656 148,875 16,350 142,850 749,458 1,510,816 143,129 2,779,134 4,3181999 67,172 189,505 25,663 126,438 743,451 1,795,119 148,702 3,096,050 9,8792000 70,263 262,453 33,231 129,790 732,319 1,918,058 222,091 3,368,205 6,7532001 57,068 327,257 18,697 147,648 731,433 2,009,088 227,366 3,518,557 11,2832002 70,785 326,825 26,209 154,971 804,863 2,059,725 207,127 3,650,505 24,6162003 90,370 272,201 31,855 187,999 932,469 2,100,346 195,397 3,810,637 21,3582002QTR. I 61,472 320,900 22,152 152,505 767,395 2,050,750 227,200 3,602,374 9,608QTR. II 76,135 325,438 22,114 170,743 798,132 2,061,182 233,918 3,687,662 9,892QTR. III 76,233 330,021 25,003 160,077 816,291 2,051,685 223,841 3,683,151 12,335QTR. IV 70,785 326,825 26,209 154,971 804,863 2,059,725 207,127 3,650,505 24,6162003Jan. 65,856 323,389 25,930 154,955 808,374 2,070,835 197,978 3,647,317 15,463Feb. 69,744 316,620 25,817 153,232 807,475 2,091,846 191,032 3,655,766 19,748Mar. 66,697 302,657 36,046 133,957 854,701 2,098,971 200,390 3,693,419 19,942Apr. 69,348 298,311 34,138 138,592 849,632 2,117,962 189,050 3,697,033 18,152May 60,078 298,214 34,193 146,818 848,652 2,120,676 187,794 3,696,425 23,143Jun. 73,067 279,080 32,890 149,345 886,985 2,114,450 189,077 3,724,894 19,242Jul. 81,338 271,098 31,194 186,210 917,320 2,034,515 191,232 3,712,907 15,408Aug. 90,943 260,765 32,655 187,152 936,625 2,044,754 186,187 3,739,081 17,378Sep. 79,770 247,678 29,776 188,272 917,610 2,075,294 185,978 3,724,378 19,323Oct. 82,151 260,875 27,105 192,771 926,728 2,079,809 185,156 3,754,595 19,020Nov. 88,896 245,810 24,908 177,297 939,066 2,080,439 201,115 3,757,531 20,215Dec. 90,370 272,201 31,855 187,999 932,469 2,100,346 195,397 3,810,637 21,3582004Jan. 86,765 272,814 32,159 203,742 933,386 2,114,254 184,274 3,827,394 21,134Feb. 87,959 273,811 28,629 203,244 953,960 2,160,157 182,661 3,890,421 21,897Mar. 95,043 263,894 33,250 191,863 997,647 2,173,702 195,957 3,951,356 23,544Apr. 94,285 269,295 43,673 178,190 1,047,006 2,210,941 153,491 3,996,881 24,786May 92,392 250,525 41,672 183,791 1,049,364 2,248,312 152,216 4,018,272 17,286Jun. 95,391 242,092 27,691 184,787 1,071,041 2,256,022 176,500 4,053,524 17,415
SOURCE: The Central Bank of The Bahamas
Table 2.6 Bank Deposits by Depositors (B$)
11
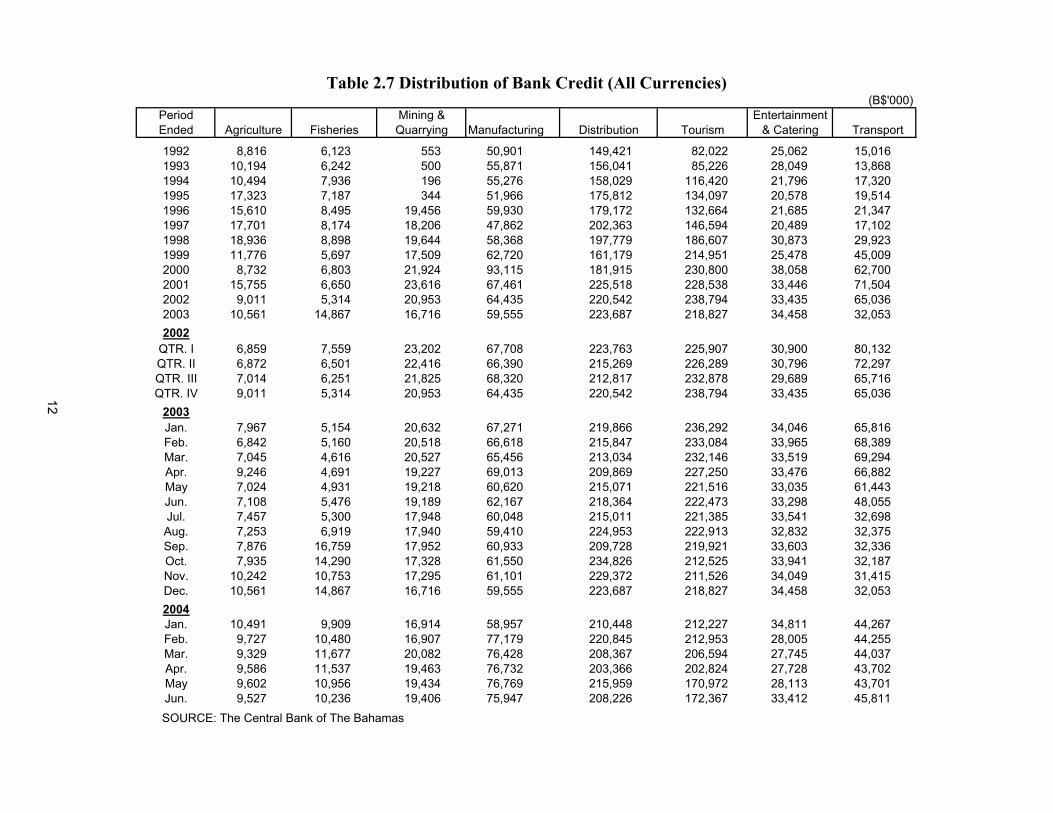
(B$'000)Period Mining & EntertainmentEnded Agriculture Fisheries Quarrying Manufacturing Distribution Tourism & Catering Transport
1992 8,816 6,123 553 50,901 149,421 82,022 25,062 15,0161993 10,194 6,242 500 55,871 156,041 85,226 28,049 13,8681994 10,494 7,936 196 55,276 158,029 116,420 21,796 17,3201995 17,323 7,187 344 51,966 175,812 134,097 20,578 19,5141996 15,610 8,495 19,456 59,930 179,172 132,664 21,685 21,3471997 17,701 8,174 18,206 47,862 202,363 146,594 20,489 17,1021998 18,936 8,898 19,644 58,368 197,779 186,607 30,873 29,9231999 11,776 5,697 17,509 62,720 161,179 214,951 25,478 45,0092000 8,732 6,803 21,924 93,115 181,915 230,800 38,058 62,7002001 15,755 6,650 23,616 67,461 225,518 228,538 33,446 71,5042002 9,011 5,314 20,953 64,435 220,542 238,794 33,435 65,0362003 10,561 14,867 16,716 59,555 223,687 218,827 34,458 32,0532002
QTR. I 6,859 7,559 23,202 67,708 223,763 225,907 30,900 80,132QTR. II 6,872 6,501 22,416 66,390 215,269 226,289 30,796 72,297QTR. III 7,014 6,251 21,825 68,320 212,817 232,878 29,689 65,716QTR. IV 9,011 5,314 20,953 64,435 220,542 238,794 33,435 65,036
2003Jan. 7,967 5,154 20,632 67,271 219,866 236,292 34,046 65,816Feb. 6,842 5,160 20,518 66,618 215,847 233,084 33,965 68,389Mar. 7,045 4,616 20,527 65,456 213,034 232,146 33,519 69,294Apr. 9,246 4,691 19,227 69,013 209,869 227,250 33,476 66,882May 7,024 4,931 19,218 60,620 215,071 221,516 33,035 61,443Jun. 7,108 5,476 19,189 62,167 218,364 222,473 33,298 48,055Jul. 7,457 5,300 17,948 60,048 215,011 221,385 33,541 32,698Aug. 7,253 6,919 17,940 59,410 224,953 222,913 32,832 32,375Sep. 7,876 16,759 17,952 60,933 209,728 219,921 33,603 32,336Oct. 7,935 14,290 17,328 61,550 234,826 212,525 33,941 32,187Nov. 10,242 10,753 17,295 61,101 229,372 211,526 34,049 31,415Dec. 10,561 14,867 16,716 59,555 223,687 218,827 34,458 32,0532004Jan. 10,491 9,909 16,914 58,957 210,448 212,227 34,811 44,267Feb. 9,727 10,480 16,907 77,179 220,845 212,953 28,005 44,255Mar. 9,329 11,677 20,082 76,428 208,367 206,594 27,745 44,037Apr. 9,586 11,537 19,463 76,732 203,366 202,824 27,728 43,702May 9,602 10,956 19,434 76,769 215,959 170,972 28,113 43,701Jun. 9,527 10,236 19,406 75,947 208,226 172,367 33,412 45,811
SOURCE: The Central Bank of The Bahamas
Table 2.7 Distribution of Bank Credit (All Currencies)
12
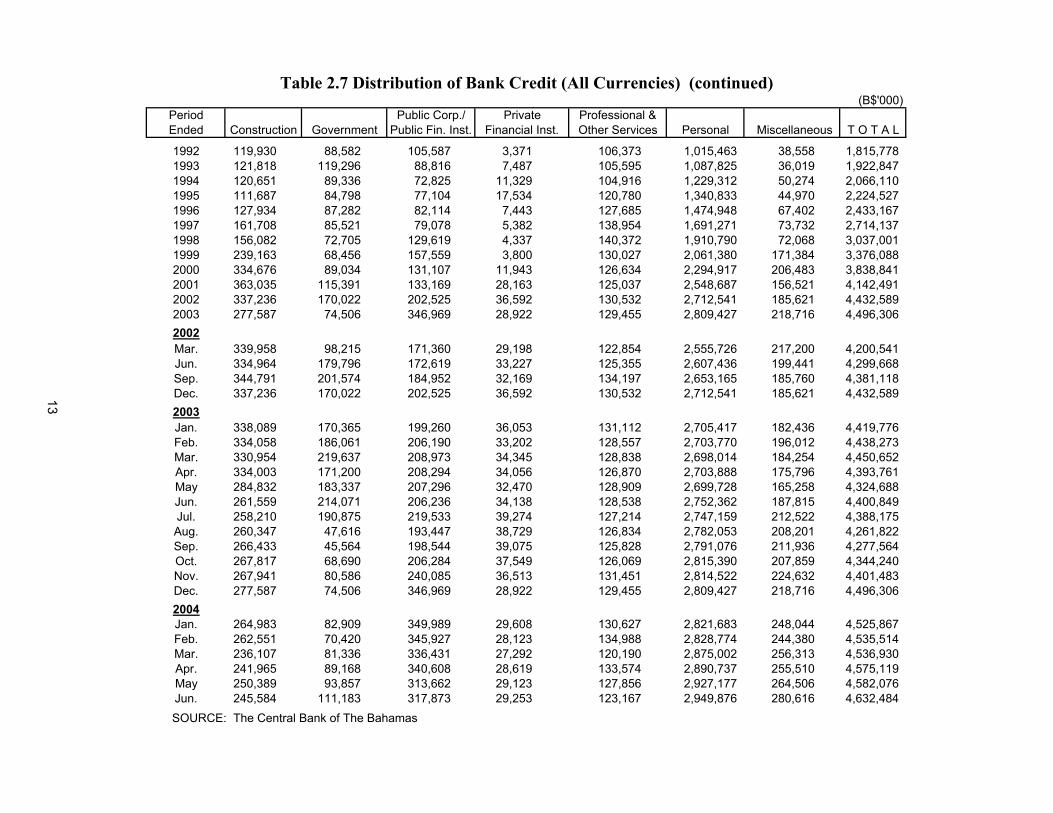
(B$'000)Period Public Corp./ Private Professional &Ended Construction Government Public Fin. Inst. Financial Inst. Other Services Personal Miscellaneous T O T A L
1992 119,930 88,582 105,587 3,371 106,373 1,015,463 38,558 1,815,7781993 121,818 119,296 88,816 7,487 105,595 1,087,825 36,019 1,922,8471994 120,651 89,336 72,825 11,329 104,916 1,229,312 50,274 2,066,1101995 111,687 84,798 77,104 17,534 120,780 1,340,833 44,970 2,224,5271996 127,934 87,282 82,114 7,443 127,685 1,474,948 67,402 2,433,1671997 161,708 85,521 79,078 5,382 138,954 1,691,271 73,732 2,714,1371998 156,082 72,705 129,619 4,337 140,372 1,910,790 72,068 3,037,0011999 239,163 68,456 157,559 3,800 130,027 2,061,380 171,384 3,376,0882000 334,676 89,034 131,107 11,943 126,634 2,294,917 206,483 3,838,8412001 363,035 115,391 133,169 28,163 125,037 2,548,687 156,521 4,142,4912002 337,236 170,022 202,525 36,592 130,532 2,712,541 185,621 4,432,5892003 277,587 74,506 346,969 28,922 129,455 2,809,427 218,716 4,496,3062002Mar. 339,958 98,215 171,360 29,198 122,854 2,555,726 217,200 4,200,541Jun. 334,964 179,796 172,619 33,227 125,355 2,607,436 199,441 4,299,668Sep. 344,791 201,574 184,952 32,169 134,197 2,653,165 185,760 4,381,118Dec. 337,236 170,022 202,525 36,592 130,532 2,712,541 185,621 4,432,5892003Jan. 338,089 170,365 199,260 36,053 131,112 2,705,417 182,436 4,419,776Feb. 334,058 186,061 206,190 33,202 128,557 2,703,770 196,012 4,438,273Mar. 330,954 219,637 208,973 34,345 128,838 2,698,014 184,254 4,450,652Apr. 334,003 171,200 208,294 34,056 126,870 2,703,888 175,796 4,393,761May 284,832 183,337 207,296 32,470 128,909 2,699,728 165,258 4,324,688Jun. 261,559 214,071 206,236 34,138 128,538 2,752,362 187,815 4,400,849Jul. 258,210 190,875 219,533 39,274 127,214 2,747,159 212,522 4,388,175Aug. 260,347 47,616 193,447 38,729 126,834 2,782,053 208,201 4,261,822Sep. 266,433 45,564 198,544 39,075 125,828 2,791,076 211,936 4,277,564Oct. 267,817 68,690 206,284 37,549 126,069 2,815,390 207,859 4,344,240Nov. 267,941 80,586 240,085 36,513 131,451 2,814,522 224,632 4,401,483Dec. 277,587 74,506 346,969 28,922 129,455 2,809,427 218,716 4,496,3062004Jan. 264,983 82,909 349,989 29,608 130,627 2,821,683 248,044 4,525,867Feb. 262,551 70,420 345,927 28,123 134,988 2,828,774 244,380 4,535,514Mar. 236,107 81,336 336,431 27,292 120,190 2,875,002 256,313 4,536,930Apr. 241,965 89,168 340,608 28,619 133,574 2,890,737 255,510 4,575,119May 250,389 93,857 313,662 29,123 127,856 2,927,177 264,506 4,582,076Jun. 245,584 111,183 317,873 29,253 123,167 2,949,876 280,616 4,632,484
SOURCE: The Central Bank of The Bahamas
Table 2.7 Distribution of Bank Credit (All Currencies) (continued)
13
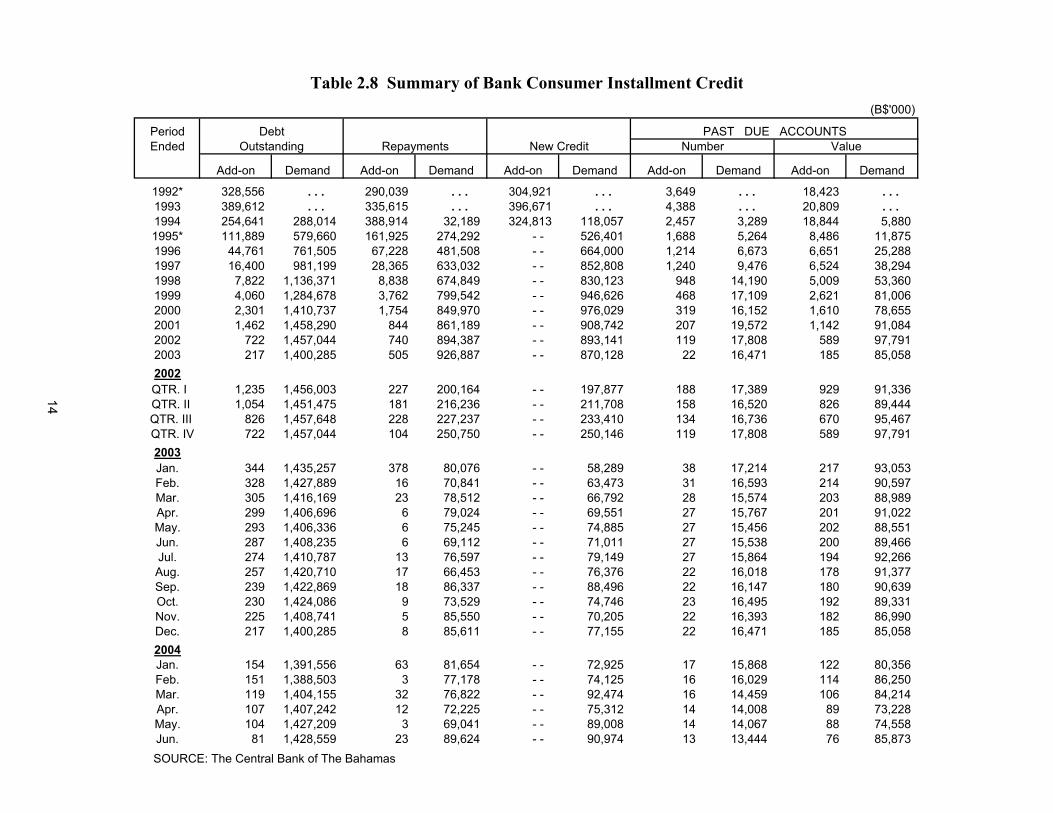
Table 2.8 Summary of Bank Consumer Installment Credit(B$'000)
Period Debt PAST DUE ACCOUNTSEnded Outstanding Repayments New Credit Number Value
Add-on Demand Add-on Demand Add-on Demand Add-on Demand Add-on Demand
1992* 328,556 . . . 290,039 . . . 304,921 . . . 3,649 . . . 18,423 . . .1993 389,612 . . . 335,615 . . . 396,671 . . . 4,388 . . . 20,809 . . .1994 254,641 288,014 388,914 32,189 324,813 118,057 2,457 3,289 18,844 5,8801995* 111,889 579,660 161,925 274,292 - - 526,401 1,688 5,264 8,486 11,8751996 44,761 761,505 67,228 481,508 - - 664,000 1,214 6,673 6,651 25,2881997 16,400 981,199 28,365 633,032 - - 852,808 1,240 9,476 6,524 38,2941998 7,822 1,136,371 8,838 674,849 - - 830,123 948 14,190 5,009 53,3601999 4,060 1,284,678 3,762 799,542 - - 946,626 468 17,109 2,621 81,0062000 2,301 1,410,737 1,754 849,970 - - 976,029 319 16,152 1,610 78,6552001 1,462 1,458,290 844 861,189 - - 908,742 207 19,572 1,142 91,0842002 722 1,457,044 740 894,387 - - 893,141 119 17,808 589 97,7912003 217 1,400,285 505 926,887 - - 870,128 22 16,471 185 85,0582002
QTR. I 1,235 1,456,003 227 200,164 - - 197,877 188 17,389 929 91,336 QTR. II 1,054 1,451,475 181 216,236 - - 211,708 158 16,520 826 89,444 QTR. III 826 1,457,648 228 227,237 - - 233,410 134 16,736 670 95,467 QTR. IV 722 1,457,044 104 250,750 - - 250,146 119 17,808 589 97,791
2003Jan. 344 1,435,257 378 80,076 - - 58,289 38 17,214 217 93,053Feb. 328 1,427,889 16 70,841 - - 63,473 31 16,593 214 90,597Mar. 305 1,416,169 23 78,512 - - 66,792 28 15,574 203 88,989Apr. 299 1,406,696 6 79,024 - - 69,551 27 15,767 201 91,022May. 293 1,406,336 6 75,245 - - 74,885 27 15,456 202 88,551Jun. 287 1,408,235 6 69,112 - - 71,011 27 15,538 200 89,466Jul. 274 1,410,787 13 76,597 - - 79,149 27 15,864 194 92,266Aug. 257 1,420,710 17 66,453 - - 76,376 22 16,018 178 91,377Sep. 239 1,422,869 18 86,337 - - 88,496 22 16,147 180 90,639Oct. 230 1,424,086 9 73,529 - - 74,746 23 16,495 192 89,331Nov. 225 1,408,741 5 85,550 - - 70,205 22 16,393 182 86,990Dec. 217 1,400,285 8 85,611 - - 77,155 22 16,471 185 85,0582004Jan. 154 1,391,556 63 81,654 - - 72,925 17 15,868 122 80,356Feb. 151 1,388,503 3 77,178 - - 74,125 16 16,029 114 86,250Mar. 119 1,404,155 32 76,822 - - 92,474 16 14,459 106 84,214Apr. 107 1,407,242 12 72,225 - - 75,312 14 14,008 89 73,228May. 104 1,427,209 3 69,041 - - 89,008 14 14,067 88 74,558Jun. 81 1,428,559 23 89,624 - - 90,974 13 13,444 76 85,873
SOURCE: The Central Bank of The Bahamas
14
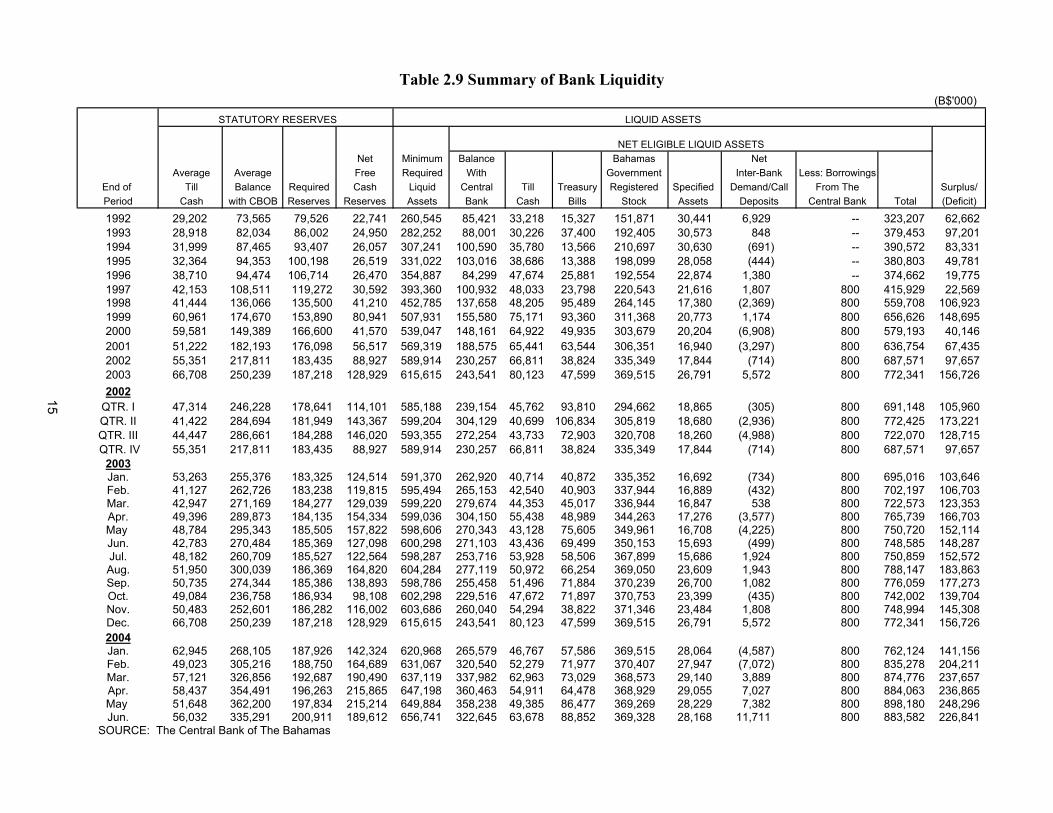
(B$'000)STATUTORY RESERVES LIQUID ASSETS
NET ELIGIBLE LIQUID ASSETSNet Minimum Balance Bahamas Net
Average Average Free Required With Government Inter-Bank Less: BorrowingsEnd of Till Balance Required Cash Liquid Central Till Treasury Registered Specified Demand/Call From The Surplus/Period Cash with CBOB Reserves Reserves Assets Bank Cash Bills Stock Assets Deposits Central Bank Total (Deficit)
1992 29,202 73,565 79,526 22,741 260,545 85,421 33,218 15,327 151,871 30,441 6,929 -- 323,207 62,6621993 28,918 82,034 86,002 24,950 282,252 88,001 30,226 37,400 192,405 30,573 848 -- 379,453 97,2011994 31,999 87,465 93,407 26,057 307,241 100,590 35,780 13,566 210,697 30,630 (691) -- 390,572 83,3311995 32,364 94,353 100,198 26,519 331,022 103,016 38,686 13,388 198,099 28,058 (444) -- 380,803 49,7811996 38,710 94,474 106,714 26,470 354,887 84,299 47,674 25,881 192,554 22,874 1,380 -- 374,662 19,7751997 42,153 108,511 119,272 30,592 393,360 100,932 48,033 23,798 220,543 21,616 1,807 800 415,929 22,5691998 41,444 136,066 135,500 41,210 452,785 137,658 48,205 95,489 264,145 17,380 (2,369) 800 559,708 106,9231999 60,961 174,670 153,890 80,941 507,931 155,580 75,171 93,360 311,368 20,773 1,174 800 656,626 148,6952000 59,581 149,389 166,600 41,570 539,047 148,161 64,922 49,935 303,679 20,204 (6,908) 800 579,193 40,1462001 51,222 182,193 176,098 56,517 569,319 188,575 65,441 63,544 306,351 16,940 (3,297) 800 636,754 67,4352002 55,351 217,811 183,435 88,927 589,914 230,257 66,811 38,824 335,349 17,844 (714) 800 687,571 97,6572003 66,708 250,239 187,218 128,929 615,615 243,541 80,123 47,599 369,515 26,791 5,572 800 772,341 156,7262002
QTR. I 47,314 246,228 178,641 114,101 585,188 239,154 45,762 93,810 294,662 18,865 (305) 800 691,148 105,960QTR. II 41,422 284,694 181,949 143,367 599,204 304,129 40,699 106,834 305,819 18,680 (2,936) 800 772,425 173,221QTR. III 44,447 286,661 184,288 146,020 593,355 272,254 43,733 72,903 320,708 18,260 (4,988) 800 722,070 128,715 QTR. IV 55,351 217,811 183,435 88,927 589,914 230,257 66,811 38,824 335,349 17,844 (714) 800 687,571 97,657
2003Jan. 53,263 255,376 183,325 124,514 591,370 262,920 40,714 40,872 335,352 16,692 (734) 800 695,016 103,646Feb. 41,127 262,726 183,238 119,815 595,494 265,153 42,540 40,903 337,944 16,889 (432) 800 702,197 106,703Mar. 42,947 271,169 184,277 129,039 599,220 279,674 44,353 45,017 336,944 16,847 538 800 722,573 123,353Apr. 49,396 289,873 184,135 154,334 599,036 304,150 55,438 48,989 344,263 17,276 (3,577) 800 765,739 166,703May 48,784 295,343 185,505 157,822 598,606 270,343 43,128 75,605 349,961 16,708 (4,225) 800 750,720 152,114Jun. 42,783 270,484 185,369 127,098 600,298 271,103 43,436 69,499 350,153 15,693 (499) 800 748,585 148,287Jul. 48,182 260,709 185,527 122,564 598,287 253,716 53,928 58,506 367,899 15,686 1,924 800 750,859 152,572Aug. 51,950 300,039 186,369 164,820 604,284 277,119 50,972 66,254 369,050 23,609 1,943 800 788,147 183,863Sep. 50,735 274,344 185,386 138,893 598,786 255,458 51,496 71,884 370,239 26,700 1,082 800 776,059 177,273Oct. 49,084 236,758 186,934 98,108 602,298 229,516 47,672 71,897 370,753 23,399 (435) 800 742,002 139,704Nov. 50,483 252,601 186,282 116,002 603,686 260,040 54,294 38,822 371,346 23,484 1,808 800 748,994 145,308Dec. 66,708 250,239 187,218 128,929 615,615 243,541 80,123 47,599 369,515 26,791 5,572 800 772,341 156,7262004Jan. 62,945 268,105 187,926 142,324 620,968 265,579 46,767 57,586 369,515 28,064 (4,587) 800 762,124 141,156Feb. 49,023 305,216 188,750 164,689 631,067 320,540 52,279 71,977 370,407 27,947 (7,072) 800 835,278 204,211Mar. 57,121 326,856 192,687 190,490 637,119 337,982 62,963 73,029 368,573 29,140 3,889 800 874,776 237,657Apr. 58,437 354,491 196,263 215,865 647,198 360,463 54,911 64,478 368,929 29,055 7,027 800 884,063 236,865May 51,648 362,200 197,834 215,214 649,884 358,238 49,385 86,477 369,269 28,229 7,382 800 898,180 248,296Jun. 56,032 335,291 200,911 189,612 656,741 322,645 63,678 88,852 369,328 28,168 11,711 800 883,582 226,841
SOURCE: The Central Bank of The Bahamas
Table 2.9 Summary of Bank Liquidity
15
(B$'000)2004
2001 2002 2003 Qtr. I Qtr. II Qtr. III Qtr. IV Qtr. I Qtr. II Qtr. III Qtr. IV Qtr. I
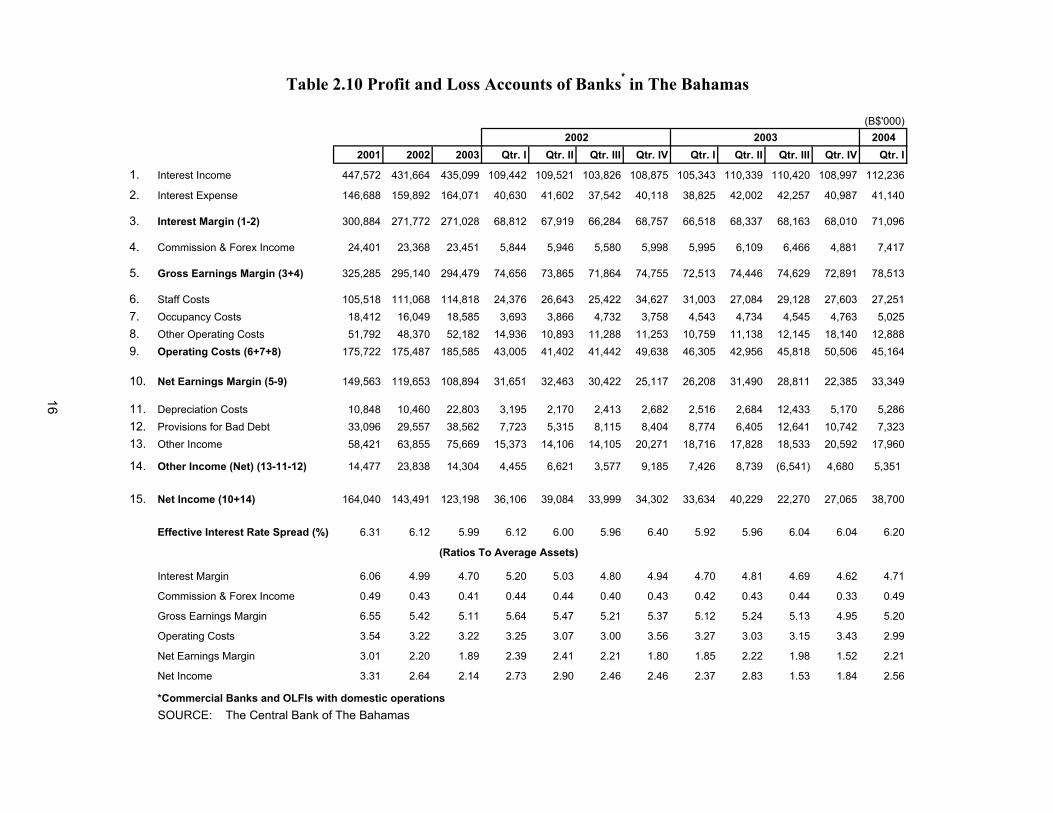
1. Interest Income 447,572 431,664 435,099 109,442 109,521 103,826 108,875 105,343 110,339 110,420 108,997 112,236
2. Interest Expense 146,688 159,892 164,071 40,630 41,602 37,542 40,118 38,825 42,002 42,257 40,987 41,140
3. Interest Margin (1-2) 300,884 271,772 271,028 68,812 67,919 66,284 68,757 66,518 68,337 68,163 68,010 71,096
4. Commission & Forex Income 24,401 23,368 23,451 5,844 5,946 5,580 5,998 5,995 6,109 6,466 4,881 7,417
5. Gross Earnings Margin (3+4) 325,285 295,140 294,479 74,656 73,865 71,864 74,755 72,513 74,446 74,629 72,891 78,513
6. Staff Costs 105,518 111,068 114,818 24,376 26,643 25,422 34,627 31,003 27,084 29,128 27,603 27,2517. Occupancy Costs 18,412 16,049 18,585 3,693 3,866 4,732 3,758 4,543 4,734 4,545 4,763 5,0258. Other Operating Costs 51,792 48,370 52,182 14,936 10,893 11,288 11,253 10,759 11,138 12,145 18,140 12,8889. Operating Costs (6+7+8) 175,722 175,487 185,585 43,005 41,402 41,442 49,638 46,305 42,956 45,818 50,506 45,164
10. Net Earnings Margin (5-9) 149,563 119,653 108,894 31,651 32,463 30,422 25,117 26,208 31,490 28,811 22,385 33,349
11. Depreciation Costs 10,848 10,460 22,803 3,195 2,170 2,413 2,682 2,516 2,684 12,433 5,170 5,28612. Provisions for Bad Debt 33,096 29,557 38,562 7,723 5,315 8,115 8,404 8,774 6,405 12,641 10,742 7,32313. Other Income 58,421 63,855 75,669 15,373 14,106 14,105 20,271 18,716 17,828 18,533 20,592 17,960
14. Other Income (Net) (13-11-12) 14,477 23,838 14,304 4,455 6,621 3,577 9,185 7,426 8,739 (6,541) 4,680 5,351
15. Net Income (10+14) 164,040 143,491 123,198 36,106 39,084 33,999 34,302 33,634 40,229 22,270 27,065 38,700
Effective Interest Rate Spread (%) 6.31 6.12 5.99 6.12 6.00 5.96 6.40 5.92 5.96 6.04 6.04 6.20
Interest Margin 6.06 4.99 4.70 5.20 5.03 4.80 4.94 4.70 4.81 4.69 4.62 4.71
Commission & Forex Income 0.49 0.43 0.41 0.44 0.44 0.40 0.43 0.42 0.43 0.44 0.33 0.49
Gross Earnings Margin 6.55 5.42 5.11 5.64 5.47 5.21 5.37 5.12 5.24 5.13 4.95 5.20
Operating Costs 3.54 3.22 3.22 3.25 3.07 3.00 3.56 3.27 3.03 3.15 3.43 2.99
Net Earnings Margin 3.01 2.20 1.89 2.39 2.41 2.21 1.80 1.85 2.22 1.98 1.52 2.21
Net Income 3.31 2.64 2.14 2.73 2.90 2.46 2.46 2.37 2.83 1.53 1.84 2.56
*Commercial Banks and OLFIs with domestic operationsSOURCE: The Central Bank of The Bahamas
2003
(Ratios To Average Assets)
2002
Table 2.10 Profit and Loss Accounts of Banks* in The Bahamas
16
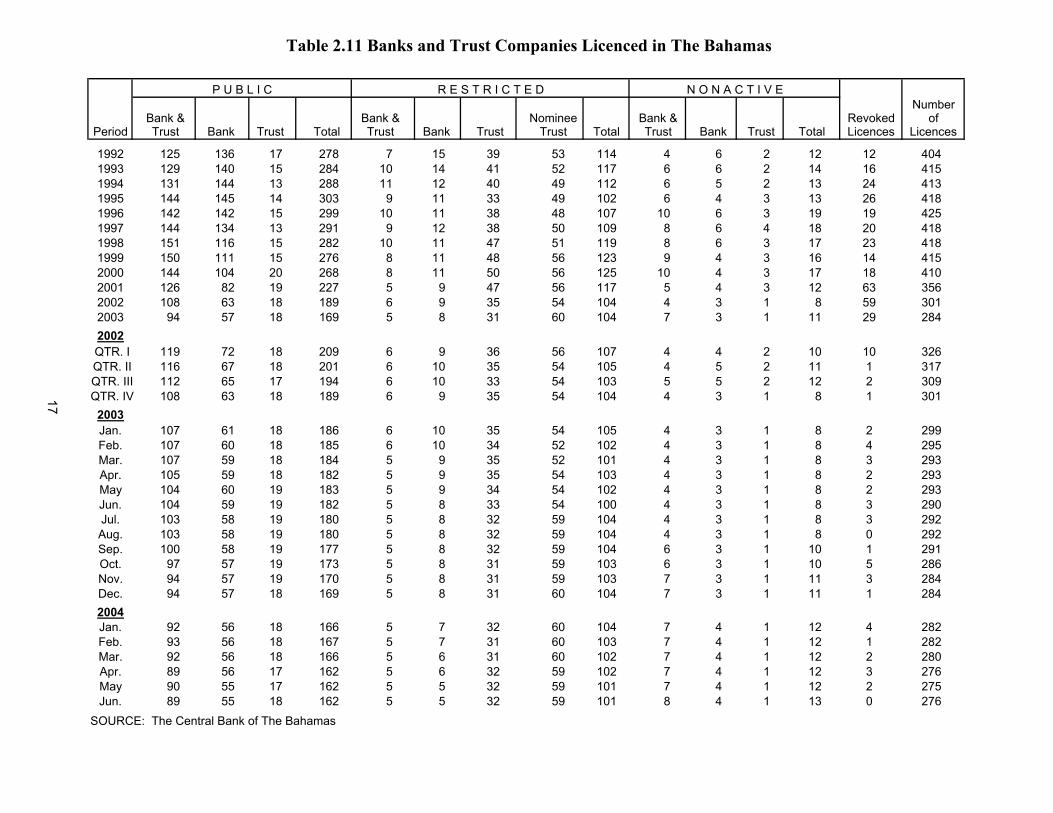
P U B L I C R E S T R I C T E D N O N A C T I V E Number
Bank & Bank & Nominee Bank & Revoked ofPeriod Trust Bank Trust Total Trust Bank Trust Trust Total Trust Bank Trust Total Licences Licences
1992 125 136 17 278 7 15 39 53 114 4 6 2 12 12 4041993 129 140 15 284 10 14 41 52 117 6 6 2 14 16 4151994 131 144 13 288 11 12 40 49 112 6 5 2 13 24 4131995 144 145 14 303 9 11 33 49 102 6 4 3 13 26 4181996 142 142 15 299 10 11 38 48 107 10 6 3 19 19 4251997 144 134 13 291 9 12 38 50 109 8 6 4 18 20 4181998 151 116 15 282 10 11 47 51 119 8 6 3 17 23 4181999 150 111 15 276 8 11 48 56 123 9 4 3 16 14 4152000 144 104 20 268 8 11 50 56 125 10 4 3 17 18 4102001 126 82 19 227 5 9 47 56 117 5 4 3 12 63 3562002 108 63 18 189 6 9 35 54 104 4 3 1 8 59 3012003 94 57 18 169 5 8 31 60 104 7 3 1 11 29 2842002
QTR. I 119 72 18 209 6 9 36 56 107 4 4 2 10 10 326 QTR. II 116 67 18 201 6 10 35 54 105 4 5 2 11 1 317 QTR. III 112 65 17 194 6 10 33 54 103 5 5 2 12 2 309 QTR. IV 108 63 18 189 6 9 35 54 104 4 3 1 8 1 301
2003Jan. 107 61 18 186 6 10 35 54 105 4 3 1 8 2 299Feb. 107 60 18 185 6 10 34 52 102 4 3 1 8 4 295Mar. 107 59 18 184 5 9 35 52 101 4 3 1 8 3 293Apr. 105 59 18 182 5 9 35 54 103 4 3 1 8 2 293May 104 60 19 183 5 9 34 54 102 4 3 1 8 2 293Jun. 104 59 19 182 5 8 33 54 100 4 3 1 8 3 290Jul. 103 58 19 180 5 8 32 59 104 4 3 1 8 3 292Aug. 103 58 19 180 5 8 32 59 104 4 3 1 8 0 292Sep. 100 58 19 177 5 8 32 59 104 6 3 1 10 1 291Oct. 97 57 19 173 5 8 31 59 103 6 3 1 10 5 286Nov. 94 57 19 170 5 8 31 59 103 7 3 1 11 3 284Dec. 94 57 18 169 5 8 31 60 104 7 3 1 11 1 2842004Jan. 92 56 18 166 5 7 32 60 104 7 4 1 12 4 282Feb. 93 56 18 167 5 7 31 60 103 7 4 1 12 1 282Mar. 92 56 18 166 5 6 31 60 102 7 4 1 12 2 280Apr. 89 56 17 162 5 6 32 59 102 7 4 1 12 3 276May 90 55 17 162 5 5 32 59 101 7 4 1 12 2 275Jun. 89 55 18 162 5 5 32 59 101 8 4 1 13 0 276
SOURCE: The Central Bank of The Bahamas
Table 2.11 Banks and Trust Companies Licenced in The Bahamas
17
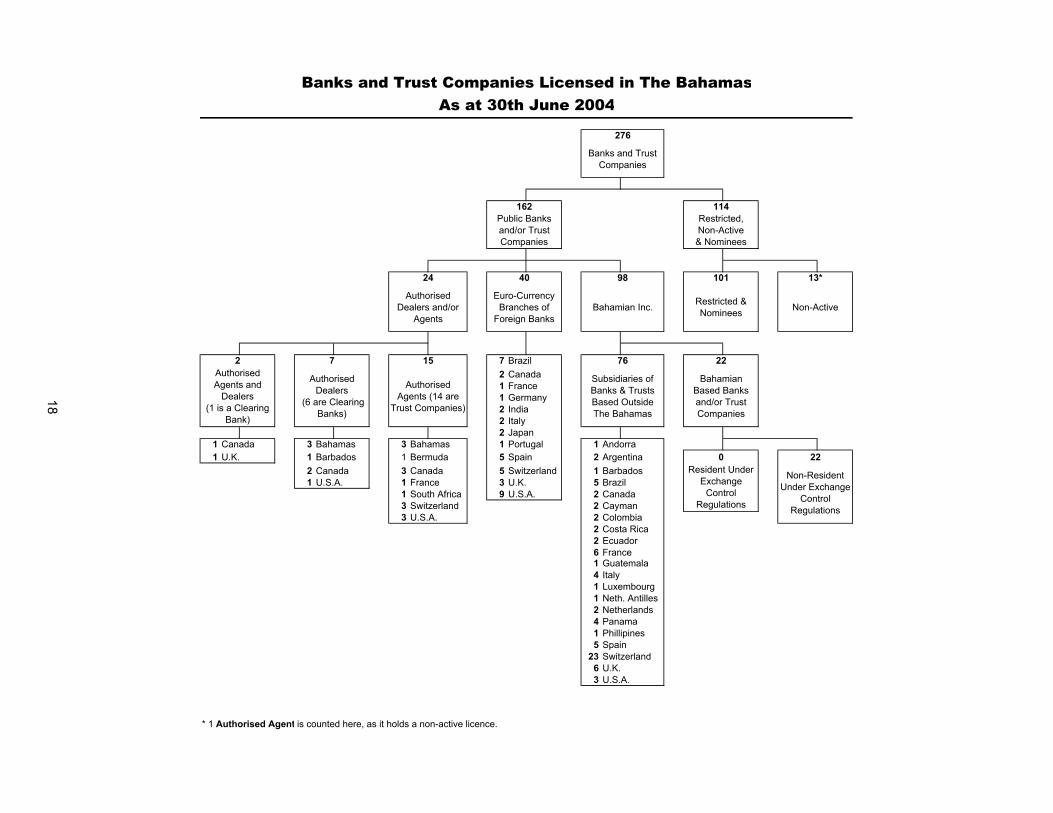
7 Brazil2 Canada 1 France1 Germany2 India2 Italy2 Japan
1 Canada 3 Bahamas 3 Bahamas 1 Portugal 1 Andorra1 U.K. 1 Barbados 1 Bermuda 5 Spain 2 Argentina
2 Canada 3 Canada 5 Switzerland 1 Barbados1 U.S.A. 1 France 3 U.K. 5 Brazil
1 South Africa 9 U.S.A. 2 Canada3 Switzerland 2 Cayman3 U.S.A. 2 Colombia
2 Costa Rica2 Ecuador6 France1 Guatemala4 Italy1 Luxembourg1 Neth. Antilles2 Netherlands4 Panama1 Phillipines5 Spain
23 Switzerland6 U.K.3 U.S.A.
* 1 Authorised Agent is counted here, as it holds a non-active licence.
0 22Resident Under
Exchange Control
Regulations
Non-Resident Under Exchange
Control Regulations
22AuthorisedAgents and
Dealers(1 is a Clearing
Bank)
AuthorisedDealers
(6 are ClearingBanks)
AuthorisedAgents (14 are
Trust Companies)
Subsidiaries of Banks & Trusts Based Outside The Bahamas
BahamianBased Banksand/or TrustCompanies
2 7 15 76
13*
Authorised Dealers and/or
Agents
Euro-Currency Branches of
Foreign Banks Bahamian Inc. Restricted &
Nominees Non-Active
24 40 98 101
162 114Public Banks and/or Trust Companies
Restricted,Non-Active& Nominees
Banks and Trust Companies Licensed in The BahamasAs at 30th June 2004
276
Banks and Trust Companies
18
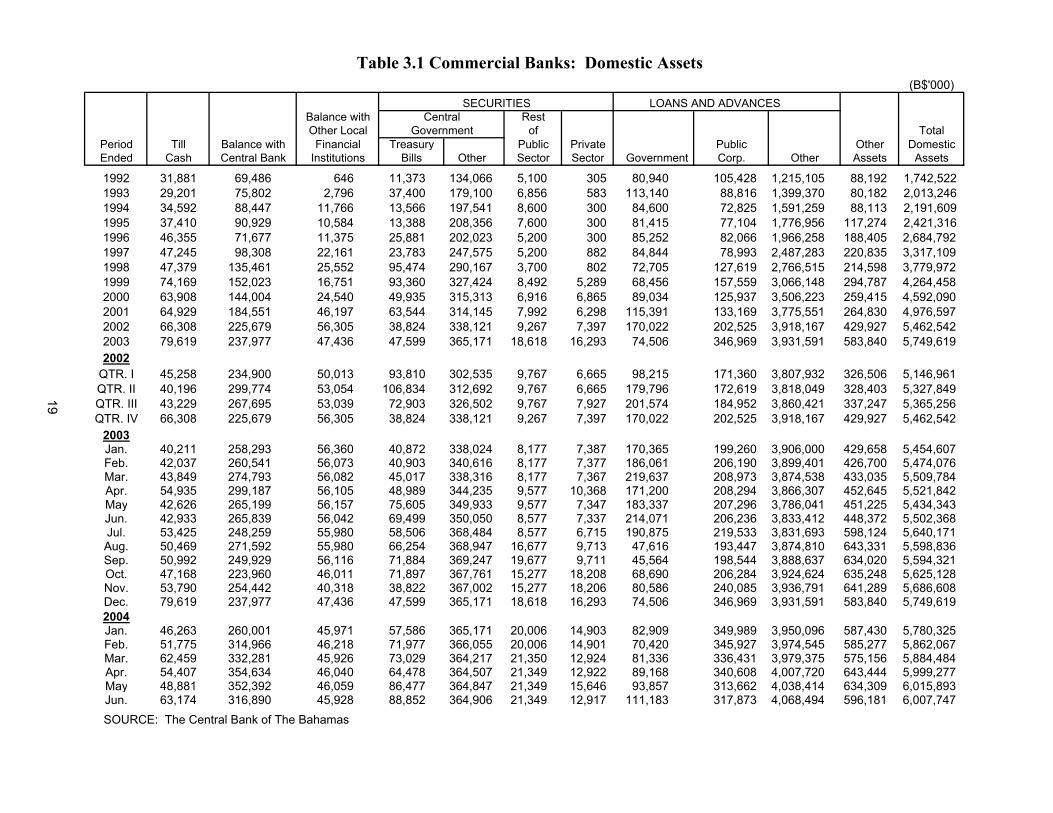
Table 3.1 Commercial Banks: Domestic Assets (B$'000)
SECURITIES LOANS AND ADVANCESBalance with Central Rest
Other Local Government of TotalPeriod Till Balance with Financial Treasury Public Private Public Other DomesticEnded Cash Central Bank Institutions Bills Other Sector Sector Government Corp. Other Assets Assets
1992 31,881 69,486 646 11,373 134,066 5,100 305 80,940 105,428 1,215,105 88,192 1,742,5221993 29,201 75,802 2,796 37,400 179,100 6,856 583 113,140 88,816 1,399,370 80,182 2,013,2461994 34,592 88,447 11,766 13,566 197,541 8,600 300 84,600 72,825 1,591,259 88,113 2,191,6091995 37,410 90,929 10,584 13,388 208,356 7,600 300 81,415 77,104 1,776,956 117,274 2,421,3161996 46,355 71,677 11,375 25,881 202,023 5,200 300 85,252 82,066 1,966,258 188,405 2,684,7921997 47,245 98,308 22,161 23,783 247,575 5,200 882 84,844 78,993 2,487,283 220,835 3,317,1091998 47,379 135,461 25,552 95,474 290,167 3,700 802 72,705 127,619 2,766,515 214,598 3,779,9721999 74,169 152,023 16,751 93,360 327,424 8,492 5,289 68,456 157,559 3,066,148 294,787 4,264,4582000 63,908 144,004 24,540 49,935 315,313 6,916 6,865 89,034 125,937 3,506,223 259,415 4,592,0902001 64,929 184,551 46,197 63,544 314,145 7,992 6,298 115,391 133,169 3,775,551 264,830 4,976,5972002 66,308 225,679 56,305 38,824 338,121 9,267 7,397 170,022 202,525 3,918,167 429,927 5,462,5422003 79,619 237,977 47,436 47,599 365,171 18,618 16,293 74,506 346,969 3,931,591 583,840 5,749,6192002
QTR. I 45,258 234,900 50,013 93,810 302,535 9,767 6,665 98,215 171,360 3,807,932 326,506 5,146,961QTR. II 40,196 299,774 53,054 106,834 312,692 9,767 6,665 179,796 172,619 3,818,049 328,403 5,327,849QTR. III 43,229 267,695 53,039 72,903 326,502 9,767 7,927 201,574 184,952 3,860,421 337,247 5,365,256QTR. IV 66,308 225,679 56,305 38,824 338,121 9,267 7,397 170,022 202,525 3,918,167 429,927 5,462,542
2003Jan. 40,211 258,293 56,360 40,872 338,024 8,177 7,387 170,365 199,260 3,906,000 429,658 5,454,607Feb. 42,037 260,541 56,073 40,903 340,616 8,177 7,377 186,061 206,190 3,899,401 426,700 5,474,076Mar. 43,849 274,793 56,082 45,017 338,316 8,177 7,367 219,637 208,973 3,874,538 433,035 5,509,784Apr. 54,935 299,187 56,105 48,989 344,235 9,577 10,368 171,200 208,294 3,866,307 452,645 5,521,842May 42,626 265,199 56,157 75,605 349,933 9,577 7,347 183,337 207,296 3,786,041 451,225 5,434,343Jun. 42,933 265,839 56,042 69,499 350,050 8,577 7,337 214,071 206,236 3,833,412 448,372 5,502,368Jul. 53,425 248,259 55,980 58,506 368,484 8,577 6,715 190,875 219,533 3,831,693 598,124 5,640,171Aug. 50,469 271,592 55,980 66,254 368,947 16,677 9,713 47,616 193,447 3,874,810 643,331 5,598,836Sep. 50,992 249,929 56,116 71,884 369,247 19,677 9,711 45,564 198,544 3,888,637 634,020 5,594,321Oct. 47,168 223,960 46,011 71,897 367,761 15,277 18,208 68,690 206,284 3,924,624 635,248 5,625,128Nov. 53,790 254,442 40,318 38,822 367,002 15,277 18,206 80,586 240,085 3,936,791 641,289 5,686,608Dec. 79,619 237,977 47,436 47,599 365,171 18,618 16,293 74,506 346,969 3,931,591 583,840 5,749,6192004Jan. 46,263 260,001 45,971 57,586 365,171 20,006 14,903 82,909 349,989 3,950,096 587,430 5,780,325Feb. 51,775 314,966 46,218 71,977 366,055 20,006 14,901 70,420 345,927 3,974,545 585,277 5,862,067Mar. 62,459 332,281 45,926 73,029 364,217 21,350 12,924 81,336 336,431 3,979,375 575,156 5,884,484Apr. 54,407 354,634 46,040 64,478 364,507 21,349 12,922 89,168 340,608 4,007,720 643,444 5,999,277May 48,881 352,392 46,059 86,477 364,847 21,349 15,646 93,857 313,662 4,038,414 634,309 6,015,893Jun. 63,174 316,890 45,928 88,852 364,906 21,349 12,917 111,183 317,873 4,068,494 596,181 6,007,747
SOURCE: The Central Bank of The Bahamas
19
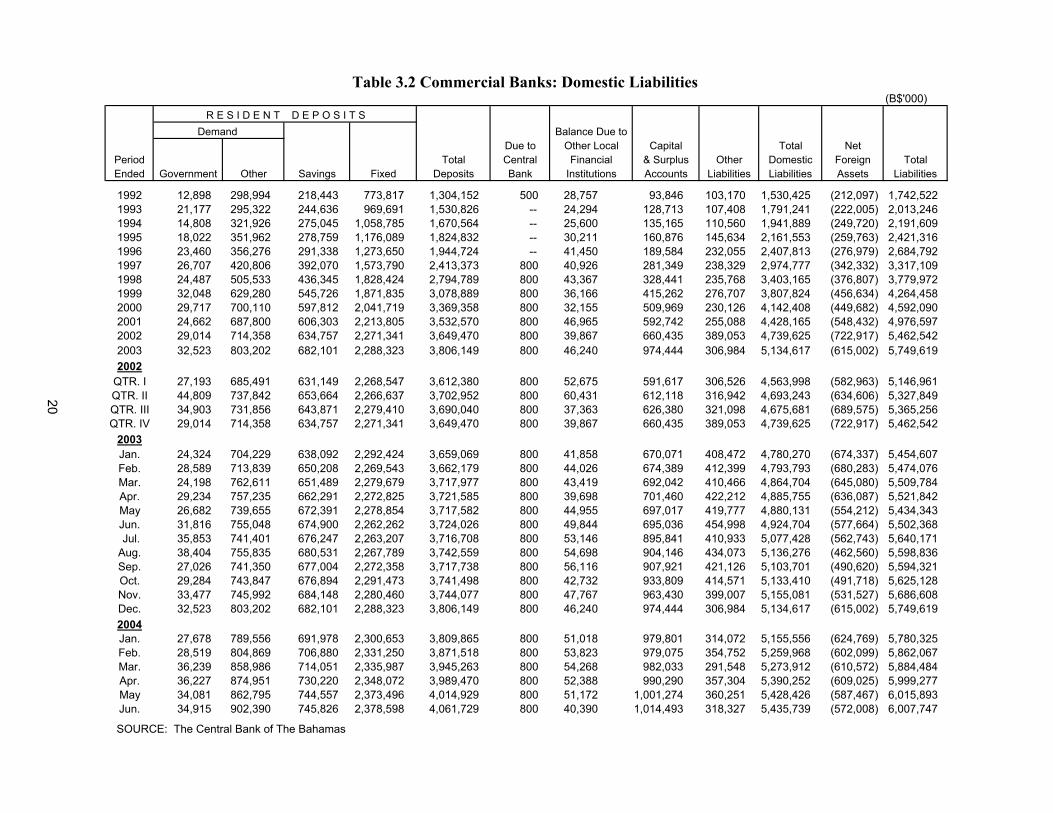
Table 3.2 Commercial Banks: Domestic Liabilities(B$'000)
R E S I D E N T D E P O S I T S Demand Balance Due to
Due to Other Local Capital Total NetPeriod Total Central Financial & Surplus Other Domestic Foreign TotalEnded Government Other Savings Fixed Deposits Bank Institutions Accounts Liabilities Liabilities Assets Liabilities
1992 12,898 298,994 218,443 773,817 1,304,152 500 28,757 93,846 103,170 1,530,425 (212,097) 1,742,5221993 21,177 295,322 244,636 969,691 1,530,826 -- 24,294 128,713 107,408 1,791,241 (222,005) 2,013,2461994 14,808 321,926 275,045 1,058,785 1,670,564 -- 25,600 135,165 110,560 1,941,889 (249,720) 2,191,6091995 18,022 351,962 278,759 1,176,089 1,824,832 -- 30,211 160,876 145,634 2,161,553 (259,763) 2,421,3161996 23,460 356,276 291,338 1,273,650 1,944,724 -- 41,450 189,584 232,055 2,407,813 (276,979) 2,684,7921997 26,707 420,806 392,070 1,573,790 2,413,373 800 40,926 281,349 238,329 2,974,777 (342,332) 3,317,1091998 24,487 505,533 436,345 1,828,424 2,794,789 800 43,367 328,441 235,768 3,403,165 (376,807) 3,779,9721999 32,048 629,280 545,726 1,871,835 3,078,889 800 36,166 415,262 276,707 3,807,824 (456,634) 4,264,4582000 29,717 700,110 597,812 2,041,719 3,369,358 800 32,155 509,969 230,126 4,142,408 (449,682) 4,592,0902001 24,662 687,800 606,303 2,213,805 3,532,570 800 46,965 592,742 255,088 4,428,165 (548,432) 4,976,5972002 29,014 714,358 634,757 2,271,341 3,649,470 800 39,867 660,435 389,053 4,739,625 (722,917) 5,462,5422003 32,523 803,202 682,101 2,288,323 3,806,149 800 46,240 974,444 306,984 5,134,617 (615,002) 5,749,6192002
QTR. I 27,193 685,491 631,149 2,268,547 3,612,380 800 52,675 591,617 306,526 4,563,998 (582,963) 5,146,961QTR. II 44,809 737,842 653,664 2,266,637 3,702,952 800 60,431 612,118 316,942 4,693,243 (634,606) 5,327,849QTR. III 34,903 731,856 643,871 2,279,410 3,690,040 800 37,363 626,380 321,098 4,675,681 (689,575) 5,365,256QTR. IV 29,014 714,358 634,757 2,271,341 3,649,470 800 39,867 660,435 389,053 4,739,625 (722,917) 5,462,542
2003Jan. 24,324 704,229 638,092 2,292,424 3,659,069 800 41,858 670,071 408,472 4,780,270 (674,337) 5,454,607Feb. 28,589 713,839 650,208 2,269,543 3,662,179 800 44,026 674,389 412,399 4,793,793 (680,283) 5,474,076Mar. 24,198 762,611 651,489 2,279,679 3,717,977 800 43,419 692,042 410,466 4,864,704 (645,080) 5,509,784Apr. 29,234 757,235 662,291 2,272,825 3,721,585 800 39,698 701,460 422,212 4,885,755 (636,087) 5,521,842May 26,682 739,655 672,391 2,278,854 3,717,582 800 44,955 697,017 419,777 4,880,131 (554,212) 5,434,343Jun. 31,816 755,048 674,900 2,262,262 3,724,026 800 49,844 695,036 454,998 4,924,704 (577,664) 5,502,368 Jul. 35,853 741,401 676,247 2,263,207 3,716,708 800 53,146 895,841 410,933 5,077,428 (562,743) 5,640,171Aug. 38,404 755,835 680,531 2,267,789 3,742,559 800 54,698 904,146 434,073 5,136,276 (462,560) 5,598,836Sep. 27,026 741,350 677,004 2,272,358 3,717,738 800 56,116 907,921 421,126 5,103,701 (490,620) 5,594,321Oct. 29,284 743,847 676,894 2,291,473 3,741,498 800 42,732 933,809 414,571 5,133,410 (491,718) 5,625,128Nov. 33,477 745,992 684,148 2,280,460 3,744,077 800 47,767 963,430 399,007 5,155,081 (531,527) 5,686,608Dec. 32,523 803,202 682,101 2,288,323 3,806,149 800 46,240 974,444 306,984 5,134,617 (615,002) 5,749,6192004Jan. 27,678 789,556 691,978 2,300,653 3,809,865 800 51,018 979,801 314,072 5,155,556 (624,769) 5,780,325Feb. 28,519 804,869 706,880 2,331,250 3,871,518 800 53,823 979,075 354,752 5,259,968 (602,099) 5,862,067Mar. 36,239 858,986 714,051 2,335,987 3,945,263 800 54,268 982,033 291,548 5,273,912 (610,572) 5,884,484Apr. 36,227 874,951 730,220 2,348,072 3,989,470 800 52,388 990,290 357,304 5,390,252 (609,025) 5,999,277May 34,081 862,795 744,557 2,373,496 4,014,929 800 51,172 1,001,274 360,251 5,428,426 (587,467) 6,015,893Jun. 34,915 902,390 745,826 2,378,598 4,061,729 800 40,390 1,014,493 318,327 5,435,739 (572,008) 6,007,747
SOURCE: The Central Bank of The Bahamas
20
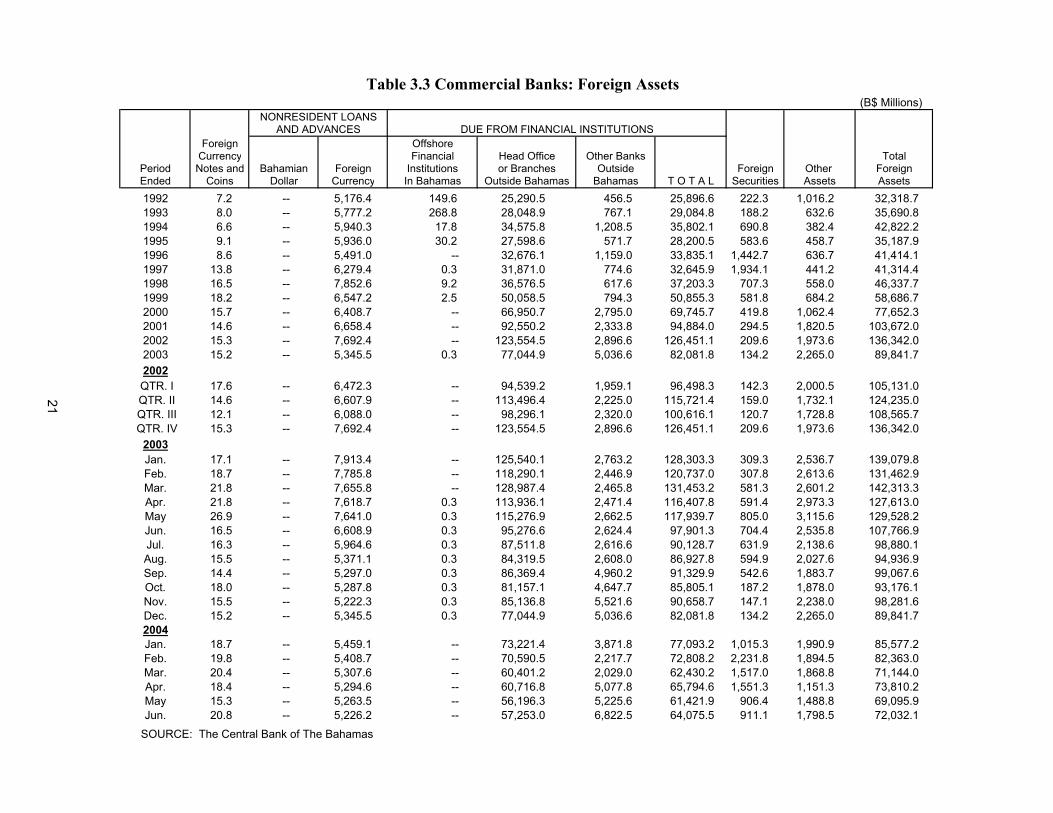
Table 3.3 Commercial Banks: Foreign Assets (B$ Millions)
NONRESIDENT LOANSAND ADVANCES DUE FROM FINANCIAL INSTITUTIONS
Foreign Offshore Currency Financial Head Office Other Banks Total
Period Notes and Bahamian Foreign Institutions or Branches Outside Foreign Other ForeignEnded Coins Dollar Currency In Bahamas Outside Bahamas Bahamas T O T A L Securities Assets Assets1992 7.2 -- 5,176.4 149.6 25,290.5 456.5 25,896.6 222.3 1,016.2 32,318.71993 8.0 -- 5,777.2 268.8 28,048.9 767.1 29,084.8 188.2 632.6 35,690.81994 6.6 -- 5,940.3 17.8 34,575.8 1,208.5 35,802.1 690.8 382.4 42,822.21995 9.1 -- 5,936.0 30.2 27,598.6 571.7 28,200.5 583.6 458.7 35,187.91996 8.6 -- 5,491.0 -- 32,676.1 1,159.0 33,835.1 1,442.7 636.7 41,414.11997 13.8 -- 6,279.4 0.3 31,871.0 774.6 32,645.9 1,934.1 441.2 41,314.41998 16.5 -- 7,852.6 9.2 36,576.5 617.6 37,203.3 707.3 558.0 46,337.71999 18.2 -- 6,547.2 2.5 50,058.5 794.3 50,855.3 581.8 684.2 58,686.72000 15.7 -- 6,408.7 -- 66,950.7 2,795.0 69,745.7 419.8 1,062.4 77,652.32001 14.6 -- 6,658.4 -- 92,550.2 2,333.8 94,884.0 294.5 1,820.5 103,672.02002 15.3 7,692.4 -- 123,554.5 2,896.6 126,451.1 209.6 1,973.6 136,342.02003 15.2 5,345.5 0.3 77,044.9 5,036.6 82,081.8 134.2 2,265.0 89,841.72002
QTR. I 17.6 6,472.3 -- 94,539.2 1,959.1 96,498.3 142.3 2,000.5 105,131.0 QTR. II 14.6 6,607.9 -- 113,496.4 2,225.0 115,721.4 159.0 1,732.1 124,235.0 QTR. III 12.1 6,088.0 -- 98,296.1 2,320.0 100,616.1 120.7 1,728.8 108,565.7 QTR. IV 15.3 7,692.4 -- 123,554.5 2,896.6 126,451.1 209.6 1,973.6 136,342.0
2003Jan. 17.1 7,913.4 -- 125,540.1 2,763.2 128,303.3 309.3 2,536.7 139,079.8Feb. 18.7 7,785.8 -- 118,290.1 2,446.9 120,737.0 307.8 2,613.6 131,462.9Mar. 21.8 7,655.8 -- 128,987.4 2,465.8 131,453.2 581.3 2,601.2 142,313.3Apr. 21.8 7,618.7 0.3 113,936.1 2,471.4 116,407.8 591.4 2,973.3 127,613.0May 26.9 7,641.0 0.3 115,276.9 2,662.5 117,939.7 805.0 3,115.6 129,528.2Jun. 16.5 6,608.9 0.3 95,276.6 2,624.4 97,901.3 704.4 2,535.8 107,766.9Jul. 16.3 5,964.6 0.3 87,511.8 2,616.6 90,128.7 631.9 2,138.6 98,880.1Aug. 15.5 5,371.1 0.3 84,319.5 2,608.0 86,927.8 594.9 2,027.6 94,936.9Sep. 14.4 5,297.0 0.3 86,369.4 4,960.2 91,329.9 542.6 1,883.7 99,067.6Oct. 18.0 5,287.8 0.3 81,157.1 4,647.7 85,805.1 187.2 1,878.0 93,176.1Nov. 15.5 5,222.3 0.3 85,136.8 5,521.6 90,658.7 147.1 2,238.0 98,281.6Dec. 15.2 5,345.5 0.3 77,044.9 5,036.6 82,081.8 134.2 2,265.0 89,841.72004Jan. 18.7 5,459.1 -- 73,221.4 3,871.8 77,093.2 1,015.3 1,990.9 85,577.2Feb. 19.8 5,408.7 -- 70,590.5 2,217.7 72,808.2 2,231.8 1,894.5 82,363.0Mar. 20.4 5,307.6 -- 60,401.2 2,029.0 62,430.2 1,517.0 1,868.8 71,144.0Apr. 18.4 5,294.6 -- 60,716.8 5,077.8 65,794.6 1,551.3 1,151.3 73,810.2May 15.3 5,263.5 -- 56,196.3 5,225.6 61,421.9 906.4 1,488.8 69,095.9Jun. 20.8 5,226.2 -- 57,253.0 6,822.5 64,075.5 911.1 1,798.5 72,032.1
SOURCE: The Central Bank of The Bahamas
-- -- --
-- -- --
-- -- --
-- -- --
-- -- --
--
--
--
--
--
--
--
-- --21
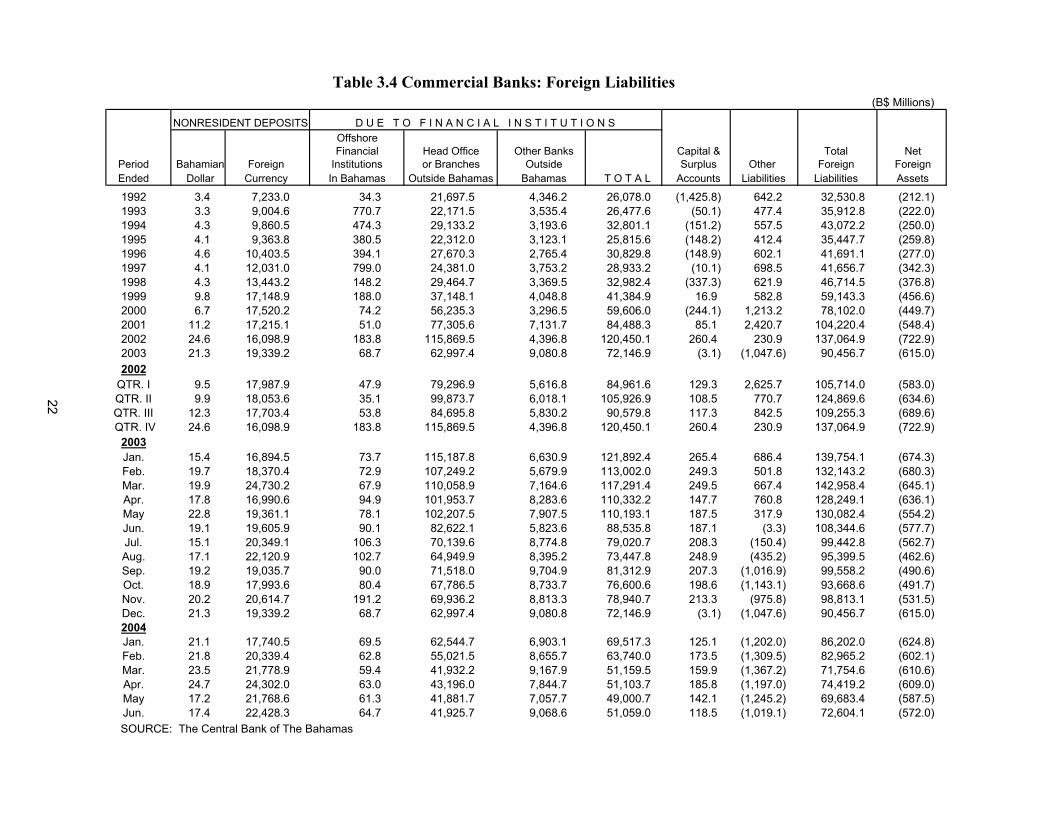
Table 3.4 Commercial Banks: Foreign Liabilities (B$ Millions)
NONRESIDENT DEPOSITS D U E T O F I N A N C I A L I N S T I T U T I O N S Offshore
Financial Head Office Other Banks Capital & Total NetPeriod Bahamian Foreign Institutions or Branches Outside Surplus Other Foreign ForeignEnded Dollar Currency In Bahamas Outside Bahamas Bahamas T O T A L Accounts Liabilities Liabilities Assets
1992 3.4 7,233.0 34.3 21,697.5 4,346.2 26,078.0 (1,425.8) 642.2 32,530.8 (212.1)1993 3.3 9,004.6 770.7 22,171.5 3,535.4 26,477.6 (50.1) 477.4 35,912.8 (222.0)1994 4.3 9,860.5 474.3 29,133.2 3,193.6 32,801.1 (151.2) 557.5 43,072.2 (250.0)1995 4.1 9,363.8 380.5 22,312.0 3,123.1 25,815.6 (148.2) 412.4 35,447.7 (259.8)1996 4.6 10,403.5 394.1 27,670.3 2,765.4 30,829.8 (148.9) 602.1 41,691.1 (277.0)1997 4.1 12,031.0 799.0 24,381.0 3,753.2 28,933.2 (10.1) 698.5 41,656.7 (342.3)1998 4.3 13,443.2 148.2 29,464.7 3,369.5 32,982.4 (337.3) 621.9 46,714.5 (376.8)1999 9.8 17,148.9 188.0 37,148.1 4,048.8 41,384.9 16.9 582.8 59,143.3 (456.6)2000 6.7 17,520.2 74.2 56,235.3 3,296.5 59,606.0 (244.1) 1,213.2 78,102.0 (449.7)2001 11.2 17,215.1 51.0 77,305.6 7,131.7 84,488.3 85.1 2,420.7 104,220.4 (548.4)2002 24.6 16,098.9 183.8 115,869.5 4,396.8 120,450.1 260.4 230.9 137,064.9 (722.9)2003 21.3 19,339.2 68.7 62,997.4 9,080.8 72,146.9 (3.1) (1,047.6) 90,456.7 (615.0)2002
QTR. I 9.5 17,987.9 47.9 79,296.9 5,616.8 84,961.6 129.3 2,625.7 105,714.0 (583.0)QTR. II 9.9 18,053.6 35.1 99,873.7 6,018.1 105,926.9 108.5 770.7 124,869.6 (634.6)QTR. III 12.3 17,703.4 53.8 84,695.8 5,830.2 90,579.8 117.3 842.5 109,255.3 (689.6) QTR. IV 24.6 16,098.9 183.8 115,869.5 4,396.8 120,450.1 260.4 230.9 137,064.9 (722.9)
2003Jan. 15.4 16,894.5 73.7 115,187.8 6,630.9 121,892.4 265.4 686.4 139,754.1 (674.3)Feb. 19.7 18,370.4 72.9 107,249.2 5,679.9 113,002.0 249.3 501.8 132,143.2 (680.3)Mar. 19.9 24,730.2 67.9 110,058.9 7,164.6 117,291.4 249.5 667.4 142,958.4 (645.1)Apr. 17.8 16,990.6 94.9 101,953.7 8,283.6 110,332.2 147.7 760.8 128,249.1 (636.1)May 22.8 19,361.1 78.1 102,207.5 7,907.5 110,193.1 187.5 317.9 130,082.4 (554.2)Jun. 19.1 19,605.9 90.1 82,622.1 5,823.6 88,535.8 187.1 (3.3) 108,344.6 (577.7)Jul. 15.1 20,349.1 106.3 70,139.6 8,774.8 79,020.7 208.3 (150.4) 99,442.8 (562.7)Aug. 17.1 22,120.9 102.7 64,949.9 8,395.2 73,447.8 248.9 (435.2) 95,399.5 (462.6)Sep. 19.2 19,035.7 90.0 71,518.0 9,704.9 81,312.9 207.3 (1,016.9) 99,558.2 (490.6)Oct. 18.9 17,993.6 80.4 67,786.5 8,733.7 76,600.6 198.6 (1,143.1) 93,668.6 (491.7)Nov. 20.2 20,614.7 191.2 69,936.2 8,813.3 78,940.7 213.3 (975.8) 98,813.1 (531.5)Dec. 21.3 19,339.2 68.7 62,997.4 9,080.8 72,146.9 (3.1) (1,047.6) 90,456.7 (615.0)2004Jan. 21.1 17,740.5 69.5 62,544.7 6,903.1 69,517.3 125.1 (1,202.0) 86,202.0 (624.8)Feb. 21.8 20,339.4 62.8 55,021.5 8,655.7 63,740.0 173.5 (1,309.5) 82,965.2 (602.1)Mar. 23.5 21,778.9 59.4 41,932.2 9,167.9 51,159.5 159.9 (1,367.2) 71,754.6 (610.6)Apr. 24.7 24,302.0 63.0 43,196.0 7,844.7 51,103.7 185.8 (1,197.0) 74,419.2 (609.0)May 17.2 21,768.6 61.3 41,881.7 7,057.7 49,000.7 142.1 (1,245.2) 69,683.4 (587.5)Jun. 17.4 22,428.3 64.7 41,925.7 9,068.6 51,059.0 118.5 (1,019.1) 72,604.1 (572.0)
SOURCE: The Central Bank of The Bahamas
22
(B$'000)R E S I D E N T
Public PrivatePeriod Public Financial Financial Business Private Ended Government Corporations Institutions Institutions Firms Individuals Other T O T A L Nonresident
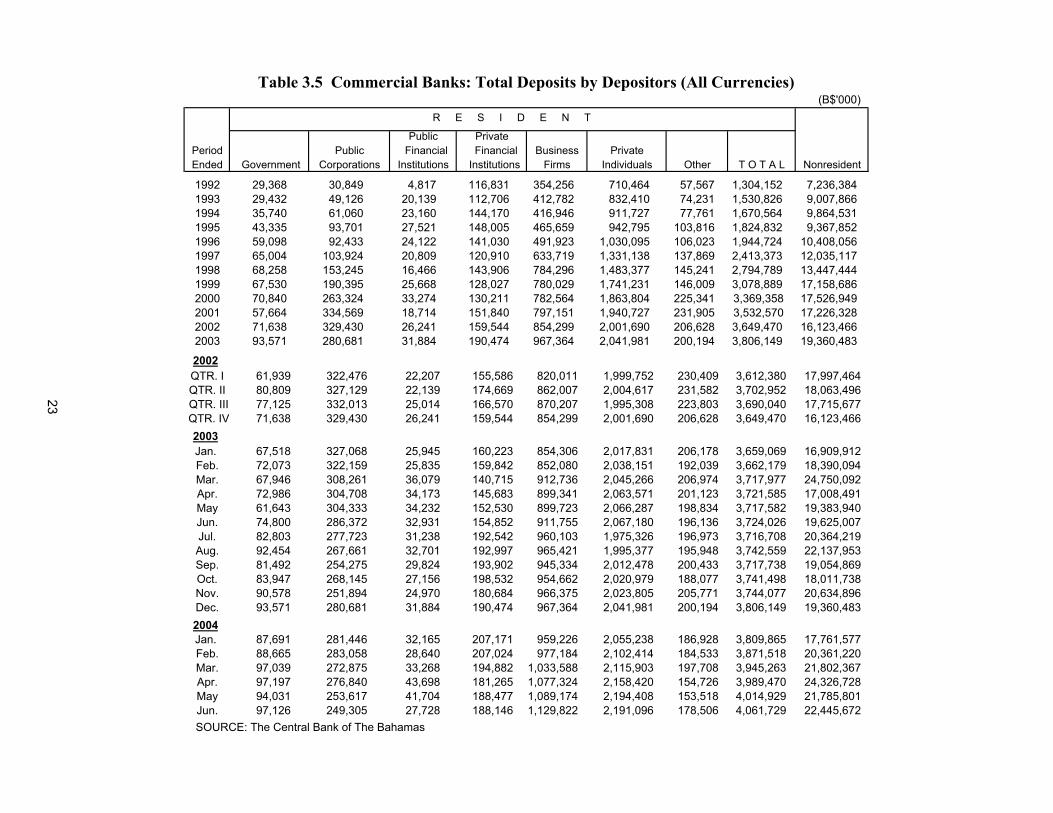
1992 29,368 30,849 4,817 116,831 354,256 710,464 57,567 1,304,152 7,236,3841993 29,432 49,126 20,139 112,706 412,782 832,410 74,231 1,530,826 9,007,8661994 35,740 61,060 23,160 144,170 416,946 911,727 77,761 1,670,564 9,864,5311995 43,335 93,701 27,521 148,005 465,659 942,795 103,816 1,824,832 9,367,8521996 59,098 92,433 24,122 141,030 491,923 1,030,095 106,023 1,944,724 10,408,0561997 65,004 103,924 20,809 120,910 633,719 1,331,138 137,869 2,413,373 12,035,1171998 68,258 153,245 16,466 143,906 784,296 1,483,377 145,241 2,794,789 13,447,4441999 67,530 190,395 25,668 128,027 780,029 1,741,231 146,009 3,078,889 17,158,6862000 70,840 263,324 33,274 130,211 782,564 1,863,804 225,341 3,369,358 17,526,9492001 57,664 334,569 18,714 151,840 797,151 1,940,727 231,905 3,532,570 17,226,3282002 71,638 329,430 26,241 159,544 854,299 2,001,690 206,628 3,649,470 16,123,4662003 93,571 280,681 31,884 190,474 967,364 2,041,981 200,194 3,806,149 19,360,483
2002QTR. I 61,939 322,476 22,207 155,586 820,011 1,999,752 230,409 3,612,380 17,997,464QTR. II 80,809 327,129 22,139 174,669 862,007 2,004,617 231,582 3,702,952 18,063,496
QTR. III 77,125 332,013 25,014 166,570 870,207 1,995,308 223,803 3,690,040 17,715,677 QTR. IV 71,638 329,430 26,241 159,544 854,299 2,001,690 206,628 3,649,470 16,123,466
2003Jan. 67,518 327,068 25,945 160,223 854,306 2,017,831 206,178 3,659,069 16,909,912Feb. 72,073 322,159 25,835 159,842 852,080 2,038,151 192,039 3,662,179 18,390,094Mar. 67,946 308,261 36,079 140,715 912,736 2,045,266 206,974 3,717,977 24,750,092Apr. 72,986 304,708 34,173 145,683 899,341 2,063,571 201,123 3,721,585 17,008,491May 61,643 304,333 34,232 152,530 899,723 2,066,287 198,834 3,717,582 19,383,940Jun. 74,800 286,372 32,931 154,852 911,755 2,067,180 196,136 3,724,026 19,625,007Jul. 82,803 277,723 31,238 192,542 960,103 1,975,326 196,973 3,716,708 20,364,219Aug. 92,454 267,661 32,701 192,997 965,421 1,995,377 195,948 3,742,559 22,137,953Sep. 81,492 254,275 29,824 193,902 945,334 2,012,478 200,433 3,717,738 19,054,869Oct. 83,947 268,145 27,156 198,532 954,662 2,020,979 188,077 3,741,498 18,011,738Nov. 90,578 251,894 24,970 180,684 966,375 2,023,805 205,771 3,744,077 20,634,896Dec. 93,571 280,681 31,884 190,474 967,364 2,041,981 200,194 3,806,149 19,360,4832004Jan. 87,691 281,446 32,165 207,171 959,226 2,055,238 186,928 3,809,865 17,761,577Feb. 88,665 283,058 28,640 207,024 977,184 2,102,414 184,533 3,871,518 20,361,220Mar. 97,039 272,875 33,268 194,882 1,033,588 2,115,903 197,708 3,945,263 21,802,367Apr. 97,197 276,840 43,698 181,265 1,077,324 2,158,420 154,726 3,989,470 24,326,728May 94,031 253,617 41,704 188,477 1,089,174 2,194,408 153,518 4,014,929 21,785,801Jun. 97,126 249,305 27,728 188,146 1,129,822 2,191,096 178,506 4,061,729 22,445,672
SOURCE: The Central Bank of The Bahamas
Table 3.5 Commercial Banks: Total Deposits by Depositors (All Currencies)
23
(B$'000) R E S I D E N T
Public PrivatePeriod Public Financial Financial Business Private Ended Government Corporations Institutions Institutions Firms Individuals Other T O T A L Nonresident
1992 12,898 23,543 2,803 22,342 146,108 83,944 20,254 311,892 164,8081993 21,177 25,515 2,948 15,263 137,316 90,586 23,694 316,499 288,8491994 14,808 20,433 1,075 25,389 151,298 98,601 25,130 336,734 337,5981995 18,022 34,067 4,412 11,122 182,269 101,746 18,346 369,984 326,7111996 23,460 26,483 4,339 13,487 181,989 110,153 19,825 379,736 442,7551997 26,707 20,058 5,002 15,724 227,545 126,086 26,391 447,513 536,6681998 24,487 27,262 1,672 26,258 264,072 154,660 31,609 530,020 462,0101999 32,048 25,022 2,472 37,439 329,079 197,277 37,991 661,328 543,4902000 29,717 26,319 4,173 23,028 366,830 212,075 67,685 729,827 390,7772001 24,662 24,647 1,211 23,853 364,144 199,492 74,453 712,462 411,7422002 29,014 31,934 1,091 28,743 374,811 210,310 67,469 743,372 701,3032003 32,523 39,821 8,732 31,096 415,130 227,277 81,146 835,725 456,750
2002QTR. I 27,193 26,298 1,182 22,125 366,040 199,154 70,692 712,684 359,138QTR. II 44,809 32,989 1,599 27,429 401,426 208,248 66,151 782,651 434,581
QTR. III 34,903 33,491 3,368 42,789 372,024 213,407 66,777 766,759 405,833 QTR. IV 29,014 31,934 1,091 28,743 374,811 210,310 67,469 743,372 701,303
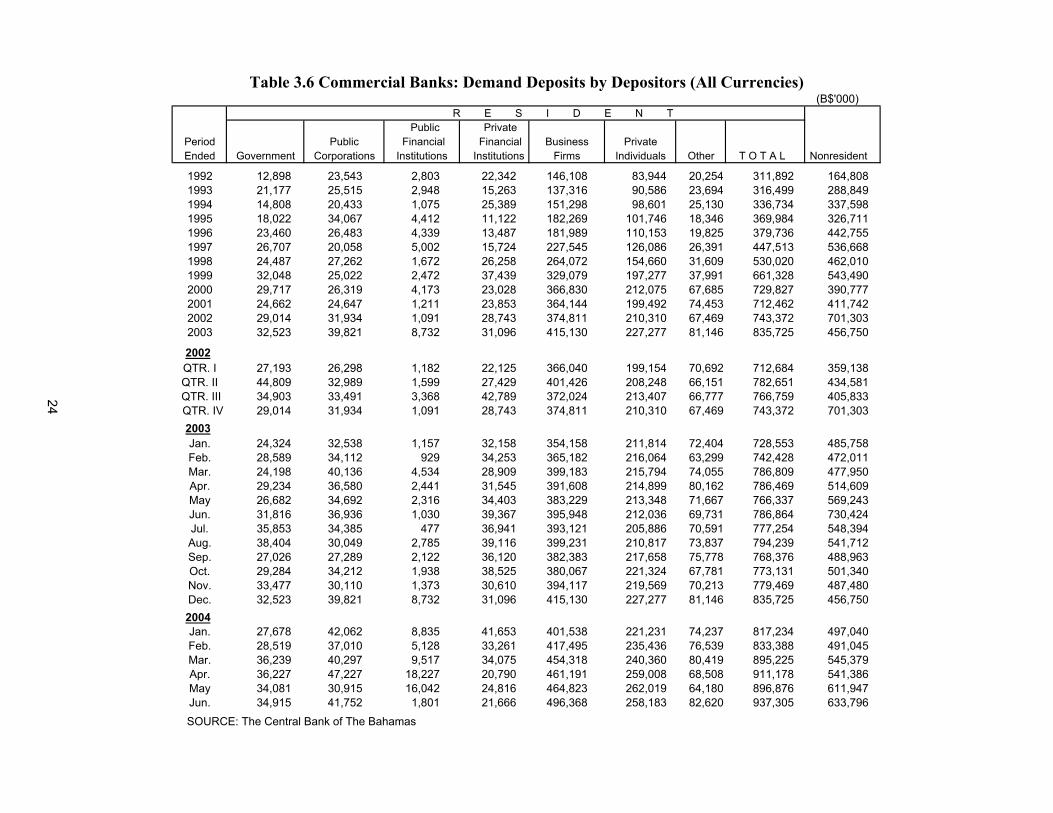
2003Jan. 24,324 32,538 1,157 32,158 354,158 211,814 72,404 728,553 485,758Feb. 28,589 34,112 929 34,253 365,182 216,064 63,299 742,428 472,011Mar. 24,198 40,136 4,534 28,909 399,183 215,794 74,055 786,809 477,950Apr. 29,234 36,580 2,441 31,545 391,608 214,899 80,162 786,469 514,609May 26,682 34,692 2,316 34,403 383,229 213,348 71,667 766,337 569,243Jun. 31,816 36,936 1,030 39,367 395,948 212,036 69,731 786,864 730,424Jul. 35,853 34,385 477 36,941 393,121 205,886 70,591 777,254 548,394Aug. 38,404 30,049 2,785 39,116 399,231 210,817 73,837 794,239 541,712Sep. 27,026 27,289 2,122 36,120 382,383 217,658 75,778 768,376 488,963Oct. 29,284 34,212 1,938 38,525 380,067 221,324 67,781 773,131 501,340Nov. 33,477 30,110 1,373 30,610 394,117 219,569 70,213 779,469 487,480Dec. 32,523 39,821 8,732 31,096 415,130 227,277 81,146 835,725 456,7502004Jan. 27,678 42,062 8,835 41,653 401,538 221,231 74,237 817,234 497,040Feb. 28,519 37,010 5,128 33,261 417,495 235,436 76,539 833,388 491,045Mar. 36,239 40,297 9,517 34,075 454,318 240,360 80,419 895,225 545,379Apr. 36,227 47,227 18,227 20,790 461,191 259,008 68,508 911,178 541,386May 34,081 30,915 16,042 24,816 464,823 262,019 64,180 896,876 611,947Jun. 34,915 41,752 1,801 21,666 496,368 258,183 82,620 937,305 633,796
SOURCE: The Central Bank of The Bahamas
Table 3.6 Commercial Banks: Demand Deposits by Depositors (All Currencies)
24
(B$'000)R E S I D E N T
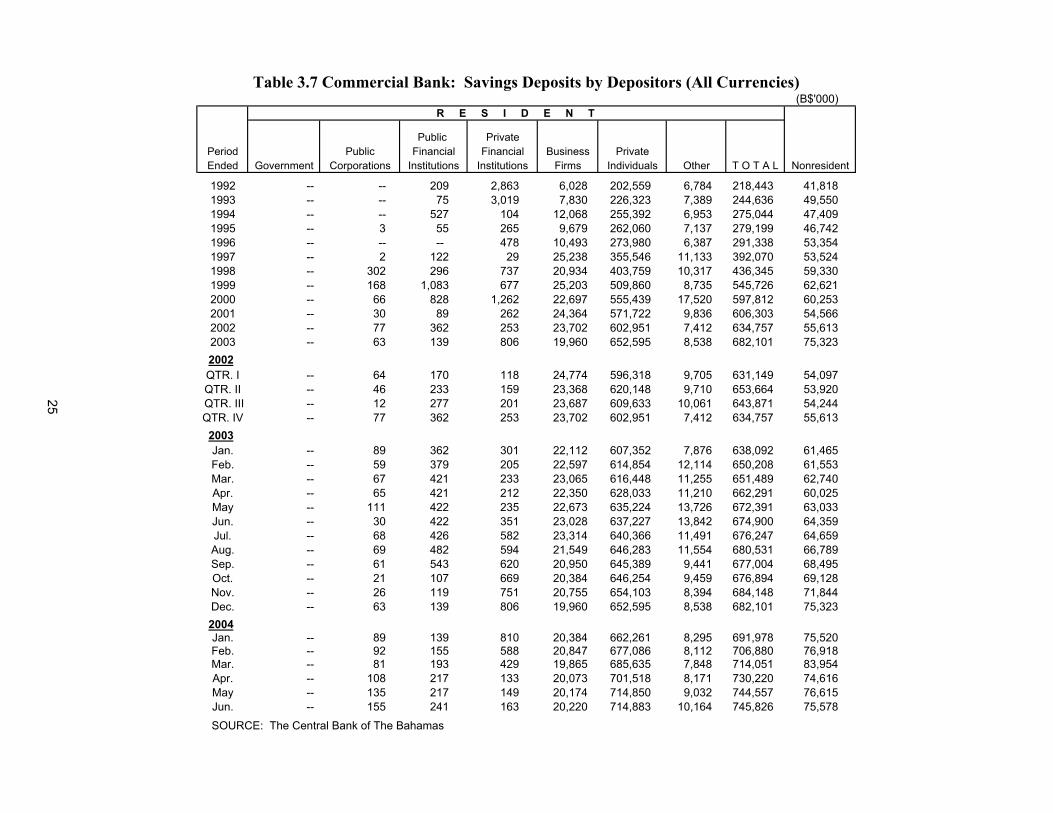
Public PrivatePeriod Public Financial Financial Business Private Ended Corporations Institutions Institutions Firms Individuals Other T O T A L Nonresident
1992 -- -- 209 2,863 6,028 202,559 6,784 218,443 41,8181993 -- -- 75 3,019 7,830 226,323 7,389 244,636 49,5501994 -- -- 527 104 12,068 255,392 6,953 275,044 47,4091995 -- 3 55 265 9,679 262,060 7,137 279,199 46,7421996 -- -- -- 478 10,493 273,980 6,387 291,338 53,3541997 -- 2 122 29 25,238 355,546 11,133 392,070 53,5241998 -- 302 296 737 20,934 403,759 10,317 436,345 59,3301999 -- 168 1,083 677 25,203 509,860 8,735 545,726 62,6212000 -- 66 828 1,262 22,697 555,439 17,520 597,812 60,2532001 -- 30 89 262 24,364 571,722 9,836 606,303 54,5662002 -- 77 362 253 23,702 602,951 7,412 634,757 55,6132003 -- 63 139 806 19,960 652,595 8,538 682,101 75,3232002QTR. I -- 64 170 118 24,774 596,318 9,705 631,149 54,097QTR. II -- 46 233 159 23,368 620,148 9,710 653,664 53,920
QTR. III -- 12 277 201 23,687 609,633 10,061 643,871 54,244QTR. IV -- 77 362 253 23,702 602,951 7,412 634,757 55,6132003Jan. -- 89 362 301 22,112 607,352 7,876 638,092 61,465Feb. -- 59 379 205 22,597 614,854 12,114 650,208 61,553Mar. -- 67 421 233 23,065 616,448 11,255 651,489 62,740Apr. -- 65 421 212 22,350 628,033 11,210 662,291 60,025May -- 111 422 235 22,673 635,224 13,726 672,391 63,033Jun. -- 30 422 351 23,028 637,227 13,842 674,900 64,359Jul. -- 68 426 582 23,314 640,366 11,491 676,247 64,659Aug. -- 69 482 594 21,549 646,283 11,554 680,531 66,789Sep. -- 61 543 620 20,950 645,389 9,441 677,004 68,495Oct. -- 21 107 669 20,384 646,254 9,459 676,894 69,128Nov. -- 26 119 751 20,755 654,103 8,394 684,148 71,844Dec. -- 63 139 806 19,960 652,595 8,538 682,101 75,3232004Jan. -- 89 139 810 20,384 662,261 8,295 691,978 75,520Feb. -- 92 155 588 20,847 677,086 8,112 706,880 76,918Mar. -- 81 193 429 19,865 685,635 7,848 714,051 83,954Apr. -- 108 217 133 20,073 701,518 8,171 730,220 74,616May -- 135 217 149 20,174 714,850 9,032 744,557 76,615Jun. -- 155 241 163 20,220 714,883 10,164 745,826 75,578
SOURCE: The Central Bank of The Bahamas
Table 3.7 Commercial Bank: Savings Deposits by Depositors (All Currencies)
Government
25
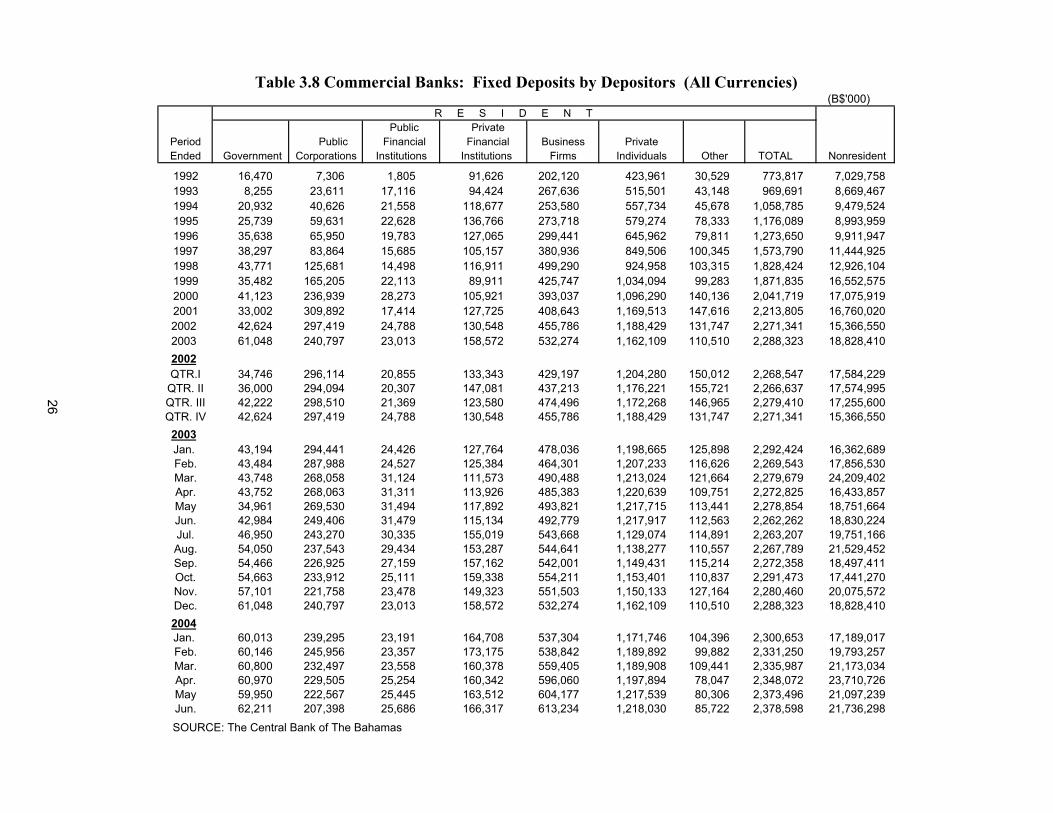
(B$'000)R E S I D E N T
Public PrivatePeriod Financial Financial Business Private Ended Institutions Institutions Firms Individuals Other TOTAL Nonresident
1992 16,470 7,306 1,805 91,626 202,120 423,961 30,529 773,817 7,029,7581993 8,255 23,611 17,116 94,424 267,636 515,501 43,148 969,691 8,669,4671994 20,932 40,626 21,558 118,677 253,580 557,734 45,678 1,058,785 9,479,5241995 25,739 59,631 22,628 136,766 273,718 579,274 78,333 1,176,089 8,993,9591996 35,638 65,950 19,783 127,065 299,441 645,962 79,811 1,273,650 9,911,9471997 38,297 83,864 15,685 105,157 380,936 849,506 100,345 1,573,790 11,444,9251998 43,771 125,681 14,498 116,911 499,290 924,958 103,315 1,828,424 12,926,1041999 35,482 165,205 22,113 89,911 425,747 1,034,094 99,283 1,871,835 16,552,5752000 41,123 236,939 28,273 105,921 393,037 1,096,290 140,136 2,041,719 17,075,9192001 33,002 309,892 17,414 127,725 408,643 1,169,513 147,616 2,213,805 16,760,0202002 42,624 297,419 24,788 130,548 455,786 1,188,429 131,747 2,271,341 15,366,5502003 61,048 240,797 23,013 158,572 532,274 1,162,109 110,510 2,288,323 18,828,4102002QTR.I 34,746 296,114 20,855 133,343 429,197 1,204,280 150,012 2,268,547 17,584,229
QTR. II 36,000 294,094 20,307 147,081 437,213 1,176,221 155,721 2,266,637 17,574,995QTR. III 42,222 298,510 21,369 123,580 474,496 1,172,268 146,965 2,279,410 17,255,600QTR. IV 42,624 297,419 24,788 130,548 455,786 1,188,429 131,747 2,271,341 15,366,5502003Jan. 43,194 294,441 24,426 127,764 478,036 1,198,665 125,898 2,292,424 16,362,689Feb. 43,484 287,988 24,527 125,384 464,301 1,207,233 116,626 2,269,543 17,856,530Mar. 43,748 268,058 31,124 111,573 490,488 1,213,024 121,664 2,279,679 24,209,402Apr. 43,752 268,063 31,311 113,926 485,383 1,220,639 109,751 2,272,825 16,433,857May 34,961 269,530 31,494 117,892 493,821 1,217,715 113,441 2,278,854 18,751,664Jun. 42,984 249,406 31,479 115,134 492,779 1,217,917 112,563 2,262,262 18,830,224Jul. 46,950 243,270 30,335 155,019 543,668 1,129,074 114,891 2,263,207 19,751,166Aug. 54,050 237,543 29,434 153,287 544,641 1,138,277 110,557 2,267,789 21,529,452Sep. 54,466 226,925 27,159 157,162 542,001 1,149,431 115,214 2,272,358 18,497,411Oct. 54,663 233,912 25,111 159,338 554,211 1,153,401 110,837 2,291,473 17,441,270Nov. 57,101 221,758 23,478 149,323 551,503 1,150,133 127,164 2,280,460 20,075,572Dec. 61,048 240,797 23,013 158,572 532,274 1,162,109 110,510 2,288,323 18,828,4102004Jan. 60,013 239,295 23,191 164,708 537,304 1,171,746 104,396 2,300,653 17,189,017Feb. 60,146 245,956 23,357 173,175 538,842 1,189,892 99,882 2,331,250 19,793,257Mar. 60,800 232,497 23,558 160,378 559,405 1,189,908 109,441 2,335,987 21,173,034Apr. 60,970 229,505 25,254 160,342 596,060 1,197,894 78,047 2,348,072 23,710,726May 59,950 222,567 25,445 163,512 604,177 1,217,539 80,306 2,373,496 21,097,239Jun. 62,211 207,398 25,686 166,317 613,234 1,218,030 85,722 2,378,598 21,736,298
SOURCE: The Central Bank of The Bahamas
Table 3.8 Commercial Banks: Fixed Deposits by Depositors (All Currencies)
Government Public
Corporations
26
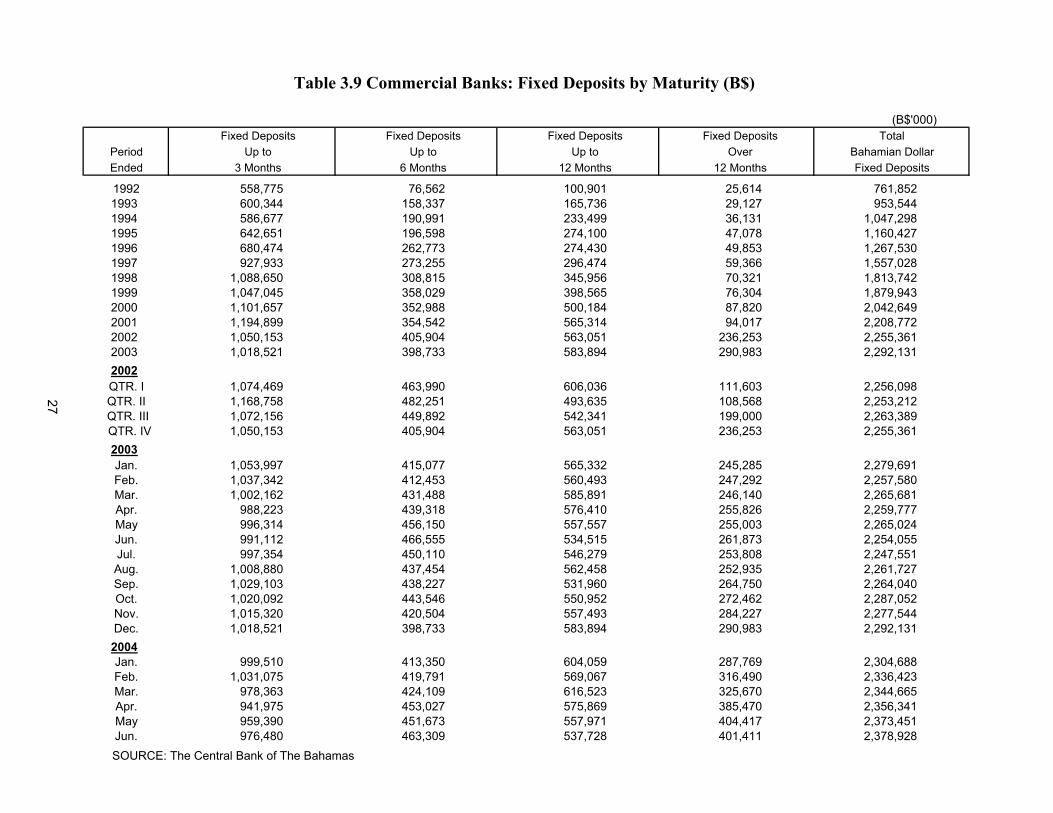
Table 3.9 Commercial Banks: Fixed Deposits by Maturity (B$)
(B$'000) Fixed Deposits Fixed Deposits Fixed Deposits Fixed Deposits Total
Period Up to Up to Up to Over Bahamian DollarEnded 3 Months 6 Months 12 Months 12 Months Fixed Deposits
1992 558,775 76,562 100,901 25,614 761,8521993 600,344 158,337 165,736 29,127 953,5441994 586,677 190,991 233,499 36,131 1,047,2981995 642,651 196,598 274,100 47,078 1,160,4271996 680,474 262,773 274,430 49,853 1,267,5301997 927,933 273,255 296,474 59,366 1,557,0281998 1,088,650 308,815 345,956 70,321 1,813,7421999 1,047,045 358,029 398,565 76,304 1,879,9432000 1,101,657 352,988 500,184 87,820 2,042,6492001 1,194,899 354,542 565,314 94,017 2,208,7722002 1,050,153 405,904 563,051 236,253 2,255,3612003 1,018,521 398,733 583,894 290,983 2,292,1312002QTR. I 1,074,469 463,990 606,036 111,603 2,256,098QTR. II 1,168,758 482,251 493,635 108,568 2,253,212
QTR. III 1,072,156 449,892 542,341 199,000 2,263,389 QTR. IV 1,050,153 405,904 563,051 236,253 2,255,361
2003Jan. 1,053,997 415,077 565,332 245,285 2,279,691Feb. 1,037,342 412,453 560,493 247,292 2,257,580Mar. 1,002,162 431,488 585,891 246,140 2,265,681Apr. 988,223 439,318 576,410 255,826 2,259,777May 996,314 456,150 557,557 255,003 2,265,024Jun. 991,112 466,555 534,515 261,873 2,254,055Jul. 997,354 450,110 546,279 253,808 2,247,551Aug. 1,008,880 437,454 562,458 252,935 2,261,727Sep. 1,029,103 438,227 531,960 264,750 2,264,040Oct. 1,020,092 443,546 550,952 272,462 2,287,052Nov. 1,015,320 420,504 557,493 284,227 2,277,544Dec. 1,018,521 398,733 583,894 290,983 2,292,1312004Jan. 999,510 413,350 604,059 287,769 2,304,688Feb. 1,031,075 419,791 569,067 316,490 2,336,423Mar. 978,363 424,109 616,523 325,670 2,344,665Apr. 941,975 453,027 575,869 385,470 2,356,341May 959,390 451,673 557,971 404,417 2,373,451Jun. 976,480 463,309 537,728 401,411 2,378,928
SOURCE: The Central Bank of The Bahamas
27
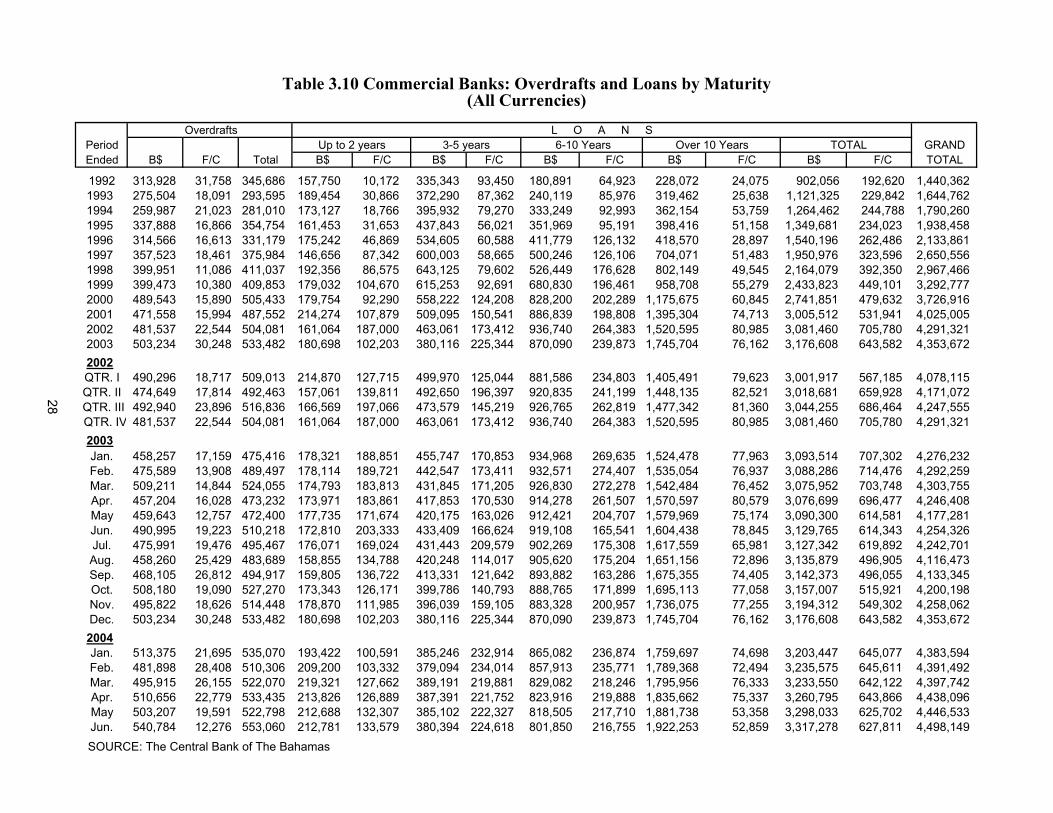
Overdrafts L O A N SPeriod Up to 2 years 3-5 years 6-10 Years Over 10 Years TOTAL GRANDEnded B$ F/C Total B$ F/C B$ F/C B$ F/C B$ F/C B$ F/C TOTAL
1992 313,928 31,758 345,686 157,750 10,172 335,343 93,450 180,891 64,923 228,072 24,075 902,056 192,620 1,440,3621993 275,504 18,091 293,595 189,454 30,866 372,290 87,362 240,119 85,976 319,462 25,638 1,121,325 229,842 1,644,7621994 259,987 21,023 281,010 173,127 18,766 395,932 79,270 333,249 92,993 362,154 53,759 1,264,462 244,788 1,790,2601995 337,888 16,866 354,754 161,453 31,653 437,843 56,021 351,969 95,191 398,416 51,158 1,349,681 234,023 1,938,4581996 314,566 16,613 331,179 175,242 46,869 534,605 60,588 411,779 126,132 418,570 28,897 1,540,196 262,486 2,133,8611997 357,523 18,461 375,984 146,656 87,342 600,003 58,665 500,246 126,106 704,071 51,483 1,950,976 323,596 2,650,5561998 399,951 11,086 411,037 192,356 86,575 643,125 79,602 526,449 176,628 802,149 49,545 2,164,079 392,350 2,967,4661999 399,473 10,380 409,853 179,032 104,670 615,253 92,691 680,830 196,461 958,708 55,279 2,433,823 449,101 3,292,7772000 489,543 15,890 505,433 179,754 92,290 558,222 124,208 828,200 202,289 1,175,675 60,845 2,741,851 479,632 3,726,9162001 471,558 15,994 487,552 214,274 107,879 509,095 150,541 886,839 198,808 1,395,304 74,713 3,005,512 531,941 4,025,0052002 481,537 22,544 504,081 161,064 187,000 463,061 173,412 936,740 264,383 1,520,595 80,985 3,081,460 705,780 4,291,3212003 503,234 30,248 533,482 180,698 102,203 380,116 225,344 870,090 239,873 1,745,704 76,162 3,176,608 643,582 4,353,6722002QTR. I 490,296 18,717 509,013 214,870 127,715 499,970 125,044 881,586 234,803 1,405,491 79,623 3,001,917 567,185 4,078,115QTR. II 474,649 17,814 492,463 157,061 139,811 492,650 196,397 920,835 241,199 1,448,135 82,521 3,018,681 659,928 4,171,072
QTR. III 492,940 23,896 516,836 166,569 197,066 473,579 145,219 926,765 262,819 1,477,342 81,360 3,044,255 686,464 4,247,555 QTR. IV 481,537 22,544 504,081 161,064 187,000 463,061 173,412 936,740 264,383 1,520,595 80,985 3,081,460 705,780 4,291,321
2003Jan. 458,257 17,159 475,416 178,321 188,851 455,747 170,853 934,968 269,635 1,524,478 77,963 3,093,514 707,302 4,276,232Feb. 475,589 13,908 489,497 178,114 189,721 442,547 173,411 932,571 274,407 1,535,054 76,937 3,088,286 714,476 4,292,259Mar. 509,211 14,844 524,055 174,793 183,813 431,845 171,205 926,830 272,278 1,542,484 76,452 3,075,952 703,748 4,303,755Apr. 457,204 16,028 473,232 173,971 183,861 417,853 170,530 914,278 261,507 1,570,597 80,579 3,076,699 696,477 4,246,408May 459,643 12,757 472,400 177,735 171,674 420,175 163,026 912,421 204,707 1,579,969 75,174 3,090,300 614,581 4,177,281Jun. 490,995 19,223 510,218 172,810 203,333 433,409 166,624 919,108 165,541 1,604,438 78,845 3,129,765 614,343 4,254,326Jul. 475,991 19,476 495,467 176,071 169,024 431,443 209,579 902,269 175,308 1,617,559 65,981 3,127,342 619,892 4,242,701Aug. 458,260 25,429 483,689 158,855 134,788 420,248 114,017 905,620 175,204 1,651,156 72,896 3,135,879 496,905 4,116,473Sep. 468,105 26,812 494,917 159,805 136,722 413,331 121,642 893,882 163,286 1,675,355 74,405 3,142,373 496,055 4,133,345Oct. 508,180 19,090 527,270 173,343 126,171 399,786 140,793 888,765 171,899 1,695,113 77,058 3,157,007 515,921 4,200,198Nov. 495,822 18,626 514,448 178,870 111,985 396,039 159,105 883,328 200,957 1,736,075 77,255 3,194,312 549,302 4,258,062Dec. 503,234 30,248 533,482 180,698 102,203 380,116 225,344 870,090 239,873 1,745,704 76,162 3,176,608 643,582 4,353,6722004Jan. 513,375 21,695 535,070 193,422 100,591 385,246 232,914 865,082 236,874 1,759,697 74,698 3,203,447 645,077 4,383,594Feb. 481,898 28,408 510,306 209,200 103,332 379,094 234,014 857,913 235,771 1,789,368 72,494 3,235,575 645,611 4,391,492Mar. 495,915 26,155 522,070 219,321 127,662 389,191 219,881 829,082 218,246 1,795,956 76,333 3,233,550 642,122 4,397,742Apr. 510,656 22,779 533,435 213,826 126,889 387,391 221,752 823,916 219,888 1,835,662 75,337 3,260,795 643,866 4,438,096May 503,207 19,591 522,798 212,688 132,307 385,102 222,327 818,505 217,710 1,881,738 53,358 3,298,033 625,702 4,446,533Jun. 540,784 12,276 553,060 212,781 133,579 380,394 224,618 801,850 216,755 1,922,253 52,859 3,317,278 627,811 4,498,149
SOURCE: The Central Bank of The Bahamas
Table 3.10 Commercial Banks: Overdrafts and Loans by Maturity(All Currencies)
28
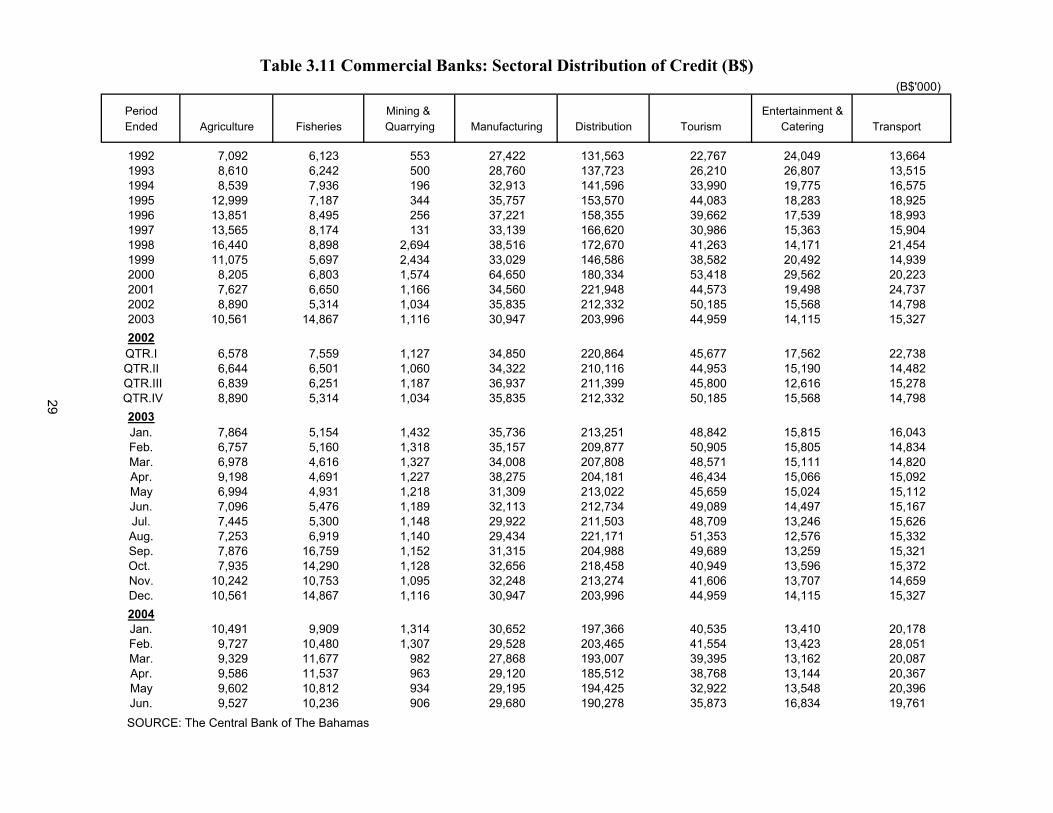
Table 3.11 Commercial Banks: Sectoral Distribution of Credit (B$) (B$'000)
Period Mining & Entertainment &Ended Agriculture Fisheries Quarrying Manufacturing Distribution Tourism Catering Transport
1992 7,092 6,123 553 27,422 131,563 22,767 24,049 13,6641993 8,610 6,242 500 28,760 137,723 26,210 26,807 13,5151994 8,539 7,936 196 32,913 141,596 33,990 19,775 16,5751995 12,999 7,187 344 35,757 153,570 44,083 18,283 18,9251996 13,851 8,495 256 37,221 158,355 39,662 17,539 18,9931997 13,565 8,174 131 33,139 166,620 30,986 15,363 15,9041998 16,440 8,898 2,694 38,516 172,670 41,263 14,171 21,4541999 11,075 5,697 2,434 33,029 146,586 38,582 20,492 14,9392000 8,205 6,803 1,574 64,650 180,334 53,418 29,562 20,2232001 7,627 6,650 1,166 34,560 221,948 44,573 19,498 24,7372002 8,890 5,314 1,034 35,835 212,332 50,185 15,568 14,7982003 10,561 14,867 1,116 30,947 203,996 44,959 14,115 15,3272002QTR.I 6,578 7,559 1,127 34,850 220,864 45,677 17,562 22,738QTR.II 6,644 6,501 1,060 34,322 210,116 44,953 15,190 14,482
QTR.III 6,839 6,251 1,187 36,937 211,399 45,800 12,616 15,278 QTR.IV 8,890 5,314 1,034 35,835 212,332 50,185 15,568 14,798
2003Jan. 7,864 5,154 1,432 35,736 213,251 48,842 15,815 16,043Feb. 6,757 5,160 1,318 35,157 209,877 50,905 15,805 14,834Mar. 6,978 4,616 1,327 34,008 207,808 48,571 15,111 14,820Apr. 9,198 4,691 1,227 38,275 204,181 46,434 15,066 15,092May 6,994 4,931 1,218 31,309 213,022 45,659 15,024 15,112Jun. 7,096 5,476 1,189 32,113 212,734 49,089 14,497 15,167Jul. 7,445 5,300 1,148 29,922 211,503 48,709 13,246 15,626Aug. 7,253 6,919 1,140 29,434 221,171 51,353 12,576 15,332Sep. 7,876 16,759 1,152 31,315 204,988 49,689 13,259 15,321Oct. 7,935 14,290 1,128 32,656 218,458 40,949 13,596 15,372Nov. 10,242 10,753 1,095 32,248 213,274 41,606 13,707 14,659Dec. 10,561 14,867 1,116 30,947 203,996 44,959 14,115 15,3272004Jan. 10,491 9,909 1,314 30,652 197,366 40,535 13,410 20,178Feb. 9,727 10,480 1,307 29,528 203,465 41,554 13,423 28,051Mar. 9,329 11,677 982 27,868 193,007 39,395 13,162 20,087Apr. 9,586 11,537 963 29,120 185,512 38,768 13,144 20,367May 9,602 10,812 934 29,195 194,425 32,922 13,548 20,396Jun. 9,527 10,236 906 29,680 190,278 35,873 16,834 19,761
SOURCE: The Central Bank of The Bahamas
29
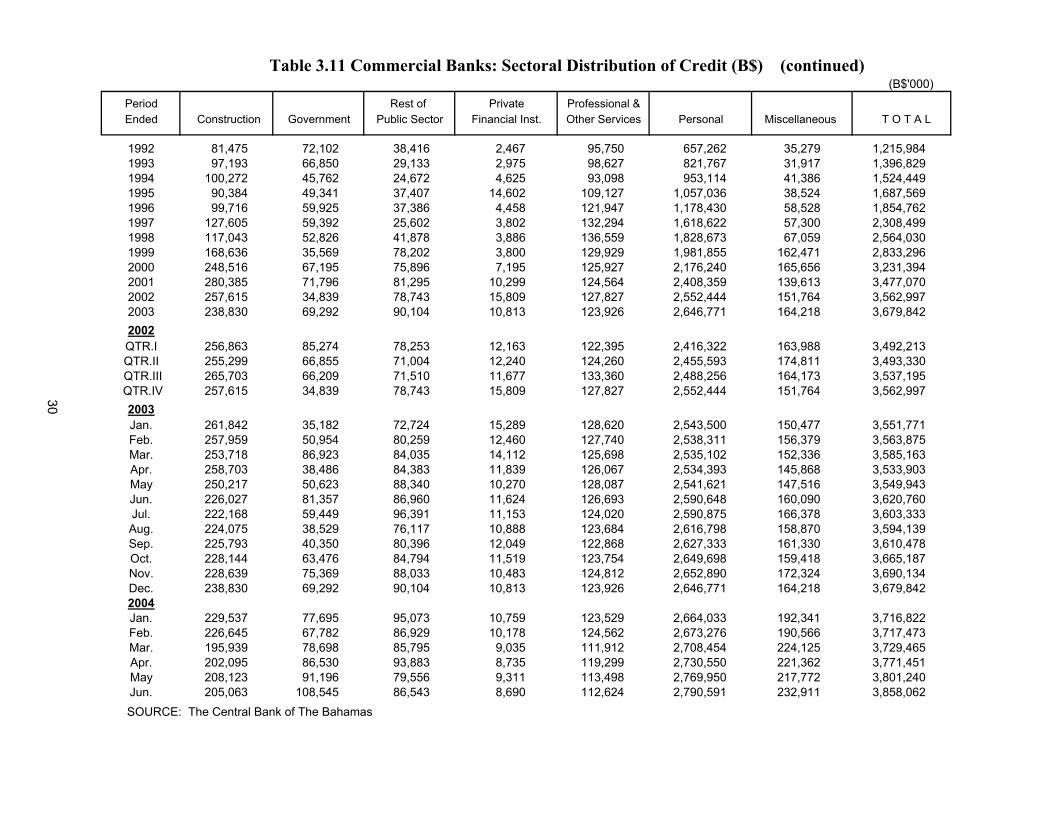
Table 3.11 Commercial Banks: Sectoral Distribution of Credit (B$) (continued)(B$'000)
Period Rest of Private Professional &Ended Construction Government Public Sector Financial Inst. Other Services Personal Miscellaneous T O T A L
1992 81,475 72,102 38,416 2,467 95,750 657,262 35,279 1,215,9841993 97,193 66,850 29,133 2,975 98,627 821,767 31,917 1,396,8291994 100,272 45,762 24,672 4,625 93,098 953,114 41,386 1,524,4491995 90,384 49,341 37,407 14,602 109,127 1,057,036 38,524 1,687,5691996 99,716 59,925 37,386 4,458 121,947 1,178,430 58,528 1,854,7621997 127,605 59,392 25,602 3,802 132,294 1,618,622 57,300 2,308,4991998 117,043 52,826 41,878 3,886 136,559 1,828,673 67,059 2,564,0301999 168,636 35,569 78,202 3,800 129,929 1,981,855 162,471 2,833,2962000 248,516 67,195 75,896 7,195 125,927 2,176,240 165,656 3,231,3942001 280,385 71,796 81,295 10,299 124,564 2,408,359 139,613 3,477,0702002 257,615 34,839 78,743 15,809 127,827 2,552,444 151,764 3,562,9972003 238,830 69,292 90,104 10,813 123,926 2,646,771 164,218 3,679,8422002QTR.I 256,863 85,274 78,253 12,163 122,395 2,416,322 163,988 3,492,213QTR.II 255,299 66,855 71,004 12,240 124,260 2,455,593 174,811 3,493,330
QTR.III 265,703 66,209 71,510 11,677 133,360 2,488,256 164,173 3,537,195 QTR.IV 257,615 34,839 78,743 15,809 127,827 2,552,444 151,764 3,562,997
2003Jan. 261,842 35,182 72,724 15,289 128,620 2,543,500 150,477 3,551,771Feb. 257,959 50,954 80,259 12,460 127,740 2,538,311 156,379 3,563,875Mar. 253,718 86,923 84,035 14,112 125,698 2,535,102 152,336 3,585,163Apr. 258,703 38,486 84,383 11,839 126,067 2,534,393 145,868 3,533,903May 250,217 50,623 88,340 10,270 128,087 2,541,621 147,516 3,549,943Jun. 226,027 81,357 86,960 11,624 126,693 2,590,648 160,090 3,620,760Jul. 222,168 59,449 96,391 11,153 124,020 2,590,875 166,378 3,603,333Aug. 224,075 38,529 76,117 10,888 123,684 2,616,798 158,870 3,594,139Sep. 225,793 40,350 80,396 12,049 122,868 2,627,333 161,330 3,610,478Oct. 228,144 63,476 84,794 11,519 123,754 2,649,698 159,418 3,665,187Nov. 228,639 75,369 88,033 10,483 124,812 2,652,890 172,324 3,690,134Dec. 238,830 69,292 90,104 10,813 123,926 2,646,771 164,218 3,679,8422004Jan. 229,537 77,695 95,073 10,759 123,529 2,664,033 192,341 3,716,822Feb. 226,645 67,782 86,929 10,178 124,562 2,673,276 190,566 3,717,473Mar. 195,939 78,698 85,795 9,035 111,912 2,708,454 224,125 3,729,465Apr. 202,095 86,530 93,883 8,735 119,299 2,730,550 221,362 3,771,451May 208,123 91,196 79,556 9,311 113,498 2,769,950 217,772 3,801,240Jun. 205,063 108,545 86,543 8,690 112,624 2,790,591 232,911 3,858,062
SOURCE: The Central Bank of The Bahamas
30
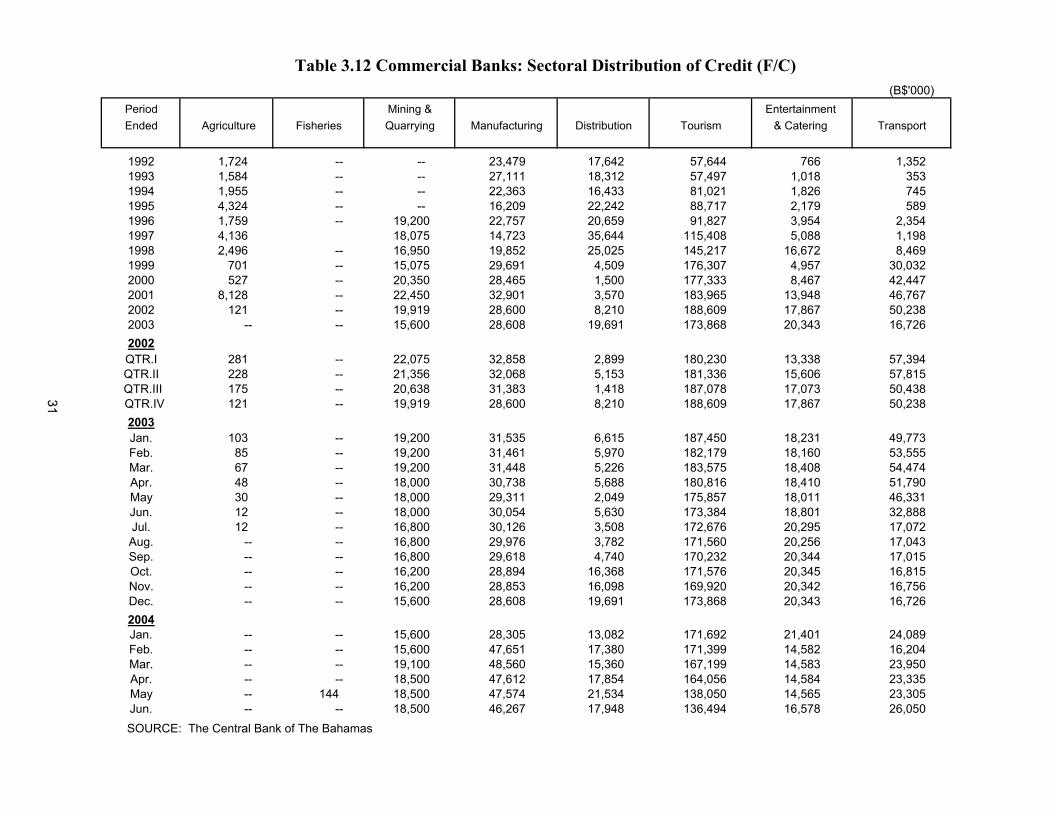
Table 3.12 Commercial Banks: Sectoral Distribution of Credit (F/C) (B$'000)
Period Mining & EntertainmentEnded Agriculture Fisheries Quarrying Manufacturing Distribution Tourism & Catering Transport
1992 1,724 -- -- 23,479 17,642 57,644 766 1,3521993 1,584 -- -- 27,111 18,312 57,497 1,018 3531994 1,955 -- -- 22,363 16,433 81,021 1,826 7451995 4,324 -- -- 16,209 22,242 88,717 2,179 5891996 1,759 -- 19,200 22,757 20,659 91,827 3,954 2,3541997 4,136 18,075 14,723 35,644 115,408 5,088 1,1981998 2,496 -- 16,950 19,852 25,025 145,217 16,672 8,4691999 701 -- 15,075 29,691 4,509 176,307 4,957 30,0322000 527 -- 20,350 28,465 1,500 177,333 8,467 42,4472001 8,128 -- 22,450 32,901 3,570 183,965 13,948 46,7672002 121 -- 19,919 28,600 8,210 188,609 17,867 50,2382003 -- -- 15,600 28,608 19,691 173,868 20,343 16,7262002QTR.I 281 -- 22,075 32,858 2,899 180,230 13,338 57,394QTR.II 228 -- 21,356 32,068 5,153 181,336 15,606 57,815
QTR.III 175 -- 20,638 31,383 1,418 187,078 17,073 50,438 QTR.IV 121 -- 19,919 28,600 8,210 188,609 17,867 50,238
2003Jan. 103 -- 19,200 31,535 6,615 187,450 18,231 49,773Feb. 85 -- 19,200 31,461 5,970 182,179 18,160 53,555Mar. 67 -- 19,200 31,448 5,226 183,575 18,408 54,474Apr. 48 -- 18,000 30,738 5,688 180,816 18,410 51,790May 30 -- 18,000 29,311 2,049 175,857 18,011 46,331Jun. 12 -- 18,000 30,054 5,630 173,384 18,801 32,888Jul. 12 -- 16,800 30,126 3,508 172,676 20,295 17,072Aug. -- -- 16,800 29,976 3,782 171,560 20,256 17,043Sep. -- -- 16,800 29,618 4,740 170,232 20,344 17,015Oct. -- -- 16,200 28,894 16,368 171,576 20,345 16,815Nov. -- -- 16,200 28,853 16,098 169,920 20,342 16,756Dec. -- -- 15,600 28,608 19,691 173,868 20,343 16,7262004Jan. -- -- 15,600 28,305 13,082 171,692 21,401 24,089Feb. -- -- 15,600 47,651 17,380 171,399 14,582 16,204Mar. -- -- 19,100 48,560 15,360 167,199 14,583 23,950Apr. -- -- 18,500 47,612 17,854 164,056 14,584 23,335May -- 144 18,500 47,574 21,534 138,050 14,565 23,305Jun. -- -- 18,500 46,267 17,948 136,494 16,578 26,050
SOURCE: The Central Bank of The Bahamas
31
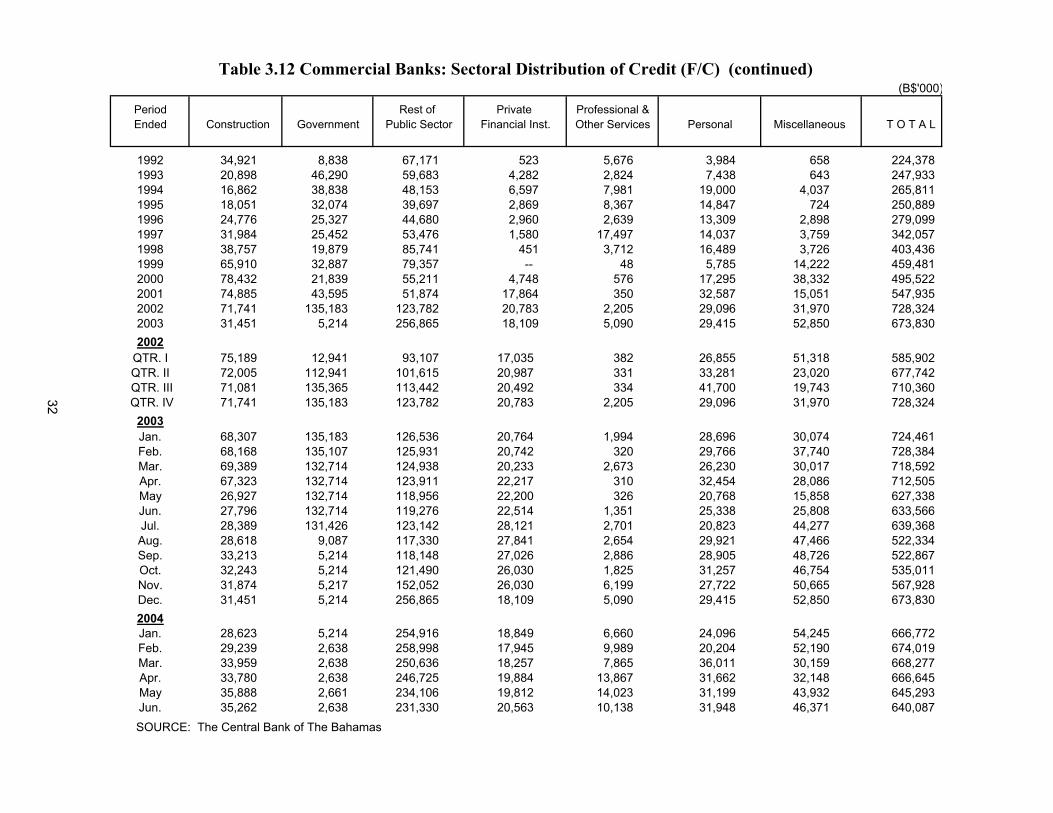
Table 3.12 Commercial Banks: Sectoral Distribution of Credit (F/C) (continued) (B$'000)
Period Rest of Private Professional &Ended Construction Government Public Sector Financial Inst. Other Services Personal Miscellaneous T O T A L
1992 34,921 8,838 67,171 523 5,676 3,984 658 224,3781993 20,898 46,290 59,683 4,282 2,824 7,438 643 247,9331994 16,862 38,838 48,153 6,597 7,981 19,000 4,037 265,8111995 18,051 32,074 39,697 2,869 8,367 14,847 724 250,8891996 24,776 25,327 44,680 2,960 2,639 13,309 2,898 279,0991997 31,984 25,452 53,476 1,580 17,497 14,037 3,759 342,0571998 38,757 19,879 85,741 451 3,712 16,489 3,726 403,4361999 65,910 32,887 79,357 -- 48 5,785 14,222 459,4812000 78,432 21,839 55,211 4,748 576 17,295 38,332 495,5222001 74,885 43,595 51,874 17,864 350 32,587 15,051 547,9352002 71,741 135,183 123,782 20,783 2,205 29,096 31,970 728,3242003 31,451 5,214 256,865 18,109 5,090 29,415 52,850 673,8302002
QTR. I 75,189 12,941 93,107 17,035 382 26,855 51,318 585,902QTR. II 72,005 112,941 101,615 20,987 331 33,281 23,020 677,742
QTR. III 71,081 135,365 113,442 20,492 334 41,700 19,743 710,360 QTR. IV 71,741 135,183 123,782 20,783 2,205 29,096 31,970 728,324
2003Jan. 68,307 135,183 126,536 20,764 1,994 28,696 30,074 724,461Feb. 68,168 135,107 125,931 20,742 320 29,766 37,740 728,384Mar. 69,389 132,714 124,938 20,233 2,673 26,230 30,017 718,592Apr. 67,323 132,714 123,911 22,217 310 32,454 28,086 712,505May 26,927 132,714 118,956 22,200 326 20,768 15,858 627,338Jun. 27,796 132,714 119,276 22,514 1,351 25,338 25,808 633,566Jul. 28,389 131,426 123,142 28,121 2,701 20,823 44,277 639,368Aug. 28,618 9,087 117,330 27,841 2,654 29,921 47,466 522,334Sep. 33,213 5,214 118,148 27,026 2,886 28,905 48,726 522,867Oct. 32,243 5,214 121,490 26,030 1,825 31,257 46,754 535,011Nov. 31,874 5,217 152,052 26,030 6,199 27,722 50,665 567,928Dec. 31,451 5,214 256,865 18,109 5,090 29,415 52,850 673,8302004Jan. 28,623 5,214 254,916 18,849 6,660 24,096 54,245 666,772Feb. 29,239 2,638 258,998 17,945 9,989 20,204 52,190 674,019Mar. 33,959 2,638 250,636 18,257 7,865 36,011 30,159 668,277Apr. 33,780 2,638 246,725 19,884 13,867 31,662 32,148 666,645May 35,888 2,661 234,106 19,812 14,023 31,199 43,932 645,293Jun. 35,262 2,638 231,330 20,563 10,138 31,948 46,371 640,087
SOURCE: The Central Bank of The Bahamas
32
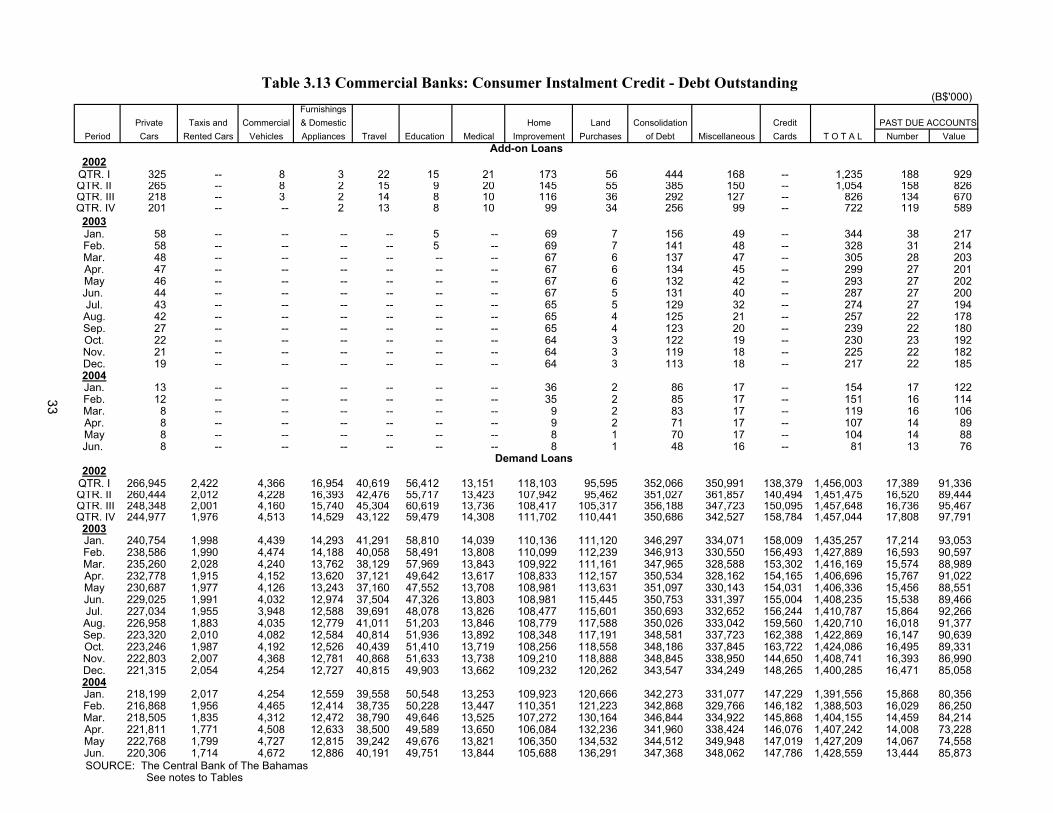
(B$'000)Furnishings
Private Taxis and Commercial & Domestic Home Land Consolidation Credit PAST DUE ACCOUNTSPeriod Cars Rented Cars Vehicles Appliances Travel Education Medical Improvement Purchases of Debt Cards T O T A L Number Value
2002QTR. I 325 -- 8 3 22 15 21 173 56 444 168 -- 1,235 188 929QTR. II 265 -- 8 2 15 9 20 145 55 385 150 -- 1,054 158 826QTR. III 218 -- 3 2 14 8 10 116 36 292 127 -- 826 134 670QTR. IV 201 -- -- 2 13 8 10 99 34 256 99 -- 722 119 589
2003Jan. 58 -- -- -- -- 5 -- 69 7 156 49 -- 344 38 217Feb. 58 -- -- -- -- 5 -- 69 7 141 48 -- 328 31 214Mar. 48 -- -- -- -- -- -- 67 6 137 47 -- 305 28 203Apr. 47 -- -- -- -- -- -- 67 6 134 45 -- 299 27 201May 46 -- -- -- -- -- -- 67 6 132 42 -- 293 27 202Jun. 44 -- -- -- -- -- -- 67 5 131 40 -- 287 27 200Jul. 43 -- -- -- -- -- -- 65 5 129 32 -- 274 27 194Aug. 42 -- -- -- -- -- -- 65 4 125 21 -- 257 22 178Sep. 27 -- -- -- -- -- -- 65 4 123 20 -- 239 22 180Oct. 22 -- -- -- -- -- -- 64 3 122 19 -- 230 23 192Nov. 21 -- -- -- -- -- -- 64 3 119 18 -- 225 22 182Dec. 19 -- -- -- -- -- -- 64 3 113 18 -- 217 22 1852004Jan. 13 -- -- -- -- -- -- 36 2 86 17 -- 154 17 122Feb. 12 -- -- -- -- -- -- 35 2 85 17 -- 151 16 114Mar. 8 -- -- -- -- -- -- 9 2 83 17 -- 119 16 106Apr. 8 -- -- -- -- -- -- 9 2 71 17 -- 107 14 89May 8 -- -- -- -- -- -- 8 1 70 17 -- 104 14 88Jun. 8 -- -- -- -- -- -- 8 1 48 16 -- 81 13 76
2002QTR. I 266,945 2,422 4,366 16,954 40,619 56,412 13,151 118,103 95,595 352,066 350,991 138,379 1,456,003 17,389 91,336QTR. II 260,444 2,012 4,228 16,393 42,476 55,717 13,423 107,942 95,462 351,027 361,857 140,494 1,451,475 16,520 89,444QTR. III 248,348 2,001 4,160 15,740 45,304 60,619 13,736 108,417 105,317 356,188 347,723 150,095 1,457,648 16,736 95,467QTR. IV 244,977 1,976 4,513 14,529 43,122 59,479 14,308 111,702 110,441 350,686 342,527 158,784 1,457,044 17,808 97,791
2003Jan. 240,754 1,998 4,439 14,293 41,291 58,810 14,039 110,136 111,120 346,297 334,071 158,009 1,435,257 17,214 93,053Feb. 238,586 1,990 4,474 14,188 40,058 58,491 13,808 110,099 112,239 346,913 330,550 156,493 1,427,889 16,593 90,597Mar. 235,260 2,028 4,240 13,762 38,129 57,969 13,843 109,922 111,161 347,965 328,588 153,302 1,416,169 15,574 88,989Apr. 232,778 1,915 4,152 13,620 37,121 49,642 13,617 108,833 112,157 350,534 328,162 154,165 1,406,696 15,767 91,022May 230,687 1,977 4,126 13,243 37,160 47,552 13,708 108,981 113,631 351,097 330,143 154,031 1,406,336 15,456 88,551Jun. 229,025 1,991 4,032 12,974 37,504 47,326 13,803 108,981 115,445 350,753 331,397 155,004 1,408,235 15,538 89,466Jul. 227,034 1,955 3,948 12,588 39,691 48,078 13,826 108,477 115,601 350,693 332,652 156,244 1,410,787 15,864 92,266Aug. 226,958 1,883 4,035 12,779 41,011 51,203 13,846 108,779 117,588 350,026 333,042 159,560 1,420,710 16,018 91,377Sep. 223,320 2,010 4,082 12,584 40,814 51,936 13,892 108,348 117,191 348,581 337,723 162,388 1,422,869 16,147 90,639Oct. 223,246 1,987 4,192 12,526 40,439 51,410 13,719 108,256 118,558 348,186 337,845 163,722 1,424,086 16,495 89,331Nov. 222,803 2,007 4,368 12,781 40,868 51,633 13,738 109,210 118,888 348,845 338,950 144,650 1,408,741 16,393 86,990Dec. 221,315 2,054 4,254 12,727 40,815 49,903 13,662 109,232 120,262 343,547 334,249 148,265 1,400,285 16,471 85,0582004Jan. 218,199 2,017 4,254 12,559 39,558 50,548 13,253 109,923 120,666 342,273 331,077 147,229 1,391,556 15,868 80,356Feb. 216,868 1,956 4,465 12,414 38,735 50,228 13,447 110,351 121,223 342,868 329,766 146,182 1,388,503 16,029 86,250Mar. 218,505 1,835 4,312 12,472 38,790 49,646 13,525 107,272 130,164 346,844 334,922 145,868 1,404,155 14,459 84,214Apr. 221,811 1,771 4,508 12,633 38,500 49,589 13,650 106,084 132,236 341,960 338,424 146,076 1,407,242 14,008 73,228May 222,768 1,799 4,727 12,815 39,242 49,676 13,821 106,350 134,532 344,512 349,948 147,019 1,427,209 14,067 74,558Jun. 220,306 1,714 4,672 12,886 40,191 49,751 13,844 105,688 136,291 347,368 348,062 147,786 1,428,559 13,444 85,873
SOURCE: The Central Bank of The Bahamas See notes to Tables
MiscellaneousAdd-on Loans
Demand Loans
Table 3.13 Commercial Banks: Consumer Instalment Credit - Debt Outstanding
33
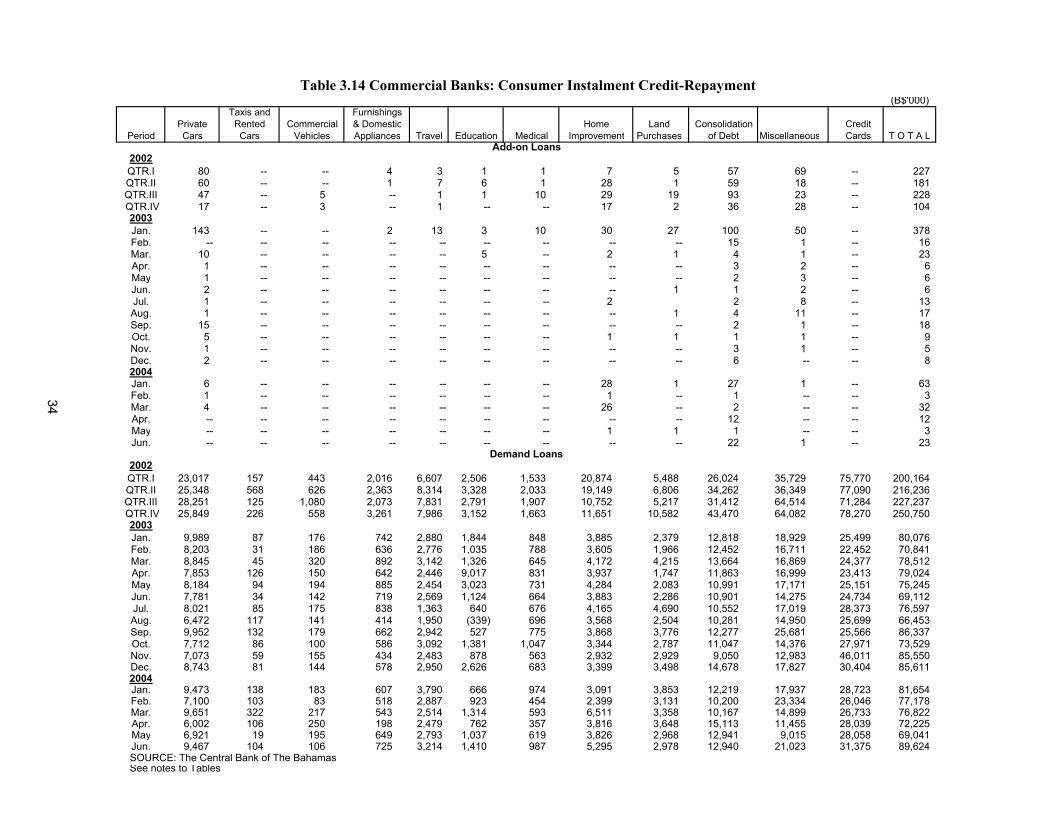
Table 3.14 Commercial Banks: Consumer Instalment Credit-Repayment(B$'000)
Taxis and Furnishings Private Rented Commercial & Domestic Home Land Consolidation Credit
Period Cars Cars Vehicles Appliances Travel Education Medical Improvement Purchases of Debt Miscellaneous Cards T O T A L
2002QTR.I 80 -- -- 4 3 1 1 7 5 57 69 -- 227QTR.II 60 -- -- 1 7 6 1 28 1 59 18 -- 181QTR.III 47 -- 5 -- 1 1 10 29 19 93 23 -- 228 QTR.IV 17 -- 3 -- 1 -- -- 17 2 36 28 -- 104
2003Jan. 143 -- -- 2 13 3 10 30 27 100 50 -- 378Feb. -- -- -- -- -- -- -- -- -- 15 1 -- 16Mar. 10 -- -- -- -- 5 -- 2 1 4 1 -- 23Apr. 1 -- -- -- -- -- -- -- -- 3 2 -- 6May 1 -- -- -- -- -- -- -- -- 2 3 -- 6Jun. 2 -- -- -- -- -- -- -- 1 1 2 -- 6Jul. 1 -- -- -- -- -- -- 2 2 8 -- 13Aug. 1 -- -- -- -- -- -- -- 1 4 11 -- 17Sep. 15 -- -- -- -- -- -- -- -- 2 1 -- 18Oct. 5 -- -- -- -- -- -- 1 1 1 1 -- 9Nov. 1 -- -- -- -- -- -- -- -- 3 1 -- 5Dec. 2 -- -- -- -- -- -- -- -- 6 -- -- 82004Jan. 6 -- -- -- -- -- -- 28 1 27 1 -- 63Feb. 1 -- -- -- -- -- -- 1 -- 1 -- -- 3Mar. 4 -- -- -- -- -- -- 26 -- 2 -- -- 32Apr. -- -- -- -- -- -- -- -- -- 12 -- -- 12May -- -- -- -- -- -- -- 1 1 1 -- -- 3Jun. -- -- -- -- -- -- -- -- -- 22 1 -- 23
2002QTR.I 23,017 157 443 2,016 6,607 2,506 1,533 20,874 5,488 26,024 35,729 75,770 200,164QTR.II 25,348 568 626 2,363 8,314 3,328 2,033 19,149 6,806 34,262 36,349 77,090 216,236QTR.III 28,251 125 1,080 2,073 7,831 2,791 1,907 10,752 5,217 31,412 64,514 71,284 227,237 QTR.IV 25,849 226 558 3,261 7,986 3,152 1,663 11,651 10,582 43,470 64,082 78,270 250,750
2003Jan. 9,989 87 176 742 2,880 1,844 848 3,885 2,379 12,818 18,929 25,499 80,076Feb. 8,203 31 186 636 2,776 1,035 788 3,605 1,966 12,452 16,711 22,452 70,841Mar. 8,845 45 320 892 3,142 1,326 645 4,172 4,215 13,664 16,869 24,377 78,512Apr. 7,853 126 150 642 2,446 9,017 831 3,937 1,747 11,863 16,999 23,413 79,024May 8,184 94 194 885 2,454 3,023 731 4,284 2,083 10,991 17,171 25,151 75,245Jun. 7,781 34 142 719 2,569 1,124 664 3,883 2,286 10,901 14,275 24,734 69,112Jul. 8,021 85 175 838 1,363 640 676 4,165 4,690 10,552 17,019 28,373 76,597Aug. 6,472 117 141 414 1,950 (339) 696 3,568 2,504 10,281 14,950 25,699 66,453Sep. 9,952 132 179 662 2,942 527 775 3,868 3,776 12,277 25,681 25,566 86,337Oct. 7,712 86 100 586 3,092 1,381 1,047 3,344 2,787 11,047 14,376 27,971 73,529Nov. 7,073 59 155 434 2,483 878 563 2,932 2,929 9,050 12,983 46,011 85,550Dec. 8,743 81 144 578 2,950 2,626 683 3,399 3,498 14,678 17,827 30,404 85,6112004Jan. 9,473 138 183 607 3,790 666 974 3,091 3,853 12,219 17,937 28,723 81,654Feb. 7,100 103 83 518 2,887 923 454 2,399 3,131 10,200 23,334 26,046 77,178Mar. 9,651 322 217 543 2,514 1,314 593 6,511 3,358 10,167 14,899 26,733 76,822Apr. 6,002 106 250 198 2,479 762 357 3,816 3,648 15,113 11,455 28,039 72,225May 6,921 19 195 649 2,793 1,037 619 3,826 2,968 12,941 9,015 28,058 69,041Jun. 9,467 104 106 725 3,214 1,410 987 5,295 2,978 12,940 21,023 31,375 89,624
SOURCE: The Central Bank of The Bahamas See notes to Tables
Add-on Loans
Demand Loans
34
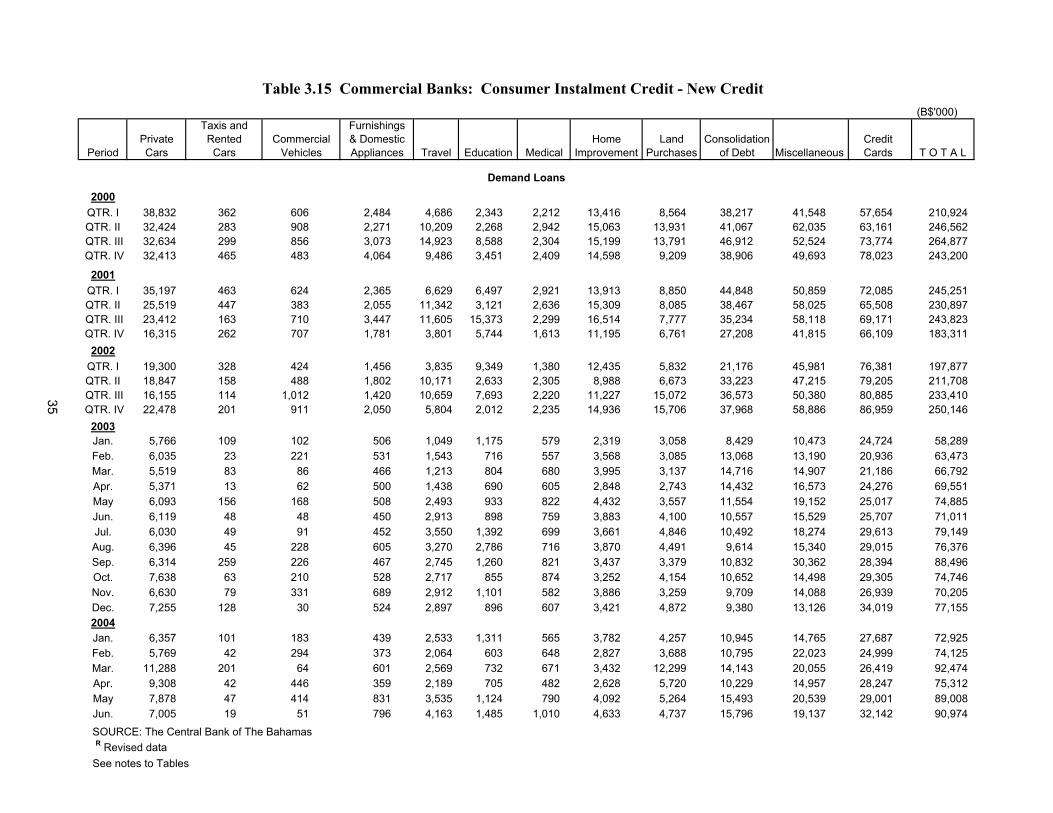
Table 3.15 Commercial Banks: Consumer Instalment Credit - New Credit (B$'000)
Taxis and Furnishings Private Rented Commercial & Domestic Home Land Consolidation Credit
Period Cars Cars Vehicles Appliances Travel Education Medical Improvement Purchases of Debt Miscellaneous Cards T O T A L
2000QTR. I 38,832 362 606 2,484 4,686 2,343 2,212 13,416 8,564 38,217 41,548 57,654 210,924QTR. II 32,424 283 908 2,271 10,209 2,268 2,942 15,063 13,931 41,067 62,035 63,161 246,562
QTR. III 32,634 299 856 3,073 14,923 8,588 2,304 15,199 13,791 46,912 52,524 73,774 264,877 QTR. IV 32,413 465 483 4,064 9,486 3,451 2,409 14,598 9,209 38,906 49,693 78,023 243,200
2001QTR. I 35,197 463 624 2,365 6,629 6,497 2,921 13,913 8,850 44,848 50,859 72,085 245,251QTR. II 25,519 447 383 2,055 11,342 3,121 2,636 15,309 8,085 38,467 58,025 65,508 230,897
QTR. III 23,412 163 710 3,447 11,605 15,373 2,299 16,514 7,777 35,234 58,118 69,171 243,823 QTR. IV 16,315 262 707 1,781 3,801 5,744 1,613 11,195 6,761 27,208 41,815 66,109 183,311
2002QTR. I 19,300 328 424 1,456 3,835 9,349 1,380 12,435 5,832 21,176 45,981 76,381 197,877QTR. II 18,847 158 488 1,802 10,171 2,633 2,305 8,988 6,673 33,223 47,215 79,205 211,708
QTR. III 16,155 114 1,012 1,420 10,659 7,693 2,220 11,227 15,072 36,573 50,380 80,885 233,410 QTR. IV 22,478 201 911 2,050 5,804 2,012 2,235 14,936 15,706 37,968 58,886 86,959 250,146
2003Jan. 5,766 109 102 506 1,049 1,175 579 2,319 3,058 8,429 10,473 24,724 58,289Feb. 6,035 23 221 531 1,543 716 557 3,568 3,085 13,068 13,190 20,936 63,473Mar. 5,519 83 86 466 1,213 804 680 3,995 3,137 14,716 14,907 21,186 66,792Apr. 5,371 13 62 500 1,438 690 605 2,848 2,743 14,432 16,573 24,276 69,551May 6,093 156 168 508 2,493 933 822 4,432 3,557 11,554 19,152 25,017 74,885Jun. 6,119 48 48 450 2,913 898 759 3,883 4,100 10,557 15,529 25,707 71,011Jul. 6,030 49 91 452 3,550 1,392 699 3,661 4,846 10,492 18,274 29,613 79,149Aug. 6,396 45 228 605 3,270 2,786 716 3,870 4,491 9,614 15,340 29,015 76,376Sep. 6,314 259 226 467 2,745 1,260 821 3,437 3,379 10,832 30,362 28,394 88,496Oct. 7,638 63 210 528 2,717 855 874 3,252 4,154 10,652 14,498 29,305 74,746Nov. 6,630 79 331 689 2,912 1,101 582 3,886 3,259 9,709 14,088 26,939 70,205Dec. 7,255 128 30 524 2,897 896 607 3,421 4,872 9,380 13,126 34,019 77,1552004Jan. 6,357 101 183 439 2,533 1,311 565 3,782 4,257 10,945 14,765 27,687 72,925Feb. 5,769 42 294 373 2,064 603 648 2,827 3,688 10,795 22,023 24,999 74,125Mar. 11,288 201 64 601 2,569 732 671 3,432 12,299 14,143 20,055 26,419 92,474Apr. 9,308 42 446 359 2,189 705 482 2,628 5,720 10,229 14,957 28,247 75,312May 7,878 47 414 831 3,535 1,124 790 4,092 5,264 15,493 20,539 29,001 89,008Jun. 7,005 19 51 796 4,163 1,485 1,010 4,633 4,737 15,796 19,137 32,142 90,974
SOURCE: The Central Bank of The Bahamas R Revised data See notes to Tables
Demand Loans
35
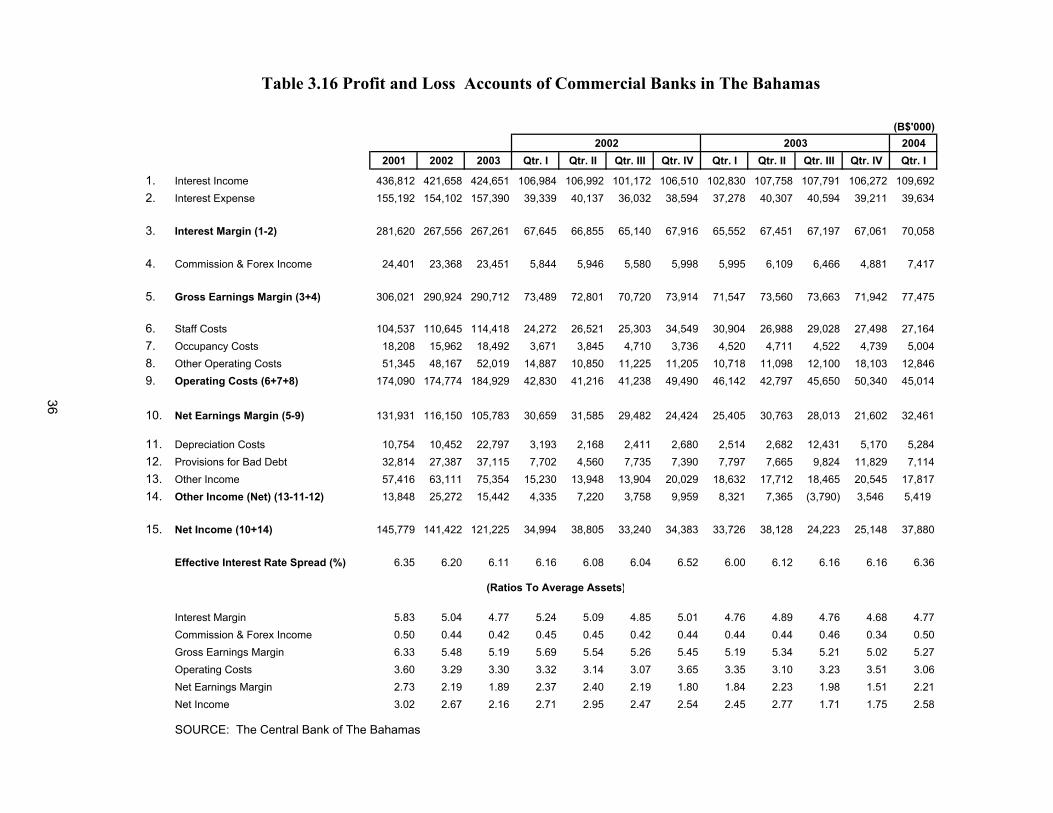
(B$'000)2004
2001 2002 2003 Qtr. I Qtr. II Qtr. III Qtr. IV Qtr. I Qtr. II Qtr. III Qtr. IV Qtr. I
1. Interest Income 436,812 421,658 424,651 106,984 106,992 101,172 106,510 102,830 107,758 107,791 106,272 109,6922. Interest Expense 155,192 154,102 157,390 39,339 40,137 36,032 38,594 37,278 40,307 40,594 39,211 39,634
3. Interest Margin (1-2) 281,620 267,556 267,261 67,645 66,855 65,140 67,916 65,552 67,451 67,197 67,061 70,058
4. Commission & Forex Income 24,401 23,368 23,451 5,844 5,946 5,580 5,998 5,995 6,109 6,466 4,881 7,417
5. Gross Earnings Margin (3+4) 306,021 290,924 290,712 73,489 72,801 70,720 73,914 71,547 73,560 73,663 71,942 77,475
6. Staff Costs 104,537 110,645 114,418 24,272 26,521 25,303 34,549 30,904 26,988 29,028 27,498 27,1647. Occupancy Costs 18,208 15,962 18,492 3,671 3,845 4,710 3,736 4,520 4,711 4,522 4,739 5,0048. Other Operating Costs 51,345 48,167 52,019 14,887 10,850 11,225 11,205 10,718 11,098 12,100 18,103 12,8469. Operating Costs (6+7+8) 174,090 174,774 184,929 42,830 41,216 41,238 49,490 46,142 42,797 45,650 50,340 45,014
10. Net Earnings Margin (5-9) 131,931 116,150 105,783 30,659 31,585 29,482 24,424 25,405 30,763 28,013 21,602 32,461
11. Depreciation Costs 10,754 10,452 22,797 3,193 2,168 2,411 2,680 2,514 2,682 12,431 5,170 5,28412. Provisions for Bad Debt 32,814 27,387 37,115 7,702 4,560 7,735 7,390 7,797 7,665 9,824 11,829 7,11413. Other Income 57,416 63,111 75,354 15,230 13,948 13,904 20,029 18,632 17,712 18,465 20,545 17,81714. Other Income (Net) (13-11-12) 13,848 25,272 15,442 4,335 7,220 3,758 9,959 8,321 7,365 (3,790) 3,546 5,419
15. Net Income (10+14) 145,779 141,422 121,225 34,994 38,805 33,240 34,383 33,726 38,128 24,223 25,148 37,880
Effective Interest Rate Spread (%) 6.35 6.20 6.11 6.16 6.08 6.04 6.52 6.00 6.12 6.16 6.16 6.36
Interest Margin 5.83 5.04 4.77 5.24 5.09 4.85 5.01 4.76 4.89 4.76 4.68 4.77Commission & Forex Income 0.50 0.44 0.42 0.45 0.45 0.42 0.44 0.44 0.44 0.46 0.34 0.50Gross Earnings Margin 6.33 5.48 5.19 5.69 5.54 5.26 5.45 5.19 5.34 5.21 5.02 5.27Operating Costs 3.60 3.29 3.30 3.32 3.14 3.07 3.65 3.35 3.10 3.23 3.51 3.06Net Earnings Margin 2.73 2.19 1.89 2.37 2.40 2.19 1.80 1.84 2.23 1.98 1.51 2.21Net Income 3.02 2.67 2.16 2.71 2.95 2.47 2.54 2.45 2.77 1.71 1.75 2.58
SOURCE: The Central Bank of The Bahamas
2002 2003
Table 3.16 Profit and Loss Accounts of Commercial Banks in The Bahamas
(Ratios To Average Assets)
36
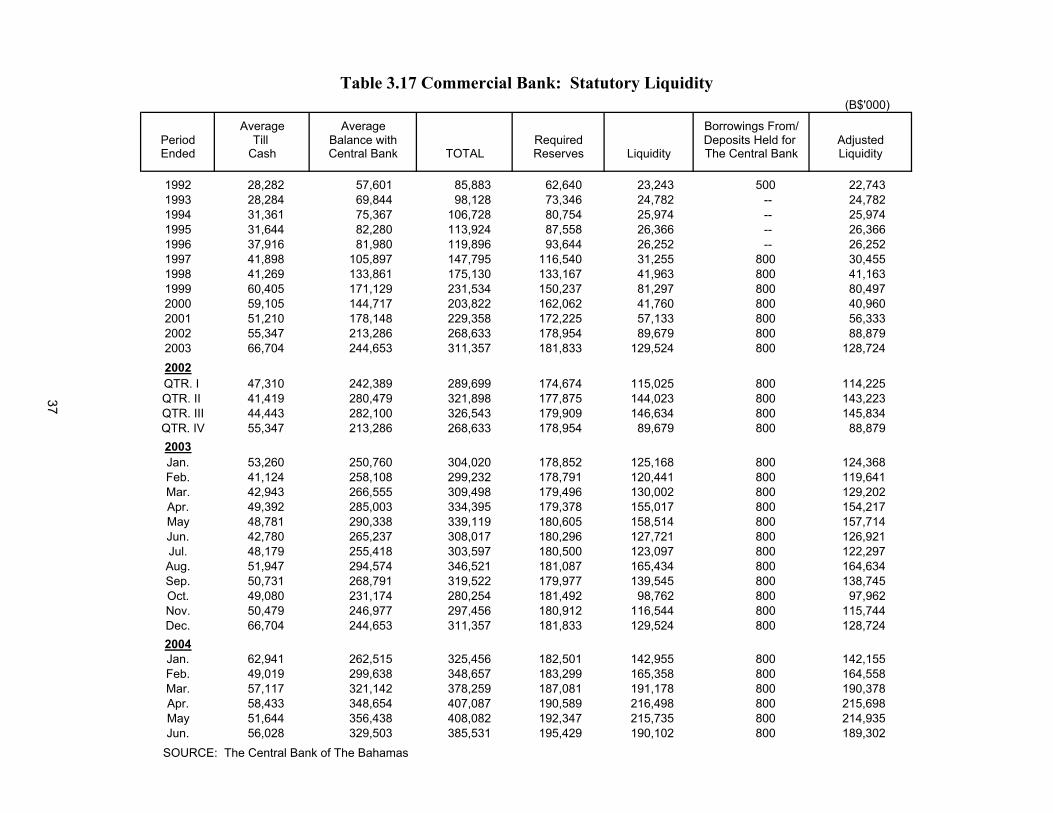
Table 3.17 Commercial Bank: Statutory Liquidity(B$'000)
Average Average Borrowings From/Period Till Balance with Required Deposits Held for AdjustedEnded Cash Central Bank TOTAL Reserves Liquidity The Central Bank Liquidity
1992 28,282 57,601 85,883 62,640 23,243 500 22,7431993 28,284 69,844 98,128 73,346 24,782 -- 24,7821994 31,361 75,367 106,728 80,754 25,974 -- 25,9741995 31,644 82,280 113,924 87,558 26,366 -- 26,3661996 37,916 81,980 119,896 93,644 26,252 -- 26,2521997 41,898 105,897 147,795 116,540 31,255 800 30,4551998 41,269 133,861 175,130 133,167 41,963 800 41,1631999 60,405 171,129 231,534 150,237 81,297 800 80,4972000 59,105 144,717 203,822 162,062 41,760 800 40,9602001 51,210 178,148 229,358 172,225 57,133 800 56,3332002 55,347 213,286 268,633 178,954 89,679 800 88,8792003 66,704 244,653 311,357 181,833 129,524 800 128,7242002
QTR. I 47,310 242,389 289,699 174,674 115,025 800 114,225 QTR. II 41,419 280,479 321,898 177,875 144,023 800 143,223
QTR. III 44,443 282,100 326,543 179,909 146,634 800 145,834 QTR. IV 55,347 213,286 268,633 178,954 89,679 800 88,879
2003Jan. 53,260 250,760 304,020 178,852 125,168 800 124,368Feb. 41,124 258,108 299,232 178,791 120,441 800 119,641Mar. 42,943 266,555 309,498 179,496 130,002 800 129,202Apr. 49,392 285,003 334,395 179,378 155,017 800 154,217May 48,781 290,338 339,119 180,605 158,514 800 157,714Jun. 42,780 265,237 308,017 180,296 127,721 800 126,921Jul. 48,179 255,418 303,597 180,500 123,097 800 122,297Aug. 51,947 294,574 346,521 181,087 165,434 800 164,634Sep. 50,731 268,791 319,522 179,977 139,545 800 138,745Oct. 49,080 231,174 280,254 181,492 98,762 800 97,962Nov. 50,479 246,977 297,456 180,912 116,544 800 115,744Dec. 66,704 244,653 311,357 181,833 129,524 800 128,7242004Jan. 62,941 262,515 325,456 182,501 142,955 800 142,155Feb. 49,019 299,638 348,657 183,299 165,358 800 164,558Mar. 57,117 321,142 378,259 187,081 191,178 800 190,378Apr. 58,433 348,654 407,087 190,589 216,498 800 215,698May 51,644 356,438 408,082 192,347 215,735 800 214,935Jun. 56,028 329,503 385,531 195,429 190,102 800 189,302
SOURCE: The Central Bank of The Bahamas
37
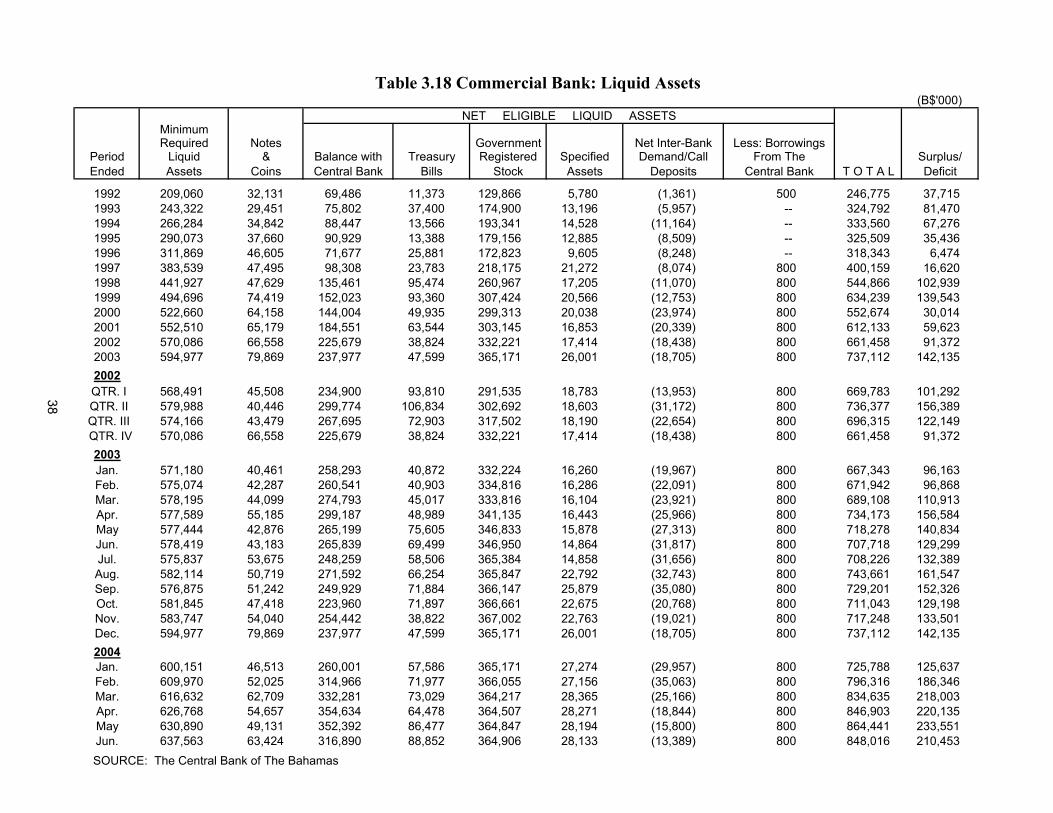
Table 3.18 Commercial Bank: Liquid Assets (B$'000)
NET ELIGIBLE LIQUID ASSETSMinimumRequired Notes Government Net Inter-Bank Less: Borrowings
Period Liquid & Balance with Treasury Registered Specified Demand/Call From The Surplus/Ended Assets Coins Central Bank Bills Stock Assets Deposits Central Bank T O T A L Deficit
1992 209,060 32,131 69,486 11,373 129,866 5,780 (1,361) 500 246,775 37,7151993 243,322 29,451 75,802 37,400 174,900 13,196 (5,957) -- 324,792 81,4701994 266,284 34,842 88,447 13,566 193,341 14,528 (11,164) -- 333,560 67,2761995 290,073 37,660 90,929 13,388 179,156 12,885 (8,509) -- 325,509 35,4361996 311,869 46,605 71,677 25,881 172,823 9,605 (8,248) -- 318,343 6,4741997 383,539 47,495 98,308 23,783 218,175 21,272 (8,074) 800 400,159 16,6201998 441,927 47,629 135,461 95,474 260,967 17,205 (11,070) 800 544,866 102,9391999 494,696 74,419 152,023 93,360 307,424 20,566 (12,753) 800 634,239 139,5432000 522,660 64,158 144,004 49,935 299,313 20,038 (23,974) 800 552,674 30,0142001 552,510 65,179 184,551 63,544 303,145 16,853 (20,339) 800 612,133 59,6232002 570,086 66,558 225,679 38,824 332,221 17,414 (18,438) 800 661,458 91,3722003 594,977 79,869 237,977 47,599 365,171 26,001 (18,705) 800 737,112 142,1352002
QTR. I 568,491 45,508 234,900 93,810 291,535 18,783 (13,953) 800 669,783 101,292 QTR. II 579,988 40,446 299,774 106,834 302,692 18,603 (31,172) 800 736,377 156,389 QTR. III 574,166 43,479 267,695 72,903 317,502 18,190 (22,654) 800 696,315 122,149 QTR. IV 570,086 66,558 225,679 38,824 332,221 17,414 (18,438) 800 661,458 91,372
2003Jan. 571,180 40,461 258,293 40,872 332,224 16,260 (19,967) 800 667,343 96,163Feb. 575,074 42,287 260,541 40,903 334,816 16,286 (22,091) 800 671,942 96,868Mar. 578,195 44,099 274,793 45,017 333,816 16,104 (23,921) 800 689,108 110,913Apr. 577,589 55,185 299,187 48,989 341,135 16,443 (25,966) 800 734,173 156,584May 577,444 42,876 265,199 75,605 346,833 15,878 (27,313) 800 718,278 140,834Jun. 578,419 43,183 265,839 69,499 346,950 14,864 (31,817) 800 707,718 129,299Jul. 575,837 53,675 248,259 58,506 365,384 14,858 (31,656) 800 708,226 132,389Aug. 582,114 50,719 271,592 66,254 365,847 22,792 (32,743) 800 743,661 161,547Sep. 576,875 51,242 249,929 71,884 366,147 25,879 (35,080) 800 729,201 152,326Oct. 581,845 47,418 223,960 71,897 366,661 22,675 (20,768) 800 711,043 129,198Nov. 583,747 54,040 254,442 38,822 367,002 22,763 (19,021) 800 717,248 133,501Dec. 594,977 79,869 237,977 47,599 365,171 26,001 (18,705) 800 737,112 142,1352004Jan. 600,151 46,513 260,001 57,586 365,171 27,274 (29,957) 800 725,788 125,637Feb. 609,970 52,025 314,966 71,977 366,055 27,156 (35,063) 800 796,316 186,346Mar. 616,632 62,709 332,281 73,029 364,217 28,365 (25,166) 800 834,635 218,003Apr. 626,768 54,657 354,634 64,478 364,507 28,271 (18,844) 800 846,903 220,135May 630,890 49,131 352,392 86,477 364,847 28,194 (15,800) 800 864,441 233,551Jun. 637,563 63,424 316,890 88,852 364,906 28,133 (13,389) 800 848,016 210,453
SOURCE: The Central Bank of The Bahamas
38
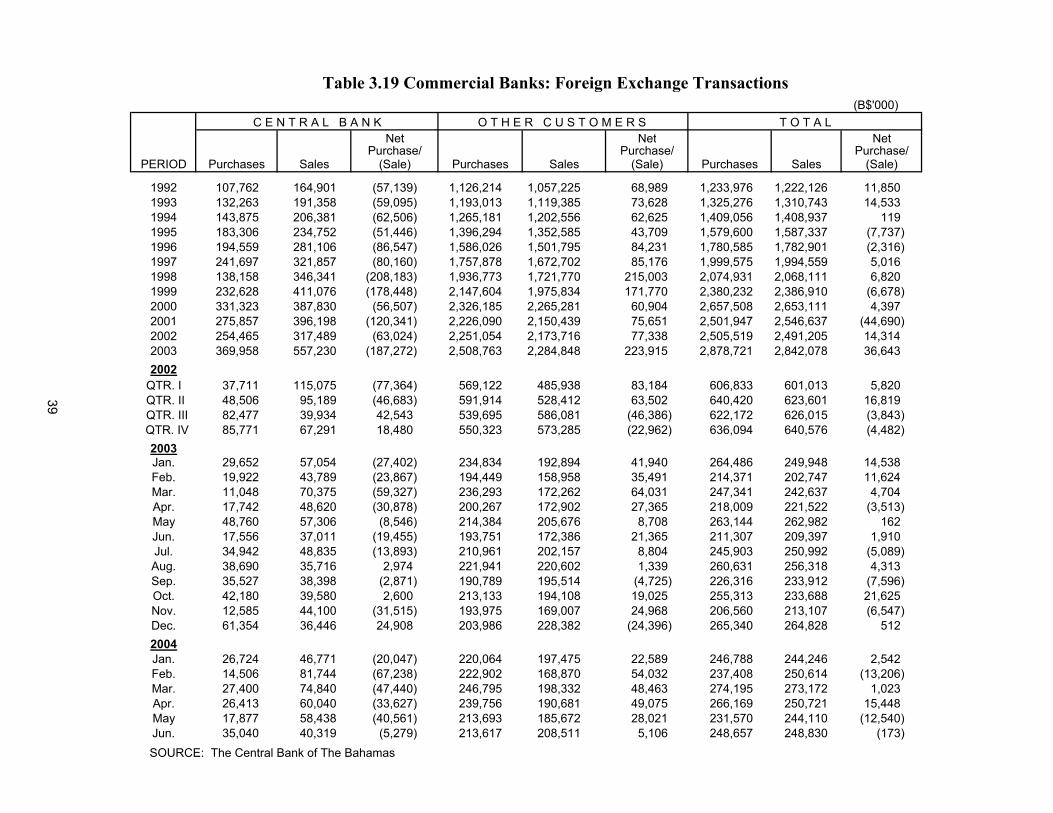
Table 3.19 Commercial Banks: Foreign Exchange Transactions (B$'000)
C E N T R A L B A N K O T H E R C U S T O M E R S T O T A LNet Net Net
Purchase/ Purchase/ Purchase/PERIOD Purchases Sales (Sale) Purchases Sales (Sale) Purchases Sales (Sale)
1992 107,762 164,901 (57,139) 1,126,214 1,057,225 68,989 1,233,976 1,222,126 11,850 1993 132,263 191,358 (59,095) 1,193,013 1,119,385 73,628 1,325,276 1,310,743 14,533 1994 143,875 206,381 (62,506) 1,265,181 1,202,556 62,625 1,409,056 1,408,937 119 1995 183,306 234,752 (51,446) 1,396,294 1,352,585 43,709 1,579,600 1,587,337 (7,737) 1996 194,559 281,106 (86,547) 1,586,026 1,501,795 84,231 1,780,585 1,782,901 (2,316) 1997 241,697 321,857 (80,160) 1,757,878 1,672,702 85,176 1,999,575 1,994,559 5,016 1998 138,158 346,341 (208,183) 1,936,773 1,721,770 215,003 2,074,931 2,068,111 6,820 1999 232,628 411,076 (178,448) 2,147,604 1,975,834 171,770 2,380,232 2,386,910 (6,678) 2000 331,323 387,830 (56,507) 2,326,185 2,265,281 60,904 2,657,508 2,653,111 4,397 2001 275,857 396,198 (120,341) 2,226,090 2,150,439 75,651 2,501,947 2,546,637 (44,690) 2002 254,465 317,489 (63,024) 2,251,054 2,173,716 77,338 2,505,519 2,491,205 14,314 2003 369,958 557,230 (187,272) 2,508,763 2,284,848 223,915 2,878,721 2,842,078 36,643 2002
QTR. I 37,711 115,075 (77,364) 569,122 485,938 83,184 606,833 601,013 5,820 QTR. II 48,506 95,189 (46,683) 591,914 528,412 63,502 640,420 623,601 16,819
QTR. III 82,477 39,934 42,543 539,695 586,081 (46,386) 622,172 626,015 (3,843) QTR. IV 85,771 67,291 18,480 550,323 573,285 (22,962) 636,094 640,576 (4,482)
2003Jan. 29,652 57,054 (27,402) 234,834 192,894 41,940 264,486 249,948 14,538 Feb. 19,922 43,789 (23,867) 194,449 158,958 35,491 214,371 202,747 11,624 Mar. 11,048 70,375 (59,327) 236,293 172,262 64,031 247,341 242,637 4,704 Apr. 17,742 48,620 (30,878) 200,267 172,902 27,365 218,009 221,522 (3,513) May 48,760 57,306 (8,546) 214,384 205,676 8,708 263,144 262,982 162 Jun. 17,556 37,011 (19,455) 193,751 172,386 21,365 211,307 209,397 1,910 Jul. 34,942 48,835 (13,893) 210,961 202,157 8,804 245,903 250,992 (5,089) Aug. 38,690 35,716 2,974 221,941 220,602 1,339 260,631 256,318 4,313 Sep. 35,527 38,398 (2,871) 190,789 195,514 (4,725) 226,316 233,912 (7,596) Oct. 42,180 39,580 2,600 213,133 194,108 19,025 255,313 233,688 21,625 Nov. 12,585 44,100 (31,515) 193,975 169,007 24,968 206,560 213,107 (6,547) Dec. 61,354 36,446 24,908 203,986 228,382 (24,396) 265,340 264,828 512 2004Jan. 26,724 46,771 (20,047) 220,064 197,475 22,589 246,788 244,246 2,542 Feb. 14,506 81,744 (67,238) 222,902 168,870 54,032 237,408 250,614 (13,206) Mar. 27,400 74,840 (47,440) 246,795 198,332 48,463 274,195 273,172 1,023 Apr. 26,413 60,040 (33,627) 239,756 190,681 49,075 266,169 250,721 15,448 May 17,877 58,438 (40,561) 213,693 185,672 28,021 231,570 244,110 (12,540) Jun. 35,040 40,319 (5,279) 213,617 208,511 5,106 248,657 248,830 (173)
SOURCE: The Central Bank of The Bahamas
39
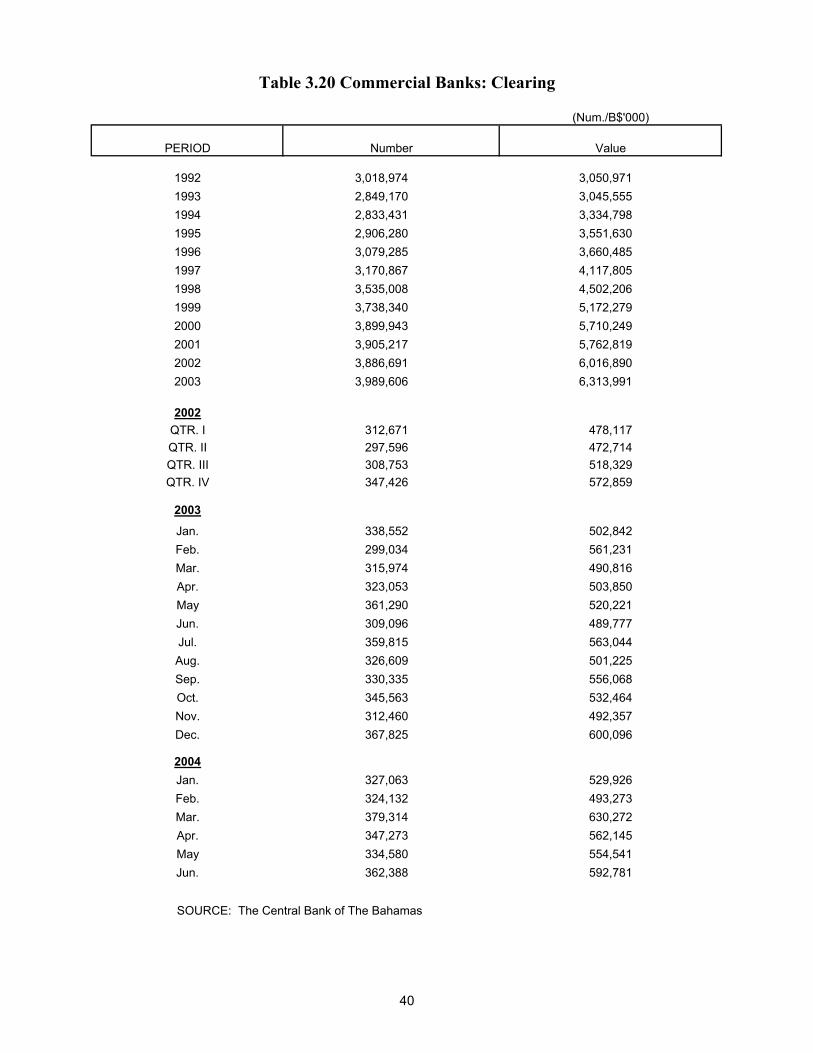
(Num./B$'000)
PERIOD Number Value
1992 3,018,974 3,050,9711993 2,849,170 3,045,5551994 2,833,431 3,334,7981995 2,906,280 3,551,6301996 3,079,285 3,660,4851997 3,170,867 4,117,8051998 3,535,008 4,502,2061999 3,738,340 5,172,2792000 3,899,943 5,710,2492001 3,905,217 5,762,8192002 3,886,691 6,016,8902003 3,989,606 6,313,991
2002QTR. I 312,671 478,117QTR. II 297,596 472,714QTR. III 308,753 518,329QTR. IV 347,426 572,859
2003
Jan. 338,552 502,842Feb. 299,034 561,231Mar. 315,974 490,816Apr. 323,053 503,850May 361,290 520,221Jun. 309,096 489,777Jul. 359,815 563,044Aug. 326,609 501,225Sep. 330,335 556,068Oct. 345,563 532,464Nov. 312,460 492,357Dec. 367,825 600,096
2004Jan. 327,063 529,926Feb. 324,132 493,273Mar. 379,314 630,272Apr. 347,273 562,145May 334,580 554,541Jun. 362,388 592,781
SOURCE: The Central Bank of The Bahamas
Table 3.20 Commercial Banks: Clearing
40
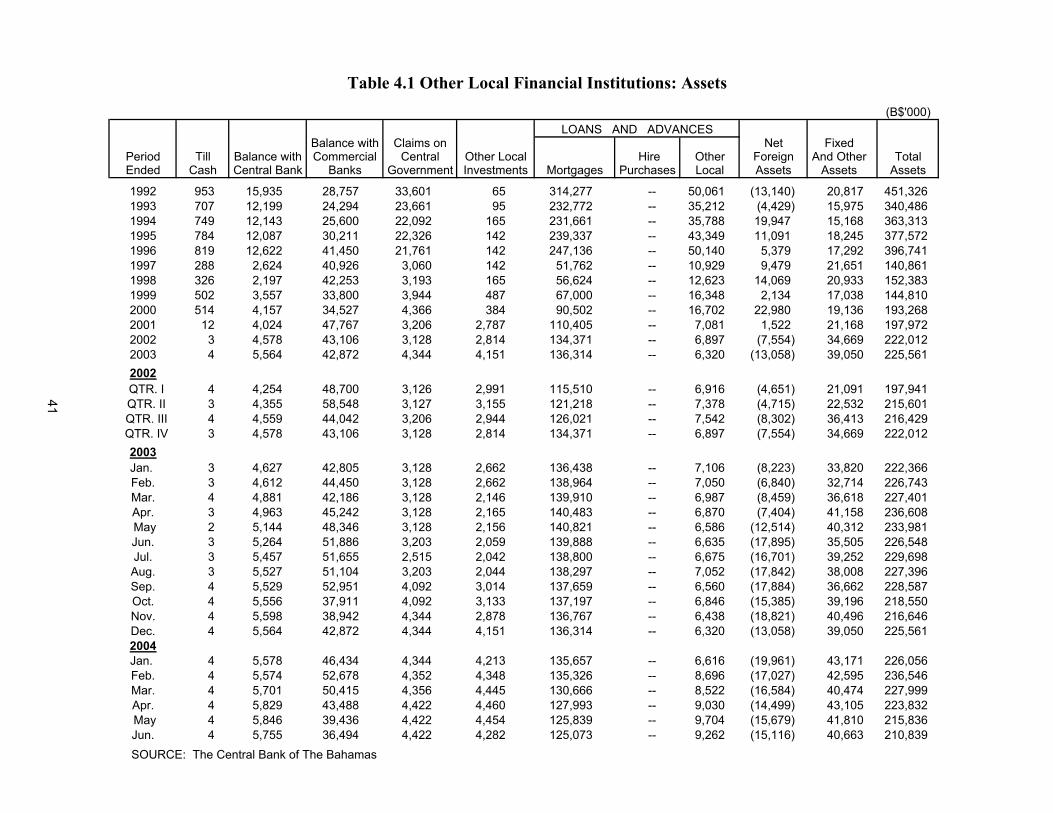
Table 4.1 Other Local Financial Institutions: Assets (B$'000)
LOANS AND ADVANCES Balance with Claims on Net Fixed
Period Till Balance with Commercial Central Other Local Hire Other Foreign And Other TotalEnded Cash Central Bank Banks Government Investments Mortgages Purchases Local Assets Assets Assets
1992 953 15,935 28,757 33,601 65 314,277 -- 50,061 (13,140) 20,817 451,3261993 707 12,199 24,294 23,661 95 232,772 -- 35,212 (4,429) 15,975 340,4861994 749 12,143 25,600 22,092 165 231,661 -- 35,788 19,947 15,168 363,3131995 784 12,087 30,211 22,326 142 239,337 -- 43,349 11,091 18,245 377,5721996 819 12,622 41,450 21,761 142 247,136 -- 50,140 5,379 17,292 396,7411997 288 2,624 40,926 3,060 142 51,762 -- 10,929 9,479 21,651 140,8611998 326 2,197 42,253 3,193 165 56,624 -- 12,623 14,069 20,933 152,3831999 502 3,557 33,800 3,944 487 67,000 -- 16,348 2,134 17,038 144,8102000 514 4,157 34,527 4,366 384 90,502 -- 16,702 22,980 19,136 193,2682001 12 4,024 47,767 3,206 2,787 110,405 -- 7,081 1,522 21,168 197,9722002 3 4,578 43,106 3,128 2,814 134,371 -- 6,897 (7,554) 34,669 222,0122003 4 5,564 42,872 4,344 4,151 136,314 -- 6,320 (13,058) 39,050 225,5612002
QTR. I 4 4,254 48,700 3,126 2,991 115,510 -- 6,916 (4,651) 21,091 197,941 QTR. II 3 4,355 58,548 3,127 3,155 121,218 -- 7,378 (4,715) 22,532 215,601 QTR. III 4 4,559 44,042 3,206 2,944 126,021 -- 7,542 (8,302) 36,413 216,429 QTR. IV 3 4,578 43,106 3,128 2,814 134,371 -- 6,897 (7,554) 34,669 222,012
2003Jan. 3 4,627 42,805 3,128 2,662 136,438 -- 7,106 (8,223) 33,820 222,366Feb. 3 4,612 44,450 3,128 2,662 138,964 -- 7,050 (6,840) 32,714 226,743Mar. 4 4,881 42,186 3,128 2,146 139,910 -- 6,987 (8,459) 36,618 227,401Apr. 3 4,963 45,242 3,128 2,165 140,483 -- 6,870 (7,404) 41,158 236,608 May 2 5,144 48,346 3,128 2,156 140,821 -- 6,586 (12,514) 40,312 233,981Jun. 3 5,264 51,886 3,203 2,059 139,888 -- 6,635 (17,895) 35,505 226,548Jul. 3 5,457 51,655 2,515 2,042 138,800 -- 6,675 (16,701) 39,252 229,698Aug. 3 5,527 51,104 3,203 2,044 138,297 -- 7,052 (17,842) 38,008 227,396Sep. 4 5,529 52,951 4,092 3,014 137,659 -- 6,560 (17,884) 36,662 228,587Oct. 4 5,556 37,911 4,092 3,133 137,197 -- 6,846 (15,385) 39,196 218,550Nov. 4 5,598 38,942 4,344 2,878 136,767 -- 6,438 (18,821) 40,496 216,646Dec. 4 5,564 42,872 4,344 4,151 136,314 -- 6,320 (13,058) 39,050 225,5612004Jan. 4 5,578 46,434 4,344 4,213 135,657 -- 6,616 (19,961) 43,171 226,056Feb. 4 5,574 52,678 4,352 4,348 135,326 -- 8,696 (17,027) 42,595 236,546Mar. 4 5,701 50,415 4,356 4,445 130,666 -- 8,522 (16,584) 40,474 227,999Apr. 4 5,829 43,488 4,422 4,460 127,993 -- 9,030 (14,499) 43,105 223,832 May 4 5,846 39,436 4,422 4,454 125,839 -- 9,704 (15,679) 41,810 215,836Jun. 4 5,755 36,494 4,422 4,282 125,073 -- 9,262 (15,116) 40,663 210,839
SOURCE: The Central Bank of The Bahamas
41
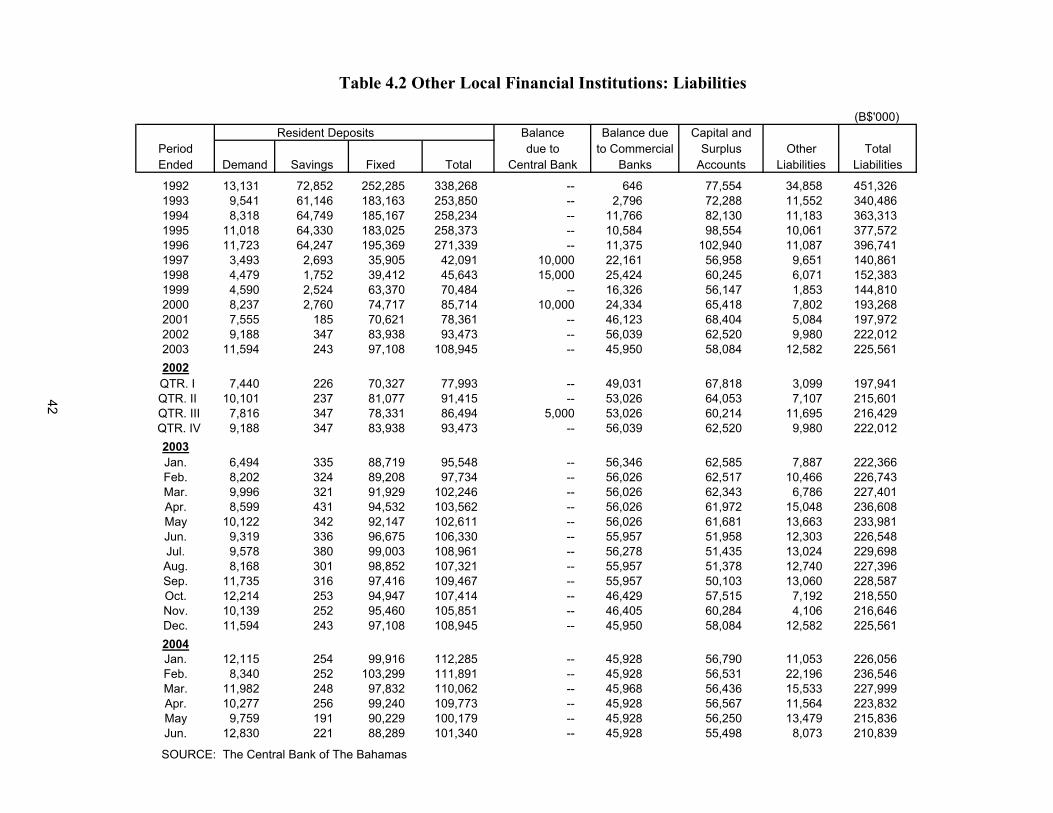
Table 4.2 Other Local Financial Institutions: Liabilities
(B$'000) Resident Deposits Balance Balance due Capital and
Period due to to Commercial Surplus Other TotalEnded Demand Savings Fixed Total Central Bank Banks Accounts Liabilities Liabilities
1992 13,131 72,852 252,285 338,268 -- 646 77,554 34,858 451,3261993 9,541 61,146 183,163 253,850 -- 2,796 72,288 11,552 340,4861994 8,318 64,749 185,167 258,234 -- 11,766 82,130 11,183 363,3131995 11,018 64,330 183,025 258,373 -- 10,584 98,554 10,061 377,5721996 11,723 64,247 195,369 271,339 -- 11,375 102,940 11,087 396,7411997 3,493 2,693 35,905 42,091 10,000 22,161 56,958 9,651 140,8611998 4,479 1,752 39,412 45,643 15,000 25,424 60,245 6,071 152,3831999 4,590 2,524 63,370 70,484 -- 16,326 56,147 1,853 144,8102000 8,237 2,760 74,717 85,714 10,000 24,334 65,418 7,802 193,2682001 7,555 185 70,621 78,361 -- 46,123 68,404 5,084 197,9722002 9,188 347 83,938 93,473 -- 56,039 62,520 9,980 222,0122003 11,594 243 97,108 108,945 -- 45,950 58,084 12,582 225,5612002
QTR. I 7,440 226 70,327 77,993 -- 49,031 67,818 3,099 197,941 QTR. II 10,101 237 81,077 91,415 -- 53,026 64,053 7,107 215,601
QTR. III 7,816 347 78,331 86,494 5,000 53,026 60,214 11,695 216,429 QTR. IV 9,188 347 83,938 93,473 -- 56,039 62,520 9,980 222,012
2003Jan. 6,494 335 88,719 95,548 -- 56,346 62,585 7,887 222,366Feb. 8,202 324 89,208 97,734 -- 56,026 62,517 10,466 226,743Mar. 9,996 321 91,929 102,246 -- 56,026 62,343 6,786 227,401Apr. 8,599 431 94,532 103,562 -- 56,026 61,972 15,048 236,608May 10,122 342 92,147 102,611 -- 56,026 61,681 13,663 233,981Jun. 9,319 336 96,675 106,330 -- 55,957 51,958 12,303 226,548Jul. 9,578 380 99,003 108,961 -- 56,278 51,435 13,024 229,698Aug. 8,168 301 98,852 107,321 -- 55,957 51,378 12,740 227,396Sep. 11,735 316 97,416 109,467 -- 55,957 50,103 13,060 228,587Oct. 12,214 253 94,947 107,414 -- 46,429 57,515 7,192 218,550Nov. 10,139 252 95,460 105,851 -- 46,405 60,284 4,106 216,646Dec. 11,594 243 97,108 108,945 -- 45,950 58,084 12,582 225,5612004Jan. 12,115 254 99,916 112,285 -- 45,928 56,790 11,053 226,056Feb. 8,340 252 103,299 111,891 -- 45,928 56,531 22,196 236,546Mar. 11,982 248 97,832 110,062 -- 45,968 56,436 15,533 227,999Apr. 10,277 256 99,240 109,773 -- 45,928 56,567 11,564 223,832May 9,759 191 90,229 100,179 -- 45,928 56,250 13,479 215,836Jun. 12,830 221 88,289 101,340 -- 45,928 55,498 8,073 210,839
SOURCE: The Central Bank of The Bahamas
42
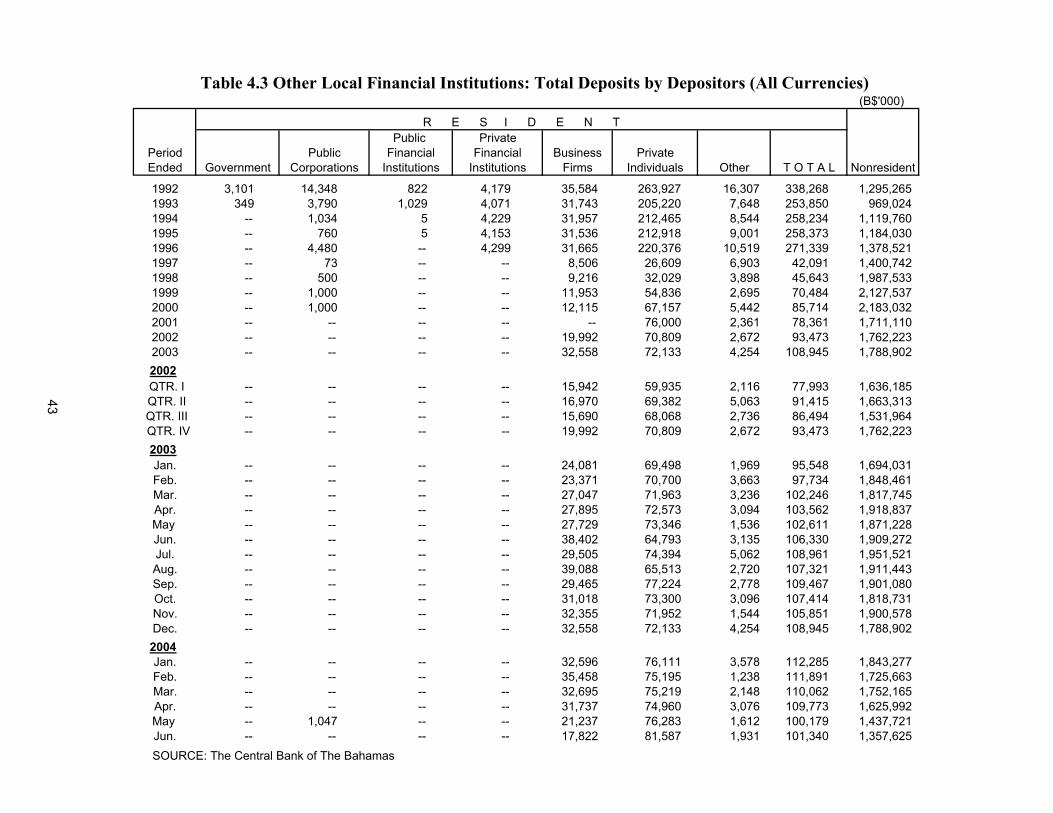
Table 4.3 Other Local Financial Institutions: Total Deposits by Depositors (All Currencies) (B$'000)
R E S I D E N T Public Private
Period Public Financial Financial Business Private Ended Government Corporations Institutions Institutions Firms Individuals Other T O T A L Nonresident
1992 3,101 14,348 822 4,179 35,584 263,927 16,307 338,268 1,295,2651993 349 3,790 1,029 4,071 31,743 205,220 7,648 253,850 969,0241994 -- 1,034 5 4,229 31,957 212,465 8,544 258,234 1,119,7601995 -- 760 5 4,153 31,536 212,918 9,001 258,373 1,184,0301996 -- 4,480 -- 4,299 31,665 220,376 10,519 271,339 1,378,5211997 -- 73 -- -- 8,506 26,609 6,903 42,091 1,400,7421998 -- 500 -- -- 9,216 32,029 3,898 45,643 1,987,5331999 -- 1,000 -- -- 11,953 54,836 2,695 70,484 2,127,5372000 -- 1,000 -- -- 12,115 67,157 5,442 85,714 2,183,0322001 -- -- -- -- -- 76,000 2,361 78,361 1,711,1102002 -- -- -- -- 19,992 70,809 2,672 93,473 1,762,2232003 -- -- -- -- 32,558 72,133 4,254 108,945 1,788,9022002
QTR. I -- -- -- -- 15,942 59,935 2,116 77,993 1,636,185 QTR. II -- -- -- -- 16,970 69,382 5,063 91,415 1,663,313 QTR. III -- -- -- -- 15,690 68,068 2,736 86,494 1,531,964 QTR. IV -- -- -- -- 19,992 70,809 2,672 93,473 1,762,223
2003Jan. -- -- -- -- 24,081 69,498 1,969 95,548 1,694,031Feb. -- -- -- -- 23,371 70,700 3,663 97,734 1,848,461Mar. -- -- -- -- 27,047 71,963 3,236 102,246 1,817,745Apr. -- -- -- -- 27,895 72,573 3,094 103,562 1,918,837May -- -- -- -- 27,729 73,346 1,536 102,611 1,871,228Jun. -- -- -- -- 38,402 64,793 3,135 106,330 1,909,272Jul. -- -- -- -- 29,505 74,394 5,062 108,961 1,951,521Aug. -- -- -- -- 39,088 65,513 2,720 107,321 1,911,443Sep. -- -- -- -- 29,465 77,224 2,778 109,467 1,901,080Oct. -- -- -- -- 31,018 73,300 3,096 107,414 1,818,731Nov. -- -- -- -- 32,355 71,952 1,544 105,851 1,900,578Dec. -- -- -- -- 32,558 72,133 4,254 108,945 1,788,9022004Jan. -- -- -- -- 32,596 76,111 3,578 112,285 1,843,277Feb. -- -- -- -- 35,458 75,195 1,238 111,891 1,725,663Mar. -- -- -- -- 32,695 75,219 2,148 110,062 1,752,165Apr. -- -- -- -- 31,737 74,960 3,076 109,773 1,625,992May -- 1,047 -- -- 21,237 76,283 1,612 100,179 1,437,721Jun. -- -- -- -- 17,822 81,587 1,931 101,340 1,357,625
SOURCE: The Central Bank of The Bahamas
43
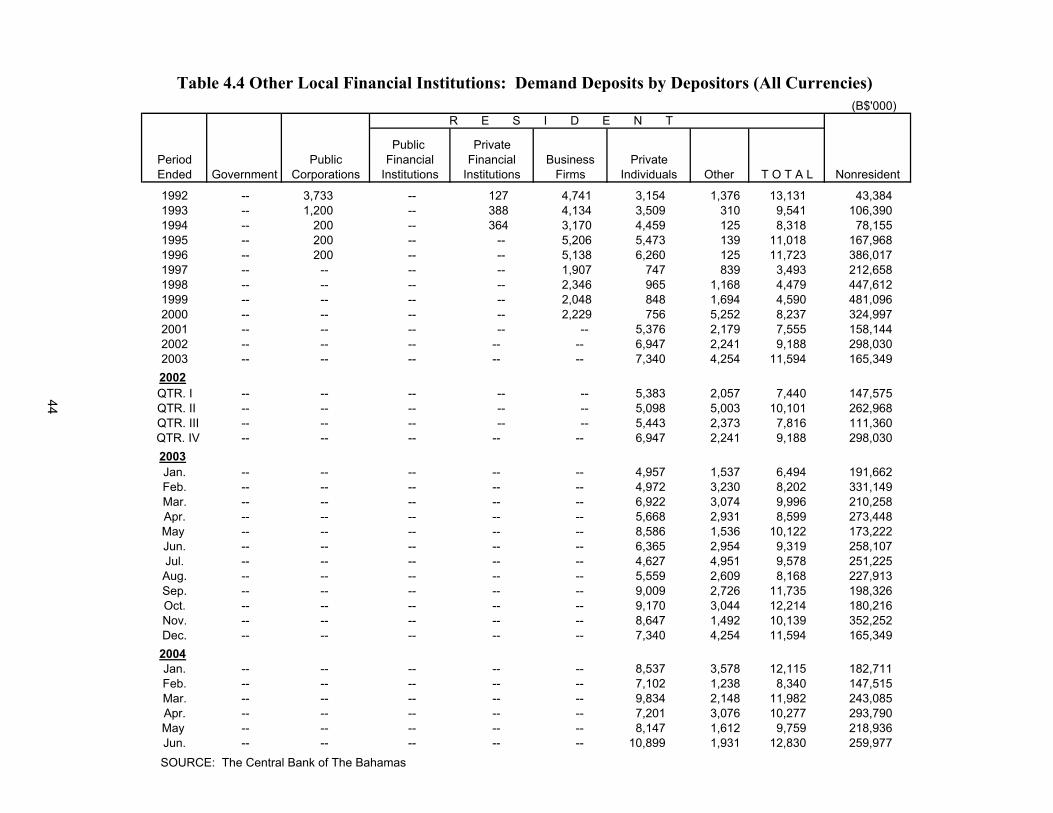
Table 4.4 Other Local Financial Institutions: Demand Deposits by Depositors (All Currencies) (B$'000)
R E S I D E N T
Public PrivatePeriod Public Financial Financial Business Private Ended Government Corporations Institutions Institutions Firms Individuals Other T O T A L Nonresident
1992 -- 3,733 -- 127 4,741 3,154 1,376 13,131 43,3841993 -- 1,200 -- 388 4,134 3,509 310 9,541 106,3901994 -- 200 -- 364 3,170 4,459 125 8,318 78,1551995 -- 200 -- -- 5,206 5,473 139 11,018 167,9681996 -- 200 -- -- 5,138 6,260 125 11,723 386,0171997 -- -- -- -- 1,907 747 839 3,493 212,6581998 -- -- -- -- 2,346 965 1,168 4,479 447,6121999 -- -- -- -- 2,048 848 1,694 4,590 481,0962000 -- -- -- -- 2,229 756 5,252 8,237 324,9972001 -- -- -- -- -- 5,376 2,179 7,555 158,1442002 -- -- -- -- -- 6,947 2,241 9,188 298,0302003 -- -- -- -- -- 7,340 4,254 11,594 165,3492002QTR. I -- -- -- -- -- 5,383 2,057 7,440 147,575
QTR. II -- -- -- -- -- 5,098 5,003 10,101 262,968 QTR. III -- -- -- -- -- 5,443 2,373 7,816 111,360 QTR. IV -- -- -- -- -- 6,947 2,241 9,188 298,030
2003Jan. -- -- -- -- -- 4,957 1,537 6,494 191,662Feb. -- -- -- -- -- 4,972 3,230 8,202 331,149Mar. -- -- -- -- -- 6,922 3,074 9,996 210,258Apr. -- -- -- -- -- 5,668 2,931 8,599 273,448May -- -- -- -- -- 8,586 1,536 10,122 173,222Jun. -- -- -- -- -- 6,365 2,954 9,319 258,107Jul. -- -- -- -- -- 4,627 4,951 9,578 251,225Aug. -- -- -- -- -- 5,559 2,609 8,168 227,913Sep. -- -- -- -- -- 9,009 2,726 11,735 198,326Oct. -- -- -- -- -- 9,170 3,044 12,214 180,216Nov. -- -- -- -- -- 8,647 1,492 10,139 352,252Dec. -- -- -- -- -- 7,340 4,254 11,594 165,3492004Jan. -- -- -- -- -- 8,537 3,578 12,115 182,711Feb. -- -- -- -- -- 7,102 1,238 8,340 147,515Mar. -- -- -- -- -- 9,834 2,148 11,982 243,085Apr. -- -- -- -- -- 7,201 3,076 10,277 293,790May -- -- -- -- -- 8,147 1,612 9,759 218,936Jun. -- -- -- -- -- 10,899 1,931 12,830 259,977
SOURCE: The Central Bank of The Bahamas
44
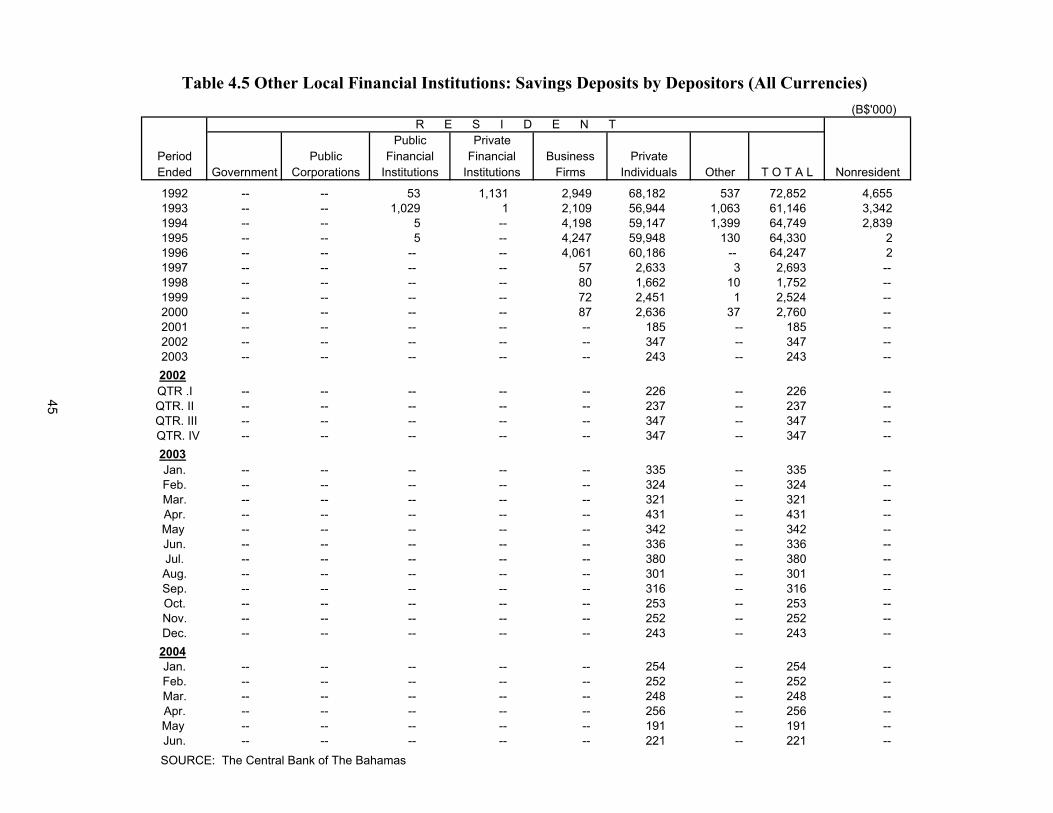
Table 4.5 Other Local Financial Institutions: Savings Deposits by Depositors (All Currencies) (B$'000)
R E S I D E N T Public Private
Period Public Financial Financial Business Private Ended Government Corporations Institutions Institutions Firms Individuals Other T O T A L Nonresident
1992 -- -- 53 1,131 2,949 68,182 537 72,852 4,6551993 -- -- 1,029 1 2,109 56,944 1,063 61,146 3,3421994 -- -- 5 -- 4,198 59,147 1,399 64,749 2,8391995 -- -- 5 -- 4,247 59,948 130 64,330 21996 -- -- -- -- 4,061 60,186 -- 64,247 21997 -- -- -- -- 57 2,633 3 2,693 --1998 -- -- -- -- 80 1,662 10 1,752 --1999 -- -- -- -- 72 2,451 1 2,524 --2000 -- -- -- -- 87 2,636 37 2,760 --2001 -- -- -- -- -- 185 -- 185 --2002 -- -- -- -- -- 347 -- 347 --2003 -- -- -- -- -- 243 -- 243 --2002QTR .I -- -- -- -- -- 226 -- 226 --QTR. II -- -- -- -- -- 237 -- 237 --
QTR. III -- -- -- -- -- 347 -- 347 -- QTR. IV -- -- -- -- -- 347 -- 347 --
2003Jan. -- -- -- -- -- 335 -- 335 --Feb. -- -- -- -- -- 324 -- 324 --Mar. -- -- -- -- -- 321 -- 321 --Apr. -- -- -- -- -- 431 -- 431 --May -- -- -- -- -- 342 -- 342 --Jun. -- -- -- -- -- 336 -- 336 --Jul. -- -- -- -- -- 380 -- 380 --Aug. -- -- -- -- -- 301 -- 301 --Sep. -- -- -- -- -- 316 -- 316 --Oct. -- -- -- -- -- 253 -- 253 --Nov. -- -- -- -- -- 252 -- 252 --Dec. -- -- -- -- -- 243 -- 243 --2004Jan. -- -- -- -- -- 254 -- 254 --Feb. -- -- -- -- -- 252 -- 252 --Mar. -- -- -- -- -- 248 -- 248 --Apr. -- -- -- -- -- 256 -- 256 --May -- -- -- -- -- 191 -- 191 --Jun. -- -- -- -- -- 221 -- 221 --
SOURCE: The Central Bank of The Bahamas
45
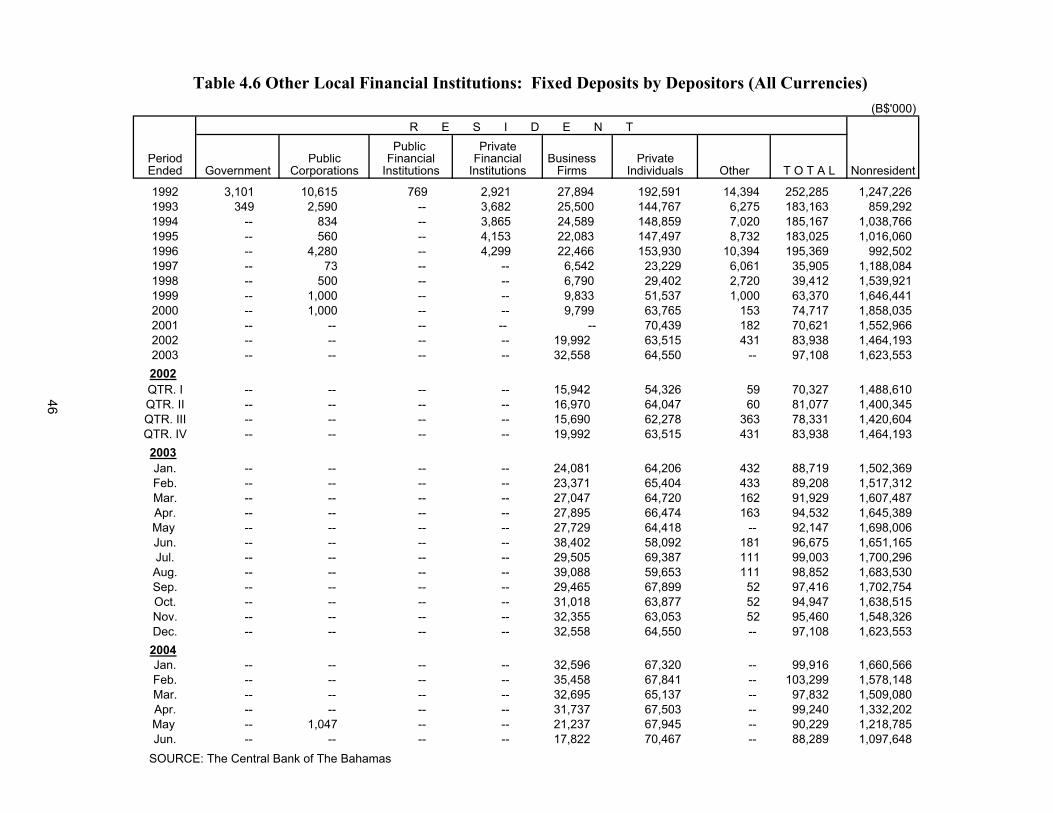
Table 4.6 Other Local Financial Institutions: Fixed Deposits by Depositors (All Currencies) (B$'000)
R E S I D E N T Public Private
Period Public Financial Financial Business PrivateEnded Government Corporations Institutions Institutions Firms Individuals Other T O T A L Nonresident
1992 3,101 10,615 769 2,921 27,894 192,591 14,394 252,285 1,247,2261993 349 2,590 -- 3,682 25,500 144,767 6,275 183,163 859,2921994 -- 834 -- 3,865 24,589 148,859 7,020 185,167 1,038,7661995 -- 560 -- 4,153 22,083 147,497 8,732 183,025 1,016,0601996 -- 4,280 -- 4,299 22,466 153,930 10,394 195,369 992,5021997 -- 73 -- -- 6,542 23,229 6,061 35,905 1,188,0841998 -- 500 -- -- 6,790 29,402 2,720 39,412 1,539,9211999 -- 1,000 -- -- 9,833 51,537 1,000 63,370 1,646,4412000 -- 1,000 -- -- 9,799 63,765 153 74,717 1,858,0352001 -- -- -- -- 70,439 182 70,621 1,552,9662002 -- -- -- -- 19,992 63,515 431 83,938 1,464,1932003 -- -- -- -- 32,558 64,550 -- 97,108 1,623,5532002QTR. I -- -- -- -- 15,942 54,326 59 70,327 1,488,610QTR. II -- -- -- -- 16,970 64,047 60 81,077 1,400,345QTR. III -- -- -- -- 15,690 62,278 363 78,331 1,420,604QTR. IV -- -- -- -- 19,992 63,515 431 83,938 1,464,1932003Jan. -- -- -- -- 24,081 64,206 432 88,719 1,502,369Feb. -- -- -- -- 23,371 65,404 433 89,208 1,517,312Mar. -- -- -- -- 27,047 64,720 162 91,929 1,607,487Apr. -- -- -- -- 27,895 66,474 163 94,532 1,645,389May -- -- -- -- 27,729 64,418 -- 92,147 1,698,006Jun. -- -- -- -- 38,402 58,092 181 96,675 1,651,165Jul. -- -- -- -- 29,505 69,387 111 99,003 1,700,296Aug. -- -- -- -- 39,088 59,653 111 98,852 1,683,530Sep. -- -- -- -- 29,465 67,899 52 97,416 1,702,754Oct. -- -- -- -- 31,018 63,877 52 94,947 1,638,515Nov. -- -- -- -- 32,355 63,053 52 95,460 1,548,326Dec. -- -- -- -- 32,558 64,550 -- 97,108 1,623,5532004Jan. -- -- -- -- 32,596 67,320 -- 99,916 1,660,566Feb. -- -- -- -- 35,458 67,841 -- 103,299 1,578,148Mar. -- -- -- -- 32,695 65,137 -- 97,832 1,509,080Apr. -- -- -- -- 31,737 67,503 -- 99,240 1,332,202May -- 1,047 -- -- 21,237 67,945 -- 90,229 1,218,785Jun. -- -- -- -- 17,822 70,467 -- 88,289 1,097,648
SOURCE: The Central Bank of The Bahamas
--
46
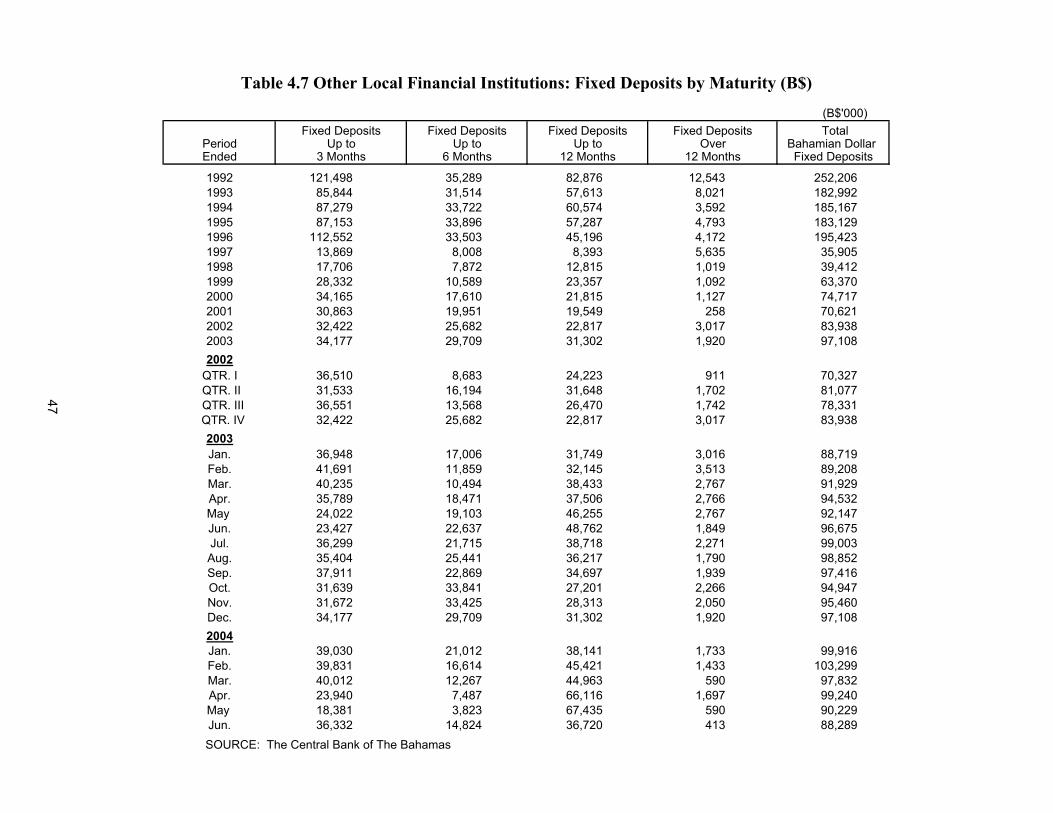
Table 4.7 Other Local Financial Institutions: Fixed Deposits by Maturity (B$)
(B$'000) Fixed Deposits Fixed Deposits Fixed Deposits Fixed Deposits Total
Period Up to Up to Up to Over Bahamian Dollar Ended 3 Months 6 Months 12 Months 12 Months Fixed Deposits
1992 121,498 35,289 82,876 12,543 252,2061993 85,844 31,514 57,613 8,021 182,9921994 87,279 33,722 60,574 3,592 185,1671995 87,153 33,896 57,287 4,793 183,1291996 112,552 33,503 45,196 4,172 195,4231997 13,869 8,008 8,393 5,635 35,9051998 17,706 7,872 12,815 1,019 39,4121999 28,332 10,589 23,357 1,092 63,3702000 34,165 17,610 21,815 1,127 74,7172001 30,863 19,951 19,549 258 70,6212002 32,422 25,682 22,817 3,017 83,9382003 34,177 29,709 31,302 1,920 97,1082002
QTR. I 36,510 8,683 24,223 911 70,327 QTR. II 31,533 16,194 31,648 1,702 81,077
QTR. III 36,551 13,568 26,470 1,742 78,331 QTR. IV 32,422 25,682 22,817 3,017 83,938
2003Jan. 36,948 17,006 31,749 3,016 88,719Feb. 41,691 11,859 32,145 3,513 89,208Mar. 40,235 10,494 38,433 2,767 91,929Apr. 35,789 18,471 37,506 2,766 94,532May 24,022 19,103 46,255 2,767 92,147Jun. 23,427 22,637 48,762 1,849 96,675Jul. 36,299 21,715 38,718 2,271 99,003Aug. 35,404 25,441 36,217 1,790 98,852Sep. 37,911 22,869 34,697 1,939 97,416Oct. 31,639 33,841 27,201 2,266 94,947Nov. 31,672 33,425 28,313 2,050 95,460Dec. 34,177 29,709 31,302 1,920 97,1082004Jan. 39,030 21,012 38,141 1,733 99,916Feb. 39,831 16,614 45,421 1,433 103,299Mar. 40,012 12,267 44,963 590 97,832Apr. 23,940 7,487 66,116 1,697 99,240May 18,381 3,823 67,435 590 90,229Jun. 36,332 14,824 36,720 413 88,289
SOURCE: The Central Bank of The Bahamas
47
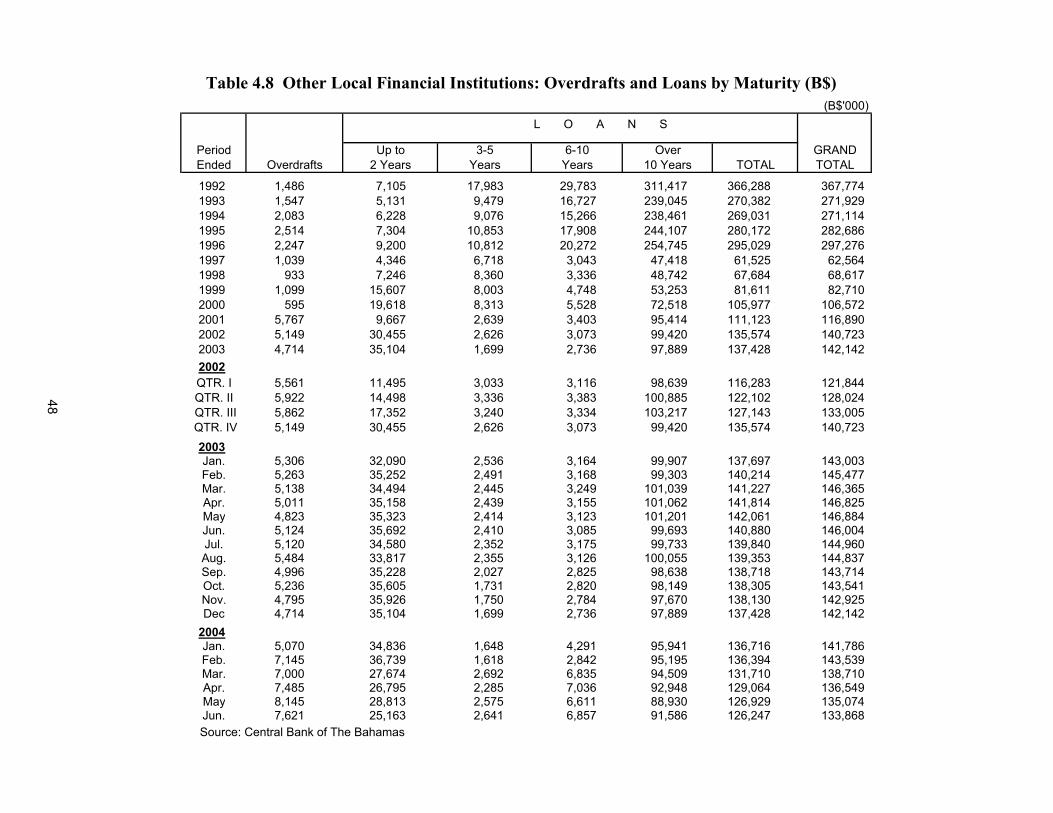
Table 4.8 Other Local Financial Institutions: Overdrafts and Loans by Maturity (B$)(B$'000)
L O A N S
Period Up to 3-5 6-10 Over GRANDEnded Overdrafts 2 Years Years Years 10 Years TOTAL TOTAL
1992 1,486 7,105 17,983 29,783 311,417 366,288 367,7741993 1,547 5,131 9,479 16,727 239,045 270,382 271,9291994 2,083 6,228 9,076 15,266 238,461 269,031 271,1141995 2,514 7,304 10,853 17,908 244,107 280,172 282,6861996 2,247 9,200 10,812 20,272 254,745 295,029 297,2761997 1,039 4,346 6,718 3,043 47,418 61,525 62,5641998 933 7,246 8,360 3,336 48,742 67,684 68,6171999 1,099 15,607 8,003 4,748 53,253 81,611 82,7102000 595 19,618 8,313 5,528 72,518 105,977 106,5722001 5,767 9,667 2,639 3,403 95,414 111,123 116,8902002 5,149 30,455 2,626 3,073 99,420 135,574 140,7232003 4,714 35,104 1,699 2,736 97,889 137,428 142,1422002QTR. I 5,561 11,495 3,033 3,116 98,639 116,283 121,844QTR. II 5,922 14,498 3,336 3,383 100,885 122,102 128,024
QTR. III 5,862 17,352 3,240 3,334 103,217 127,143 133,005 QTR. IV 5,149 30,455 2,626 3,073 99,420 135,574 140,723
2003Jan. 5,306 32,090 2,536 3,164 99,907 137,697 143,003Feb. 5,263 35,252 2,491 3,168 99,303 140,214 145,477Mar. 5,138 34,494 2,445 3,249 101,039 141,227 146,365Apr. 5,011 35,158 2,439 3,155 101,062 141,814 146,825May 4,823 35,323 2,414 3,123 101,201 142,061 146,884Jun. 5,124 35,692 2,410 3,085 99,693 140,880 146,004Jul. 5,120 34,580 2,352 3,175 99,733 139,840 144,960Aug. 5,484 33,817 2,355 3,126 100,055 139,353 144,837Sep. 4,996 35,228 2,027 2,825 98,638 138,718 143,714Oct. 5,236 35,605 1,731 2,820 98,149 138,305 143,541Nov. 4,795 35,926 1,750 2,784 97,670 138,130 142,925Dec 4,714 35,104 1,699 2,736 97,889 137,428 142,142
2004Jan. 5,070 34,836 1,648 4,291 95,941 136,716 141,786Feb. 7,145 36,739 1,618 2,842 95,195 136,394 143,539Mar. 7,000 27,674 2,692 6,835 94,509 131,710 138,710Apr. 7,485 26,795 2,285 7,036 92,948 129,064 136,549May 8,145 28,813 2,575 6,611 88,930 126,929 135,074Jun. 7,621 25,163 2,641 6,857 91,586 126,247 133,868
Source: Central Bank of The Bahamas
48
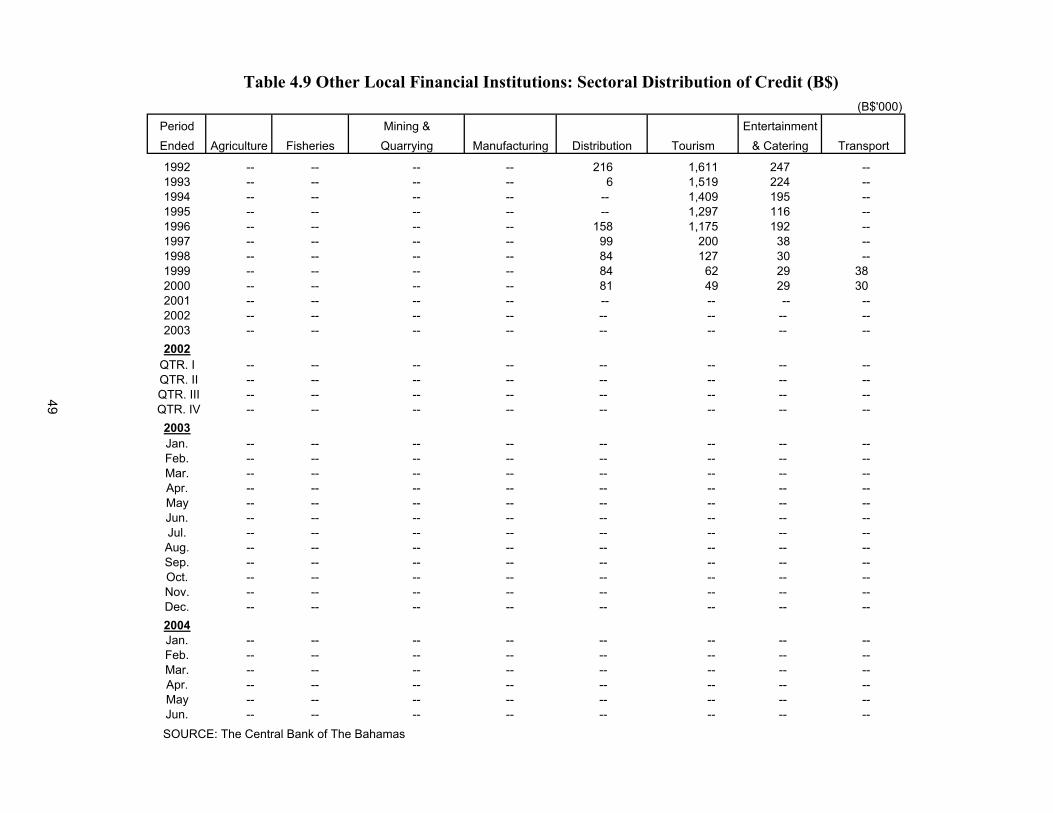
Table 4.9 Other Local Financial Institutions: Sectoral Distribution of Credit (B$)
Period Mining & EntertainmentEnded Agriculture Fisheries Quarrying Manufacturing Distribution Tourism & Catering
1992 -- -- -- -- 216 1,611 247 --1993 -- -- -- -- 6 1,519 224 --1994 -- -- -- -- -- 1,409 195 --1995 -- -- -- -- -- 1,297 116 --1996 -- -- -- -- 158 1,175 192 --1997 -- -- -- -- 99 200 38 --1998 -- -- -- -- 84 127 30 --1999 -- -- -- -- 84 62 292000 -- -- -- -- 81 49 292001 -- -- -- -- -- -- -- --2002 -- -- -- -- -- -- -- --2003 -- -- -- -- -- -- -- --2002
QTR. I -- -- -- -- -- -- -- -- QTR. II -- -- -- -- -- -- -- -- QTR. III -- -- -- -- -- -- -- -- QTR. IV -- -- -- -- -- -- -- --
2003Jan. -- -- -- -- -- -- -- --Feb. -- -- -- -- -- -- -- --Mar. -- -- -- -- -- -- -- --Apr. -- -- -- -- -- -- -- --May -- -- -- -- -- -- -- --Jun. -- -- -- -- -- -- -- --Jul. -- -- -- -- -- -- -- --Aug. -- -- -- -- -- -- -- --Sep. -- -- -- -- -- -- -- --Oct. -- -- -- -- -- -- -- --Nov. -- -- -- -- -- -- -- --Dec. -- -- -- -- -- -- -- --2004Jan. -- -- -- -- -- -- -- --Feb. -- -- -- -- -- -- -- --Mar. -- -- -- -- -- -- -- --Apr. -- -- -- -- -- -- -- --May -- -- -- -- -- -- -- --Jun. -- -- -- -- -- -- -- --
SOURCE: The Central Bank of The Bahamas
(B$'000)
Transport
3830
49
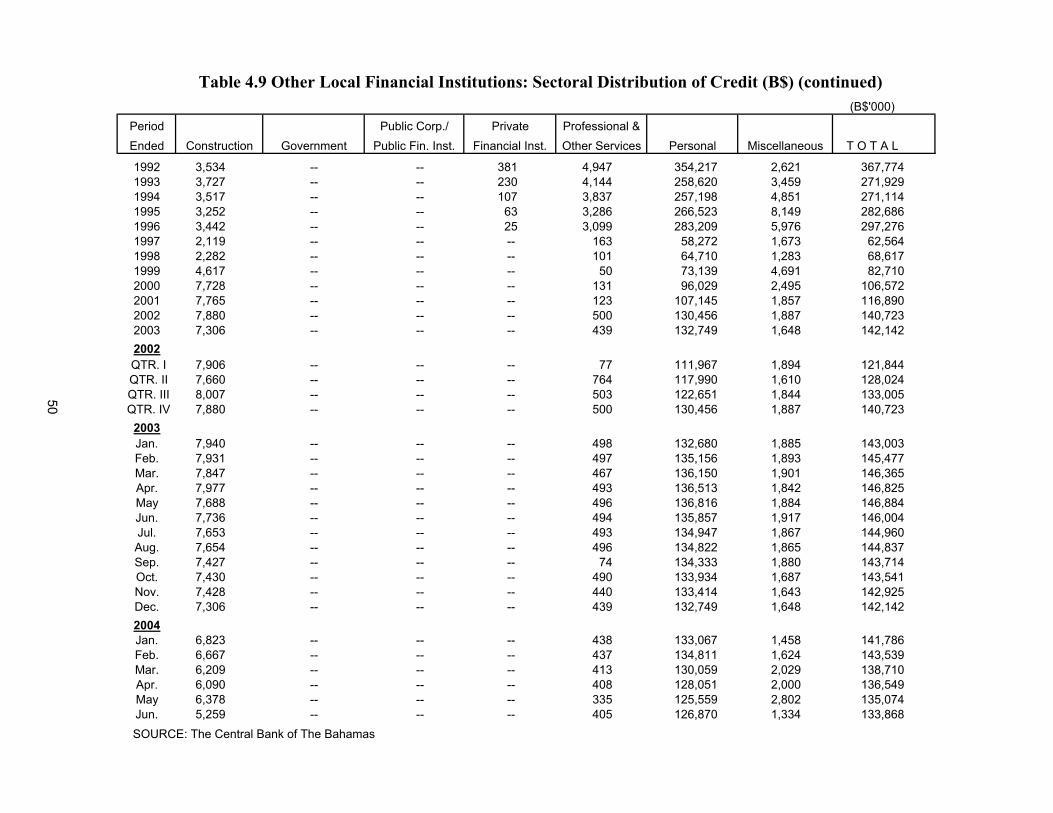
Table 4.9 Other Local Financial Institutions: Sectoral Distribution of Credit (B$) (continued) (B$'000)
Period Public Corp./ Private Professional &Ended Construction Government Public Fin. Inst. Financial Inst. Other Services Personal Miscellaneous T O T A L
1992 3,534 -- -- 381 4,947 354,217 2,621 367,7741993 3,727 -- -- 230 4,144 258,620 3,459 271,9291994 3,517 -- -- 107 3,837 257,198 4,851 271,1141995 3,252 -- -- 63 3,286 266,523 8,149 282,6861996 3,442 -- -- 25 3,099 283,209 5,976 297,2761997 2,119 -- -- -- 163 58,272 1,673 62,5641998 2,282 -- -- -- 101 64,710 1,283 68,6171999 4,617 -- -- -- 50 73,139 4,691 82,7102000 7,728 -- -- -- 131 96,029 2,495 106,5722001 7,765 -- -- -- 123 107,145 1,857 116,8902002 7,880 -- -- -- 500 130,456 1,887 140,7232003 7,306 -- -- -- 439 132,749 1,648 142,1422002
QTR. I 7,906 -- -- -- 77 111,967 1,894 121,844 QTR. II 7,660 -- -- -- 764 117,990 1,610 128,024 QTR. III 8,007 -- -- -- 503 122,651 1,844 133,005 QTR. IV 7,880 -- -- -- 500 130,456 1,887 140,723
2003Jan. 7,940 -- -- -- 498 132,680 1,885 143,003Feb. 7,931 -- -- -- 497 135,156 1,893 145,477Mar. 7,847 -- -- -- 467 136,150 1,901 146,365Apr. 7,977 -- -- -- 493 136,513 1,842 146,825May 7,688 -- -- -- 496 136,816 1,884 146,884Jun. 7,736 -- -- -- 494 135,857 1,917 146,004Jul. 7,653 -- -- -- 493 134,947 1,867 144,960Aug. 7,654 -- -- -- 496 134,822 1,865 144,837Sep. 7,427 -- -- -- 74 134,333 1,880 143,714Oct. 7,430 -- -- -- 490 133,934 1,687 143,541Nov. 7,428 -- -- -- 440 133,414 1,643 142,925Dec. 7,306 -- -- -- 439 132,749 1,648 142,1422004Jan. 6,823 -- -- -- 438 133,067 1,458 141,786Feb. 6,667 -- -- -- 437 134,811 1,624 143,539Mar. 6,209 -- -- -- 413 130,059 2,029 138,710Apr. 6,090 -- -- -- 408 128,051 2,000 136,549May 6,378 -- -- -- 335 125,559 2,802 135,074Jun. 5,259 -- -- -- 405 126,870 1,334 133,868
SOURCE: The Central Bank of The Bahamas
50
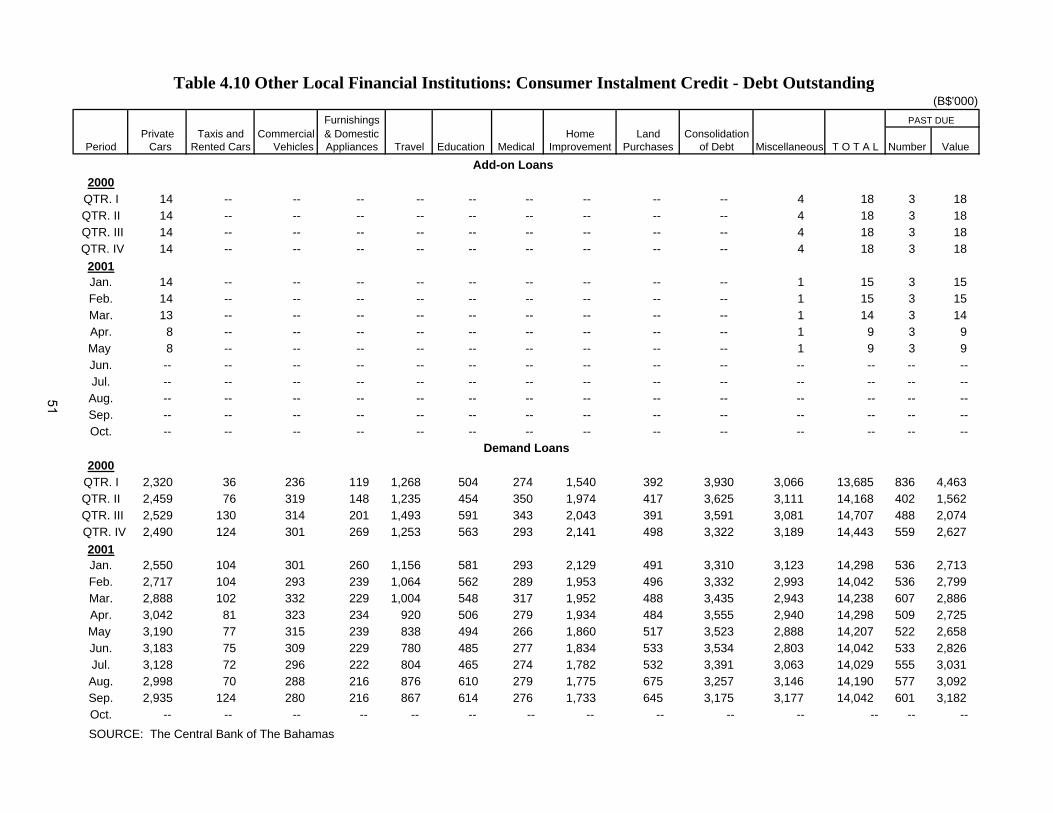
Table 4.10 Other Local Financial Institutions: Consumer Instalment Credit - Debt Outstanding(B$'000)
Furnishings PAST DUE Private Taxis and Commercial & Domestic Home Land Consolidation
Period Cars Rented Cars Vehicles Appliances Travel Education Medical Improvement Purchases of Debt Miscellaneous T O T A L Number Value
Add-on Loans2000
QTR. I 14 -- -- -- -- -- -- -- -- -- 4 18 3 18QTR. II 14 -- -- -- -- -- -- -- -- -- 4 18 3 18
QTR. III 14 -- -- -- -- -- -- -- -- -- 4 18 3 18 QTR. IV 14 -- -- -- -- -- -- -- -- -- 4 18 3 18
2001Jan. 14 -- -- -- -- -- -- -- -- -- 1 15 3 15Feb. 14 -- -- -- -- -- -- -- -- -- 1 15 3 15Mar. 13 -- -- -- -- -- -- -- -- -- 1 14 3 14Apr. 8 -- -- -- -- -- -- -- -- -- 1 9 3 9May 8 -- -- -- -- -- -- -- -- -- 1 9 3 9Jun. -- -- -- -- -- -- -- -- -- -- -- -- -- --Jul. -- -- -- -- -- -- -- -- -- -- -- -- -- --Aug. -- -- -- -- -- -- -- -- -- -- -- -- -- --Sep. -- -- -- -- -- -- -- -- -- -- -- -- -- --Oct. -- -- -- -- -- -- -- -- -- -- -- -- -- --
Demand Loans2000
QTR. I 2,320 36 236 119 1,268 504 274 1,540 392 3,930 3,066 13,685 836 4,463QTR. II 2,459 76 319 148 1,235 454 350 1,974 417 3,625 3,111 14,168 402 1,562
QTR. III 2,529 130 314 201 1,493 591 343 2,043 391 3,591 3,081 14,707 488 2,074 QTR. IV 2,490 124 301 269 1,253 563 293 2,141 498 3,322 3,189 14,443 559 2,627
2001Jan. 2,550 104 301 260 1,156 581 293 2,129 491 3,310 3,123 14,298 536 2,713Feb. 2,717 104 293 239 1,064 562 289 1,953 496 3,332 2,993 14,042 536 2,799Mar. 2,888 102 332 229 1,004 548 317 1,952 488 3,435 2,943 14,238 607 2,886Apr. 3,042 81 323 234 920 506 279 1,934 484 3,555 2,940 14,298 509 2,725May 3,190 77 315 239 838 494 266 1,860 517 3,523 2,888 14,207 522 2,658Jun. 3,183 75 309 229 780 485 277 1,834 533 3,534 2,803 14,042 533 2,826Jul. 3,128 72 296 222 804 465 274 1,782 532 3,391 3,063 14,029 555 3,031Aug. 2,998 70 288 216 876 610 279 1,775 675 3,257 3,146 14,190 577 3,092Sep. 2,935 124 280 216 867 614 276 1,733 645 3,175 3,177 14,042 601 3,182Oct. -- -- -- -- -- -- -- -- -- -- -- -- -- --
SOURCE: The Central Bank of The Bahamas
51
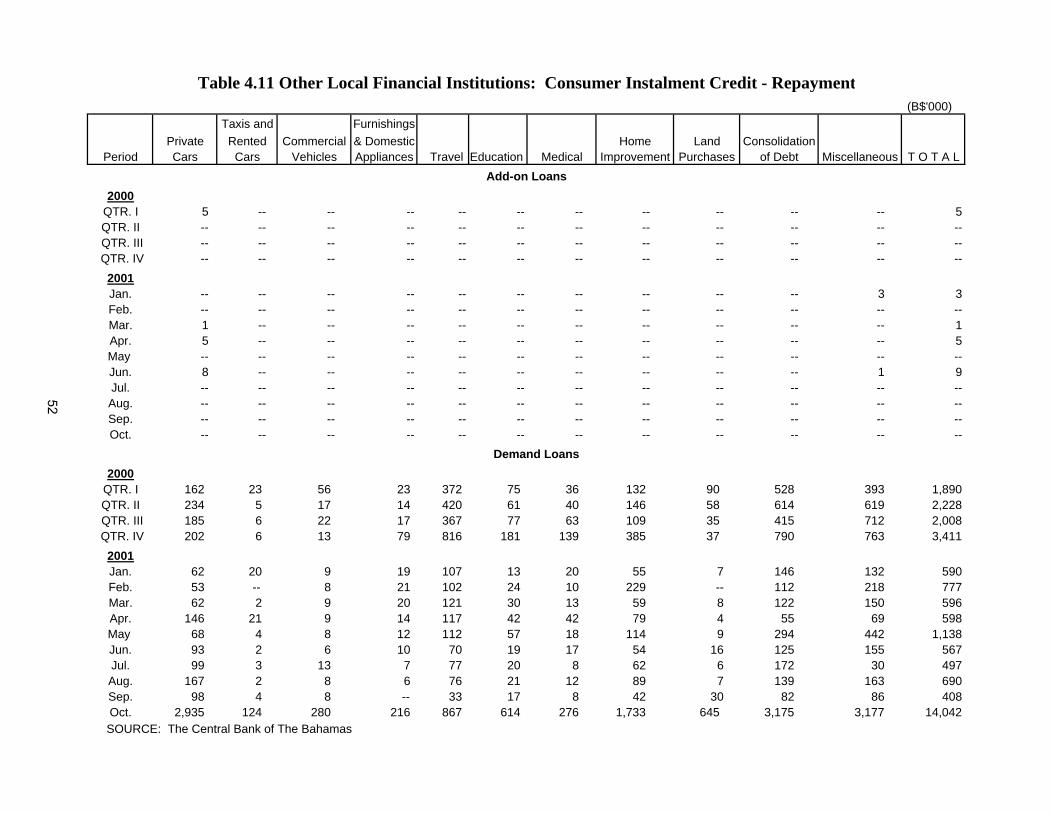
Table 4.11 Other Local Financial Institutions: Consumer Instalment Credit - Repayment (B$'000)
Taxis and FurnishingsPrivate Rented Commercial & Domestic Home Land Consolidation
Period Cars Cars Vehicles Appliances Travel Education Medical Improvement Purchases of Debt Miscellaneous T O T A L
2000QTR. I 5 -- -- -- -- -- -- -- -- -- -- 5QTR. II -- -- -- -- -- -- -- -- -- -- -- --
QTR. III -- -- -- -- -- -- -- -- -- -- -- -- QTR. IV -- -- -- -- -- -- -- -- -- -- -- --
2001Jan. -- -- -- -- -- -- -- -- -- -- 3 3Feb. -- -- -- -- -- -- -- -- -- -- -- --Mar. 1 -- -- -- -- -- -- -- -- -- -- 1Apr. 5 -- -- -- -- -- -- -- -- -- -- 5May -- -- -- -- -- -- -- -- -- -- -- --Jun. 8 -- -- -- -- -- -- -- -- -- 1 9Jul. -- -- -- -- -- -- -- -- -- -- -- --Aug. -- -- -- -- -- -- -- -- -- -- -- --Sep. -- -- -- -- -- -- -- -- -- -- -- --Oct. -- -- -- -- -- -- -- -- -- -- -- --
2000QTR. I 162 23 56 23 372 75 36 132 90 528 393 1,890QTR. II 234 5 17 14 420 61 40 146 58 614 619 2,228
QTR. III 185 6 22 17 367 77 63 109 35 415 712 2,008 QTR. IV 202 6 13 79 816 181 139 385 37 790 763 3,411
2001Jan. 62 20 9 19 107 13 20 55 7 146 132 590Feb. 53 -- 8 21 102 24 10 229 -- 112 218 777Mar. 62 2 9 20 121 30 13 59 8 122 150 596Apr. 146 21 9 14 117 42 42 79 4 55 69 598May 68 4 8 12 112 57 18 114 9 294 442 1,138Jun. 93 2 6 10 70 19 17 54 16 125 155 567Jul. 99 3 13 7 77 20 8 62 6 172 30 497Aug. 167 2 8 6 76 21 12 89 7 139 163 690Sep. 98 4 8 -- 33 17 8 42 30 82 86 408Oct. 2,935 124 280 216 867 614 276 1,733 645 3,175 3,177 14,042
SOURCE: The Central Bank of The Bahamas
Demand Loans
Add-on Loans
52
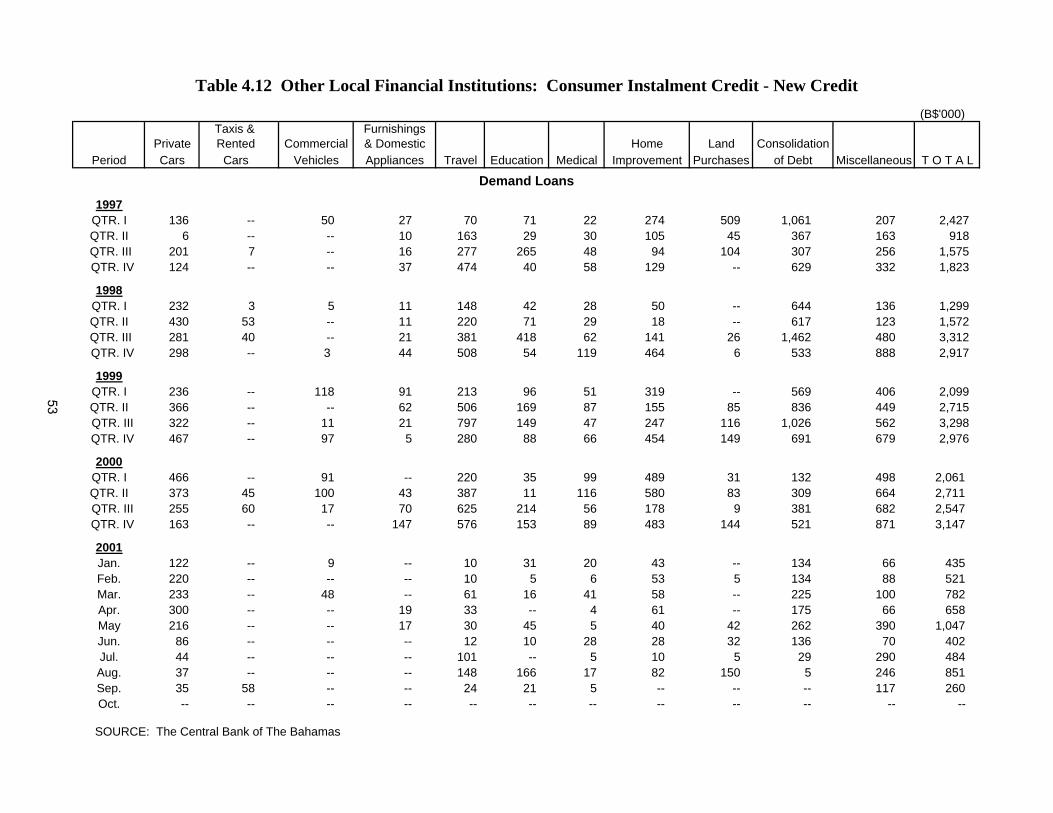
Table 4.12 Other Local Financial Institutions: Consumer Instalment Credit - New Credit (B$'000)
Taxis & FurnishingsPrivate Rented Commercial & Domestic Home Land Consolidation
Period Cars Cars Vehicles Appliances Travel Education Medical Improvement Purchases of Debt Miscellaneous T O T A L
1997QTR. I 136 -- 50 27 70 71 22 274 509 1,061 207 2,427QTR. II 6 -- -- 10 163 29 30 105 45 367 163 918
QTR. III 201 7 -- 16 277 265 48 94 104 307 256 1,575 QTR. IV 124 -- -- 37 474 40 58 129 -- 629 332 1,823
1998QTR. I 232 3 5 11 148 42 28 50 -- 644 136 1,299QTR. II 430 53 -- 11 220 71 29 18 -- 617 123 1,572
QTR. III 281 40 -- 21 381 418 62 141 26 1,462 480 3,312 QTR. IV 298 -- 3 44 508 54 119 464 6 533 888 2,917
1999QTR. I 236 -- 118 91 213 96 51 319 -- 569 406 2,099QTR. II 366 -- -- 62 506 169 87 155 85 836 449 2,715
QTR. III 322 -- 11 21 797 149 47 247 116 1,026 562 3,298 QTR. IV 467 -- 97 5 280 88 66 454 149 691 679 2,976
2000QTR. I 466 -- 91 -- 220 35 99 489 31 132 498 2,061QTR. II 373 45 100 43 387 11 116 580 83 309 664 2,711
QTR. III 255 60 17 70 625 214 56 178 9 381 682 2,547 QTR. IV 163 -- -- 147 576 153 89 483 144 521 871 3,147
2001Jan. 122 -- 9 -- 10 31 20 43 -- 134 66 435Feb. 220 -- -- -- 10 5 6 53 5 134 88 521Mar. 233 -- 48 -- 61 16 41 58 -- 225 100 782Apr. 300 -- -- 19 33 -- 4 61 -- 175 66 658May 216 -- -- 17 30 45 5 40 42 262 390 1,047Jun. 86 -- -- -- 12 10 28 28 32 136 70 402Jul. 44 -- -- -- 101 -- 5 10 5 29 290 484Aug. 37 -- -- -- 148 166 17 82 150 5 246 851Sep. 35 58 -- -- 24 21 5 -- -- -- 117 260Oct. -- -- -- -- -- -- -- -- -- -- -- --
SOURCE: The Central Bank of The Bahamas
Demand Loans
53
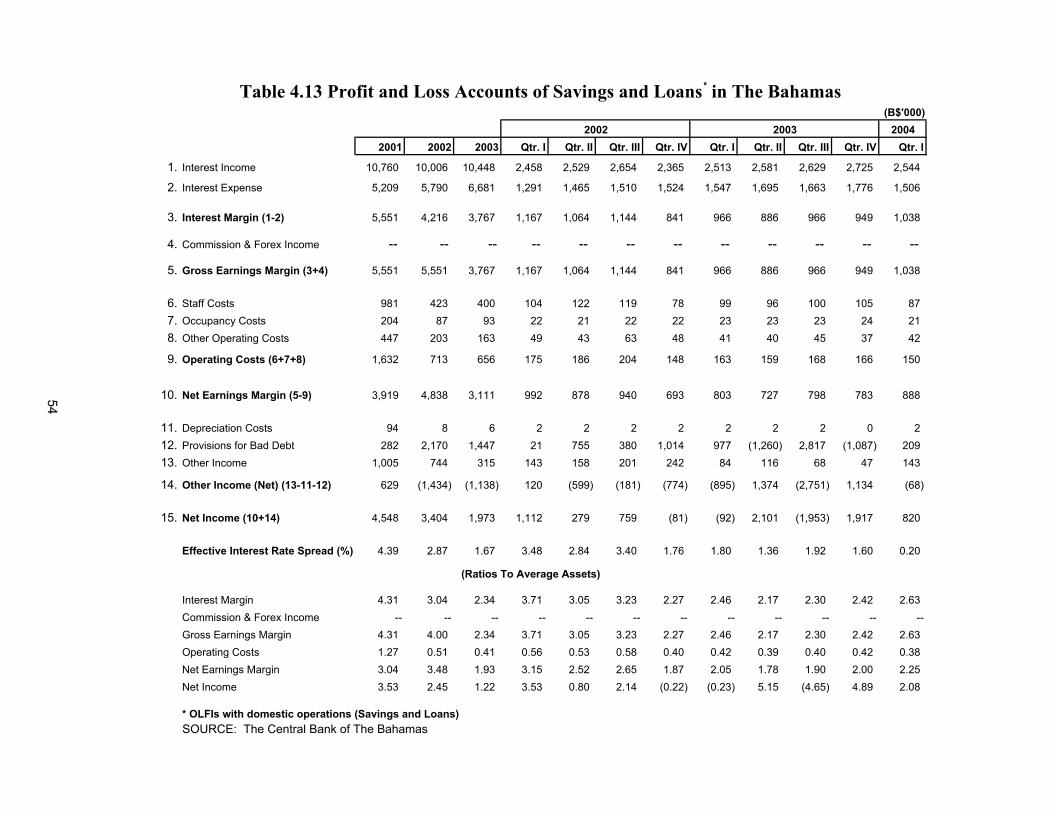
(B$'000)2004
2001 2002 2003 Qtr. I Qtr. II Qtr. III Qtr. IV Qtr. I Qtr. II Qtr. III Qtr. IV Qtr. I
1. Interest Income 10,760 10,006 10,448 2,458 2,529 2,654 2,365 2,513 2,581 2,629 2,725 2,544
2. Interest Expense 5,209 5,790 6,681 1,291 1,465 1,510 1,524 1,547 1,695 1,663 1,776 1,506
3. Interest Margin (1-2) 5,551 4,216 3,767 1,167 1,064 1,144 841 966 886 966 949 1,038
4. Commission & Forex Income -- -- -- -- -- -- -- -- -- -- -- --
5. Gross Earnings Margin (3+4) 5,551 5,551 3,767 1,167 1,064 1,144 841 966 886 966 949 1,038
6. Staff Costs 981 423 400 104 122 119 78 99 96 100 105 877. Occupancy Costs 204 87 93 22 21 22 22 23 23 23 24 218. Other Operating Costs 447 203 163 49 43 63 48 41 40 45 37 42
9. Operating Costs (6+7+8) 1,632 713 656 175 186 204 148 163 159 168 166 150
10. Net Earnings Margin (5-9) 3,919 4,838 3,111 992 878 940 693 803 727 798 783 888
11. Depreciation Costs 94 8 6 2 2 2 2 2 2 2 0 212. Provisions for Bad Debt 282 2,170 1,447 21 755 380 1,014 977 (1,260) 2,817 (1,087) 20913. Other Income 1,005 744 315 143 158 201 242 84 116 68 47 143
14. Other Income (Net) (13-11-12) 629 (1,434) (1,138) 120 (599) (181) (774) (895) 1,374 (2,751) 1,134 (68)
15. Net Income (10+14) 4,548 3,404 1,973 1,112 279 759 (81) (92) 2,101 (1,953) 1,917 820
Effective Interest Rate Spread (%) 4.39 2.87 1.67 3.48 2.84 3.40 1.76 1.80 1.36 1.92 1.60 0.20
Interest Margin 4.31 3.04 2.34 3.71 3.05 3.23 2.27 2.46 2.17 2.30 2.42 2.63Commission & Forex Income -- -- -- -- -- -- -- -- -- -- -- --Gross Earnings Margin 4.31 4.00 2.34 3.71 3.05 3.23 2.27 2.46 2.17 2.30 2.42 2.63Operating Costs 1.27 0.51 0.41 0.56 0.53 0.58 0.40 0.42 0.39 0.40 0.42 0.38Net Earnings Margin 3.04 3.48 1.93 3.15 2.52 2.65 1.87 2.05 1.78 1.90 2.00 2.25Net Income 3.53 2.45 1.22 3.53 0.80 2.14 (0.22) (0.23) 5.15 (4.65) 4.89 2.08
* OLFIs with domestic operations (Savings and Loans)SOURCE: The Central Bank of The Bahamas
Table 4.13 Profit and Loss Accounts of Savings and Loans * in The Bahamas
(Ratios To Average Assets)
2002 2003
54
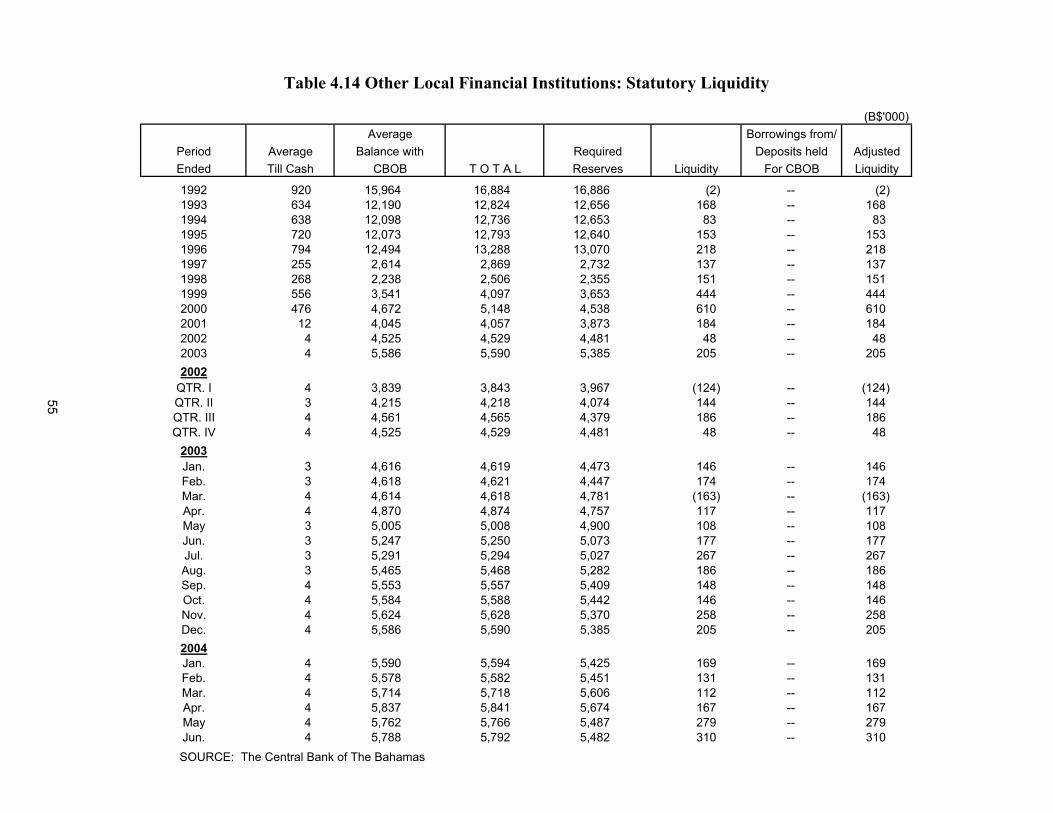
Table 4.14 Other Local Financial Institutions: Statutory Liquidity
(B$'000)Average Borrowings from/
Period Average Balance with Required Deposits held AdjustedEnded Till Cash CBOB T O T A L Reserves Liquidity For CBOB Liquidity
1992 920 15,964 16,884 16,886 (2) -- (2) 1993 634 12,190 12,824 12,656 168 -- 168 1994 638 12,098 12,736 12,653 83 -- 83 1995 720 12,073 12,793 12,640 153 -- 153 1996 794 12,494 13,288 13,070 218 -- 218 1997 255 2,614 2,869 2,732 137 -- 137 1998 268 2,238 2,506 2,355 151 -- 151 1999 556 3,541 4,097 3,653 444 -- 444 2000 476 4,672 5,148 4,538 610 -- 610 2001 12 4,045 4,057 3,873 184 -- 184 2002 4 4,525 4,529 4,481 48 -- 48 2003 4 5,586 5,590 5,385 205 -- 205 2002
QTR. I 4 3,839 3,843 3,967 (124) -- (124) QTR. II 3 4,215 4,218 4,074 144 -- 144 QTR. III 4 4,561 4,565 4,379 186 -- 186 QTR. IV 4 4,525 4,529 4,481 48 -- 48
2003Jan. 3 4,616 4,619 4,473 146 -- 146 Feb. 3 4,618 4,621 4,447 174 -- 174 Mar. 4 4,614 4,618 4,781 (163) -- (163) Apr. 4 4,870 4,874 4,757 117 -- 117 May 3 5,005 5,008 4,900 108 -- 108 Jun. 3 5,247 5,250 5,073 177 -- 177 Jul. 3 5,291 5,294 5,027 267 -- 267 Aug. 3 5,465 5,468 5,282 186 -- 186 Sep. 4 5,553 5,557 5,409 148 -- 148 Oct. 4 5,584 5,588 5,442 146 -- 146 Nov. 4 5,624 5,628 5,370 258 -- 258 Dec. 4 5,586 5,590 5,385 205 -- 205 2004Jan. 4 5,590 5,594 5,425 169 -- 169 Feb. 4 5,578 5,582 5,451 131 -- 131 Mar. 4 5,714 5,718 5,606 112 -- 112 Apr. 4 5,837 5,841 5,674 167 -- 167 May 4 5,762 5,766 5,487 279 -- 279 Jun. 4 5,788 5,792 5,482 310 -- 310
SOURCE: The Central Bank of The Bahamas
55
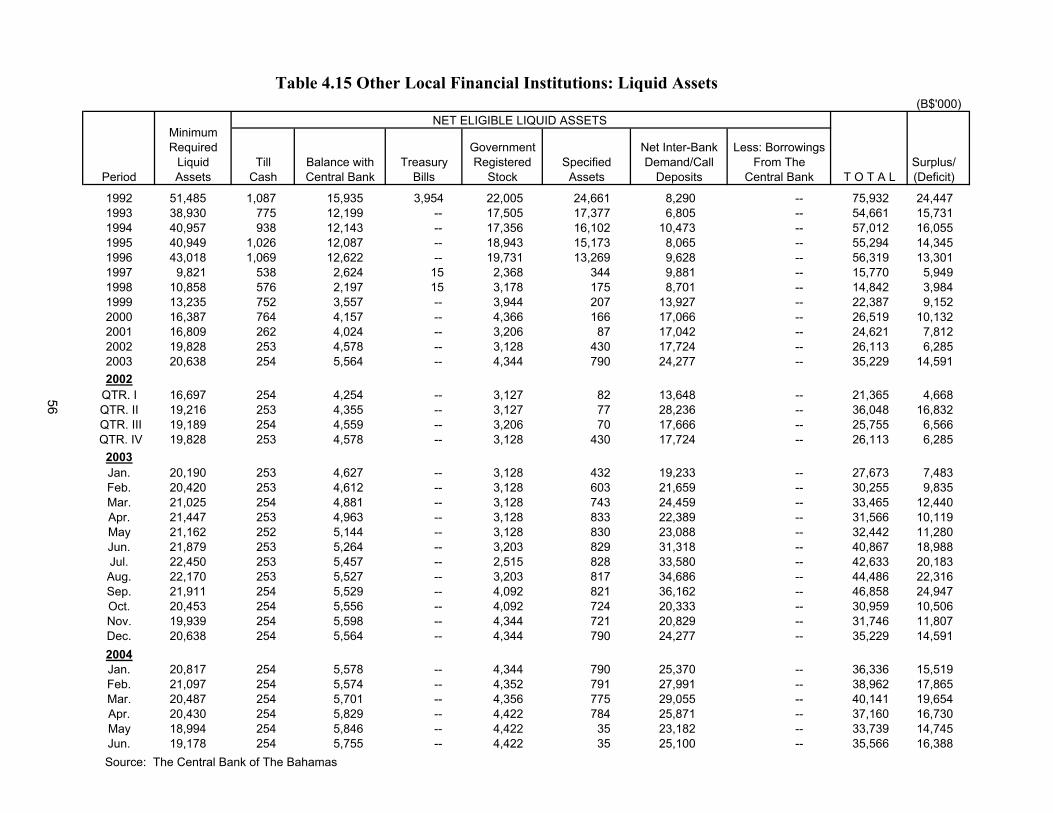
Table 4.15 Other Local Financial Institutions: Liquid Assets(B$'000)
NET ELIGIBLE LIQUID ASSETS MinimumRequired Government Net Inter-Bank Less: Borrowings
Liquid Till Balance with Treasury Registered Specified Demand/Call From The Surplus/Period Assets Cash Central Bank Bills Stock Assets Deposits Central Bank T O T A L (Deficit)
1992 51,485 1,087 15,935 3,954 22,005 24,661 8,290 -- 75,932 24,4471993 38,930 775 12,199 -- 17,505 17,377 6,805 -- 54,661 15,7311994 40,957 938 12,143 -- 17,356 16,102 10,473 -- 57,012 16,0551995 40,949 1,026 12,087 -- 18,943 15,173 8,065 -- 55,294 14,3451996 43,018 1,069 12,622 -- 19,731 13,269 9,628 -- 56,319 13,3011997 9,821 538 2,624 15 2,368 344 9,881 -- 15,770 5,9491998 10,858 576 2,197 15 3,178 175 8,701 -- 14,842 3,9841999 13,235 752 3,557 -- 3,944 207 13,927 -- 22,387 9,1522000 16,387 764 4,157 -- 4,366 166 17,066 -- 26,519 10,1322001 16,809 262 4,024 -- 3,206 87 17,042 -- 24,621 7,8122002 19,828 253 4,578 -- 3,128 430 17,724 -- 26,113 6,2852003 20,638 254 5,564 -- 4,344 790 24,277 -- 35,229 14,5912002
QTR. I 16,697 254 4,254 -- 3,127 82 13,648 -- 21,365 4,668QTR. II 19,216 253 4,355 -- 3,127 77 28,236 -- 36,048 16,832
QTR. III 19,189 254 4,559 -- 3,206 70 17,666 -- 25,755 6,566 QTR. IV 19,828 253 4,578 -- 3,128 430 17,724 -- 26,113 6,285
2003Jan. 20,190 253 4,627 -- 3,128 432 19,233 -- 27,673 7,483Feb. 20,420 253 4,612 -- 3,128 603 21,659 -- 30,255 9,835Mar. 21,025 254 4,881 -- 3,128 743 24,459 -- 33,465 12,440Apr. 21,447 253 4,963 -- 3,128 833 22,389 -- 31,566 10,119May 21,162 252 5,144 -- 3,128 830 23,088 -- 32,442 11,280Jun. 21,879 253 5,264 -- 3,203 829 31,318 -- 40,867 18,988Jul. 22,450 253 5,457 -- 2,515 828 33,580 -- 42,633 20,183Aug. 22,170 253 5,527 -- 3,203 817 34,686 -- 44,486 22,316Sep. 21,911 254 5,529 -- 4,092 821 36,162 -- 46,858 24,947Oct. 20,453 254 5,556 -- 4,092 724 20,333 -- 30,959 10,506Nov. 19,939 254 5,598 -- 4,344 721 20,829 -- 31,746 11,807Dec. 20,638 254 5,564 -- 4,344 790 24,277 -- 35,229 14,5912004Jan. 20,817 254 5,578 -- 4,344 790 25,370 -- 36,336 15,519Feb. 21,097 254 5,574 -- 4,352 791 27,991 -- 38,962 17,865Mar. 20,487 254 5,701 -- 4,356 775 29,055 -- 40,141 19,654Apr. 20,430 254 5,829 -- 4,422 784 25,871 -- 37,160 16,730May 18,994 254 5,846 -- 4,422 35 23,182 -- 33,739 14,745Jun. 19,178 254 5,755 -- 4,422 35 25,100 -- 35,566 16,388
Source: The Central Bank of The Bahamas
56
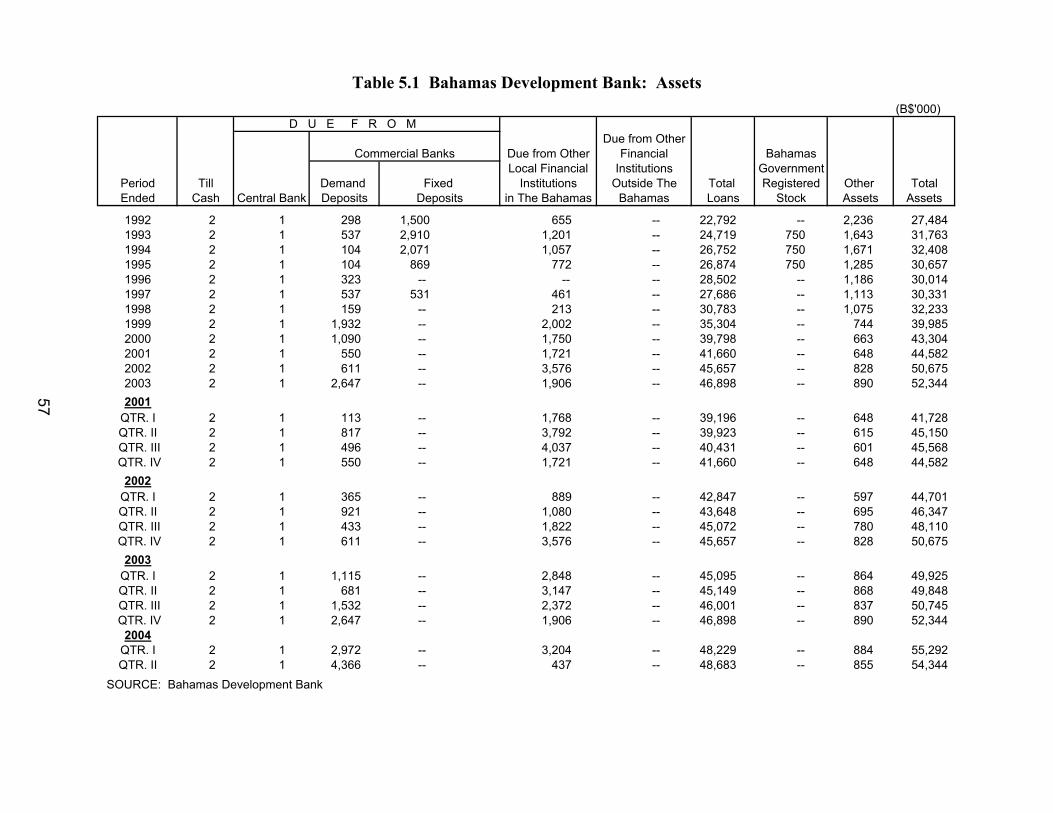
(B$'000) D U E F R O M
Due from Other Commercial Banks Due from Other Financial Bahamas
Local Financial Institutions GovernmentPeriod Till Demand Fixed Institutions Outside The Total Registered Other TotalEnded Cash Central Bank Deposits Deposits in The Bahamas Bahamas Loans Stock Assets Assets
1992 2 1 298 1,500 655 -- 22,792 -- 2,236 27,4841993 2 1 537 2,910 1,201 -- 24,719 750 1,643 31,7631994 2 1 104 2,071 1,057 -- 26,752 750 1,671 32,4081995 2 1 104 869 772 -- 26,874 750 1,285 30,6571996 2 1 323 -- -- -- 28,502 -- 1,186 30,0141997 2 1 537 531 461 -- 27,686 -- 1,113 30,3311998 2 1 159 -- 213 -- 30,783 -- 1,075 32,2331999 2 1 1,932 -- 2,002 -- 35,304 -- 744 39,9852000 2 1 1,090 -- 1,750 -- 39,798 -- 663 43,3042001 2 1 550 -- 1,721 -- 41,660 -- 648 44,5822002 2 1 611 -- 3,576 -- 45,657 -- 828 50,6752003 2 1 2,647 -- 1,906 -- 46,898 -- 890 52,3442001
QTR. I 2 1 113 -- 1,768 -- 39,196 -- 648 41,728QTR. II 2 1 817 -- 3,792 -- 39,923 -- 615 45,150
QTR. III 2 1 496 -- 4,037 -- 40,431 -- 601 45,568 QTR. IV 2 1 550 -- 1,721 -- 41,660 -- 648 44,582
2002QTR. I 2 1 365 -- 889 -- 42,847 -- 597 44,701QTR. II 2 1 921 -- 1,080 -- 43,648 -- 695 46,347
QTR. III 2 1 433 -- 1,822 -- 45,072 -- 780 48,110 QTR. IV 2 1 611 -- 3,576 -- 45,657 -- 828 50,675
2003QTR. I 2 1 1,115 -- 2,848 -- 45,095 -- 864 49,925QTR. II 2 1 681 -- 3,147 -- 45,149 -- 868 49,848
QTR. III 2 1 1,532 -- 2,372 -- 46,001 -- 837 50,745 QTR. IV 2 1 2,647 -- 1,906 -- 46,898 -- 890 52,344
2004QTR. I 2 1 2,972 -- 3,204 -- 48,229 -- 884 55,292QTR. II 2 1 4,366 -- 437 -- 48,683 -- 855 54,344
SOURCE: Bahamas Development Bank
Table 5.1 Bahamas Development Bank: Assets
57
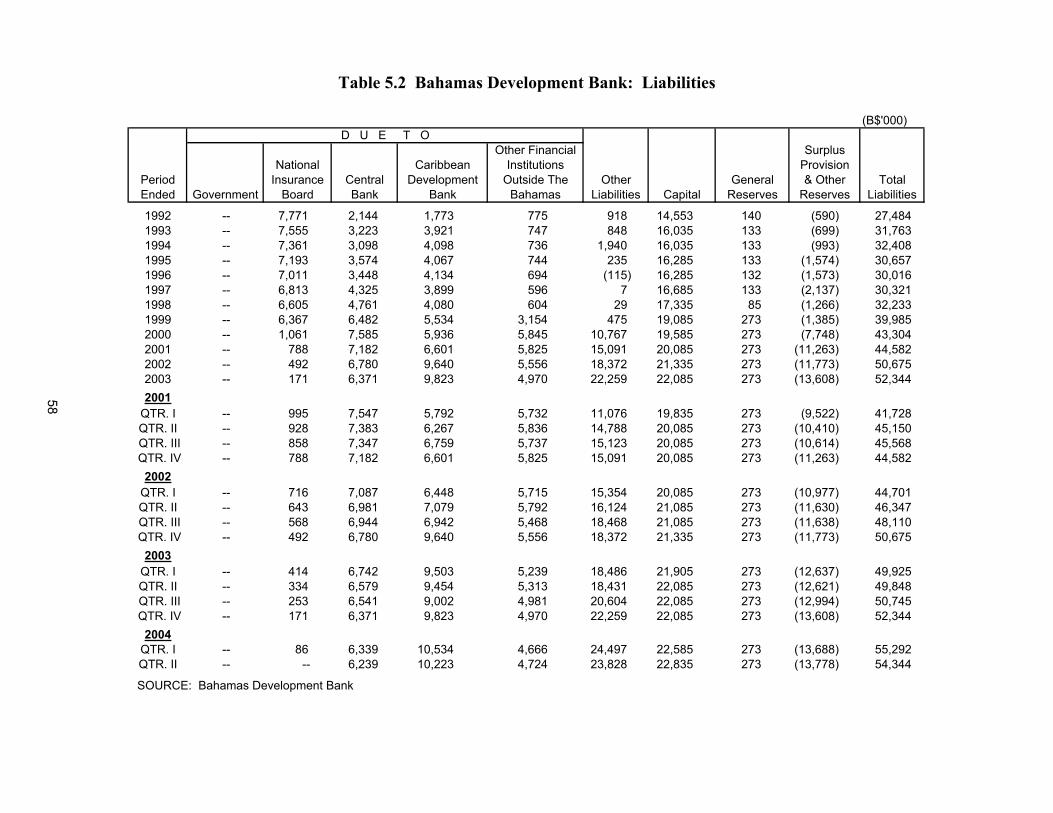
Table 5.2 Bahamas Development Bank: Liabilities
(B$'000)D U E T O
Other Financial Surplus National Caribbean Institutions Provision
Period Insurance Central Development Outside The Other General & Other TotalEnded Government Board Bank Bank Bahamas Liabilities Capital Reserves Reserves Liabilities
1992 -- 7,771 2,144 1,773 775 918 14,553 140 (590) 27,4841993 -- 7,555 3,223 3,921 747 848 16,035 133 (699) 31,7631994 -- 7,361 3,098 4,098 736 1,940 16,035 133 (993) 32,4081995 -- 7,193 3,574 4,067 744 235 16,285 133 (1,574) 30,6571996 -- 7,011 3,448 4,134 694 (115) 16,285 132 (1,573) 30,0161997 -- 6,813 4,325 3,899 596 7 16,685 133 (2,137) 30,3211998 -- 6,605 4,761 4,080 604 29 17,335 85 (1,266) 32,2331999 -- 6,367 6,482 5,534 3,154 475 19,085 273 (1,385) 39,9852000 -- 1,061 7,585 5,936 5,845 10,767 19,585 273 (7,748) 43,3042001 -- 788 7,182 6,601 5,825 15,091 20,085 273 (11,263) 44,5822002 -- 492 6,780 9,640 5,556 18,372 21,335 273 (11,773) 50,6752003 -- 171 6,371 9,823 4,970 22,259 22,085 273 (13,608) 52,3442001
QTR. I -- 995 7,547 5,792 5,732 11,076 19,835 273 (9,522) 41,728QTR. II -- 928 7,383 6,267 5,836 14,788 20,085 273 (10,410) 45,150
QTR. III -- 858 7,347 6,759 5,737 15,123 20,085 273 (10,614) 45,568 QTR. IV -- 788 7,182 6,601 5,825 15,091 20,085 273 (11,263) 44,582
2002QTR. I -- 716 7,087 6,448 5,715 15,354 20,085 273 (10,977) 44,701QTR. II -- 643 6,981 7,079 5,792 16,124 21,085 273 (11,630) 46,347
QTR. III -- 568 6,944 6,942 5,468 18,468 21,085 273 (11,638) 48,110 QTR. IV -- 492 6,780 9,640 5,556 18,372 21,335 273 (11,773) 50,675
2003QTR. I -- 414 6,742 9,503 5,239 18,486 21,905 273 (12,637) 49,925QTR. II -- 334 6,579 9,454 5,313 18,431 22,085 273 (12,621) 49,848
QTR. III -- 253 6,541 9,002 4,981 20,604 22,085 273 (12,994) 50,745 QTR. IV -- 171 6,371 9,823 4,970 22,259 22,085 273 (13,608) 52,344
2004QTR. I -- 86 6,339 10,534 4,666 24,497 22,585 273 (13,688) 55,292QTR. II -- -- 6,239 10,223 4,724 23,828 22,835 273 (13,778) 54,344
SOURCE: Bahamas Development Bank
58
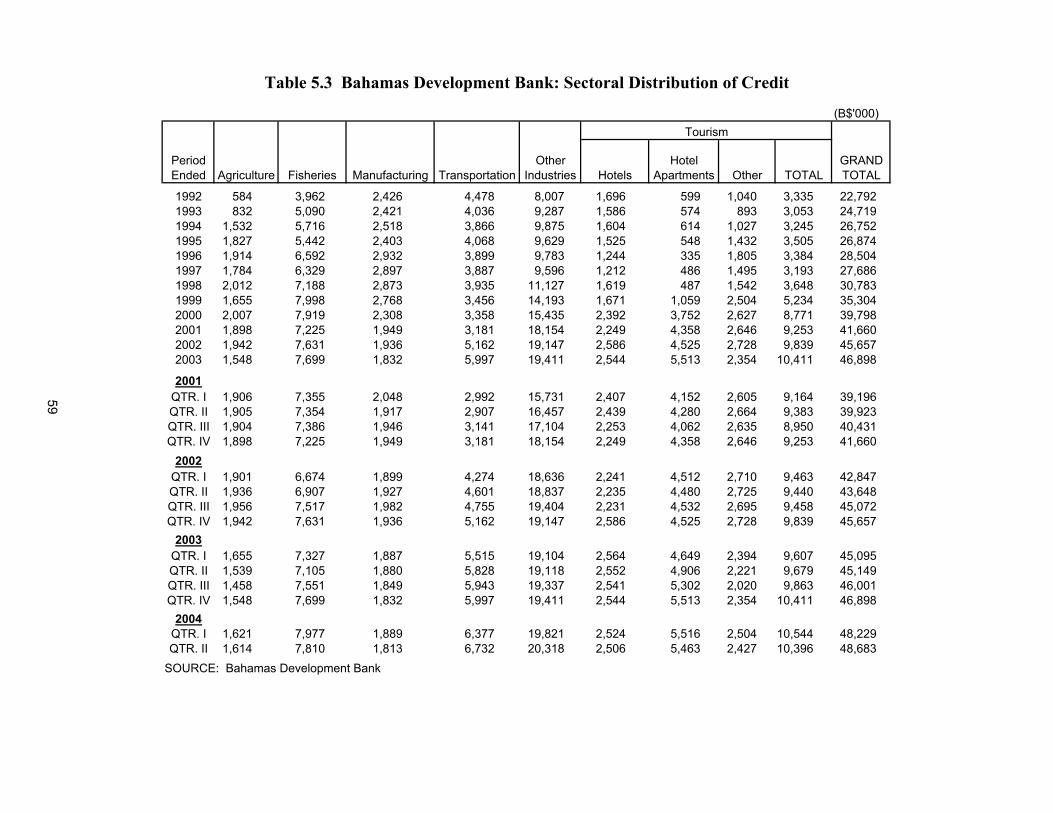
Table 5.3 Bahamas Development Bank: Sectoral Distribution of Credit
(B$'000) Tourism
Period Other Hotel GRANDEnded Agriculture Fisheries Manufacturing Transportation Industries Hotels Apartments Other TOTAL TOTAL
1992 584 3,962 2,426 4,478 8,007 1,696 599 1,040 3,335 22,7921993 832 5,090 2,421 4,036 9,287 1,586 574 893 3,053 24,7191994 1,532 5,716 2,518 3,866 9,875 1,604 614 1,027 3,245 26,7521995 1,827 5,442 2,403 4,068 9,629 1,525 548 1,432 3,505 26,8741996 1,914 6,592 2,932 3,899 9,783 1,244 335 1,805 3,384 28,5041997 1,784 6,329 2,897 3,887 9,596 1,212 486 1,495 3,193 27,6861998 2,012 7,188 2,873 3,935 11,127 1,619 487 1,542 3,648 30,7831999 1,655 7,998 2,768 3,456 14,193 1,671 1,059 2,504 5,234 35,3042000 2,007 7,919 2,308 3,358 15,435 2,392 3,752 2,627 8,771 39,7982001 1,898 7,225 1,949 3,181 18,154 2,249 4,358 2,646 9,253 41,6602002 1,942 7,631 1,936 5,162 19,147 2,586 4,525 2,728 9,839 45,6572003 1,548 7,699 1,832 5,997 19,411 2,544 5,513 2,354 10,411 46,898
2001QTR. I 1,906 7,355 2,048 2,992 15,731 2,407 4,152 2,605 9,164 39,196QTR. II 1,905 7,354 1,917 2,907 16,457 2,439 4,280 2,664 9,383 39,923QTR. III 1,904 7,386 1,946 3,141 17,104 2,253 4,062 2,635 8,950 40,431QTR. IV 1,898 7,225 1,949 3,181 18,154 2,249 4,358 2,646 9,253 41,660
2002QTR. I 1,901 6,674 1,899 4,274 18,636 2,241 4,512 2,710 9,463 42,847QTR. II 1,936 6,907 1,927 4,601 18,837 2,235 4,480 2,725 9,440 43,648QTR. III 1,956 7,517 1,982 4,755 19,404 2,231 4,532 2,695 9,458 45,072QTR. IV 1,942 7,631 1,936 5,162 19,147 2,586 4,525 2,728 9,839 45,657
2003QTR. I 1,655 7,327 1,887 5,515 19,104 2,564 4,649 2,394 9,607 45,095QTR. II 1,539 7,105 1,880 5,828 19,118 2,552 4,906 2,221 9,679 45,149QTR. III 1,458 7,551 1,849 5,943 19,337 2,541 5,302 2,020 9,863 46,001QTR. IV 1,548 7,699 1,832 5,997 19,411 2,544 5,513 2,354 10,411 46,898
2004QTR. I 1,621 7,977 1,889 6,377 19,821 2,524 5,516 2,504 10,544 48,229QTR. II 1,614 7,810 1,813 6,732 20,318 2,506 5,463 2,427 10,396 48,683
SOURCE: Bahamas Development Bank
59
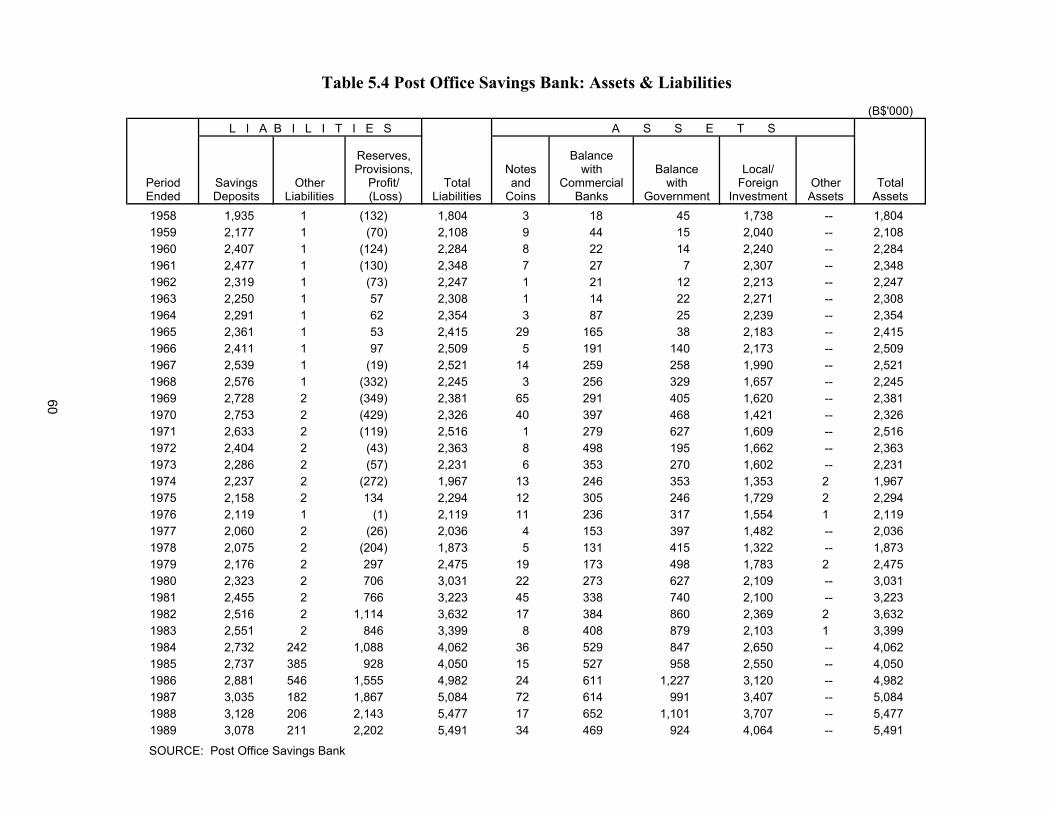
Table 5.4 Post Office Savings Bank: Assets & Liabilities(B$'000)
L I A B I L I T I E S A S S E T S
Reserves, Balance Provisions, Notes with Balance Local/
Period Savings Other Profit/ Total and Commercial with Foreign Other TotalEnded Deposits Liabilities (Loss) Liabilities Coins Banks Government Investment Assets Assets1958 1,935 1 (132) 1,804 3 18 45 1,738 -- 1,8041959 2,177 1 (70) 2,108 9 44 15 2,040 -- 2,1081960 2,407 1 (124) 2,284 8 22 14 2,240 -- 2,2841961 2,477 1 (130) 2,348 7 27 7 2,307 -- 2,3481962 2,319 1 (73) 2,247 1 21 12 2,213 -- 2,2471963 2,250 1 57 2,308 1 14 22 2,271 -- 2,3081964 2,291 1 62 2,354 3 87 25 2,239 -- 2,3541965 2,361 1 53 2,415 29 165 38 2,183 -- 2,4151966 2,411 1 97 2,509 5 191 140 2,173 -- 2,5091967 2,539 1 (19) 2,521 14 259 258 1,990 -- 2,5211968 2,576 1 (332) 2,245 3 256 329 1,657 -- 2,2451969 2,728 2 (349) 2,381 65 291 405 1,620 -- 2,3811970 2,753 2 (429) 2,326 40 397 468 1,421 -- 2,3261971 2,633 2 (119) 2,516 1 279 627 1,609 -- 2,5161972 2,404 2 (43) 2,363 8 498 195 1,662 -- 2,3631973 2,286 2 (57) 2,231 6 353 270 1,602 -- 2,2311974 2,237 2 (272) 1,967 13 246 353 1,353 2 1,9671975 2,158 2 134 2,294 12 305 246 1,729 2 2,2941976 2,119 1 (1) 2,119 11 236 317 1,554 1 2,1191977 2,060 2 (26) 2,036 4 153 397 1,482 -- 2,0361978 2,075 2 (204) 1,873 5 131 415 1,322 -- 1,8731979 2,176 2 297 2,475 19 173 498 1,783 2 2,4751980 2,323 2 706 3,031 22 273 627 2,109 -- 3,0311981 2,455 2 766 3,223 45 338 740 2,100 -- 3,2231982 2,516 2 1,114 3,632 17 384 860 2,369 2 3,6321983 2,551 2 846 3,399 8 408 879 2,103 1 3,3991984 2,732 242 1,088 4,062 36 529 847 2,650 -- 4,0621985 2,737 385 928 4,050 15 527 958 2,550 -- 4,0501986 2,881 546 1,555 4,982 24 611 1,227 3,120 -- 4,9821987 3,035 182 1,867 5,084 72 614 991 3,407 -- 5,0841988 3,128 206 2,143 5,477 17 652 1,101 3,707 -- 5,4771989 3,078 211 2,202 5,491 34 469 924 4,064 -- 5,491
SOURCE: Post Office Savings Bank
60
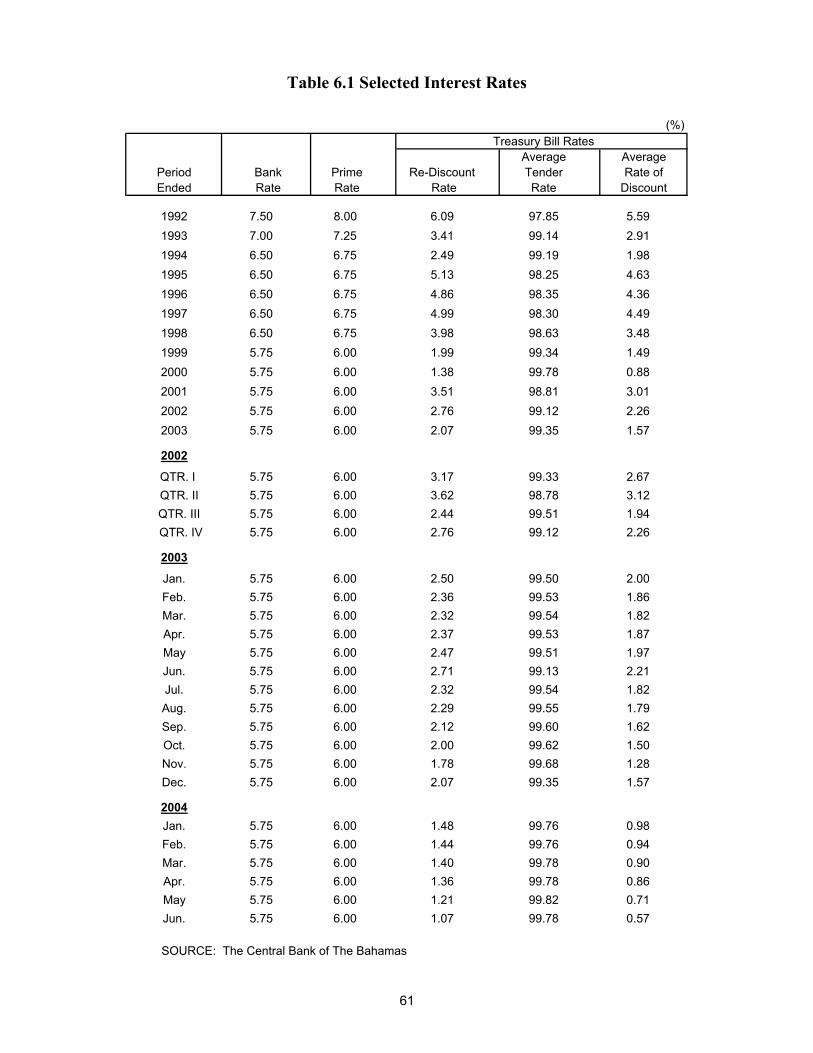
Table 6.1 Selected Interest Rates
(%)Treasury Bill Rates
Average AveragePeriod Bank Prime Re-Discount Tender Rate ofEnded Rate Rate Rate Rate Discount
1992 7.50 8.00 6.09 97.85 5.591993 7.00 7.25 3.41 99.14 2.911994 6.50 6.75 2.49 99.19 1.981995 6.50 6.75 5.13 98.25 4.631996 6.50 6.75 4.86 98.35 4.361997 6.50 6.75 4.99 98.30 4.491998 6.50 6.75 3.98 98.63 3.481999 5.75 6.00 1.99 99.34 1.492000 5.75 6.00 1.38 99.78 0.882001 5.75 6.00 3.51 98.81 3.012002 5.75 6.00 2.76 99.12 2.262003 5.75 6.00 2.07 99.35 1.57
2002
QTR. I 5.75 6.00 3.17 99.33 2.67 QTR. II 5.75 6.00 3.62 98.78 3.12 QTR. III 5.75 6.00 2.44 99.51 1.94 QTR. IV 5.75 6.00 2.76 99.12 2.26
2003
Jan. 5.75 6.00 2.50 99.50 2.00Feb. 5.75 6.00 2.36 99.53 1.86Mar. 5.75 6.00 2.32 99.54 1.82Apr. 5.75 6.00 2.37 99.53 1.87May 5.75 6.00 2.47 99.51 1.97Jun. 5.75 6.00 2.71 99.13 2.21Jul. 5.75 6.00 2.32 99.54 1.82Aug. 5.75 6.00 2.29 99.55 1.79Sep. 5.75 6.00 2.12 99.60 1.62Oct. 5.75 6.00 2.00 99.62 1.50Nov. 5.75 6.00 1.78 99.68 1.28Dec. 5.75 6.00 2.07 99.35 1.57
2004Jan. 5.75 6.00 1.48 99.76 0.98Feb. 5.75 6.00 1.44 99.76 0.94Mar. 5.75 6.00 1.40 99.78 0.90Apr. 5.75 6.00 1.36 99.78 0.86May 5.75 6.00 1.21 99.82 0.71Jun. 5.75 6.00 1.07 99.78 0.57
SOURCE: The Central Bank of The Bahamas
61
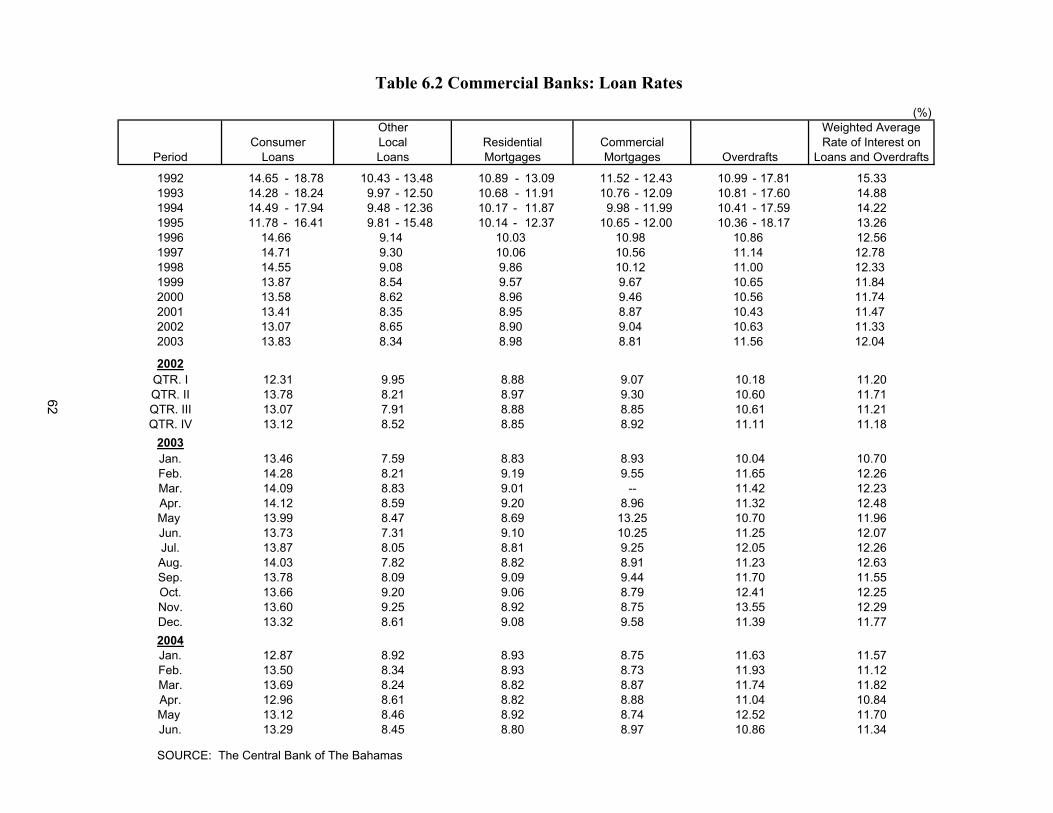
(%)Other Weighted Average
Consumer Local Residential Commercial Rate of Interest onPeriod Loans Loans Mortgages Mortgages Overdrafts Loans and Overdrafts
1992 14.65 - 18.78 10.43 - 13.48 10.89 - 13.09 11.52 - 12.43 10.99 - 17.81 15.331993 14.28 - 18.24 9.97 - 12.50 10.68 - 11.91 10.76 - 12.09 10.81 - 17.60 14.881994 14.49 - 17.94 9.48 - 12.36 10.17 - 11.87 9.98 - 11.99 10.41 - 17.59 14.221995 11.78 - 16.41 9.81 - 15.48 10.14 - 12.37 10.65 - 12.00 10.36 - 18.17 13.261996 14.66 9.14 10.03 10.98 10.86 12.561997 14.71 9.30 10.06 10.56 11.14 12.781998 14.55 9.08 9.86 10.12 11.00 12.331999 13.87 8.54 9.57 9.67 10.65 11.842000 13.58 8.62 8.96 9.46 10.56 11.742001 13.41 8.35 8.95 8.87 10.43 11.472002 13.07 8.65 8.90 9.04 10.63 11.332003 13.83 8.34 8.98 8.81 11.56 12.04
2002QTR. I 11.20QTR. II 11.71QTR. III 11.21QTR. IV 11.18
2003Jan. 7.59 10.70Feb. 8.21 12.26Mar. 8.83 12.23Apr. 8.59 12.48May 8.47 11.96Jun. 7.31 12.07Jul. 8.05 12.26Aug. 7.82 12.63Sep. 8.09 11.55Oct. 9.20 12.25Nov. 9.25 12.29Dec. 8.61 11.772004Jan. 8.92 11.57Feb. 8.34 11.12Mar. 8.24 11.82Apr. 8.61 10.84May 8.46 11.70Jun. 8.45 11.34
SOURCE: The Central Bank of The Bahamas
8.888.748.97
11.0412.5210.86
12.9613.1213.29
8.828.928.80
11.6311.9311.74
8.758.738.87
8.938.938.82
12.8713.5013.69
14.09 9.01 -- 11.42
13.46 8.83 8.93 10.0414.28 9.19 9.55 11.65
9.208.699.10
Table 6.2 Commercial Banks: Loan Rates
8.9613.2510.25
11.3210.7011.25
14.1213.9913.7313.8714.0313.78
8.818.829.09
10.18
9.258.919.44
12.0511.2311.70
12.31 9.95 8.88 9.0710.60
13.07 7.91 8.88 8.85 10.6113.78 8.21 8.97 9.30
11.1113.12 8.52 8.85 8.92
13.6613.6013.32
9.068.929.08
8.798.759.58
12.4113.5511.39
62
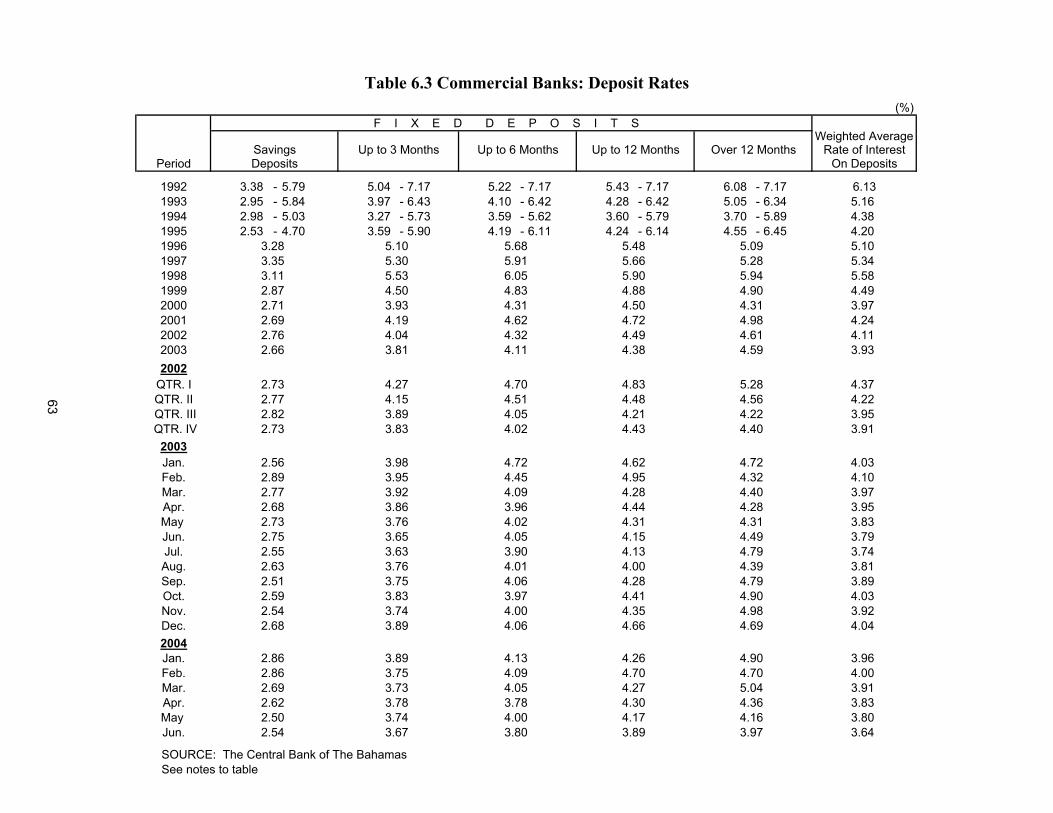
Table 6.3 Commercial Banks: Deposit Rates(%)
F I X E D D E P O S I T S Weighted Average
Savings Up to 3 Months Up to 6 Months Up to 12 Months Over 12 Months Rate of InterestPeriod Deposits On Deposits
1992 3.38 - 5.79 5.04 - 7.17 5.22 - 7.17 5.43 - 7.17 6.08 - 7.17 6.131993 2.95 - 5.84 3.97 - 6.43 4.10 - 6.42 4.28 - 6.42 5.05 - 6.34 5.161994 2.98 - 5.03 3.27 - 5.73 3.59 - 5.62 3.60 - 5.79 3.70 - 5.89 4.381995 2.53 - 4.70 3.59 - 5.90 4.19 - 6.11 4.24 - 6.14 4.55 - 6.45 4.201996 3.28 5.10 5.68 5.48 5.09 5.101997 3.35 5.30 5.91 5.66 5.28 5.341998 3.11 5.53 6.05 5.90 5.94 5.581999 2.87 4.50 4.83 4.88 4.90 4.492000 2.71 3.93 4.31 4.50 4.31 3.972001 2.69 4.19 4.62 4.72 4.98 4.242002 2.76 4.04 4.32 4.49 4.61 4.112003 2.66 3.81 4.11 4.38 4.59 3.932002
QTR. I 4.37QTR. II 4.22
QTR. III 3.95 QTR. IV 3.91
2003Jan. 4.03Feb. 4.10Mar. 3.97Apr. 3.95May 3.83Jun. 3.79Jul. 3.74Aug. 3.81Sep. 3.89Oct. 4.03Nov. 3.92Dec. 4.042004Jan. 3.96Feb. 4.00Mar. 3.91Apr. 3.83May 3.80Jun. 3.64
SOURCE: The Central Bank of The Bahamas See notes to table
4.364.163.97
3.784.003.80
4.304.173.89
2.622.502.54
3.783.743.67
4.904.705.04
4.264.704.27
4.134.094.05
3.893.753.73
2.862.862.69
4.904.984.69
3.974.004.06
4.414.354.66
2.592.542.68
3.833.743.89
4.794.394.79
3.904.014.06
4.134.004.28
2.552.632.51
3.633.763.75
4.402.77 3.92 4.09 4.28
4.722.89 3.95 4.45 4.95 4.322.56 3.98 4.72 4.62
2.682.732.75
3.863.763.65
4.284.314.49
3.964.024.05
4.444.314.15
5.282.77 4.15 4.51 4.48 4.562.73 4.27 4.70 4.83
4.404.22
2.73 3.83 4.02 4.432.82 3.89 4.05 4.21
63
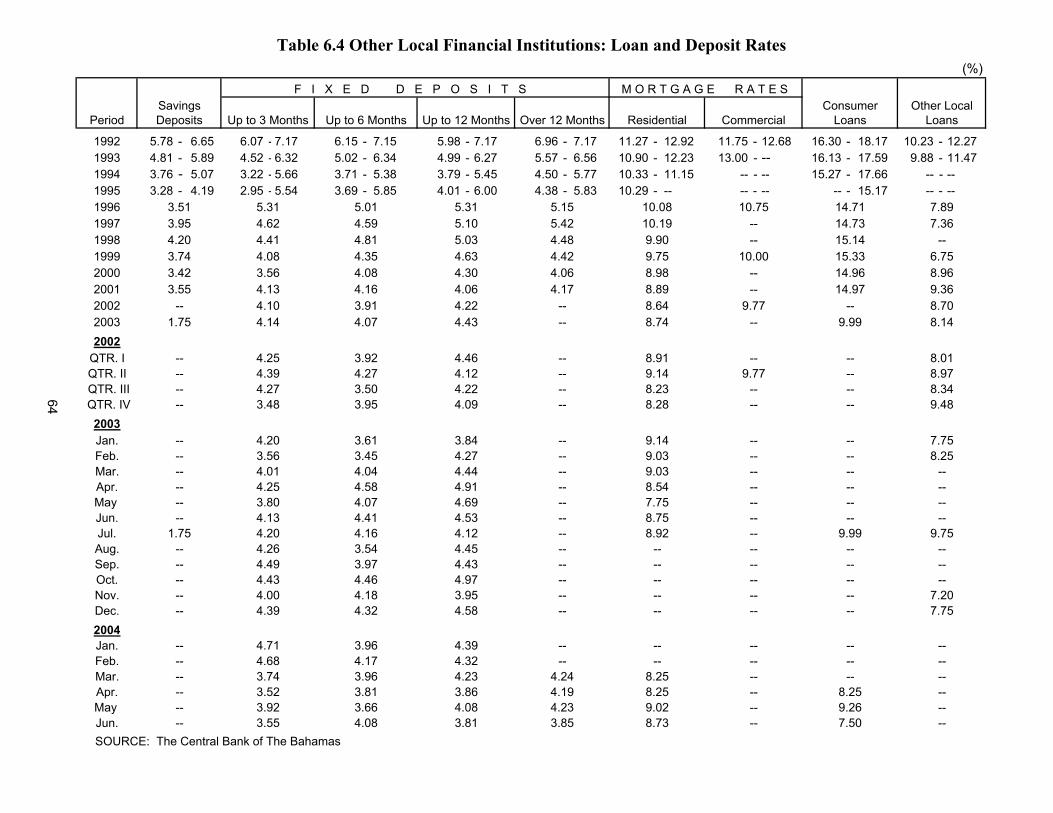
(%)F I X E D D E P O S I T S M O R T G A G E R A T E S
Savings Consumer Other LocalPeriod Deposits Up to 3 Months Up to 6 Months Up to 12 Months Over 12 Months Residential Commercial Loans Loans
1992 5.78 - 6.65 6.07 - 7.17 6.15 - 7.15 5.98 - 7.17 6.96 - 7.17 11.27 - 12.92 11.75 - 12.68 16.30 - 18.17 10.23 - 12.271993 4.81 - 5.89 4.52 - 6.32 5.02 - 6.34 4.99 - 6.27 5.57 - 6.56 10.90 - 12.23 13.00 - -- 16.13 - 17.59 9.88 - 11.471994 3.76 - 5.07 3.22 - 5.66 3.71 - 5.38 3.79 - 5.45 4.50 - 5.77 10.33 - 11.15 -- - -- 15.27 - 17.66 -- - --1995 3.28 - 4.19 2.95 - 5.54 3.69 - 5.85 4.01 - 6.00 4.38 - 5.83 10.29 - -- -- - -- -- - 15.17 -- - --1996 3.51 5.31 5.01 5.31 5.15 10.08 10.75 14.71 7.891997 3.95 4.62 4.59 5.10 5.42 10.19 -- 14.73 7.361998 4.20 4.41 4.81 5.03 4.48 9.90 -- 15.14 --1999 3.74 4.08 4.35 4.63 4.42 9.75 10.00 15.33 6.752000 3.42 3.56 4.08 4.30 4.06 8.98 -- 14.96 8.962001 3.55 4.13 4.16 4.06 4.17 8.89 -- 14.97 9.362002 4.10 3.91 4.22 8.64 9.77 8.702003 4.14 4.07 4.43 8.74 8.142002
QTR. IQTR. II
QTR. III QTR. IV
2003Jan.Feb.Mar.Apr.May Jun.Jul.Aug.Sep.Oct.Nov.Dec.2004Jan.Feb.Mar.Apr.May Jun.
SOURCE: The Central Bank of The Bahamas
------
------
8.259.267.50
4.194.233.85
8.259.028.73
3.864.083.81
3.813.664.08
------
3.523.923.55
--
----
8.28 -- 9.483.48 3.95 4.09 -- ---- 8.344.27 3.50 4.22 -- 8.23 --
8.014.39 4.27 4.12 -- 9.14 9.77 -- 8.97
-- 8.91 -- ---- 4.25 3.92 4.46
9.75----
------
9.99----
------
8.92----
4.163.543.97
4.124.454.43
1.75----
4.204.264.49
------
Table 6.4 Other Local Financial Institutions: Loan and Deposit Rates
------
------
------
8.547.758.75
4.584.074.41
4.914.694.53
------
4.253.804.13
7.75-- 3.56 3.45 -- 9.03 -- -- 8.25-- 4.20 3.61 --
-- ----
-- 4.01 4.04 4.44
3.844.27
---- 9.03 -- --
9.14 -- --
1.75 -- 9.99
------
4.434.004.39
4.464.184.32
4.973.954.58
------
------
--
--7.207.75
------
------
------
4.714.683.74
3.964.173.96
4.394.324.23
-- -- -- ---- -- -- --
4.24 8.25 -- --
------
64
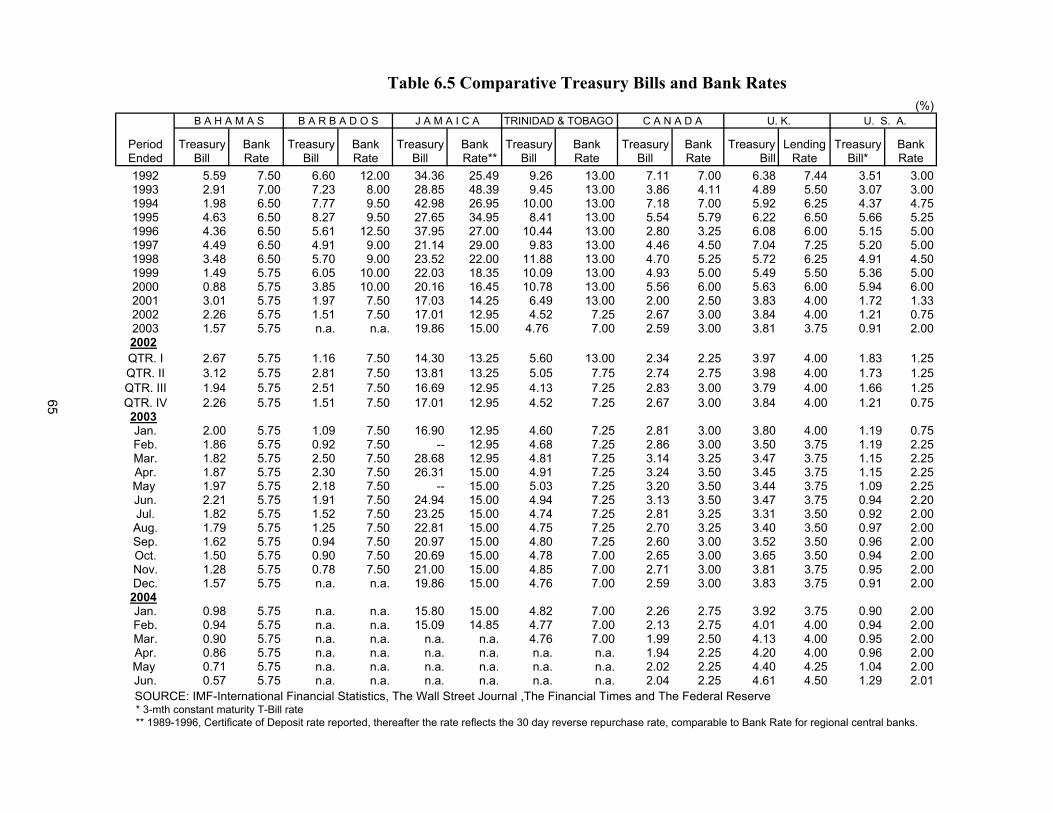
Table 6.5 Comparative Treasury Bills and Bank Rates (%)
B A H A M A S B A R B A D O S J A M A I C A TRINIDAD & TOBAGO C A N A D A U. K. U. S. A.
Period Treasury Bank Treasury Bank Treasury Bank Treasury Bank Treasury Bank Treasury Lending Treasury BankEnded Bill Rate Bill Rate Bill Rate** Bill Rate Bill Rate Bill Rate Bill* Rate1992 5.59 7.50 6.60 12.00 34.36 25.49 9.26 13.00 7.11 7.00 6.38 7.44 3.51 3.001993 2.91 7.00 7.23 8.00 28.85 48.39 9.45 13.00 3.86 4.11 4.89 5.50 3.07 3.001994 1.98 6.50 7.77 9.50 42.98 26.95 10.00 13.00 7.18 7.00 5.92 6.25 4.37 4.751995 4.63 6.50 8.27 9.50 27.65 34.95 8.41 13.00 5.54 5.79 6.22 6.50 5.66 5.251996 4.36 6.50 5.61 12.50 37.95 27.00 10.44 13.00 2.80 3.25 6.08 6.00 5.15 5.001997 4.49 6.50 4.91 9.00 21.14 29.00 9.83 13.00 4.46 4.50 7.04 7.25 5.20 5.001998 3.48 6.50 5.70 9.00 23.52 22.00 11.88 13.00 4.70 5.25 5.72 6.25 4.91 4.501999 1.49 5.75 6.05 10.00 22.03 18.35 10.09 13.00 4.93 5.00 5.49 5.50 5.36 5.002000 0.88 5.75 3.85 10.00 20.16 16.45 10.78 13.00 5.56 6.00 5.63 6.00 5.94 6.002001 3.01 5.75 1.97 7.50 17.03 14.25 6.49 13.00 2.00 2.50 3.83 4.00 1.72 1.332002 2.26 5.75 1.51 7.50 17.01 12.95 4.52 7.25 2.67 3.00 3.84 4.00 1.21 0.752003 1.57 5.75 n.a. n.a. 19.86 15.00 4.76 7.00 2.59 3.00 3.81 3.75 0.91 2.002002QTR. I 2.67 5.75 1.16 7.50 14.30 13.25 5.60 13.00 2.34 2.25 3.97 4.00 1.83 1.25QTR. II 3.12 5.75 2.81 7.50 13.81 13.25 5.05 7.75 2.74 2.75 3.98 4.00 1.73 1.25QTR. III 1.94 5.75 2.51 7.50 16.69 12.95 4.13 7.25 2.83 3.00 3.79 4.00 1.66 1.25QTR. IV 2.26 5.75 1.51 7.50 17.01 12.95 4.52 7.25 2.67 3.00 3.84 4.00 1.21 0.752003Jan. 2.00 5.75 1.09 7.50 16.90 12.95 4.60 7.25 2.81 3.00 3.80 4.00 1.19 0.75Feb. 1.86 5.75 0.92 7.50 -- 12.95 4.68 7.25 2.86 3.00 3.50 3.75 1.19 2.25Mar. 1.82 5.75 2.50 7.50 28.68 12.95 4.81 7.25 3.14 3.25 3.47 3.75 1.15 2.25Apr. 1.87 5.75 2.30 7.50 26.31 15.00 4.91 7.25 3.24 3.50 3.45 3.75 1.15 2.25May 1.97 5.75 2.18 7.50 -- 15.00 5.03 7.25 3.20 3.50 3.44 3.75 1.09 2.25Jun. 2.21 5.75 1.91 7.50 24.94 15.00 4.94 7.25 3.13 3.50 3.47 3.75 0.94 2.20Jul. 1.82 5.75 1.52 7.50 23.25 15.00 4.74 7.25 2.81 3.25 3.31 3.50 0.92 2.00Aug. 1.79 5.75 1.25 7.50 22.81 15.00 4.75 7.25 2.70 3.25 3.40 3.50 0.97 2.00Sep. 1.62 5.75 0.94 7.50 20.97 15.00 4.80 7.25 2.60 3.00 3.52 3.50 0.96 2.00Oct. 1.50 5.75 0.90 7.50 20.69 15.00 4.78 7.00 2.65 3.00 3.65 3.50 0.94 2.00Nov. 1.28 5.75 0.78 7.50 21.00 15.00 4.85 7.00 2.71 3.00 3.81 3.75 0.95 2.00Dec. 1.57 5.75 n.a. n.a. 19.86 15.00 4.76 7.00 2.59 3.00 3.83 3.75 0.91 2.002004Jan. 0.98 5.75 n.a. n.a. 15.80 15.00 4.82 7.00 2.26 2.75 3.92 3.75 0.90 2.00Feb. 0.94 5.75 n.a. n.a. 15.09 14.85 4.77 7.00 2.13 2.75 4.01 4.00 0.94 2.00Mar. 0.90 5.75 n.a. n.a. n.a. n.a. 4.76 7.00 1.99 2.50 4.13 4.00 0.95 2.00Apr. 0.86 5.75 n.a. n.a. n.a. n.a. n.a. n.a. 1.94 2.25 4.20 4.00 0.96 2.00May 0.71 5.75 n.a. n.a. n.a. n.a. n.a. n.a. 2.02 2.25 4.40 4.25 1.04 2.00Jun. 0.57 5.75 n.a. n.a. n.a. n.a. n.a. n.a. 2.04 2.25 4.61 4.50 1.29 2.01
SOURCE: IMF-International Financial Statistics, The Wall Street Journal ,The Financial Times and The Federal Reserve * 3-mth constant maturity T-Bill rate ** 1989-1996, Certificate of Deposit rate reported, thereafter the rate reflects the 30 day reverse repurchase rate, comparable to Bank Rate for regional central banks.
65
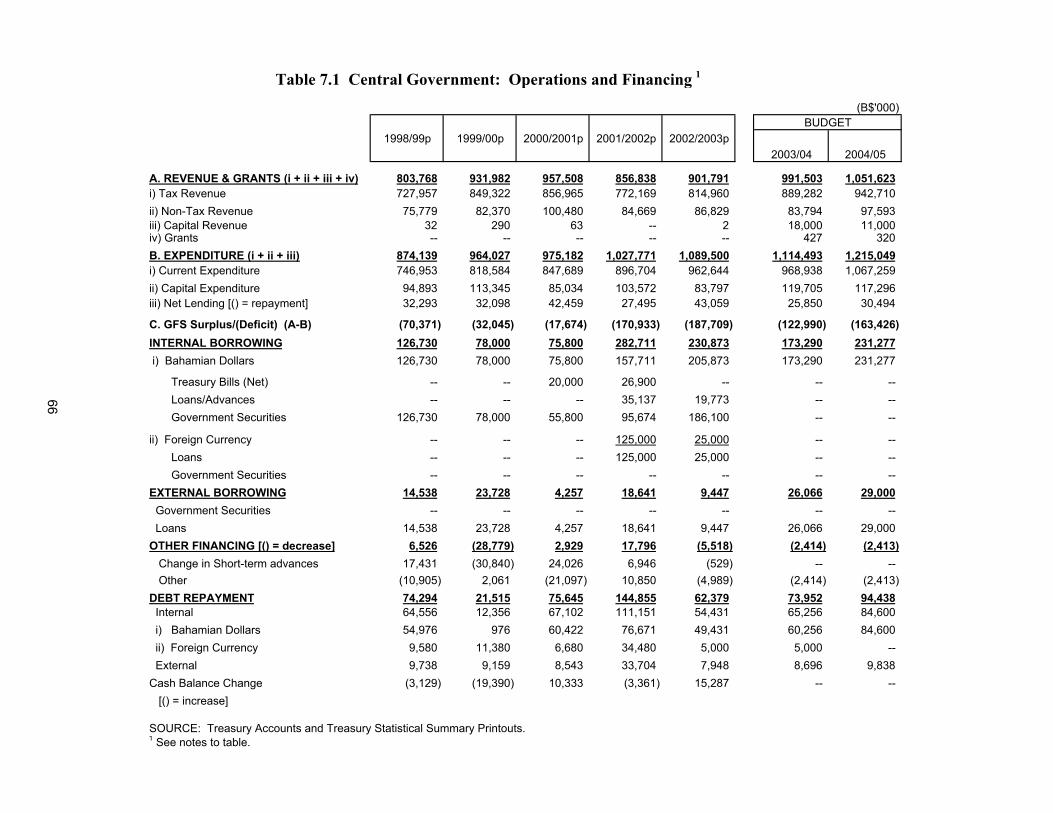
Table 7.1 Central Government: Operations and Financing 1
(B$'000)
1998/99p 1999/00p 2000/2001p 2001/2002p 2002/2003p2003/04 2004/05
A. REVENUE & GRANTS (i + ii + iii + iv) 803,768 931,982 957,508 856,838 901,791 991,503 1,051,623i) Tax Revenue 727,957 849,322 856,965 772,169 814,960 889,282 942,710ii) Non-Tax Revenue 75,779 82,370 100,480 84,669 86,829 83,794 97,593iii) Capital Revenue 32 290 63 -- 2 18,000 11,000iv) Grants -- -- -- -- -- 427 320B. EXPENDITURE (i + ii + iii) 874,139 964,027 975,182 1,027,771 1,089,500 1,114,493 1,215,049i) Current Expenditure 746,953 818,584 847,689 896,704 962,644 968,938 1,067,259ii) Capital Expenditure 94,893 113,345 85,034 103,572 83,797 119,705 117,296iii) Net Lending [() = repayment] 32,293 32,098 42,459 27,495 43,059 25,850 30,494
C. GFS Surplus/(Deficit) (A-B) (70,371) (32,045) (17,674) (170,933) (187,709) (122,990) (163,426)INTERNAL BORROWING 126,730 78,000 75,800 282,711 230,873 173,290 231,277 i) Bahamian Dollars 126,730 78,000 75,800 157,711 205,873 173,290 231,277
Treasury Bills (Net) -- -- 20,000 26,900 -- -- -- Loans/Advances -- -- -- 35,137 19,773 -- -- Government Securities 126,730 78,000 55,800 95,674 186,100 -- --
ii) Foreign Currency -- -- -- 125,000 25,000 -- -- Loans -- -- -- 125,000 25,000 -- -- Government Securities -- -- -- -- -- -- -- EXTERNAL BORROWING 14,538 23,728 4,257 18,641 9,447 26,066 29,000 Government Securities -- -- -- -- -- -- -- Loans 14,538 23,728 4,257 18,641 9,447 26,066 29,000OTHER FINANCING [() = decrease] 6,526 (28,779) 2,929 17,796 (5,518) (2,414) (2,413) Change in Short-term advances 17,431 (30,840) 24,026 6,946 (529) -- -- Other (10,905) 2,061 (21,097) 10,850 (4,989) (2,414) (2,413)DEBT REPAYMENT 74,294 21,515 75,645 144,855 62,379 73,952 94,438 Internal 64,556 12,356 67,102 111,151 54,431 65,256 84,600 i) Bahamian Dollars 54,976 976 60,422 76,671 49,431 60,256 84,600 ii) Foreign Currency 9,580 11,380 6,680 34,480 5,000 5,000 -- External 9,738 9,159 8,543 33,704 7,948 8,696 9,838Cash Balance Change (3,129) (19,390) 10,333 (3,361) 15,287 -- -- [() = increase]
SOURCE: Treasury Accounts and Treasury Statistical Summary Printouts.1 See notes to table.
BUDGET
66
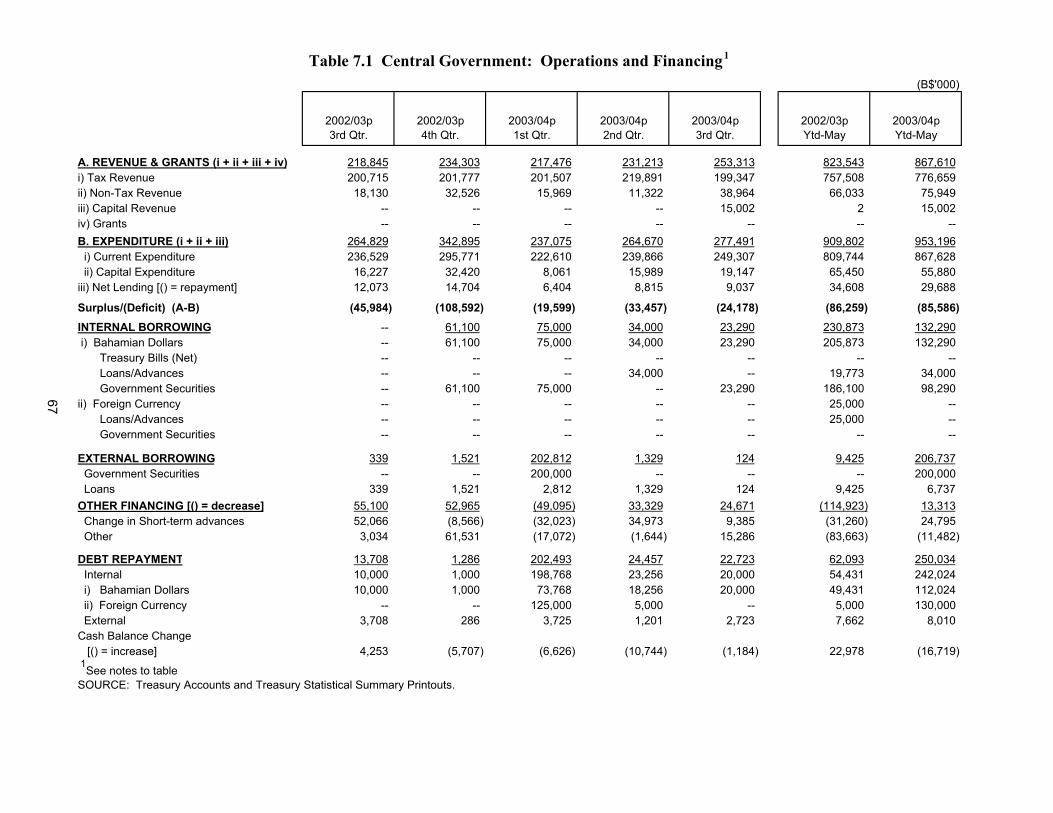
(B$'000)
2002/03p 2002/03p 2003/04p 2003/04p 2003/04p 2002/03p 2003/04p3rd Qtr. 4th Qtr. 1st Qtr. 2nd Qtr. 3rd Qtr. Ytd-May Ytd-May
A. REVENUE & GRANTS (i + ii + iii + iv) 218,845 234,303 217,476 231,213 253,313 823,543 867,610i) Tax Revenue 200,715 201,777 201,507 219,891 199,347 757,508 776,659ii) Non-Tax Revenue 18,130 32,526 15,969 11,322 38,964 66,033 75,949iii) Capital Revenue -- -- -- -- 15,002 2 15,002iv) Grants -- -- -- -- -- -- -- B. EXPENDITURE (i + ii + iii) 264,829 342,895 237,075 264,670 277,491 909,802 953,196 i) Current Expenditure 236,529 295,771 222,610 239,866 249,307 809,744 867,628 ii) Capital Expenditure 16,227 32,420 8,061 15,989 19,147 65,450 55,880iii) Net Lending [() = repayment] 12,073 14,704 6,404 8,815 9,037 34,608 29,688
Surplus/(Deficit) (A-B) (45,984) (108,592) (19,599) (33,457) (24,178) (86,259) (85,586) INTERNAL BORROWING -- 61,100 75,000 34,000 23,290 230,873 132,290 i) Bahamian Dollars -- 61,100 75,000 34,000 23,290 205,873 132,290 Treasury Bills (Net) -- -- -- -- -- -- -- Loans/Advances -- -- -- 34,000 -- 19,773 34,000 Government Securities -- 61,100 75,000 -- 23,290 186,100 98,290ii) Foreign Currency -- -- -- -- -- 25,000 -- Loans/Advances -- -- -- -- -- 25,000 -- Government Securities -- -- -- -- -- -- --
EXTERNAL BORROWING 339 1,521 202,812 1,329 124 9,425 206,737 Government Securities -- -- 200,000 -- -- -- 200,000 Loans 339 1,521 2,812 1,329 124 9,425 6,737OTHER FINANCING [() = decrease] 55,100 52,965 (49,095) 33,329 24,671 (114,923) 13,313 Change in Short-term advances 52,066 (8,566) (32,023) 34,973 9,385 (31,260) 24,795 Other 3,034 61,531 (17,072) (1,644) 15,286 (83,663) (11,482)
DEBT REPAYMENT 13,708 1,286 202,493 24,457 22,723 62,093 250,034 Internal 10,000 1,000 198,768 23,256 20,000 54,431 242,024 i) Bahamian Dollars 10,000 1,000 73,768 18,256 20,000 49,431 112,024 ii) Foreign Currency -- -- 125,000 5,000 -- 5,000 130,000 External 3,708 286 3,725 1,201 2,723 7,662 8,010Cash Balance Change [() = increase] 4,253 (5,707) (6,626) (10,744) (1,184) 22,978 (16,719) 1See notes to tableSOURCE: Treasury Accounts and Treasury Statistical Summary Printouts.
Table 7.1 Central Government: Operations and Financing 1
67
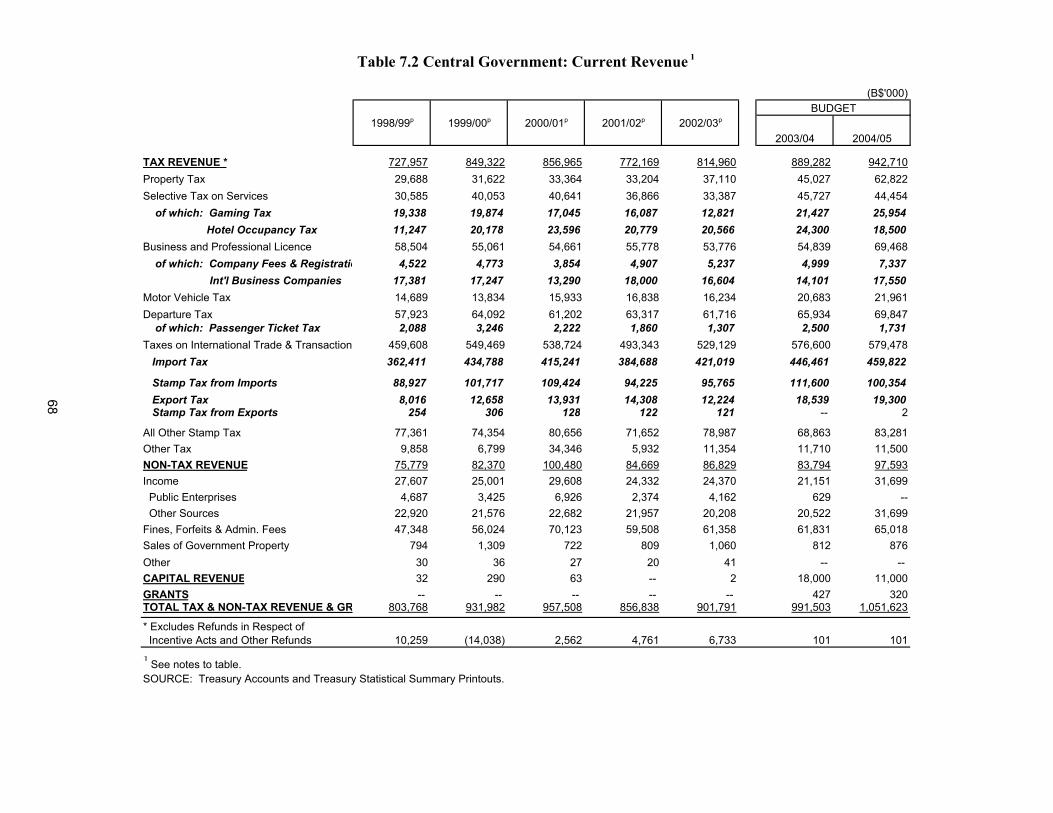
Table 7.2 Central Government: Current Revenue 1
(B$'000)
1998/99p 1999/00p 2000/01p 2001/02p 2002/03p
TAX REVENUE * 727,957 849,322 856,965 772,169 814,960 889,282 942,710Property Tax 29,688 31,622 33,364 33,204 37,110 45,027 62,822Selective Tax on Services 30,585 40,053 40,641 36,866 33,387 45,727 44,454 of which: Gaming Tax 19,338 19,874 17,045 16,087 12,821 21,427 25,954 Hotel Occupancy Tax 11,247 20,178 23,596 20,779 20,566 24,300 18,500Business and Professional Licence 58,504 55,061 54,661 55,778 53,776 54,839 69,468 of which: Company Fees & Registratio 4,522 4,773 3,854 4,907 5,237 4,999 7,337 Int'l Business Companies 17,381 17,247 13,290 18,000 16,604 14,101 17,550Motor Vehicle Tax 14,689 13,834 15,933 16,838 16,234 20,683 21,961Departure Tax 57,923 64,092 61,202 63,317 61,716 65,934 69,847 of which: Passenger Ticket Tax 2,088 3,246 2,222 1,860 1,307 2,500 1,731Taxes on International Trade & Transactions 459,608 549,469 538,724 493,343 529,129 576,600 579,478 Import Tax 362,411 434,788 415,241 384,688 421,019 446,461 459,822
Stamp Tax from Imports 88,927 101,717 109,424 94,225 95,765 111,600 100,354 Export Tax 8,016 12,658 13,931 14,308 12,224 18,539 19,300 Stamp Tax from Exports 254 306 128 122 121 -- 2
All Other Stamp Tax 77,361 74,354 80,656 71,652 78,987 68,863 83,281Other Tax 9,858 6,799 34,346 5,932 11,354 11,710 11,500NON-TAX REVENUE 75,779 82,370 100,480 84,669 86,829 83,794 97,593Income 27,607 25,001 29,608 24,332 24,370 21,151 31,699 Public Enterprises 4,687 3,425 6,926 2,374 4,162 629 -- Other Sources 22,920 21,576 22,682 21,957 20,208 20,522 31,699Fines, Forfeits & Admin. Fees 47,348 56,024 70,123 59,508 61,358 61,831 65,018Sales of Government Property 794 1,309 722 809 1,060 812 876Other 30 36 27 20 41 -- -- CAPITAL REVENUE 32 290 63 -- 2 18,000 11,000GRANTS -- -- -- -- -- 427 320TOTAL TAX & NON-TAX REVENUE & GR 803,768 931,982 957,508 856,838 901,791 991,503 1,051,623
* Excludes Refunds in Respect of Incentive Acts and Other Refunds 10,259 (14,038) 2,562 4,761 6,733 101 1011 See notes to table.SOURCE: Treasury Accounts and Treasury Statistical Summary Printouts.
2003/04 2004/05
BUDGET
68
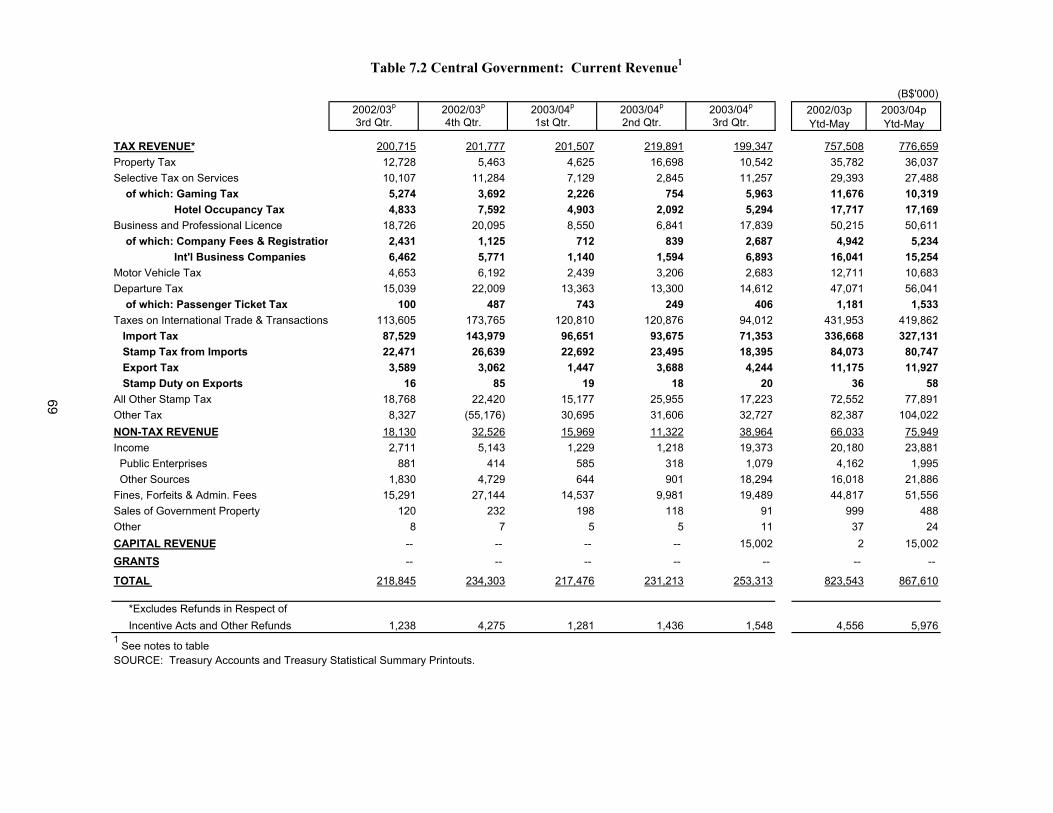
Mar-03 Jun-03 Sep-03 (B$'000)2002/03p 2002/03p 2003/04p 2003/04p 2003/04p 2002/03p 2003/04p3rd Qtr. 4th Qtr. 1st Qtr. 2nd Qtr. 3rd Qtr. Ytd-May Ytd-May
TAX REVENUE* 200,715 201,777 201,507 219,891 199,347 757,508 776,659Property Tax 12,728 5,463 4,625 16,698 10,542 35,782 36,037Selective Tax on Services 10,107 11,284 7,129 2,845 11,257 29,393 27,488 of which: Gaming Tax 5,274 3,692 2,226 754 5,963 11,676 10,319 Hotel Occupancy Tax 4,833 7,592 4,903 2,092 5,294 17,717 17,169Business and Professional Licence 18,726 20,095 8,550 6,841 17,839 50,215 50,611 of which: Company Fees & Registration 2,431 1,125 712 839 2,687 4,942 5,234 Int'l Business Companies 6,462 5,771 1,140 1,594 6,893 16,041 15,254Motor Vehicle Tax 4,653 6,192 2,439 3,206 2,683 12,711 10,683Departure Tax 15,039 22,009 13,363 13,300 14,612 47,071 56,041 of which: Passenger Ticket Tax 100 487 743 249 406 1,181 1,533Taxes on International Trade & Transactions 113,605 173,765 120,810 120,876 94,012 431,953 419,862 Import Tax 87,529 143,979 96,651 93,675 71,353 336,668 327,131 Stamp Tax from Imports 22,471 26,639 22,692 23,495 18,395 84,073 80,747 Export Tax 3,589 3,062 1,447 3,688 4,244 11,175 11,927 Stamp Duty on Exports 16 85 19 18 20 36 58All Other Stamp Tax 18,768 22,420 15,177 25,955 17,223 72,552 77,891Other Tax 8,327 (55,176) 30,695 31,606 32,727 82,387 104,022NON-TAX REVENUE 18,130 32,526 15,969 11,322 38,964 66,033 75,949Income 2,711 5,143 1,229 1,218 19,373 20,180 23,881 Public Enterprises 881 414 585 318 1,079 4,162 1,995 Other Sources 1,830 4,729 644 901 18,294 Aut 16,018 21,886Fines, Forfeits & Admin. Fees 15,291 27,144 14,537 9,981 19,489 Imm 44,817 51,556Sales of Government Property 120 232 198 118 91 999 488Other 8 7 5 5 11 37 24CAPITAL REVENUE -- -- -- -- 15,002 Sa 2 15,002GRANTS -- -- -- -- -- BO -- --
TOTAL 218,845 234,303 217,476 231,213 253,313 823,543 867,610
*Excludes Refunds in Respect of Incentive Acts and Other Refunds 1,238 4,275 1,281 1,436 1,548 4,556 5,9761 See notes to tableSOURCE: Treasury Accounts and Treasury Statistical Summary Printouts.
Table 7.2 Central Government: Current Revenue1
69
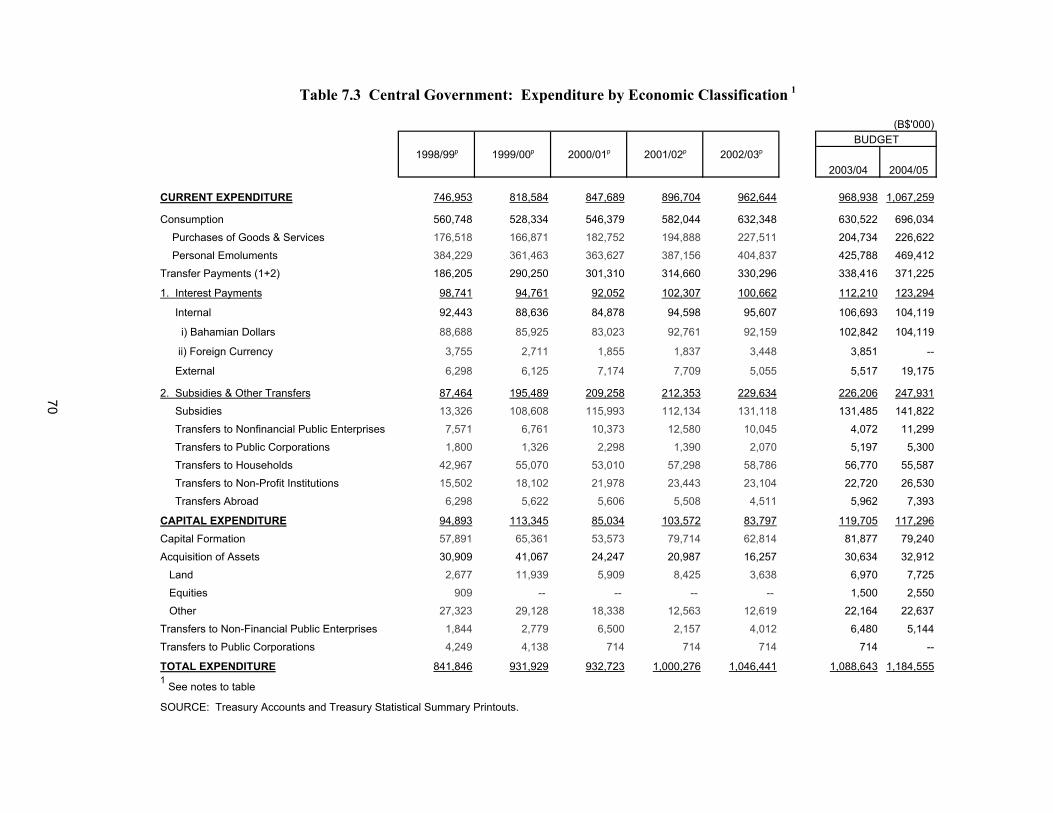
Table 7.3 Central Government: Expenditure by Economic Classification 1
(B$'000)
1998/99p 1999/00p 2000/01p 2001/02p 2002/03p
2003/04 2004/05
CURRENT EXPENDITURE 746,953 818,584 847,689 896,704 962,644 968,938 1,067,259
Consumption 560,748 528,334 546,379 582,044 632,348 630,522 696,034
Purchases of Goods & Services 176,518 166,871 182,752 194,888 227,511 204,734 226,622
Personal Emoluments 384,229 361,463 363,627 387,156 404,837 425,788 469,412
Transfer Payments (1+2) 186,205 290,250 301,310 314,660 330,296 338,416 371,225
1. Interest Payments 98,741 94,761 92,052 102,307 100,662 112,210 123,294
Internal 92,443 88,636 84,878 94,598 95,607 106,693 104,119
i) Bahamian Dollars 88,688 85,925 83,023 92,761 92,159 102,842 104,119
ii) Foreign Currency 3,755 2,711 1,855 1,837 3,448 3,851 --
External 6,298 6,125 7,174 7,709 5,055 5,517 19,175
2. Subsidies & Other Transfers 87,464 195,489 209,258 212,353 229,634 226,206 247,931
Subsidies 13,326 108,608 115,993 112,134 131,118 131,485 141,822
Transfers to Nonfinancial Public Enterprises 7,571 6,761 10,373 12,580 10,045 4,072 11,299
Transfers to Public Corporations 1,800 1,326 2,298 1,390 2,070 5,197 5,300
Transfers to Households 42,967 55,070 53,010 57,298 58,786 56,770 55,587
Transfers to Non-Profit Institutions 15,502 18,102 21,978 23,443 23,104 22,720 26,530
Transfers Abroad 6,298 5,622 5,606 5,508 4,511 5,962 7,393
CAPITAL EXPENDITURE 94,893 113,345 85,034 103,572 83,797 119,705 117,296
Capital Formation 57,891 65,361 53,573 79,714 62,814 81,877 79,240
Acquisition of Assets 30,909 41,067 24,247 20,987 16,257 30,634 32,912
Land 2,677 11,939 5,909 8,425 3,638 6,970 7,725
Equities 909 -- -- -- -- 1,500 2,550
Other 27,323 29,128 18,338 12,563 12,619 22,164 22,637
Transfers to Non-Financial Public Enterprises 1,844 2,779 6,500 2,157 4,012 6,480 5,144
Transfers to Public Corporations 4,249 4,138 714 714 714 714 --
TOTAL EXPENDITURE 841,846 931,929 932,723 1,000,276 1,046,441 1,088,643 1,184,5551 See notes to table
SOURCE: Treasury Accounts and Treasury Statistical Summary Printouts.
BUDGET
70
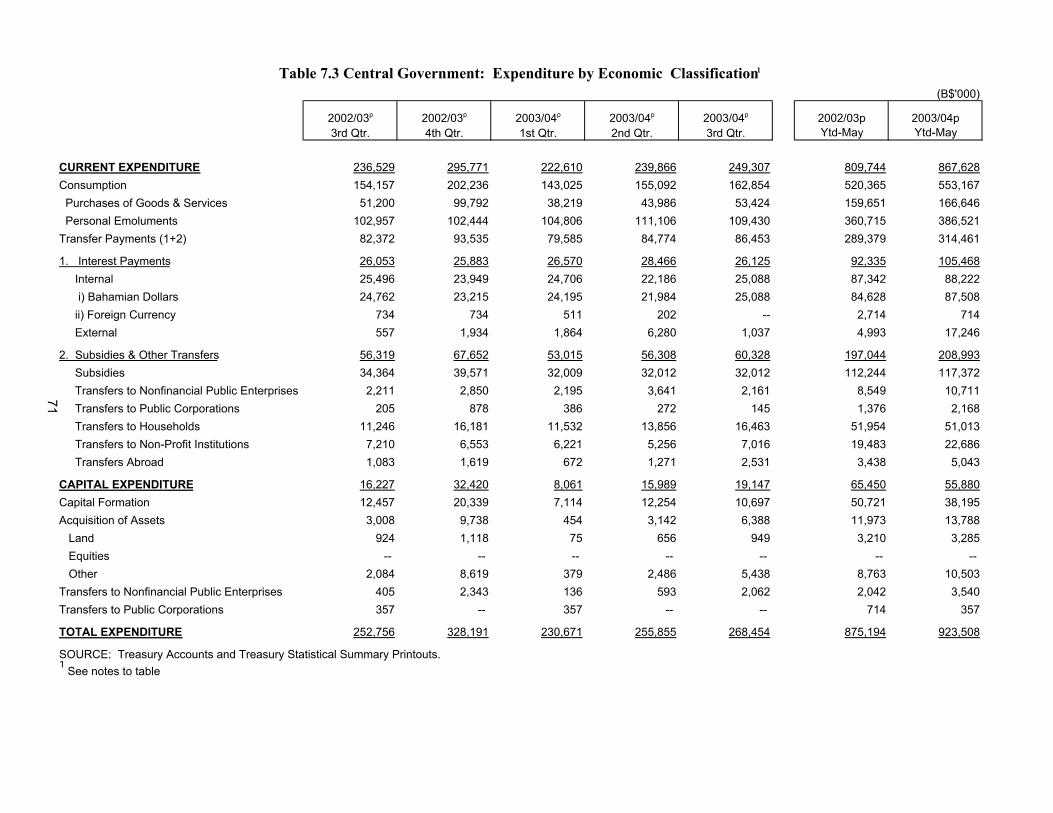
(B$'000)
2002/03p 2002/03p 2003/04p 2003/04p 2003/04p 2002/03p 2003/04p3rd Qtr. 4th Qtr. 1st Qtr. 2nd Qtr. 3rd Qtr. Ytd-May Ytd-May
CURRENT EXPENDITURE 236,529 295,771 222,610 239,866 249,307 809,744 867,628Consumption 154,157 202,236 143,025 155,092 162,854 520,365 553,167 Purchases of Goods & Services 51,200 99,792 38,219 43,986 53,424 159,651 166,646 Personal Emoluments 102,957 102,444 104,806 111,106 109,430 360,715 386,521Transfer Payments (1+2) 82,372 93,535 79,585 84,774 86,453 289,379 314,461
1. Interest Payments 26,053 25,883 26,570 28,466 26,125 92,335 105,468 Internal 25,496 23,949 24,706 22,186 25,088 87,342 88,222 i) Bahamian Dollars 24,762 23,215 24,195 21,984 25,088 84,628 87,508 ii) Foreign Currency 734 734 511 202 -- 2,714 714 External 557 1,934 1,864 6,280 1,037 4,993 17,246
2. Subsidies & Other Transfers 56,319 67,652 53,015 56,308 60,328 197,044 208,993 Subsidies 34,364 39,571 32,009 32,012 32,012 112,244 117,372 Transfers to Nonfinancial Public Enterprises 2,211 2,850 2,195 3,641 2,161 8,549 10,711 Transfers to Public Corporations 205 878 386 272 145 1,376 2,168 Transfers to Households 11,246 16,181 11,532 13,856 16,463 51,954 51,013 Transfers to Non-Profit Institutions 7,210 6,553 6,221 5,256 7,016 19,483 22,686 Transfers Abroad 1,083 1,619 672 1,271 2,531 3,438 5,043
CAPITAL EXPENDITURE 16,227 32,420 8,061 15,989 19,147 65,450 55,880Capital Formation 12,457 20,339 7,114 12,254 10,697 50,721 38,195Acquisition of Assets 3,008 9,738 454 3,142 6,388 11,973 13,788 Land 924 1,118 75 656 949 3,210 3,285 Equities -- -- -- -- -- -- -- Other 2,084 8,619 379 2,486 5,438 8,763 10,503Transfers to Nonfinancial Public Enterprises 405 2,343 136 593 2,062 2,042 3,540Transfers to Public Corporations 357 -- 357 -- -- 714 357
TOTAL EXPENDITURE 252,756 328,191 230,671 255,855 268,454 875,194 923,508
SOURCE: Treasury Accounts and Treasury Statistical Summary Printouts.1
See notes to table
Table 7.3 Central Government: Expenditure by Economic Classification1
71
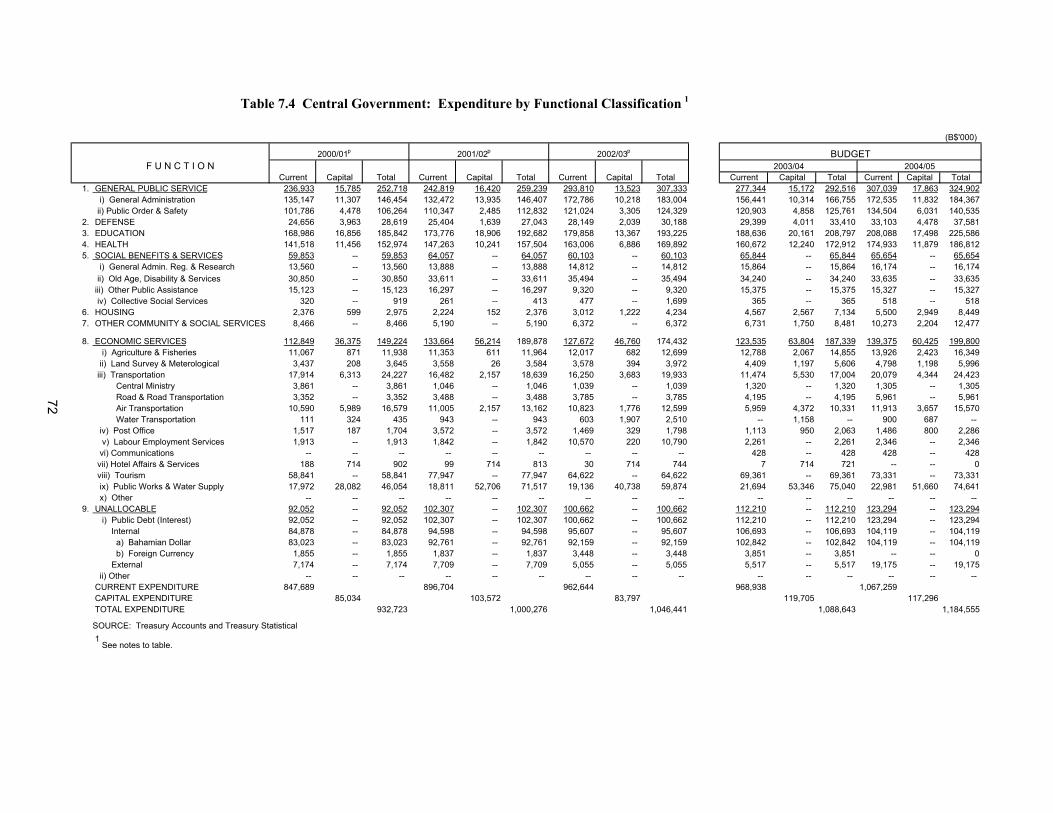
(B$'000)
2000/01p 2001/02p 2002/03p
F U N C T I O N 2003/04 2004/05 Current Capital Total Current Capital Total Current Capital Total Current Capital Total Current Capital Total
1. GENERAL PUBLIC SERVICE 236,933 15,785 252,718 242,819 16,420 259,239 293,810 13,523 307,333 277,344 15,172 292,516 307,039 17,863 324,902 i) General Administration 135,147 11,307 146,454 132,472 13,935 146,407 172,786 10,218 183,004 156,441 10,314 166,755 172,535 11,832 184,367 ii) Public Order & Safety 101,786 4,478 106,264 110,347 2,485 112,832 121,024 3,305 124,329 120,903 4,858 125,761 134,504 6,031 140,535
2. DEFENSE 24,656 3,963 28,619 25,404 1,639 27,043 28,149 2,039 30,188 29,399 4,011 33,410 33,103 4,478 37,5813. EDUCATION 168,986 16,856 185,842 173,776 18,906 192,682 179,858 13,367 193,225 188,636 20,161 208,797 208,088 17,498 225,5864. HEALTH 141,518 11,456 152,974 147,263 10,241 157,504 163,006 6,886 169,892 160,672 12,240 172,912 174,933 11,879 186,8125. SOCIAL BENEFITS & SERVICES 59,853 -- 59,853 64,057 -- 64,057 60,103 -- 60,103 65,844 -- 65,844 65,654 -- 65,654
i) General Admin. Reg. & Research 13,560 -- 13,560 13,888 -- 13,888 14,812 -- 14,812 15,864 -- 15,864 16,174 -- 16,174 ii) Old Age, Disability & Services 30,850 -- 30,850 33,611 -- 33,611 35,494 -- 35,494 34,240 -- 34,240 33,635 -- 33,635 iii) Other Public Assistance 15,123 -- 15,123 16,297 -- 16,297 9,320 -- 9,320 15,375 -- 15,375 15,327 -- 15,327 iv) Collective Social Services 320 -- 919 261 -- 413 477 -- 1,699 365 -- 365 518 -- 518
6. HOUSING 2,376 599 2,975 2,224 152 2,376 3,012 1,222 4,234 4,567 2,567 7,134 5,500 2,949 8,4497. OTHER COMMUNITY & SOCIAL SERVICES 8,466 -- 8,466 5,190 -- 5,190 6,372 -- 6,372 6,731 1,750 8,481 10,273 2,204 12,477
8. ECONOMIC SERVICES 112,849 36,375 149,224 133,664 56,214 189,878 127,672 46,760 174,432 123,535 63,804 187,339 139,375 60,425 199,800 i) Agriculture & Fisheries 11,067 871 11,938 11,353 611 11,964 12,017 682 12,699 12,788 2,067 14,855 13,926 2,423 16,349 ii) Land Survey & Meterological 3,437 208 3,645 3,558 26 3,584 3,578 394 3,972 4,409 1,197 5,606 4,798 1,198 5,996 iii) Transportation 17,914 6,313 24,227 16,482 2,157 18,639 16,250 3,683 19,933 11,474 5,530 17,004 20,079 4,344 24,423 Central Ministry 3,861 -- 3,861 1,046 -- 1,046 1,039 -- 1,039 1,320 -- 1,320 1,305 -- 1,305 Road & Road Transportation 3,352 -- 3,352 3,488 -- 3,488 3,785 -- 3,785 4,195 -- 4,195 5,961 -- 5,961 Air Transportation 10,590 5,989 16,579 11,005 2,157 13,162 10,823 1,776 12,599 5,959 4,372 10,331 11,913 3,657 15,570 Water Transportation 111 324 435 943 -- 943 603 1,907 2,510 -- 1,158 -- 900 687 -- iv) Post Office 1,517 187 1,704 3,572 -- 3,572 1,469 329 1,798 1,113 950 2,063 1,486 800 2,286 v) Labour Employment Services 1,913 -- 1,913 1,842 -- 1,842 10,570 220 10,790 2,261 -- 2,261 2,346 -- 2,346 vi) Communications -- -- -- -- -- -- -- -- -- 428 -- 428 428 -- 428 vii) Hotel Affairs & Services 188 714 902 99 714 813 30 714 744 7 714 721 -- -- 0 viii) Tourism 58,841 -- 58,841 77,947 -- 77,947 64,622 -- 64,622 69,361 -- 69,361 73,331 -- 73,331 ix) Public Works & Water Supply 17,972 28,082 46,054 18,811 52,706 71,517 19,136 40,738 59,874 21,694 53,346 75,040 22,981 51,660 74,641 x) Other -- -- -- -- -- -- -- -- -- -- -- -- -- -- --
9. UNALLOCABLE 92,052 -- 92,052 102,307 -- 102,307 100,662 -- 100,662 112,210 -- 112,210 123,294 -- 123,294 i) Public Debt (Interest) 92,052 -- 92,052 102,307 -- 102,307 100,662 -- 100,662 112,210 -- 112,210 123,294 -- 123,294 Internal 84,878 -- 84,878 94,598 -- 94,598 95,607 -- 95,607 106,693 -- 106,693 104,119 -- 104,119 a) Bahamian Dollar 83,023 -- 83,023 92,761 -- 92,761 92,159 -- 92,159 102,842 -- 102,842 104,119 -- 104,119 b) Foreign Currency 1,855 -- 1,855 1,837 -- 1,837 3,448 -- 3,448 3,851 -- 3,851 -- -- 0 External 7,174 -- 7,174 7,709 -- 7,709 5,055 -- 5,055 5,517 -- 5,517 19,175 -- 19,175 ii) Other -- -- -- -- -- -- -- -- -- -- -- -- -- -- -- CURRENT EXPENDITURE 847,689 896,704 962,644 968,938 1,067,259 CAPITAL EXPENDITURE 85,034 103,572 83,797 119,705 117,296 TOTAL EXPENDITURE 932,723 1,000,276 1,046,441 1,088,643 1,184,555
SOURCE: Treasury Accounts and Treasury Statistical ######## ######## 1
See notes to table.
Table 7.4 Central Government: Expenditure by Functional Classification 1
BUDGET
72
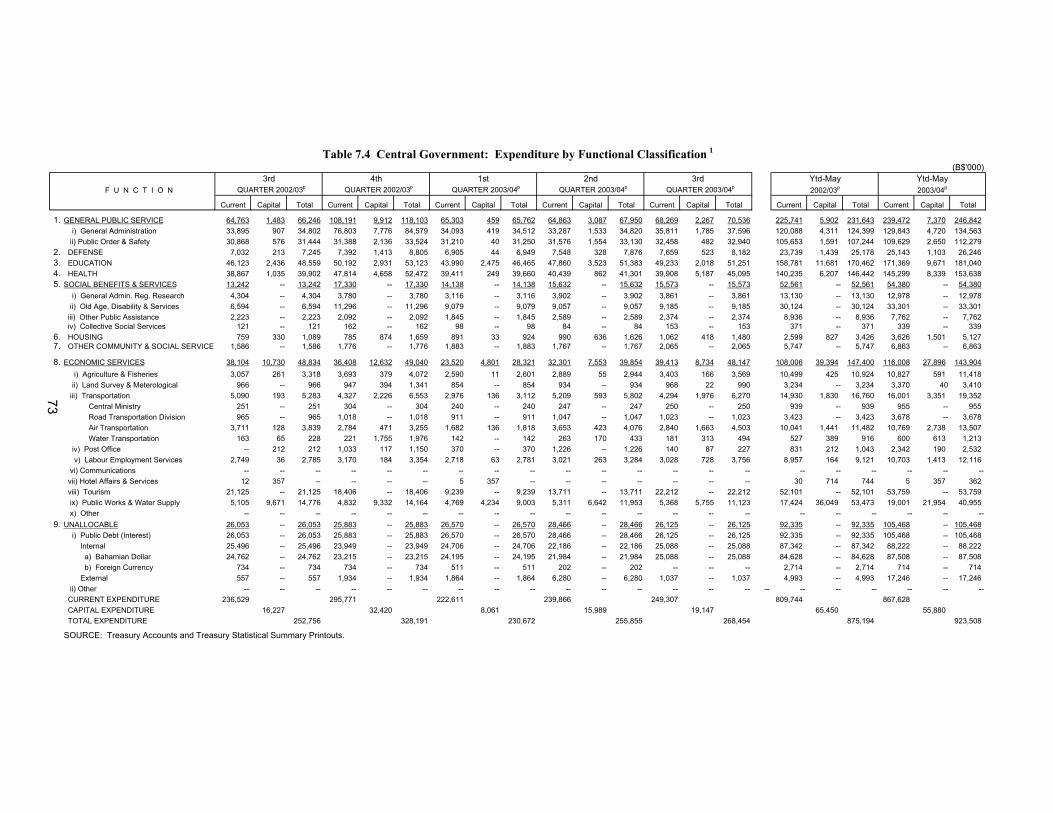
(B$'000)3rd 4th 1st 2nd 3rd
F U N C T I O N QUARTER 2002/03p QUARTER 2002/03p QUARTER 2003/04p QUARTER 2003/04p QUARTER 2003/04p
Current Capital Total Current Capital Total Current Capital Total Current Capital Total Current Capital Total Current Capital Total Current Capital Total
1. GENERAL PUBLIC SERVICE 64,763 1,483 66,246 108,191 9,912 118,103 65,303 459 65,762 64,863 3,087 67,950 68,269 2,267 70,536 225,741 5,902 231,643 239,472 7,370 246,842 i) General Administration 33,895 907 34,802 76,803 7,776 84,579 34,093 419 34,512 33,287 1,533 34,820 35,811 1,785 37,596 120,088 4,311 124,399 129,843 4,720 134,563 ii) Public Order & Safety 30,868 576 31,444 31,388 2,136 33,524 31,210 40 31,250 31,576 1,554 33,130 32,458 482 32,940 105,653 1,591 107,244 109,629 2,650 112,279
2. DEFENSE 7,032 213 7,245 7,392 1,413 8,805 6,905 44 6,949 7,548 328 7,876 7,659 523 8,182 23,739 1,439 25,178 25,143 1,103 26,2463. EDUCATION 46,123 2,436 48,559 50,192 2,931 53,123 43,990 2,475 46,465 47,860 3,523 51,383 49,233 2,018 51,251 158,781 11,681 170,462 171,369 9,671 181,0404. HEALTH 38,867 1,035 39,902 47,814 4,658 52,472 39,411 249 39,660 40,439 862 41,301 39,908 5,187 45,095 140,235 6,207 146,442 145,299 8,339 153,6385. SOCIAL BENEFITS & SERVICES 13,242 -- 13,242 17,330 -- 17,330 14,138 -- 14,138 15,632 -- 15,632 15,573 -- 15,573 52,561 -- 52,561 54,380 -- 54,380
i) General Admin. Reg. Research 4,304 -- 4,304 3,780 -- 3,780 3,116 -- 3,116 3,902 -- 3,902 3,861 -- 3,861 13,130 -- 13,130 12,978 -- 12,978 ii) Old Age, Disability & Services 6,594 -- 6,594 11,296 -- 11,296 9,079 -- 9,079 9,057 -- 9,057 9,185 -- 9,185 30,124 -- 30,124 33,301 -- 33,301 iii) Other Public Assistance 2,223 -- 2,223 2,092 -- 2,092 1,845 -- 1,845 2,589 -- 2,589 2,374 -- 2,374 8,936 -- 8,936 7,762 -- 7,762 iv) Collective Social Services 121 -- 121 162 -- 162 98 -- 98 84 -- 84 153 -- 153 371 -- 371 339 -- 339
6. HOUSING 759 330 1,089 785 874 1,659 891 33 924 990 636 1,626 1,062 418 1,480 2,599 827 3,426 3,626 1,501 5,1277. OTHER COMMUNITY & SOCIAL SERVICES 1,586 -- 1,586 1,776 -- 1,776 1,883 -- 1,883 1,767 -- 1,767 2,065 -- 2,065 5,747 -- 5,747 6,863 -- 6,863
8. ECONOMIC SERVICES 38,104 10,730 48,834 36,408 12,632 49,040 23,520 4,801 28,321 32,301 7,553 39,854 39,413 8,734 48,147 108,006 39,394 147,400 116,008 27,896 143,904 i) Agriculture & Fisheries 3,057 261 3,318 3,693 379 4,072 2,590 11 2,601 2,889 55 2,944 3,403 166 3,569 10,499 425 10,924 10,827 591 11,418 ii) Land Survey & Meterological 966 -- 966 947 394 1,341 854 -- 854 934 -- 934 968 22 990 3,234 -- 3,234 3,370 40 3,410 iii) Transportation 5,090 193 5,283 4,327 2,226 6,553 2,976 136 3,112 5,209 593 5,802 4,294 1,976 6,270 14,930 1,830 16,760 16,001 3,351 19,352 Central Ministry 251 -- 251 304 -- 304 240 -- 240 247 -- 247 250 -- 250 939 -- 939 955 -- 955 Road Transportation Division 965 -- 965 1,018 -- 1,018 911 -- 911 1,047 -- 1,047 1,023 -- 1,023 3,423 -- 3,423 3,678 -- 3,678 Air Transportation 3,711 128 3,839 2,784 471 3,255 1,682 136 1,818 3,653 423 4,076 2,840 1,663 4,503 10,041 1,441 11,482 10,769 2,738 13,507 Water Transportation 163 65 228 221 1,755 1,976 142 -- 142 263 170 433 181 313 494 527 389 916 600 613 1,213 iv) Post Office -- 212 212 1,033 117 1,150 370 -- 370 1,226 -- 1,226 140 87 227 831 212 1,043 2,342 190 2,532 v) Labour Employment Services 2,749 36 2,785 3,170 184 3,354 2,718 63 2,781 3,021 263 3,284 3,028 728 3,756 8,957 164 9,121 10,703 1,413 12,116 vi) Communications -- -- -- -- -- -- -- -- -- -- -- -- -- -- -- -- -- -- -- -- -- vii) Hotel Affairs & Services 12 357 -- -- -- -- 5 357 -- -- -- -- -- -- -- 30 714 744 5 357 362 viii) Tourism 21,125 -- 21,125 18,406 -- 18,406 9,239 -- 9,239 13,711 -- 13,711 22,212 -- 22,212 52,101 -- 52,101 53,759 -- 53,759 ix) Public Works & Water Supply 5,105 9,671 14,776 4,832 9,332 14,164 4,769 4,234 9,003 5,311 6,642 11,953 5,368 5,755 11,123 17,424 36,049 53,473 19,001 21,954 40,955 x) Other -- -- -- -- -- -- -- -- -- -- -- -- -- -- -- -- -- -- -- -- --
9. UNALLOCABLE 26,053 -- 26,053 25,883 -- 25,883 26,570 -- 26,570 28,466 -- 28,466 26,125 -- 26,125 92,335 -- 92,335 105,468 -- 105,468 i) Public Debt (Interest) 26,053 -- 26,053 25,883 -- 25,883 26,570 -- 26,570 28,466 -- 28,466 26,125 -- 26,125 92,335 -- 92,335 105,468 -- 105,468 Internal 25,496 -- 25,496 23,949 -- 23,949 24,706 -- 24,706 22,186 -- 22,186 25,088 -- 25,088 87,342 -- 87,342 88,222 -- 88,222 a) Bahamian Dollar 24,762 -- 24,762 23,215 -- 23,215 24,195 -- 24,195 21,984 -- 21,984 25,088 -- 25,088 84,628 -- 84,628 87,508 -- 87,508 b) Foreign Currency 734 -- 734 734 -- 734 511 -- 511 202 -- 202 -- -- -- 2,714 -- 2,714 714 -- 714 External 557 -- 557 1,934 -- 1,934 1,864 -- 1,864 6,280 -- 6,280 1,037 -- 1,037 4,993 -- 4,993 17,246 -- 17,246 ii) Other -- -- -- -- -- -- -- -- -- -- -- -- -- -- -- -- -- -- -- -- -- -- CURRENT EXPENDITURE 236,529 295,771 222,611 239,866 249,307 809,744 867,628 CAPITAL EXPENDITURE 16,227 32,420 8,061 15,989 19,147 65,450 55,880 TOTAL EXPENDITURE 252,756 328,191 230,672 255,855 268,454 875,194 923,508
SOURCE: Treasury Accounts and Treasury Statistical Summary Printouts.
Table 7.4 Central Government: Expenditure by Functional Classification 1
Ytd-May2003/04p2002/03p
Ytd-May
73
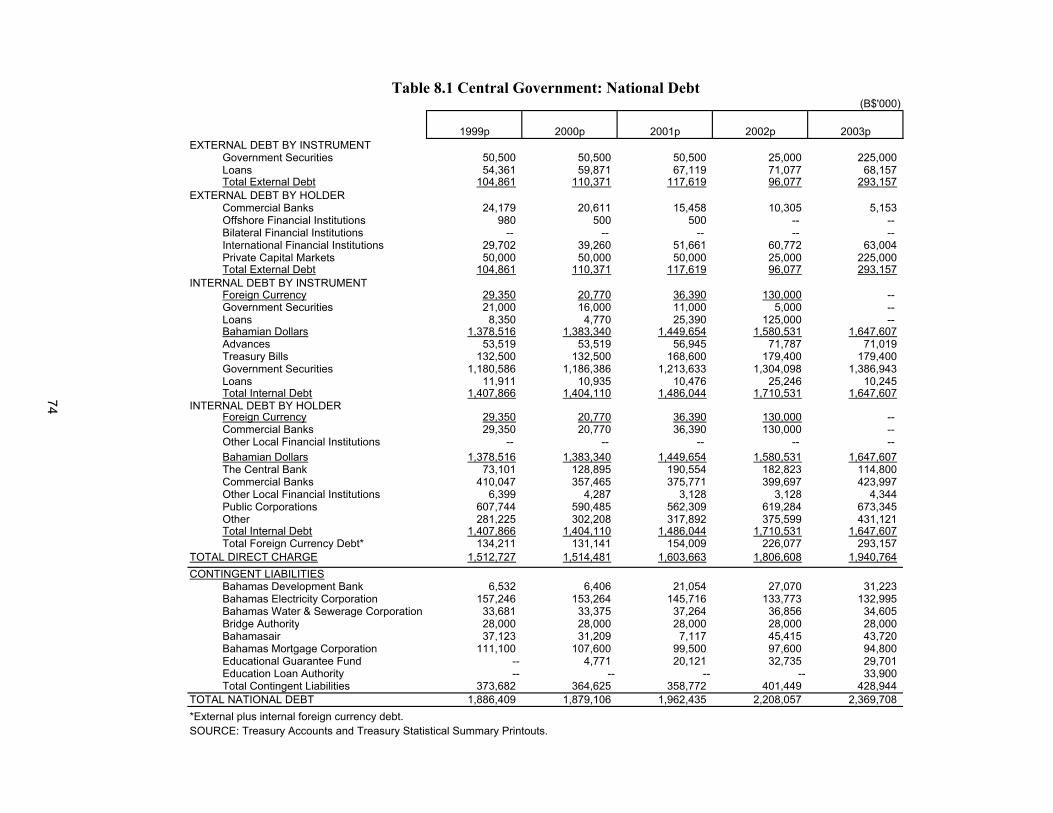
(B$'000)
1999p 2000p 2001p 2002p 2003pEXTERNAL DEBT BY INSTRUMENT
Government Securities 50,500 50,500 50,500 25,000 225,000Loans 54,361 59,871 67,119 71,077 68,157Total External Debt 104,861 110,371 117,619 96,077 293,157
EXTERNAL DEBT BY HOLDERCommercial Banks 24,179 20,611 15,458 10,305 5,153Offshore Financial Institutions 980 500 500 -- -- Bilateral Financial Institutions -- -- -- -- -- International Financial Institutions 29,702 39,260 51,661 60,772 63,004Private Capital Markets 50,000 50,000 50,000 25,000 225,000Total External Debt 104,861 110,371 117,619 96,077 293,157
INTERNAL DEBT BY INSTRUMENTForeign Currency 29,350 20,770 36,390 130,000 -- Government Securities 21,000 16,000 11,000 5,000 -- Loans 8,350 4,770 25,390 125,000 -- Bahamian Dollars 1,378,516 1,383,340 1,449,654 1,580,531 1,647,607Advances 53,519 53,519 56,945 71,787 71,019Treasury Bills 132,500 132,500 168,600 179,400 179,400Government Securities 1,180,586 1,186,386 1,213,633 1,304,098 1,386,943Loans 11,911 10,935 10,476 25,246 10,245Total Internal Debt 1,407,866 1,404,110 1,486,044 1,710,531 1,647,607
INTERNAL DEBT BY HOLDERForeign Currency 29,350 20,770 36,390 130,000 -- Commercial Banks 29,350 20,770 36,390 130,000 -- Other Local Financial Institutions -- -- -- -- -- Bahamian Dollars 1,378,516 1,383,340 1,449,654 1,580,531 1,647,607The Central Bank 73,101 128,895 190,554 182,823 114,800Commercial Banks 410,047 357,465 375,771 399,697 423,997Other Local Financial Institutions 6,399 4,287 3,128 3,128 4,344Public Corporations 607,744 590,485 562,309 619,284 673,345Other 281,225 302,208 317,892 375,599 431,121Total Internal Debt 1,407,866 1,404,110 1,486,044 1,710,531 1,647,607Total Foreign Currency Debt* 134,211 131,141 154,009 226,077 293,157
TOTAL DIRECT CHARGE 1,512,727 1,514,481 1,603,663 1,806,608 1,940,764CONTINGENT LIABILITIES
Bahamas Development Bank 6,532 6,406 21,054 27,070 31,223Bahamas Electricity Corporation 157,246 153,264 145,716 133,773 132,995Bahamas Water & Sewerage Corporation 33,681 33,375 37,264 36,856 34,605Bridge Authority 28,000 28,000 28,000 28,000 28,000Bahamasair 37,123 31,209 7,117 45,415 43,720Bahamas Mortgage Corporation 111,100 107,600 99,500 97,600 94,800Educational Guarantee Fund -- 4,771 20,121 32,735 29,701Education Loan Authority -- -- -- -- 33,900Total Contingent Liabilities 373,682 364,625 358,772 401,449 428,944
TOTAL NATIONAL DEBT 1,886,409 1,879,106 1,962,435 2,208,057 2,369,708*External plus internal foreign currency debt. 373,682SOURCE: Treasury Accounts and Treasury Statistical Summary Printouts. 0 0 0
Table 8.1 Central Government: National Debt
74
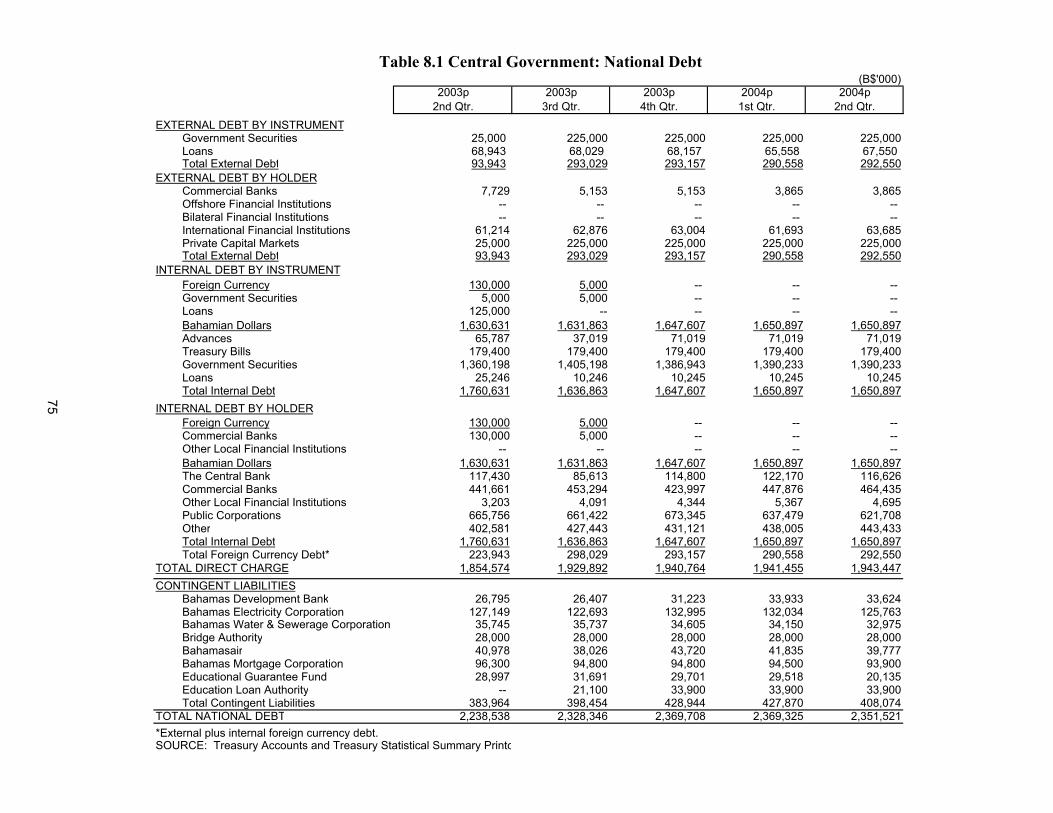
(B$'000)2003p 2003p 2003p 2004p 2004p
2nd Qtr. 3rd Qtr. 4th Qtr. 1st Qtr. 2nd Qtr.EXTERNAL DEBT BY INSTRUMENT
Government Securities 25,000 225,000 225,000 225,000 225,000Loans 68,943 68,029 68,157 65,558 67,550Total External Debt 93,943 293,029 293,157 290,558 292,550
EXTERNAL DEBT BY HOLDERCommercial Banks 7,729 5,153 5,153 3,865 3,865Offshore Financial Institutions -- -- -- -- -- Bilateral Financial Institutions -- -- -- -- -- International Financial Institutions 61,214 62,876 63,004 61,693 63,685Private Capital Markets 25,000 225,000 225,000 225,000 225,000Total External Debt 93,943 293,029 293,157 290,558 292,550
INTERNAL DEBT BY INSTRUMENTForeign Currency 130,000 5,000 -- -- -- Government Securities 5,000 5,000 -- -- -- Loans 125,000 -- -- -- -- Bahamian Dollars 1,630,631 1,631,863 1,647,607 1,650,897 1,650,897Advances 65,787 37,019 71,019 71,019 71,019Treasury Bills 179,400 179,400 179,400 179,400 179,400Government Securities 1,360,198 1,405,198 1,386,943 1,390,233 1,390,233Loans 25,246 10,246 10,245 10,245 10,245Total Internal Debt 1,760,631 1,636,863 1,647,607 1,650,897 1,650,897
INTERNAL DEBT BY HOLDERForeign Currency 130,000 5,000 -- -- -- Commercial Banks 130,000 5,000 -- -- -- Other Local Financial Institutions -- -- -- -- -- Bahamian Dollars 1,630,631 1,631,863 1,647,607 1,650,897 1,650,897The Central Bank 117,430 85,613 114,800 122,170 116,626Commercial Banks 441,661 453,294 423,997 447,876 464,435Other Local Financial Institutions 3,203 4,091 4,344 5,367 4,695Public Corporations 665,756 661,422 673,345 637,479 621,708Other 402,581 427,443 431,121 438,005 443,433Total Internal Debt 1,760,631 1,636,863 1,647,607 1,650,897 1,650,897Total Foreign Currency Debt* 223,943 298,029 293,157 290,558 292,550
TOTAL DIRECT CHARGE 1,854,574 1,929,892 1,940,764 1,941,455 1,943,447CONTINGENT LIABILITIES
Bahamas Development Bank 26,795 26,407 31,223 33,933 33,624Bahamas Electricity Corporation 127,149 122,693 132,995 132,034 125,763Bahamas Water & Sewerage Corporation 35,745 35,737 34,605 34,150 32,975Bridge Authority 28,000 28,000 28,000 28,000 28,000Bahamasair 40,978 38,026 43,720 41,835 39,777Bahamas Mortgage Corporation 96,300 94,800 94,800 94,500 93,900Educational Guarantee Fund 28,997 31,691 29,701 29,518 20,135Education Loan Authority -- 21,100 33,900 33,900 33,900Total Contingent Liabilities 383,964 398,454 428,944 427,870 408,074
TOTAL NATIONAL DEBT 2,238,538 2,328,346 2,369,708 2,369,325 2,351,521*External plus internal foreign currency debt.SOURCE: Treasury Accounts and Treasury Statistical Summary Printo 0.0% 0.0%
Table 8.1 Central Government: National Debt
75
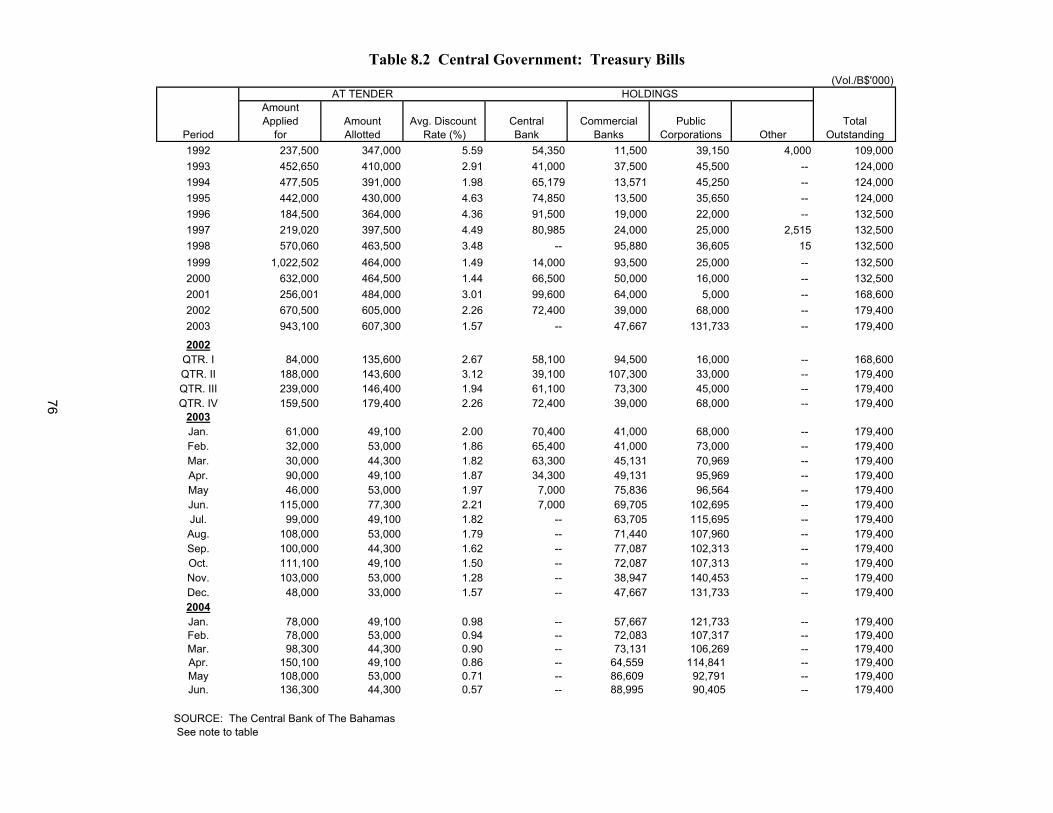
(Vol./B$'000)AT TENDER HOLDINGS
AmountApplied Amount Avg. Discount Central Commercial Public Total
Period for Allotted Rate (%) Bank Banks Corporations Other Outstanding1992 237,500 347,000 5.59 54,350 11,500 39,150 4,000 109,0001993 452,650 410,000 2.91 41,000 37,500 45,500 -- 124,0001994 477,505 391,000 1.98 65,179 13,571 45,250 -- 124,0001995 442,000 430,000 4.63 74,850 13,500 35,650 -- 124,0001996 184,500 364,000 4.36 91,500 19,000 22,000 -- 132,5001997 219,020 397,500 4.49 80,985 24,000 25,000 2,515 132,5001998 570,060 463,500 3.48 -- 95,880 36,605 15 132,5001999 1,022,502 464,000 1.49 14,000 93,500 25,000 -- 132,5002000 632,000 464,500 1.44 66,500 50,000 16,000 -- 132,5002001 256,001 484,000 3.01 99,600 64,000 5,000 -- 168,6002002 670,500 605,000 2.26 72,400 39,000 68,000 -- 179,4002003 943,100 607,300 1.57 -- 47,667 131,733 -- 179,400
2002QTR. I 84,000 135,600 2.67 58,100 94,500 16,000 -- 168,600QTR. II 188,000 143,600 3.12 39,100 107,300 33,000 -- 179,400QTR. III 239,000 146,400 1.94 61,100 73,300 45,000 -- 179,400QTR. IV 159,500 179,400 2.26 72,400 39,000 68,000 -- 179,400
2003Jan. 61,000 49,100 2.00 70,400 41,000 68,000 -- 179,400Feb. 32,000 53,000 1.86 65,400 41,000 73,000 -- 179,400Mar. 30,000 44,300 1.82 63,300 45,131 70,969 -- 179,400Apr. 90,000 49,100 1.87 34,300 49,131 95,969 -- 179,400May 46,000 53,000 1.97 7,000 75,836 96,564 -- 179,400Jun. 115,000 77,300 2.21 7,000 69,705 102,695 -- 179,400Jul. 99,000 49,100 1.82 -- 63,705 115,695 -- 179,400Aug. 108,000 53,000 1.79 -- 71,440 107,960 -- 179,400Sep. 100,000 44,300 1.62 -- 77,087 102,313 -- 179,400Oct. 111,100 49,100 1.50 -- 72,087 107,313 -- 179,400Nov. 103,000 53,000 1.28 -- 38,947 140,453 -- 179,400Dec. 48,000 33,000 1.57 -- 47,667 131,733 -- 179,4002004Jan. 78,000 49,100 0.98 -- 57,667 121,733 -- 179,400Feb. 78,000 53,000 0.94 -- 72,083 107,317 -- 179,400Mar. 98,300 44,300 0.90 -- 73,131 106,269 -- 179,400Apr. 150,100 49,100 0.86 -- 64,559 114,841 -- 179,400May 108,000 53,000 0.71 -- 86,609 92,791 -- 179,400Jun. 136,300 44,300 0.57 -- 88,995 90,405 -- 179,400
SOURCE: The Central Bank of The Bahamas See note to table
Table 8.2 Central Government: Treasury Bills
76
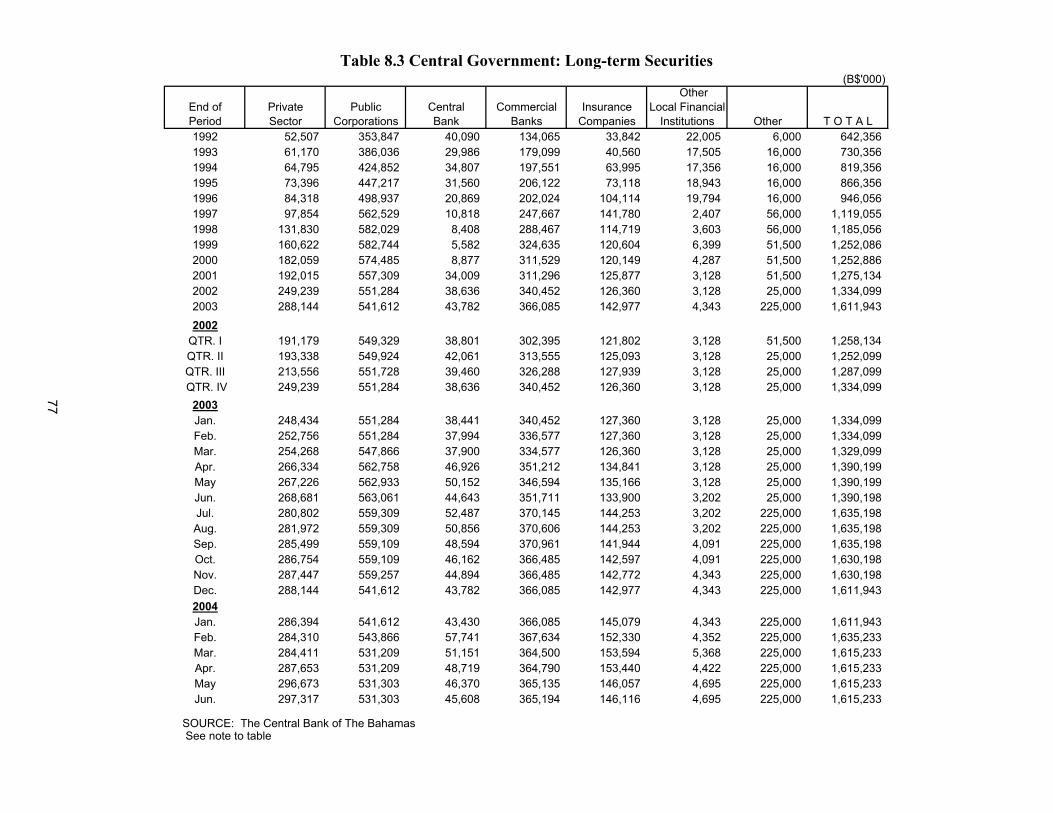
Table 8.3 Central Government: Long-term Securities (B$'000)
OtherEnd of Private Public Central Commercial Insurance Local FinancialPeriod Sector Corporations Bank Banks Companies Institutions Other T O T A L1992 52,507 353,847 40,090 134,065 33,842 22,005 6,000 642,3561993 61,170 386,036 29,986 179,099 40,560 17,505 16,000 730,3561994 64,795 424,852 34,807 197,551 63,995 17,356 16,000 819,3561995 73,396 447,217 31,560 206,122 73,118 18,943 16,000 866,3561996 84,318 498,937 20,869 202,024 104,114 19,794 16,000 946,0561997 97,854 562,529 10,818 247,667 141,780 2,407 56,000 1,119,0551998 131,830 582,029 8,408 288,467 114,719 3,603 56,000 1,185,0561999 160,622 582,744 5,582 324,635 120,604 6,399 51,500 1,252,0862000 182,059 574,485 8,877 311,529 120,149 4,287 51,500 1,252,8862001 192,015 557,309 34,009 311,296 125,877 3,128 51,500 1,275,1342002 249,239 551,284 38,636 340,452 126,360 3,128 25,000 1,334,0992003 288,144 541,612 43,782 366,085 142,977 4,343 225,000 1,611,9432002
QTR. I 191,179 549,329 38,801 302,395 121,802 3,128 51,500 1,258,134QTR. II 193,338 549,924 42,061 313,555 125,093 3,128 25,000 1,252,099QTR. III 213,556 551,728 39,460 326,288 127,939 3,128 25,000 1,287,099 QTR. IV 249,239 551,284 38,636 340,452 126,360 3,128 25,000 1,334,099
2003Jan. 248,434 551,284 38,441 340,452 127,360 3,128 25,000 1,334,099Feb. 252,756 551,284 37,994 336,577 127,360 3,128 25,000 1,334,099Mar. 254,268 547,866 37,900 334,577 126,360 3,128 25,000 1,329,099Apr. 266,334 562,758 46,926 351,212 134,841 3,128 25,000 1,390,199May 267,226 562,933 50,152 346,594 135,166 3,128 25,000 1,390,199Jun. 268,681 563,061 44,643 351,711 133,900 3,202 25,000 1,390,198Jul. 280,802 559,309 52,487 370,145 144,253 3,202 225,000 1,635,198Aug. 281,972 559,309 50,856 370,606 144,253 3,202 225,000 1,635,198Sep. 285,499 559,109 48,594 370,961 141,944 4,091 225,000 1,635,198Oct. 286,754 559,109 46,162 366,485 142,597 4,091 225,000 1,630,198Nov. 287,447 559,257 44,894 366,485 142,772 4,343 225,000 1,630,198Dec. 288,144 541,612 43,782 366,085 142,977 4,343 225,000 1,611,9432004Jan. 286,394 541,612 43,430 366,085 145,079 4,343 225,000 1,611,943Feb. 284,310 543,866 57,741 367,634 152,330 4,352 225,000 1,635,233Mar. 284,411 531,209 51,151 364,500 153,594 5,368 225,000 1,615,233Apr. 287,653 531,209 48,719 364,790 153,440 4,422 225,000 1,615,233May 296,673 531,303 46,370 365,135 146,057 4,695 225,000 1,615,233Jun. 297,317 531,303 45,608 365,194 146,116 4,695 225,000 1,615,233
SOURCE: The Central Bank of The Bahamas See note to table
77
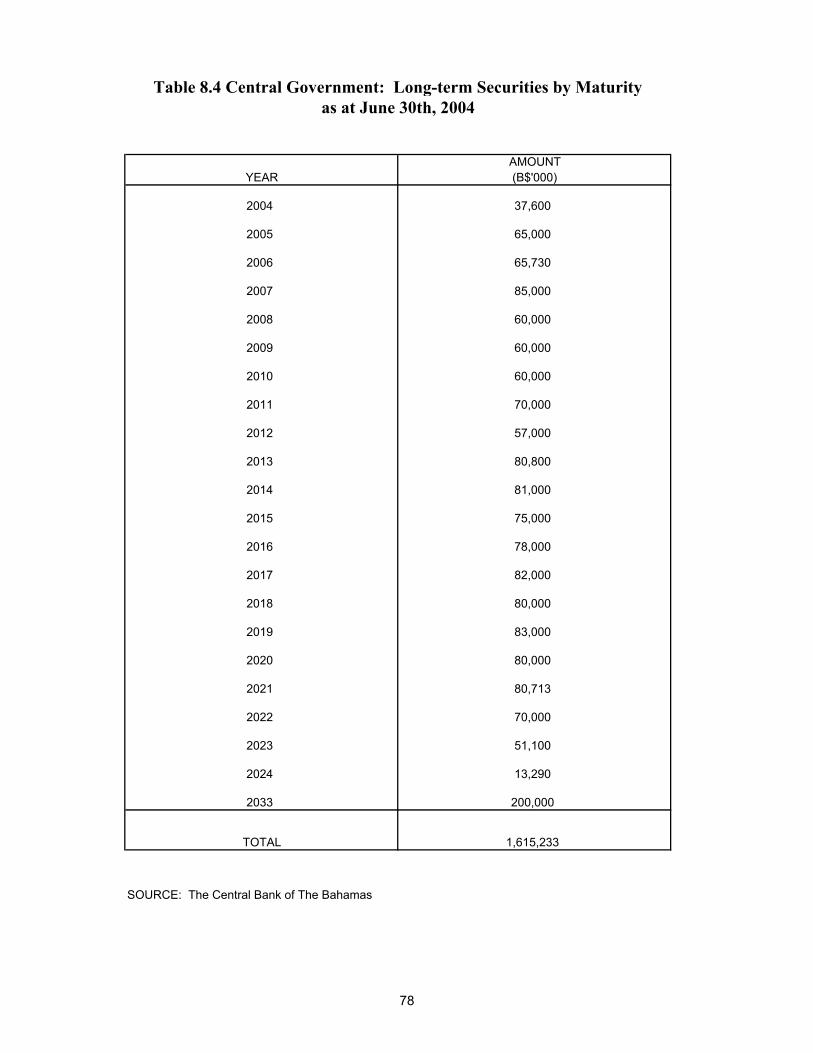
AMOUNTYEAR (B$'000)
2004 37,600
2005 65,000
2006 65,730
2007 85,000
2008 60,000
2009 60,000
2010 60,000
2011 70,000
2012 57,000
2013 80,800
2014 81,000
2015 75,000
2016 78,000
2017 82,000
2018 80,000
2019 83,000
2020 80,000
2021 80,713
2022 70,000
2023 51,100
2024 13,290
2033 200,000
TOTAL 1,615,233
SOURCE: The Central Bank of The Bahamas
as at June 30th, 2004Table 8.4 Central Government: Long-term Securities by Maturity
78
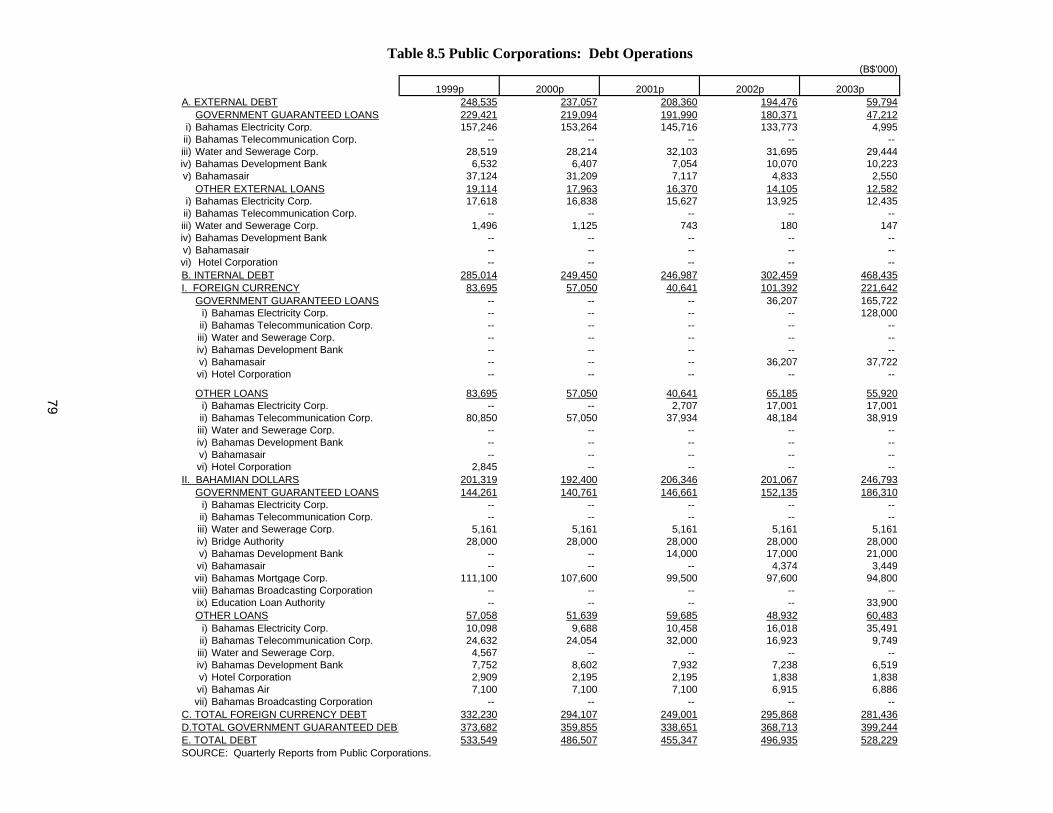
(B$'000)
1999p 2000p 2001p 2002p 2003pA. EXTERNAL DEBT 248,535 237,057 208,360 194,476 59,794
GOVERNMENT GUARANTEED LOANS 229,421 219,094 191,990 180,371 47,212i) Bahamas Electricity Corp. 157,246 153,264 145,716 133,773 4,995ii) Bahamas Telecommunication Corp. -- -- -- -- -- iii) Water and Sewerage Corp. 28,519 28,214 32,103 31,695 29,444iv) Bahamas Development Bank 6,532 6,407 7,054 10,070 10,223v) Bahamasair 37,124 31,209 7,117 4,833 2,550
OTHER EXTERNAL LOANS 19,114 17,963 16,370 14,105 12,582i) Bahamas Electricity Corp. 17,618 16,838 15,627 13,925 12,435ii) Bahamas Telecommunication Corp. -- -- -- -- -- iii) Water and Sewerage Corp. 1,496 1,125 743 180 147iv) Bahamas Development Bank -- -- -- -- -- v) Bahamasair -- -- -- -- -- vi) Hotel Corporation -- -- -- -- -- B. INTERNAL DEBT 285,014 249,450 246,987 302,459 468,435I. FOREIGN CURRENCY 83,695 57,050 40,641 101,392 221,642
GOVERNMENT GUARANTEED LOANS -- -- -- 36,207 165,722i) Bahamas Electricity Corp. -- -- -- -- 128,000ii) Bahamas Telecommunication Corp. -- -- -- -- -- iii) Water and Sewerage Corp. -- -- -- -- -- iv) Bahamas Development Bank -- -- -- -- -- v) Bahamasair -- -- -- 36,207 37,722vi) Hotel Corporation -- -- -- -- --
OTHER LOANS 83,695 57,050 40,641 65,185 55,920i) Bahamas Electricity Corp. -- -- 2,707 17,001 17,001ii) Bahamas Telecommunication Corp. 80,850 57,050 37,934 48,184 38,919iii) Water and Sewerage Corp. -- -- -- -- -- iv) Bahamas Development Bank -- -- -- -- -- v) Bahamasair -- -- -- -- -- vi) Hotel Corporation 2,845 -- -- -- --
II. BAHAMIAN DOLLARS 201,319 192,400 206,346 201,067 246,793GOVERNMENT GUARANTEED LOANS 144,261 140,761 146,661 152,135 186,310
i) Bahamas Electricity Corp. -- -- -- -- -- ii) Bahamas Telecommunication Corp. -- -- -- -- -- iii) Water and Sewerage Corp. 5,161 5,161 5,161 5,161 5,161iv) Bridge Authority 28,000 28,000 28,000 28,000 28,000v) Bahamas Development Bank -- -- 14,000 17,000 21,000
vi) Bahamasair -- -- -- 4,374 3,449 vii) Bahamas Mortgage Corp. 111,100 107,600 99,500 97,600 94,800 viii) Bahamas Broadcasting Corporation -- -- -- -- -- ix) Education Loan Authority -- -- -- -- 33,900
OTHER LOANS 57,058 51,639 59,685 48,932 60,483i) Bahamas Electricity Corp. 10,098 9,688 10,458 16,018 35,491ii) Bahamas Telecommunication Corp. 24,632 24,054 32,000 16,923 9,749iii) Water and Sewerage Corp. 4,567 -- -- -- -- iv) Bahamas Development Bank 7,752 8,602 7,932 7,238 6,519v) Hotel Corporation 2,909 2,195 2,195 1,838 1,838vi) Bahamas Air 7,100 7,100 7,100 6,915 6,886vii) Bahamas Broadcasting Corporation -- -- -- -- --
C. TOTAL FOREIGN CURRENCY DEBT 332,230 294,107 249,001 295,868 281,436D.TOTAL GOVERNMENT GUARANTEED DEBT 373,682 359,855 338,651 368,713 399,244E. TOTAL DEBT 533,549 486,507 455,347 496,935 528,229SOURCE: Quarterly Reports from Public Corporations.
Table 8.5 Public Corporations: Debt Operations
79
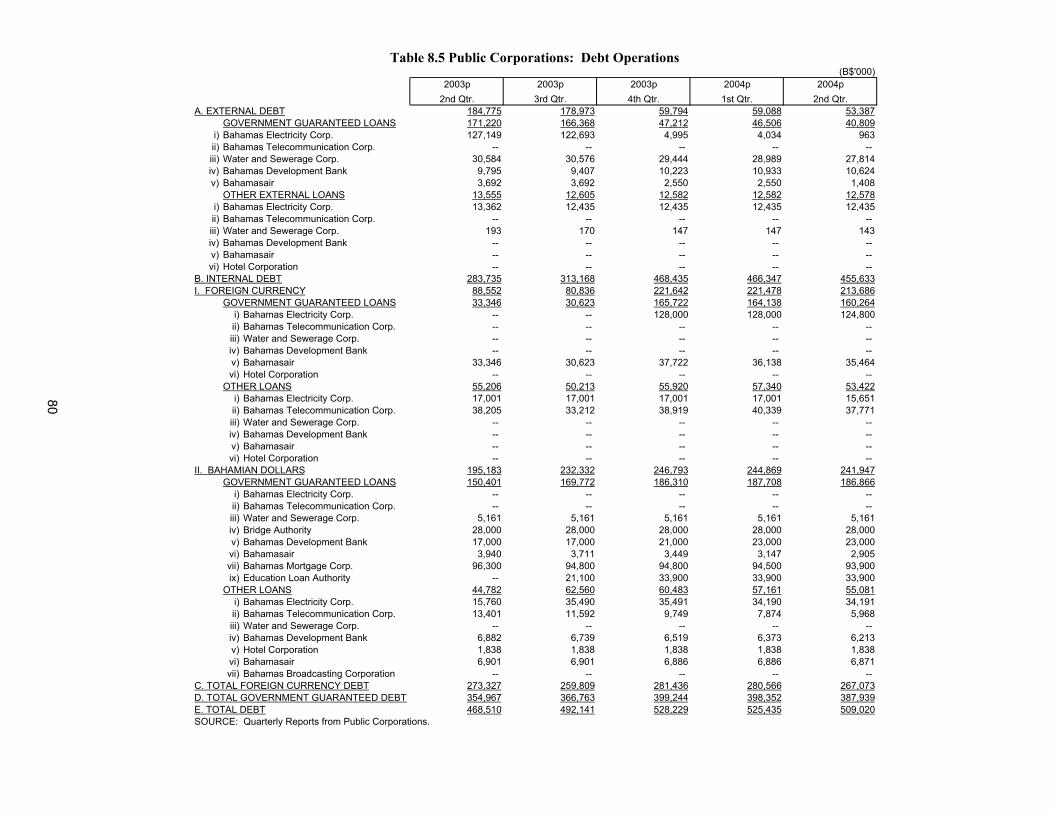
(B$'000)2003p 2003p 2003p 2004p 2004p
2nd Qtr. 3rd Qtr. 4th Qtr. 1st Qtr. 2nd Qtr.A. EXTERNAL DEBT 184,775 178,973 59,794 59,088 53,387
GOVERNMENT GUARANTEED LOANS 171,220 166,368 47,212 46,506 40,809i) Bahamas Electricity Corp. 127,149 122,693 4,995 4,034 963ii) Bahamas Telecommunication Corp. -- -- -- -- -- iii) Water and Sewerage Corp. 30,584 30,576 29,444 28,989 27,814iv) Bahamas Development Bank 9,795 9,407 10,223 10,933 10,624v) Bahamasair 3,692 3,692 2,550 2,550 1,408
OTHER EXTERNAL LOANS 13,555 12,605 12,582 12,582 12,578i) Bahamas Electricity Corp. 13,362 12,435 12,435 12,435 12,435ii) Bahamas Telecommunication Corp. -- -- -- -- -- iii) Water and Sewerage Corp. 193 170 147 147 143iv) Bahamas Development Bank -- -- -- -- -- v) Bahamasair -- -- -- -- -- vi) Hotel Corporation -- -- -- -- --
B. INTERNAL DEBT 283,735 313,168 468,435 466,347 455,633I. FOREIGN CURRENCY 88,552 80,836 221,642 221,478 213,686
GOVERNMENT GUARANTEED LOANS 33,346 30,623 165,722 164,138 160,264i) Bahamas Electricity Corp. -- -- 128,000 128,000 124,800ii) Bahamas Telecommunication Corp. -- -- -- -- -- iii) Water and Sewerage Corp. -- -- -- -- -- iv) Bahamas Development Bank -- -- -- -- -- v) Bahamasair 33,346 30,623 37,722 36,138 35,464
vi) Hotel Corporation -- -- -- -- -- OTHER LOANS 55,206 50,213 55,920 57,340 53,422
i) Bahamas Electricity Corp. 17,001 17,001 17,001 17,001 15,651ii) Bahamas Telecommunication Corp. 38,205 33,212 38,919 40,339 37,771iii) Water and Sewerage Corp. -- -- -- -- -- iv) Bahamas Development Bank -- -- -- -- -- v) Bahamasair -- -- -- -- -- vi) Hotel Corporation -- -- -- -- --
II. BAHAMIAN DOLLARS 195,183 232,332 246,793 244,869 241,947GOVERNMENT GUARANTEED LOANS 150,401 169,772 186,310 187,708 186,866
i) Bahamas Electricity Corp. -- -- -- -- -- ii) Bahamas Telecommunication Corp. -- -- -- -- -- iii) Water and Sewerage Corp. 5,161 5,161 5,161 5,161 5,161iv) Bridge Authority 28,000 28,000 28,000 28,000 28,000v) Bahamas Development Bank 17,000 17,000 21,000 23,000 23,000
vi) Bahamasair 3,940 3,711 3,449 3,147 2,905 vii) Bahamas Mortgage Corp. 96,300 94,800 94,800 94,500 93,900 ix) Education Loan Authority -- 21,100 33,900 33,900 33,900OTHER LOANS 44,782 62,560 60,483 57,161 55,081
i) Bahamas Electricity Corp. 15,760 35,490 35,491 34,190 34,191ii) Bahamas Telecommunication Corp. 13,401 11,592 9,749 7,874 5,968iii) Water and Sewerage Corp. -- -- -- -- -- iv) Bahamas Development Bank 6,882 6,739 6,519 6,373 6,213v) Hotel Corporation 1,838 1,838 1,838 1,838 1,838
vi) Bahamasair 6,901 6,901 6,886 6,886 6,871 vii) Bahamas Broadcasting Corporation -- -- -- -- --
C. TOTAL FOREIGN CURRENCY DEBT 273,327 259,809 281,436 280,566 267,073D. TOTAL GOVERNMENT GUARANTEED DEBT 354,967 366,763 399,244 398,352 387,939E. TOTAL DEBT 468,510 492,141 528,229 525,435 509,020SOURCE: Quarterly Reports from Public Corporations.
Table 8.5 Public Corporations: Debt Operations
80
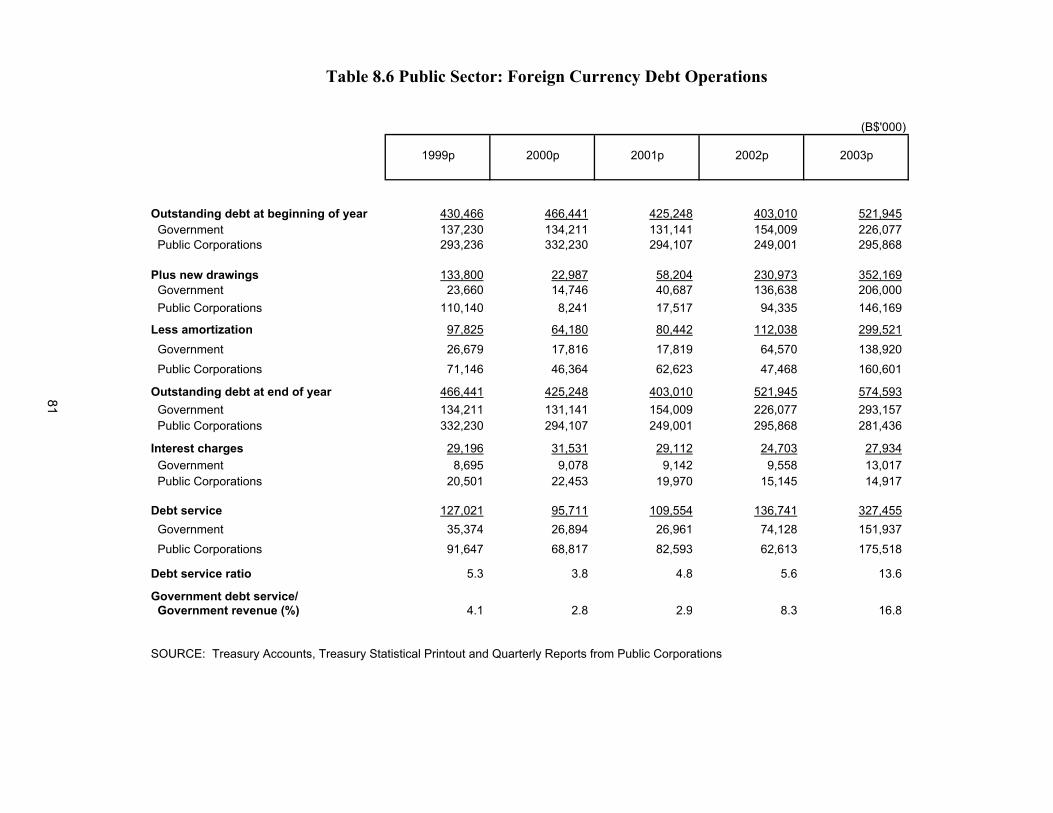
(B$'000)
1999p 2000p 2001p 2002p 2003p
Outstanding debt at beginning of year 430,466 466,441 425,248 403,010 521,945 Government 137,230 134,211 131,141 154,009 226,077 Public Corporations 293,236 332,230 294,107 249,001 295,868
Plus new drawings 133,800 22,987 58,204 230,973 352,169 Government 23,660 14,746 40,687 136,638 206,000 Public Corporations 110,140 8,241 17,517 94,335 146,169
Less amortization 97,825 64,180 80,442 112,038 299,521 Government 26,679 17,816 17,819 64,570 138,920 Public Corporations 71,146 46,364 62,623 47,468 160,601
Outstanding debt at end of year 466,441 425,248 403,010 521,945 574,593 Government 134,211 131,141 154,009 226,077 293,157 Public Corporations 332,230 294,107 249,001 295,868 281,436
Interest charges 29,196 31,531 29,112 24,703 27,934 Government 8,695 9,078 9,142 9,558 13,017 Public Corporations 20,501 22,453 19,970 15,145 14,917
Debt service 127,021 95,711 109,554 136,741 327,455 Government 35,374 26,894 26,961 74,128 151,937 Public Corporations 91,647 68,817 82,593 62,613 175,518
Debt service ratio 5.3 3.8 4.8 5.6 13.6
Government debt service/ Government revenue (%) 4.1 2.8 2.9 8.3 16.8
SOURCE: Treasury Accounts, Treasury Statistical Printout and Quarterly Reports from Public Corporations
Table 8.6 Public Sector: Foreign Currency Debt Operations
81
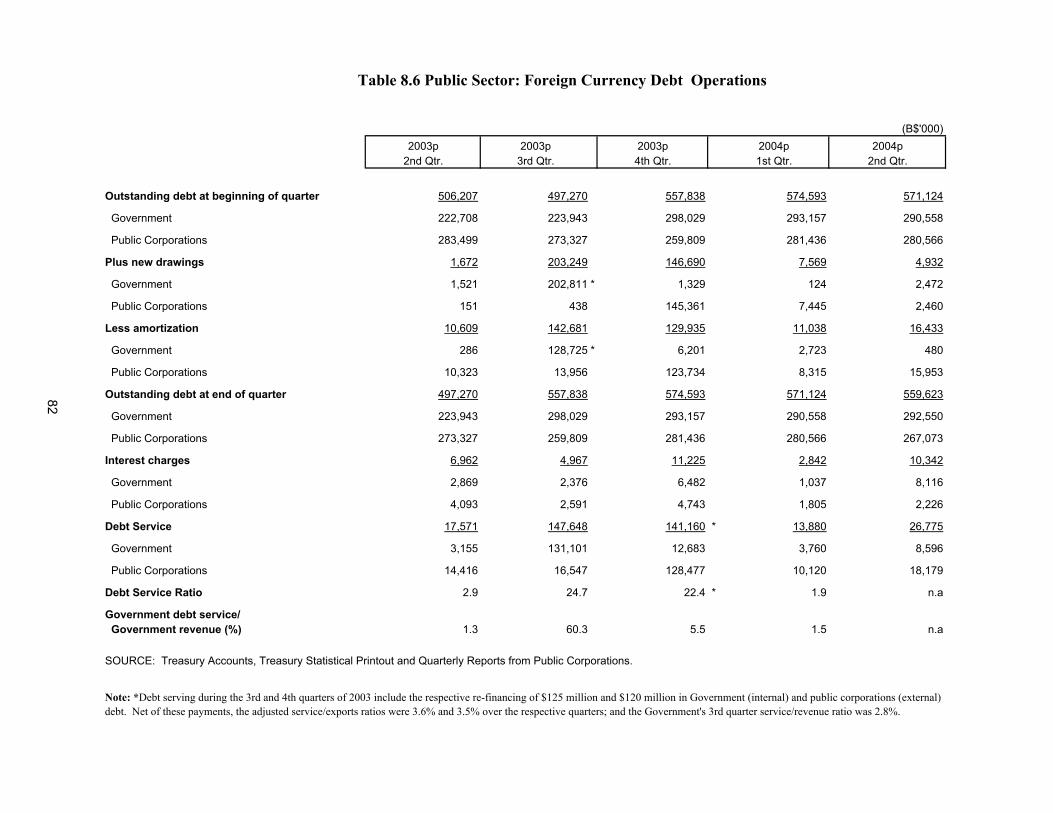
(B$'000)2003p 2003p 2003p 2004p 2004p
2nd Qtr. 3rd Qtr. 4th Qtr. 1st Qtr. 2nd Qtr.
Outstanding debt at beginning of quarter 506,207 497,270 557,838 574,593 571,124
Government 222,708 223,943 298,029 293,157 290,558
Public Corporations 283,499 273,327 259,809 281,436 280,566
Plus new drawings 1,672 203,249 146,690 7,569 4,932
Government 1,521 202,811 * 1,329 124 2,472
Public Corporations 151 438 145,361 7,445 2,460
Less amortization 10,609 142,681 129,935 11,038 16,433
Government 286 128,725 * 6,201 2,723 480
Public Corporations 10,323 13,956 123,734 8,315 15,953
Outstanding debt at end of quarter 497,270 557,838 574,593 571,124 559,623
Government 223,943 298,029 293,157 290,558 292,550
Public Corporations 273,327 259,809 281,436 280,566 267,073
Interest charges 6,962 4,967 11,225 2,842 10,342
Government 2,869 2,376 6,482 1,037 8,116
Public Corporations 4,093 2,591 4,743 1,805 2,226
Debt Service 17,571 147,648 141,160 * 13,880 26,775
Government 3,155 131,101 12,683 3,760 8,596
Public Corporations 14,416 16,547 128,477 10,120 18,179
Debt Service Ratio 2.9 24.7 22.4 * 1.9 n.a
Government debt service/ Government revenue (%) 1.3 60.3 5.5 1.5 n.a
SOURCE: Treasury Accounts, Treasury Statistical Printout and Quarterly Reports from Public Corporations.
Table 8.6 Public Sector: Foreign Currency Debt Operations
Note: *Debt serving during the 3rd and 4th quarters of 2003 include the respective re-financing of $125 million and $120 million in Government (internal) and public corporations (external) debt. Net of these payments, the adjusted service/exports ratios were 3.6% and 3.5% over the respective quarters; and the Government's 3rd quarter service/revenue ratio was 2.8%.
82
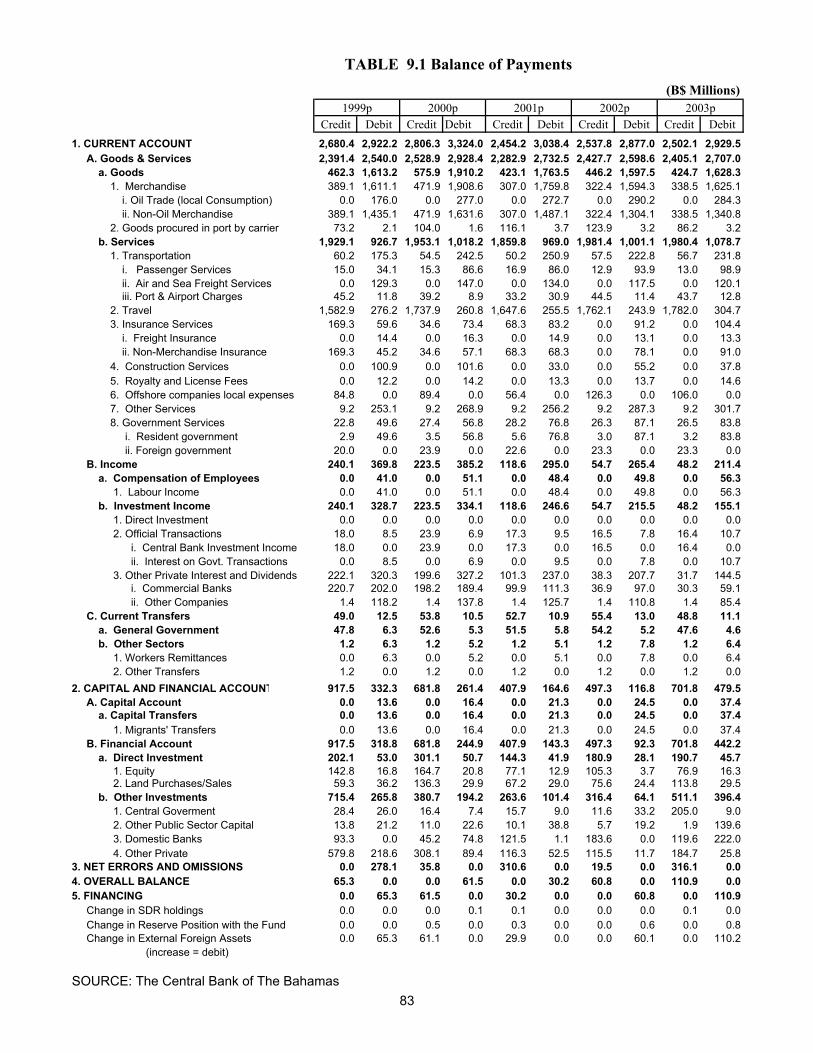
(B$ Millions)1999p 2000p 2001p 2002p 2003p
Credit Debit Credit Debit Credit Debit Credit Debit Credit Debit1. CURRENT ACCOUNT 2,680.4 2,922.2 2,806.3 3,324.0 2,454.2 3,038.4 2,537.8 2,877.0 2,502.1 2,929.5 A. Goods & Services 2,391.4 2,540.0 2,528.9 2,928.4 2,282.9 2,732.5 2,427.7 2,598.6 2,405.1 2,707.0 a. Goods 462.3 1,613.2 575.9 1,910.2 423.1 1,763.5 446.2 1,597.5 424.7 1,628.3 1. Merchandise 389.1 1,611.1 471.9 1,908.6 307.0 1,759.8 322.4 1,594.3 338.5 1,625.1 i. Oil Trade (local Consumption) 0.0 176.0 0.0 277.0 0.0 272.7 0.0 290.2 0.0 284.3 ii. Non-Oil Merchandise 389.1 1,435.1 471.9 1,631.6 307.0 1,487.1 322.4 1,304.1 338.5 1,340.8 2. Goods procured in port by carrier 73.2 2.1 104.0 1.6 116.1 3.7 123.9 3.2 86.2 3.2 b. Services 1,929.1 926.7 1,953.1 1,018.2 1,859.8 969.0 1,981.4 1,001.1 1,980.4 1,078.7 1. Transportation 60.2 175.3 54.5 242.5 50.2 250.9 57.5 222.8 56.7 231.8 i. Passenger Services 15.0 34.1 15.3 86.6 16.9 86.0 12.9 93.9 13.0 98.9 ii. Air and Sea Freight Services 0.0 129.3 0.0 147.0 0.0 134.0 0.0 117.5 0.0 120.1 iii. Port & Airport Charges 45.2 11.8 39.2 8.9 33.2 30.9 44.5 11.4 43.7 12.8 2. Travel 1,582.9 276.2 1,737.9 260.8 1,647.6 255.5 1,762.1 243.9 1,782.0 304.7 3. Insurance Services 169.3 59.6 34.6 73.4 68.3 83.2 0.0 91.2 0.0 104.4 i. Freight Insurance 0.0 14.4 0.0 16.3 0.0 14.9 0.0 13.1 0.0 13.3 ii. Non-Merchandise Insurance 169.3 45.2 34.6 57.1 68.3 68.3 0.0 78.1 0.0 91.0 4. Construction Services 0.0 100.9 0.0 101.6 0.0 33.0 0.0 55.2 0.0 37.8 5. Royalty and License Fees 0.0 12.2 0.0 14.2 0.0 13.3 0.0 13.7 0.0 14.6 6. Offshore companies local expenses 84.8 0.0 89.4 0.0 56.4 0.0 126.3 0.0 106.0 0.0 7. Other Services 9.2 253.1 9.2 268.9 9.2 256.2 9.2 287.3 9.2 301.7 8. Government Services 22.8 49.6 27.4 56.8 28.2 76.8 26.3 87.1 26.5 83.8 i. Resident government 2.9 49.6 3.5 56.8 5.6 76.8 3.0 87.1 3.2 83.8 ii. Foreign government 20.0 0.0 23.9 0.0 22.6 0.0 23.3 0.0 23.3 0.0 B. Income 240.1 369.8 223.5 385.2 118.6 295.0 54.7 265.4 48.2 211.4 a. Compensation of Employees 0.0 41.0 0.0 51.1 0.0 48.4 0.0 49.8 0.0 56.3 1. Labour Income 0.0 41.0 0.0 51.1 0.0 48.4 0.0 49.8 0.0 56.3 b. Investment Income 240.1 328.7 223.5 334.1 118.6 246.6 54.7 215.5 48.2 155.1 1. Direct Investment 0.0 0.0 0.0 0.0 0.0 0.0 0.0 0.0 0.0 0.0 2. Official Transactions 18.0 8.5 23.9 6.9 17.3 9.5 16.5 7.8 16.4 10.7 i. Central Bank Investment Income 18.0 0.0 23.9 0.0 17.3 0.0 16.5 0.0 16.4 0.0 ii. Interest on Govt. Transactions 0.0 8.5 0.0 6.9 0.0 9.5 0.0 7.8 0.0 10.7 3. Other Private Interest and Dividends 222.1 320.3 199.6 327.2 101.3 237.0 38.3 207.7 31.7 144.5 i. Commercial Banks 220.7 202.0 198.2 189.4 99.9 111.3 36.9 97.0 30.3 59.1 ii. Other Companies 1.4 118.2 1.4 137.8 1.4 125.7 1.4 110.8 1.4 85.4 C. Current Transfers 49.0 12.5 53.8 10.5 52.7 10.9 55.4 13.0 48.8 11.1 a. General Government 47.8 6.3 52.6 5.3 51.5 5.8 54.2 5.2 47.6 4.6 b. Other Sectors 1.2 6.3 1.2 5.2 1.2 5.1 1.2 7.8 1.2 6.4 1. Workers Remittances 0.0 6.3 0.0 5.2 0.0 5.1 0.0 7.8 0.0 6.4 2. Other Transfers 1.2 0.0 1.2 0.0 1.2 0.0 1.2 0.0 1.2 0.02. CAPITAL AND FINANCIAL ACCOUNT 917.5 332.3 681.8 261.4 407.9 164.6 497.3 116.8 701.8 479.5 A. Capital Account 0.0 13.6 0.0 16.4 0.0 21.3 0.0 24.5 0.0 37.4 a. Capital Transfers 0.0 13.6 0.0 16.4 0.0 21.3 0.0 24.5 0.0 37.4 1. Migrants' Transfers 0.0 13.6 0.0 16.4 0.0 21.3 0.0 24.5 0.0 37.4 B. Financial Account 917.5 318.8 681.8 244.9 407.9 143.3 497.3 92.3 701.8 442.2 a. Direct Investment 202.1 53.0 301.1 50.7 144.3 41.9 180.9 28.1 190.7 45.7 1. Equity 142.8 16.8 164.7 20.8 77.1 12.9 105.3 3.7 76.9 16.3 2. Land Purchases/Sales 59.3 36.2 136.3 29.9 67.2 29.0 75.6 24.4 113.8 29.5 b. Other Investments 715.4 265.8 380.7 194.2 263.6 101.4 316.4 64.1 511.1 396.4 1. Central Goverment 28.4 26.0 16.4 7.4 15.7 9.0 11.6 33.2 205.0 9.0 2. Other Public Sector Capital 13.8 21.2 11.0 22.6 10.1 38.8 5.7 19.2 1.9 139.6 3. Domestic Banks 93.3 0.0 45.2 74.8 121.5 1.1 183.6 0.0 119.6 222.0 4. Other Private 579.8 218.6 308.1 89.4 116.3 52.5 115.5 11.7 184.7 25.83. NET ERRORS AND OMISSIONS 0.0 278.1 35.8 0.0 310.6 0.0 19.5 0.0 316.1 0.04. OVERALL BALANCE 65.3 0.0 0.0 61.5 0.0 30.2 60.8 0.0 110.9 0.05. FINANCING 0.0 65.3 61.5 0.0 30.2 0.0 0.0 60.8 0.0 110.9 Change in SDR holdings 0.0 0.0 0.0 0.1 0.1 0.0 0.0 0.0 0.1 0.0 Change in Reserve Position with the Fund 0.0 0.0 0.5 0.0 0.3 0.0 0.0 0.6 0.0 0.8 Change in External Foreign Assets 0.0 65.3 61.1 0.0 29.9 0.0 0.0 60.1 0.0 110.2 (increase = debit)
TABLE 9.1 Balance of Payments
SOURCE: The Central Bank of The Bahamas 83
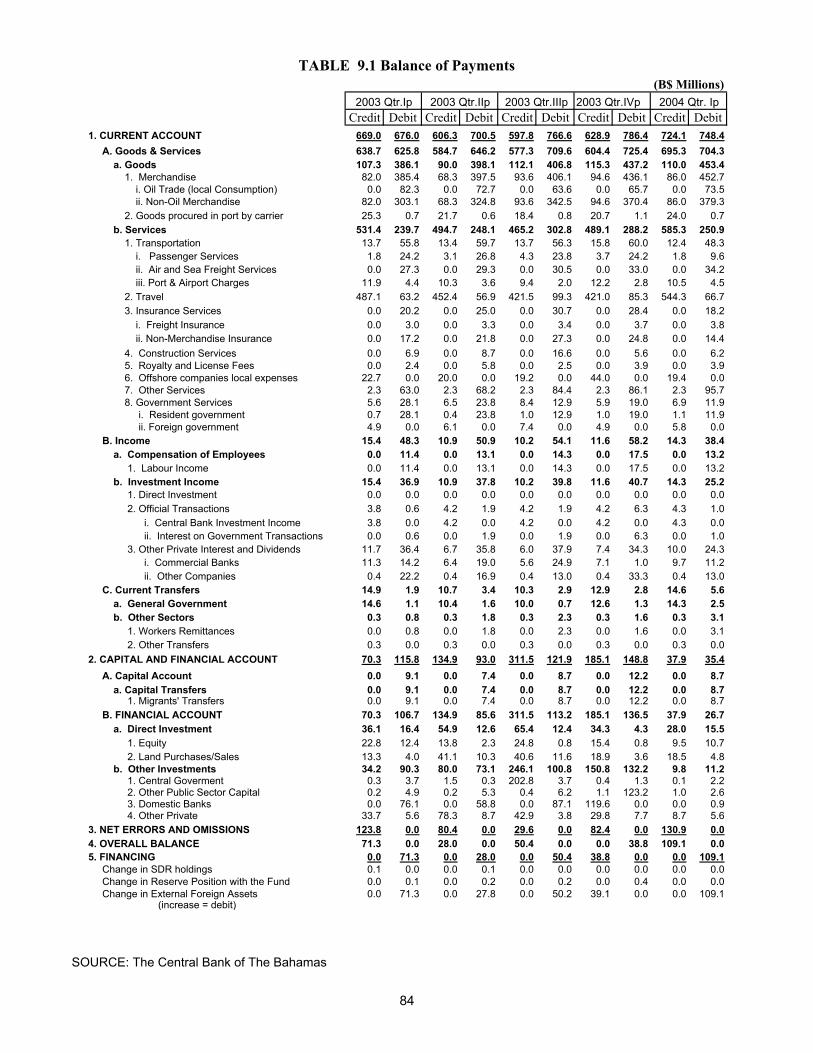
1. CURRENT ACCOUNT A. Goods & Services a. Goods 1. Merchandise i. Oil Trade (local Consumption) ii. Non-Oil Merchandise 2. Goods procured in port by carrier b. Services 1. Transportation i. Passenger Services ii. Air and Sea Freight Services iii. Port & Airport Charges 2. Travel 3. Insurance Services i. Freight Insurance ii. Non-Merchandise Insurance 4. Construction Services 5. Royalty and License Fees 6. Offshore companies local expenses 7. Other Services 8. Government Services i. Resident government ii. Foreign government B. Income a. Compensation of Employees 1. Labour Income b. Investment Income 1. Direct Investment 2. Official Transactions i. Central Bank Investment Income ii. Interest on Government Transactions 3. Other Private Interest and Dividends i. Commercial Banks ii. Other Companies C. Current Transfers a. General Government b. Other Sectors 1. Workers Remittances 2. Other Transfers2. CAPITAL AND FINANCIAL ACCOUNT A. Capital Account a. Capital Transfers 1. Migrants' Transfers B. FINANCIAL ACCOUNT a. Direct Investment 1. Equity 2. Land Purchases/Sales b. Other Investments 1. Central Goverment 2. Other Public Sector Capital 3. Domestic Banks 4. Other Private3. NET ERRORS AND OMISSIONS4. OVERALL BALANCE5. FINANCING Change in SDR holdings Change in Reserve Position with the Fund Change in External Foreign Assets (increase = debit)
TABLE(B$ Millions)
2003 Qtr.Ip 2003 Qtr.IIp 2003 Qtr.IIIp 2003 Qtr.IVpCredit Debit Credit Debit Credit Debit Credit Debit Credit Debit
669.0 676.0 606.3 700.5 597.8 766.6 628.9 786.4 724.1 748.4638.7 625.8 584.7 646.2 577.3 709.6 604.4 725.4 695.3 704.3107.3 386.1 90.0 398.1 112.1 406.8 115.3 437.2 110.0 453.482.0 385.4 68.3 397.5 93.6 406.1 94.6 436.1 86.0 452.70.0 82.3 0.0 72.7 0.0 63.6 0.0 65.7 0.0 73.5
82.0 303.1 68.3 324.8 93.6 342.5 94.6 370.4 86.0 379.325.3 0.7 21.7 0.6 18.4 0.8 20.7 1.1 24.0 0.7
531.4 239.7 494.7 248.1 465.2 302.8 489.1 288.2 585.3 250.913.7 55.8 13.4 59.7 13.7 56.3 15.8 60.0 12.4 48.31.8 24.2 3.1 26.8 4.3 23.8 3.7 24.2 1.8 9.60.0 27.3 0.0 29.3 0.0 30.5 0.0 33.0 0.0 34.2
11.9 4.4 10.3 3.6 9.4 2.0 12.2 2.8 10.5 4.5487.1 63.2 452.4 56.9 421.5 99.3 421.0 85.3 544.3 66.7
0.0 20.2 0.0 25.0 0.0 30.7 0.0 28.4 0.0 18.20.0 3.0 0.0 3.3 0.0 3.4 0.0 3.7 0.0 3.80.0 17.2 0.0 21.8 0.0 27.3 0.0 24.8 0.0 14.40.0 6.9 0.0 8.7 0.0 16.6 0.0 5.6 0.0 6.20.0 2.4 0.0 5.8 0.0 2.5 0.0 3.9 0.0 3.9
22.7 0.0 20.0 0.0 19.2 0.0 44.0 0.0 19.4 0.02.3 63.0 2.3 68.2 2.3 84.4 2.3 86.1 2.3 95.75.6 28.1 6.5 23.8 8.4 12.9 5.9 19.0 6.9 11.90.7 28.1 0.4 23.8 1.0 12.9 1.0 19.0 1.1 11.94.9 0.0 6.1 0.0 7.4 0.0 4.9 0.0 5.8 0.0
15.4 48.3 10.9 50.9 10.2 54.1 11.6 58.2 14.3 38.40.0 11.4 0.0 13.1 0.0 14.3 0.0 17.5 0.0 13.20.0 11.4 0.0 13.1 0.0 14.3 0.0 17.5 0.0 13.2
15.4 36.9 10.9 37.8 10.2 39.8 11.6 40.7 14.3 25.20.0 0.0 0.0 0.0 0.0 0.0 0.0 0.0 0.0 0.03.8 0.6 4.2 1.9 4.2 1.9 4.2 6.3 4.3 1.03.8 0.0 4.2 0.0 4.2 0.0 4.2 0.0 4.3 0.00.0 0.6 0.0 1.9 0.0 1.9 0.0 6.3 0.0 1.0
11.7 36.4 6.7 35.8 6.0 37.9 7.4 34.3 10.0 24.311.3 14.2 6.4 19.0 5.6 24.9 7.1 1.0 9.7 11.20.4 22.2 0.4 16.9 0.4 13.0 0.4 33.3 0.4 13.0
14.9 1.9 10.7 3.4 10.3 2.9 12.9 2.8 14.6 5.614.6 1.1 10.4 1.6 10.0 0.7 12.6 1.3 14.3 2.50.3 0.8 0.3 1.8 0.3 2.3 0.3 1.6 0.3 3.10.0 0.8 0.0 1.8 0.0 2.3 0.0 1.6 0.0 3.10.3 0.0 0.3 0.0 0.3 0.0 0.3 0.0 0.3 0.0
70.3 115.8 134.9 93.0 311.5 121.9 185.1 148.8 37.9 35.40.0 9.1 0.0 7.4 0.0 8.7 0.0 12.2 0.0 8.70.0 9.1 0.0 7.4 0.0 8.7 0.0 12.2 0.0 8.70.0 9.1 0.0 7.4 0.0 8.7 0.0 12.2 0.0 8.7
70.3 106.7 134.9 85.6 311.5 113.2 185.1 136.5 37.9 26.736.1 16.4 54.9 12.6 65.4 12.4 34.3 4.3 28.0 15.522.8 12.4 13.8 2.3 24.8 0.8 15.4 0.8 9.5 10.713.3 4.0 41.1 10.3 40.6 11.6 18.9 3.6 18.5 4.834.2 90.3 80.0 73.1 246.1 100.8 150.8 132.2 9.8 11.20.3 3.7 1.5 0.3 202.8 3.7 0.4 1.3 0.1 2.20.2 4.9 0.2 5.3 0.4 6.2 1.1 123.2 1.0 2.60.0 76.1 0.0 58.8 0.0 87.1 119.6 0.0 0.0 0.9
33.7 5.6 78.3 8.7 42.9 3.8 29.8 7.7 8.7 5.6123.8 0.0 80.4 0.0 29.6 0.0 82.4 0.0 130.9 0.071.3 0.0 28.0 0.0 50.4 0.0 0.0 38.8 109.1 0.00.0 71.3 0.0 28.0 0.0 50.4 38.8 0.0 0.0 109.10.1 0.0 0.0 0.1 0.0 0.0 0.0 0.0 0.0 0.00.0 0.1 0.0 0.2 0.0 0.2 0.0 0.4 0.0 0.00.0 71.3 0.0 27.8 0.0 50.2 39.1 0.0 0.0 109.1
2004 Qtr. Ip
E 9.1 Balance of Payments
SOURCE: The Central Bank of The Bahamas
84
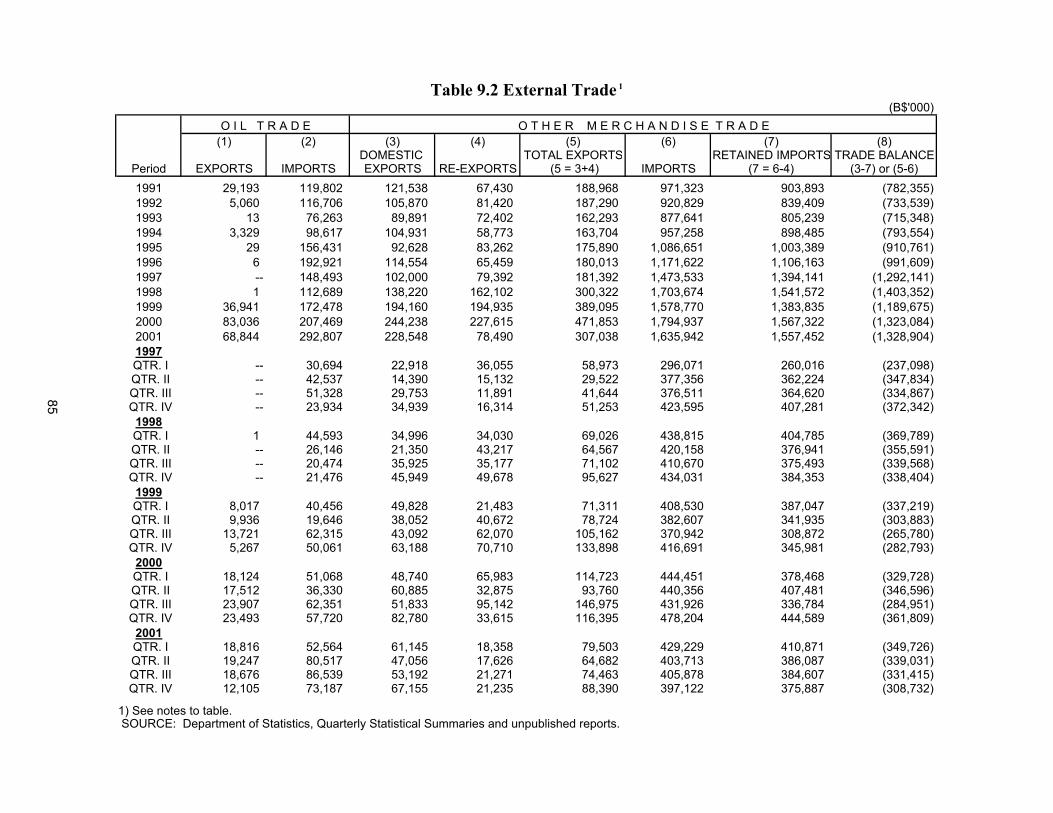
Table 9.2 External Trade 1
(B$'000)O I L T R A D E O T H E R M E R C H A N D I S E T R A D E
(1) (2) (3) (4) (5) (6) (7) (8) DOMESTIC TOTAL EXPORTS RETAINED IMPORTS TRADE BALANCE
Period EXPORTS IMPORTS EXPORTS RE-EXPORTS (5 = 3+4) IMPORTS (7 = 6-4) (3-7) or (5-6)1991 29,193 119,802 121,538 67,430 188,968 971,323 903,893 (782,355)1992 5,060 116,706 105,870 81,420 187,290 920,829 839,409 (733,539)1993 13 76,263 89,891 72,402 162,293 877,641 805,239 (715,348)1994 3,329 98,617 104,931 58,773 163,704 957,258 898,485 (793,554)1995 29 156,431 92,628 83,262 175,890 1,086,651 1,003,389 (910,761)1996 6 192,921 114,554 65,459 180,013 1,171,622 1,106,163 (991,609)1997 -- 148,493 102,000 79,392 181,392 1,473,533 1,394,141 (1,292,141)1998 1 112,689 138,220 162,102 300,322 1,703,674 1,541,572 (1,403,352)1999 36,941 172,478 194,160 194,935 389,095 1,578,770 1,383,835 (1,189,675)2000 83,036 207,469 244,238 227,615 471,853 1,794,937 1,567,322 (1,323,084)2001 68,844 292,807 228,548 78,490 307,038 1,635,942 1,557,452 (1,328,904)1997
QTR. I -- 30,694 22,918 36,055 58,973 296,071 260,016 (237,098) QTR. II -- 42,537 14,390 15,132 29,522 377,356 362,224 (347,834) QTR. III -- 51,328 29,753 11,891 41,644 376,511 364,620 (334,867) QTR. IV -- 23,934 34,939 16,314 51,253 423,595 407,281 (372,342)
1998 QTR. I 1 44,593 34,996 34,030 69,026 438,815 404,785 (369,789) QTR. II -- 26,146 21,350 43,217 64,567 420,158 376,941 (355,591) QTR. III -- 20,474 35,925 35,177 71,102 410,670 375,493 (339,568) QTR. IV -- 21,476 45,949 49,678 95,627 434,031 384,353 (338,404)
1999 QTR. I 8,017 40,456 49,828 21,483 71,311 408,530 387,047 (337,219) QTR. II 9,936 19,646 38,052 40,672 78,724 382,607 341,935 (303,883) QTR. III 13,721 62,315 43,092 62,070 105,162 370,942 308,872 (265,780) QTR. IV 5,267 50,061 63,188 70,710 133,898 416,691 345,981 (282,793)
2000 QTR. I 18,124 51,068 48,740 65,983 114,723 444,451 378,468 (329,728) QTR. II 17,512 36,330 60,885 32,875 93,760 440,356 407,481 (346,596) QTR. III 23,907 62,351 51,833 95,142 146,975 431,926 336,784 (284,951) QTR. IV 23,493 57,720 82,780 33,615 116,395 478,204 444,589 (361,809)
2001 QTR. I 18,816 52,564 61,145 18,358 79,503 429,229 410,871 (349,726) QTR. II 19,247 80,517 47,056 17,626 64,682 403,713 386,087 (339,031) QTR. III 18,676 86,539 53,192 21,271 74,463 405,878 384,607 (331,415) QTR. IV 12,105 73,187 67,155 21,235 88,390 397,122 375,887 (308,732)
1) See notes to table. SOURCE: Department of Statistics, Quarterly Statistical Summaries and unpublished reports.
85
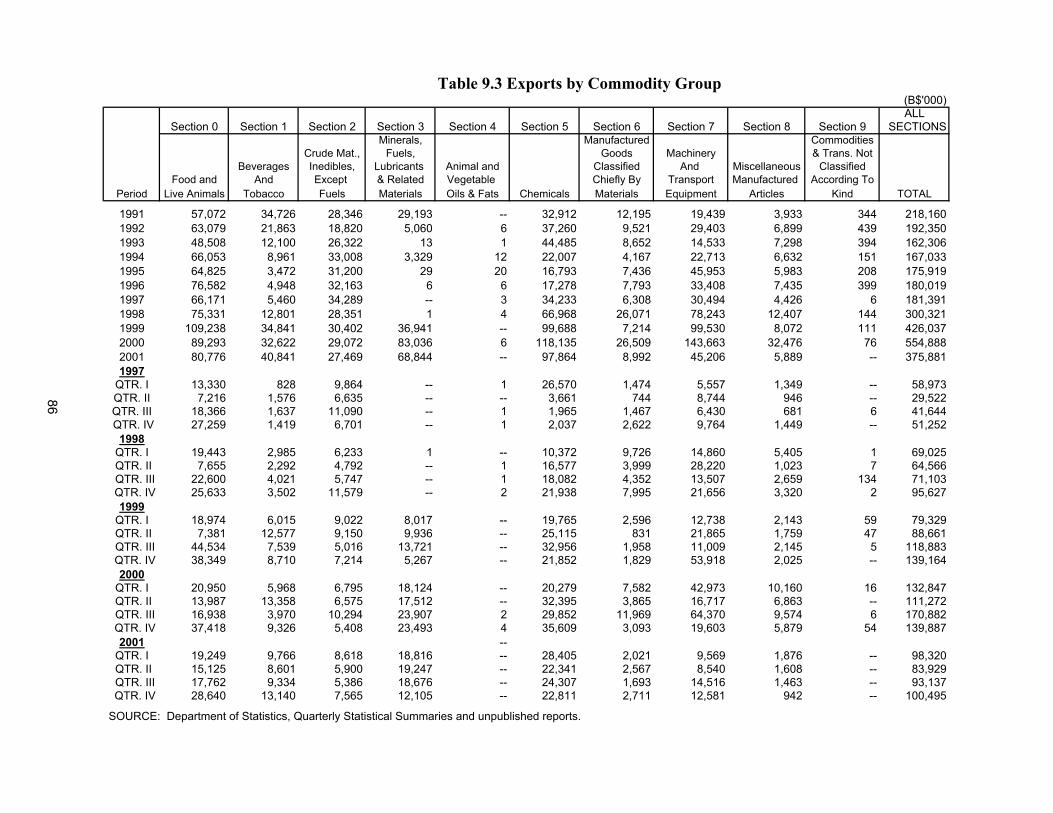
Table 9.3 Exports by Commodity Group(B$'000)ALL
Section 0 Section 1 Section 2 Section 3 Section 4 Section 5 Section 6 Section 7 Section 8 Section 9 SECTIONSMinerals, Manufactured Commodities
Crude Mat., Fuels, Goods Machinery & Trans. NotBeverages Inedibles, Lubricants Animal and Classified And Miscellaneous Classified
Food and And Except & Related Vegetable Chiefly By Transport Manufactured According ToPeriod Live Animals Tobacco Fuels Materials Oils & Fats Chemicals Materials Equipment Articles Kind TOTAL
1991 57,072 34,726 28,346 29,193 -- 32,912 12,195 19,439 3,933 344 218,1601992 63,079 21,863 18,820 5,060 6 37,260 9,521 29,403 6,899 439 192,3501993 48,508 12,100 26,322 13 1 44,485 8,652 14,533 7,298 394 162,3061994 66,053 8,961 33,008 3,329 12 22,007 4,167 22,713 6,632 151 167,0331995 64,825 3,472 31,200 29 20 16,793 7,436 45,953 5,983 208 175,9191996 76,582 4,948 32,163 6 6 17,278 7,793 33,408 7,435 399 180,0191997 66,171 5,460 34,289 -- 3 34,233 6,308 30,494 4,426 6 181,3911998 75,331 12,801 28,351 1 4 66,968 26,071 78,243 12,407 144 300,3211999 109,238 34,841 30,402 36,941 -- 99,688 7,214 99,530 8,072 111 426,0372000 89,293 32,622 29,072 83,036 6 118,135 26,509 143,663 32,476 76 554,8882001 80,776 40,841 27,469 68,844 -- 97,864 8,992 45,206 5,889 -- 375,8811997
QTR. I 13,330 828 9,864 -- 1 26,570 1,474 5,557 1,349 -- 58,973QTR. II 7,216 1,576 6,635 -- -- 3,661 744 8,744 946 -- 29,522QTR. III 18,366 1,637 11,090 -- 1 1,965 1,467 6,430 681 6 41,644 QTR. IV 27,259 1,419 6,701 -- 1 2,037 2,622 9,764 1,449 -- 51,252
1998QTR. I 19,443 2,985 6,233 1 -- 10,372 9,726 14,860 5,405 1 69,025 QTR. II 7,655 2,292 4,792 -- 1 16,577 3,999 28,220 1,023 7 64,566 QTR. III 22,600 4,021 5,747 -- 1 18,082 4,352 13,507 2,659 134 71,103 QTR. IV 25,633 3,502 11,579 -- 2 21,938 7,995 21,656 3,320 2 95,627
1999QTR. I 18,974 6,015 9,022 8,017 -- 19,765 2,596 12,738 2,143 59 79,329 QTR. II 7,381 12,577 9,150 9,936 -- 25,115 831 21,865 1,759 47 88,661 QTR. III 44,534 7,539 5,016 13,721 -- 32,956 1,958 11,009 2,145 5 118,883 QTR. IV 38,349 8,710 7,214 5,267 -- 21,852 1,829 53,918 2,025 -- 139,164
2000QTR. I 20,950 5,968 6,795 18,124 -- 20,279 7,582 42,973 10,160 16 132,847 QTR. II 13,987 13,358 6,575 17,512 -- 32,395 3,865 16,717 6,863 -- 111,272 QTR. III 16,938 3,970 10,294 23,907 2 29,852 11,969 64,370 9,574 6 170,882 QTR. IV 37,418 9,326 5,408 23,493 4 35,609 3,093 19,603 5,879 54 139,887
2001 --QTR. I 19,249 9,766 8,618 18,816 -- 28,405 2,021 9,569 1,876 -- 98,320 QTR. II 15,125 8,601 5,900 19,247 -- 22,341 2,567 8,540 1,608 -- 83,929 QTR. III 17,762 9,334 5,386 18,676 -- 24,307 1,693 14,516 1,463 -- 93,137 QTR. IV 28,640 13,140 7,565 12,105 -- 22,811 2,711 12,581 942 -- 100,495
SOURCE: Department of Statistics, Quarterly Statistical Summaries and unpublished reports.
86
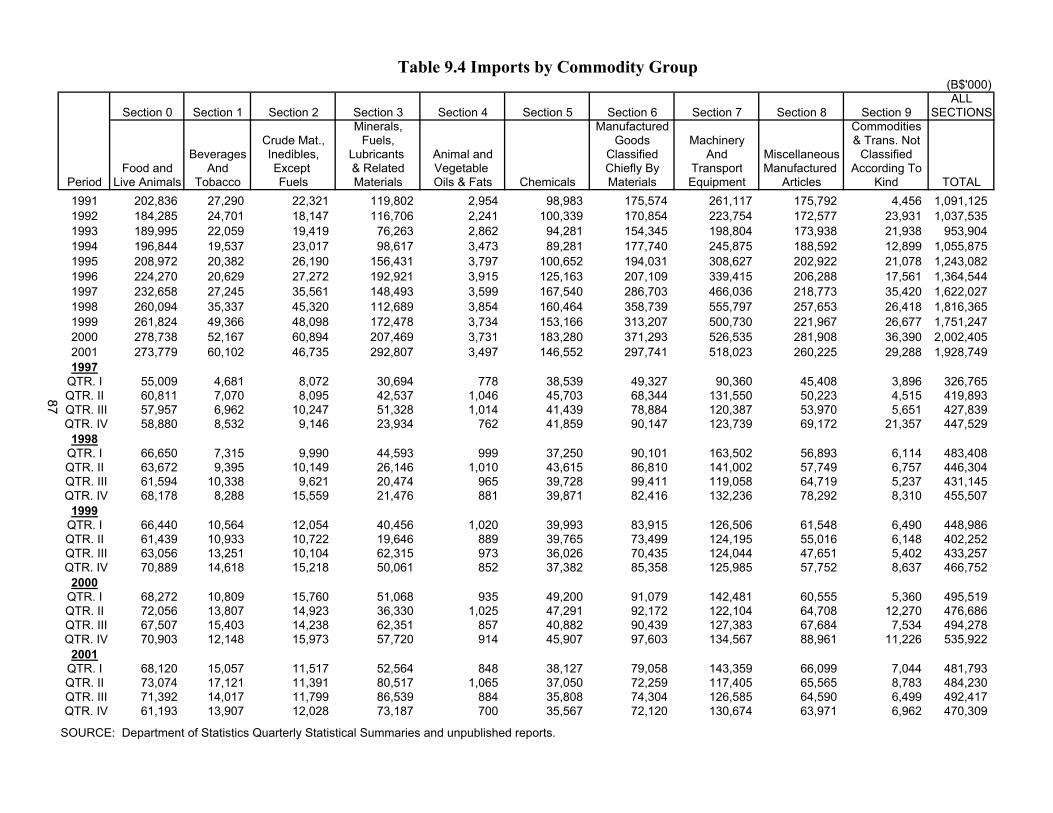
Table 9.4 Imports by Commodity Group (B$'000)ALL
Section 0 Section 1 Section 2 Section 3 Section 4 Section 5 Section 6 Section 7 Section 8 Section 9 SECTIONSMinerals, Manufactured Commodities
Crude Mat., Fuels, Goods Machinery & Trans. NotBeverages Inedibles, Lubricants Animal and Classified And Miscellaneous Classified
Food and And Except & Related Vegetable Chiefly By Transport Manufactured According ToPeriod Live Animals Tobacco Fuels Materials Oils & Fats Chemicals Materials Equipment Articles Kind TOTAL1991 202,836 27,290 22,321 119,802 2,954 98,983 175,574 261,117 175,792 4,456 1,091,1251992 184,285 24,701 18,147 116,706 2,241 100,339 170,854 223,754 172,577 23,931 1,037,5351993 189,995 22,059 19,419 76,263 2,862 94,281 154,345 198,804 173,938 21,938 953,9041994 196,844 19,537 23,017 98,617 3,473 89,281 177,740 245,875 188,592 12,899 1,055,8751995 208,972 20,382 26,190 156,431 3,797 100,652 194,031 308,627 202,922 21,078 1,243,0821996 224,270 20,629 27,272 192,921 3,915 125,163 207,109 339,415 206,288 17,561 1,364,5441997 232,658 27,245 35,561 148,493 3,599 167,540 286,703 466,036 218,773 35,420 1,622,0271998 260,094 35,337 45,320 112,689 3,854 160,464 358,739 555,797 257,653 26,418 1,816,3651999 261,824 49,366 48,098 172,478 3,734 153,166 313,207 500,730 221,967 26,677 1,751,2472000 278,738 52,167 60,894 207,469 3,731 183,280 371,293 526,535 281,908 36,390 2,002,4052001 273,779 60,102 46,735 292,807 3,497 146,552 297,741 518,023 260,225 29,288 1,928,7491997
QTR. I 55,009 4,681 8,072 30,694 778 38,539 49,327 90,360 45,408 3,896 326,765QTR. II 60,811 7,070 8,095 42,537 1,046 45,703 68,344 131,550 50,223 4,515 419,893 QTR. III 57,957 6,962 10,247 51,328 1,014 41,439 78,884 120,387 53,970 5,651 427,839 QTR. IV 58,880 8,532 9,146 23,934 762 41,859 90,147 123,739 69,172 21,357 447,529
1998QTR. I 66,650 7,315 9,990 44,593 999 37,250 90,101 163,502 56,893 6,114 483,408QTR. II 63,672 9,395 10,149 26,146 1,010 43,615 86,810 141,002 57,749 6,757 446,304 QTR. III 61,594 10,338 9,621 20,474 965 39,728 99,411 119,058 64,719 5,237 431,145 QTR. IV 68,178 8,288 15,559 21,476 881 39,871 82,416 132,236 78,292 8,310 455,507
1999QTR. I 66,440 10,564 12,054 40,456 1,020 39,993 83,915 126,506 61,548 6,490 448,986QTR. II 61,439 10,933 10,722 19,646 889 39,765 73,499 124,195 55,016 6,148 402,252 QTR. III 63,056 13,251 10,104 62,315 973 36,026 70,435 124,044 47,651 5,402 433,257 QTR. IV 70,889 14,618 15,218 50,061 852 37,382 85,358 125,985 57,752 8,637 466,752
2000QTR. I 68,272 10,809 15,760 51,068 935 49,200 91,079 142,481 60,555 5,360 495,519QTR. II 72,056 13,807 14,923 36,330 1,025 47,291 92,172 122,104 64,708 12,270 476,686 QTR. III 67,507 15,403 14,238 62,351 857 40,882 90,439 127,383 67,684 7,534 494,278 QTR. IV 70,903 12,148 15,973 57,720 914 45,907 97,603 134,567 88,961 11,226 535,922
2001QTR. I 68,120 15,057 11,517 52,564 848 38,127 79,058 143,359 66,099 7,044 481,793QTR. II 73,074 17,121 11,391 80,517 1,065 37,050 72,259 117,405 65,565 8,783 484,230 QTR. III 71,392 14,017 11,799 86,539 884 35,808 74,304 126,585 64,590 6,499 492,417 QTR. IV 61,193 13,907 12,028 73,187 700 35,567 72,120 130,674 63,971 6,962 470,309
SOURCE: Department of Statistics Quarterly Statistical Summaries and unpublished reports.
87
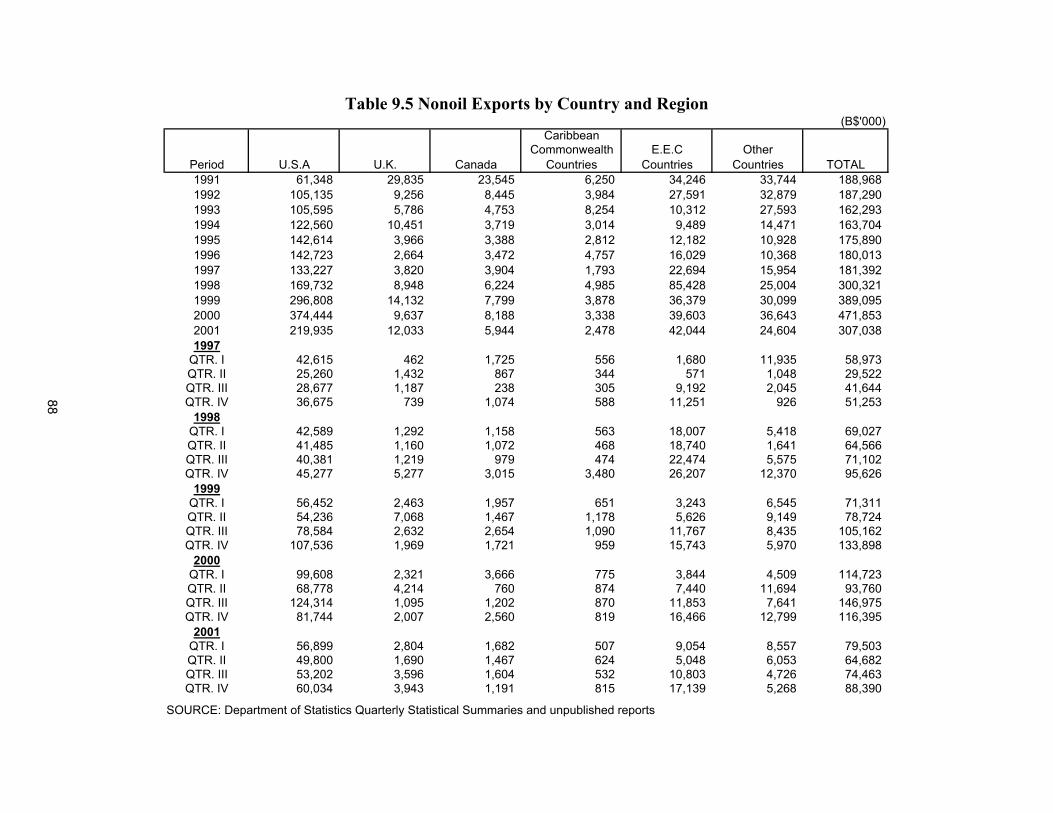
Table 9.5 Nonoil Exports by Country and Region(B$'000)
CaribbeanCommonwealth E.E.C Other
Period U.S.A U.K. Canada Countries Countries Countries TOTAL1991 61,348 29,835 23,545 6,250 34,246 33,744 188,9681992 105,135 9,256 8,445 3,984 27,591 32,879 187,2901993 105,595 5,786 4,753 8,254 10,312 27,593 162,2931994 122,560 10,451 3,719 3,014 9,489 14,471 163,7041995 142,614 3,966 3,388 2,812 12,182 10,928 175,8901996 142,723 2,664 3,472 4,757 16,029 10,368 180,0131997 133,227 3,820 3,904 1,793 22,694 15,954 181,3921998 169,732 8,948 6,224 4,985 85,428 25,004 300,3211999 296,808 14,132 7,799 3,878 36,379 30,099 389,0952000 374,444 9,637 8,188 3,338 39,603 36,643 471,8532001 219,935 12,033 5,944 2,478 42,044 24,604 307,0381997
QTR. I 42,615 462 1,725 556 1,680 11,935 58,973QTR. II 25,260 1,432 867 344 571 1,048 29,522QTR. III 28,677 1,187 238 305 9,192 2,045 41,644QTR. IV 36,675 739 1,074 588 11,251 926 51,253
1998QTR. I 42,589 1,292 1,158 563 18,007 5,418 69,027QTR. II 41,485 1,160 1,072 468 18,740 1,641 64,566QTR. III 40,381 1,219 979 474 22,474 5,575 71,102QTR. IV 45,277 5,277 3,015 3,480 26,207 12,370 95,626
1999QTR. I 56,452 2,463 1,957 651 3,243 6,545 71,311QTR. II 54,236 7,068 1,467 1,178 5,626 9,149 78,724QTR. III 78,584 2,632 2,654 1,090 11,767 8,435 105,162QTR. IV 107,536 1,969 1,721 959 15,743 5,970 133,898
2000QTR. I 99,608 2,321 3,666 775 3,844 4,509 114,723QTR. II 68,778 4,214 760 874 7,440 11,694 93,760QTR. III 124,314 1,095 1,202 870 11,853 7,641 146,975QTR. IV 81,744 2,007 2,560 819 16,466 12,799 116,395
2001QTR. I 56,899 2,804 1,682 507 9,054 8,557 79,503QTR. II 49,800 1,690 1,467 624 5,048 6,053 64,682QTR. III 53,202 3,596 1,604 532 10,803 4,726 74,463QTR. IV 60,034 3,943 1,191 815 17,139 5,268 88,390
SOURCE: Department of Statistics Quarterly Statistical Summaries and unpublished reports.
88
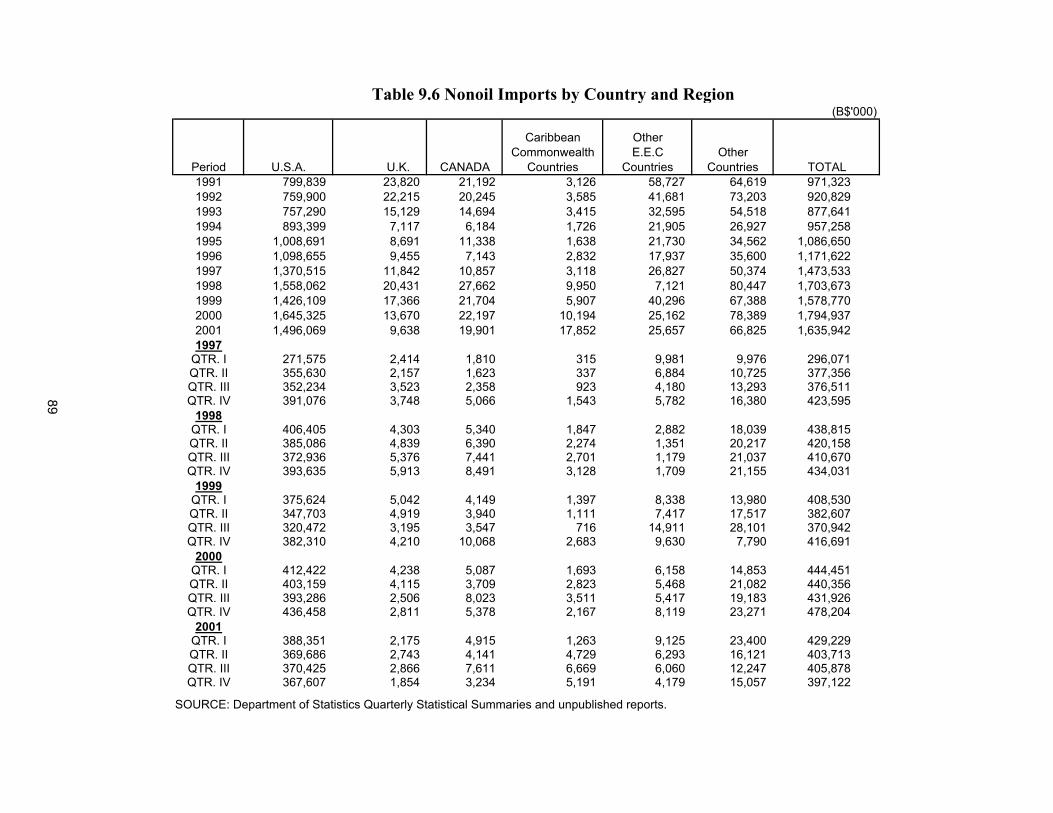
Table 9.6 Nonoil Imports by Country and Region(B$'000)
Caribbean OtherCommonwealth E.E.C Other
Period U.S.A. U.K. CANADA Countries Countries Countries TOTAL1991 799,839 23,820 21,192 3,126 58,727 64,619 971,3231992 759,900 22,215 20,245 3,585 41,681 73,203 920,8291993 757,290 15,129 14,694 3,415 32,595 54,518 877,6411994 893,399 7,117 6,184 1,726 21,905 26,927 957,2581995 1,008,691 8,691 11,338 1,638 21,730 34,562 1,086,6501996 1,098,655 9,455 7,143 2,832 17,937 35,600 1,171,6221997 1,370,515 11,842 10,857 3,118 26,827 50,374 1,473,5331998 1,558,062 20,431 27,662 9,950 7,121 80,447 1,703,6731999 1,426,109 17,366 21,704 5,907 40,296 67,388 1,578,7702000 1,645,325 13,670 22,197 10,194 25,162 78,389 1,794,9372001 1,496,069 9,638 19,901 17,852 25,657 66,825 1,635,9421997
QTR. I 271,575 2,414 1,810 315 9,981 9,976 296,071QTR. II 355,630 2,157 1,623 337 6,884 10,725 377,356QTR. III 352,234 3,523 2,358 923 4,180 13,293 376,511QTR. IV 391,076 3,748 5,066 1,543 5,782 16,380 423,595
1998QTR. I 406,405 4,303 5,340 1,847 2,882 18,039 438,815QTR. II 385,086 4,839 6,390 2,274 1,351 20,217 420,158QTR. III 372,936 5,376 7,441 2,701 1,179 21,037 410,670QTR. IV 393,635 5,913 8,491 3,128 1,709 21,155 434,031
1999QTR. I 375,624 5,042 4,149 1,397 8,338 13,980 408,530QTR. II 347,703 4,919 3,940 1,111 7,417 17,517 382,607QTR. III 320,472 3,195 3,547 716 14,911 28,101 370,942QTR. IV 382,310 4,210 10,068 2,683 9,630 7,790 416,691
2000QTR. I 412,422 4,238 5,087 1,693 6,158 14,853 444,451QTR. II 403,159 4,115 3,709 2,823 5,468 21,082 440,356QTR. III 393,286 2,506 8,023 3,511 5,417 19,183 431,926QTR. IV 436,458 2,811 5,378 2,167 8,119 23,271 478,204
2001QTR. I 388,351 2,175 4,915 1,263 9,125 23,400 429,229QTR. II 369,686 2,743 4,141 4,729 6,293 16,121 403,713QTR. III 370,425 2,866 7,611 6,669 6,060 12,247 405,878QTR. IV 367,607 1,854 3,234 5,191 4,179 15,057 397,122
SOURCE: Department of Statistics Quarterly Statistical Summaries and unpublished reports.
89
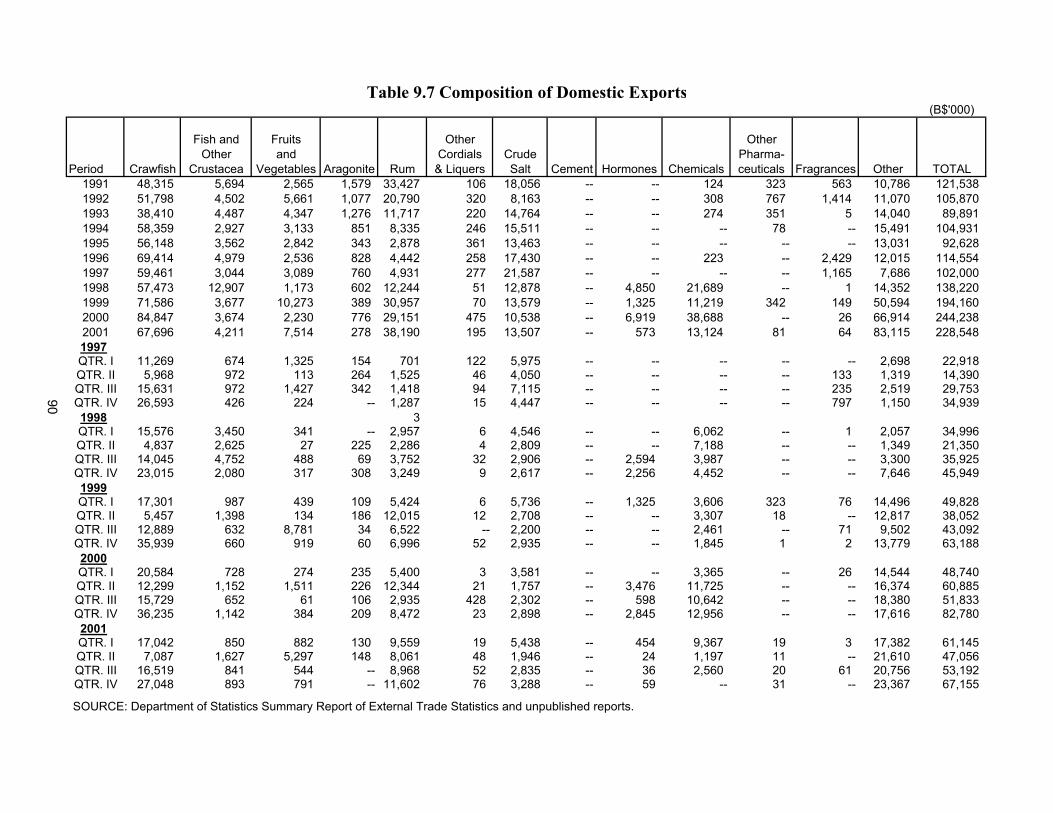
Table 9.7 Composition of Domestic Exports(B$'000)
Fish and Fruits Other OtherOther and Cordials Crude Pharma-
Period Crawfish Crustacea Vegetables Aragonite Rum & Liquers Salt Cement Hormones Chemicals ceuticals Fragrances Other TOTAL1991 48,315 5,694 2,565 1,579 33,427 106 18,056 -- -- 124 323 563 10,786 121,5381992 51,798 4,502 5,661 1,077 20,790 320 8,163 -- -- 308 767 1,414 11,070 105,8701993 38,410 4,487 4,347 1,276 11,717 220 14,764 -- -- 274 351 5 14,040 89,8911994 58,359 2,927 3,133 851 8,335 246 15,511 -- -- -- 78 -- 15,491 104,9311995 56,148 3,562 2,842 343 2,878 361 13,463 -- -- -- -- -- 13,031 92,6281996 69,414 4,979 2,536 828 4,442 258 17,430 -- -- 223 -- 2,429 12,015 114,5541997 59,461 3,044 3,089 760 4,931 277 21,587 -- -- -- -- 1,165 7,686 102,0001998 57,473 12,907 1,173 602 12,244 51 12,878 -- 4,850 21,689 -- 1 14,352 138,2201999 71,586 3,677 10,273 389 30,957 70 13,579 -- 1,325 11,219 342 149 50,594 194,1602000 84,847 3,674 2,230 776 29,151 475 10,538 -- 6,919 38,688 -- 26 66,914 244,2382001 67,696 4,211 7,514 278 38,190 195 13,507 -- 573 13,124 81 64 83,115 228,5481997QTR. I 11,269 674 1,325 154 701 122 5,975 -- -- -- -- -- 2,698 22,918QTR. II 5,968 972 113 264 1,525 46 4,050 -- -- -- -- 133 1,319 14,390QTR. III 15,631 972 1,427 342 1,418 94 7,115 -- -- -- -- 235 2,519 29,753QTR. IV 26,593 426 224 -- 1,287 15 4,447 -- -- -- -- 797 1,150 34,9391998 3QTR. I 15,576 3,450 341 -- 2,957 6 4,546 -- -- 6,062 -- 1 2,057 34,996QTR. II 4,837 2,625 27 225 2,286 4 2,809 -- -- 7,188 -- -- 1,349 21,350QTR. III 14,045 4,752 488 69 3,752 32 2,906 -- 2,594 3,987 -- -- 3,300 35,925QTR. IV 23,015 2,080 317 308 3,249 9 2,617 -- 2,256 4,452 -- -- 7,646 45,9491999QTR. I 17,301 987 439 109 5,424 6 5,736 -- 1,325 3,606 323 76 14,496 49,828QTR. II 5,457 1,398 134 186 12,015 12 2,708 -- -- 3,307 18 -- 12,817 38,052QTR. III 12,889 632 8,781 34 6,522 -- 2,200 -- -- 2,461 -- 71 9,502 43,092QTR. IV 35,939 660 919 60 6,996 52 2,935 -- -- 1,845 1 2 13,779 63,1882000QTR. I 20,584 728 274 235 5,400 3 3,581 -- -- 3,365 -- 26 14,544 48,740QTR. II 12,299 1,152 1,511 226 12,344 21 1,757 -- 3,476 11,725 -- -- 16,374 60,885QTR. III 15,729 652 61 106 2,935 428 2,302 -- 598 10,642 -- -- 18,380 51,833QTR. IV 36,235 1,142 384 209 8,472 23 2,898 -- 2,845 12,956 -- -- 17,616 82,7802001QTR. I 17,042 850 882 130 9,559 19 5,438 -- 454 9,367 19 3 17,382 61,145QTR. II 7,087 1,627 5,297 148 8,061 48 1,946 -- 24 1,197 11 -- 21,610 47,056QTR. III 16,519 841 544 -- 8,968 52 2,835 -- 36 2,560 20 61 20,756 53,192QTR. IV 27,048 893 791 -- 11,602 76 3,288 -- 59 -- 31 -- 23,367 67,155
SOURCE: Department of Statistics Summary Report of External Trade Statistics and unpublished reports.
90
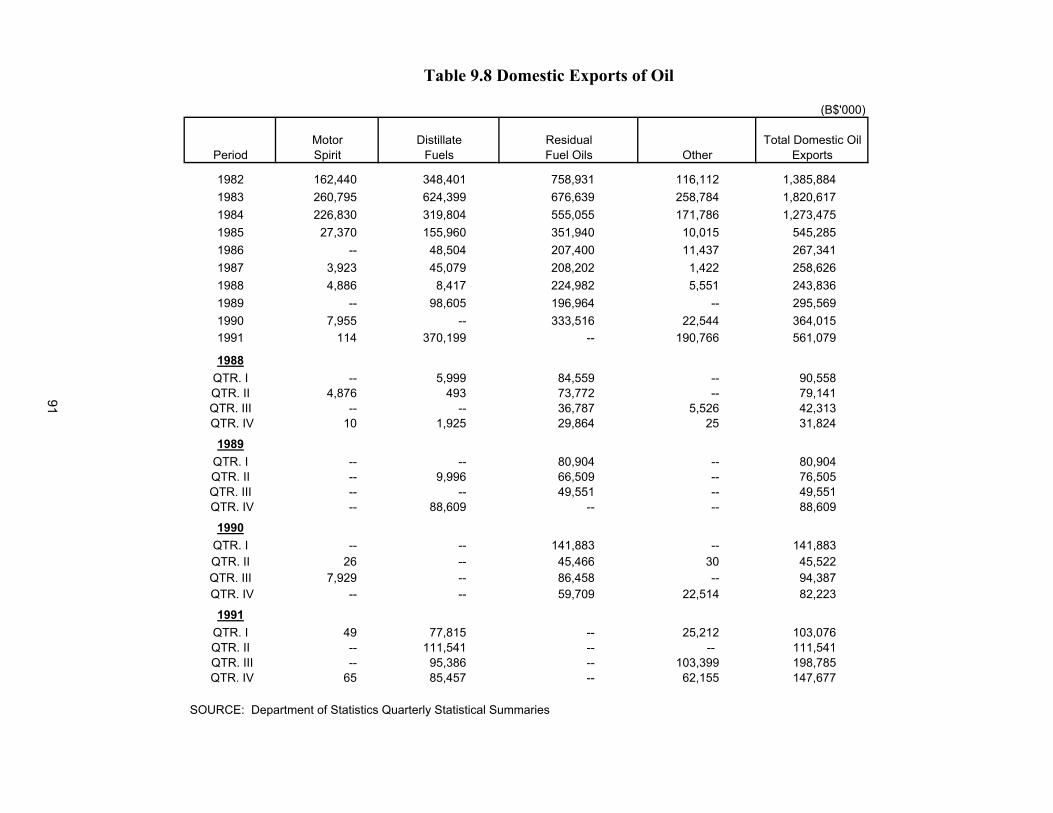
Table 9.8 Domestic Exports of Oil
(B$'000)
Motor Distillate Residual Total Domestic OilPeriod Spirit Fuels Fuel Oils Other Exports
1982 162,440 348,401 758,931 116,112 1,385,884 1983 260,795 624,399 676,639 258,784 1,820,617 1984 226,830 319,804 555,055 171,786 1,273,475 1985 27,370 155,960 351,940 10,015 545,285 1986 -- 48,504 207,400 11,437 267,3411987 3,923 45,079 208,202 1,422 258,6261988 4,886 8,417 224,982 5,551 243,8361989 -- 98,605 196,964 -- 295,5691990 7,955 -- 333,516 22,544 364,0151991 114 370,199 -- 190,766 561,079
1988 QTR. I -- 5,999 84,559 -- 90,558QTR. II 4,876 493 73,772 -- 79,141QTR. III -- -- 36,787 5,526 42,313 QTR. IV 10 1,925 29,864 25 31,824
1989 QTR. I -- -- 80,904 -- 80,904QTR. II -- 9,996 66,509 -- 76,505QTR. III -- -- 49,551 -- 49,551 QTR. IV -- 88,609 -- -- 88,609
1990 QTR. I -- -- 141,883 -- 141,883QTR. II 26 -- 45,466 30 45,522QTR. III 7,929 -- 86,458 -- 94,387 QTR. IV -- -- 59,709 22,514 82,223
1991QTR. I 49 77,815 -- 25,212 103,076QTR. II -- 111,541 -- -- 111,541 QTR. III -- 95,386 -- 103,399 198,785 QTR. IV 65 85,457 -- 62,155 147,677
SOURCE: Department of Statistics Quarterly Statistical Summaries
91
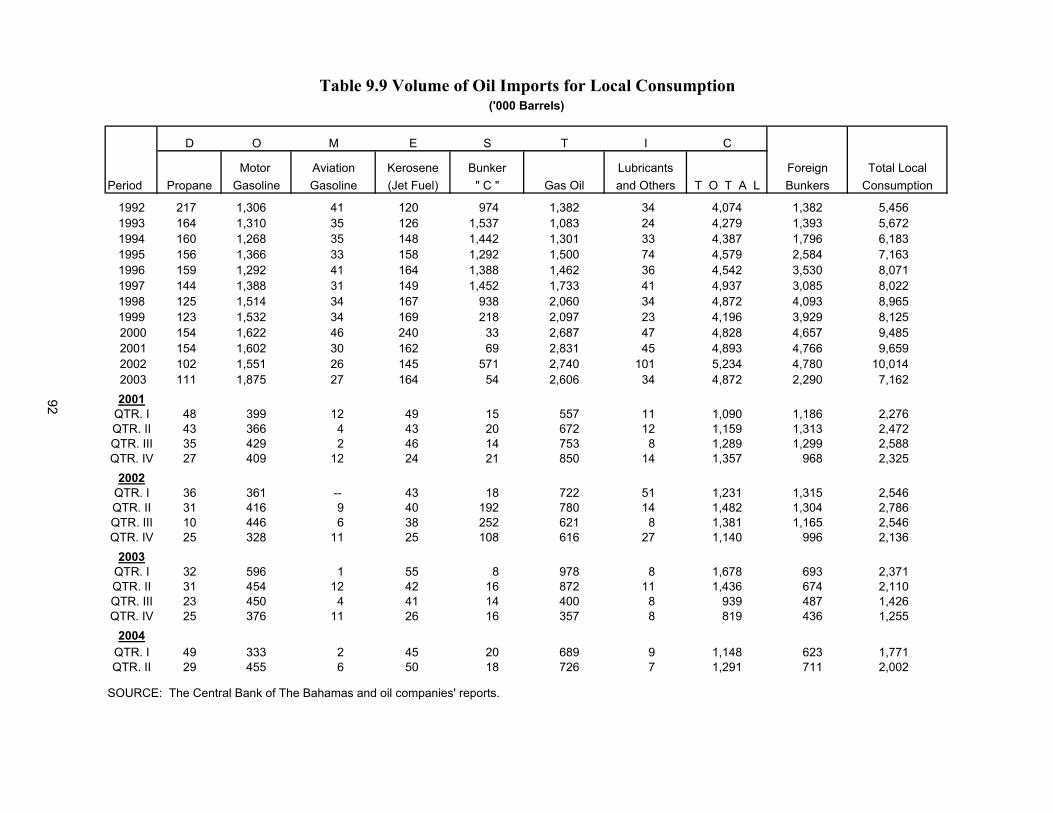
Table 9.9 Volume of Oil Imports for Local Consumption('000 Barrels)
D O M E S T I C
Motor Aviation Kerosene Bunker Lubricants Foreign Total LocalPeriod Propane Gasoline Gasoline (Jet Fuel) " C " Gas Oil and Others T O T A L Bunkers Consumption
1992 217 1,306 41 120 974 1,382 34 4,074 1,382 5,4561993 164 1,310 35 126 1,537 1,083 24 4,279 1,393 5,6721994 160 1,268 35 148 1,442 1,301 33 4,387 1,796 6,1831995 156 1,366 33 158 1,292 1,500 74 4,579 2,584 7,1631996 159 1,292 41 164 1,388 1,462 36 4,542 3,530 8,0711997 144 1,388 31 149 1,452 1,733 41 4,937 3,085 8,0221998 125 1,514 34 167 938 2,060 34 4,872 4,093 8,9651999 123 1,532 34 169 218 2,097 23 4,196 3,929 8,125 2000 154 1,622 46 240 33 2,687 47 4,828 4,657 9,485 2001 154 1,602 30 162 69 2,831 45 4,893 4,766 9,659 2002 102 1,551 26 145 571 2,740 101 5,234 4,780 10,014 2003 111 1,875 27 164 54 2,606 34 4,872 2,290 7,1622001
QTR. I 48 399 12 49 15 557 11 1,090 1,186 2,276QTR. II 43 366 4 43 20 672 12 1,159 1,313 2,472QTR. III 35 429 2 46 14 753 8 1,289 1,299 2,588QTR. IV 27 409 12 24 21 850 14 1,357 968 2,325
2002QTR. I 36 361 -- 43 18 722 51 1,231 1,315 2,546QTR. II 31 416 9 40 192 780 14 1,482 1,304 2,786QTR. III 10 446 6 38 252 621 8 1,381 1,165 2,546QTR. IV 25 328 11 25 108 616 27 1,140 996 2,136
2003QTR. I 32 596 1 55 8 978 8 1,678 693 2,371QTR. II 31 454 12 42 16 872 11 1,436 674 2,110QTR. III 23 450 4 41 14 400 8 939 487 1,426QTR. IV 25 376 11 26 16 357 8 819 436 1,255
2004QTR. I 49 333 2 45 20 689 9 1,148 623 1,771QTR. II 29 455 6 50 18 726 7 1,291 711 2,002
SOURCE: The Central Bank of The Bahamas and oil companies' reports.
92
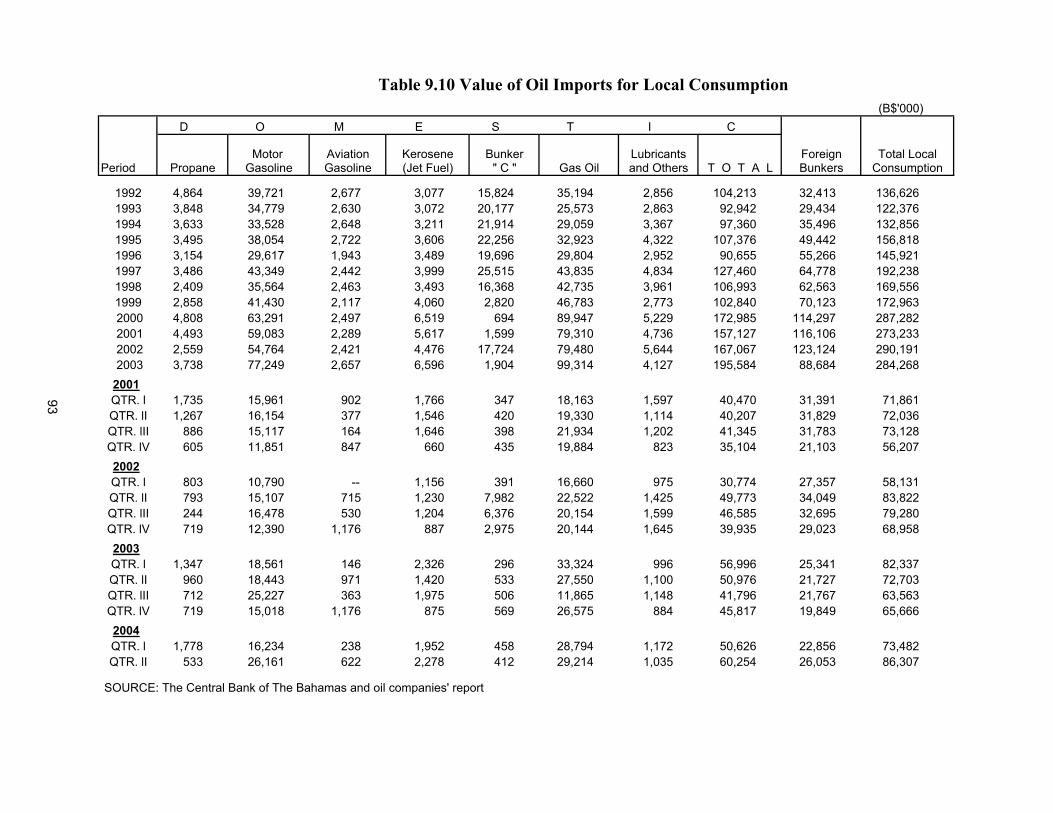
(B$'000)D O M E S T I C
Motor Aviation Kerosene Bunker Lubricants Foreign Total Local
Period Propane Gasoline Gasoline (Jet Fuel) " C " Gas Oil and Others T O T A L Bunkers Consumption
1992 4,864 39,721 2,677 3,077 15,824 35,194 2,856 104,213 32,413 136,6261993 3,848 34,779 2,630 3,072 20,177 25,573 2,863 92,942 29,434 122,3761994 3,633 33,528 2,648 3,211 21,914 29,059 3,367 97,360 35,496 132,8561995 3,495 38,054 2,722 3,606 22,256 32,923 4,322 107,376 49,442 156,8181996 3,154 29,617 1,943 3,489 19,696 29,804 2,952 90,655 55,266 145,9211997 3,486 43,349 2,442 3,999 25,515 43,835 4,834 127,460 64,778 192,2381998 2,409 35,564 2,463 3,493 16,368 42,735 3,961 106,993 62,563 169,5561999 2,858 41,430 2,117 4,060 2,820 46,783 2,773 102,840 70,123 172,963 2000 4,808 63,291 2,497 6,519 694 89,947 5,229 172,985 114,297 287,282 2001 4,493 59,083 2,289 5,617 1,599 79,310 4,736 157,127 116,106 273,233 2002 2,559 54,764 2,421 4,476 17,724 79,480 5,644 167,067 123,124 290,191 2003 3,738 77,249 2,657 6,596 1,904 99,314 4,127 195,584 88,684 284,2682001QTR. l 1,735 15,961 902 1,766 347 18,163 1,597 40,470 31,391 71,861QTR. lI 1,267 16,154 377 1,546 420 19,330 1,114 40,207 31,829 72,036QTR. lII 886 15,117 164 1,646 398 21,934 1,202 41,345 31,783 73,128QTR. lV 605 11,851 847 660 435 19,884 823 35,104 21,103 56,2072002QTR. l 803 10,790 -- 1,156 391 16,660 975 30,774 27,357 58,131QTR. lI 793 15,107 715 1,230 7,982 22,522 1,425 49,773 34,049 83,822QTR. lII 244 16,478 530 1,204 6,376 20,154 1,599 46,585 32,695 79,280QTR. lV 719 12,390 1,176 887 2,975 20,144 1,645 39,935 29,023 68,9582003QTR. l 1,347 18,561 146 2,326 296 33,324 996 56,996 25,341 82,337QTR. lI 960 18,443 971 1,420 533 27,550 1,100 50,976 21,727 72,703QTR. lII 712 25,227 363 1,975 506 11,865 1,148 41,796 21,767 63,563QTR. lV 719 15,018 1,176 875 569 26,575 884 45,817 19,849 65,6662004QTR. l 1,778 16,234 238 1,952 458 28,794 1,172 50,626 22,856 73,482QTR. lI 533 26,161 622 2,278 412 29,214 1,035 60,254 26,053 86,307
SOURCE: The Central Bank of The Bahamas and oil companies' report
Table 9.10 Value of Oil Imports for Local Consumption
93
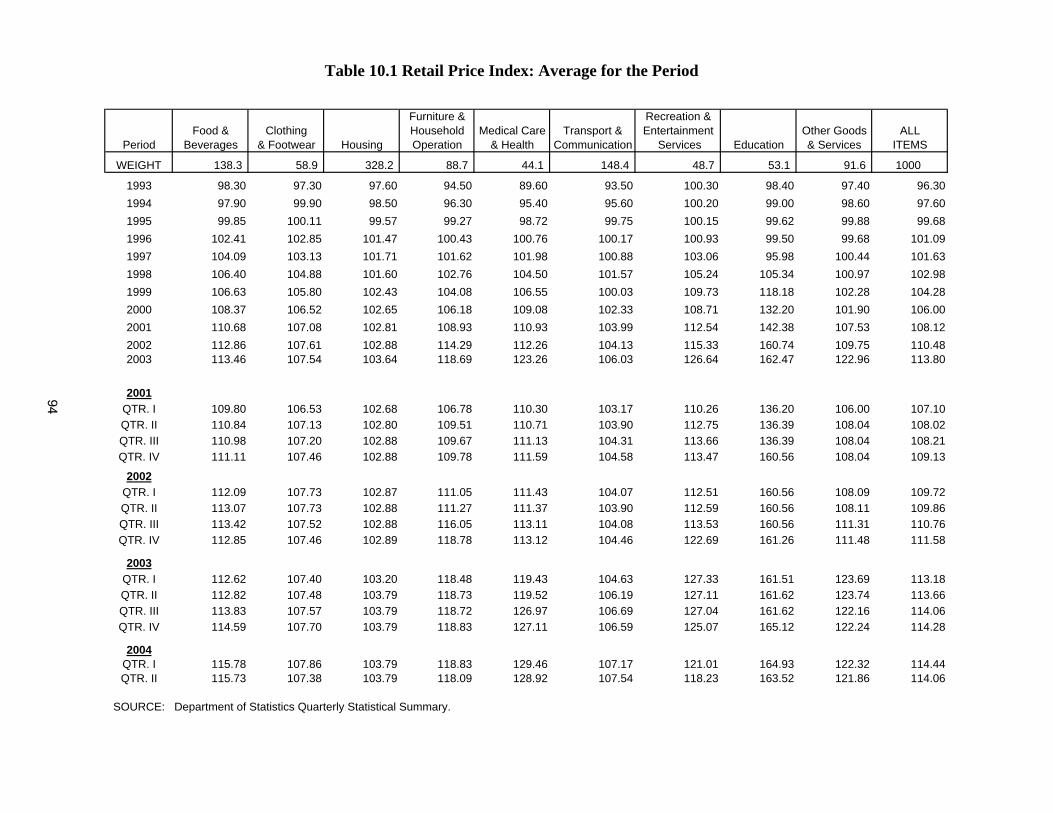
Table 10.1 Retail Price Index: Average for the Period
Furniture & Recreation &Food & Clothing Household Medical Care Transport & Entertainment Other Goods ALL
Period Beverages & Footwear Housing Operation & Health Communication Services Education & Services ITEMS
WEIGHT 138.3 58.9 328.2 88.7 44.1 148.4 48.7 53.1 91.6 1000
1993 98.30 97.30 97.60 94.50 89.60 93.50 100.30 98.40 97.40 96.301994 97.90 99.90 98.50 96.30 95.40 95.60 100.20 99.00 98.60 97.601995 99.85 100.11 99.57 99.27 98.72 99.75 100.15 99.62 99.88 99.681996 102.41 102.85 101.47 100.43 100.76 100.17 100.93 99.50 99.68 101.091997 104.09 103.13 101.71 101.62 101.98 100.88 103.06 95.98 100.44 101.631998 106.40 104.88 101.60 102.76 104.50 101.57 105.24 105.34 100.97 102.981999 106.63 105.80 102.43 104.08 106.55 100.03 109.73 118.18 102.28 104.282000 108.37 106.52 102.65 106.18 109.08 102.33 108.71 132.20 101.90 106.002001 110.68 107.08 102.81 108.93 110.93 103.99 112.54 142.38 107.53 108.122002 112.86 107.61 102.88 114.29 112.26 104.13 115.33 160.74 109.75 110.482003 113.46 107.54 103.64 118.69 123.26 106.03 126.64 162.47 122.96 113.80
2001QTR. I 109.80 106.53 102.68 106.78 110.30 103.17 110.26 136.20 106.00 107.10QTR. II 110.84 107.13 102.80 109.51 110.71 103.90 112.75 136.39 108.04 108.02QTR. III 110.98 107.20 102.88 109.67 111.13 104.31 113.66 136.39 108.04 108.21QTR. IV 111.11 107.46 102.88 109.78 111.59 104.58 113.47 160.56 108.04 109.13
2002QTR. I 112.09 107.73 102.87 111.05 111.43 104.07 112.51 160.56 108.09 109.72QTR. II 113.07 107.73 102.88 111.27 111.37 103.90 112.59 160.56 108.11 109.86QTR. III 113.42 107.52 102.88 116.05 113.11 104.08 113.53 160.56 111.31 110.76QTR. IV 112.85 107.46 102.89 118.78 113.12 104.46 122.69 161.26 111.48 111.58
2003QTR. I 112.62 107.40 103.20 118.48 119.43 104.63 127.33 161.51 123.69 113.18QTR. II 112.82 107.48 103.79 118.73 119.52 106.19 127.11 161.62 123.74 113.66QTR. III 113.83 107.57 103.79 118.72 126.97 106.69 127.04 161.62 122.16 114.06QTR. IV 114.59 107.70 103.79 118.83 127.11 106.59 125.07 165.12 122.24 114.28
2004QTR. I 115.78 107.86 103.79 118.83 129.46 107.17 121.01 164.93 122.32 114.44QTR. II 115.73 107.38 103.79 118.09 128.92 107.54 118.23 163.52 121.86 114.06
SOURCE: Department of Statistics Quarterly Statistical Summary.
94
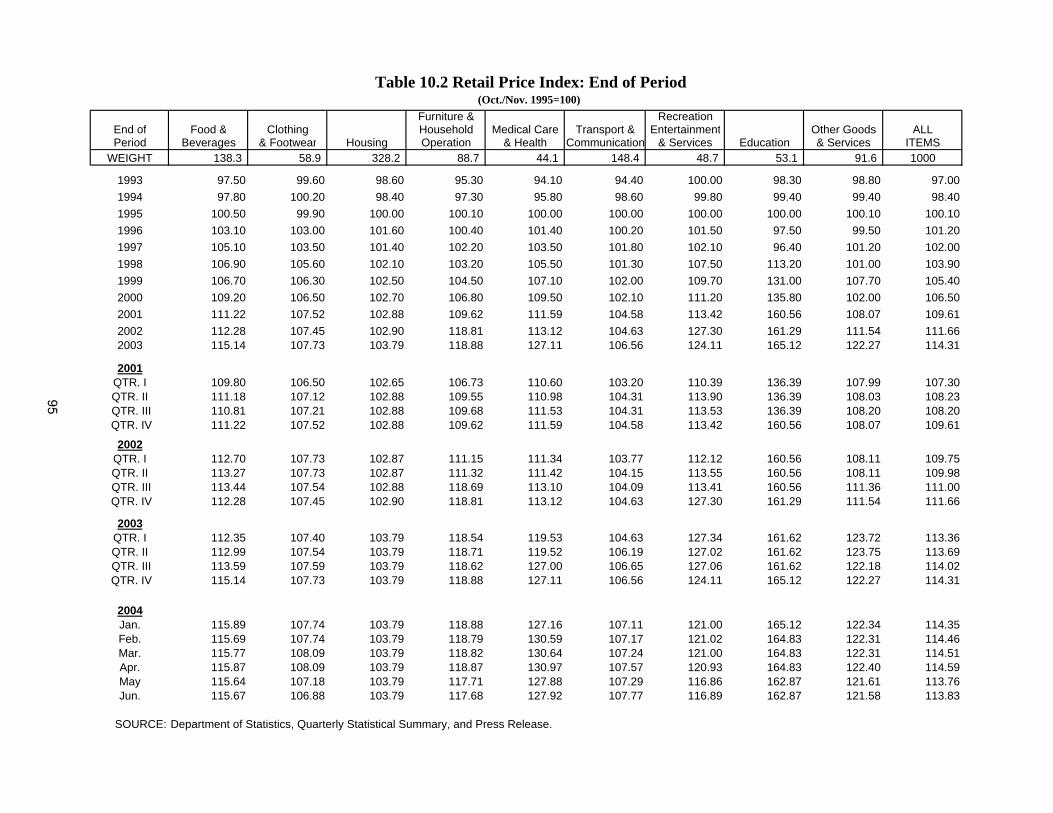
Table 10.2 Retail Price Index: End of Period (Oct./Nov. 1995=100)
Furniture & RecreationEnd of Food & Clothing Household Medical Care Transport & Entertainment Other Goods ALLPeriod Beverages & Footwear Housing Operation & Health Communication & Services Education & Services ITEMS
WEIGHT 138.3 58.9 328.2 88.7 44.1 148.4 48.7 53.1 91.6 1000
1993 97.50 99.60 98.60 95.30 94.10 94.40 100.00 98.30 98.80 97.001994 97.80 100.20 98.40 97.30 95.80 98.60 99.80 99.40 99.40 98.401995 100.50 99.90 100.00 100.10 100.00 100.00 100.00 100.00 100.10 100.101996 103.10 103.00 101.60 100.40 101.40 100.20 101.50 97.50 99.50 101.201997 105.10 103.50 101.40 102.20 103.50 101.80 102.10 96.40 101.20 102.001998 106.90 105.60 102.10 103.20 105.50 101.30 107.50 113.20 101.00 103.901999 106.70 106.30 102.50 104.50 107.10 102.00 109.70 131.00 107.70 105.402000 109.20 106.50 102.70 106.80 109.50 102.10 111.20 135.80 102.00 106.502001 111.22 107.52 102.88 109.62 111.59 104.58 113.42 160.56 108.07 109.612002 112.28 107.45 102.90 118.81 113.12 104.63 127.30 161.29 111.54 111.662003 115.14 107.73 103.79 118.88 127.11 106.56 124.11 165.12 122.27 114.31
2001QTR. I 109.80 106.50 102.65 106.73 110.60 103.20 110.39 136.39 107.99 107.30QTR. II 111.18 107.12 102.88 109.55 110.98 104.31 113.90 136.39 108.03 108.23
QTR. III 110.81 107.21 102.88 109.68 111.53 104.31 113.53 136.39 108.20 108.20 QTR. IV 111.22 107.52 102.88 109.62 111.59 104.58 113.42 160.56 108.07 109.61
2002QTR. I 112.70 107.73 102.87 111.15 111.34 103.77 112.12 160.56 108.11 109.75QTR. II 113.27 107.73 102.87 111.32 111.42 104.15 113.55 160.56 108.11 109.98
QTR. III 113.44 107.54 102.88 118.69 113.10 104.09 113.41 160.56 111.36 111.00 QTR. IV 112.28 107.45 102.90 118.81 113.12 104.63 127.30 161.29 111.54 111.66
2003QTR. I 112.35 107.40 103.79 118.54 119.53 104.63 127.34 161.62 123.72 113.36QTR. II 112.99 107.54 103.79 118.71 119.52 106.19 127.02 161.62 123.75 113.69
QTR. III 113.59 107.59 103.79 118.62 127.00 106.65 127.06 161.62 122.18 114.02 QTR. IV 115.14 107.73 103.79 118.88 127.11 106.56 124.11 165.12 122.27 114.31
2004Jan. 115.89 107.74 103.79 118.88 127.16 107.11 121.00 165.12 122.34 114.35Feb. 115.69 107.74 103.79 118.79 130.59 107.17 121.02 164.83 122.31 114.46Mar. 115.77 108.09 103.79 118.82 130.64 107.24 121.00 164.83 122.31 114.51Apr. 115.87 108.09 103.79 118.87 130.97 107.57 120.93 164.83 122.40 114.59May 115.64 107.18 103.79 117.71 127.88 107.29 116.86 162.87 121.61 113.76Jun. 115.67 106.88 103.79 117.68 127.92 107.77 116.89 162.87 121.58 113.83
SOURCE: Department of Statistics, Quarterly Statistical Summary, and Press Release.
95
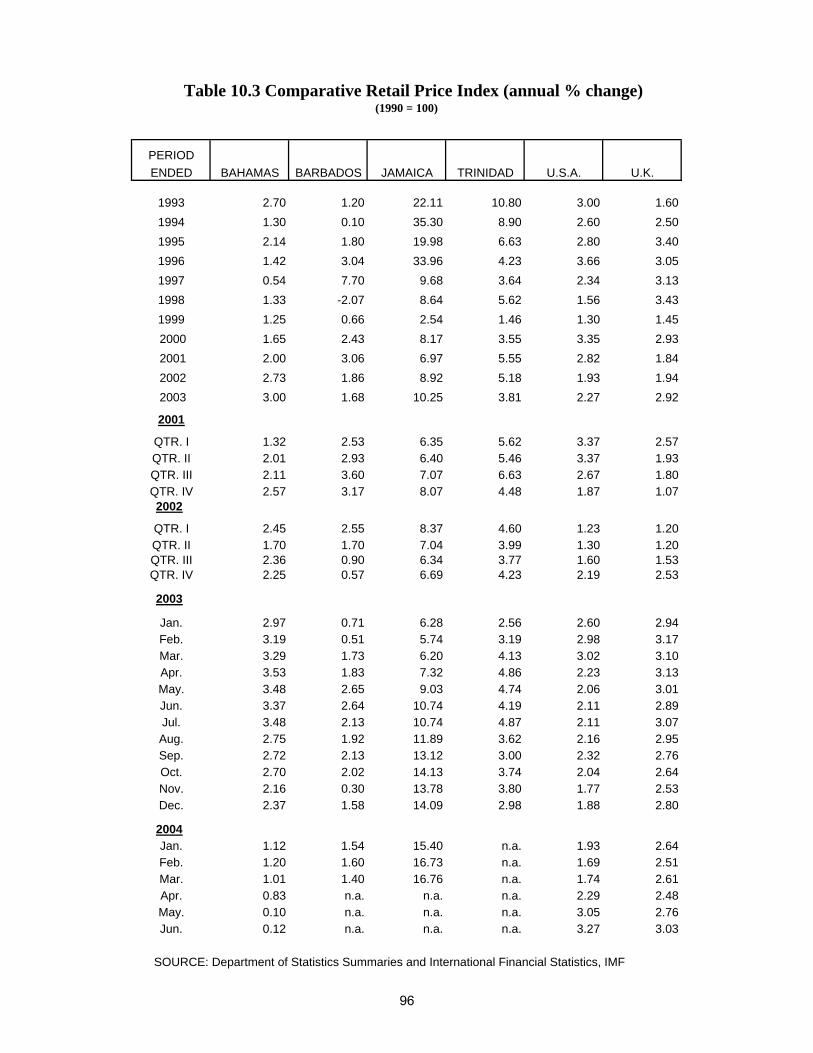
Table 10.3 Comparative Retail Price Index (annual % change)(1990 = 100)
PERIODENDED BAHAMAS BARBADOS JAMAICA TRINIDAD U.S.A. U.K.
1993 2.70 1.20 22.11 10.80 3.00 1.601994 1.30 0.10 35.30 8.90 2.60 2.501995 2.14 1.80 19.98 6.63 2.80 3.401996 1.42 3.04 33.96 4.23 3.66 3.051997 0.54 7.70 9.68 3.64 2.34 3.131998 1.33 -2.07 8.64 5.62 1.56 3.431999 1.25 0.66 2.54 1.46 1.30 1.45 2000 1.65 2.43 8.17 3.55 3.35 2.93 2001 2.00 3.06 6.97 5.55 2.82 1.84 2002 2.73 1.86 8.92 5.18 1.93 1.94 2003 3.00 1.68 10.25 3.81 2.27 2.92
2001
QTR. I 1.32 2.53 6.35 5.62 3.37 2.57QTR. II 2.01 2.93 6.40 5.46 3.37 1.93QTR. III 2.11 3.60 7.07 6.63 2.67 1.80QTR. IV 2.57 3.17 8.07 4.48 1.87 1.072002
QTR. I 2.45 2.55 8.37 4.60 1.23 1.20QTR. II 1.70 1.70 7.04 3.99 1.30 1.20QTR. III 2.36 0.90 6.34 3.77 1.60 1.53QTR. IV 2.25 0.57 6.69 4.23 2.19 2.53
2003
Jan. 2.97 0.71 6.28 2.56 2.60 2.94Feb. 3.19 0.51 5.74 3.19 2.98 3.17Mar. 3.29 1.73 6.20 4.13 3.02 3.10Apr. 3.53 1.83 7.32 4.86 2.23 3.13May. 3.48 2.65 9.03 4.74 2.06 3.01Jun. 3.37 2.64 10.74 4.19 2.11 2.89Jul. 3.48 2.13 10.74 4.87 2.11 3.07Aug. 2.75 1.92 11.89 3.62 2.16 2.95Sep. 2.72 2.13 13.12 3.00 2.32 2.76Oct. 2.70 2.02 14.13 3.74 2.04 2.64Nov. 2.16 0.30 13.78 3.80 1.77 2.53Dec. 2.37 1.58 14.09 2.98 1.88 2.80
2004Jan. 1.12 1.54 15.40 n.a. 1.93 2.64Feb. 1.20 1.60 16.73 n.a. 1.69 2.51Mar. 1.01 1.40 16.76 n.a. 1.74 2.61Apr. 0.83 n.a. n.a. n.a. 2.29 2.48May. 0.10 n.a. n.a. n.a. 3.05 2.76Jun. 0.12 n.a. n.a. n.a. 3.27 3.03
SOURCE: Department of Statistics Summaries and International Financial Statistics, IMF
96
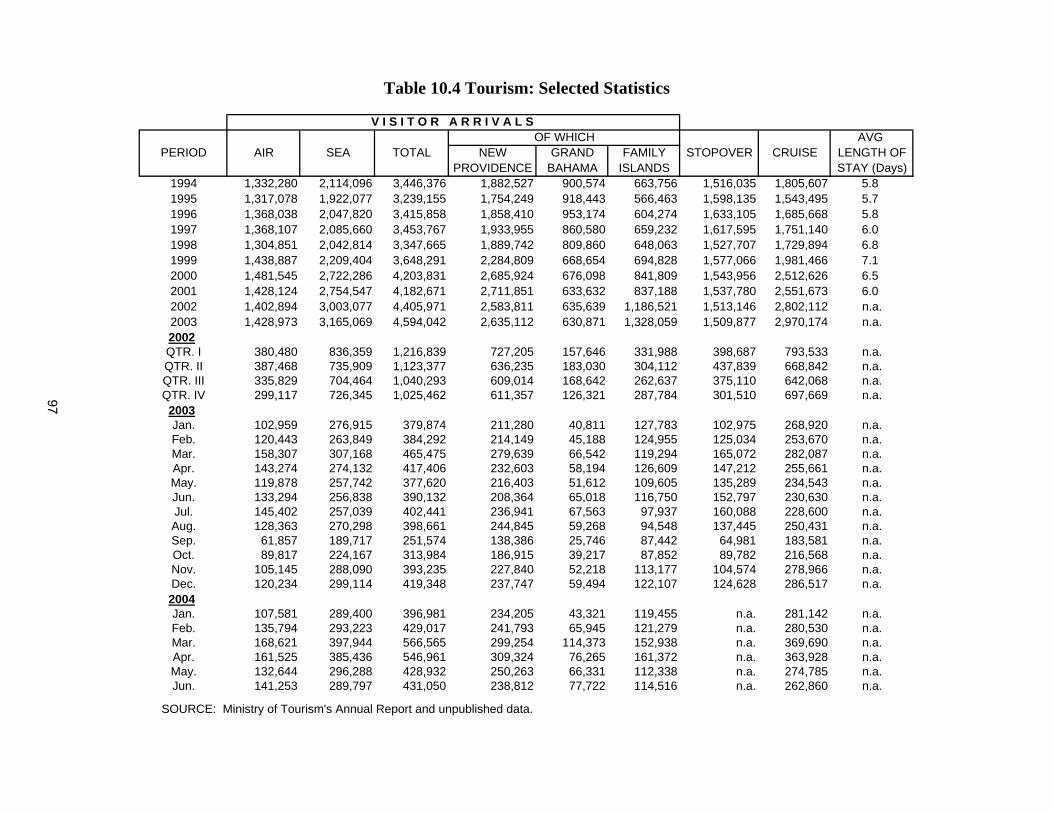
Table 10.4 Tourism: Selected Statistics
V I S I T O R A R R I V A L S OF WHICH AVG
PERIOD AIR SEA TOTAL NEW GRAND FAMILY STOPOVER CRUISE LENGTH OFPROVIDENCE BAHAMA ISLANDS STAY (Days)
1994 1,332,280 2,114,096 3,446,376 1,882,527 900,574 663,756 1,516,035 1,805,607 5.81995 1,317,078 1,922,077 3,239,155 1,754,249 918,443 566,463 1,598,135 1,543,495 5.71996 1,368,038 2,047,820 3,415,858 1,858,410 953,174 604,274 1,633,105 1,685,668 5.81997 1,368,107 2,085,660 3,453,767 1,933,955 860,580 659,232 1,617,595 1,751,140 6.01998 1,304,851 2,042,814 3,347,665 1,889,742 809,860 648,063 1,527,707 1,729,894 6.81999 1,438,887 2,209,404 3,648,291 2,284,809 668,654 694,828 1,577,066 1,981,466 7.12000 1,481,545 2,722,286 4,203,831 2,685,924 676,098 841,809 1,543,956 2,512,626 6.52001 1,428,124 2,754,547 4,182,671 2,711,851 633,632 837,188 1,537,780 2,551,673 6.02002 1,402,894 3,003,077 4,405,971 2,583,811 635,639 1,186,521 1,513,146 2,802,112 n.a.2003 1,428,973 3,165,069 4,594,042 2,635,112 630,871 1,328,059 1,509,877 2,970,174 n.a.2002QTR. I 380,480 836,359 1,216,839 727,205 157,646 331,988 398,687 793,533 n.a.QTR. II 387,468 735,909 1,123,377 636,235 183,030 304,112 437,839 668,842 n.a.QTR. III 335,829 704,464 1,040,293 609,014 168,642 262,637 375,110 642,068 n.a.QTR. IV 299,117 726,345 1,025,462 611,357 126,321 287,784 301,510 697,669 n.a.2003Jan. 102,959 276,915 379,874 211,280 40,811 127,783 102,975 268,920 n.a.Feb. 120,443 263,849 384,292 214,149 45,188 124,955 125,034 253,670 n.a.Mar. 158,307 307,168 465,475 279,639 66,542 119,294 165,072 282,087 n.a.Apr. 143,274 274,132 417,406 232,603 58,194 126,609 147,212 255,661 n.a.May. 119,878 257,742 377,620 216,403 51,612 109,605 135,289 234,543 n.a.Jun. 133,294 256,838 390,132 208,364 65,018 116,750 152,797 230,630 n.a.Jul. 145,402 257,039 402,441 236,941 67,563 97,937 160,088 228,600 n.a.Aug. 128,363 270,298 398,661 244,845 59,268 94,548 137,445 250,431 n.a.Sep. 61,857 189,717 251,574 138,386 25,746 87,442 64,981 183,581 n.a.Oct. 89,817 224,167 313,984 186,915 39,217 87,852 89,782 216,568 n.a.Nov. 105,145 288,090 393,235 227,840 52,218 113,177 104,574 278,966 n.a.Dec. 120,234 299,114 419,348 237,747 59,494 122,107 124,628 286,517 n.a.2004Jan. 107,581 289,400 396,981 234,205 43,321 119,455 n.a. 281,142 n.a.Feb. 135,794 293,223 429,017 241,793 65,945 121,279 n.a. 280,530 n.a.Mar. 168,621 397,944 566,565 299,254 114,373 152,938 n.a. 369,690 n.a.Apr. 161,525 385,436 546,961 309,324 76,265 161,372 n.a. 363,928 n.a.May. 132,644 296,288 428,932 250,263 66,331 112,338 n.a. 274,785 n.a.Jun. 141,253 289,797 431,050 238,812 77,722 114,516 n.a. 262,860 n.a.
SOURCE: Ministry of Tourism's Annual Report and unpublished data.
97
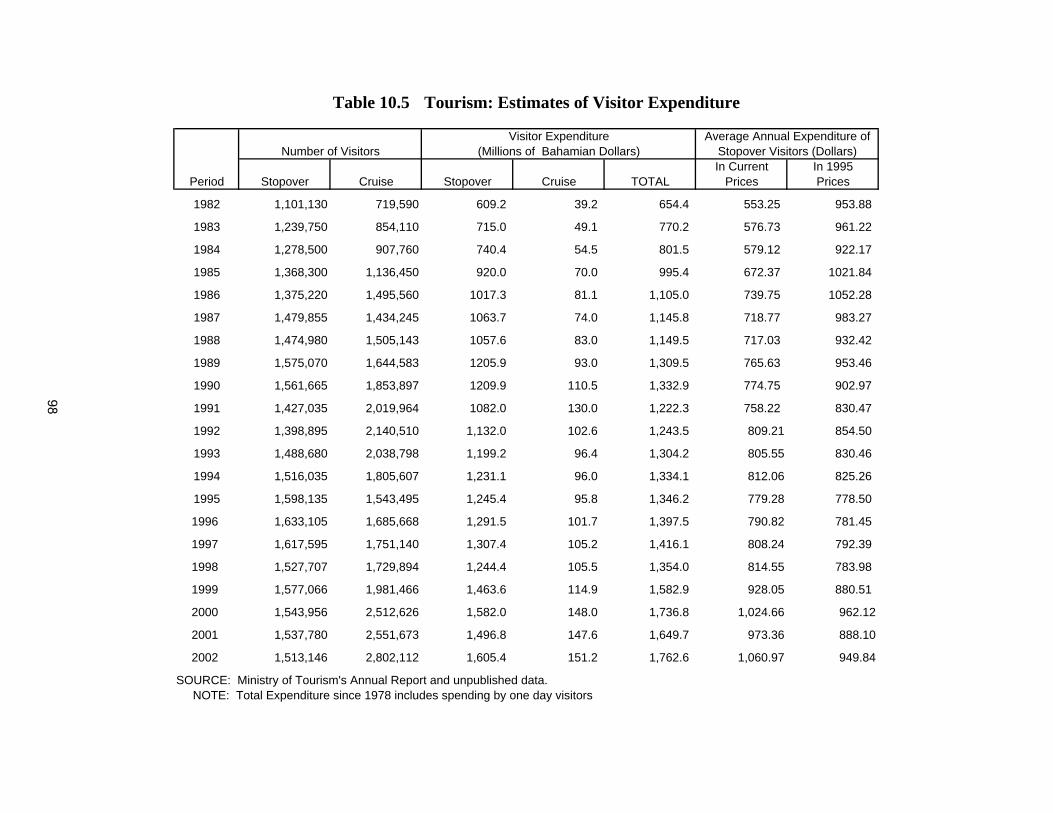
Table 10.5 Tourism: Estimates of Visitor Expenditure
In Current In 1995Stopover Cruise Stopover Cruise TOTAL Prices Prices
1982 1,101,130 719,590 609.2 39.2 654.4 553.25 953.88
1983 1,239,750 854,110 715.0 49.1 770.2 576.73 961.22
1984 1,278,500 907,760 740.4 54.5 801.5 579.12 922.17
1985 1,368,300 1,136,450 920.0 70.0 995.4 672.37 1021.84
1986 1,375,220 1,495,560 1017.3 81.1 1,105.0 739.75 1052.28
1987 1,479,855 1,434,245 1063.7 74.0 1,145.8 718.77 983.27
1988 1,474,980 1,505,143 1057.6 83.0 1,149.5 717.03 932.42
1989 1,575,070 1,644,583 1205.9 93.0 1,309.5 765.63 953.46
1990 1,561,665 1,853,897 1209.9 110.5 1,332.9 774.75 902.97
1991 1,427,035 2,019,964 1082.0 130.0 1,222.3 758.22 830.47
1992 1,398,895 2,140,510 1,132.0 102.6 1,243.5 809.21 854.50
1993 1,488,680 2,038,798 1,199.2 96.4 1,304.2 805.55 830.46
1994 1,516,035 1,805,607 1,231.1 96.0 1,334.1 812.06 825.26
1995 1,598,135 1,543,495 1,245.4 95.8 1,346.2 779.28 778.50
1996 1,633,105 1,685,668 1,291.5 101.7 1,397.5 790.82 781.45
1997 1,617,595 1,751,140 1,307.4 105.2 1,416.1 808.24 792.39
1998 1,527,707 1,729,894 1,244.4 105.5 1,354.0 814.55 783.98
1999 1,577,066 1,981,466 1,463.6 114.9 1,582.9 928.05 880.51
2000 1,543,956 2,512,626 1,582.0 148.0 1,736.8 1,024.66 962.12
2001 1,537,780 2,551,673 1,496.8 147.6 1,649.7 973.36 888.10
2002 1,513,146 2,802,112 1,605.4 151.2 1,762.6 1,060.97 949.84
SOURCE: Ministry of Tourism's Annual Report and unpublished data. NOTE: Total Expenditure since 1978 includes spending by one day visitors
Average Annual Expenditure ofStopover Visitors (Dollars)
Period
Visitor Expenditure(Millions of Bahamian Dollars)Number of Visitors
98
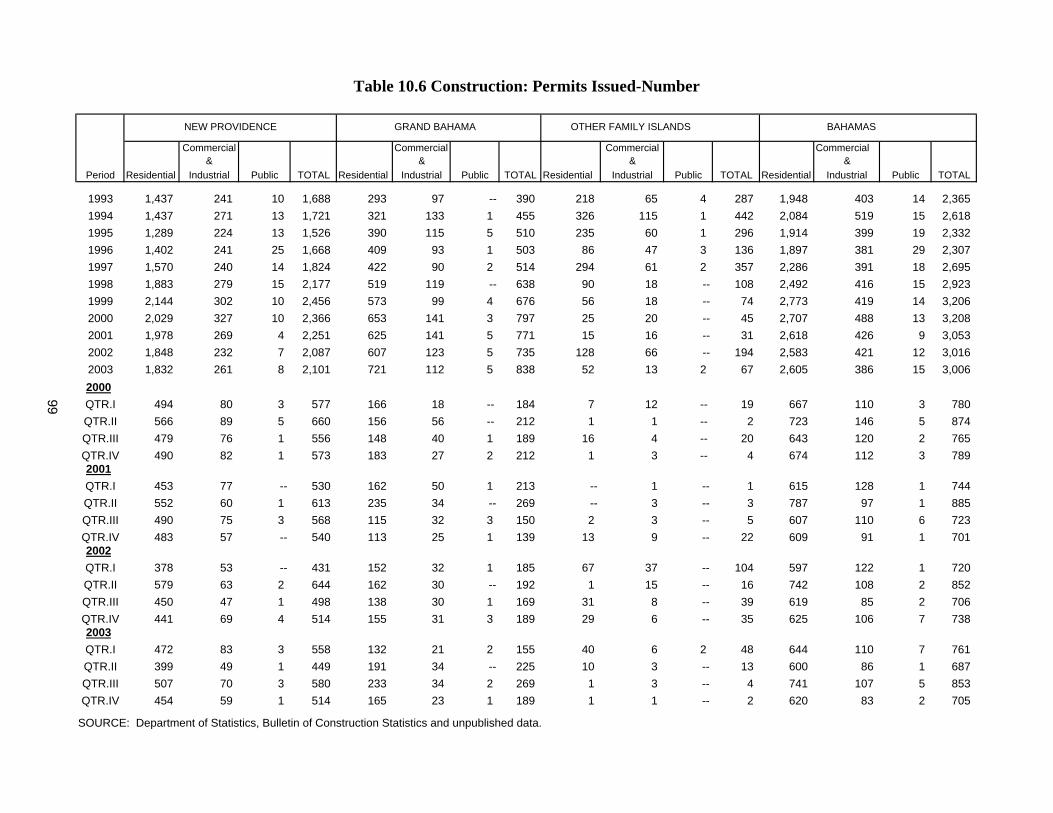
Table 10.6 Construction: Permits Issued-Number
NEW PROVIDENCE GRAND BAHAMA OTHER FAMILY ISLANDS BAHAMAS
Commercial Commercial Commercial Commercial & & & &
Period Residential Industrial Public TOTAL Residential Industrial Public TOTAL Residential Industrial Public TOTAL Residential Industrial Public TOTAL
1993 1,437 241 10 1,688 293 97 -- 390 218 65 4 287 1,948 403 14 2,3651994 1,437 271 13 1,721 321 133 1 455 326 115 1 442 2,084 519 15 2,6181995 1,289 224 13 1,526 390 115 5 510 235 60 1 296 1,914 399 19 2,3321996 1,402 241 25 1,668 409 93 1 503 86 47 3 136 1,897 381 29 2,3071997 1,570 240 14 1,824 422 90 2 514 294 61 2 357 2,286 391 18 2,6951998 1,883 279 15 2,177 519 119 -- 638 90 18 -- 108 2,492 416 15 2,9231999 2,144 302 10 2,456 573 99 4 676 56 18 -- 74 2,773 419 14 3,2062000 2,029 327 10 2,366 653 141 3 797 25 20 -- 45 2,707 488 13 3,2082001 1,978 269 4 2,251 625 141 5 771 15 16 -- 31 2,618 426 9 3,0532002 1,848 232 7 2,087 607 123 5 735 128 66 -- 194 2,583 421 12 3,0162003 1,832 261 8 2,101 721 112 5 838 52 13 2 67 2,605 386 15 3,0062000QTR.I 494 80 3 577 166 18 -- 184 7 12 -- 19 667 110 3 780QTR.II 566 89 5 660 156 56 -- 212 1 1 -- 2 723 146 5 874QTR.III 479 76 1 556 148 40 1 189 16 4 -- 20 643 120 2 765QTR.IV 490 82 1 573 183 27 2 212 1 3 -- 4 674 112 3 7892001QTR.I 453 77 -- 530 162 50 1 213 -- 1 -- 1 615 128 1 744QTR.II 552 60 1 613 235 34 -- 269 -- 3 -- 3 787 97 1 885QTR.III 490 75 3 568 115 32 3 150 2 3 -- 5 607 110 6 723QTR.IV 483 57 -- 540 113 25 1 139 13 9 -- 22 609 91 1 7012002QTR.I 378 53 -- 431 152 32 1 185 67 37 -- 104 597 122 1 720QTR.II 579 63 2 644 162 30 -- 192 1 15 -- 16 742 108 2 852QTR.III 450 47 1 498 138 30 1 169 31 8 -- 39 619 85 2 706QTR.IV 441 69 4 514 155 31 3 189 29 6 -- 35 625 106 7 7382003QTR.I 472 83 3 558 132 21 2 155 40 6 2 48 644 110 7 761QTR.II 399 49 1 449 191 34 -- 225 10 3 -- 13 600 86 1 687QTR.III 507 70 3 580 233 34 2 269 1 3 -- 4 741 107 5 853QTR.IV 454 59 1 514 165 23 1 189 1 1 -- 2 620 83 2 705
SOURCE: Department of Statistics, Bulletin of Construction Statistics and unpublished data.
99
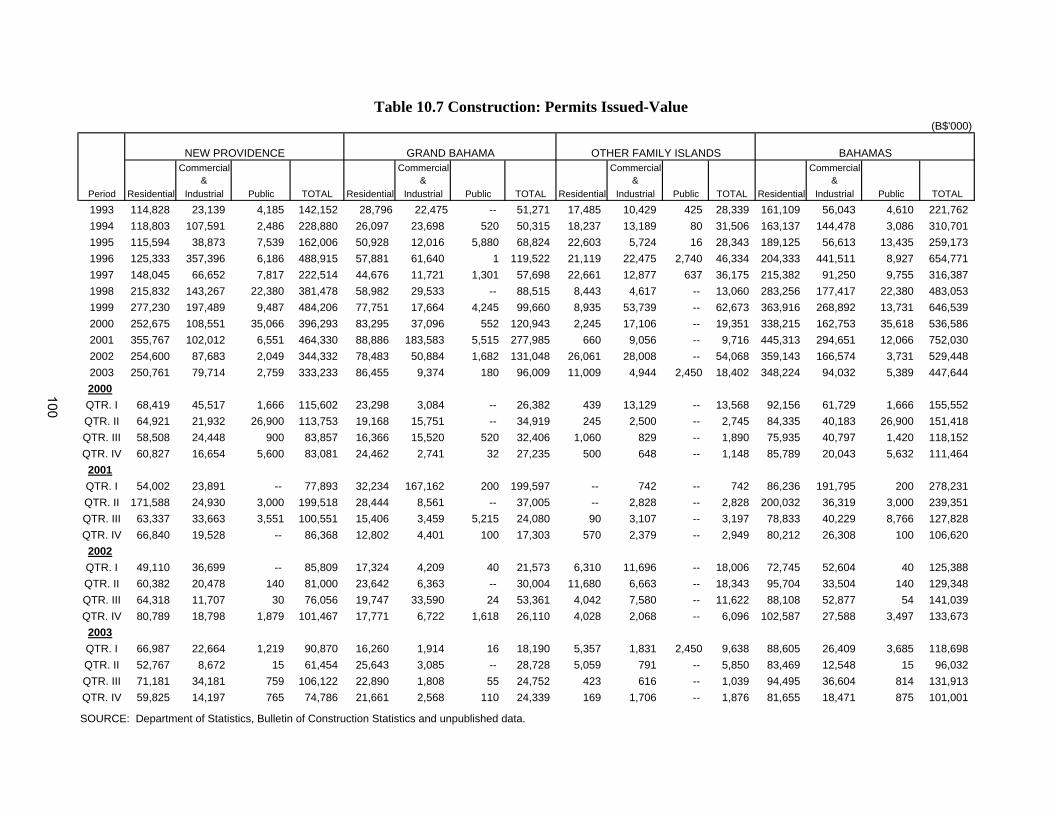
Table 10.7 Construction: Permits Issued-Value(B$'000)
NEW PROVIDENCE GRAND BAHAMA OTHER FAMILY ISLANDS BAHAMAS Commercial Commercial Commercial Commercial
& & & & Period Residential Industrial Public TOTAL Residential Industrial Public TOTAL Residential Industrial Public TOTAL Residential Industrial Public TOTAL
1993 114,828 23,139 4,185 142,152 28,796 22,475 -- 51,271 17,485 10,429 425 28,339 161,109 56,043 4,610 221,7621994 118,803 107,591 2,486 228,880 26,097 23,698 520 50,315 18,237 13,189 80 31,506 163,137 144,478 3,086 310,7011995 115,594 38,873 7,539 162,006 50,928 12,016 5,880 68,824 22,603 5,724 16 28,343 189,125 56,613 13,435 259,1731996 125,333 357,396 6,186 488,915 57,881 61,640 1 119,522 21,119 22,475 2,740 46,334 204,333 441,511 8,927 654,7711997 148,045 66,652 7,817 222,514 44,676 11,721 1,301 57,698 22,661 12,877 637 36,175 215,382 91,250 9,755 316,3871998 215,832 143,267 22,380 381,478 58,982 29,533 -- 88,515 8,443 4,617 -- 13,060 283,256 177,417 22,380 483,0531999 277,230 197,489 9,487 484,206 77,751 17,664 4,245 99,660 8,935 53,739 -- 62,673 363,916 268,892 13,731 646,5392000 252,675 108,551 35,066 396,293 83,295 37,096 552 120,943 2,245 17,106 -- 19,351 338,215 162,753 35,618 536,5862001 355,767 102,012 6,551 464,330 88,886 183,583 5,515 277,985 660 9,056 -- 9,716 445,313 294,651 12,066 752,0302002 254,600 87,683 2,049 344,332 78,483 50,884 1,682 131,048 26,061 28,008 -- 54,068 359,143 166,574 3,731 529,4482003 250,761 79,714 2,759 333,233 86,455 9,374 180 96,009 11,009 4,944 2,450 18,402 348,224 94,032 5,389 447,6442000QTR. I 68,419 45,517 1,666 115,602 23,298 3,084 -- 26,382 439 13,129 -- 13,568 92,156 61,729 1,666 155,552QTR. II 64,921 21,932 26,900 113,753 19,168 15,751 -- 34,919 245 2,500 -- 2,745 84,335 40,183 26,900 151,418QTR. III 58,508 24,448 900 83,857 16,366 15,520 520 32,406 1,060 829 -- 1,890 75,935 40,797 1,420 118,152QTR. IV 60,827 16,654 5,600 83,081 24,462 2,741 32 27,235 500 648 -- 1,148 85,789 20,043 5,632 111,4642001QTR. I 54,002 23,891 -- 77,893 32,234 167,162 200 199,597 -- 742 -- 742 86,236 191,795 200 278,231QTR. II 171,588 24,930 3,000 199,518 28,444 8,561 -- 37,005 -- 2,828 -- 2,828 200,032 36,319 3,000 239,351QTR. III 63,337 33,663 3,551 100,551 15,406 3,459 5,215 24,080 90 3,107 -- 3,197 78,833 40,229 8,766 127,828QTR. IV 66,840 19,528 -- 86,368 12,802 4,401 100 17,303 570 2,379 -- 2,949 80,212 26,308 100 106,6202002QTR. I 49,110 36,699 -- 85,809 17,324 4,209 40 21,573 6,310 11,696 -- 18,006 72,745 52,604 40 125,388QTR. II 60,382 20,478 140 81,000 23,642 6,363 -- 30,004 11,680 6,663 -- 18,343 95,704 33,504 140 129,348QTR. III 64,318 11,707 30 76,056 19,747 33,590 24 53,361 4,042 7,580 -- 11,622 88,108 52,877 54 141,039QTR. IV 80,789 18,798 1,879 101,467 17,771 6,722 1,618 26,110 4,028 2,068 -- 6,096 102,587 27,588 3,497 133,6732003QTR. I 66,987 22,664 1,219 90,870 16,260 1,914 16 18,190 5,357 1,831 2,450 9,638 88,605 26,409 3,685 118,698QTR. II 52,767 8,672 15 61,454 25,643 3,085 -- 28,728 5,059 791 -- 5,850 83,469 12,548 15 96,032QTR. III 71,181 34,181 759 106,122 22,890 1,808 55 24,752 423 616 -- 1,039 94,495 36,604 814 131,913QTR. IV 59,825 14,197 765 74,786 21,661 2,568 110 24,339 169 1,706 -- 1,876 81,655 18,471 875 101,001
SOURCE: Department of Statistics, Bulletin of Construction Statistics and unpublished data.
100
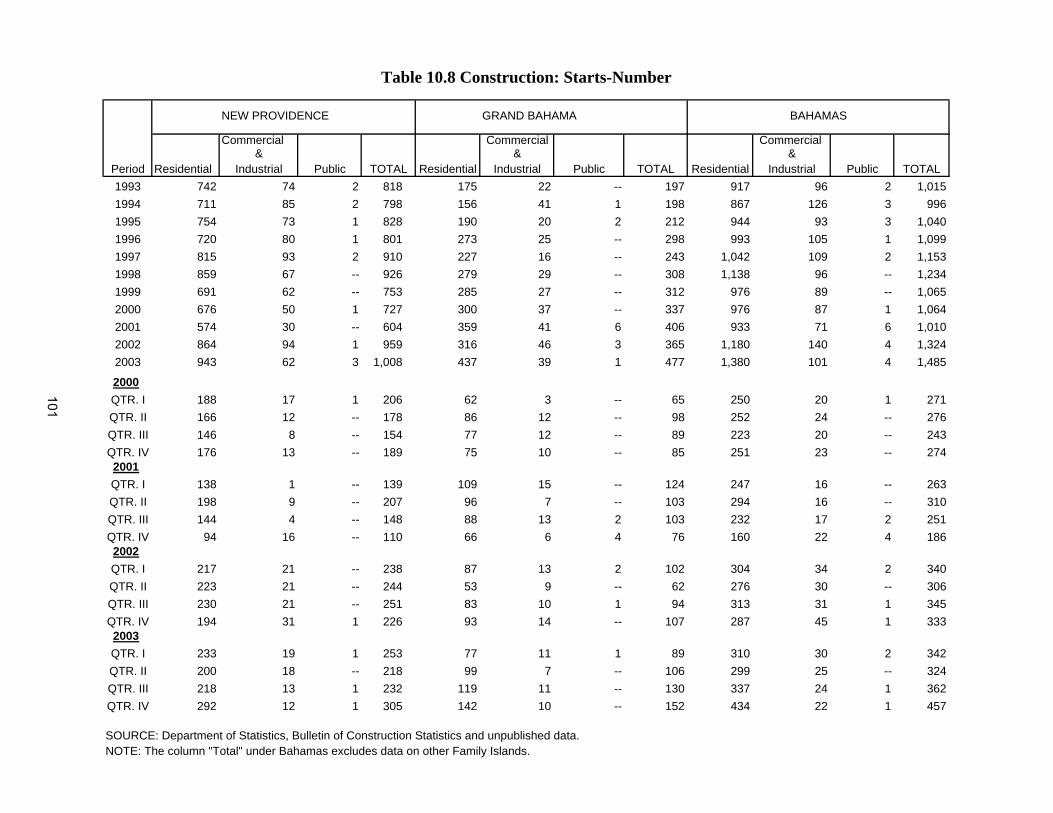
Table 10.8 Construction: Starts-Number
NEW PROVIDENCE GRAND BAHAMA BAHAMAS
Commercial Commercial Commercial & & &
Period Residential Industrial Public TOTAL Residential Industrial Public TOTAL Residential Industrial Public TOTAL1993 742 74 2 818 175 22 -- 197 917 96 2 1,0151994 711 85 2 798 156 41 1 198 867 126 3 9961995 754 73 1 828 190 20 2 212 944 93 3 1,0401996 720 80 1 801 273 25 -- 298 993 105 1 1,0991997 815 93 2 910 227 16 -- 243 1,042 109 2 1,1531998 859 67 -- 926 279 29 -- 308 1,138 96 -- 1,2341999 691 62 -- 753 285 27 -- 312 976 89 -- 1,0652000 676 50 1 727 300 37 -- 337 976 87 1 1,0642001 574 30 -- 604 359 41 6 406 933 71 6 1,0102002 864 94 1 959 316 46 3 365 1,180 140 4 1,3242003 943 62 3 1,008 437 39 1 477 1,380 101 4 1,485
2000QTR. I 188 17 1 206 62 3 -- 65 250 20 1 271QTR. II 166 12 -- 178 86 12 -- 98 252 24 -- 276QTR. III 146 8 -- 154 77 12 -- 89 223 20 -- 243QTR. IV 176 13 -- 189 75 10 -- 85 251 23 -- 2742001QTR. I 138 1 -- 139 109 15 -- 124 247 16 -- 263QTR. II 198 9 -- 207 96 7 -- 103 294 16 -- 310QTR. III 144 4 -- 148 88 13 2 103 232 17 2 251QTR. IV 94 16 -- 110 66 6 4 76 160 22 4 1862002QTR. I 217 21 -- 238 87 13 2 102 304 34 2 340QTR. II 223 21 -- 244 53 9 -- 62 276 30 -- 306QTR. III 230 21 -- 251 83 10 1 94 313 31 1 345QTR. IV 194 31 1 226 93 14 -- 107 287 45 1 3332003QTR. I 233 19 1 253 77 11 1 89 310 30 2 342QTR. II 200 18 -- 218 99 7 -- 106 299 25 -- 324QTR. III 218 13 1 232 119 11 -- 130 337 24 1 362QTR. IV 292 12 1 305 142 10 -- 152 434 22 1 457
SOURCE: Department of Statistics, Bulletin of Construction Statistics and unpublished data.NOTE: The column "Total" under Bahamas excludes data on other Family Islands.
101
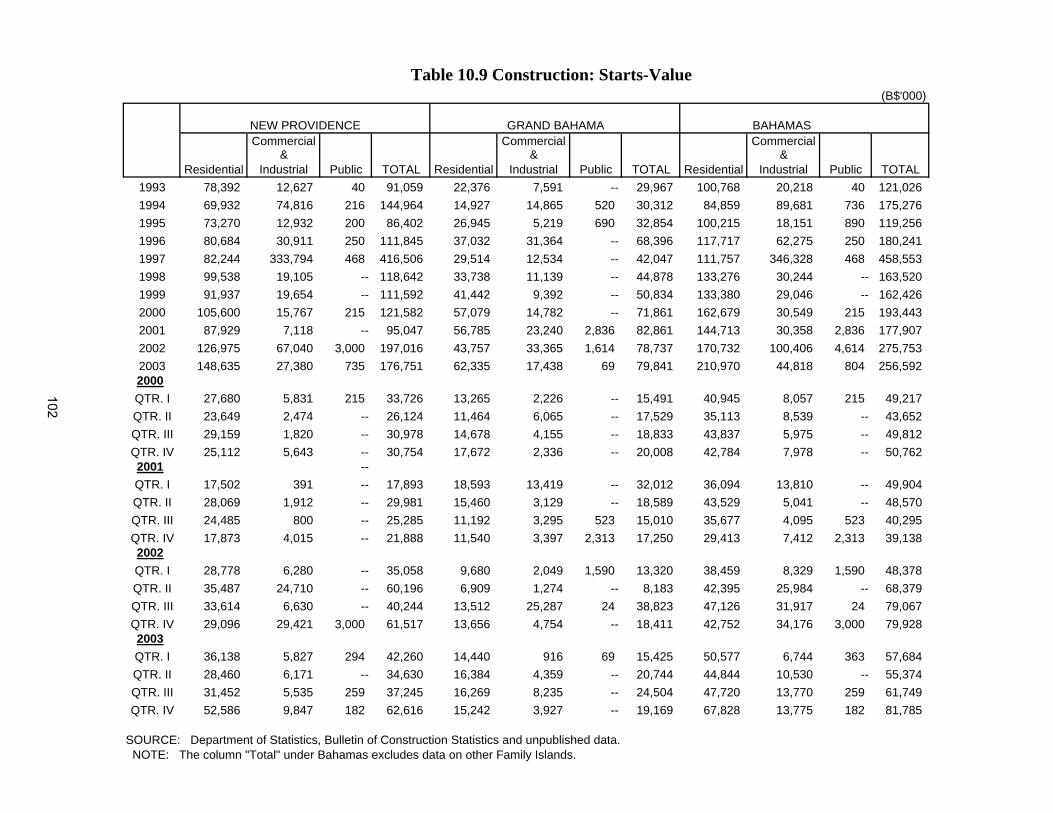
Table 10.9 Construction: Starts-Value(B$'000)
NEW PROVIDENCE GRAND BAHAMA BAHAMAS Commercial Commercial Commercial
& & & Residential Industrial Public TOTAL Residential Industrial Public TOTAL Residential Industrial Public TOTAL
1993 78,392 12,627 40 91,059 22,376 7,591 -- 29,967 100,768 20,218 40 121,0261994 69,932 74,816 216 144,964 14,927 14,865 520 30,312 84,859 89,681 736 175,2761995 73,270 12,932 200 86,402 26,945 5,219 690 32,854 100,215 18,151 890 119,2561996 80,684 30,911 250 111,845 37,032 31,364 -- 68,396 117,717 62,275 250 180,2411997 82,244 333,794 468 416,506 29,514 12,534 -- 42,047 111,757 346,328 468 458,5531998 99,538 19,105 -- 118,642 33,738 11,139 -- 44,878 133,276 30,244 -- 163,5201999 91,937 19,654 -- 111,592 41,442 9,392 -- 50,834 133,380 29,046 -- 162,4262000 105,600 15,767 215 121,582 57,079 14,782 -- 71,861 162,679 30,549 215 193,4432001 87,929 7,118 -- 95,047 56,785 23,240 2,836 82,861 144,713 30,358 2,836 177,9072002 126,975 67,040 3,000 197,016 43,757 33,365 1,614 78,737 170,732 100,406 4,614 275,7532003 148,635 27,380 735 176,751 62,335 17,438 69 79,841 210,970 44,818 804 256,5922000QTR. I 27,680 5,831 215 33,726 13,265 2,226 -- 15,491 40,945 8,057 215 49,217QTR. II 23,649 2,474 -- 26,124 11,464 6,065 -- 17,529 35,113 8,539 -- 43,652QTR. III 29,159 1,820 -- 30,978 14,678 4,155 -- 18,833 43,837 5,975 -- 49,812QTR. IV 25,112 5,643 -- 30,754 17,672 2,336 -- 20,008 42,784 7,978 -- 50,7622001 --QTR. I 17,502 391 -- 17,893 18,593 13,419 -- 32,012 36,094 13,810 -- 49,904QTR. II 28,069 1,912 -- 29,981 15,460 3,129 -- 18,589 43,529 5,041 -- 48,570QTR. III 24,485 800 -- 25,285 11,192 3,295 523 15,010 35,677 4,095 523 40,295QTR. IV 17,873 4,015 -- 21,888 11,540 3,397 2,313 17,250 29,413 7,412 2,313 39,1382002QTR. I 28,778 6,280 -- 35,058 9,680 2,049 1,590 13,320 38,459 8,329 1,590 48,378QTR. II 35,487 24,710 -- 60,196 6,909 1,274 -- 8,183 42,395 25,984 -- 68,379QTR. III 33,614 6,630 -- 40,244 13,512 25,287 24 38,823 47,126 31,917 24 79,067QTR. IV 29,096 29,421 3,000 61,517 13,656 4,754 -- 18,411 42,752 34,176 3,000 79,9282003QTR. I 36,138 5,827 294 42,260 14,440 916 69 15,425 50,577 6,744 363 57,684QTR. II 28,460 6,171 -- 34,630 16,384 4,359 -- 20,744 44,844 10,530 -- 55,374QTR. III 31,452 5,535 259 37,245 16,269 8,235 -- 24,504 47,720 13,770 259 61,749QTR. IV 52,586 9,847 182 62,616 15,242 3,927 -- 19,169 67,828 13,775 182 81,785
SOURCE: Department of Statistics, Bulletin of Construction Statistics and unpublished data. NOTE: The column "Total" under Bahamas excludes data on other Family Islands.
102
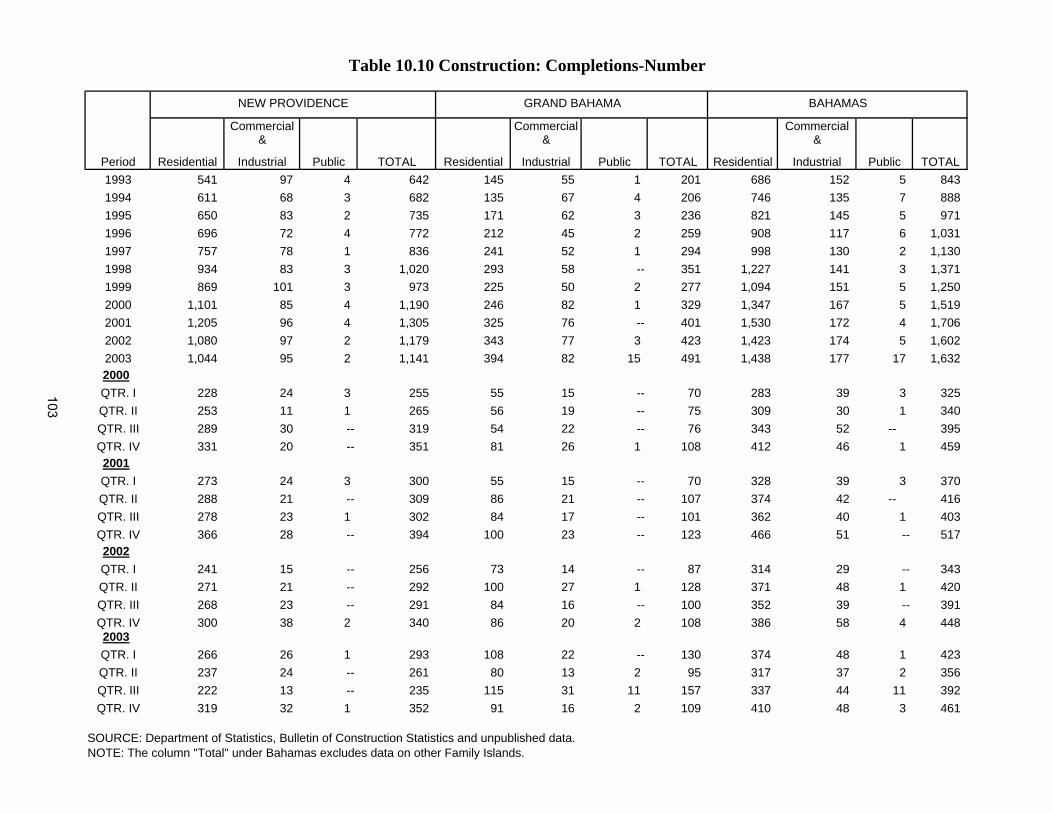
Table 10.10 Construction: Completions-Number
NEW PROVIDENCE GRAND BAHAMA BAHAMAS
Commercial Commercial Commercial & & &
Period Residential Industrial Public TOTAL Residential Industrial Public TOTAL Residential Industrial Public TOTAL1993 541 97 4 642 145 55 1 201 686 152 5 8431994 611 68 3 682 135 67 4 206 746 135 7 8881995 650 83 2 735 171 62 3 236 821 145 5 9711996 696 72 4 772 212 45 2 259 908 117 6 1,0311997 757 78 1 836 241 52 1 294 998 130 2 1,1301998 934 83 3 1,020 293 58 -- 351 1,227 141 3 1,3711999 869 101 3 973 225 50 2 277 1,094 151 5 1,2502000 1,101 85 4 1,190 246 82 1 329 1,347 167 5 1,5192001 1,205 96 4 1,305 325 76 -- 401 1,530 172 4 1,7062002 1,080 97 2 1,179 343 77 3 423 1,423 174 5 1,6022003 1,044 95 2 1,141 394 82 15 491 1,438 177 17 1,6322000QTR. I 228 24 3 255 55 15 -- 70 283 39 3 325QTR. II 253 11 1 265 56 19 -- 75 309 30 1 340QTR. III 289 30 -- 319 54 22 -- 76 343 52 -- 395QTR. IV 331 20 -- 351 81 26 1 108 412 46 1 4592001QTR. I 273 24 3 300 55 15 -- 70 328 39 3 370QTR. II 288 21 -- 309 86 21 -- 107 374 42 -- 416QTR. III 278 23 1 302 84 17 -- 101 362 40 1 403QTR. IV 366 28 -- 394 100 23 -- 123 466 51 -- 5172002QTR. I 241 15 -- 256 73 14 -- 87 314 29 -- 343QTR. II 271 21 -- 292 100 27 1 128 371 48 1 420QTR. III 268 23 -- 291 84 16 -- 100 352 39 -- 391QTR. IV 300 38 2 340 86 20 2 108 386 58 4 4482003QTR. I 266 26 1 293 108 22 -- 130 374 48 1 423QTR. II 237 24 -- 261 80 13 2 95 317 37 2 356QTR. III 222 13 -- 235 115 31 11 157 337 44 11 392QTR. IV 319 32 1 352 91 16 2 109 410 48 3 461
SOURCE: Department of Statistics, Bulletin of Construction Statistics and unpublished data. NOTE: The column "Total" under Bahamas excludes data on other Family Islands.
103
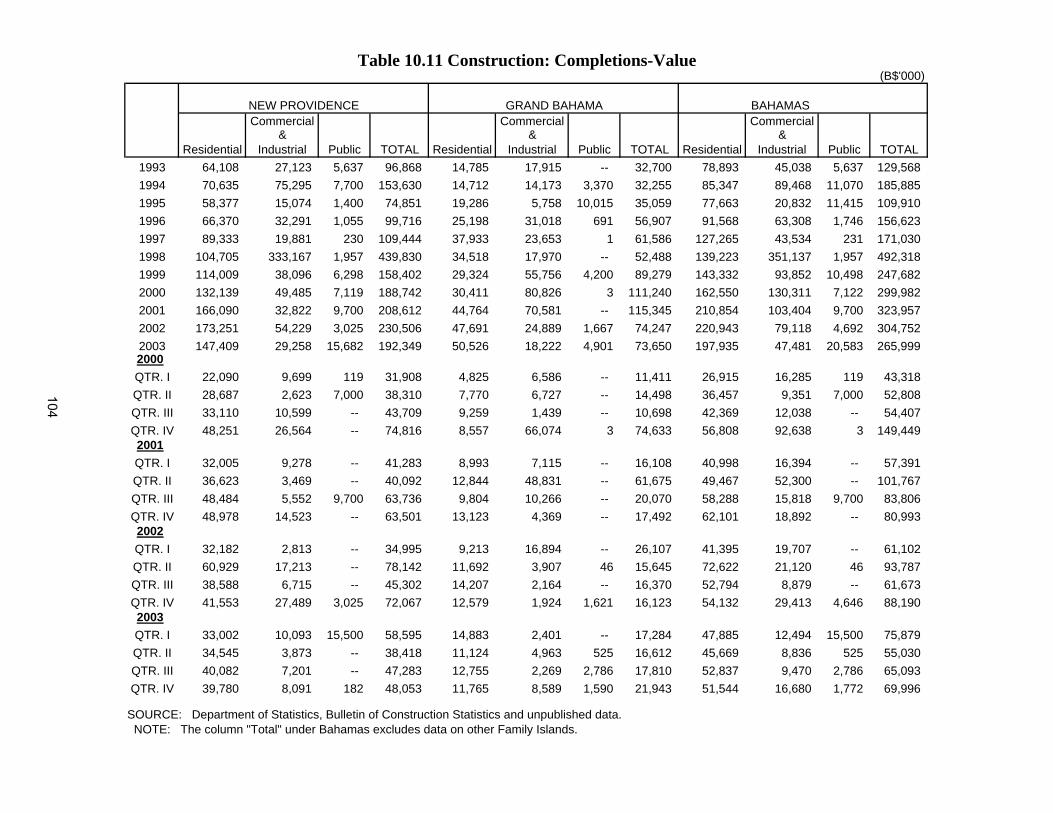
Table 10.11 Construction: Completions-Value(B$'000)
NEW PROVIDENCE GRAND BAHAMA BAHAMAS Commercial Commercial Commercial
& & & Residential Industrial Public TOTAL Residential Industrial Public TOTAL Residential Industrial Public TOTAL
1993 64,108 27,123 5,637 96,868 14,785 17,915 -- 32,700 78,893 45,038 5,637 129,5681994 70,635 75,295 7,700 153,630 14,712 14,173 3,370 32,255 85,347 89,468 11,070 185,8851995 58,377 15,074 1,400 74,851 19,286 5,758 10,015 35,059 77,663 20,832 11,415 109,9101996 66,370 32,291 1,055 99,716 25,198 31,018 691 56,907 91,568 63,308 1,746 156,6231997 89,333 19,881 230 109,444 37,933 23,653 1 61,586 127,265 43,534 231 171,0301998 104,705 333,167 1,957 439,830 34,518 17,970 -- 52,488 139,223 351,137 1,957 492,3181999 114,009 38,096 6,298 158,402 29,324 55,756 4,200 89,279 143,332 93,852 10,498 247,6822000 132,139 49,485 7,119 188,742 30,411 80,826 3 111,240 162,550 130,311 7,122 299,9822001 166,090 32,822 9,700 208,612 44,764 70,581 -- 115,345 210,854 103,404 9,700 323,9572002 173,251 54,229 3,025 230,506 47,691 24,889 1,667 74,247 220,943 79,118 4,692 304,7522003 147,409 29,258 15,682 192,349 50,526 18,222 4,901 73,650 197,935 47,481 20,583 265,9992000QTR. I 22,090 9,699 119 31,908 4,825 6,586 -- 11,411 26,915 16,285 119 43,318QTR. II 28,687 2,623 7,000 38,310 7,770 6,727 -- 14,498 36,457 9,351 7,000 52,808QTR. III 33,110 10,599 -- 43,709 9,259 1,439 -- 10,698 42,369 12,038 -- 54,407QTR. IV 48,251 26,564 -- 74,816 8,557 66,074 3 74,633 56,808 92,638 3 149,4492001QTR. I 32,005 9,278 -- 41,283 8,993 7,115 -- 16,108 40,998 16,394 -- 57,391QTR. II 36,623 3,469 -- 40,092 12,844 48,831 -- 61,675 49,467 52,300 -- 101,767QTR. III 48,484 5,552 9,700 63,736 9,804 10,266 -- 20,070 58,288 15,818 9,700 83,806QTR. IV 48,978 14,523 -- 63,501 13,123 4,369 -- 17,492 62,101 18,892 -- 80,9932002QTR. I 32,182 2,813 -- 34,995 9,213 16,894 -- 26,107 41,395 19,707 -- 61,102QTR. II 60,929 17,213 -- 78,142 11,692 3,907 46 15,645 72,622 21,120 46 93,787QTR. III 38,588 6,715 -- 45,302 14,207 2,164 -- 16,370 52,794 8,879 -- 61,673QTR. IV 41,553 27,489 3,025 72,067 12,579 1,924 1,621 16,123 54,132 29,413 4,646 88,1902003QTR. I 33,002 10,093 15,500 58,595 14,883 2,401 -- 17,284 47,885 12,494 15,500 75,879QTR. II 34,545 3,873 -- 38,418 11,124 4,963 525 16,612 45,669 8,836 525 55,030QTR. III 40,082 7,201 -- 47,283 12,755 2,269 2,786 17,810 52,837 9,470 2,786 65,093QTR. IV 39,780 8,091 182 48,053 11,765 8,589 1,590 21,943 51,544 16,680 1,772 69,996
SOURCE: Department of Statistics, Bulletin of Construction Statistics and unpublished data. NOTE: The column "Total" under Bahamas excludes data on other Family Islands.
104
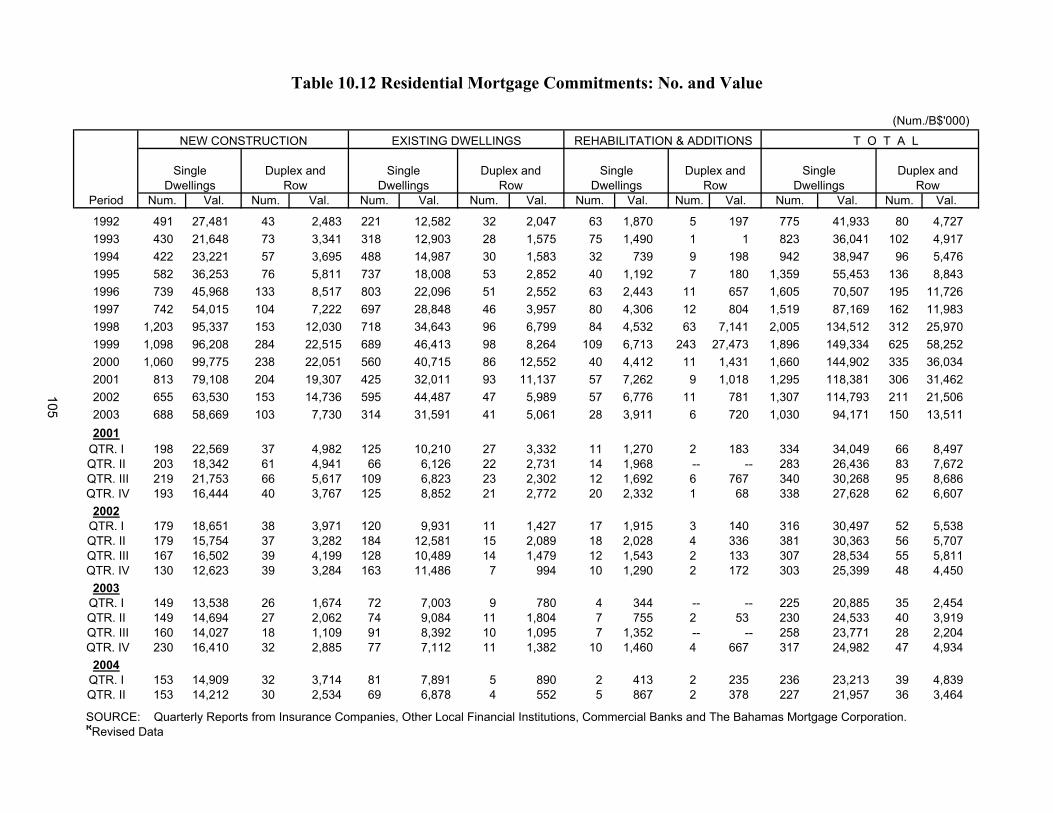
(Num./B$'000)
NEW CONSTRUCTION EXISTING DWELLINGS REHABILITATION & ADDITIONS T O T A L
Single Duplex and Single Duplex and Single Duplex and Single Duplex andDwellings Row Dwellings Row Dwellings Row Dwellings Row
Period Num. Val. Num. Val. Num. Val. Num. Val. Num. Val. Num. Val. Num. Val. Num. Val.
1992 491 27,481 43 2,483 221 12,582 32 2,047 63 1,870 5 197 775 41,933 80 4,7271993 430 21,648 73 3,341 318 12,903 28 1,575 75 1,490 1 1 823 36,041 102 4,9171994 422 23,221 57 3,695 488 14,987 30 1,583 32 739 9 198 942 38,947 96 5,4761995 582 36,253 76 5,811 737 18,008 53 2,852 40 1,192 7 180 1,359 55,453 136 8,8431996 739 45,968 133 8,517 803 22,096 51 2,552 63 2,443 11 657 1,605 70,507 195 11,7261997 742 54,015 104 7,222 697 28,848 46 3,957 80 4,306 12 804 1,519 87,169 162 11,9831998 1,203 95,337 153 12,030 718 34,643 96 6,799 84 4,532 63 7,141 2,005 134,512 312 25,9701999 1,098 96,208 284 22,515 689 46,413 98 8,264 109 6,713 243 27,473 1,896 149,334 625 58,2522000 1,060 99,775 238 22,051 560 40,715 86 12,552 40 4,412 11 1,431 1,660 144,902 335 36,0342001 813 79,108 204 19,307 425 32,011 93 11,137 57 7,262 9 1,018 1,295 118,381 306 31,4622002 655 63,530 153 14,736 595 44,487 47 5,989 57 6,776 11 781 1,307 114,793 211 21,5062003 688 58,669 103 7,730 314 31,591 41 5,061 28 3,911 6 720 1,030 94,171 150 13,5112001
QTR. I 198 22,569 37 4,982 125 10,210 27 3,332 11 1,270 2 183 334 34,049 66 8,497QTR. II 203 18,342 61 4,941 66 6,126 22 2,731 14 1,968 -- -- 283 26,436 83 7,672
QTR. III 219 21,753 66 5,617 109 6,823 23 2,302 12 1,692 6 767 340 30,268 95 8,686 QTR. IV 193 16,444 40 3,767 125 8,852 21 2,772 20 2,332 1 68 338 27,628 62 6,607
2002QTR. I 179 18,651 38 3,971 120 9,931 11 1,427 17 1,915 3 140 316 30,497 52 5,538QTR. II 179 15,754 37 3,282 184 12,581 15 2,089 18 2,028 4 336 381 30,363 56 5,707
QTR. III 167 16,502 39 4,199 128 10,489 14 1,479 12 1,543 2 133 307 28,534 55 5,811 QTR. IV 130 12,623 39 3,284 163 11,486 7 994 10 1,290 2 172 303 25,399 48 4,450
2003QTR. I 149 13,538 26 1,674 72 7,003 9 780 4 344 -- -- 225 20,885 35 2,454QTR. II 149 14,694 27 2,062 74 9,084 11 1,804 7 755 2 53 230 24,533 40 3,919
QTR. III 160 14,027 18 1,109 91 8,392 10 1,095 7 1,352 -- -- 258 23,771 28 2,204 QTR. IV 230 16,410 32 2,885 77 7,112 11 1,382 10 1,460 4 667 317 24,982 47 4,934
2004QTR. I 153 14,909 32 3,714 81 7,891 5 890 2 413 2 235 236 23,213 39 4,839QTR. II 153 14,212 30 2,534 69 6,878 4 552 5 867 2 378 227 21,957 36 3,464
SOURCE: Quarterly Reports from Insurance Companies, Other Local Financial Institutions, Commercial Banks and The Bahamas Mortgage Corporation. RRevised Data
Table 10.12 Residential Mortgage Commitments: No. and Value
105
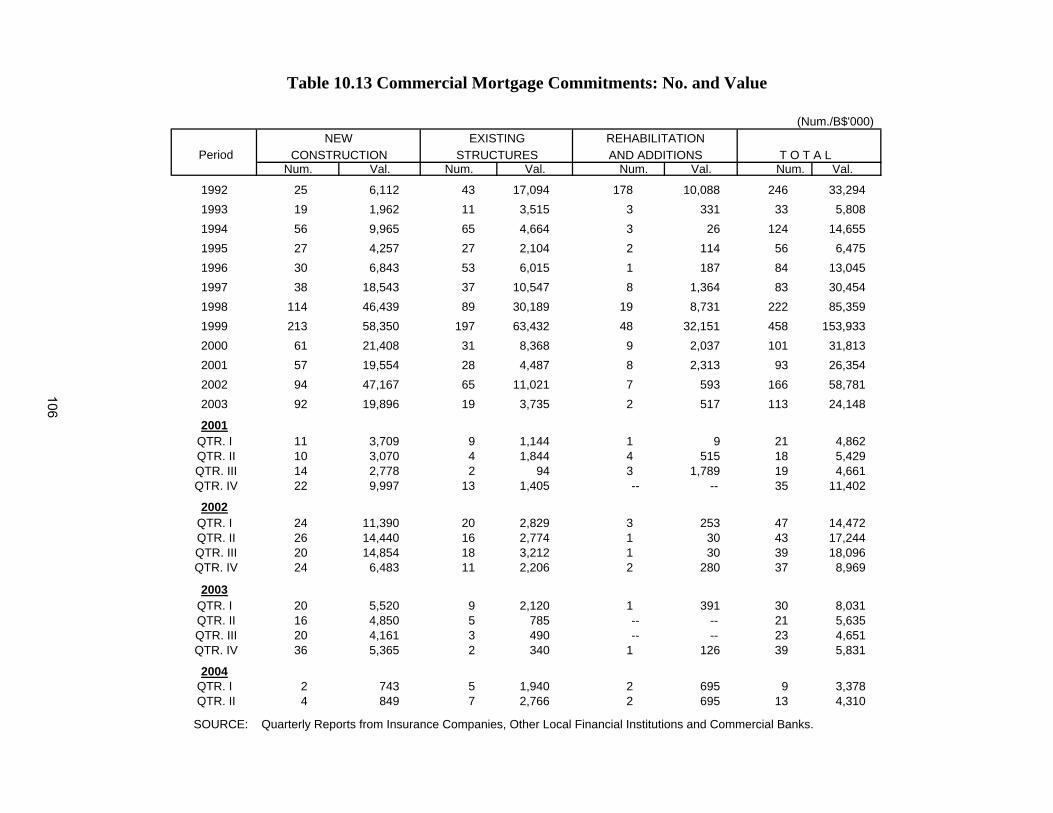
(Num./B$'000)NEW EXISTING REHABILITATION
Period CONSTRUCTION STRUCTURES AND ADDITIONS T O T A L Num. Val. Num. Val. Num. Val. Num. Val.
1992 25 6,112 43 17,094 178 10,088 246 33,2941993 19 1,962 11 3,515 3 331 33 5,8081994 56 9,965 65 4,664 3 26 124 14,6551995 27 4,257 27 2,104 2 114 56 6,4751996 30 6,843 53 6,015 1 187 84 13,0451997 38 18,543 37 10,547 8 1,364 83 30,4541998 114 46,439 89 30,189 19 8,731 222 85,3591999 213 58,350 197 63,432 48 32,151 458 153,9332000 61 21,408 31 8,368 9 2,037 101 31,8132001 57 19,554 28 4,487 8 2,313 93 26,3542002 94 47,167 65 11,021 7 593 166 58,7812003 92 19,896 19 3,735 2 517 113 24,148
2001QTR. I 11 3,709 9 1,144 1 9 21 4,862
QTR. II 10 3,070 4 1,844 4 515 18 5,429 QTR. III 14 2,778 2 94 3 1,789 19 4,661 QTR. IV 22 9,997 13 1,405 -- -- 35 11,402
2002QTR. I 24 11,390 20 2,829 3 253 47 14,472
QTR. II 26 14,440 16 2,774 1 30 43 17,244 QTR. III 20 14,854 18 3,212 1 30 39 18,096 QTR. IV 24 6,483 11 2,206 2 280 37 8,969
2003QTR. I 20 5,520 9 2,120 1 391 30 8,031
QTR. II 16 4,850 5 785 -- -- 21 5,635 QTR. III 20 4,161 3 490 -- -- 23 4,651 QTR. IV 36 5,365 2 340 1 126 39 5,831
2004QTR. I 2 743 5 1,940 2 695 9 3,378
QTR. II 4 849 7 2,766 2 695 13 4,310
SOURCE: Quarterly Reports from Insurance Companies, Other Local Financial Institutions and Commercial Banks.
Table 10.13 Commercial Mortgage Commitments: No. and Value
106
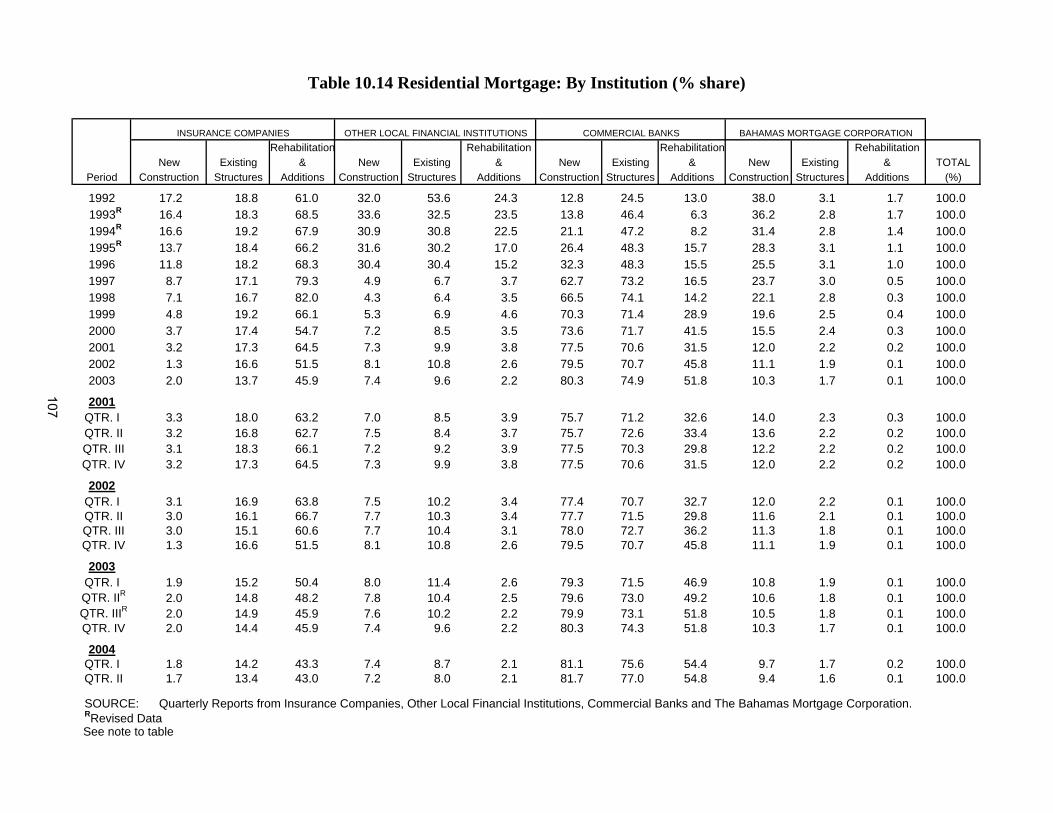
INSURANCE COMPANIES OTHER LOCAL FINANCIAL INSTITUTIONS COMMERCIAL BANKS BAHAMAS MORTGAGE CORPORATION Rehabilitation Rehabilitation Rehabilitation Rehabilitation
New Existing & New Existing & New Existing & New Existing & TOTALPeriod Construction Structures Additions Construction Structures Additions Construction Structures Additions Construction Structures Additions (%)
1992 17.2 18.8 61.0 32.0 53.6 24.3 12.8 24.5 13.0 38.0 3.1 1.7 100.0 1993R 16.4 18.3 68.5 33.6 32.5 23.5 13.8 46.4 6.3 36.2 2.8 1.7 100.0 1994R 16.6 19.2 67.9 30.9 30.8 22.5 21.1 47.2 8.2 31.4 2.8 1.4 100.0 1995R 13.7 18.4 66.2 31.6 30.2 17.0 26.4 48.3 15.7 28.3 3.1 1.1 100.01996 11.8 18.2 68.3 30.4 30.4 15.2 32.3 48.3 15.5 25.5 3.1 1.0 100.01997 8.7 17.1 79.3 4.9 6.7 3.7 62.7 73.2 16.5 23.7 3.0 0.5 100.01998 7.1 16.7 82.0 4.3 6.4 3.5 66.5 74.1 14.2 22.1 2.8 0.3 100.01999 4.8 19.2 66.1 5.3 6.9 4.6 70.3 71.4 28.9 19.6 2.5 0.4 100.02000 3.7 17.4 54.7 7.2 8.5 3.5 73.6 71.7 41.5 15.5 2.4 0.3 100.02001 3.2 17.3 64.5 7.3 9.9 3.8 77.5 70.6 31.5 12.0 2.2 0.2 100.02002 1.3 16.6 51.5 8.1 10.8 2.6 79.5 70.7 45.8 11.1 1.9 0.1 100.02003 2.0 13.7 45.9 7.4 9.6 2.2 80.3 74.9 51.8 10.3 1.7 0.1 100.0
2001QTR. I 3.3 18.0 63.2 7.0 8.5 3.9 75.7 71.2 32.6 14.0 2.3 0.3 100.0
QTR. II 3.2 16.8 62.7 7.5 8.4 3.7 75.7 72.6 33.4 13.6 2.2 0.2 100.0 QTR. III 3.1 18.3 66.1 7.2 9.2 3.9 77.5 70.3 29.8 12.2 2.2 0.2 100.0 QTR. IV 3.2 17.3 64.5 7.3 9.9 3.8 77.5 70.6 31.5 12.0 2.2 0.2 100.0
2002QTR. I 3.1 16.9 63.8 7.5 10.2 3.4 77.4 70.7 32.7 12.0 2.2 0.1 100.0
QTR. II 3.0 16.1 66.7 7.7 10.3 3.4 77.7 71.5 29.8 11.6 2.1 0.1 100.0 QTR. III 3.0 15.1 60.6 7.7 10.4 3.1 78.0 72.7 36.2 11.3 1.8 0.1 100.0 QTR. IV 1.3 16.6 51.5 8.1 10.8 2.6 79.5 70.7 45.8 11.1 1.9 0.1 100.0
2003QTR. I 1.9 15.2 50.4 8.0 11.4 2.6 79.3 71.5 46.9 10.8 1.9 0.1 100.0
QTR. IIR 2.0 14.8 48.2 7.8 10.4 2.5 79.6 73.0 49.2 10.6 1.8 0.1 100.0 QTR. IIIR 2.0 14.9 45.9 7.6 10.2 2.2 79.9 73.1 51.8 10.5 1.8 0.1 100.0 QTR. IV 2.0 14.4 45.9 7.4 9.6 2.2 80.3 74.3 51.8 10.3 1.7 0.1 100.0
2004QTR. I 1.8 14.2 43.3 7.4 8.7 2.1 81.1 75.6 54.4 9.7 1.7 0.2 100.0
QTR. II 1.7 13.4 43.0 7.2 8.0 2.1 81.7 77.0 54.8 9.4 1.6 0.1 100.0
SOURCE: Quarterly Reports from Insurance Companies, Other Local Financial Institutions, Commercial Banks and The Bahamas Mortgage Corporation. RRevised Data See note to table
Table 10.14 Residential Mortgage: By Institution (% share)
107
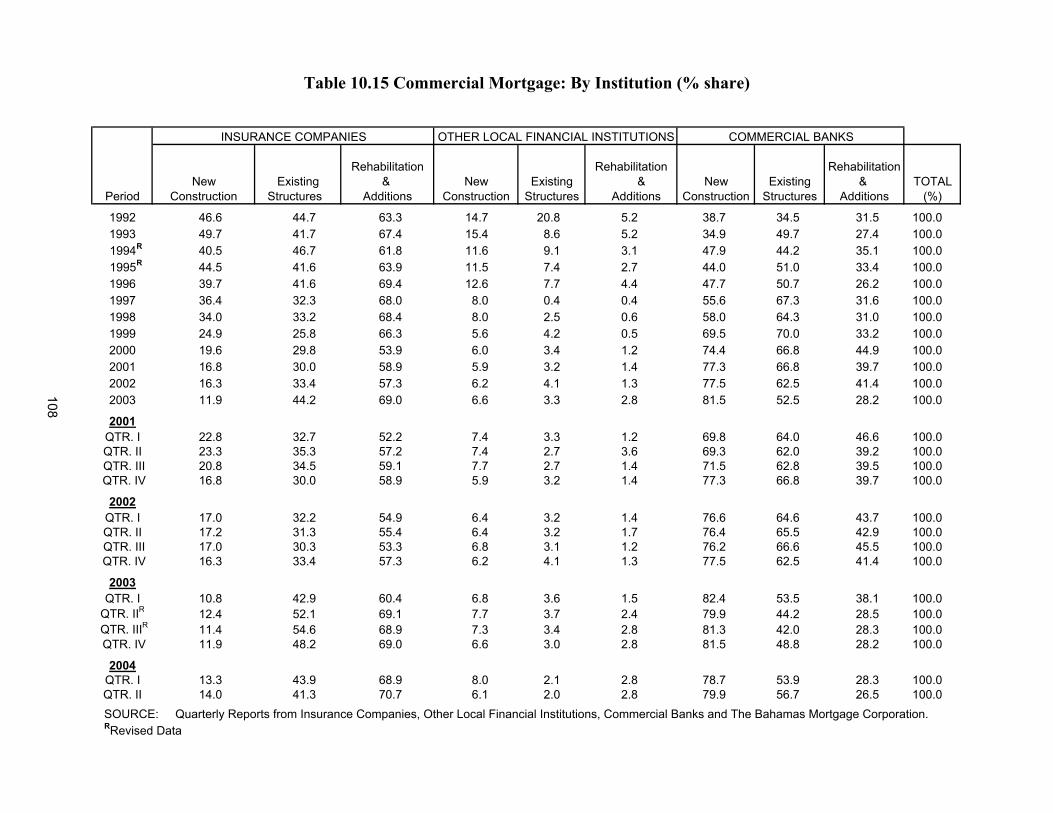
INSURANCE COMPANIES OTHER LOCAL FINANCIAL INSTITUTIONS COMMERCIAL BANKS Rehabilitation Rehabilitation Rehabilitation
New Existing & New Existing & New Existing & TOTALPeriod Construction Structures Additions Construction Structures Additions Construction Structures Additions (%)
1992 46.6 44.7 63.3 14.7 20.8 5.2 38.7 34.5 31.5 100.01993 49.7 41.7 67.4 15.4 8.6 5.2 34.9 49.7 27.4 100.0
1994R 40.5 46.7 61.8 11.6 9.1 3.1 47.9 44.2 35.1 100.0 1995R 44.5 41.6 63.9 11.5 7.4 2.7 44.0 51.0 33.4 100.01996 39.7 41.6 69.4 12.6 7.7 4.4 47.7 50.7 26.2 100.01997 36.4 32.3 68.0 8.0 0.4 0.4 55.6 67.3 31.6 100.01998 34.0 33.2 68.4 8.0 2.5 0.6 58.0 64.3 31.0 100.01999 24.9 25.8 66.3 5.6 4.2 0.5 69.5 70.0 33.2 100.02000 19.6 29.8 53.9 6.0 3.4 1.2 74.4 66.8 44.9 100.02001 16.8 30.0 58.9 5.9 3.2 1.4 77.3 66.8 39.7 100.02002 16.3 33.4 57.3 6.2 4.1 1.3 77.5 62.5 41.4 100.02003 11.9 44.2 69.0 6.6 3.3 2.8 81.5 52.5 28.2 100.0
2001QTR. I 22.8 32.7 52.2 7.4 3.3 1.2 69.8 64.0 46.6 100.0QTR. II 23.3 35.3 57.2 7.4 2.7 3.6 69.3 62.0 39.2 100.0
QTR. III 20.8 34.5 59.1 7.7 2.7 1.4 71.5 62.8 39.5 100.0 QTR. IV 16.8 30.0 58.9 5.9 3.2 1.4 77.3 66.8 39.7 100.0
2002QTR. I 17.0 32.2 54.9 6.4 3.2 1.4 76.6 64.6 43.7 100.0QTR. II 17.2 31.3 55.4 6.4 3.2 1.7 76.4 65.5 42.9 100.0
QTR. III 17.0 30.3 53.3 6.8 3.1 1.2 76.2 66.6 45.5 100.0 QTR. IV 16.3 33.4 57.3 6.2 4.1 1.3 77.5 62.5 41.4 100.0
2003QTR. I 10.8 42.9 60.4 6.8 3.6 1.5 82.4 53.5 38.1 100.0
QTR. IIR 12.4 52.1 69.1 7.7 3.7 2.4 79.9 44.2 28.5 100.0 QTR. IIIR 11.4 54.6 68.9 7.3 3.4 2.8 81.3 42.0 28.3 100.0 QTR. IV 11.9 48.2 69.0 6.6 3.0 2.8 81.5 48.8 28.2 100.0
2004QTR. I 13.3 43.9 68.9 8.0 2.1 2.8 78.7 53.9 28.3 100.0QTR. II 14.0 41.3 70.7 6.1 2.0 2.8 79.9 56.7 26.5 100.0
SOURCE: Quarterly Reports from Insurance Companies, Other Local Financial Institutions, Commercial Banks and The Bahamas Mortgage Corporation. RRevised Data
Table 10.15 Commercial Mortgage: By Institution (% share)
108
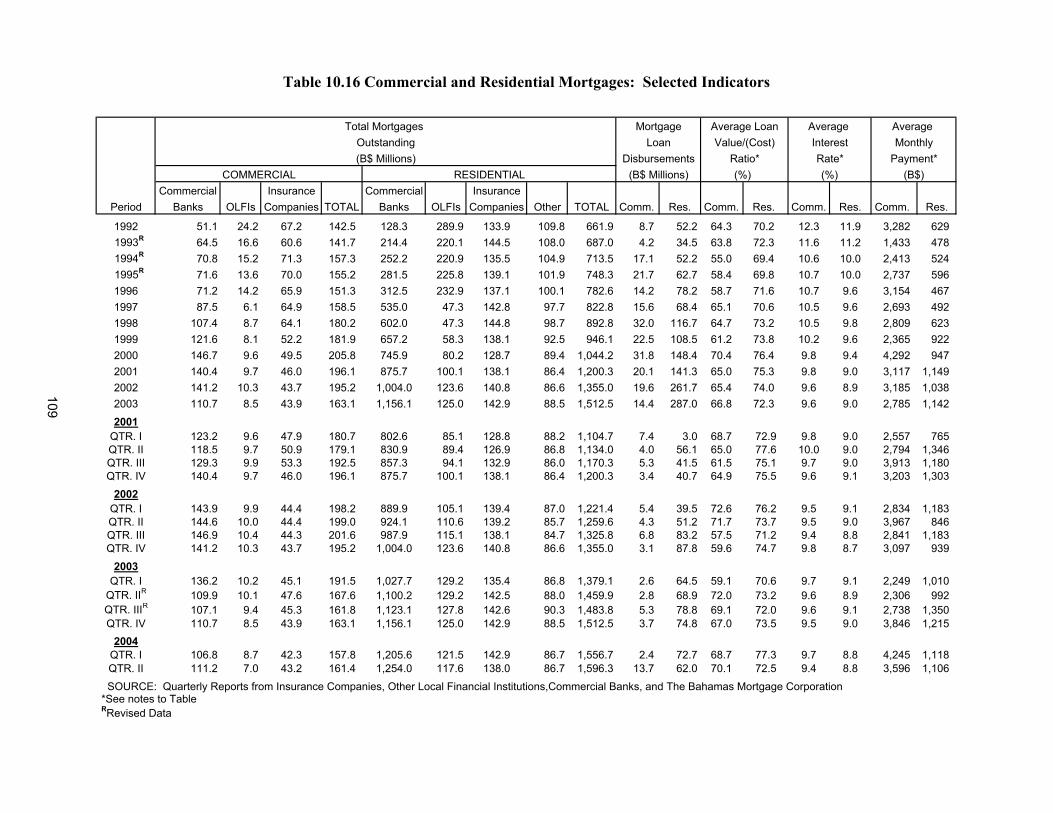
Total Mortgages Mortgage Average Loan Average Average Outstanding Loan Value/(Cost) Interest Monthly(B$ Millions) Disbursements Ratio* Rate* Payment*
COMMERCIAL RESIDENTIAL (B$ Millions) (%) (%) (B$)Commercial Insurance Commercial Insurance
Period Banks OLFIs Companies TOTAL Banks OLFIs Companies Other TOTAL Comm. Res. Comm. Res. Comm. Res. Comm. Res.
1992 51.1 24.2 67.2 142.5 128.3 289.9 133.9 109.8 661.9 8.7 52.2 64.3 70.2 12.3 11.9 3,282 629 1993R 64.5 16.6 60.6 141.7 214.4 220.1 144.5 108.0 687.0 4.2 34.5 63.8 72.3 11.6 11.2 1,433 478 1994R 70.8 15.2 71.3 157.3 252.2 220.9 135.5 104.9 713.5 17.1 52.2 55.0 69.4 10.6 10.0 2,413 524 1995R 71.6 13.6 70.0 155.2 281.5 225.8 139.1 101.9 748.3 21.7 62.7 58.4 69.8 10.7 10.0 2,737 5961996 71.2 14.2 65.9 151.3 312.5 232.9 137.1 100.1 782.6 14.2 78.2 58.7 71.6 10.7 9.6 3,154 4671997 87.5 6.1 64.9 158.5 535.0 47.3 142.8 97.7 822.8 15.6 68.4 65.1 70.6 10.5 9.6 2,693 4921998 107.4 8.7 64.1 180.2 602.0 47.3 144.8 98.7 892.8 32.0 116.7 64.7 73.2 10.5 9.8 2,809 6231999 121.6 8.1 52.2 181.9 657.2 58.3 138.1 92.5 946.1 22.5 108.5 61.2 73.8 10.2 9.6 2,365 9222000 146.7 9.6 49.5 205.8 745.9 80.2 128.7 89.4 1,044.2 31.8 148.4 70.4 76.4 9.8 9.4 4,292 9472001 140.4 9.7 46.0 196.1 875.7 100.1 138.1 86.4 1,200.3 20.1 141.3 65.0 75.3 9.8 9.0 3,117 1,1492002 141.2 10.3 43.7 195.2 1,004.0 123.6 140.8 86.6 1,355.0 19.6 261.7 65.4 74.0 9.6 8.9 3,185 1,0382003 110.7 8.5 43.9 163.1 1,156.1 125.0 142.9 88.5 1,512.5 14.4 287.0 66.8 72.3 9.6 9.0 2,785 1,1422001
QTR. I 123.2 9.6 47.9 180.7 802.6 85.1 128.8 88.2 1,104.7 7.4 3.0 68.7 72.9 9.8 9.0 2,557 765QTR. II 118.5 9.7 50.9 179.1 830.9 89.4 126.9 86.8 1,134.0 4.0 56.1 65.0 77.6 10.0 9.0 2,794 1,346QTR. III 129.3 9.9 53.3 192.5 857.3 94.1 132.9 86.0 1,170.3 5.3 41.5 61.5 75.1 9.7 9.0 3,913 1,180QTR. IV 140.4 9.7 46.0 196.1 875.7 100.1 138.1 86.4 1,200.3 3.4 40.7 64.9 75.5 9.6 9.1 3,203 1,303
2002QTR. I 143.9 9.9 44.4 198.2 889.9 105.1 139.4 87.0 1,221.4 5.4 39.5 72.6 76.2 9.5 9.1 2,834 1,183QTR. II 144.6 10.0 44.4 199.0 924.1 110.6 139.2 85.7 1,259.6 4.3 51.2 71.7 73.7 9.5 9.0 3,967 846QTR. III 146.9 10.4 44.3 201.6 987.9 115.1 138.1 84.7 1,325.8 6.8 83.2 57.5 71.2 9.4 8.8 2,841 1,183QTR. IV 141.2 10.3 43.7 195.2 1,004.0 123.6 140.8 86.6 1,355.0 3.1 87.8 59.6 74.7 9.8 8.7 3,097 939
2003QTR. I 136.2 10.2 45.1 191.5 1,027.7 129.2 135.4 86.8 1,379.1 2.6 64.5 59.1 70.6 9.7 9.1 2,249 1,010
QTR. IIR 109.9 10.1 47.6 167.6 1,100.2 129.2 142.5 88.0 1,459.9 2.8 68.9 72.0 73.2 9.6 8.9 2,306 992QTR. IIIR 107.1 9.4 45.3 161.8 1,123.1 127.8 142.6 90.3 1,483.8 5.3 78.8 69.1 72.0 9.6 9.1 2,738 1,350QTR. IV 110.7 8.5 43.9 163.1 1,156.1 125.0 142.9 88.5 1,512.5 3.7 74.8 67.0 73.5 9.5 9.0 3,846 1,215
2004QTR. I 106.8 8.7 42.3 157.8 1,205.6 121.5 142.9 86.7 1,556.7 2.4 72.7 68.7 77.3 9.7 8.8 4,245 1,118QTR. II 111.2 7.0 43.2 161.4 1,254.0 117.6 138.0 86.7 1,596.3 13.7 62.0 70.1 72.5 9.4 8.8 3,596 1,106
SOURCE: Quarterly Reports from Insurance Companies, Other Local Financial Institutions,Commercial Banks, and The Bahamas Mortgage Corporation *See notes to Table RRevised Data
Table 10.16 Commercial and Residential Mortgages: Selected Indicators
109
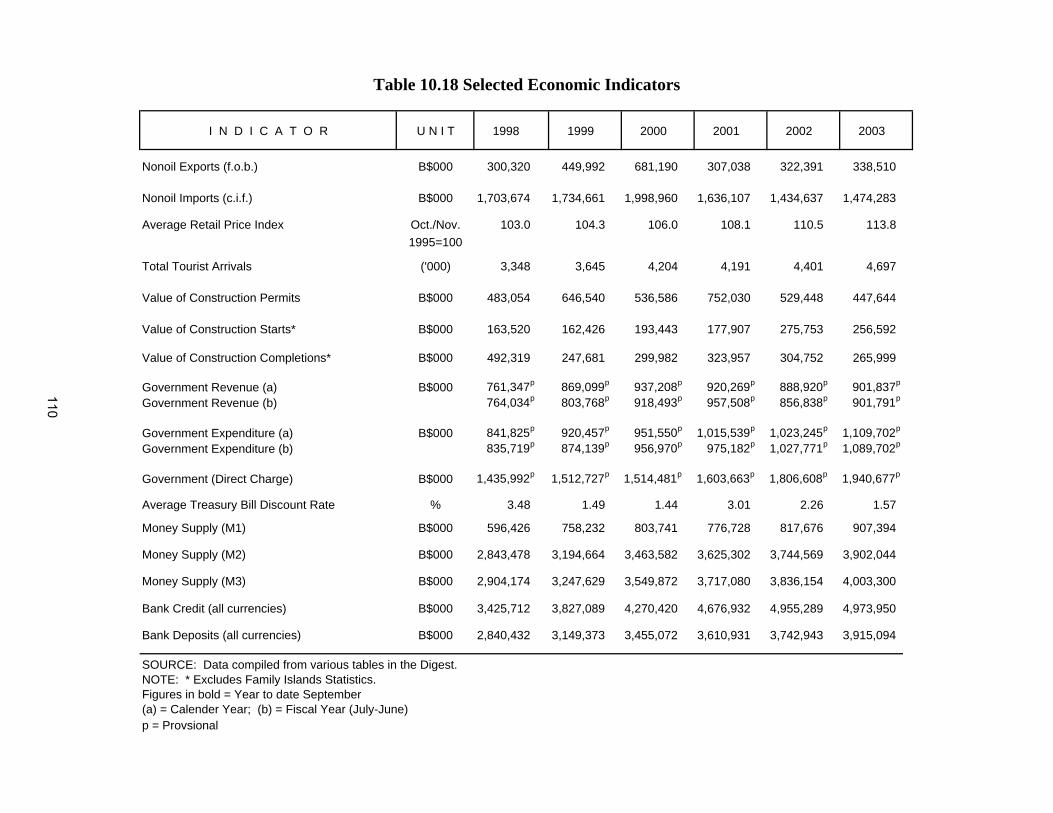
I N D I C A T O R U N I T 1998 1999 2000 2001 2002 2003
Nonoil Exports (f.o.b.) B$000 300,320 449,992 681,190 307,038 322,391 338,510
Nonoil Imports (c.i.f.) B$000 1,703,674 1,734,661 1,998,960 1,636,107 1,434,637 1,474,283
Average Retail Price Index Oct./Nov. 103.0 104.3 106.0 108.1 110.5 113.81995=100
Total Tourist Arrivals ('000) 3,348 3,645 4,204 4,191 4,401 4,697
Value of Construction Permits B$000 483,054 646,540 536,586 752,030 529,448 447,644
Value of Construction Starts* B$000 163,520 162,426 193,443 177,907 275,753 256,592
Value of Construction Completions* B$000 492,319 247,681 299,982 323,957 304,752 265,999
Government Revenue (a) B$000 761,347p 869,099p 937,208p 920,269p 888,920p 901,837p
Government Revenue (b) 764,034p 803,768p 918,493p 957,508p 856,838p 901,791p
Government Expenditure (a) B$000 841,825p 920,457p 951,550p 1,015,539p 1,023,245p 1,109,702p
Government Expenditure (b) 835,719p 874,139p 956,970p 975,182p 1,027,771p 1,089,702p
Government (Direct Charge) B$000 1,435,992p 1,512,727p 1,514,481p 1,603,663p 1,806,608p 1,940,677p
Average Treasury Bill Discount Rate % 3.48 1.49 1.44 3.01 2.26 1.57
Money Supply (M1) B$000 596,426 758,232 803,741 776,728 817,676 907,394
Money Supply (M2) B$000 2,843,478 3,194,664 3,463,582 3,625,302 3,744,569 3,902,044
Money Supply (M3) B$000 2,904,174 3,247,629 3,549,872 3,717,080 3,836,154 4,003,300
Bank Credit (all currencies) B$000 3,425,712 3,827,089 4,270,420 4,676,932 4,955,289 4,973,950
Bank Deposits (all currencies) B$000 2,840,432 3,149,373 3,455,072 3,610,931 3,742,943 3,915,094
SOURCE: Data compiled from various tables in the Digest.NOTE: * Excludes Family Islands Statistics.Figures in bold = Year to date September(a) = Calender Year; (b) = Fiscal Year (July-June)p = Provsional
Table 10.18 Selected Economic Indicators
110
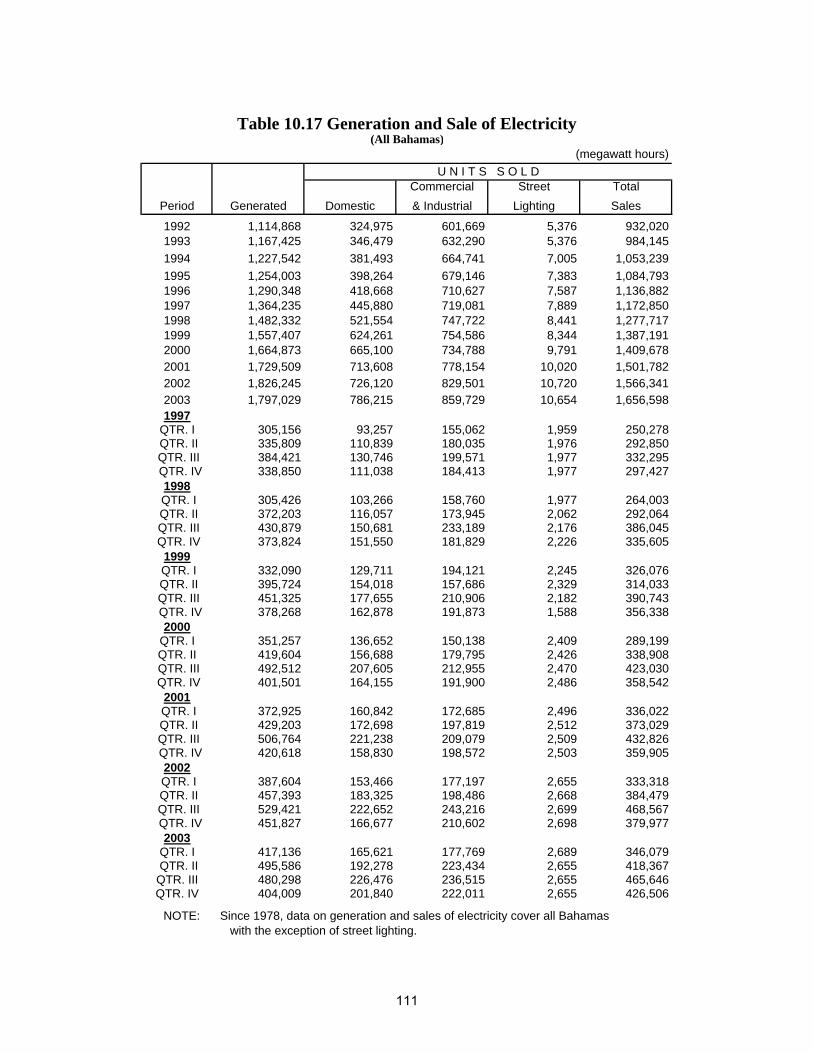
Table 10.17 Generation and Sale of Electricity(All Bahamas)
(megawatt hours)
Commercial Street TotalPeriod Generated Domestic & Industrial Lighting Sales
1992 1,114,868 324,975 601,669 5,376 932,0201993 1,167,425 346,479 632,290 5,376 984,1451994 1,227,542 381,493 664,741 7,005 1,053,2391995 1,254,003 398,264 679,146 7,383 1,084,7931996 1,290,348 418,668 710,627 7,587 1,136,8821997 1,364,235 445,880 719,081 7,889 1,172,8501998 1,482,332 521,554 747,722 8,441 1,277,7171999 1,557,407 624,261 754,586 8,344 1,387,1912000 1,664,873 665,100 734,788 9,791 1,409,6782001 1,729,509 713,608 778,154 10,020 1,501,7822002 1,826,245 726,120 829,501 10,720 1,566,3412003 1,797,029 786,215 859,729 10,654 1,656,5981997
QTR. I 305,156 93,257 155,062 1,959 250,278 QTR. II 335,809 110,839 180,035 1,976 292,850 QTR. III 384,421 130,746 199,571 1,977 332,295 QTR. IV 338,850 111,038 184,413 1,977 297,427
1998 QTR. I 305,426 103,266 158,760 1,977 264,003 QTR. II 372,203 116,057 173,945 2,062 292,064 QTR. III 430,879 150,681 233,189 2,176 386,045 QTR. IV 373,824 151,550 181,829 2,226 335,605
1999 QTR. I 332,090 129,711 194,121 2,245 326,076 QTR. II 395,724 154,018 157,686 2,329 314,033 QTR. III 451,325 177,655 210,906 2,182 390,743 QTR. IV 378,268 162,878 191,873 1,588 356,338
2000QTR. I 351,257 136,652 150,138 2,409 289,199QTR. II 419,604 156,688 179,795 2,426 338,908
QTR. III 492,512 207,605 212,955 2,470 423,030 QTR. IV 401,501 164,155 191,900 2,486 358,542
2001 QTR. I 372,925 160,842 172,685 2,496 336,022 QTR. II 429,203 172,698 197,819 2,512 373,029 QTR. III 506,764 221,238 209,079 2,509 432,826 QTR. IV 420,618 158,830 198,572 2,503 359,905
2002 QTR. I 387,604 153,466 177,197 2,655 333,318 QTR. II 457,393 183,325 198,486 2,668 384,479 QTR. III 529,421 222,652 243,216 2,699 468,567 QTR. IV 451,827 166,677 210,602 2,698 379,977
2003QTR. I 417,136 165,621 177,769 2,689 346,079
QTR. II 495,586 192,278 223,434 2,655 418,367QTR. III 480,298 226,476 236,515 2,655 465,646QTR. IV 404,009 201,840 222,011 2,655 426,506
NOTE: Since 1978, data on generation and sales of electricity cover all Bahamas with the exception of street lighting.
U N I T S S O L D
111
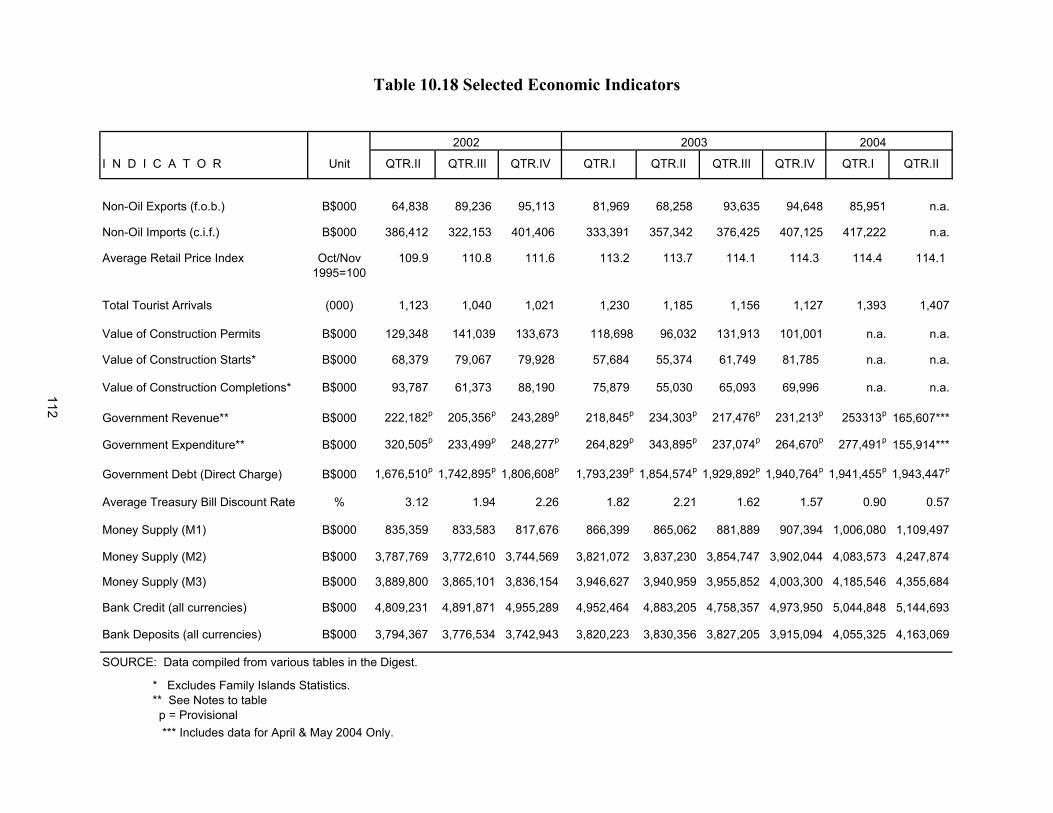
2004
I N D I C A T O R Unit QTR.II QTR.III QTR.IV QTR.II QTR.III QTR.IV QTR.I QTR.II
Non-Oil Exports (f.o.b.) B$000 64,838 89,236 95,113 81,969 68,258 93,635 94,648 85,951 n.a.
Non-Oil Imports (c.i.f.) B$000 386,412 322,153 401,406 333,391 357,342 376,425 407,125 417,222 n.a.
Average Retail Price Index Oct/Nov 109.9 110.8 111.6 113.2 113.7 114.1 114.3 114.4 114.11995=100
Total Tourist Arrivals (000) 1,123 1,040 1,021 1,230 1,185 1,156 1,127 1,393 1,407
Value of Construction Permits B$000 129,348 141,039 133,673 118,698 96,032 131,913 101,001 n.a. n.a.
Value of Construction Starts* B$000 68,379 79,067 79,928 57,684 55,374 61,749 81,785 n.a. n.a.
Value of Construction Completions* B$000 93,787 61,373 88,190 75,879 55,030 65,093 69,996 n.a. n.a.
Government Revenue** B$000 222,182p 205,356p 243,289p 218,845p 234,303p 217,476p 231,213p 253313p 165,607***
Government Expenditure** B$000 320,505p 233,499p 248,277p 264,829p 343,895p 237,074p 264,670p 277,491p 155,914***
Government Debt (Direct Charge) B$000 1,676,510p 1,742,895p 1,806,608p 1,793,239p 1,854,574p 1,929,892p 1,940,764p 1,941,455p 1,943,447p
Average Treasury Bill Discount Rate % 3.12 1.94 2.26 1.82 2.21 1.62 1.57 0.90 0.57
Money Supply (M1) B$000 835,359 833,583 817,676 866,399 865,062 881,889 907,394 1,006,080 1,109,497
Money Supply (M2) B$000 3,787,769 3,772,610 3,744,569 3,821,072 3,837,230 3,854,747 3,902,044 4,083,573 4,247,874
Money Supply (M3) B$000 3,889,800 3,865,101 3,836,154 3,946,627 3,940,959 3,955,852 4,003,300 4,185,546 4,355,684
Bank Credit (all currencies) B$000 4,809,231 4,891,871 4,955,289 4,952,464 4,883,205 4,758,357 4,973,950 5,044,848 5,144,693
Bank Deposits (all currencies) B$000 3,794,367 3,776,534 3,742,943 3,820,223 3,830,356 3,827,205 3,915,094 4,055,325 4,163,069
SOURCE: Data compiled from various tables in the Digest.
* Excludes Family Islands Statistics.** See Notes to table
p = Provisional *** Includes data for April & May 2004 Only.
Table 10.18 Selected Economic Indicators
QTR.I
2002 2003
112
113
NOTES TO TABLES SECTION 1 MONETARY AUTHORITY
Table 1.1 Central Bank of The Bahamas: Assets
Balances With Foreign Banks: are deposits of the Central Bank held with foreign banks. Foreign Securities: are holdings of short and long term debt instruments of foreign governments and supranational organizations which are reported at cost. IMF Reserve Tranche: represents that part of The Bahamas' quota in the IMF which must be paid up in SDRs. Fluctuations may reflect valuation changes. Special Drawing Rights (SDRs): are the unused portion of SDRs allocated by the IMF to its members in proportion to their quota. Members are free to convert these amounts into other currencies or they may hold them as part of their reserves. Claims on Central Government: comprise holdings of the Central Government's treasury bills, bonds and advances from the Central Bank. These are recorded at cost. According to The Central Bank of The Bahamas Act, the Bank's advances to the Government cannot exceed ten percent of the Government's average ordinary revenue or ten percent of the estimated ordinary revenue, whichever is less. The average ordinary revenue is the annual average of the ordinary revenue over the last three years for which audited accounts of revenue and expenditure of the Government have been laid before Parliament.
Table 1.2 Central Bank of The Bahamas: Liabilities
Currency in Circulation: is the total value of Bahamian dollar notes and coins issued to the public which are the liabilities of the Central Bank. Demand Liabilities to Bankers: comprise the balances for commercial banks and other local financial institutions, part of which is held to satisfy the statutory reserve requirements vis-a-vis Bahamian dollar deposit liabilities and to facilitate cheque clearing requirements. These deposits are non interest bearing. Deposit Liabilities to Others: include total balances held for the public corporations and international organizations such as the IMF.
Table 1.4 Central Bank of The Bahamas: Notes in Circulation Sterling notes: were in circulation prior to the issuance of the Bahamian dollar in 1967. These are still redeemable at a rate of B£1 = B$2.85714.
Table 1.5 Central Bank of The Bahamas: Coins in Circulation Gold Coins: in circulation were placed into general circulation in the late 1960s by way of commercial banks and coin dealers. These are redeemable at face value.
114
SECTION 2 BANKING SYSTEM Table 2.1 Financial Survey
This table is compiled from the combined balance sheets of the Central Bank, commercial banks, and other local financial institutions. Data coverage is in respect of all resident transactions, i.e., both Bahamian dollar and foreign currency transactions. Net Foreign Assets: are foreign assets held by the banking system and the Central Bank less short term foreign liabilities of the banking system. Domestic Credit to Government (net): is all claims on Central Government net of deposit liabilities held for Government. Domestic Credit to Rest of Public Sector: represents all claims on public corporations and public financial institutions. Currency in Active Circulation: is Bahamian dollar currency in the hands of the public i.e., the total currency liabilities of the Central Bank less banks' till cash and gold coins and sterling notes. Demand Deposits for Commercial Banks and Other Local Financial Institutions: are adjusted to exclude nonresident demand deposits which are included in the net foreign assets positions of banks. Government's demand deposits are also excluded from the total. Central Bank Demand Deposits: only include balances owing to the public corporations. Deposits of international agencies are included in other items (net). Savings and Fixed Deposits: exclude amounts held to the account of nonresidents. It should also be noted that all deposits are adjusted for foreign currency balances which are included in the calculation of quasi money . Foreign Currency Deposits: comprise all foreign currency deposits (demand, savings and fixed) of residents. Other Items (net): include non-monetary liabilities less the non-monetary assets of the Central Bank and banks. The capital and reserves positions are a component of this category. As at 1984, unearned interest is excluded from private sector credit and is included in other items (net).
Table 2.4 Factors Affecting Money Supply
This table is based on the Financial Survey, as it includes data for Central Bank, commercial banks and other local financial institutions. Brackets denote a contractionary impact on Money Supply (M1).
Table 2.5 Bank Deposits by Depositors (All Currencies)
Amounts represent non-financial deposits of the commercial banks and the other local financial institutions only. Collection of this data series, according to the existing seven categories, commenced in 1982 for the commercial banks and in 1988 for the other local financial institutions. Other: includes deposits of charitable and non-profit organizations and pension funds.
115
Table 2.7 Distribution of Bank Credit: All Currencies
Loans and advances are classified according to the main economic activity of the borrower. The report form for loans and advances was revised with effect from January 1982 in accordance with the U.N. International Standard Industrial Classification. Modifications were made to highlight certain sectors and to maintain conformity with the previous data set. There are now fifteen categories compared with the previous eight, with the miscellaneous, tourism, manufacturing, and agriculture sectors as separate categories. There is a break in the series on loans and advances to building and construction, real estate, the personal and miscellaneous categories and quarrying and manufacturing owing to numerous reclassifications that were made to ensure consistency between the past and existing series. The totals on these tables differ from those on the banks' balance sheets due to the inclusion of unearned interest in the former.
Table 2.8 Summary of Bank Consumer Credit
These loans are of a personal nature and are repaid on an installment basis. The category home improvement includes land purchases for the years 1982-1987, and miscellaneous, commercial bank credit card debt. Also, see notes to Table 6.2. Beginning October 1994, banks have disaggregated loans previously granted on a demand basis from 'add-on' loans. These amounts were also new consumer loans granted subsequent to the directive of the Central Bank's guideline that all loans, after October 1, 1994, be extended using the simple interest method of interest calculation.
Table 2.9 Summary of Bank Liquidity
A. Primary Reserves Under Section 19 of The Central Bank of The Bahamas Act 2000, banks are required to maintain a reserve called a 'Statutory Reserve" against their Bahamian dollar deposit liabilities. Since coming into effect in June, 1974, the ratio has been unchanged at 5%; however, the Bank has the power to raise the ratio up to 20%. The determination of required reserves is based on the average of the weekly positions of Bahamian dollar deposit liabilities for four preceding weeks prior to the month for which the statutory reserves are applicable. Section 20(5) of The Act provides for a fine to be applied not exceeding twice the annual discount rate for every day that a deficit occurs. Required Deposit Balance: is derived from the required reserves less the average till cash or 1% of average deposits, whichever is smaller. The balance is computed using the average deposits of banks for the week-ending Wednesday during the month. Average Till Cash: is the average of banks' Bahamian dollar cash in vault and is calculated using the average of the previous month-end figures. The data are obtained from the monthly balance sheets of the banks. Average Balance with the Central Bank: is the average of the daily balances for the month. B. Liquid Assets Under Section 20 of The Central Bank of The Bahamas Act, all banks are required to maintain an average ratio of liquid assets in relation to their Bahamian dollar deposit liabilities, taking one calendar month with another. For the purposes of calculation, weekly positions as reported for the week ending Wednesday are averaged to arrive at the position for a calendar month. Section 20 (5) of the Act also provides for a fine not exceeding twice the annual discount rate for every day that a deficit occurs.
116
Minimum Required Liquid Assets: represent 20% of the banks demand deposits, 15% of savings and fixed deposits and 15% of borrowings due to/from the central bank and inter bank. Eligible Liquid Assets: include notes and coins, government securities, and other specified assets. Notes and Coins: are the total Bahamian dollar cash held by the banks and up to $250,000 in foreign currency cash. Government Registered Stocks: include Bahamian dollar registered stock, foreign currency stock for the years 1979-1981. Specified Assets: are those which can be statutorily prescribed by the Central Bank and currently comprise Government guaranteed low cost housing loans and public financial institutions bonds. Net Interbank Demand/Call Deposit: is the net of demand/call deposit placements between commercial banks and the other local financial institutions.
Table 2.10 Profit and Loss Accounts of Banks in The Bahamas This table presents data on domestic banks (Savings & Loans and Commercial Banks) profit and loss in respect of resident transactions only (i.e., all Bahamian dollar and foreign currency operations of residents). It excludes those banks which are principally offshore in nature, although designated as Authorized Agents. In several instances, fluctuations in the data set for Savings & Loans and Commercial Banks reflect reclassification of banks from the former category to the latter. Savings and Loans: are a subset of Other Local Financial Institutions (OLFIs) and include institutions which deal only in resident Bahamian dollar transactions. Commercial Banks: See notes to Table 2.11. The collecting of profitability data commenced with annual surveys for the years 1985-1989 and 1992. Quarterly reporting was instituted beginning first quarter 1993. Although presented using the standard quarters, the data reflect fiscal quarter-ends of individual institutions; the Canadian institutions are on the April, July, October and January quarter-end system. Average Domestic Assets: represent balance sheet totals of Bahamian Dollar and foreign currency claims on residents, averaged for the respective quarterly/annual period. Return on Assets Ratio: is calculated by taking the ratio of net income to average domestic assets. It measures a bank's efficiency in utilizing assets to generate profits. Net Interest Margin: represents the difference between a bank's interest income and interest expense. A measure of net interest income divided by average level of interest earnings assets indicates how well a bank is able to acquire funds and reinvest them. Gross Earnings Margin: represents the net interest margin in addition to income received from foreign exchange transactions and other commission sales. Net Income: represents the difference between gross income and gross expense. Effective Bahamian Dollar Interest Rate Spread: measures the difference between the interest yield on average loans and interest cost on deposit liabilities.
117
Table 2.11 Banks and Trust Companies Licensed in The Bahamas
Table shows the total number of banks and trust companies licenced in The Bahamas along with data on revoked licences. The definitions of 'bank and trust companies' licences are outlined below. Authorized Dealer: is a bank which has been authorized by the Central Bank to deal in gold and all foreign currencies, and for this purpose can open and maintain accounts in such currencies within the limits laid down in Exchange Control Notices issued by the Bank. Under authority delegated by the Central Bank, an authorized dealer can approve certain applications for foreign currency within specified limits. Authorized Agent: is a bank or trust company authorized by the Central Bank to deal in Bahamian and foreign securities and to receive securities into deposit (i.e. to act as custodian) in accordance with the terms of Exchange Control Regulations Act, 1965 and Exchange Control Notices issued by the Bank. Public Licensee: is an entity permitted to carry on banking and/or trust business with members of the public. The institution's exchange control designation determines whether the licensee is 'resident' or 'nonresident' Resident: status allows a bank or trust company to deal only in Bahamian dollars and all operations in foreign currencies require Exchange Control's authorization. Trust companies with resident status are allowed to deal in foreign securities on behalf of nonresident customers. Nonresident: designation permits a bank and/or trust company to operate freely in foreign currencies, however, Exchange Control approval is necessary to operate a Bahamian dollar account to pay local expenses. Restricted: banks and/or trust companies carry on business for certain specified persons which are usually named in the licence. Nonactive: companies are those which are either in voluntary liquidation or wish to keep the word bank or trust in the company's name even though they are not carrying on any banking or trust business. Nominee: companies are those which hold securities and other assets in their name on behalf of clients of parent bank and trust company. Commercial Banks: are deposit money banks operating demand, savings and fixed deposits and making loans through a number of branches. These banks also provide services for the exchange of foreign currency. At end-December, 2002, the following banks were classified as commercial banks: Bank of The Bahamas, Scotiabank (Bahamas) Limited, British American Bank, FirstCaribbean International Bank (Bahamas) Limited, Citibank, N.A., Finance Corporation of The Bahamas Limited, Royal Bank of Canada and Commonwealth Bank. Other Local Financial Institutions: are primarily savings and loans institutions which deal only in Bahamian dollars. Also included in this grouping are some banks which opt to deal only with nonresidents. At end-December, 2002, the domestic OLFIs comprised the following: FirstCaribbean International Finance Corporation. The remaining OLFIs include Ansbacher (Bahamas) Limited; Bank of Nova Scotia Trust; Canadian Imperial Bank of Commerce Trust; Cititrust (Bahamas) Ltd.; JP Morgan Chase; UBS Trustees (Bahamas) Limited, Fidelity Merchant Bank & Trust Limited, S. G. Hambros Bank & Trust (Bahamas) Limited, Pictet Overseas Trust Corp. Ltd., Latin American Investment Bank, Royal Bank of Canada Trust.
118
SECTION 3 COMMERCIAL BANKS Table 3.1 Commercial Banks: Domestic Assets
Till Cash: is holdings of Bahamian dollar notes and coins in vault. Treasury Bills: are recorded at cost. Balance with Central Bank: See notes to Table 1.2. Other Assets: include fixed assets such as land and building, furniture and other miscellaneous assets in Bahamian dollars only. As at October, 2001, data reflects the acquisition of an OLFI by a commercial bank.
Table 3.2 Commercial Banks: Domestic Liabilities
Resident Deposits: include balances in both Bahamian dollars and foreign currency. Other Demand, Savings and Fixed Deposits: include accounts of individuals, companies and public corporations. Also included are any fixed deposits held for Central Government. Due to Central Bank: represents Central Bank advances to and Bahamian dollar deposits held with commercial banks. Balances Due to and With Other Local Financial Institutions: are Bahamian dollar balances only. Capital and Surplus Accounts: include only paid-up capital, reserves, provisions and profit and loss accounts in Bahamian dollars. Other Liabilities: include bills payable in The Bahamas, debentures issued in The Bahamas and other miscellaneous liabilities in Bahamian dollars. Net Foreign Assets: are derived by netting out total domestic assets (in Bahamian dollars and foreign currencies) against total domestic liabilities (Bahamian dollars and foreign currencies). A negative figure, showing an excess of liabilities over assets, represents an inflow of foreign capital into the economy to finance a portion of the banks' domestic assets.
Table 3.3 Commercial Banks: Foreign Assets Table 3.4 Commercial Banks: Foreign Liabilities
Included in external assets and liabilities are both Bahamian dollar and foreign currency claims on and liabilities due to the nonresident financial and nonfinancial sectors. The significant decline in commercial banks claims on offshore financial institutions in 1989 reflects the departure of a bank from the system.
Table 3.10 Commercial Banks: Overdrafts and Loans by Maturity
See notes to Table 2.7.
Table 3.16 See notes to Table 2.10. Table 3.19 Commercial Banks: Foreign Exchange Transactions
Table shows foreign exchange purchases and sales between commercial banks, the
119
public and the Central Bank.
Table 3.20 Commercial Banks: Clearings Table shows data on the total monthly cheques exchanged between banks in the Clearing Banks Association each month.
SECTION 4 OTHER LOCAL FINANCIAL INSTITUTIONS Table 4.1 Other Local Financial Institutions: Assets Table 4.2 Other Local Financial Institutions: Liabilities
See notes on commercial banks.
Table 4.13 See Notes to Table 2.10.
SECTION 6 INTEREST RATES Table 6.1 Selected Interest Rates
Bank Rate: is the interest rate at which banks borrow from the Central Bank. Average Tender Rate (ATR): is the rate determined during a tender by dividing the principal (amount actually paid for bills) by the amount on offer. Average Treasury Bill Discount Rate (ADR): represents the annual yield to the investor or cost to the Government. It is calculated on the basis of the following formula: ADR = 100 % less ATR × 4.
Table 6.2 Commercial Banks: Loan Rates
Data for the years 1982 through 1984 are average rates; however, as of January 1985, a range is given for lending rates. The weighted average rate of interest is calculated using total loans and advances. Beginning October 1, 1994, the Central Bank directed banks to discontinue utilizing the add-on rate method for calculating interest rates on consumer loans, and instead, stipulated that the simple interest rate method be used.
Table 6.3 Commercial Banks: Deposit Rates
For the years 1982 through 1984, the respective rates shown represent the average rates offered by commercial banks on their deposit liabilities. As of January 1985, the data represent ranges.
Table 6.4 Other Local Financial Institutions: Loan and Deposit Rates
See notes to Tables 6.2 and 6.3.
120
Table 6.5 Comparative Treasury Bill Rates and Bank Rates
Treasury bill rates for the United Kingdom, United States and Canada are the average discount rates on three-month Treasury Bills at the last tender in each month. The rates for The Bahamas, Barbados, Jamaica and Trinidad and Tobago are the average rates quoted on the date of issue of three-month bills for the appropriate month. The distinction arises because in the former case there are several tenders per month whereas for CARICOM territories and The Bahamas there is usually only one tender. Bank rates (minimum lending rate in the case of the United Kingdom) are those obtaining at the end of the month. The lending rate for Jamaica represents the Certificate of Deposit rate for 1989-1996, thereafter the rate reflects the 30 day reverse repurchase rate.
SECTION 7 GOVERNMENT FINANCE
The Government Finance Statistics are compiled from the monthly summary printouts of the Public Treasury accounts and the Central Bank records. The totals under these headings although consistent with Government's expenditures/revenue and overall balances, will not agree with those found in the Government's audited accounts as amounts have been reclassified according to the International Monetary Fund's compilation methodology. In particular, the Post Office, Port and Aviation Departments are treated as non-financial public enterprises. Whenever revenues exceed expenditures, the surplus is included under the revenue category 'Income: Public Enterprises'. On the other hand, deficits are included in the capital expenditure under the heading: 'Capital Transfers to Non-financial Public Enterprises'. Furthermore, the presentation is consistent with the financing data found in the monetary accounts. Pending the completion of audited accounts the annual data should be regarded as very provisional and may change between reporting periods to reflect revised positions. In the Government's Budget presentation to Parliament on November 25, 1992, approval was sought and received to change the commencement of the fiscal year to July 1. As a consequence, an interim budget was presented for the period January-June 1993. In December of 1992, the Government tabled a supplementary budget of approximately $74 million, of which $25.1 million and $7.9 million in recurrent and capital expenditures, respectively was outlayed in 1993. The data for 1993 is presented on a calendar year basis and is inclusive of these amounts.
Table 7.1 Central Government: Operations and Financing Net Lending: consists of the changes in Government loans to public corporations net of any repayments. Minus indicates repayment and a decline in these outstanding advances for the period. Deficit/Surplus: is calculated by subtracting total expenditure and net lending from revenue. The remaining items show how the deficit was financed or surplus allocated. Domestic Borrowing: comprises loans and advances from resident sources in all currencies extended during the reporting period. Decreases in outstanding Treasury Bills are shown as a negative item. Foreign Borrowing: comprises borrowing from nonresident sources in foreign currencies. Other Financing: is inclusive of Government's short-term borrowing from the banking system.
121
Debt Repayment: comprises amortization of all debt items except Treasury Bills. In accordance with the IMF's treatment, debt repayment is not considered to be an expenditure but a negative financing item. Cash Balance Change: shows the increase or decrease in Government's deposits with the domestic banking system. Changes in Short-term advances: shows the increases and decreases in Government's short-term obligations to the banking system, excluding the Central Bank. Other: reflects the net of changes in float of cheques outstanding and a residual financing item.
Table 7.2 Central Government: Current Revenue
Tax Revenue Selective Taxes on Services: include casino, hotel occupancy, and security taxes. Business and Professional Licence: includes fees for insurance companies, banks/trust companies and the business licence fees. Other taxes: include casino application fees, insurance premium taxes, and immovable property fees. Non tax Revenue Other Sources: include revenue from rental of government properties and interest dividends and profits. Fines, forfeits and Administrative Fees: include driver licence fees and other service charges. Other: includes proceeds of sale from services of a commercial nature such as livestock; and fees relating to education.
SECTION 8 PUBLIC DEBT
All data are in respect of disbursed debt only. Table 8.1 Central Government: National Debt
Direct Charge: is that amount which is direct claim on Central Government by foreign and local holders of the Public Debt. External Debt: comprises that portion of the debt owed to nonresidents in foreign currencies. Internal Debt: comprises debt owed to residents in foreign currencies and Bahamian dollars. Total Foreign Currency Debt: includes all external and foreign currency internal debt. Contingent Liabilities: are both Bahamian and foreign currency claims on the public corporations guaranteed by Government. As such, these are potential liabilities to Central Government in the event of a default.
122
Table 8.2 Central Government: Treasury Bill
Treasury bills are compiled from the results of the monthly tenders conducted by the Central Bank and are reported at face value. Amounts differ from those shown in banks' balance sheets where they are reported at cost. The statutory ceiling on Treasury Bills which may be outstanding was increased in December 1990 to 25% from 20%. This is computed on the basis of government's average ordinary revenue for the most recent three years.
Table 8.3 Central Government: Long-term Securities Table 8.4 Central Government: Long-term Securities by Maturity
Beginning in April 1992, data also include holdings of bonds issued under the Development Bond Act, 1990 together with the traditional registered stocks issued under the Registered Stock Act 1973.
Table 8.5 Public Corporations: Debt Operations
In some cases, the data may differ slightly from that published in the audited accounts of the public corporations. The foreign currency loan balances shown in the audited accounts are usually adjusted to reflect year-end exchange rate values.
Table 8.6 Public Sector: Foreign Currency Debt Operations
This table shows the changes in the foreign currency debt of Government and public corporations. Debt Service Ratio: is calculated as total debt service as a percentage of exports of goods and non-factor services.
SECTION 9 INTERNATIONAL TRADE AND PAYMENTS Table 9.1 Balance of Payments
The table format is based on the IMF's standard format for reporting balance of payments statistics. The information on oil trade is supplied by oil companies and is desegregated into oil imported for domestic consumption and that for bunkering of foreign ships and aircraft. Oil that is imported for trans-shipment or refining and subsequently re-exported is excluded from the trade account since no change of ownership occurs. Interest, Dividends and Profits: data for banks exclude transactions relative to offshore activities. Import and Export: data differ from those published by the Department of Statistics owing, inter alia, to some erratic movement in the series compiled by this department. For the years 1978-1987:3, the Central Bank's estimates for imports were based on import duties to which a multiplier of 3.75 was applied. Since 1987:4 - 1989, imports have been compiled as a percentage of tourism expenditure. Exports have been estimated from the data supplied by offshore exporting companies and applying a multiplier of 2.22.
123
Thereafter, the Bank has reverted to using imports and exports data from the Department of Statistics. In the absence of timely data, the Bank estimates exports from previous years’ information and imports are obtained from The Bahamas Customs Department. Travel: debit is based on Exchange Control approvals for purchases of foreign currency. For a detailed exposition of the components of the table, please see the article, 'An overview of Bahamas Balance of Payments 1973-1979', Quarterly Review, March 1977. The non-oil imports data for 1985 have been revised upwards to reflect the impact of the sharp upward adjustment in tourist expenditure, as reported by the Ministry of Tourism. The revisions by the ministry reflect the new methodology employed in calculating tourist expenditure by using an average per visit measurement instead of a per diem concept. The adjustments to non-oil imports were designed to maintain the historical relationship which exits between tourism receipts and imports. Accordingly, the freight and insurance data were also revised.
Table 9.2 External Trade Other Merchandise Imports: exclude bullion and specie and include parcel mail, insurance and freight.
Table 9.3 Export by Commodity Group
Exports: are reported f.o.b., i.e. the value includes the expenses up to the time of delivery on board the exporting carrier, and any related export duties. Although not shown separately, exports consist of domestic exports and re-exports. The former is comprised of domestic goods exported directly and imports which have been transformed in The Bahamas. The latter consists of foreign goods re-exported without transformation. The low figure of $339,000, which represents exports 'beverages and tobacco' for the fourth quarter 1977 is due to the non-processing of a number of customs entry forms during that period. The differences between the annual and quarterly series through 1984 are due to the lack of the relevant breakdowns for the quarters. Where the annual and quarterly totals differ, the annual figure should be used. Adjustments to the quarters are not available.
The commodity classification used is The Standard International Trade Classification. Table 9.4 Imports by Commodity Group
Imports: are reported c.i.f., i.e., the value includes the cost of imports, freight and insurance and any other expenses relating to the delivery at the port.
Table 9.5 Non-oil Exports by Country and Region Table 9.6 Non-oil Imports by Country and Region
The quarterly totals for 1976-1984 differ from the respective annual totals because adjustments were only made to the annual data.
Table 9.7 Composition of Domestic Exports
Table shows those products which are produced locally and exported.
124
SECTION 10 GENERAL STATISTICS Table 10.1 Retail Price Index: Average for the Period
The arithmetic average is used. These tables begin a new series based on the revised retail price index as prepared by the Department of Statistics in 1987. The revised index includes an expansion in the number of categories to nine from the previous seven categories.
Table 10.3 Comparative Retail Price Index
In the case of The Bahamas, the quarterly and annual comparisons are calculated using the Average Retail Price Index for New Providence. These figures have been rebased to Oct/Nov 1990 = 100. The monthly index changes are based on the actual Retail Price Index and have been likewise rebased to 1985.
Table 10.4 Tourism: Selected Statistics Average Length of Stay: is derived from the immigration cards which recorded the intended length of stay. The average length of stay is reported in days which is derived by adding 0.5 to the average length of stay (nights). Since 1977, excursionists (one day visitors) have been excluded from stopover visitors. Stopover: is a visitor who stays in excess of 24 hours and requires accommodations.
Table 10.5 Tourism: Estimates of Visitor Expenditure
Average Expenditure Per Visit: is based on information received on The Ministry of Tourism's exit surveys. This figure is then expressed in 1987 dollars by using the formula: Average Expenditure Per Visit ÷ [(current year average price index) × (1987 average price index)] Total visitor expenditure: is inclusive of spending by day visitors.
Table 10.6 Construction thru 10.11
Since 1975, the data for the 'Rest of Grand Bahama' were classified with Freeport to provide a complete picture for Grand Bahama. Starts and completions: Only include data for New Providence and Grand Bahama.
Table 10.12 Residential Mortgage Commitments: No. and Value Table is based on information received from banks, insurance companies and the Bahamas Mortgage Corporation. The data refer to the number and value of loans committed during the reporting period only. In 1986: Qtr. IV, the reporting format was revised to standardize reporting procedures across institutions. Based on this new format data were published beginning 1987: Qtr. IV. Row: buildings refer to owner-occupied property consisting of no more than four units.
125
Table 10.13 Commercial Mortgage Commitments: No. and Value
See notes to Table 10.12. Commercial Mortgage Loan Commitments: are those for non-owner occupied single dwellings, duplex and row; owner occupied apartments exceeding four units; new and existing structures, and rehabilitation and additions for commercial use.
Table 10.16 Commercial and Residential Mortgages: Selected Indicators
See notes to Table 10.12. Average Loan Value/Cash Ratio: is calculated for new and existing single dwellings only and is the percentage of the loan value financed divided by the total cost of the structure.
Table 10.17 Generation and Sale of Electricity
Data since 1978 cover all Bahamas, with the exception of street lighting.
Table 10.18 Selected Economic Indicators Bank Credit (All Currencies): comprises banks holdings of treasury bills, government securities, other local securities and loans and advances to Government, rest of public sector and the private sector. Bank Deposits (All Currencies): comprise the deposits held by residents including Government, rest of public sector and banks. Beginning with third quarter 1993, data on Government Revenue and Expenditure reflect the changes in the commencement of the Fiscal Year to July 1. Therefore third quarter represents the initial quarter of Fiscal Year 1993/94.
Related Documents