BIS Quarterly Review, December 2009 A1 Statistical Annex The international banking market Introduction to the BIS locational and consolidated international banking statistics ........................................................................................... page A4 1 BIS reporting banks: Summary of international positions ................................................... A7 2 External positions of banks in individual reporting countries .............................................. A8 3 External loans and deposits of banks in individual reporting countries ............................. A12 4 Local positions in foreign currency of banks in individual reporting countries ................... A14 5 Currency breakdown of reporting banks’ international positions ....................................... A16 6 External positions of reporting banks vis-à-vis individual countries .................................. A20 7 External loans and deposits of reporting banks vis-à-vis individual countries ................... A36 8 International positions by nationality of ownership of reporting banks .............................. A52 9 Consolidated claims of reporting banks on individual countries ........................................ A54 10 Signed international syndicated credit facilities by nationality of borrower ....................... A82 Securities markets 11 International debt securities by residence of issuer .......................................................... A85 12 International debt securities by nationality of issuer ......................................................... A86 13 International debt securities by type, sector and currency ................................................ A90 14 International debt securities by residence of issuer .......................................................... A92 15 International debt securities by nationality of issuer ......................................................... A94 16 Domestic debt securities by sector and residence of issuer ............................................. A96 17 Debt securities with remaining maturity up to one year .................................................... A98 18 Announced international equity issues by nationality of issuer ....................................... A100 Derivatives markets 19 Amounts outstanding of over-the-counter (OTC) derivatives by risk category and instrument ..................................................................................... A103 20 Amounts outstanding of OTC foreign exchange derivatives ........................................... A103 21 Amounts outstanding of OTC single-currency interest rate derivatives ........................... A105 22 Amounts outstanding of OTC equity-linked and commodity derivatives .......................... A106 23 Derivative financial instruments traded on organised exchanges by instrument and location ............................................................................................. A108 Notes to tables ........................................................................................................................ A110

Welcome message from author
This document is posted to help you gain knowledge. Please leave a comment to let me know what you think about it! Share it to your friends and learn new things together.
Transcript

BIS Quarterly Review, December 2009 A1
Statistical Annex
The international banking market
Introduction to the BIS locational and consolidated international banking statistics ........................................................................................... page A4
1 BIS reporting banks: Summary of international positions ................................................... A7 2 External positions of banks in individual reporting countries .............................................. A8 3 External loans and deposits of banks in individual reporting countries ............................. A12 4 Local positions in foreign currency of banks in individual reporting countries ................... A14 5 Currency breakdown of reporting banks’ international positions....................................... A16 6 External positions of reporting banks vis-à-vis individual countries .................................. A20 7 External loans and deposits of reporting banks vis-à-vis individual countries................... A36 8 International positions by nationality of ownership of reporting banks .............................. A52 9 Consolidated claims of reporting banks on individual countries........................................ A54 10 Signed international syndicated credit facilities by nationality of borrower ....................... A82
Securities markets
11 International debt securities by residence of issuer.......................................................... A85 12 International debt securities by nationality of issuer ......................................................... A86 13 International debt securities by type, sector and currency................................................ A90 14 International debt securities by residence of issuer.......................................................... A92 15 International debt securities by nationality of issuer ......................................................... A94 16 Domestic debt securities by sector and residence of issuer ............................................. A96 17 Debt securities with remaining maturity up to one year .................................................... A98 18 Announced international equity issues by nationality of issuer ....................................... A100
Derivatives markets
19 Amounts outstanding of over-the-counter (OTC) derivatives by risk category and instrument ..................................................................................... A103
20 Amounts outstanding of OTC foreign exchange derivatives ........................................... A103 21 Amounts outstanding of OTC single-currency interest rate derivatives........................... A105 22 Amounts outstanding of OTC equity-linked and commodity derivatives.......................... A106 23 Derivative financial instruments traded on organised exchanges
by instrument and location ............................................................................................. A108
Notes to tables ........................................................................................................................ A110


BIS Quarterly Review, December 2009 A3
The international banking market1
Introduction to the BIS locational and consolidated international banking statistics ........................................................................................... page A4
1 BIS reporting banks: Summary of international positions ............................................ A7
2 External positions of banks in individual reporting countries A In all currencies vis-à-vis all sectors .................................................................................. A8 B In all currencies vis-à-vis the non-bank sector ................................................................... A9 C In foreign currencies vis-à-vis all sectors ......................................................................... A10 D In foreign currencies vis-à-vis the non-bank sector .......................................................... A11
3 External loans and deposits of banks in individual reporting countries A In all currencies vis-à-vis all sectors ................................................................................ A12 B In all currencies vis-à-vis the non-bank sector ................................................................. A13
4 Local positions in foreign currency of banks in individual reporting countries A Vis-à-vis all sectors.......................................................................................................... A14 B Vis-à-vis the non-bank sector........................................................................................... A15
5 Currency breakdown of reporting banks’ international positions A Cross border positions vis-à-vis all sectors ...................................................................... A16 B Cross border positions vis-à-vis the non-bank sector ....................................................... A17 C Cross border positions vis-à-vis official monetary institutions........................................... A18 D Local positions in foreign currency vis-à-vis all sectors and vis-à-vis
the non-bank sector ......................................................................................................... A19
6 External positions of reporting banks vis-à-vis individual countries A Vis-à-vis all sectors.......................................................................................................... A20 B Vis-à-vis the non-bank sector........................................................................................... A28
7 External loans and deposits of reporting banks vis-à-vis individual countries A Vis-à-vis all sectors.......................................................................................................... A36 B Vis-à-vis the non-bank sector........................................................................................... A44
8 International positions by nationality of ownership of reporting banks A Amounts outstanding ....................................................................................................... A52 B Estimated exchange rate adjusted changes ..................................................................... A53
9 Consolidated claims of reporting banks on individual countries A International and foreign claims by maturity and sector.................................................... A54 B Foreign claims by nationality of reporting banks, immediate borrower basis .................... A62 C Foreign claims by sector and type, ultimate risk basis ..................................................... A70 D Foreign claims by nationality of reporting banks, ultimate risk basis ................................ A74
10 Signed international syndicated credit facilities by nationality of borrower ............. A82
1 More detailed data and a full set of historical time series are available on the BIS website under
http://www.bis.org/statistics/bankstats.htm.

A4 BIS Quarterly Review, December 2009
Introduction to the BIS locational and consolidated international banking statistics
The BIS collects and disseminates two different sets of international banking data, both based on information provided by banks. The first set of data is known as the locational statistics and is presented in Annex Tables 1–8B. These statistics were originally introduced in 1964 to monitor the development of eurocurrency markets, although in practice comprehensive locational data are only available from 1977. The second set, known as the consolidated statistics, is shown in Annex Tables 9A–9D. They were launched in a comprehensive form in 1983 following the onset of the Mexican debt crisis, with the main purpose of monitoring industrial country banks’ exposure to developing countries. Once differences in reporting regimes are taken into account, the two sets of data may be used to complement one another in economic analysis. The basic characteristics of the two data sets are summarised in the table below.
The locational reporting system collects quarterly data on the gross international financial claims and liabilities of banks resident in a given country. The main purpose of the statistics is to provide information on the role of banks and financial centres in the intermediation of international capital flows. The reporting system is currently comprised of 42 countries (see the table overleaf). The key organisational criteria are the country of residence of the reporting banks and their counterparties as well as the recording of all positions on a gross basis, including those vis-à-vis own affiliates. This methodology is consistent with the principles underlying the compilation of national accounts, balances of payments and external debt statistics. The currency detail supplied by the reporting countries allows the approximation of capital flows, adjusted for exchange rate fluctuations.
The consolidated banking statistics report banks’ on-balance sheet financial claims (ie contractual lending) vis-à-vis the rest of the world and provide a measure of the risk exposures of lenders’ national banking systems. The data cover contractual (immediate borrower) and ultimate risk lending by the head office and all its branches and subsidiaries on a worldwide consolidated basis, net of inter-office accounts. Reporting of lending in this way allows the allocation of claims to the bank entity that would bear the losses as a result of default by borrowers. The consolidated statistics also provide information on the maturity (ie liquidity) and sector risk distribution of banks’ contractual lending. Furthermore, to reflect the fact that banks’ country risk exposure can differ substantially from that of contractual lending due to the use of risk mitigants such as guarantees and collateral, reporting countries provide information on claims on an ultimate risk basis (ie
Data characteristics Locational (Tables 1–8 B)
Consolidated (Tables 9 A–9 D)
Creditor reporting basis Residence (host country) Nationality (home country)
Number of reporting countries 42 30
Frequency Quarterly since 1977 Quarterly since March 20001
Reported data External claims and liabilities Worldwide consolidated claims
Inter-office netting-out No Yes
Type of counterparty Immediate borrower Immediate (contractual) and ultimate borrower
Composition of claims by:
Country of borrower Yes Yes Currency Yes No Type of instrument Yes (loans, deposits, securities) No Maturity No Yes Sector Yes (bank, non-banks) Yes (banks, non-banks, public) 1 Semiannual available since 1983.

BIS Quarterly Review, December 2009 A5
contractual claims net of guarantees and collateral) since June 1999. A finer breakdown of BIS reporting banks’ foreign claims on an ultimate risk basis, and information about derivatives, credit commitments and guarantees are provided as of 2005 Q1. The consolidated statistics became available on a quarterly basis in March 2000; previously, the statistics were collected semiannually. There are currently 30 countries reporting these data (see the table below).
Because more countries contribute to the locational bank lending data, one would expect the measure of outstanding debt as reported by the locational data to exceed that of the consolidated data. However, the reporting of worldwide positions in the consolidated data tends to compensate for this. While the locational statistics are appropriate for measuring lending flows in a given period, the consolidated statistics are more suited to gauging the size of banks’ country and liquidity risk exposures. The detailed maturity and sector breakdowns of the consolidated statistics can be used to supplement the locational data.
Reporting countries providing locational banking data First year of data availability in brackets
Australia (1997) France (1977) Malaysia (2008) Austria (1977) Germany (1977) Mexico (2003 Bahamas1 (1983) Greece (2003) Netherlands (1977) Bahrain (1983) Guernsey (2001) Netherlands Antilles (1983) Belgium (1977) Hong Kong SAR (1983) Norway (1983) Bermuda (2002) India (2001) Panama (2002) Brazil (2002) Ireland (1977) Portugal (1997) Canada (1977) Isle of Man (2001) Singapore (1983) Cayman Islands (1983) Italy (1977) Spain (1983) Chile (2002) Japan (1977) Sweden (1977) Chinese Taipei(2000) Jersey (2001) Switzerland (1977) Cyprus (2008) Korea (2005) Turkey (2000) Denmark (1977) Luxembourg (1977) United Kingdom (1977) Finland (1983) Macao SAR (2006) United States (1977)
Reporting countries providing consolidated banking data First year of data availability in brackets
Australia (2003) Germany (1983) Norway (1994) Austria (1983) Greece (2003) Panama (2002) 2 Belgium (1983) Hong Kong SAR (1997) 2 Portugal (1999) Brazil (2002)2 India (2001) Singapore (2000) Canada (1983) Ireland (1983) Spain (1985) Chile (2002) Italy (1983) Sweden (1983) Chinese Taipei (2000) Japan (1983) Switzerland (1983) Denmark (1983) 2 Luxembourg (1983) 2 Turkey (2000) Finland (1985) Mexico (2003) 2 United Kingdom (1983) France (1983) Netherlands (1983) United States (1983) 1 Semiannual reporting. 2 Provides only consolidated banking statistics on an immediate borrower basis.
______________________________________________________
For a more detailed analysis, see the special feature “The BIS consolidated banking statistics: structure, uses and improvements” in September 2005 BIS Quarterly Review.


Positions Dec 2007 Dec 2008 Mar 2009 Jun 2009 2007 2008 Q3 2008 Q4 2008 Q1 2009 Q2 2009
A. Total assets 37,384.9 35,212.4 33,246.3 34,007.9 6,201.2 –1,244.1 202.1 –1,895.6 –1,111.3 –476.8
claims on banks 23,371.8 22,268.2 20,860.5 21,188.3 4,000.6 –527.7 124.8 –915.6 –867.6 –480.7
claims on non-banks 14,013.1 12,944.2 12,385.8 12,819.6 2,200.6 –716.4 77.2 –980.0 –243.8 3.9
B. External assets 33,440.6 31,139.8 29,565.1 30,267.1 5,719.3 –1,364.1 130.8 –1,791.1 –811.6 –415.2
claims on banks 21,504.2 20,281.0 19,108.9 19,394.0 3,910.1 –619.1 95.9 –922.9 –672.4 –458.5
claims on non-banks 11,936.4 10,858.8 10,456.3 10,873.1 1,809.2 –745.0 35.0 –868.2 –139.2 43.3
1. Loans and deposits 24,541.2 22,728.7 21,532.0 21,891.4 4,519.0 –1,023.9 189.7 –1,499.1 –678.8 –394.4
claims on banks 18,098.9 16,560.8 15,617.5 15,858.0 3,399.3 –929.1 37.6 –919.8 –554.9 –325.8
claims on non-banks 6,442.3 6,167.9 5,914.5 6,033.4 1,119.7 –94.7 152.1 –579.3 –123.9 –68.6
2. Holdings of securities and other assets 8,899.4 8,300.3 8,033.1 8,375.7 1,200.3 –448.5 –58.8 –400.3 –25.2 –20.1
claims on banks 3,405.4 3,609.5 3,491.3 3,536.0 510.8 201.7 58.3 –111.4 –10.0 –133.0
claims on non-banks 5,494.1 4,690.8 4,541.8 4,839.7 689.5 –650.2 –117.1 –288.9 –15.3 112.9
C. Local assets in
foreign currency 3,944.3 4,072.6 3,681.2 3,740.8 481.9 120.0 71.2 –104.6 –299.8 –61.7
claims on banks 1,867.6 1,987.2 1,751.6 1,794.3 90.5 91.5 28.9 7.3 –195.2 –22.3
claims on non-banks 2,076.7 2,085.4 1,929.6 1,946.5 391.4 28.5 42.3 –111.9 –104.6 –39.4
D. Total liabilities 36,040.0 33,821.2 31,963.6 32,477.0 5,987.5 –1,113.3 134.9 –1,693.4 –1,164.4 –626.4
liabilities to banks 25,697.5 24,236.4 22,990.9 23,321.1 4,222.6 –689.1 504.6 –1,138.9 –724.6 –568.7
liabilities to non-banks 10,342.5 9,584.9 8,972.8 9,155.9 1,764.9 –424.2 –369.6 –554.5 –439.7 –57.7
E. External liabilities 31,418.1 29,010.5 27,627.7 28,158.7 5,448.1 –1,425.5 9.5 –1,759.9 –772.9 –484.0
liabilities to banks 23,108.8 21,363.7 20,467.0 20,875.3 4,015.8 –1,062.6 264.9 –1,256.0 –424.3 –413.8
liabilities to non-banks 8,309.2 7,646.8 7,160.7 7,283.4 1,432.3 –363.0 –255.3 –503.9 –348.6 –70.2
1. Loans and deposits 27,129.3 24,282.5 22,985.7 23,273.5 4,685.3 –1,762.7 65.7 –1,751.5 –801.0 –518.4
liabilities to banks 19,672.9 17,344.8 16,512.1 16,727.2 3,456.6 –1,450.8 247.1 –1,271.0 –457.6 –425.7
liabilities to non-banks 7,456.4 6,937.7 6,473.7 6,546.3 1,228.7 –311.8 –181.4 –480.5 –343.3 –92.7
2. Own issues of securitiesand other liabilities 4,288.7 4,728.0 4,642.0 4,885.2 762.8 337.2 –56.2 –8.3 28.0 35.4
liabilities to banks 3,436.0 4,018.9 3,955.0 4,148.1 559.2 388.3 17.7 15.1 33.3 12.7
liabilities to non-banks 852.7 709.0 687.0 737.0 203.6 –51.1 –73.9 –23.4 –5.2 22.7
F. Local liabilities in
foreign currency 4,621.9 4,810.7 4,335.9 4,318.2 539.4 312.2 125.4 66.5 –391.5 –142.4
liabilities to banks 2,588.7 2,872.6 2,523.9 2,445.8 206.8 373.5 239.7 117.1 –300.3 –154.9
liabilities to non-banks 2,033.3 1,938.1 1,812.1 1,872.4 332.6 –61.3 –114.3 –50.6 –91.2 12.5
Table 1: BIS reporting banksSummary of international positionsIn billions of US dollars
Amounts outstanding Estimated exchange rate adjusted changes
BIS Quarterly Review, December 2009 A 7

Table 2A: External positions of banks in all currencies vis-à-vis all sectorsIn individual reporting countriesin billions of US dollars
Reporting countries Dec 2007 Dec 2008 Mar 2009 Jun 2009 2007 2008 Q3 2008 Q4 2008 Q1 2009 Q2 2009
AssetsAll countries 33,440.6 31,139.8 29,565.1 30,267.1 5,719.3 –1,364.1 130.8 –1,791.1 –811.6 –415.2
Australia 185.0 260.1 247.0 242.3 27.2 96.4 34.1 27.4 –9.7 –23.6 Austria 483.1 497.9 470.6 493.1 82.8 39.0 –4.7 –28.7 –8.5 –2.3 Bahamas 406.5 514.4 461.7 390.6 59.3 110.4 23.5 81.4 –50.0 –75.0 Bahrain 208.3 203.9 192.5 189.3 44.4 –1.1 9.8 –18.9 –8.9 –6.4 Belgium 1,161.6 970.7 889.3 865.2 191.8 –109.1 29.3 –208.3 –48.1 –68.3 Brazil 65.2 60.7 52.4 56.3 27.4 –4.5 2.6 –15.1 –7.3 2.8 Canada 302.6 342.5 332.9 339.6 46.8 59.1 31.7 –2.8 –6.9 –0.1 Cayman Islands 1,873.6 1,798.9 1,741.0 1,727.8 249.1 –69.3 –91.8 80.8 –51.4 –20.2 Chinese Taipei 184.7 169.5 163.1 175.2 38.3 –15.0 –4.3 –19.0 –5.0 10.5 Cyprus ... 89.2 102.5 114.0 ... – ... – 15.6 6.3 Denmark 222.9 225.4 209.7 205.8 46.6 13.2 –12.3 –0.0 –7.4 –13.8 Finland 101.7 113.0 110.0 116.4 11.7 15.9 –4.9 –8.9 0.5 1.8 France 2,814.0 2,599.9 2,423.2 2,546.4 406.2 –67.1 –14.5 –133.8 –85.7 –6.5 Germany 3,561.0 3,389.9 3,093.5 3,247.6 486.1 9.9 76.4 –194.5 –177.2 –3.0 Greece 124.2 184.8 193.6 221.4 42.3 67.4 20.2 22.9 15.1 16.8 Guernsey 246.3 245.9 225.1 227.6 55.7 20.1 –1.0 3.1 –16.3 –7.9 Hong Kong SAR 798.5 788.5 770.4 760.1 166.8 –20.6 23.1 8.5 –6.6 –20.6 Ireland 1,029.6 968.3 942.8 994.2 152.5 18.0 –52.6 –16.0 3.4 –12.0 Isle of Man 93.5 81.7 76.7 84.3 14.0 7.5 –3.2 1.2 –3.7 –0.8 Italy 647.5 662.6 641.5 648.1 38.1 53.5 –13.9 17.0 5.3 –29.1 Japan 2,401.7 2,575.8 2,348.1 2,461.6 423.5 73.0 –27.7 41.4 –153.2 59.3 Jersey 519.0 387.7 359.3 370.8 56.0 –85.6 –8.5 –39.1 –20.2 –11.7 Luxembourg 1,067.4 981.8 900.3 914.8 87.5 –35.2 59.2 –93.4 –46.0 –30.8 Malaysia 37.1 26.2 28.4 28.4 – –10.4 –7.1 –1.8 2.6 –0.7 Netherlands 1,325.9 1,183.5 1,116.9 1,106.2 235.4 –73.6 23.5 –149.0 –31.2 –63.0 Norway 82.2 109.8 101.8 102.3 16.7 36.8 –0.6 13.8 –6.8 –2.8 Portugal 138.9 139.4 139.1 147.2 16.4 7.4 0.8 0.4 4.8 0.5 Singapore 785.4 794.2 726.3 756.9 153.1 –25.7 26.8 –76.6 –44.9 14.1 South Korea 85.7 106.8 99.5 101.2 13.9 20.5 1.4 –1.5 –6.4 0.8 Spain 612.8 575.3 548.0 594.6 118.8 13.7 12.7 –71.4 –8.2 14.3 Sweden 337.4 365.7 340.4 353.8 65.5 54.4 21.7 21.2 –16.3 –3.6 Switzerland 1,539.3 1,115.7 1,009.9 1,034.5 361.3 –382.9 –9.7 –173.2 –75.1 –17.6 Turkey 44.1 51.6 49.4 51.6 4.6 10.3 –0.5 3.7 –1.0 0.8 United Kingdom 6,844.2 5,639.2 5,482.8 5,553.2 1,345.1 –890.8 68.5 –576.4 –27.8 –176.2 United States 2,961.1 2,762.2 2,819.8 2,878.4 567.8 –322.9 –80.2 –291.4 69.8 45.9 Other 148.6 157.0 155.6 166.2 13.8 13.5 3.0 5.8 1.2 6.8
LiabilitiesAll countries 31,418.1 29,010.5 27,627.7 28,158.7 5,448.1 –1,425.5 9.5 –1,759.9 –772.9 –484.0
Australia 495.6 514.1 507.6 552.7 94.0 55.0 –14.2 –6.3 2.8 12.4 Austria 324.3 306.4 300.6 306.7 22.3 –2.0 –2.5 –40.7 5.9 –9.6 Bahamas 413.6 518.3 465.3 393.5 61.5 107.8 22.7 81.1 –50.7 –74.6 Bahrain 201.6 197.8 187.2 184.7 45.0 1.0 –2.0 –7.6 –8.3 –5.7 Belgium 970.2 733.1 665.9 686.8 154.9 –172.1 –70.4 –178.3 –42.4 –11.1 Brazil 93.1 85.2 72.6 77.9 42.0 –8.8 7.1 –26.6 –11.5 4.1 Canada 263.1 274.1 278.3 279.5 43.7 26.7 0.4 10.2 7.3 –7.0 Cayman Islands 1,856.5 1,803.4 1,749.4 1,756.3 244.3 –48.4 –79.2 73.6 –48.1 –0.0 Chinese Taipei 84.8 91.7 85.9 81.0 16.2 7.4 6.9 –12.8 –5.2 –5.8 Cyprus ... 81.1 90.9 103.0 ... – ... – 11.9 7.7 Denmark 343.6 323.6 326.5 335.4 81.0 –3.2 –6.7 –35.3 13.5 –6.1 Finland 120.4 135.4 133.7 147.2 12.2 23.0 4.6 –7.4 1.9 7.2 France 2,805.7 2,501.9 2,336.3 2,410.4 498.6 –170.4 –29.1 –218.8 –83.5 –38.9 Germany 1,992.7 1,824.9 1,741.9 1,816.4 142.3 –82.0 34.7 –235.1 –26.1 –5.7 Greece 143.9 153.4 147.4 154.9 44.6 18.0 5.4 –12.4 –0.6 0.2 Guernsey 204.7 207.7 182.5 178.8 42.5 18.4 3.3 3.5 –21.3 –11.9 Hong Kong SAR 476.5 504.4 485.6 470.4 117.8 30.5 16.7 0.4 –13.8 –21.6 Ireland 1,151.7 1,023.0 903.1 933.0 199.2 –44.3 –79.9 –64.8 –92.3 –24.3 Isle of Man 68.6 59.8 56.5 61.6 15.9 4.3 –1.2 0.3 –2.2 –0.9 Italy 941.9 917.5 914.7 949.1 184.2 67.4 –12.8 22.4 32.4 –16.8 Japan 712.0 942.1 905.9 986.4 11.7 170.8 6.4 142.1 –4.0 64.6 Jersey 349.0 352.9 323.8 333.2 28.8 –82.9 –15.6 –23.8 –21.2 –9.7 Luxembourg 732.6 682.8 624.6 624.1 75.6 –20.9 60.4 –55.7 –32.8 –30.5 Malaysia 48.1 46.6 45.8 47.2 – 0.1 1.2 –8.6 0.4 0.4 Netherlands 1,436.1 1,256.9 1,218.0 1,245.4 246.6 –91.1 25.5 –266.6 –3.3 –28.0 Norway 173.1 201.3 193.2 193.6 35.9 48.8 1.8 13.8 –7.5 –6.7 Portugal 241.9 203.6 196.8 203.8 23.5 –25.3 –5.6 –20.7 1.1 –3.3 Singapore 802.8 795.4 728.8 753.2 180.1 5.1 31.3 –63.9 –51.7 7.2 South Korea 203.7 195.1 187.2 196.4 52.9 –12.1 9.5 –47.3 –5.3 7.4 Spain 701.7 755.1 747.7 793.7 129.0 105.4 –21.5 –5.6 16.1 4.5 Sweden 403.5 421.3 417.0 439.3 56.1 45.3 24.7 –17.5 –13.4 4.4 Switzerland 1,393.4 1,030.8 987.5 1,019.5 342.4 –305.9 –2.0 –107.4 –18.5 –9.2 Turkey 54.2 57.9 51.9 51.5 5.5 9.2 5.2 –5.0 –4.2 –2.3 United Kingdom 7,304.8 6,121.1 5,961.2 6,060.1 1,577.9 –798.0 133.1 –631.1 –30.5 –182.2 United States 3,715.5 3,512.9 3,237.6 3,152.0 590.2 –301.6 –43.4 –4.9 –263.2 –97.1 Other 193.0 178.1 168.9 180.2 29.9 –1.5 –5.1 –3.2 –4.6 5.1
Amounts outstanding Estimated exchange rate adjusted changes
A 8 BIS Quarterly Review, December 2009

Reporting countries Dec 2007 Dec 2008 Mar 2009 Jun 2009 2007 2008 Q3 2008 Q4 2008 Q1 2009 Q2 2009
AssetsAll countries 11,936.4 10,858.8 10,456.3 10,873.1 1,809.2 –745.0 35.0 –868.2 –139.2 43.3
Australia 71.7 85.0 80.0 80.1 9.4 19.7 0.2 2.3 –3.7 –5.8 Austria 204.5 212.5 200.9 212.3 33.3 17.3 –1.1 –3.7 –3.4 0.8 Bahamas 27.9 30.4 24.0 17.8 –0.9 2.8 1.0 0.4 –6.0 –6.2 Bahrain 111.7 124.1 115.9 113.5 28.0 14.8 1.6 3.2 –6.9 –3.8 Belgium 434.8 423.4 386.5 368.5 11.9 21.1 –17.2 –1.4 –22.6 –38.8 Brazil 10.0 8.6 7.5 7.2 6.2 –0.0 2.1 –7.1 –1.0 –0.7 Canada 154.7 142.0 137.4 139.3 10.6 –2.1 –1.3 –4.5 –3.3 –1.7 Cayman Islands 496.9 467.2 469.2 504.6 47.1 –28.2 19.7 –59.2 3.0 34.1 Chinese Taipei 123.4 97.8 90.6 100.0 27.7 –25.5 –11.3 –20.0 –6.5 8.8 Cyprus ... 36.1 43.1 51.4 ... – ... – 8.1 5.9 Denmark 58.0 57.1 54.3 62.1 1.8 1.7 –6.0 –0.5 –0.7 4.9 Finland 12.5 24.4 18.0 15.4 2.7 12.2 0.5 9.9 –5.4 –3.4 France 964.3 929.1 886.9 921.5 117.3 1.9 –12.5 –9.3 –10.6 –8.9 Germany 1,348.4 1,267.9 1,173.6 1,244.7 223.7 –13.9 19.8 –84.9 –52.4 23.6 Greece 36.3 61.5 64.9 74.9 14.1 27.5 6.4 9.4 5.4 6.5 Guernsey 54.2 58.8 63.2 65.1 25.2 6.2 –0.6 4.1 4.8 0.1 Hong Kong SAR 150.6 166.6 144.1 154.0 29.1 15.7 9.8 12.0 –20.7 7.9 Ireland 519.2 488.8 477.7 501.2 92.0 0.3 –13.0 –30.4 2.6 –3.5 Isle of Man 21.3 6.9 7.3 8.1 2.1 –12.2 –0.2 –0.4 0.6 –0.2 Italy 152.5 148.8 143.9 151.2 5.2 20.7 1.6 4.0 0.9 –0.9 Japan 1,521.2 1,487.8 1,456.0 1,529.3 188.3 –46.7 –27.9 –21.0 5.4 36.1 Jersey 21.7 13.6 15.0 16.5 4.6 –5.3 –2.0 –1.7 1.7 0.0 Luxembourg 377.9 354.7 341.4 347.7 30.4 –7.5 20.7 –13.6 –1.1 –10.0 Malaysia 2.0 3.9 5.6 6.2 – 2.0 0.5 0.1 1.8 0.5 Netherlands 379.4 355.7 351.7 389.0 42.2 –2.5 20.9 –46.7 6.0 21.0 Norway 34.2 33.7 33.8 35.9 3.0 9.0 1.6 –0.6 0.7 1.0 Portugal 39.7 63.8 66.3 72.9 9.2 26.5 5.7 13.1 4.9 2.7 Singapore 197.8 214.9 204.7 210.8 53.2 15.2 9.7 –27.8 –5.0 1.7 South Korea 41.1 43.2 42.5 43.3 8.5 2.1 –1.6 –2.2 –0.4 0.5 Spain 253.7 240.2 232.6 268.5 55.8 6.2 25.7 –30.5 0.0 22.3 Sweden 95.7 106.7 102.3 102.2 9.8 17.5 6.9 5.9 –1.5 –4.5 Switzerland 183.7 162.4 140.3 143.3 35.9 –20.5 3.1 –32.3 –18.3 –1.4 Turkey 1.6 1.9 1.7 1.9 –2.5 0.5 0.7 –0.6 –0.1 0.1 United Kingdom 3,121.9 2,336.0 2,254.9 2,261.7 573.7 –706.2 12.4 –444.9 –33.5 –74.8 United States 663.9 547.3 562.3 596.2 97.7 –122.9 –39.2 –87.2 17.6 30.9 Other 48.0 55.9 55.8 55.0 2.1 8.6 –1.4 –2.0 0.6 –1.5
LiabilitiesAll countries 8,309.2 7,646.8 7,160.7 7,283.4 1,432.3 –363.0 –255.3 –503.9 –348.6 –70.2
Australia 144.9 134.2 132.5 138.1 32.1 0.8 –39.6 –9.1 0.7 –2.3 Austria 64.9 64.6 59.7 63.1 7.4 2.7 –2.8 0.2 –2.4 0.2 Bahamas 172.2 181.1 161.3 147.0 24.8 12.4 26.4 –4.3 –17.4 –16.7 Bahrain 65.1 61.6 63.9 64.1 12.2 –2.6 –0.7 –6.8 2.8 –0.6 Belgium 324.4 356.5 324.0 314.5 59.3 61.1 7.6 –0.4 –19.6 –31.7 Brazil 4.5 4.4 2.6 4.8 3.3 0.1 1.6 –3.8 –1.8 2.2 Canada 60.9 66.1 73.6 66.9 11.4 9.6 –0.8 9.1 8.3 –9.3 Cayman Islands 770.6 944.0 753.8 755.6 188.4 175.7 –45.2 170.4 –188.9 0.2 Chinese Taipei 34.8 39.8 40.1 43.3 2.5 5.4 2.0 –3.4 0.6 2.8 Cyprus ... 23.4 22.3 23.1 ... – ... – –0.7 0.1 Denmark 38.4 32.2 27.7 32.8 13.4 –5.0 –7.7 –2.5 –3.3 3.5 Finland 8.6 9.8 9.4 12.1 –0.5 1.8 –2.4 –0.6 0.1 2.1 France 176.3 147.3 152.2 162.8 26.3 –21.3 –12.4 –9.0 9.5 3.7 Germany 445.5 397.4 362.6 334.9 4.2 –15.1 2.2 –42.2 –20.9 1.9 Greece 64.2 61.6 51.5 48.3 21.0 0.7 –3.0 –4.0 –7.7 –5.4 Guernsey 69.2 63.0 62.2 61.5 9.9 1.1 –2.7 –0.3 –0.1 –4.0 Hong Kong SAR 161.8 163.1 160.8 168.7 42.4 3.6 3.8 2.2 –1.1 5.9 Ireland 303.4 180.0 151.4 166.1 40.4 –107.9 –46.5 –82.2 –24.0 6.3 Isle of Man 58.1 49.4 44.9 49.5 9.9 2.5 –1.6 1.1 –3.6 –0.4 Italy 46.1 57.4 57.1 61.0 –6.3 6.0 –2.7 1.6 2.0 0.5 Japan 171.4 260.4 241.6 233.6 20.8 77.7 12.7 58.8 –11.1 –12.3 Jersey 220.6 135.8 117.3 121.4 54.1 –63.9 –8.9 –15.4 –16.1 –4.4 Luxembourg 207.6 170.9 172.0 175.5 –8.1 –27.4 –2.1 –26.3 6.9 –4.9 Malaysia 12.8 10.4 10.6 11.5 – –1.8 –0.5 –0.7 0.6 0.6 Netherlands 286.0 251.4 258.3 268.7 18.0 –16.3 –3.3 –63.8 13.3 0.3 Norway 86.8 19.1 17.3 19.1 13.0 2.1 2.0 –0.4 –1.7 1.3 Portugal 34.8 29.1 28.7 30.2 5.6 –3.6 0.5 –4.7 0.7 –0.2 Singapore 264.5 262.2 257.7 266.5 49.9 0.2 3.5 –1.8 0.5 2.5 South Korea 4.4 4.4 4.1 6.3 0.1 –0.1 –1.9 0.5 –0.3 2.1 Spain 103.0 101.4 90.4 95.7 0.5 3.3 –7.7 1.3 –7.9 0.9 Sweden 34.3 34.1 28.7 30.3 –3.9 2.7 –5.0 8.8 –4.9 0.1 Switzerland 547.7 509.7 489.1 494.9 83.8 –18.3 1.2 –28.7 –9.3 –11.3 Turkey 4.2 5.9 5.8 5.7 0.4 2.0 0.6 1.2 0.1 –0.3 United Kingdom 2,124.9 1,792.2 1,834.2 1,911.1 499.0 –227.2 1.9 –339.8 75.8 –1.4 United States 1,077.6 929.8 801.5 793.3 175.9 –220.3 –122.3 –111.8 –127.0 –9.5 Other 114.9 93.1 90.0 101.3 20.8 –12.8 –1.6 3.0 –0.5 7.7
Table 2B: External positions of banks in all currencies vis-à-vis the non-bank sectorIndividual reporting countriesin billions of US dollars
Amounts outstanding Estimated exchange rate adjusted changes
BIS Quarterly Review, December 2009 A 9
Reporting countries Dec 2007 Dec 2008 Mar 2009 Jun 2009 2007 2008 Q3 2008 Q4 2008 Q1 2009 Q2 2009
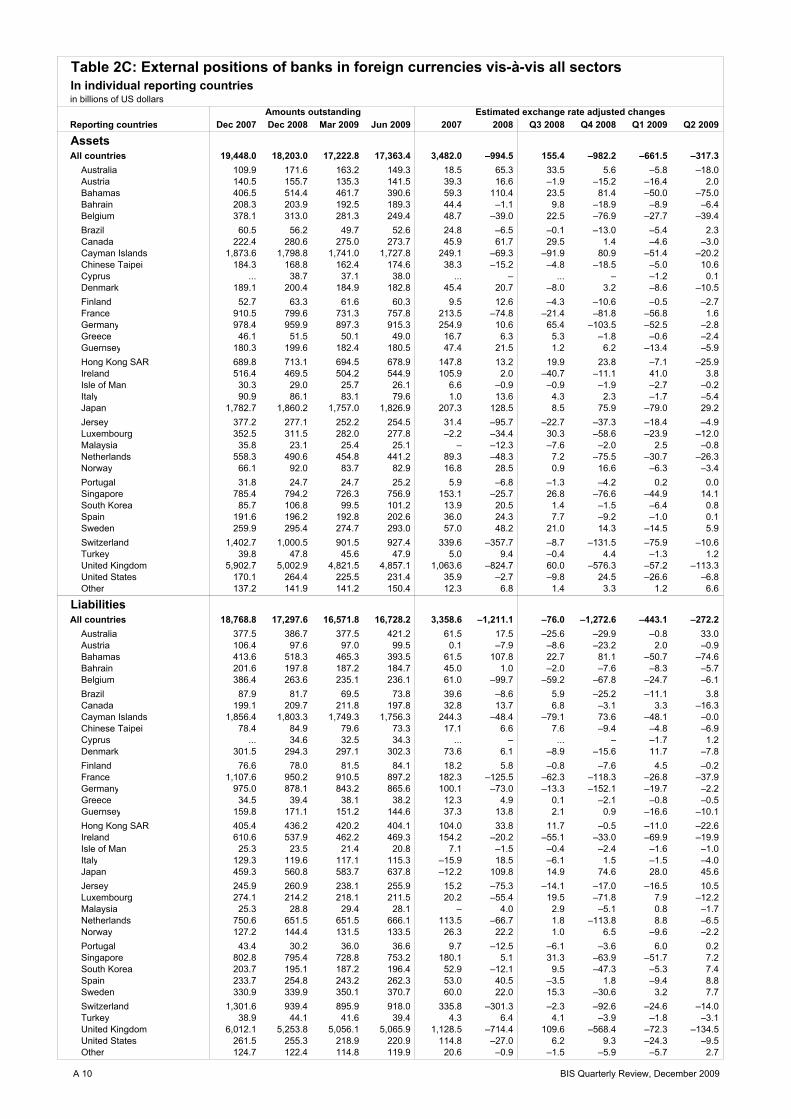
AssetsAll countries 19,448.0 18,203.0 17,222.8 17,363.4 3,482.0 –994.5 155.4 –982.2 –661.5 –317.3
Australia 109.9 171.6 163.2 149.3 18.5 65.3 33.5 5.6 –5.8 –18.0 Austria 140.5 155.7 135.3 141.5 39.3 16.6 –1.9 –15.2 –16.4 2.0 Bahamas 406.5 514.4 461.7 390.6 59.3 110.4 23.5 81.4 –50.0 –75.0 Bahrain 208.3 203.9 192.5 189.3 44.4 –1.1 9.8 –18.9 –8.9 –6.4 Belgium 378.1 313.0 281.3 249.4 48.7 –39.0 22.5 –76.9 –27.7 –39.4 Brazil 60.5 56.2 49.7 52.6 24.8 –6.5 –0.1 –13.0 –5.4 2.3 Canada 222.4 280.6 275.0 273.7 45.9 61.7 29.5 1.4 –4.6 –3.0 Cayman Islands 1,873.6 1,798.8 1,741.0 1,727.8 249.1 –69.3 –91.9 80.9 –51.4 –20.2 Chinese Taipei 184.3 168.8 162.4 174.6 38.3 –15.2 –4.8 –18.5 –5.0 10.6 Cyprus ... 38.7 37.1 38.0 ... – ... – –1.2 0.1 Denmark 189.1 200.4 184.9 182.8 45.4 20.7 –8.0 3.2 –8.6 –10.5 Finland 52.7 63.3 61.6 60.3 9.5 12.6 –4.3 –10.6 –0.5 –2.7 France 910.5 799.6 731.3 757.8 213.5 –74.8 –21.4 –81.8 –56.8 1.6 Germany 978.4 959.9 897.3 915.3 254.9 10.6 65.4 –103.5 –52.5 –2.8 Greece 46.1 51.5 50.1 49.0 16.7 6.3 5.3 –1.8 –0.6 –2.4 Guernsey 180.3 199.6 182.4 180.5 47.4 21.5 1.2 6.2 –13.4 –5.9 Hong Kong SAR 689.8 713.1 694.5 678.9 147.8 13.2 19.9 23.8 –7.1 –25.9 Ireland 516.4 469.5 504.2 544.9 105.9 2.0 –40.7 –11.1 41.0 3.8 Isle of Man 30.3 29.0 25.7 26.1 6.6 –0.9 –0.9 –1.9 –2.7 –0.2 Italy 90.9 86.1 83.1 79.6 1.0 13.6 4.3 2.3 –1.7 –5.4 Japan 1,782.7 1,860.2 1,757.0 1,826.9 207.3 128.5 8.5 75.9 –79.0 29.2 Jersey 377.2 277.1 252.2 254.5 31.4 –95.7 –22.7 –37.3 –18.4 –4.9 Luxembourg 352.5 311.5 282.0 277.8 –2.2 –34.4 30.3 –58.6 –23.9 –12.0 Malaysia 35.8 23.1 25.4 25.1 – –12.3 –7.6 –2.0 2.5 –0.8 Netherlands 558.3 490.6 454.8 441.2 89.3 –48.3 7.2 –75.5 –30.7 –26.3 Norway 66.1 92.0 83.7 82.9 16.8 28.5 0.9 16.6 –6.3 –3.4 Portugal 31.8 24.7 24.7 25.2 5.9 –6.8 –1.3 –4.2 0.2 0.0 Singapore 785.4 794.2 726.3 756.9 153.1 –25.7 26.8 –76.6 –44.9 14.1 South Korea 85.7 106.8 99.5 101.2 13.9 20.5 1.4 –1.5 –6.4 0.8 Spain 191.6 196.2 192.8 202.6 36.0 24.3 7.7 –9.2 –1.0 0.1 Sweden 259.9 295.4 274.7 293.0 57.0 48.2 21.0 14.3 –14.5 5.9 Switzerland 1,402.7 1,000.5 901.5 927.4 339.6 –357.7 –8.7 –131.5 –75.9 –10.6 Turkey 39.8 47.8 45.6 47.9 5.0 9.4 –0.4 4.4 –1.3 1.2 United Kingdom 5,902.7 5,002.9 4,821.5 4,857.1 1,063.6 –824.7 60.0 –576.3 –57.2 –113.3 United States 170.1 264.4 225.5 231.4 35.9 –2.7 –9.8 24.5 –26.6 –6.8 Other 137.2 141.9 141.2 150.4 12.3 6.8 1.4 3.3 1.2 6.6
LiabilitiesAll countries 18,768.8 17,297.6 16,571.8 16,728.2 3,358.6 –1,211.1 –76.0 –1,272.6 –443.1 –272.2
Australia 377.5 386.7 377.5 421.2 61.5 17.5 –25.6 –29.9 –0.8 33.0 Austria 106.4 97.6 97.0 99.5 0.1 –7.9 –8.6 –23.2 2.0 –0.9 Bahamas 413.6 518.3 465.3 393.5 61.5 107.8 22.7 81.1 –50.7 –74.6 Bahrain 201.6 197.8 187.2 184.7 45.0 1.0 –2.0 –7.6 –8.3 –5.7 Belgium 386.4 263.6 235.1 236.1 61.0 –99.7 –59.2 –67.8 –24.7 –6.1 Brazil 87.9 81.7 69.5 73.8 39.6 –8.6 5.9 –25.2 –11.1 3.8 Canada 199.1 209.7 211.8 197.8 32.8 13.7 6.8 –3.1 3.3 –16.3 Cayman Islands 1,856.4 1,803.3 1,749.3 1,756.3 244.3 –48.4 –79.1 73.6 –48.1 –0.0 Chinese Taipei 78.4 84.9 79.6 73.3 17.1 6.6 7.6 –9.4 –4.8 –6.9 Cyprus ... 34.6 32.5 34.3 ... – ... – –1.7 1.2 Denmark 301.5 294.3 297.1 302.3 73.6 6.1 –8.9 –15.6 11.7 –7.8 Finland 76.6 78.0 81.5 84.1 18.2 5.8 –0.8 –7.6 4.5 –0.2 France 1,107.6 950.2 910.5 897.2 182.3 –125.5 –62.3 –118.3 –26.8 –37.9 Germany 975.0 878.1 843.2 865.6 100.1 –73.0 –13.3 –152.1 –19.7 –2.2 Greece 34.5 39.4 38.1 38.2 12.3 4.9 0.1 –2.1 –0.8 –0.5 Guernsey 159.8 171.1 151.2 144.6 37.3 13.8 2.1 0.9 –16.6 –10.1 Hong Kong SAR 405.4 436.2 420.2 404.1 104.0 33.8 11.7 –0.5 –11.0 –22.6 Ireland 610.6 537.9 462.2 469.3 154.2 –20.2 –55.1 –33.0 –69.9 –19.9 Isle of Man 25.3 23.5 21.4 20.8 7.1 –1.5 –0.4 –2.4 –1.6 –1.0 Italy 129.3 119.6 117.1 115.3 –15.9 18.5 –6.1 1.5 –1.5 –4.0 Japan 459.3 560.8 583.7 637.8 –12.2 109.8 14.9 74.6 28.0 45.6 Jersey 245.9 260.9 238.1 255.9 15.2 –75.3 –14.1 –17.0 –16.5 10.5 Luxembourg 274.1 214.2 218.1 211.5 20.2 –55.4 19.5 –71.8 7.9 –12.2 Malaysia 25.3 28.8 29.4 28.1 – 4.0 2.9 –5.1 0.8 –1.7 Netherlands 750.6 651.5 651.5 666.1 113.5 –66.7 1.8 –113.8 8.8 –6.5 Norway 127.2 144.4 131.5 133.5 26.3 22.2 1.0 6.5 –9.6 –2.2 Portugal 43.4 30.2 36.0 36.6 9.7 –12.5 –6.1 –3.6 6.0 0.2 Singapore 802.8 795.4 728.8 753.2 180.1 5.1 31.3 –63.9 –51.7 7.2 South Korea 203.7 195.1 187.2 196.4 52.9 –12.1 9.5 –47.3 –5.3 7.4 Spain 233.7 254.8 243.2 262.3 53.0 40.5 –3.5 1.8 –9.4 8.8 Sweden 330.9 339.9 350.1 370.7 60.0 22.0 15.3 –30.6 3.2 7.7 Switzerland 1,301.6 939.4 895.9 918.0 335.8 –301.3 –2.3 –92.6 –24.6 –14.0 Turkey 38.9 44.1 41.6 39.4 4.3 6.4 4.1 –3.9 –1.8 –3.1 United Kingdom 6,012.1 5,253.8 5,056.1 5,065.9 1,128.5 –714.4 109.6 –568.4 –72.3 –134.5 United States 261.5 255.3 218.9 220.9 114.8 –27.0 6.2 9.3 –24.3 –9.5 Other 124.7 122.4 114.8 119.9 20.6 –0.9 –1.5 –5.9 –5.7 2.7
Table 2C: External positions of banks in foreign currencies vis-à-vis all sectorsIn individual reporting countriesin billions of US dollars
Amounts outstanding Estimated exchange rate adjusted changes
A 10 BIS Quarterly Review, December 2009

Reporting countries Dec 2007 Dec 2008 Mar 2009 Jun 2009 2007 2008 Q3 2008 Q4 2008 Q1 2009 Q2 2009
AssetsAll countries 7,618.7 6,791.5 6,563.4 6,724.6 1,339.8 –715.5 13.0 –622.3 –122.6 3.4
Australia 42.7 59.8 55.8 53.7 8.8 19.4 8.0 –6.0 –2.9 –3.9 Austria 57.3 61.3 55.3 56.1 13.3 4.2 0.6 –5.7 –4.2 –0.7 Bahamas 27.9 30.4 24.0 17.8 –0.9 2.8 1.0 0.4 –6.0 –6.2 Bahrain 111.7 124.1 115.9 113.5 28.0 14.8 1.6 3.2 –6.9 –3.8 Belgium 149.1 132.7 119.1 97.0 –4.0 –2.0 1.4 –7.8 –12.2 –27.0 Brazil 7.5 6.0 5.5 5.5 5.4 –1.3 0.2 –6.4 –0.3 –0.1 Canada 104.5 105.7 102.4 99.0 10.1 2.4 –1.8 –1.2 –3.1 –3.8 Cayman Islands 496.9 467.2 469.2 504.6 47.1 –28.2 19.7 –59.2 3.0 34.1 Chinese Taipei 123.3 97.4 90.3 99.7 27.7 –25.8 –11.5 –19.8 –6.5 8.9 Cyprus ... 14.0 13.0 14.2 ... – ... – –0.8 0.9 Denmark 40.6 47.0 42.8 49.8 –0.1 8.3 –4.1 2.4 –2.6 4.9 Finland 2.9 6.6 5.7 4.2 0.2 3.6 –0.0 2.8 –0.8 –1.5 France 328.3 294.1 267.6 277.3 74.1 –34.6 –19.5 –17.4 –22.4 4.1 Germany 455.8 424.3 413.1 419.5 120.6 –20.7 15.0 –30.5 –7.3 –0.8 Greece 13.4 15.6 15.7 16.1 7.1 2.4 1.6 –0.6 0.2 0.2 Guernsey 49.2 54.7 54.3 55.0 24.7 5.6 –0.3 4.1 0.0 0.2 Hong Kong SAR 130.6 148.9 127.2 135.4 21.9 18.2 10.0 13.8 –19.9 6.2 Ireland 270.7 244.7 268.0 280.3 74.9 –11.7 –9.3 –20.9 25.8 –1.7 Isle of Man 7.6 1.5 1.4 1.6 1.6 –6.1 –0.1 0.0 –0.0 0.1 Italy 24.3 22.2 21.5 22.3 5.8 5.2 0.5 0.5 –0.3 0.1 Japan 1,309.0 1,231.7 1,228.6 1,300.0 153.6 –37.4 –19.9 –15.5 15.4 39.3 Jersey 10.7 7.6 7.1 6.8 0.5 –3.0 –1.7 –0.3 –0.4 –0.4 Luxembourg 132.4 127.1 122.3 122.4 10.2 –3.2 13.3 –8.4 –2.4 –2.9 Malaysia 0.9 1.4 3.1 3.5 – 0.5 0.2 –0.0 1.7 0.3 Netherlands 176.9 152.7 158.6 169.8 42.8 –19.6 –4.8 –18.6 6.9 7.4 Norway 29.5 31.8 31.7 33.6 3.8 4.6 2.0 –0.2 0.6 1.0 Portugal 6.1 6.3 6.5 6.3 1.9 0.3 –0.1 –0.2 0.2 –0.3 Singapore 197.8 214.9 204.7 210.8 53.2 15.2 9.7 –27.8 –5.0 1.7 South Korea 41.1 43.2 42.5 43.3 8.5 2.1 –1.6 –2.2 –0.4 0.5 Spain 82.6 85.0 81.9 89.9 12.4 9.7 1.0 –4.8 –2.1 4.4 Sweden 74.3 95.7 91.2 89.7 15.2 24.7 9.8 9.6 –1.9 –5.2 Switzerland 150.0 134.7 113.3 115.8 32.1 –13.2 3.8 –24.4 –19.4 –0.4 Turkey 1.5 1.8 1.7 1.7 –2.3 0.4 0.4 –0.1 –0.1 –0.0 United Kingdom 2,868.1 2,157.8 2,071.4 2,073.8 529.7 –701.4 –6.4 –427.8 –40.6 –52.3 United States 48.4 88.3 77.3 82.1 10.4 39.6 –3.9 49.0 –8.4 1.7 Other 45.4 53.6 53.7 52.5 1.9 8.5 –1.6 –2.0 0.7 –1.8
LiabilitiesAll countries 5,303.4 4,965.7 4,722.4 4,747.7 1,104.5 –181.4 –117.7 –297.6 –173.3 –54.9
Australia 112.6 103.7 102.4 107.8 24.9 –5.3 –33.8 –11.5 0.9 2.5 Austria 16.0 12.9 12.4 11.9 1.2 –2.9 –1.7 –2.3 –0.4 –0.7 Bahamas 172.2 181.1 161.3 147.0 24.8 12.4 26.4 –4.3 –17.4 –16.7 Bahrain 65.1 61.6 63.9 64.1 12.2 –2.6 –0.7 –6.8 2.8 –0.6 Belgium 103.7 108.5 95.2 81.3 19.9 18.0 –1.3 2.8 –11.5 –21.3 Brazil 4.0 4.3 2.5 4.5 3.0 0.5 1.6 –3.8 –1.8 2.0 Canada 46.0 48.5 53.7 43.0 12.3 3.3 –0.9 6.7 5.4 –11.4 Cayman Islands 770.5 943.9 753.7 755.5 188.4 175.7 –45.2 170.4 –188.9 0.2 Chinese Taipei 29.1 33.7 34.6 36.6 3.8 4.6 2.9 –0.5 1.1 1.8 Cyprus ... 15.0 13.9 13.9 ... – ... – –1.1 –0.2 Denmark 30.8 27.5 22.3 27.5 12.6 –2.1 –7.0 –2.5 –4.3 4.0 Finland 4.0 2.7 3.1 3.6 0.6 –1.3 0.3 –1.5 0.5 0.4 France 80.4 50.9 60.5 59.8 18.1 –27.4 –12.5 –7.9 10.0 –1.8 Germany 162.7 125.6 116.4 88.6 13.8 –27.7 5.2 –30.2 –7.5 –2.1 Greece 11.1 15.4 14.5 14.1 5.4 4.2 1.3 0.1 –0.7 –0.5 Guernsey 44.9 45.4 43.8 40.6 12.3 1.0 –3.2 0.5 –1.1 –3.7 Hong Kong SAR 126.0 126.0 125.2 131.0 35.0 2.5 4.2 0.9 0.5 3.7 Ireland 179.7 104.2 91.8 99.4 44.2 –67.9 –37.6 –49.7 –11.4 3.1 Isle of Man 19.9 18.1 15.2 14.7 4.0 –1.6 –0.4 –1.8 –2.4 –0.9 Italy 5.0 5.5 5.5 5.5 –1.0 1.8 0.6 0.3 0.0 –0.1 Japan 123.3 177.4 168.4 164.6 16.9 56.7 9.8 39.2 –7.4 –6.6 Jersey 141.3 84.5 72.7 68.3 42.8 –56.1 –6.0 –12.9 –10.2 –6.0 Luxembourg 73.7 54.3 56.4 57.8 –3.3 –17.6 –4.4 –15.9 2.9 0.1 Malaysia 3.8 2.9 3.3 3.5 – –0.7 0.1 –0.2 0.4 0.1 Netherlands 165.3 136.1 148.4 153.3 16.1 –22.9 –9.3 –29.8 13.7 1.6 Norway 75.9 13.3 11.9 13.5 11.8 5.8 0.6 –0.7 –1.1 1.2 Portugal 4.8 4.6 4.8 4.0 1.0 0.1 –1.4 –0.4 0.1 –1.0 Singapore 264.5 262.2 257.7 266.5 49.9 0.2 3.5 –1.8 0.5 2.5 South Korea 4.4 4.4 4.1 6.3 0.1 –0.1 –1.9 0.5 –0.3 2.1 Spain 30.1 33.5 29.1 31.5 6.2 4.4 –2.6 –0.2 –4.2 1.7 Sweden 15.1 23.0 17.9 18.0 1.4 8.0 –3.4 10.2 –4.7 –0.7 Switzerland 510.6 471.4 451.6 456.0 81.4 –17.4 1.4 –28.3 –11.0 –10.7 Turkey 3.4 4.7 4.5 4.6 0.2 1.5 0.4 0.8 –0.1 –0.1 United Kingdom 1,802.2 1,559.2 1,608.8 1,654.4 409.0 –228.4 –1.5 –325.8 82.0 2.1 United States 36.2 41.9 35.7 35.1 22.5 6.5 –0.2 5.9 –5.0 –1.9 Other 65.3 57.9 55.5 60.0 13.1 –6.6 –1.0 2.9 –1.6 3.2
Table 2D: External positions of banks in foreign currencies vis-à-vis the non-bank sectorIn individual reporting countriesin billions of US dollars
Amounts outstanding Estimated exchange rate adjusted changes
BIS Quarterly Review, December 2009 A 11

Reporting countries Dec 2007 Dec 2008 Mar 2009 Jun 2009 2007 2008 Q3 2008 Q4 2008 Q1 2009 Q2 2009
LoansAll countries 24,541.2 22,728.7 21,532.0 21,891.4 4,519.0 –1,023.9 189.7 –1,499.1 –678.8 –394.4
Australia 71.2 88.9 86.8 98.1 8.8 24.8 6.2 6.3 –1.4 5.4 Austria 307.8 339.8 326.5 340.7 55.6 47.2 –1.6 –15.7 –0.7 –2.7 Bahamas 389.5 497.1 449.9 384.5 60.0 110.3 24.1 82.2 –44.5 –69.3 Bahrain 208.3 203.9 192.5 189.3 44.4 –1.1 9.8 –18.9 –8.9 –6.4 Belgium 792.4 636.3 574.2 580.7 143.9 –95.5 46.5 –195.9 –41.2 –21.0 Brazil 40.5 34.8 28.3 30.3 20.0 –8.0 –3.0 –7.0 –5.5 1.4 Canada 242.8 301.4 288.5 298.3 34.4 75.4 35.4 5.7 –10.5 3.8 Cayman Islands 1,673.1 1,554.9 1,543.1 1,571.5 196.3 –113.3 –64.9 93.8 –6.8 22.5 Chinese Taipei 70.2 86.6 85.1 86.8 12.6 16.2 11.7 –2.3 –0.6 0.7 Cyprus ... 53.6 59.7 63.4 ... – ... – 7.4 1.1 Denmark 191.4 192.2 179.8 174.1 40.2 10.1 –12.5 –2.3 –5.4 –13.9 Finland 90.8 104.8 99.4 102.6 10.0 17.9 –2.5 –6.1 –2.2 –0.7 France 1,610.6 1,472.3 1,345.1 1,390.5 251.7 –50.6 –28.3 –63.0 –77.5 –24.1 Germany 2,353.7 2,310.6 2,092.5 2,189.8 304.9 70.3 91.6 –120.1 –142.1 –2.9 Greece 84.9 122.5 129.5 147.0 32.0 41.6 14.1 13.9 11.0 10.4 Guernsey 199.8 190.1 169.9 171.5 50.7 8.9 1.9 –6.4 –16.8 –6.9 Hong Kong SAR 588.9 548.2 551.3 516.0 146.7 –48.1 32.0 –48.5 11.2 –42.5 Ireland 526.2 492.3 483.4 512.2 75.9 10.2 –47.3 –1.2 4.4 –7.5 Isle of Man 93.5 81.7 76.7 84.3 14.0 7.5 –3.2 1.2 –3.7 –0.8 Italy 451.6 299.1 264.5 276.2 3.6 22.2 –24.3 11.4 –22.4 –2.9 Japan 888.6 1,130.8 954.9 934.4 235.3 157.9 14.2 81.5 –136.0 –42.1 Jersey 490.7 377.1 347.9 337.0 64.8 –69.9 –8.8 –36.0 –21.1 –31.9 Luxembourg 742.3 690.2 624.2 628.8 69.0 –15.7 36.7 –85.4 –41.2 –26.6 Malaysia 31.2 19.0 21.6 21.3 – –11.8 –7.8 –1.7 2.8 –0.8 Netherlands 973.2 803.0 774.8 764.1 195.4 –114.9 25.5 –206.3 –6.8 –44.4 Norway 54.7 75.7 69.5 67.8 14.7 26.0 –3.6 11.8 –5.3 –3.6 Portugal 101.9 83.9 82.4 83.5 10.2 –12.7 –3.0 –12.4 1.5 –3.1 Singapore 741.2 701.1 654.0 695.1 142.0 –71.6 9.2 –85.9 –26.8 26.1 South Korea 67.6 80.1 74.8 74.1 12.8 12.1 4.4 0.2 –4.7 –1.3 Spain 369.4 347.0 322.2 335.8 67.7 4.8 –1.9 –51.7 –12.7 –3.5 Sweden 223.6 204.9 204.8 221.1 50.9 –1.3 11.9 –15.9 4.8 6.3 Switzerland 1,443.1 1,030.2 923.0 937.2 350.8 –373.6 –3.0 –171.9 –79.8 –23.6 Turkey 40.5 48.0 46.0 48.5 5.3 10.0 –0.8 3.9 –0.9 1.3 United Kingdom 5,374.5 4,674.4 4,495.6 4,561.6 1,198.1 –428.9 111.1 –400.7 –67.1 –139.8 United States 2,912.9 2,746.6 2,804.2 2,862.3 535.8 –290.3 –80.5 –264.3 69.8 45.4 Other 98.7 105.6 105.3 111.0 14.1 8.9 0.3 8.2 1.1 3.9
DepositsAll countries 27,129.3 24,282.5 22,985.7 23,273.5 4,685.3 –1,762.7 65.7 –1,751.5 –801.0 –518.4
Australia 131.8 126.6 132.2 139.2 49.8 4.1 14.2 –9.7 7.2 –1.1 Austria 211.4 200.1 200.4 201.8 18.8 0.7 –2.2 –44.0 7.6 –8.6 Bahamas 400.9 507.2 453.5 381.1 55.3 109.2 23.2 81.8 –51.4 –75.1 Bahrain 201.6 197.8 187.2 184.7 45.0 1.0 –2.0 –7.6 –8.3 –5.7 Belgium 892.4 635.9 572.7 611.3 143.4 –196.5 –75.3 –191.2 –41.5 11.1 Brazil 68.8 63.5 53.9 60.8 32.0 –6.4 5.3 –20.5 –8.7 6.3 Canada 261.0 269.7 273.0 273.4 44.3 23.7 0.6 9.3 6.3 –7.5 Cayman Islands 1,675.7 1,629.0 1,614.2 1,621.6 193.5 –43.8 –93.3 62.1 –11.0 2.4 Chinese Taipei 79.9 87.4 81.2 76.2 16.2 8.0 7.3 –12.5 –5.6 –5.7 Cyprus ... 72.9 83.3 95.4 ... – ... – 12.3 8.1 Denmark 247.3 212.6 213.0 212.5 64.8 –22.7 –4.4 –44.5 7.7 –10.4 Finland 74.7 86.7 87.1 93.7 11.6 16.2 –0.3 –7.2 2.3 3.6 France 2,156.7 1,872.3 1,737.4 1,758.7 380.8 –186.6 –32.9 –168.6 –76.2 –59.4 Germany 1,532.4 1,375.3 1,300.9 1,351.5 99.9 –83.9 39.0 –212.0 –27.2 –14.8 Greece 143.4 152.9 146.9 154.4 44.5 18.0 5.3 –12.5 –0.6 0.1 Guernsey 193.1 197.3 172.8 170.9 41.3 19.3 6.8 1.7 –20.8 –9.7 Hong Kong SAR 447.5 460.5 446.1 432.7 108.7 15.6 13.6 –6.4 –9.7 –19.4 Ireland 1,151.7 1,023.0 903.1 933.0 199.2 –44.3 –79.9 –64.8 –92.3 –24.3 Isle of Man 68.6 59.8 56.5 61.6 15.9 4.3 –1.2 0.3 –2.2 –0.9 Italy 941.1 650.6 635.6 680.1 183.6 –28.9 –12.7 –74.0 9.8 9.1 Japan 687.0 918.8 883.4 964.0 11.2 173.3 6.7 144.0 –4.2 65.4 Jersey 344.1 226.2 207.0 204.0 29.0 –89.3 –11.0 –28.3 –14.9 –15.5 Luxembourg 691.1 655.3 590.0 593.0 74.4 –8.0 52.9 –44.3 –40.8 –25.7 Malaysia 30.8 31.5 32.0 32.4 – 1.7 1.7 –7.9 1.1 –0.2 Netherlands 1,067.9 825.6 811.3 844.0 182.9 –168.2 33.1 –302.9 9.2 –5.2 Norway 95.1 113.1 115.7 115.4 24.9 32.3 4.5 6.5 1.5 –3.9 Portugal 241.8 202.4 195.4 203.0 23.5 –26.8 –5.3 –19.8 0.9 –2.6 Singapore 710.1 665.7 617.1 653.3 165.1 –34.9 13.8 –74.6 –37.5 22.9 South Korea 137.5 118.0 109.5 113.4 37.9 –22.4 10.8 –42.7 –7.0 2.9 Spain 634.1 686.5 676.8 718.6 102.5 99.5 –15.7 –5.7 12.1 3.7 Sweden 218.1 205.9 205.8 203.0 23.3 3.8 20.4 –16.9 –3.2 –10.3 Switzerland 1,393.4 1,030.8 987.5 1,019.5 342.4 –305.9 –2.0 –107.4 –18.5 –9.2 Turkey 54.2 57.9 51.9 51.5 5.5 9.2 5.2 –5.0 –4.2 –2.3 United Kingdom 6,245.1 5,137.8 4,901.0 4,888.5 1,365.8 –775.0 171.4 –550.4 –133.0 –245.4 United States 3,564.4 3,390.8 3,118.7 3,038.4 535.7 –269.3 –30.1 24.3 –260.0 –91.8 Other 134.5 135.4 131.7 137.0 12.9 9.3 –1.8 –0.5 –0.3 0.8
Table 3A: External loans and deposits of banks in all currencies vis-à-vis all sectorsIn individual reporting countriesin billions of US dollars
Amounts outstanding Estimated exchange rate adjusted changes
A 12 BIS Quarterly Review, December 2009

Reporting countries Dec 2007 Dec 2008 Mar 2009 Jun 2009 2007 2008 Q3 2008 Q4 2008 Q1 2009 Q2 2009
LoansAll countries 6,442.3 6,167.9 5,914.5 6,033.4 1,119.7 –94.7 152.1 –579.3 –123.9 –68.6
Australia 26.9 23.1 24.7 25.8 1.6 –1.4 –6.3 –2.5 1.8 –0.3 Austria 124.3 145.5 140.5 148.3 26.9 26.8 2.4 4.1 0.8 0.4 Bahamas 17.9 19.7 18.2 16.9 0.8 2.1 0.8 0.2 –1.2 –1.6 Bahrain 111.7 124.1 115.9 113.5 28.0 14.8 1.6 3.2 –6.9 –3.8 Belgium 173.1 155.3 136.1 147.5 3.4 0.2 –11.8 –21.5 –14.5 3.5 Brazil 2.8 3.4 1.5 2.1 2.4 0.9 0.1 –3.9 –1.8 0.5 Canada 102.5 107.0 98.7 102.3 –3.9 13.5 1.9 3.6 –7.3 0.6 Cayman Islands 378.3 370.5 385.0 393.2 34.9 –7.2 42.3 –60.4 15.2 7.4 Chinese Taipei 24.1 30.3 27.6 27.8 3.8 5.9 4.3 –2.1 –2.4 0.1 Cyprus ... 15.3 15.4 17.2 ... – ... – 0.5 1.2 Denmark 50.5 44.4 42.2 48.5 3.2 –3.7 –4.2 –5.8 –0.6 4.1 Finland 9.4 22.0 15.7 12.3 2.4 12.7 1.0 10.2 –5.4 –4.1 France 242.8 267.6 268.6 273.8 56.5 34.6 4.0 16.1 8.1 –5.2 Germany 725.7 736.1 684.5 725.6 126.6 48.6 38.3 –58.3 –30.1 13.1 Greece 12.0 17.5 17.7 18.8 8.1 5.8 2.5 0.4 0.4 0.7 Guernsey 31.7 36.6 40.9 42.2 23.6 6.4 0.5 2.1 4.5 –0.2 Hong Kong SAR 66.7 73.4 74.7 70.4 16.9 7.0 9.7 –13.9 1.9 –5.0 Ireland 187.1 182.5 163.0 165.8 22.6 1.8 –9.5 –4.4 –14.9 –5.6 Isle of Man 21.3 6.9 7.3 8.1 2.1 –12.2 –0.2 –0.4 0.6 –0.2 Italy 67.7 64.8 64.2 67.9 –0.4 11.1 0.9 1.6 1.8 0.1 Japan 356.7 448.9 420.2 382.7 65.0 86.0 23.4 43.1 –16.8 –48.6 Jersey 20.6 13.1 13.6 14.2 4.5 –5.1 –2.2 –0.5 0.8 –0.6 Luxembourg 198.7 195.5 189.5 193.7 22.7 5.6 2.1 –8.7 0.9 –5.2 Malaysia 1.6 3.1 4.5 4.9 – 1.6 0.4 0.2 1.5 0.2 Netherlands 239.9 236.5 238.0 254.1 38.8 11.5 6.4 –50.8 7.2 6.8 Norway 13.9 17.8 18.6 18.8 2.0 4.7 1.4 0.2 0.9 –0.2 Portugal 15.0 20.0 21.2 22.2 3.8 6.2 1.0 1.0 1.8 –0.1 Singapore 197.8 214.9 204.7 210.8 53.2 15.2 9.7 –27.8 –5.0 1.7 South Korea 37.0 40.3 39.2 39.6 8.5 3.2 1.1 –1.4 –0.8 0.0 Spain 83.9 84.2 81.5 89.3 9.6 5.4 7.5 –0.4 –0.1 3.6 Sweden 56.1 60.1 59.1 60.2 5.3 8.6 3.1 –3.7 0.2 –1.3 Switzerland 165.7 145.0 119.9 121.9 39.1 –19.5 2.7 –31.7 –22.0 –1.4 Turkey 1.2 1.2 1.0 1.2 –0.4 0.2 0.5 –0.5 –0.2 0.2 United Kingdom 2,014.5 1,655.7 1,560.1 1,558.9 430.2 –298.8 53.3 –303.2 –61.3 –58.1 United States 625.2 538.8 554.3 588.0 65.0 –92.7 –36.7 –61.7 18.1 30.7 Other 38.0 46.6 46.5 45.0 2.2 9.3 –0.0 –1.9 0.6 –2.1
DepositsAll countries 7,456.4 6,937.7 6,473.7 6,546.3 1,228.7 –311.8 –181.4 –480.5 –343.3 –92.7
Australia 39.6 31.2 40.2 40.7 12.7 –4.6 –3.1 –5.3 9.1 –2.1 Austria 64.9 64.6 59.7 63.1 7.4 2.7 –2.8 0.2 –2.4 0.2 Bahamas 161.6 172.6 151.3 135.5 19.0 14.3 27.2 –3.4 –19.0 –18.1 Bahrain 65.1 61.6 63.9 64.1 12.2 –2.6 –0.7 –6.8 2.8 –0.6 Belgium 256.2 266.1 237.6 248.7 49.6 34.6 1.6 –17.0 –18.4 –7.1 Brazil 1.7 4.0 2.5 4.8 0.7 2.5 1.6 –4.1 –1.4 2.2 Canada 60.9 66.1 73.6 66.9 11.4 9.5 –0.9 9.1 8.3 –9.3 Cayman Islands 740.7 924.4 736.6 739.8 183.3 185.6 –42.6 173.3 –186.8 1.8 Chinese Taipei 33.6 39.0 39.3 42.5 2.1 5.9 2.0 –3.2 0.6 2.8 Cyprus ... 23.3 22.1 22.9 ... – ... – –0.8 0.1 Denmark 38.4 32.2 27.7 32.8 13.4 –5.0 –7.7 –2.5 –3.3 3.5 Finland 8.6 9.8 9.4 12.1 –0.5 1.8 –2.4 –0.6 0.1 2.1 France 176.3 147.3 152.2 162.8 26.3 –21.3 –12.4 –9.0 9.5 3.7 Germany 445.5 397.4 362.6 334.9 4.2 –15.1 2.2 –42.2 –20.9 1.9 Greece 64.2 61.6 51.5 48.3 21.0 0.7 –3.0 –4.0 –7.7 –5.4 Guernsey 62.0 54.9 53.2 54.8 9.9 –0.1 –1.9 –2.4 –1.0 –1.3 Hong Kong SAR 149.2 149.3 148.3 156.3 39.5 2.2 3.3 1.7 0.2 6.1 Ireland 303.4 180.0 151.4 166.1 40.4 –107.9 –46.5 –82.2 –24.0 6.3 Isle of Man 58.1 49.4 44.9 49.5 9.9 2.5 –1.6 1.1 –3.6 –0.4 Italy 46.1 56.6 56.3 60.2 –6.3 6.0 –2.7 1.6 2.0 0.5 Japan 171.4 260.4 241.6 233.6 20.8 77.7 12.7 58.8 –11.1 –12.3 Jersey 217.4 130.0 116.9 117.3 55.2 –67.8 –9.5 –17.7 –10.8 –7.9 Luxembourg 207.6 170.9 172.0 175.5 –8.1 –27.4 –2.1 –26.3 6.9 –4.9 Malaysia 7.3 6.6 7.1 7.4 – –0.3 –0.1 –0.2 0.7 0.0 Netherlands 286.0 251.4 258.3 268.7 18.0 –16.3 –3.3 –63.8 13.3 0.3 Norway 12.3 12.9 12.7 14.4 3.9 2.2 2.2 –1.3 –0.3 1.3 Portugal 34.8 29.1 28.7 30.2 5.6 –3.6 0.5 –4.7 0.7 –0.2 Singapore 264.5 262.2 257.7 266.5 49.9 0.2 3.5 –1.8 0.5 2.5 South Korea 1.6 2.4 2.5 3.3 –0.4 0.7 –0.1 0.8 0.2 0.7 Spain 103.0 101.4 90.4 95.7 0.5 3.3 –7.7 1.3 –7.9 0.9 Sweden 22.3 19.0 20.0 21.5 –3.6 –1.3 –0.6 0.5 1.1 0.4 Switzerland 547.7 509.7 489.1 494.9 83.8 –18.3 1.2 –28.7 –9.3 –11.3 Turkey 4.2 5.9 5.8 5.7 0.4 2.0 0.6 1.1 0.1 –0.3 United Kingdom 1,741.3 1,450.5 1,477.0 1,501.2 407.1 –196.9 20.9 –317.2 50.3 –38.3 United States 972.0 851.0 727.0 716.5 129.8 –190.1 –109.4 –90.7 –122.8 –11.8 Other 87.2 83.0 82.5 87.1 9.5 3.1 0.2 5.1 1.8 1.3
Table 3B: External loans and deposits of banks in all currencies vis-à-vis the non-bank sectorIn individual reporting currenciesin billions of US dollars
Amounts outstanding Estimated exchange rate adjusted changes
BIS Quarterly Review, December 2009 A 13
Reporting countries Dec 2007 Dec 2008 Mar 2009 Jun 2009 2007 2008 Q3 2008 Q4 2008 Q1 2009 Q2 2009
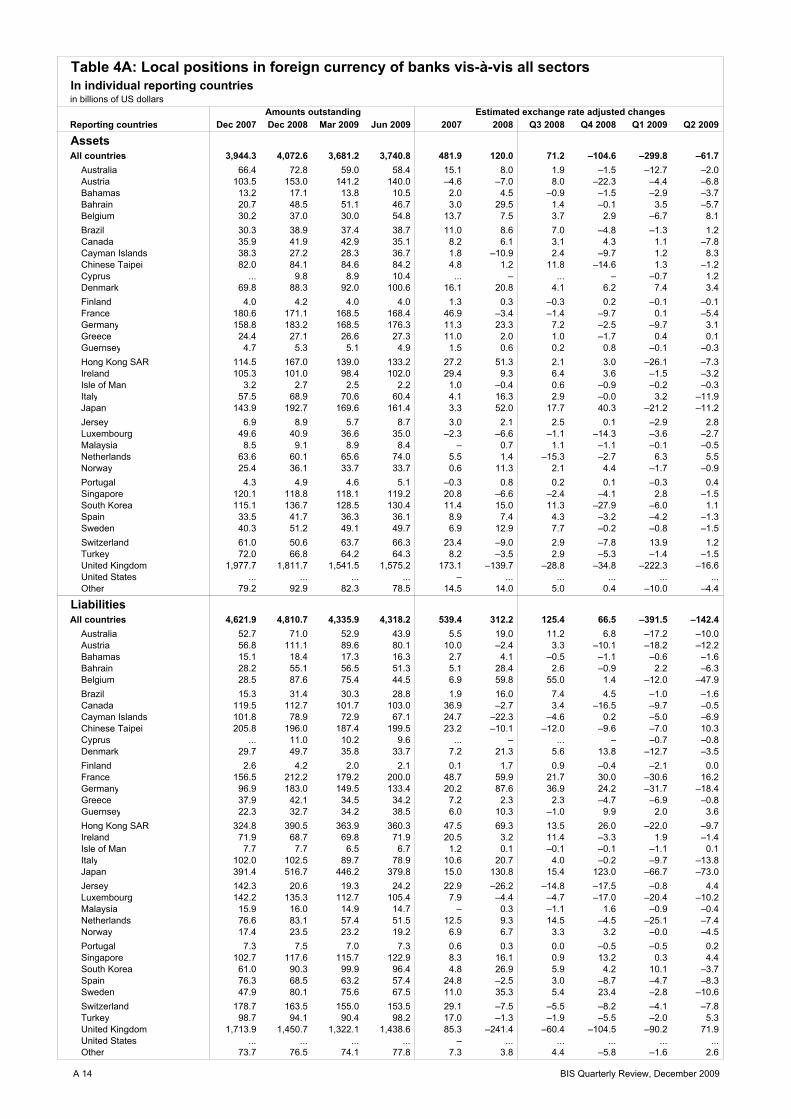
AssetsAll countries 3,944.3 4,072.6 3,681.2 3,740.8 481.9 120.0 71.2 –104.6 –299.8 –61.7
Australia 66.4 72.8 59.0 58.4 15.1 8.0 1.9 –1.5 –12.7 –2.0 Austria 103.5 153.0 141.2 140.0 –4.6 –7.0 8.0 –22.3 –4.4 –6.8 Bahamas 13.2 17.1 13.8 10.5 2.0 4.5 –0.9 –1.5 –2.9 –3.7 Bahrain 20.7 48.5 51.1 46.7 3.0 29.5 1.4 –0.1 3.5 –5.7 Belgium 30.2 37.0 30.0 54.8 13.7 7.5 3.7 2.9 –6.7 8.1 Brazil 30.3 38.9 37.4 38.7 11.0 8.6 7.0 –4.8 –1.3 1.2 Canada 35.9 41.9 42.9 35.1 8.2 6.1 3.1 4.3 1.1 –7.8 Cayman Islands 38.3 27.2 28.3 36.7 1.8 –10.9 2.4 –9.7 1.2 8.3 Chinese Taipei 82.0 84.1 84.6 84.2 4.8 1.2 11.8 –14.6 1.3 –1.2 Cyprus ... 9.8 8.9 10.4 ... – ... – –0.7 1.2 Denmark 69.8 88.3 92.0 100.6 16.1 20.8 4.1 6.2 7.4 3.4 Finland 4.0 4.2 4.0 4.0 1.3 0.3 –0.3 0.2 –0.1 –0.1 France 180.6 171.1 168.5 168.4 46.9 –3.4 –1.4 –9.7 0.1 –5.4 Germany 158.8 183.2 168.5 176.3 11.3 23.3 7.2 –2.5 –9.7 3.1 Greece 24.4 27.1 26.6 27.3 11.0 2.0 1.0 –1.7 0.4 0.1 Guernsey 4.7 5.3 5.1 4.9 1.5 0.6 0.2 0.8 –0.1 –0.3 Hong Kong SAR 114.5 167.0 139.0 133.2 27.2 51.3 2.1 3.0 –26.1 –7.3 Ireland 105.3 101.0 98.4 102.0 29.4 9.3 6.4 3.6 –1.5 –3.2 Isle of Man 3.2 2.7 2.5 2.2 1.0 –0.4 0.6 –0.9 –0.2 –0.3 Italy 57.5 68.9 70.6 60.4 4.1 16.3 2.9 –0.0 3.2 –11.9 Japan 143.9 192.7 169.6 161.4 3.3 52.0 17.7 40.3 –21.2 –11.2 Jersey 6.9 8.9 5.7 8.7 3.0 2.1 2.5 0.1 –2.9 2.8 Luxembourg 49.6 40.9 36.6 35.0 –2.3 –6.6 –1.1 –14.3 –3.6 –2.7 Malaysia 8.5 9.1 8.9 8.4 – 0.7 1.1 –1.1 –0.1 –0.5 Netherlands 63.6 60.1 65.6 74.0 5.5 1.4 –15.3 –2.7 6.3 5.5 Norway 25.4 36.1 33.7 33.7 0.6 11.3 2.1 4.4 –1.7 –0.9 Portugal 4.3 4.9 4.6 5.1 –0.3 0.8 0.2 0.1 –0.3 0.4 Singapore 120.1 118.8 118.1 119.2 20.8 –6.6 –2.4 –4.1 2.8 –1.5 South Korea 115.1 136.7 128.5 130.4 11.4 15.0 11.3 –27.9 –6.0 1.1 Spain 33.5 41.7 36.3 36.1 8.9 7.4 4.3 –3.2 –4.2 –1.3 Sweden 40.3 51.2 49.1 49.7 6.9 12.9 7.7 –0.2 –0.8 –1.5 Switzerland 61.0 50.6 63.7 66.3 23.4 –9.0 2.9 –7.8 13.9 1.2 Turkey 72.0 66.8 64.2 64.3 8.2 –3.5 2.9 –5.3 –1.4 –1.5 United Kingdom 1,977.7 1,811.7 1,541.5 1,575.2 173.1 –139.7 –28.8 –34.8 –222.3 –16.6 United States ... ... ... ... – ... ... ... ... ... Other 79.2 92.9 82.3 78.5 14.5 14.0 5.0 0.4 –10.0 –4.4
LiabilitiesAll countries 4,621.9 4,810.7 4,335.9 4,318.2 539.4 312.2 125.4 66.5 –391.5 –142.4
Australia 52.7 71.0 52.9 43.9 5.5 19.0 11.2 6.8 –17.2 –10.0 Austria 56.8 111.1 89.6 80.1 10.0 –2.4 3.3 –10.1 –18.2 –12.2 Bahamas 15.1 18.4 17.3 16.3 2.7 4.1 –0.5 –1.1 –0.6 –1.6 Bahrain 28.2 55.1 56.5 51.3 5.1 28.4 2.6 –0.9 2.2 –6.3 Belgium 28.5 87.6 75.4 44.5 6.9 59.8 55.0 1.4 –12.0 –47.9 Brazil 15.3 31.4 30.3 28.8 1.9 16.0 7.4 4.5 –1.0 –1.6 Canada 119.5 112.7 101.7 103.0 36.9 –2.7 3.4 –16.5 –9.7 –0.5 Cayman Islands 101.8 78.9 72.9 67.1 24.7 –22.3 –4.6 0.2 –5.0 –6.9 Chinese Taipei 205.8 196.0 187.4 199.5 23.2 –10.1 –12.0 –9.6 –7.0 10.3 Cyprus ... 11.0 10.2 9.6 ... – ... – –0.7 –0.8 Denmark 29.7 49.7 35.8 33.7 7.2 21.3 5.6 13.8 –12.7 –3.5 Finland 2.6 4.2 2.0 2.1 0.1 1.7 0.9 –0.4 –2.1 0.0 France 156.5 212.2 179.2 200.0 48.7 59.9 21.7 30.0 –30.6 16.2 Germany 96.9 183.0 149.5 133.4 20.2 87.6 36.9 24.2 –31.7 –18.4 Greece 37.9 42.1 34.5 34.2 7.2 2.3 2.3 –4.7 –6.9 –0.8 Guernsey 22.3 32.7 34.2 38.5 6.0 10.3 –1.0 9.9 2.0 3.6 Hong Kong SAR 324.8 390.5 363.9 360.3 47.5 69.3 13.5 26.0 –22.0 –9.7 Ireland 71.9 68.7 69.8 71.9 20.5 3.2 11.4 –3.3 1.9 –1.4 Isle of Man 7.7 7.7 6.5 6.7 1.2 0.1 –0.1 –0.1 –1.1 0.1 Italy 102.0 102.5 89.7 78.9 10.6 20.7 4.0 –0.2 –9.7 –13.8 Japan 391.4 516.7 446.2 379.8 15.0 130.8 15.4 123.0 –66.7 –73.0 Jersey 142.3 20.6 19.3 24.2 22.9 –26.2 –14.8 –17.5 –0.8 4.4 Luxembourg 142.2 135.3 112.7 105.4 7.9 –4.4 –4.7 –17.0 –20.4 –10.2 Malaysia 15.9 16.0 14.9 14.7 – 0.3 –1.1 1.6 –0.9 –0.4 Netherlands 76.6 83.1 57.4 51.5 12.5 9.3 14.5 –4.5 –25.1 –7.4 Norway 17.4 23.5 23.2 19.2 6.9 6.7 3.3 3.2 –0.0 –4.5 Portugal 7.3 7.5 7.0 7.3 0.6 0.3 0.0 –0.5 –0.5 0.2 Singapore 102.7 117.6 115.7 122.9 8.3 16.1 0.9 13.2 0.3 4.4 South Korea 61.0 90.3 99.9 96.4 4.8 26.9 5.9 4.2 10.1 –3.7 Spain 76.3 68.5 63.2 57.4 24.8 –2.5 3.0 –8.7 –4.7 –8.3 Sweden 47.9 80.1 75.6 67.5 11.0 35.3 5.4 23.4 –2.8 –10.6 Switzerland 178.7 163.5 155.0 153.5 29.1 –7.5 –5.5 –8.2 –4.1 –7.8 Turkey 98.7 94.1 90.4 98.2 17.0 –1.3 –1.9 –5.5 –2.0 5.3 United Kingdom 1,713.9 1,450.7 1,322.1 1,438.6 85.3 –241.4 –60.4 –104.5 –90.2 71.9 United States ... ... ... ... – ... ... ... ... ... Other 73.7 76.5 74.1 77.8 7.3 3.8 4.4 –5.8 –1.6 2.6
Table 4A: Local positions in foreign currency of banks vis-à-vis all sectorsIn individual reporting countriesin billions of US dollars
Amounts outstanding Estimated exchange rate adjusted changes
A 14 BIS Quarterly Review, December 2009
Reporting countries Dec 2007 Dec 2008 Mar 2009 Jun 2009 2007 2008 Q3 2008 Q4 2008 Q1 2009 Q2 2009
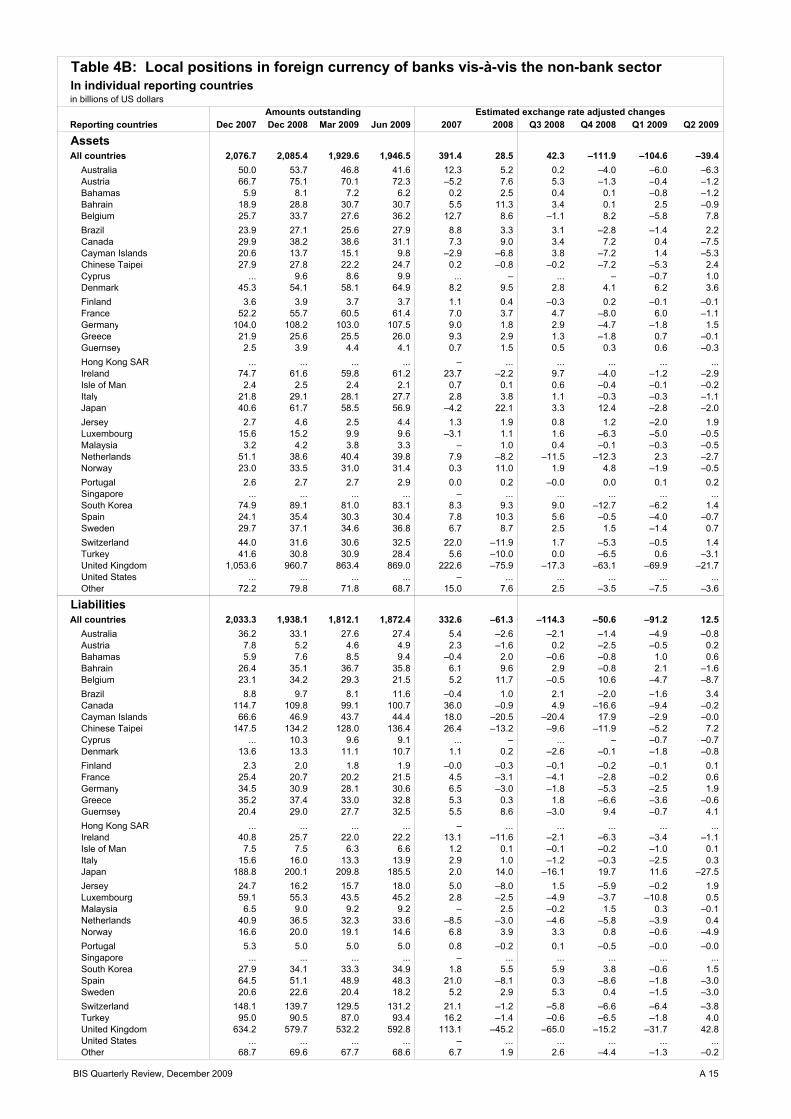
AssetsAll countries 2,076.7 2,085.4 1,929.6 1,946.5 391.4 28.5 42.3 –111.9 –104.6 –39.4
Australia 50.0 53.7 46.8 41.6 12.3 5.2 0.2 –4.0 –6.0 –6.3 Austria 66.7 75.1 70.1 72.3 –5.2 7.6 5.3 –1.3 –0.4 –1.2 Bahamas 5.9 8.1 7.2 6.2 0.2 2.5 0.4 0.1 –0.8 –1.2 Bahrain 18.9 28.8 30.7 30.7 5.5 11.3 3.4 0.1 2.5 –0.9 Belgium 25.7 33.7 27.6 36.2 12.7 8.6 –1.1 8.2 –5.8 7.8 Brazil 23.9 27.1 25.6 27.9 8.8 3.3 3.1 –2.8 –1.4 2.2 Canada 29.9 38.2 38.6 31.1 7.3 9.0 3.4 7.2 0.4 –7.5 Cayman Islands 20.6 13.7 15.1 9.8 –2.9 –6.8 3.8 –7.2 1.4 –5.3 Chinese Taipei 27.9 27.8 22.2 24.7 0.2 –0.8 –0.2 –7.2 –5.3 2.4 Cyprus ... 9.6 8.6 9.9 ... – ... – –0.7 1.0 Denmark 45.3 54.1 58.1 64.9 8.2 9.5 2.8 4.1 6.2 3.6 Finland 3.6 3.9 3.7 3.7 1.1 0.4 –0.3 0.2 –0.1 –0.1 France 52.2 55.7 60.5 61.4 7.0 3.7 4.7 –8.0 6.0 –1.1 Germany 104.0 108.2 103.0 107.5 9.0 1.8 2.9 –4.7 –1.8 1.5 Greece 21.9 25.6 25.5 26.0 9.3 2.9 1.3 –1.8 0.7 –0.1 Guernsey 2.5 3.9 4.4 4.1 0.7 1.5 0.5 0.3 0.6 –0.3 Hong Kong SAR ... ... ... ... – ... ... ... ... ... Ireland 74.7 61.6 59.8 61.2 23.7 –2.2 9.7 –4.0 –1.2 –2.9 Isle of Man 2.4 2.5 2.4 2.1 0.7 0.1 0.6 –0.4 –0.1 –0.2 Italy 21.8 29.1 28.1 27.7 2.8 3.8 1.1 –0.3 –0.3 –1.1 Japan 40.6 61.7 58.5 56.9 –4.2 22.1 3.3 12.4 –2.8 –2.0 Jersey 2.7 4.6 2.5 4.4 1.3 1.9 0.8 1.2 –2.0 1.9 Luxembourg 15.6 15.2 9.9 9.6 –3.1 1.1 1.6 –6.3 –5.0 –0.5 Malaysia 3.2 4.2 3.8 3.3 – 1.0 0.4 –0.1 –0.3 –0.5 Netherlands 51.1 38.6 40.4 39.8 7.9 –8.2 –11.5 –12.3 2.3 –2.7 Norway 23.0 33.5 31.0 31.4 0.3 11.0 1.9 4.8 –1.9 –0.5 Portugal 2.6 2.7 2.7 2.9 0.0 0.2 –0.0 0.0 0.1 0.2 Singapore ... ... ... ... – ... ... ... ... ... South Korea 74.9 89.1 81.0 83.1 8.3 9.3 9.0 –12.7 –6.2 1.4 Spain 24.1 35.4 30.3 30.4 7.8 10.3 5.6 –0.5 –4.0 –0.7 Sweden 29.7 37.1 34.6 36.8 6.7 8.7 2.5 1.5 –1.4 0.7 Switzerland 44.0 31.6 30.6 32.5 22.0 –11.9 1.7 –5.3 –0.5 1.4 Turkey 41.6 30.8 30.9 28.4 5.6 –10.0 0.0 –6.5 0.6 –3.1 United Kingdom 1,053.6 960.7 863.4 869.0 222.6 –75.9 –17.3 –63.1 –69.9 –21.7 United States ... ... ... ... – ... ... ... ... ... Other 72.2 79.8 71.8 68.7 15.0 7.6 2.5 –3.5 –7.5 –3.6
LiabilitiesAll countries 2,033.3 1,938.1 1,812.1 1,872.4 332.6 –61.3 –114.3 –50.6 –91.2 12.5
Australia 36.2 33.1 27.6 27.4 5.4 –2.6 –2.1 –1.4 –4.9 –0.8 Austria 7.8 5.2 4.6 4.9 2.3 –1.6 0.2 –2.5 –0.5 0.2 Bahamas 5.9 7.6 8.5 9.4 –0.4 2.0 –0.6 –0.8 1.0 0.6 Bahrain 26.4 35.1 36.7 35.8 6.1 9.6 2.9 –0.8 2.1 –1.6 Belgium 23.1 34.2 29.3 21.5 5.2 11.7 –0.5 10.6 –4.7 –8.7 Brazil 8.8 9.7 8.1 11.6 –0.4 1.0 2.1 –2.0 –1.6 3.4 Canada 114.7 109.8 99.1 100.7 36.0 –0.9 4.9 –16.6 –9.4 –0.2 Cayman Islands 66.6 46.9 43.7 44.4 18.0 –20.5 –20.4 17.9 –2.9 –0.0 Chinese Taipei 147.5 134.2 128.0 136.4 26.4 –13.2 –9.6 –11.9 –5.2 7.2 Cyprus ... 10.3 9.6 9.1 ... – ... – –0.7 –0.7 Denmark 13.6 13.3 11.1 10.7 1.1 0.2 –2.6 –0.1 –1.8 –0.8 Finland 2.3 2.0 1.8 1.9 –0.0 –0.3 –0.1 –0.2 –0.1 0.1 France 25.4 20.7 20.2 21.5 4.5 –3.1 –4.1 –2.8 –0.2 0.6 Germany 34.5 30.9 28.1 30.6 6.5 –3.0 –1.8 –5.3 –2.5 1.9 Greece 35.2 37.4 33.0 32.8 5.3 0.3 1.8 –6.6 –3.6 –0.6 Guernsey 20.4 29.0 27.7 32.5 5.5 8.6 –3.0 9.4 –0.7 4.1 Hong Kong SAR ... ... ... ... – ... ... ... ... ... Ireland 40.8 25.7 22.0 22.2 13.1 –11.6 –2.1 –6.3 –3.4 –1.1 Isle of Man 7.5 7.5 6.3 6.6 1.2 0.1 –0.1 –0.2 –1.0 0.1 Italy 15.6 16.0 13.3 13.9 2.9 1.0 –1.2 –0.3 –2.5 0.3 Japan 188.8 200.1 209.8 185.5 2.0 14.0 –16.1 19.7 11.6 –27.5 Jersey 24.7 16.2 15.7 18.0 5.0 –8.0 1.5 –5.9 –0.2 1.9 Luxembourg 59.1 55.3 43.5 45.2 2.8 –2.5 –4.9 –3.7 –10.8 0.5 Malaysia 6.5 9.0 9.2 9.2 – 2.5 –0.2 1.5 0.3 –0.1 Netherlands 40.9 36.5 32.3 33.6 –8.5 –3.0 –4.6 –5.8 –3.9 0.4 Norway 16.6 20.0 19.1 14.6 6.8 3.9 3.3 0.8 –0.6 –4.9 Portugal 5.3 5.0 5.0 5.0 0.8 –0.2 0.1 –0.5 –0.0 –0.0 Singapore ... ... ... ... – ... ... ... ... ... South Korea 27.9 34.1 33.3 34.9 1.8 5.5 5.9 3.8 –0.6 1.5 Spain 64.5 51.1 48.9 48.3 21.0 –8.1 0.3 –8.6 –1.8 –3.0 Sweden 20.6 22.6 20.4 18.2 5.2 2.9 5.3 0.4 –1.5 –3.0 Switzerland 148.1 139.7 129.5 131.2 21.1 –1.2 –5.8 –6.6 –6.4 –3.8 Turkey 95.0 90.5 87.0 93.4 16.2 –1.4 –0.6 –6.5 –1.8 4.0 United Kingdom 634.2 579.7 532.2 592.8 113.1 –45.2 –65.0 –15.2 –31.7 42.8 United States ... ... ... ... – ... ... ... ... ... Other 68.7 69.6 67.7 68.6 6.7 1.9 2.6 –4.4 –1.3 –0.2
Table 4B: Local positions in foreign currency of banks vis-à-vis the non-bank sectorIn individual reporting countriesin billions of US dollars
Amounts outstanding Estimated exchange rate adjusted changes
BIS Quarterly Review, December 2009 A 15

Currencies Dec 2007 Dec 2008 Mar 2009 Jun 2009 2007 2008 Q3 2008 Q4 2008 Q1 2009 Q2 2009
Assets
All Currencies 33,440.6 31,139.8 29,565.1 30,267.1 5,719.3 –1,364.1 130.8 –1,791.1 –811.6 –415.2
A) Domestic currency 13,992.7 12,936.7 12,342.3 12,903.6 2,237.3 –369.6 –24.6 –808.9 –150.1 –97.9
U.S. dollar 2,791.0 2,497.9 2,594.3 2,647.1 531.9 –320.3 –70.4 –315.9 96.4 52.8
Euro 8,820.0 8,345.4 7,770.2 8,150.5 1,103.8 66.9 58.6 –417.4 –205.5 –98.1
Yen 619.0 715.5 591.1 634.7 216.2 –55.5 –36.2 –34.5 –74.2 30.0
Pound sterling 1,212.5 846.0 861.9 917.8 321.8 –49.0 18.2 –1.9 23.8 –72.4
Swiss franc 136.5 115.3 108.4 107.1 21.7 –25.2 –1.0 –41.7 0.7 –7.0
Other 413.5 416.6 416.4 446.4 42.0 13.5 6.2 2.6 8.6 –3.2
B) Foreign currency 17,924.5 16,647.7 15,753.6 15,875.2 3,178.8 –983.2 107.2 –929.1 –611.2 –307.9
U.S. dollar 9,940.1 9,658.6 9,305.4 8,994.7 1,533.8 –298.0 138.6 –480.5 –355.1 –309.7
Euro 4,132.3 3,729.8 3,425.9 3,615.2 618.8 –253.1 34.4 –93.7 –139.5 –22.5
Yen 671.1 648.4 472.4 540.4 180.9 –191.4 15.7 –157.5 –133.4 56.8
Pound sterling 1,257.1 914.8 950.8 1,021.3 395.7 –4.8 4.8 23.7 50.8 –69.7
Swiss franc 389.9 369.3 348.5 359.2 50.5 –41.5 –17.1 –30.3 3.3 –7.6
Other 1,534.0 1,326.9 1,250.6 1,344.4 399.2 –194.4 –69.2 –190.7 –37.4 44.8
C) Unallocated 1,523.4 1,555.3 1,469.2 1,488.3 303.2 –11.3 48.2 –53.1 –50.3 –9.4
Liabilities
All Currencies 31,418.1 29,010.5 27,627.7 28,158.7 5,448.1 –1,425.5 9.5 –1,759.9 –772.9 –484.0
A) Domestic currency 12,649.2 11,712.9 11,055.9 11,430.5 2,089.5 –214.5 85.6 –487.3 –329.8 –211.9
US dollar 3,454.0 3,257.6 3,018.7 2,931.1 475.4 –274.6 –49.6 –14.1 –238.9 –87.6
Euro 6,834.8 6,378.8 5,997.4 6,289.7 1,024.3 –2.2 102.5 –493.6 –100.0 –75.3
Yen 252.6 381.3 322.2 348.6 23.8 61.0 –8.5 67.6 –32.0 19.0
Pound sterling 1,484.0 1,032.1 1,057.3 1,146.5 477.0 –80.8 22.3 –64.2 31.9 –69.5
Swiss franc 91.8 91.4 91.6 101.4 6.7 –4.6 0.3 –14.7 6.1 4.8
Other 532.0 571.7 568.7 613.2 82.4 86.7 18.6 31.8 3.2 –3.1
B) Foreign currency 17,527.5 16,030.8 15,388.4 15,534.3 3,070.3 –1,253.0 –119.0 –1,208.3 –380.8 –257.5
U.S. dollar 10,021.5 9,259.2 9,139.0 9,011.7 1,648.0 –770.7 –101.2 –827.7 –126.8 –126.5
Euro 3,475.0 3,261.8 3,077.5 3,184.6 481.5 –78.6 63.4 –30.7 –45.1 –80.8
Yen 824.2 820.2 636.2 690.2 298.3 –208.6 –16.1 –191.6 –129.8 39.3
Pound sterling 1,326.1 1,003.5 909.1 970.3 319.1 29.1 –15.4 79.2 –77.9 –72.1
Swiss franc 395.2 405.0 394.2 392.0 25.8 –22.2 –0.1 –46.7 13.8 –22.6
Other 1,485.4 1,281.1 1,232.3 1,285.5 297.6 –202.1 –49.4 –190.7 –14.9 5.1
C) Unallocated 1,241.4 1,266.8 1,183.4 1,193.9 288.3 41.9 42.9 –64.3 –62.3 –14.6
Table 5A: Currency Breakdown Reporting banks' cross-border positions vis-à-vis all sectorsin billions of US dollars
Amounts outstanding Estimated exchange rate adjusted changes
A 16 BIS Quarterly Review, December 2009

Currencies Dec 2007 Dec 2008 Mar 2009 Jun 2009 2007 2008 Q3 2008 Q4 2008 Q1 2009 Q2 2009
Assets
All currencies 11,936.4 10,858.8 10,456.3 10,873.1 1,809.2 –745.0 35.0 –868.2 –139.2 43.3
A) Domestic currency 4,317.6 4,067.3 3,892.8 4,148.5 469.5 –29.4 21.9 –245.9 –16.5 39.9
U.S. dollar 615.5 459.0 485.0 514.1 87.3 –162.5 –35.3 –136.2 26.0 29.1
Euro 3,023.4 2,998.6 2,809.0 3,006.5 289.5 175.3 57.6 –72.4 –57.1 30.1
Yen 212.2 256.1 227.5 229.3 34.7 –9.3 –8.0 –5.5 –9.9 –3.2
Pound sterling 283.6 193.8 206.3 214.1 49.1 –12.7 18.1 –18.9 14.5 –22.5
Swiss franc 33.7 27.8 27.1 27.5 3.7 –7.3 –0.7 –7.9 1.1 –1.0
Other 149.2 132.0 138.0 157.0 5.1 –12.9 –9.7 –5.0 8.9 7.3
B) Foreign currency 7,276.4 6,406.4 6,211.3 6,358.9 1,267.9 –756.4 –6.4 –608.9 –97.1 –3.4
U.S. dollar 4,391.8 3,941.5 3,882.3 3,897.5 760.6 –444.2 23.3 –447.4 –59.5 15.7
Euro 1,499.8 1,277.2 1,242.3 1,285.3 225.7 –154.5 –9.5 –38.4 20.3 –32.8
Yen 287.1 225.1 152.8 163.6 33.9 –128.4 10.8 –111.1 –58.0 7.3
Pound sterling 354.9 300.8 315.8 335.5 65.2 53.9 8.2 29.4 19.8 –26.5
Swiss franc 136.5 124.7 116.1 119.6 13.4 –21.8 –0.1 –1.8 –0.4 –2.7
Other 606.3 537.2 502.0 557.3 169.0 –61.5 –39.1 –39.6 –19.4 35.6
C) Unallocated 342.3 385.1 352.2 365.7 71.9 40.9 19.4 –13.4 –25.5 6.8
Liabilities
All currencies 8,309.2 7,646.8 7,160.7 7,283.4 1,432.3 –363.0 –255.3 –503.9 –348.6 –70.2
A) Domestic currency 3,005.8 2,681.1 2,438.3 2,535.8 327.8 –181.5 –137.7 –206.3 –175.3 –15.3
US dollar 1,041.3 887.9 765.9 758.2 153.4 –226.8 –122.1 –117.6 –122.0 –7.7
Euro 1,228.2 1,173.1 1,079.3 1,122.2 46.1 32.4 –9.2 –95.5 –41.6 –5.6
Yen 48.2 83.0 73.2 69.0 3.9 21.0 2.9 19.6 –3.7 –5.7
Pound sterling 464.5 333.4 318.0 365.5 104.6 –2.5 –0.3 –14.3 –12.3 –1.7
Swiss franc 37.1 38.3 37.5 38.9 2.5 –0.9 –0.2 –0.5 1.7 –0.6
Other 186.5 165.4 164.3 182.0 17.3 –4.8 –8.8 2.1 2.6 6.0
B) Foreign currency 4,891.4 4,556.5 4,321.4 4,332.3 1,016.2 –183.6 –124.5 –300.8 –171.9 –60.2
U.S. dollar 3,137.7 2,979.1 2,778.9 2,731.6 725.3 –147.2 –132.1 –181.4 –200.2 –28.6
Euro 986.7 936.9 952.8 999.6 174.5 47.4 –2.6 –19.4 55.0 –11.8
Yen 164.0 129.5 107.7 120.2 21.7 –70.6 8.5 –71.4 –12.7 9.5
Pound sterling 248.3 192.1 178.1 180.2 20.7 24.0 10.2 6.5 –10.9 –14.2
Swiss franc 69.8 67.9 58.5 57.2 5.2 –4.5 0.0 –0.7 –4.8 –4.2
Other 284.9 251.0 245.4 243.6 68.8 –32.7 –8.6 –34.4 1.7 –11.0
C) Unallocated 412.0 409.2 401.0 415.4 88.4 2.2 6.8 3.1 –1.3 5.4
Table 5B: Currency BreakdownReporting banks' cross border positions vis-à-vis non-banksIn billions of US dollars
Amounts outstanding Estimated exchange rate adjusted changes
BIS Quarterly Review, December 2009 A 17
Currencies Dec 2007 Dec 2008 Mar 2009 Jun 2009 2007 2008 Q3 2008 Q4 2008 Q1 2009 Q2 2009
Assets
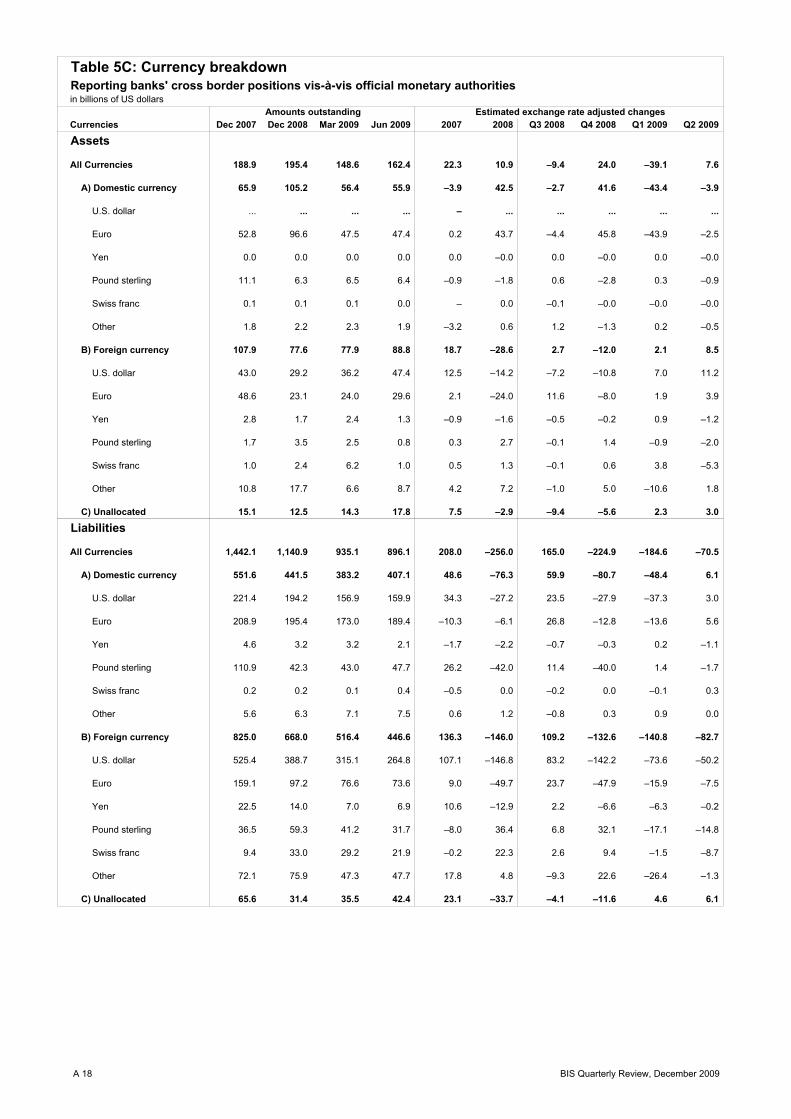
All Currencies 188.9 195.4 148.6 162.4 22.3 10.9 –9.4 24.0 –39.1 7.6
A) Domestic currency 65.9 105.2 56.4 55.9 –3.9 42.5 –2.7 41.6 –43.4 –3.9
U.S. dollar ... ... ... ... – ... ... ... ... ...
Euro 52.8 96.6 47.5 47.4 0.2 43.7 –4.4 45.8 –43.9 –2.5
Yen 0.0 0.0 0.0 0.0 0.0 –0.0 0.0 –0.0 0.0 –0.0
Pound sterling 11.1 6.3 6.5 6.4 –0.9 –1.8 0.6 –2.8 0.3 –0.9
Swiss franc 0.1 0.1 0.1 0.0 – 0.0 –0.1 –0.0 –0.0 –0.0
Other 1.8 2.2 2.3 1.9 –3.2 0.6 1.2 –1.3 0.2 –0.5
B) Foreign currency 107.9 77.6 77.9 88.8 18.7 –28.6 2.7 –12.0 2.1 8.5
U.S. dollar 43.0 29.2 36.2 47.4 12.5 –14.2 –7.2 –10.8 7.0 11.2
Euro 48.6 23.1 24.0 29.6 2.1 –24.0 11.6 –8.0 1.9 3.9
Yen 2.8 1.7 2.4 1.3 –0.9 –1.6 –0.5 –0.2 0.9 –1.2
Pound sterling 1.7 3.5 2.5 0.8 0.3 2.7 –0.1 1.4 –0.9 –2.0
Swiss franc 1.0 2.4 6.2 1.0 0.5 1.3 –0.1 0.6 3.8 –5.3
Other 10.8 17.7 6.6 8.7 4.2 7.2 –1.0 5.0 –10.6 1.8
C) Unallocated 15.1 12.5 14.3 17.8 7.5 –2.9 –9.4 –5.6 2.3 3.0
Liabilities
All Currencies 1,442.1 1,140.9 935.1 896.1 208.0 –256.0 165.0 –224.9 –184.6 –70.5
A) Domestic currency 551.6 441.5 383.2 407.1 48.6 –76.3 59.9 –80.7 –48.4 6.1
U.S. dollar 221.4 194.2 156.9 159.9 34.3 –27.2 23.5 –27.9 –37.3 3.0
Euro 208.9 195.4 173.0 189.4 –10.3 –6.1 26.8 –12.8 –13.6 5.6
Yen 4.6 3.2 3.2 2.1 –1.7 –2.2 –0.7 –0.3 0.2 –1.1
Pound sterling 110.9 42.3 43.0 47.7 26.2 –42.0 11.4 –40.0 1.4 –1.7
Swiss franc 0.2 0.2 0.1 0.4 –0.5 0.0 –0.2 0.0 –0.1 0.3
Other 5.6 6.3 7.1 7.5 0.6 1.2 –0.8 0.3 0.9 0.0
B) Foreign currency 825.0 668.0 516.4 446.6 136.3 –146.0 109.2 –132.6 –140.8 –82.7
U.S. dollar 525.4 388.7 315.1 264.8 107.1 –146.8 83.2 –142.2 –73.6 –50.2
Euro 159.1 97.2 76.6 73.6 9.0 –49.7 23.7 –47.9 –15.9 –7.5
Yen 22.5 14.0 7.0 6.9 10.6 –12.9 2.2 –6.6 –6.3 –0.2
Pound sterling 36.5 59.3 41.2 31.7 –8.0 36.4 6.8 32.1 –17.1 –14.8
Swiss franc 9.4 33.0 29.2 21.9 –0.2 22.3 2.6 9.4 –1.5 –8.7
Other 72.1 75.9 47.3 47.7 17.8 4.8 –9.3 22.6 –26.4 –1.3
C) Unallocated 65.6 31.4 35.5 42.4 23.1 –33.7 –4.1 –11.6 4.6 6.1
Table 5C: Currency breakdownReporting banks' cross border positions vis-à-vis official monetary authoritiesin billions of US dollars
Amounts outstanding Estimated exchange rate adjusted changes
A 18 BIS Quarterly Review, December 2009

Currencies Dec 2007 Dec 2008 Mar 2009 Jun 2009 2007 2008 Q3 2008 Q4 2008 Q1 2009 Q2 2009
Assets
All currencies 3,944.3 4,072.6 3,681.2 3,740.8 481.9 120.0 71.2 –104.6 –299.8 –61.7
US dollar 1,711.0 1,930.7 1,767.5 1,754.4 194.5 212.2 87.9 13.2 –163.3 –20.8
Euro 1,187.7 1,094.1 956.2 997.5 104.9 –30.3 –53.2 –10.8 –88.3 –17.3
Yen 169.9 156.8 138.2 147.1 40.0 –61.0 36.8 –61.4 –7.1 4.9
Pound sterling 140.6 123.3 126.3 145.7 26.6 24.2 6.0 6.6 5.0 –4.1
Swiss franc 223.2 251.6 240.6 239.3 –11.4 –12.1 11.6 –33.6 5.3 –14.0
Other 268.8 217.8 182.6 192.6 79.1 –62.2 –19.8 –18.1 –28.8 –0.3
Unallocated 243.1 298.2 269.9 264.3 48.2 49.2 1.8 –0.6 –22.6 –10.1
Liabilities
All currencies 4,621.9 4,810.7 4,335.9 4,318.2 539.4 312.2 125.4 66.5 –391.5 –142.4
US dollar 2,092.8 2,527.9 2,217.6 2,055.1 302.5 462.9 163.7 172.9 –310.3 –170.3
Euro 1,169.2 951.9 837.3 924.7 39.0 –115.8 –63.9 –38.1 –71.3 34.0
Yen 183.3 160.9 134.6 140.6 63.4 –64.0 1.7 –43.0 –14.9 2.3
Pound sterling 171.4 145.6 138.7 156.3 17.2 33.1 10.6 7.8 –4.6 –7.6
Swiss franc 130.8 121.9 121.7 122.1 6.9 –33.4 –4.7 –28.0 7.7 –6.1
Other 424.3 373.6 385.0 412.7 54.7 –54.5 1.7 –44.3 22.4 9.5
Unallocated 450.2 528.8 500.9 506.6 55.8 84.0 16.2 39.2 –20.4 –4.1
Assets
All currencies 2,076.7 2,085.4 1,929.6 1,946.5 391.4 28.5 42.3 –111.9 –104.6 –39.4
US dollar 966.9 1,015.1 976.1 964.9 149.3 56.3 79.9 –58.6 –39.1 –11.3
Euro 606.9 603.4 515.8 522.8 144.2 26.8 –29.7 5.4 –59.9 –24.0
Yen 88.2 99.3 97.1 100.3 20.5 –15.4 20.9 –27.6 5.5 0.9
Pound sterling 83.1 60.3 65.2 75.4 12.1 2.1 4.2 –8.0 5.9 0.1
Swiss franc 152.0 166.0 160.5 163.0 –4.8 6.0 9.5 –7.9 5.3 –5.9
Other 171.8 130.0 103.8 109.2 69.2 –50.9 –43.2 –15.8 –22.4 1.4
Unallocated 7.8 11.3 11.2 10.9 0.8 3.6 0.6 0.7 0.2 –0.5
Liabilities
All currencies 2,033.3 1,938.1 1,812.1 1,872.4 332.6 –61.3 –114.3 –50.6 –91.2 12.5
US dollar 1,146.8 1,124.0 1,049.1 1,057.4 213.7 –20.2 –81.5 –1.3 –74.9 8.2
Euro 554.1 509.4 454.3 500.3 82.5 –11.3 –40.1 –5.0 –32.0 17.1
Yen 56.5 64.4 60.9 64.4 7.2 –7.6 1.3 –21.7 1.5 2.0
Pound sterling 88.9 68.6 68.2 73.5 11.9 5.8 –1.5 –5.5 0.7 –5.1
Swiss franc 30.6 28.4 30.2 27.4 7.5 –4.1 –2.6 3.1 3.6 –4.3
Other 135.5 123.3 129.3 128.3 9.7 –23.7 8.4 –20.8 9.6 –5.8
Unallocated 20.9 20.1 20.0 21.0 0.0 –0.2 1.7 0.6 0.3 0.3
Vis-à-vis the non-bank sector
Amounts outstanding Estimated exchange rate adjusted changes
Table 5D: Currency breakdownReporting banks' local positions in foreign currencyin billions of US dollars
Vis-à-vis all sectors
BIS Quarterly Review, December 2009 A 19

Vis-à-vis countries Dec 2007 Dec 2008 Mar 2009 Jun 2009 2007 2008 Q3 2008 Q4 2008 Q1 2009 Q2 2009
AssetsAll countries 33,440,615 31,139,785 29,565,130 30,267,059 5,719,293 –1,364,067 130,848 –1,791,054 –811,580 –415,171 Developed Countries 26,274,950 24,282,308 23,028,304 23,698,737 4,263,974 –1,174,828 183,860 –1,360,234 –620,152 –286,794
i) Europe 19,278,065 17,597,488 16,605,206 17,264,625 3,321,583 –767,243 35,845 –1,165,126 –433,575 –219,598 Austria 290,145 282,648 268,668 268,382 38,326 17,796 3,792 –19,469 –2,665 –15,186 Andorra 2,435 2,178 2,615 2,766 –449 –207 –161 314 522 –9 Belgium 666,788 502,314 485,316 500,764 89,890 –119,135 –50,685 –115,903 –581 –7,955 Cyprus 54,868 75,131 90,674 102,782 15,485 22,007 3,151 6,949 17,424 7,646 Denmark 283,203 273,972 269,785 290,043 44,531 11,228 –6,762 –15,993 4,997 6,326 Finland 133,551 143,971 137,110 153,661 9,288 19,371 9,401 –8,310 –2,697 9,559 France 1,961,485 1,814,312 1,727,032 1,750,353 272,792 –75,315 –61,786 –114,696 –27,889 –59,169 Germany 1,788,119 1,749,128 1,664,617 1,790,502 182,115 33,241 19,940 –73,347 –18,465 37,034 Greece 196,990 209,104 212,175 233,745 19,584 1,033 8,507 –19,215 10,942 9,637 Iceland 66,927 31,166 26,952 27,351 25,843 –30,422 –7,043 –25,419 –3,087 –943 Ireland 1,188,240 1,246,914 1,146,616 1,212,336 288,226 138,387 189 7,533 –65,168 302 Italy 1,294,211 1,153,802 1,126,494 1,206,683 105,621 –61,182 –19,107 –107,655 19,514 13,979 Liechtenstein 8,582 8,368 7,839 8,009 –429 –130 –225 122 –159 –196 Luxembourg 949,533 975,634 829,979 878,957 179,990 89,710 33,794 –7,579 –109,818 8,540 Malta 37,465 44,678 41,317 41,344 3,821 8,771 2,301 –1,858 –2,055 –1,549 Netherlands 1,481,307 1,302,542 1,245,273 1,300,812 321,966 –88,803 39,733 –193,506 –13,206 –9,714 Norway 304,262 280,005 252,341 233,662 36,718 –13,705 –1,896 –20,732 –20,754 –28,403 Portugal 301,990 272,128 266,105 282,420 21,154 –14,452 –9,894 –17,281 5,080 970 Slovakia 21,925 27,286 15,451 16,811 8,321 6,210 1,272 742 –10,694 410 Slovenia 32,775 35,069 32,804 32,556 7,418 3,275 48 –291 –666 –2,164 Spain 1,110,288 1,107,995 1,061,481 1,106,256 132,360 77,100 31,135 –40,383 –4,826 –18,610 Sweden 326,945 307,744 288,121 303,989 53,780 –5,132 16,241 –25,966 –11,109 4,446 Switzerland 1,051,298 741,829 705,201 741,354 339,922 –279,552 10,208 –80,630 –14,917 3,743
(of which in CHF) 171,324 150,033 145,690 155,036 27,586 –31,330 –3,911 –9,971 5,417 1,471 United Kingdom 5,723,066 5,007,728 4,699,404 4,777,294 1,124,939 –507,314 13,901 –292,513 –183,379 –178,147
(of which in GBP) 976,619 716,562 762,434 829,874 367,382 –4,252 9,660 30,325 57,431 –45,316 Vatican 11 1 41 – 8 –3 58 –51 39 –42 Other 1,656 1,841 1,795 1,793 363 –21 –269 12 40 –102
LiabilitiesAll Countries 31,418,054 29,010,515 27,627,730 28,158,730 5,448,105 –1,425,522 9,511 –1,759,861 –772,897 –484,016 Developed Countries 20,554,394 18,889,797 17,765,168 18,172,848 3,606,546 –1,045,761 –131,226 –1,282,989 –665,285 –313,846
i) Europe 15,347,436 13,630,897 12,728,519 13,073,570 2,618,345 –1,073,322 –26,552 –1,161,792 –502,198 –311,999 Austria 135,875 127,424 132,505 135,205 –8,278 –8,811 –15,274 –19,180 9,675 –4,432 Andorra 8,565 7,756 7,855 5,495 1,477 659 968 –1,345 328 –2,691 Belgium 742,016 524,105 489,622 524,731 173,322 –129,399 81,399 –237,052 –16,492 7,670 Cyprus 47,400 48,751 54,526 56,809 10,010 3,588 2,086 2,546 6,884 –247 Denmark 170,129 190,023 180,122 166,138 43,125 29,132 –5,277 19,162 –4,679 –23,199 Finland 100,630 107,267 110,998 110,082 16,702 13,726 –22,368 –4,959 6,831 –5,776 France 1,172,825 1,149,105 1,074,591 1,115,740 188,213 19,077 –53,271 –22,541 –36,507 –16,291 Germany 2,075,269 2,106,155 1,954,400 2,038,329 223,099 15,182 79,263 –109,277 –76,607 –18,463 Greece 80,462 99,392 107,244 120,470 14,817 –5,038 –4,206 –771 11,167 7,017 Iceland 21,890 7,621 7,357 7,132 2,530 –11,521 –3,603 –11,323 –50 –875 Ireland 593,743 618,462 607,303 630,960 129,378 91,576 –7,863 2,515 3,529 –18,130 Italy 411,814 328,652 288,314 306,857 21,045 –61,218 –18,967 –70,417 –27,053 2,694 Liechtenstein 37,058 34,474 30,829 31,526 6,661 –1,607 932 –2,638 –2,449 –734 Luxembourg 891,307 879,726 751,990 775,924 132,304 56,222 27,484 –46,114 –96,813 –12,343 Malta 16,217 17,868 16,088 17,086 1,212 2,890 138 536 –1,172 125 Netherlands 1,082,041 900,766 849,417 835,643 220,713 –129,974 –36,866 –53,785 –24,182 –58,477 Norway 180,135 120,527 107,659 85,072 30,709 –52,316 –22,095 –5,883 –18,079 –26,380 Portugal 129,840 102,967 91,670 93,849 8,709 –18,688 –6,480 –17,803 –7,521 –2,668 Slovakia 4,448 3,542 6,763 6,808 426 –897 –7 –922 3,255 –330 Slovenia 6,957 5,043 3,737 3,900 2,612 –1,824 –1,595 –176 –1,091 –38 Spain 362,479 314,720 296,784 294,864 39,560 –19,145 –11,400 –40,776 –7,367 –17,856 Sweden 183,246 151,327 151,566 162,429 41,742 –24,775 11,368 –21,142 2,965 3,638 Switzerland 1,676,151 1,216,448 1,117,726 1,145,127 326,510 –412,006 32,580 –195,216 –63,950 –21,292
(of which in CHF) 140,747 144,853 150,950 141,254 12,381 –1,901 10,922 –27,069 15,362 –17,295 United Kingdom 5,212,775 4,562,573 4,284,340 4,397,514 991,381 –428,640 –54,225 –325,312 –161,951 –103,375
(of which in GBP) 805,136 628,787 556,556 582,572 276,124 15,630 –9,762 85,943 –61,816 –54,045 Vatican 2,290 1,923 1,628 1,724 289 –449 –214 –394 –242 6 Other 1,874 4,280 3,485 4,156 77 933 940 474 –627 449
Amounts outstanding Estimated exchange rate adjusted changes
Table 6A: External positions of reporting banks vis-à-vis all sectorsVis-à-vis individual countriesin millions of US dollars
A 20 BIS Quarterly Review, December 2009

Vis-à-vis countries Dec 2007 Dec 2008 Mar 2009 Jun 2009 2007 2008 Q3 2008 Q4 2008 Q1 2009 Q2 2009
Assetsii) Other 6,996,885 6,684,820 6,423,098 6,434,112 942,391 –407,585 148,015 –195,108 –186,577 –67,196
Australia 349,337 316,909 306,099 338,619 88,200 –18,742 6,334 –38,671 –2,611 23,489 Canada 355,706 366,756 357,882 365,753 81,691 18,402 30,359 –8,837 –2,764 –1,304 Japan 662,715 671,587 609,190 724,664 –6,880 –77,069 –2,146 –38,719 –35,808 101,864
(of which in JPY) 331,093 328,549 234,826 282,450 46,956 –82,652 2,738 –56,592 –72,340 42,285 New Zealand 42,071 38,913 62,769 84,364 3,304 –1,506 930 –4,499 24,639 19,400 United States 5,587,053 5,290,652 5,087,159 4,920,713 776,076 –328,672 112,927 –104,386 –170,030 –210,645
(of which in USD) 4,650,286 4,519,442 4,362,426 4,183,203 602,047 –163,421 96,939 –28,404 –157,728 –178,812
Offshore centres 4,068,960 3,668,246 3,523,009 3,515,854 635,548 –381,710 –70,877 –254,984 –87,912 –74,543 Aruba 847 1,878 1,958 1,873 –11 1,001 –176 –71 94 –96 Bahamas 248,323 305,193 254,540 217,800 18,772 57,255 –8,957 68,799 –49,479 –39,233 Bahrain 56,533 60,050 50,150 50,158 14,317 3,892 –3,588 2,977 –9,069 –753 Barbados 20,185 20,748 20,056 20,131 –339 2,520 3,726 –592 –440 –564 Bermuda 102,668 87,281 84,940 78,215 11,893 –15,672 4,783 –19,710 –975 –7,875 Cayman Islands 1,905,316 1,567,858 1,640,804 1,643,537 211,090 –351,895 –74,873 –176,000 90,798 –11,634 Gibraltar 21,465 14,206 15,727 11,442 4,416 –1,890 1,115 –2,111 1,892 –5,492 Guernsey 171,932 174,410 155,378 146,079 35,926 12,680 4,246 1,483 –14,669 –16,730 Hong Kong SAR 286,001 308,785 290,625 293,939 48,101 17,437 8,337 –21,282 –12,126 –2,470 Isle of Man 37,527 34,211 33,464 37,484 9,537 887 –1,402 –1,996 –54 1,020 Jersey 504,121 343,345 306,842 319,032 114,981 –130,734 –31,390 –26,858 –29,708 –2,882 Lebanon 6,219 6,647 6,591 7,318 1,157 –999 –301 –660 62 576 Macao SAR 5,603 7,308 10,599 12,681 2,351 1,686 –34 –438 3,373 1,982 Mauritius 14,011 14,071 13,512 13,468 6,312 –57 –2,501 –523 –407 –222 Netherlands Antilles 79,495 68,789 64,284 58,739 5,430 –9,615 –1,097 –3,721 –2,652 –7,343 Panama 64,456 80,218 77,481 80,381 12,466 9,867 2,362 –903 251 1,627 Samoa 1,210 1,529 1,432 1,460 352 289 230 –190 –77 16 Singapore 421,738 450,526 386,718 413,265 109,859 17,641 15,334 –48,455 –53,467 18,404 Vanuatu 119 90 80 86 –179 –32 –19 –5 –7 3 West Indies UK 112,789 108,999 96,157 96,864 20,989 106 12,155 –25,514 –11,090 –2,810
Liabilitiesii) Other 5,206,958 5,258,900 5,036,649 5,099,278 988,201 27,561 –104,674 –121,197 –163,087 –1,847
Australia 108,225 130,439 124,872 140,981 2,792 22,193 2,940 6,040 –3,465 12,961 Canada 153,553 179,222 168,943 172,035 41,192 24,631 2,453 –3,260 –8,105 –472 Japan 760,453 868,058 634,216 643,518 183,216 35,259 36,584 –35,005 –204,914 –7,063
(of which in JPY) 328,525 324,274 220,677 250,734 109,438 –87,437 –8,772 –83,669 –83,308 24,594 New Zealand 22,200 17,456 20,289 18,589 2,110 –4,030 64 –1,620 3,144 –2,343 United States 4,162,519 4,063,721 4,088,323 4,124,155 758,883 –50,490 –146,657 –87,354 50,251 –4,923
(of which in USD) 3,532,627 3,446,742 3,499,611 3,499,831 654,556 –58,182 –129,727 –76,121 52,869 –287
Offshore centres 5,188,866 4,867,364 4,645,634 4,600,999 804,620 –200,062 –24,144 –73,109 –166,013 –156,789 Aruba 1,367 1,557 1,564 1,391 141 207 206 178 27 –198 Bahamas 427,816 495,273 456,909 400,968 41,520 70,096 11,770 50,645 –36,127 –59,279 Bahrain 43,407 35,066 31,138 31,249 3,546 –6,594 –2,363 –4,697 –3,366 –731 Barbados 39,527 24,034 28,180 29,311 3,114 –13,334 –3,496 –5,982 4,445 292 Bermuda 111,811 72,484 71,615 79,025 3,915 –40,785 –5,729 –26,523 –4 5,722 Cayman Islands 1,882,666 1,827,987 1,738,222 1,747,799 286,491 –53,208 –61,977 62,266 –75,011 –5,062 Gibraltar 25,385 18,483 19,057 11,578 830 –3,450 –555 –5,167 988 –8,538 Guernsey 194,364 196,958 191,477 190,307 23,049 23,357 9,706 –8,156 –2,355 –12,298 Hong Kong SAR 664,483 602,862 581,616 546,603 166,919 –57,353 46,730 –53,471 –11,090 –49,315 Isle of Man 91,580 76,987 79,107 88,230 6,040 –3,885 –11,500 2,983 –3,848 –166 Jersey 588,316 454,061 430,354 449,621 81,543 –74,787 –18,432 –44,642 –13,880 –9,867 Lebanon 33,937 35,877 36,669 39,500 580 1,574 2,127 –325 1,156 2,182 Macao SAR 26,217 25,639 29,316 30,125 3,598 16 3,854 –891 4,023 322 Mauritius 27,223 16,077 14,949 16,253 10,603 –9,960 –18,604 –2,994 –881 828 Netherlands Antilles 155,602 143,441 132,339 124,057 15,184 –10,375 –4,349 –2,786 –6,415 –13,089 Panama 99,452 104,475 96,976 95,660 19,720 7,972 3,418 1,031 –5,496 –3,948 Samoa 4,882 6,305 7,579 8,718 1,195 1,475 805 380 1,327 1,022 Singapore 513,137 489,038 458,950 471,457 78,519 –16,649 22,547 –22,830 –22,061 1,589 Vanuatu 915 521 488 500 245 –379 –128 –190 –23 –3 West Indies UK 251,880 231,499 230,037 229,864 53,197 –18,149 –417 –13,256 1,910 –5,492
Table 6A (cont.)
Amounts outstanding Estimated exchange rate adjusted changes
BIS Quarterly Review, December 2009 A 21

Vis-à-vis countries Dec 2007 Dec 2008 Mar 2009 Jun 2009 2007 2008 Q3 2008 Q4 2008 Q1 2009 Q2 2009
AssetsDeveloping countries 2,478,719 2,482,358 2,304,642 2,366,711 684,731 4,345 143 –279,455 –127,072 5,274
i) Africa & Middle East 459,658 469,459 453,881 460,427 144,372 13,143 9,947 –20,362 –8,244 –3,383 Algeria 2,599 2,259 2,170 2,084 –340 –268 –26 –71 –16 –166 Angola 3,508 7,453 7,408 7,566 31 4,056 2,498 181 28 36 Benin 108 111 101 104 –18 –14 12 –20 –6 –3 Botswana 204 129 112 131 –57 –75 –3 21 –16 16 Burkina Faso 363 365 355 403 3 19 –13 –11 2 32 Burundi 47 61 46 51 – 14 –2 5 –11 3 Cameroon 1,921 1,460 1,225 1,259 –148 –561 –52 –114 –184 –27 Cape Verde 503 742 903 668 236 257 71 137 172 –259 Central African Republic 20 450 11 11 3 –3 – –5 –426 –1 Chad 126 97 97 93 15 –19 11 –11 2 –6 Comoros Islands 24 11 10 12 16 –13 1 – –1 1 Congo 389 309 262 266 –92 –73 –15 –5 –36 –7 Congo Democratic Republic 522 515 518 535 111 12 32 6 20 –6 Côte d’Ivoire 4,303 4,060 3,943 4,188 –274 –8 76 –147 48 24 Djibouti 208 204 222 255 94 –1 –35 –13 21 29 Egypt 20,115 19,419 19,801 19,772 3,536 –418 392 –1,223 740 –527 Equatorial Guinea 54 89 55 34 21 37 16 21 –33 –23 Eritrea 15 12 8 8 2 –4 6 –4 –4 – Ethiopia 37 39 28 38 –4 –13 –4 –15 –10 9 Gabon 1,138 796 726 744 336 –309 92 –66 –43 –17 Gambia 106 95 93 96 12 –9 8 –20 – 1 Ghana 2,683 2,472 2,290 2,007 676 –192 127 116 –145 –339 Guinea 435 383 300 307 27 –52 8 –15 –66 –8 Guinea-Bissau 7 5 8 16 1 –1 –5 –1 3 7 Iran 26,038 20,406 19,205 18,866 –1,196 –4,978 –1,055 –1,502 –462 –1,220 Iraq 1,707 1,744 1,727 1,921 192 94 321 –323 40 125 Israel 13,986 11,880 11,621 12,384 –3,200 –2,010 –1,425 –884 –20 493 Jordan 2,339 3,499 3,782 4,119 468 419 200 –278 346 255 Kenya 1,738 1,548 1,442 1,417 632 –181 87 –59 –75 –80 Kuwait 36,066 36,113 31,112 27,921 14,264 442 4,424 –7,201 –4,583 –3,640 Lesotho 17 27 18 22 –10 10 –5 5 –8 3 Liberia 18,715 21,241 21,652 21,849 1,584 2,189 –128 225 666 38
LiabilitiesDeveloping countries 2,584,553 2,198,320 2,138,150 2,107,046 419,934 –327,824 128,704 –296,172 –31,998 –78,862
i) Africa & Middle East 873,334 788,886 719,940 718,939 140,610 –60,411 40,802 –74,939 –58,128 –20,820 Algeria 11,999 6,427 5,760 6,182 –124 –5,414 –3,983 –1,339 –504 215 Angola 9,260 18,412 13,174 11,656 1,291 9,322 6,448 –2,681 –5,165 –1,643 Benin 366 321 309 374 76 –53 35 –45 1 50 Botswana 2,494 1,639 1,023 1,377 363 –749 472 –609 –602 300 Burkina Faso 344 325 321 384 54 –2 –19 26 7 46 Burundi 345 202 197 205 58 –129 –8 –141 – 1 Cameroon 4,987 1,460 1,548 1,782 3,456 –2,906 1,769 –4,551 134 156 Cape Verde 1,636 1,218 1,421 1,331 502 –271 –73 –597 235 –145 Central African Republic 95 93 84 87 21 1 7 –5 –6 –2 Chad 344 203 261 230 140 –107 8 –183 62 –38 Comoros Islands 58 60 52 52 –8 4 –34 7 –6 –2 Congo 695 893 877 843 95 236 25 72 11 –73 Congo Democratic Republic 1,324 1,229 1,148 1,264 328 –61 35 –83 –53 79 Côte d’Ivoire 2,528 2,626 2,540 2,298 165 148 –686 507 16 –345 Djibouti 648 654 590 741 23 23 –37 23 –56 145 Egypt 40,626 30,469 26,121 28,879 –2,901 –8,857 –3,414 –1,768 –3,969 2,069 Equatorial Guinea 747 838 1,152 1,708 348 102 240 –240 332 523 Eritrea 53 51 53 48 –55 6 12 –6 3 –8 Ethiopia 928 603 581 601 113 –276 68 –124 –10 –3 Gabon 1,241 1,199 942 1,132 79 27 126 –307 –218 143 Gambia 237 181 188 190 42 –37 –12 –21 9 – Ghana 1,512 1,401 1,429 1,447 –266 –43 –68 –107 43 –17 Guinea 472 531 515 516 70 75 18 –7 –5 –14 Guinea-Bissau 52 39 29 48 3 –10 13 –23 –7 17 Iran 35,469 41,497 39,816 38,401 1,161 9,504 6,598 –3,657 9 –3,536 Iraq 1,911 3,071 3,858 3,862 6 1,353 44 184 789 –140 Israel 51,770 35,377 36,770 35,016 2,130 –15,398 –4,339 –8,663 1,749 –2,524 Jordan 17,168 13,399 12,376 10,923 251 –4,031 –527 –1,717 –891 –1,716 Kenya 9,566 8,626 8,385 9,003 1,650 615 1,023 –742 –93 –36 Kuwait 51,351 52,512 47,529 46,842 10,716 2,975 354 4,420 –4,348 –2,289 Lesotho 34 39 27 40 –20 7 –3 6 –11 16 Liberia 17,660 17,914 17,322 18,009 1,274 382 863 172 –386 392
Table 6A (cont.)
Amounts outstanding Estimated exchange rate adjusted changes
A 22 BIS Quarterly Review, December 2009

Vis-à-vis countries Dec 2007 Dec 2008 Mar 2009 Jun 2009 2007 2008 Q3 2008 Q4 2008 Q1 2009 Q2 2009
AssetsLibya 1,032 1,261 1,155 1,487 651 199 -281 40 -61 281Madagascar 189 503 495 497 25 329 100 1 –2 –7 Malawi 90 115 54 58 –17 23 3 9 –60 3 Mali 307 264 247 259 –164 –38 4 –27 –6 –2 Mauritania 256 298 291 251 19 53 115 –58 –2 –47 Morocco 9,019 8,037 8,028 9,091 3,033 –505 375 –208 289 654 Mozambique 529 562 569 575 56 47 64 4 20 –13 Namibia 1,147 826 816 807 227 –200 44 –33 19 –75 Niger 163 145 117 79 73 –18 2 –14 –22 –41 Nigeria 8,111 10,575 7,160 7,474 2,625 2,749 2,039 –3,840 –3,352 228 Oman 9,693 10,556 9,934 9,948 2,718 769 724 –35 –577 –38 Palestinian Territory 19 10 13 14 –54 –14 3 –4 2 1 Qatar 34,157 47,681 48,533 51,092 19,642 13,021 –828 11,140 1,018 2,217 Rwanda 19 10 18 12 6 –8 3 –4 8 –7 Sao Tomé and Principe 35 49 52 39 16 16 – 3 5 –15 Saudi Arabia 71,886 78,102 78,306 81,069 30,702 7,220 4,992 –1,018 1,818 402 Senegal 936 933 881 1,020 245 25 13 69 –17 92 Seychelles 1,051 1,103 1,131 1,249 198 48 50 –202 67 76 Sierra Leone 103 58 66 89 –24 –42 –12 –4 10 19 Somalia 99 98 93 99 6 7 –6 –6 –1 – South Africa 37,585 35,647 33,590 32,303 7,074 –1,368 1,588 –748 –1,269 –2,327 St. Helena 4 4 4 5 –1 1 1 – – 1 Sudan 1,269 964 911 914 187 –306 –112 –48 –31 –23 Swaziland 114 58 55 58 56 –56 –116 – –2 – Syria 728 903 819 858 135 49 –36 53 –68 23 Tanzania 662 725 561 560 172 –20 –23 75 –153 –14 Togo 228 265 243 251 67 51 –21 5 –12 –6 Tunisia 4,875 5,171 4,589 4,809 249 430 178 193 –394 2 Uganda 247 357 298 336 106 122 159 –64 –53 27 United Arab Emirates 97,463 106,183 102,413 102,220 37,669 9,753 12,133 –12,218 –2,646 –1,947 Yemen 413 1,058 1,158 1,156 104 654 102 99 107 –13 Zambia 419 879 787 866 233 452 104 20 –88 74 Zimbabwe 877 815 825 672 –45 –10 –52 –1 41 –196 Residual 35,892 17,250 18,418 21,063 21,478 –18,638 –16,979 –2,269 1,223 2,543
LiabilitiesLibya 80,138 72,510 60,568 63,509 12,716 –5,659 7,882 –19,079 –10,946 1,643 Madagascar 1,482 1,008 1,124 1,389 331 –277 60 –449 146 215 Malawi 216 144 160 169 –56 –44 –22 –22 19 –4 Mali 431 372 377 386 35 –48 –7 25 18 –9 Mauritania 723 513 509 481 73 –189 –50 –103 4 –43 Morocco 13,192 9,555 9,204 8,324 –1,944 –3,008 1,547 –3,411 –23 –1,264 Mozambique 1,342 1,184 1,100 1,419 124 –60 –55 –170 –61 210 Namibia 539 453 407 492 185 –58 64 44 –31 60 Niger 122 134 165 161 –48 20 33 –31 35 –9 Nigeria 36,780 21,999 20,202 19,219 1,370 –14,008 142 –14,558 –1,478 –1,669 Oman 10,725 7,784 5,721 6,082 –164 –2,657 1,200 –2,869 –1,953 151 Palestinian Territory 761 1,063 1,232 1,184 –72 292 111 –65 181 –74 Qatar 18,010 17,336 16,919 17,856 4,951 –333 –293 708 –219 574 Rwanda 673 520 501 642 148 –151 145 –162 –14 127 Sao Tomé and Principe 72 104 88 81 –3 47 31 17 –13 –9 Saudi Arabia 163,986 181,325 159,890 151,717 55,885 15,875 26,710 –6,885 –19,588 –11,444 Senegal 1,705 1,709 1,433 1,462 149 –78 –256 96 –205 –49 Seychelles 3,307 4,563 4,743 4,794 1,038 986 239 53 271 –109 Sierra Leone 186 171 152 158 –15 –7 –31 15 –18 – Somalia 54 47 45 49 3 –4 3 –3 –1 2 South Africa 60,162 44,209 38,424 40,006 8,710 –13,235 –515 –2,798 –5,103 62 St. Helena 64 8 9 10 18 –54 16 –17 1 – Sudan 2,103 1,702 1,534 1,578 186 –188 –344 –314 –141 –34 Swaziland 749 1,220 696 677 253 500 269 291 –497 –47 Syria 25,327 23,576 20,862 19,324 290 –734 321 –952 –2,124 –2,313 Tanzania 2,876 2,022 1,631 1,649 330 –600 117 –270 –369 –43 Togo 418 447 410 421 74 54 –29 12 –26 –9 Tunisia 8,510 5,074 4,207 4,329 1,208 –2,909 –866 –1,338 –732 –64 Uganda 1,744 1,732 1,376 1,709 337 260 371 –289 –324 237 United Arab Emirates 110,620 76,864 75,201 80,174 22,927 –29,559 –12,198 1,073 –802 2,829 Yemen 7,604 7,870 7,253 6,033 –239 585 551 –212 –534 –1,444 Zambia 1,070 878 878 1,010 74 –135 –104 –62 9 93 Zimbabwe 1,030 856 903 964 –11 –67 –59 –61 58 – Residual 48,693 56,425 55,618 56,010 10,705 8,592 10,867 –956 –737 –8
Table 6A (cont.)
Amounts outstanding Estimated exchange rate adjusted changes
BIS Quarterly Review, December 2009 A 23

Vis-à-vis countries Dec 2007 Dec 2008 Mar 2009 Jun 2009 2007 2008 Q3 2008 Q4 2008 Q1 2009 Q2 2009
Assetsii) Asia & Pacific 829,939 755,146 682,329 703,767 212,224 –98,599 –31,868 –158,760 –58,777 9,202
Afghanistan 110 75 74 113 60 –34 48 –31 – 38 Armenia 202 298 255 247 61 99 43 75 –39 –13 Azerbaijan 1,860 3,302 3,137 3,176 578 1,482 635 –314 –107 –30 Bangladesh 1,770 2,077 1,785 1,760 –442 282 716 –865 –274 –45 Bhutan 63 60 57 60 –3 –1 – –3 –1 – British Overseas Territories 386 441 404 407 –1,227 99 –60 69 –26 –16 Brunei 769 832 635 1,009 99 69 409 –266 –177 350 Cambodia 440 475 492 542 43 37 142 –244 18 45 China 188,980 153,661 139,318 149,497 57,354 –33,683 –23,800 –53,085 –11,904 7,565 Chinese Taipei 66,265 51,836 44,673 44,958 8,153 –14,798 –7,680 –17,450 –6,523 –269 Fiji 267 120 335 159 51 –135 –90 –55 218 –187 French Polynesia 1,522 2,253 2,285 2,434 69 862 33 47 135 18 Georgia 438 614 557 554 58 163 –103 49 –50 –17 India 121,393 134,754 128,178 125,243 44,419 9,417 2,769 –12,093 –3,786 –5,097 Indonesia 46,840 58,115 42,087 43,709 5,335 –3,538 372 –5,631 –14,504 578 Kazakhstan 20,774 21,043 19,246 18,014 4,291 493 –919 –85 –1,498 –1,537 Kiribati 4 – – 1 –7 –4 2 –2 – 1 Kyrgyz Republic 35 54 45 65 2 20 29 –25 –8 19 Laos 407 466 475 448 197 54 25 –37 13 –30 Malaysia 48,388 37,066 34,626 35,523 8,874 –12,266 –11,423 –10,464 –1,680 252 Maldives 621 729 662 628 205 119 95 –108 –59 –42 Marshall Islands 17,368 23,597 24,623 24,836 7,325 6,087 3,106 915 1,071 165 Micronesia 15 25 – – 14 10 –2 1 –25 –
Liabilitiesii) Asia & Pacific 858,746 690,741 713,149 682,833 205,674 –156,424 35,968 –34,988 30,175 –42,285
Afghanistan 1,598 1,525 1,617 1,845 526 59 66 184 121 138 Armenia 708 283 273 310 –151 –342 –54 –283 – 24 Azerbaijan 2,885 1,189 709 714 1,091 –1,200 103 –2,061 –447 –9 Bangladesh 5,051 3,517 3,032 4,475 779 –856 169 –2,138 –471 1,364 Bhutan 405 393 383 354 325 –9 80 –79 –9 –31 British Overseas Territories 2,517 1,088 1,414 1,036 1,379 –1,254 –533 –136 358 –432 Brunei 3,700 4,376 5,012 3,846 1,144 854 –70 824 734 –1,342 Cambodia 494 460 483 469 112 –25 68 –23 26 –19 China 281,869 235,931 244,338 206,119 126,657 –45,676 50,967 –5,251 10,710 –41,654 Chinese Taipei 138,216 121,568 124,441 125,267 36,871 –16,076 2,851 –6,946 4,216 –931 Fiji 195 206 191 370 –33 19 –6 –16 –10 162 French Polynesia 1,131 1,363 1,249 1,278 65 278 –24 136 –70 –28 Georgia 1,064 1,352 1,058 966 426 364 –345 252 –270 –121 India 49,521 44,906 50,798 50,312 –36,452 –3,716 –2,004 8,966 6,211 –1,279 Indonesia 12,804 13,999 12,279 13,580 –36 1,346 –1,279 3,091 –1,609 1,127 Kazakhstan 11,986 13,105 12,810 12,075 6,444 1,044 1,868 –1,555 –111 –976 Kiribati 132 108 93 126 – 5 –6 25 –13 21 Kyrgyz Republic 254 261 261 373 –32 17 –28 20 8 98 Laos 1,265 168 330 331 566 –1,096 –147 –738 163 –8 Malaysia 46,342 19,404 24,369 20,358 16,981 –25,307 –6,552 –8,492 5,211 –4,574 Maldives 129 120 130 156 –5 –3 1 –10 12 22 Marshall Islands 6,597 7,399 7,994 7,889 2,044 839 720 –361 695 –258 Micronesia 17 36 17 18 –2 17 –9 –1 –18 1
Table 6A (cont.)
Amounts outstanding Estimated exchange rate adjusted changes
A 24 BIS Quarterly Review, December 2009

Vis-à-vis countries Dec 2007 Dec 2008 Mar 2009 Jun 2009 2007 2008 Q3 2008 Q4 2008 Q1 2009 Q2 2009 Assets
Mongolia 134 151 131 130 48 17 22 –19 –18 –4 Myanmar 1,242 1,353 1,274 1,096 23 175 99 12 –27 –241 Nauru 11 16 16 13 3 6 – 5 – –3 Nepal 67 65 53 56 –49 –1 –3 –19 –11 2 New Caledonia 2,774 3,597 3,477 3,596 429 1,060 150 –25 37 –88 North Korea 286 74 71 73 152 –210 –48 –24 –1 –1 Pakistan 5,201 4,962 4,475 4,853 899 –223 22 –243 –433 314 Palau 38 37 37 35 5 –1 – – – –2 Papua New Guinea 393 469 430 465 –153 89 123 –67 –31 21 Philippines 24,506 19,052 18,392 17,859 2,055 –5,434 –1,686 –1,364 –271 –894 Solomon Islands 30 25 25 25 –1 –2 –10 –1 – –1 South Korea 231,800 186,037 167,973 180,989 67,646 –47,115 5,619 –55,083 –14,492 10,053 Sri Lanka 2,791 3,204 2,688 2,941 649 413 525 –679 –432 163 Tajikistan 114 30 39 21 18 –85 –15 –92 9 –18 Thailand 26,764 22,757 21,706 21,839 –977 –4,598 –1,284 –458 –523 –306 Timor Leste 10 9 9 9 –4 1 6 –6 – –1 Tonga 8 18 23 35 –14 11 4 6 5 10 Turkmenistan 339 254 216 236 –101 –73 –32 –7 –28 8 Tuvalu – 1 1 11 –1 1 – – – 10 US Pacific Islands 1,209 647 614 588 785 –292 40 119 –20 –42 Uzbekistan 717 763 731 855 –62 54 169 –60 –12 104 Vietnam 9,052 16,081 10,929 10,751 3,852 2,726 279 –878 –4,783 –426 Wallis/Futuna 25 22 19 20 –2 –2 3 –3 –2 – Residual 3,511 3,629 5,051 3,888 1,522 48 –198 –273 1,460 –1,202
LiabilitiesMongolia 683 94 80 118 306 –591 –103 22 –12 34 Myanmar 360 505 866 1,144 19 158 66 65 373 235 Nauru 24 11 10 10 7 –10 –2 –16 –1 –1 Nepal 1,177 1,573 1,816 2,139 183 459 –23 293 276 265 New Caledonia 1,245 1,191 1,196 2,494 416 –1 –278 –79 43 1,237 North Korea 457 142 97 87 19 –12 –29 48 –42 –16 Pakistan 16,028 10,348 10,645 11,687 2,241 –5,033 –1,220 1,703 423 866 Palau 5 91 4 1 2 88 –3 82 –87 –3 Papua New Guinea 1,180 1,177 2,614 2,837 56 62 –490 –13 1,452 149 Philippines 25,892 18,729 17,192 16,303 6,454 –7,001 –2,807 2,233 –1,426 –1,027 Solomon Islands 158 150 147 181 –22 4 –2 –33 1 26 South Korea 83,021 58,105 55,285 58,026 23,580 –24,443 –1,090 –3,064 –2,237 2,025 Sri Lanka 2,755 1,266 1,526 1,518 172 –1,328 –455 –952 297 –83 Tajikistan 191 101 78 60 46 –90 –189 –86 –21 –20 Thailand 38,975 24,080 22,107 23,464 2,278 –14,062 –3,036 –1,833 –1,627 908 Timor Leste 15 13 11 13 –3 – –2 2 –2 1 Tonga 15 31 30 31 1 17 3 5 –1 – Turkmenistan 9,667 11,815 13,743 15,497 4,603 2,300 1,450 –299 2,000 1,666 Tuvalu 1 14 25 28 – 15 8 6 11 –1 US Pacific Islands 237 182 267 210 –131 –41 87 –12 87 –62 Uzbekistan 5,676 8,239 8,362 9,397 1,003 3,360 1,766 153 263 638 Vietnam 6,324 3,438 4,265 3,447 1,676 –2,607 46 –2,301 881 –886 Wallis/Futuna 140 41 49 57 – –94 18 4 10 6 Residual 95,640 76,648 79,453 81,817 4,073 –16,862 –3,585 –16,325 4,080 462
Table 6A (cont.)
Amounts outstanding Estimated exchange rate adjusted changes
BIS Quarterly Review, December 2009 A 25

Vis-à-vis countries Dec 2007 Dec 2008 Mar 2009 Jun 2009 2007 2008 Q3 2008 Q4 2008 Q1 2009 Q2 2009
Assetsiii) Europe 786,349 851,299 787,260 815,235 227,796 85,672 24,490 –55,211 –38,832 –2,147
Albania 631 970 770 951 355 386 19 292 –159 140 Belarus 2,604 3,135 2,726 2,766 1,027 632 333 110 –341 –59 Bosnia and Herzegovina 4,359 4,699 4,867 5,042 1,159 559 –165 148 374 –109 Bulgaria 17,051 24,349 22,977 24,139 6,160 8,546 2,243 565 –375 –108 Croatia 42,644 43,508 40,740 44,160 10,793 1,492 –861 661 –996 1,175 Czech Republic 49,450 48,877 44,379 48,222 10,876 2,741 –2,687 –3,595 –2,686 1,601 Estonia 18,421 19,124 17,146 17,777 4,590 1,505 –264 233 –1,188 –324 Hungary 77,300 93,882 90,526 93,253 13,739 18,360 3,148 –797 381 –1,822 Latvia 20,524 22,815 20,285 20,827 7,048 3,520 1,093 –31 –1,523 –663 Lithuania 19,199 22,100 20,845 21,557 6,049 4,274 1,465 560 –325 –510 Macedonia, FYR 399 610 546 604 174 151 50 12 –40 25 Moldova 478 663 614 615 170 218 62 45 –34 –15 Montenegro 958 1,489 1,415 1,506 691 609 133 55 –8 10 Poland 108,812 115,661 106,878 114,923 30,253 13,683 –2,832 –8,144 –4,060 2,861 Romania 56,149 71,062 66,119 68,317 20,090 16,920 4,177 1,136 –1,970 –1,418 Russia 184,636 180,617 165,772 167,097 71,489 –5,700 6,784 –32,630 –12,576 –1,145 Serbia 9,383 11,658 10,371 11,359 2,273 1,592 –1,293 165 –777 384 Turkey 137,140 142,575 131,713 134,833 28,486 9,134 11,063 –11,633 –8,175 –214 Ukraine 28,980 36,251 31,589 31,266 13,164 6,429 2,370 –2,903 –4,304 –734 Res. Serbia & Montenegro 48 82 70 96 –997 34 –3 71 –9 22 Residual Europe 7,183 7,172 6,912 5,925 309 586 –345 469 –42 –1,244
Liabilitiesiii) Europe 469,375 325,794 327,883 324,193 25,361 –125,201 42,872 –165,963 8,733 –15,579
Albania 1,327 485 466 481 287 –566 –53 –546 –9 –3 Belarus 4,759 2,997 3,432 2,556 3,247 –1,421 –96 –1,531 494 –939 Bosnia and Herzegovina 6,446 2,741 2,138 2,080 761 –3,560 –759 –636 –487 –169 Bulgaria 8,500 7,278 7,489 7,491 198 –1,204 –1,290 1,217 490 –407 Croatia 14,961 9,075 6,483 8,335 2,149 –5,177 –359 –2,185 –2,196 1,448 Czech Republic 21,279 21,025 19,330 21,296 471 2,360 –936 –2,826 –998 1,061 Estonia 3,453 3,064 2,292 2,546 1,505 –166 –75 28 –644 137 Hungary 11,403 11,799 19,148 18,129 1,231 628 5,749 –4,301 7,630 –1,972 Latvia 4,332 2,526 2,856 3,405 1,918 –1,509 –1,426 –984 385 423 Lithuania 3,508 1,995 2,569 2,520 909 –1,413 381 –499 631 –179 Macedonia, FYR 1,192 616 683 719 –548 –499 13 –290 86 3 Moldova 845 901 655 663 247 10 –99 112 –228 –26 Montenegro 760 215 241 210 434 –479 99 –455 35 –43 Poland 45,766 22,260 16,740 20,742 4,887 –20,808 –9,750 –23,643 –4,898 3,271 Romania 8,642 3,934 4,103 4,124 1,482 –4,643 –1,195 –1,192 290 –160 Russia 232,087 131,086 146,098 129,365 –825 –92,699 51,518 –129,085 16,858 –21,612 Serbia 6,573 3,190 2,295 2,379 3,825 –3,449 –381 –1,344 –767 –45 Turkey 61,233 65,149 62,350 65,278 3,995 5,782 2,894 –2,175 –1,566 1,299 Ukraine 20,631 19,867 16,544 18,694 3,665 –1,314 –1,371 –760 –3,015 1,632 Res. Serbia & Montenegro 846 231 232 355 –3,681 –615 –88 52 2 121 Residual Europe 10,830 15,360 11,739 12,825 904 5,540 96 5,079 –3,358 580
Table 6A (cont.)
Amounts outstanding Estimated exchange rate adjusted changes
A 26 BIS Quarterly Review, December 2009

Vis-à-vis countries Dec 2007 Dec 2008 Mar 2009 Jun 2009 2007 2008 Q3 2008 Q4 2008 Q1 2009 Q2 2009
Assetsiv) Latin America/Caribbean 402,773 406,454 381,172 387,282 100,341 4,130 –2,425 –45,122 –21,219 1,602
Argentina 23,196 17,742 17,026 16,707 6,503 –4,961 –1,282 –3,447 –569 –551 Belize 1,885 2,415 2,291 2,365 404 365 449 –37 –73 3 Bolivia 480 350 327 320 60 –128 126 –314 –21 –10 Brazil 156,849 155,016 140,053 150,125 49,498 –2,687 –9,374 –21,739 –13,350 8,462 Chile 33,884 38,555 39,360 39,265 7,143 4,558 1,918 –4,134 1,204 –501 Colombia 14,845 12,500 11,328 11,071 4,147 –2,300 –817 –1,436 –1,086 –354 Costa Rica 6,363 7,300 6,726 6,220 1,410 942 –188 –136 –566 –516 Cuba 2,935 1,933 1,779 1,750 246 –882 184 –247 –82 –121 Dominica 93 121 70 65 28 30 44 12 –49 –5 Dominican Republic 4,488 3,746 3,821 3,829 1,563 –657 –98 –322 113 –59 Ecuador 3,292 2,344 2,392 2,131 762 –962 38 –413 57 –267 El Salvador 2,441 3,563 3,355 3,155 100 1,129 1,347 –178 –203 –208 Falkland Islands 61 37 37 40 34 –21 –4 –3 1 – Grenada 89 61 58 61 48 –26 8 6 –3 3 Guatemala 3,876 4,554 4,233 4,289 603 680 81 –15 –314 49 Guyana 115 875 1,140 813 9 815 –368 –111 278 –340 Haiti 193 252 209 205 –48 62 4 8 –41 –7 Honduras 1,514 1,528 1,486 1,357 202 –1 –23 –111 –38 –136 Jamaica 2,150 2,089 1,646 1,642 292 63 93 –278 –418 –41 Mexico 94,797 101,839 97,811 93,940 17,052 7,455 2,282 –5,333 –3,046 –5,015 Nicaragua 623 694 655 650 –21 74 1 –7 –37 –7 Paraguay 1,120 1,135 1,098 969 115 14 6 –74 –27 –138 Peru 12,415 15,305 14,102 13,657 5,040 2,993 1,061 –1,863 –1,105 –567 St. Lucia 388 605 623 450 113 155 5 41 24 –179 St. Vincent 1,169 1,250 1,189 1,296 491 62 24 –96 –5 56 Surinam 33 28 62 33 16 –3 7 –6 35 –31 Trinidad and Tobago 3,254 5,861 5,755 5,953 –3 2,709 2,455 –42 –32 81 Turks and Caicos 536 512 465 435 –170 45 22 98 –43 –49 Uruguay 3,218 3,402 3,259 4,250 835 224 –421 –390 –97 947 Venezuela 11,234 8,138 7,331 7,935 –42 –3,042 413 –2,275 –684 469 Residual 15,237 12,704 11,485 12,304 3,911 –2,576 –419 –2,281 –1,045 632
Int. organisations 88,775 77,925 100,886 114,462 8,686 –5,794 –6,152 1,066 25,072 8,936 Unallocated 529,211 628,948 608,289 571,295 126,355 193,920 23,874 102,554 –1,516 –68,044
Liabilitiesiv) Latin America/Caribbean 383,098 392,899 377,178 381,081 48,288 14,212 9,062 –20,282 –12,778 –178
Argentina 29,378 28,491 29,125 29,410 4,167 –678 201 –1,259 802 50 Belize 7,789 9,561 9,262 9,573 1,560 1,493 343 258 –115 42 Bolivia 3,510 3,308 2,771 2,727 673 –58 165 345 –513 –65 Brazil 66,998 63,754 62,630 56,396 10,321 –2,728 –3,935 –919 –677 –6,795 Chile 28,502 23,623 24,332 21,517 2,332 –3,986 2,423 –6,092 971 –3,159 Colombia 15,908 13,666 14,282 15,240 2,180 –2,058 –490 –1,489 658 897 Costa Rica 6,812 6,092 5,908 5,447 80 –477 –881 –1,303 –142 –529 Cuba 1,836 2,849 2,667 3,388 213 1,226 722 –190 –76 558 Dominica 181 218 204 231 1 24 –11 –12 –10 17 Dominican Republic 7,535 6,490 5,567 5,251 521 –1,007 –16 –524 –892 –348 Ecuador 5,405 6,212 6,555 6,345 406 849 –16 –75 358 –229 El Salvador 2,512 2,352 2,527 2,525 350 –102 –262 –364 179 –9 Falkland Islands 135 119 117 138 3 22 –7 4 – 4 Grenada 90 183 220 180 24 97 26 43 42 –50 Guatemala 3,917 3,778 4,450 4,186 603 –130 –141 –297 682 –276 Guyana 604 531 444 378 –15 –57 –147 131 –86 –74 Haiti 669 679 762 595 67 13 71 –225 84 –169 Honduras 3,965 3,146 3,223 3,360 –111 –814 –376 –320 84 129 Jamaica 2,733 2,184 2,042 1,981 271 –477 –283 –500 –131 –100 Mexico 77,597 91,188 78,347 86,143 10,438 14,076 9,079 6,141 –12,240 7,012 Nicaragua 718 1,014 1,246 1,471 61 296 173 –48 235 221 Paraguay 1,665 1,777 1,837 2,013 69 133 –30 70 73 160 Peru 15,422 9,231 10,123 9,128 2,393 –6,037 –2,983 –5,003 936 –1,056 St. Lucia 342 409 393 492 29 72 –49 181 –10 87 St. Vincent 3,044 3,435 3,202 3,026 –1,032 542 392 –171 –152 –297 Surinam 901 1,092 1,164 1,212 64 230 58 71 96 11 Trinidad and Tobago 8,064 9,082 9,235 9,643 2,104 882 45 –388 202 297 Turks and Caicos 1,413 2,037 2,040 2,324 –256 757 734 –820 31 217 Uruguay 13,369 12,965 12,531 12,340 1,659 –318 133 470 –341 –297 Venezuela 53,518 59,772 56,628 58,407 6,063 7,055 4,243 –12,947 –2,791 1,341 Residual 18,566 23,661 23,344 26,014 3,050 5,376 –119 4,953 –39 2,232
Int. organisations 243,853 214,940 218,612 227,405 9,801 –12,318 1,884 –20,248 9,422 –2,394 Unallocated 2,846,388 2,840,094 2,860,166 3,050,432 607,206 160,443 34,294 –87,343 80,978 67,876
Table 6A (cont.)
Amounts outstanding Estimated exchange rate adjusted changes
BIS Quarterly Review, December 2009 A 27
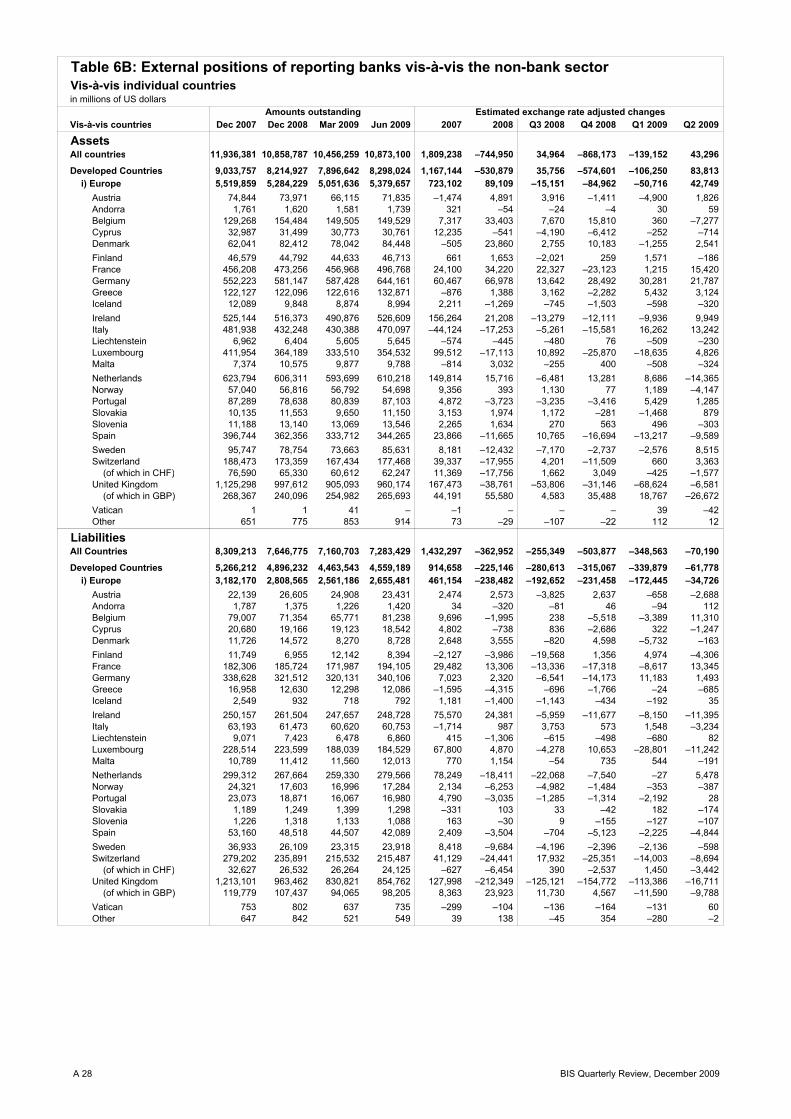
Vis-à-vis countries Dec 2007 Dec 2008 Mar 2009 Jun 2009 2007 2008 Q3 2008 Q4 2008 Q1 2009 Q2 2009
AssetsAll countries 11,936,381 10,858,787 10,456,259 10,873,100 1,809,238 –744,950 34,964 –868,173 –139,152 43,296
Developed Countries 9,033,757 8,214,927 7,896,642 8,298,024 1,167,144 –530,879 35,756 –574,601 –106,250 83,813 i) Europe 5,519,859 5,284,229 5,051,636 5,379,657 723,102 89,109 –15,151 –84,962 –50,716 42,749
Austria 74,844 73,971 66,115 71,835 –1,474 4,891 3,916 –1,411 –4,900 1,826 Andorra 1,761 1,620 1,581 1,739 321 –54 –24 –4 30 59 Belgium 129,268 154,484 149,505 149,529 7,317 33,403 7,670 15,810 360 –7,277 Cyprus 32,987 31,499 30,773 30,761 12,235 –541 –4,190 –6,412 –252 –714 Denmark 62,041 82,412 78,042 84,448 –505 23,860 2,755 10,183 –1,255 2,541 Finland 46,579 44,792 44,633 46,713 661 1,653 –2,021 259 1,571 –186 France 456,208 473,256 456,968 496,768 24,100 34,220 22,327 –23,123 1,215 15,420 Germany 552,223 581,147 587,428 644,161 60,467 66,978 13,642 28,492 30,281 21,787 Greece 122,127 122,096 122,616 132,871 –876 1,388 3,162 –2,282 5,432 3,124 Iceland 12,089 9,848 8,874 8,994 2,211 –1,269 –745 –1,503 –598 –320 Ireland 525,144 516,373 490,876 526,609 156,264 21,208 –13,279 –12,111 –9,936 9,949 Italy 481,938 432,248 430,388 470,097 –44,124 –17,253 –5,261 –15,581 16,262 13,242 Liechtenstein 6,962 6,404 5,605 5,645 –574 –445 –480 76 –509 –230 Luxembourg 411,954 364,189 333,510 354,532 99,512 –17,113 10,892 –25,870 –18,635 4,826 Malta 7,374 10,575 9,877 9,788 –814 3,032 –255 400 –508 –324 Netherlands 623,794 606,311 593,699 610,218 149,814 15,716 –6,481 13,281 8,686 –14,365 Norway 57,040 56,816 56,792 54,698 9,356 393 1,130 77 1,189 –4,147 Portugal 87,289 78,638 80,839 87,103 4,872 –3,723 –3,235 –3,416 5,429 1,285 Slovakia 10,135 11,553 9,650 11,150 3,153 1,974 1,172 –281 –1,468 879 Slovenia 11,188 13,140 13,069 13,546 2,265 1,634 270 563 496 –303 Spain 396,744 362,356 333,712 344,265 23,866 –11,665 10,765 –16,694 –13,217 –9,589 Sweden 95,747 78,754 73,663 85,631 8,181 –12,432 –7,170 –2,737 –2,576 8,515 Switzerland 188,473 173,359 167,434 177,468 39,337 –17,955 4,201 –11,509 660 3,363
(of which in CHF) 76,590 65,330 60,612 62,247 11,369 –17,756 1,662 3,049 –425 –1,577 United Kingdom 1,125,298 997,612 905,093 960,174 167,473 –38,761 –53,806 –31,146 –68,624 –6,581
(of which in GBP) 268,367 240,096 254,982 265,693 44,191 55,580 4,583 35,488 18,767 –26,672 Vatican 1 1 41 – –1 – – – 39 –42 Other 651 775 853 914 73 –29 –107 –22 112 12
LiabilitiesAll Countries 8,309,213 7,646,775 7,160,703 7,283,429 1,432,297 –362,952 –255,349 –503,877 –348,563 –70,190
Developed Countries 5,266,212 4,896,232 4,463,543 4,559,189 914,658 –225,146 –280,613 –315,067 –339,879 –61,778 i) Europe 3,182,170 2,808,565 2,561,186 2,655,481 461,154 –238,482 –192,652 –231,458 –172,445 –34,726
Austria 22,139 26,605 24,908 23,431 2,474 2,573 –3,825 2,637 –658 –2,688 Andorra 1,787 1,375 1,226 1,420 34 –320 –81 46 –94 112 Belgium 79,007 71,354 65,771 81,238 9,696 –1,995 238 –5,518 –3,389 11,310 Cyprus 20,680 19,166 19,123 18,542 4,802 –738 836 –2,686 322 –1,247 Denmark 11,726 14,572 8,270 8,728 2,648 3,555 –820 4,598 –5,732 –163 Finland 11,749 6,955 12,142 8,394 –2,127 –3,986 –19,568 1,356 4,974 –4,306 France 182,306 185,724 171,987 194,105 29,482 13,306 –13,336 –17,318 –8,617 13,345 Germany 338,628 321,512 320,131 340,106 7,023 2,320 –6,541 –14,173 11,183 1,493 Greece 16,958 12,630 12,298 12,086 –1,595 –4,315 –696 –1,766 –24 –685 Iceland 2,549 932 718 792 1,181 –1,400 –1,143 –434 –192 35 Ireland 250,157 261,504 247,657 248,728 75,570 24,381 –5,959 –11,677 –8,150 –11,395 Italy 63,193 61,473 60,620 60,753 –1,714 987 3,753 573 1,548 –3,234 Liechtenstein 9,071 7,423 6,478 6,860 415 –1,306 –615 –498 –680 82 Luxembourg 228,514 223,599 188,039 184,529 67,800 4,870 –4,278 10,653 –28,801 –11,242 Malta 10,789 11,412 11,560 12,013 770 1,154 –54 735 544 –191 Netherlands 299,312 267,664 259,330 279,566 78,249 –18,411 –22,068 –7,540 –27 5,478 Norway 24,321 17,603 16,996 17,284 2,134 –6,253 –4,982 –1,484 –353 –387 Portugal 23,073 18,871 16,067 16,980 4,790 –3,035 –1,285 –1,314 –2,192 28 Slovakia 1,189 1,249 1,399 1,298 –331 103 33 –42 182 –174 Slovenia 1,226 1,318 1,133 1,088 163 –30 9 –155 –127 –107 Spain 53,160 48,518 44,507 42,089 2,409 –3,504 –704 –5,123 –2,225 –4,844 Sweden 36,933 26,109 23,315 23,918 8,418 –9,684 –4,196 –2,396 –2,136 –598 Switzerland 279,202 235,891 215,532 215,487 41,129 –24,441 17,932 –25,351 –14,003 –8,694
(of which in CHF) 32,627 26,532 26,264 24,125 –627 –6,454 390 –2,537 1,450 –3,442 United Kingdom 1,213,101 963,462 830,821 854,762 127,998 –212,349 –125,121 –154,772 –113,386 –16,711
(of which in GBP) 119,779 107,437 94,065 98,205 8,363 23,923 11,730 4,567 –11,590 –9,788 Vatican 753 802 637 735 –299 –104 –136 –164 –131 60 Other 647 842 521 549 39 138 –45 354 –280 –2
Amounts outstanding Estimated exchange rate adjusted changes
Table 6B: External positions of reporting banks vis-à-vis the non-bank sectorVis-à-vis individual countriesin millions of US dollars
A 28 BIS Quarterly Review, December 2009

Vis-à-vis countries Dec 2007 Dec 2008 Mar 2009 Jun 2009 2007 2008 Q3 2008 Q4 2008 Q1 2009 Q2 2009 Assets
ii) Other 3,513,898 2,930,698 2,845,006 2,918,367 444,042 –619,988 50,907 –489,639 –55,534 41,064 Australia 137,595 110,195 105,103 116,290 37,380 –24,456 –1,052 –15,122 –2,293 7,577 Canada 111,475 117,080 117,712 125,050 21,639 12,014 12,190 –743 3,017 4,213 Japan 267,418 228,463 178,303 203,472 21,127 –85,597 –7,147 –54,274 –39,199 20,254
(of which in JPY) 195,397 149,955 96,818 109,776 16,924 –91,464 –521 –67,880 –43,862 10,642 New Zealand 17,577 13,937 14,858 16,318 2,057 –3,107 –1,846 –1,794 1,279 823 United States 2,979,836 2,461,020 2,429,031 2,457,237 361,843 –518,845 48,769 –417,709 –18,334 8,195
(of which in USD) 2,527,035 2,145,907 2,125,376 2,144,668 300,852 –389,408 33,846 –319,801 –20,623 19,293
Offshore centres 1,624,025 1,308,708 1,265,412 1,252,934 320,112 –292,240 545 –227,715 –17,173 –45,183 Aruba 816 1,801 1,905 1,810 87 950 –193 –85 116 –102 Bahamas 29,688 21,698 25,083 25,072 8,092 –7,846 –1,183 –992 3,605 –889 Bahrain 4,985 3,987 3,644 3,981 956 –931 –214 –429 –309 277 Barbados 10,199 10,849 10,456 10,827 –1,688 1,876 1,533 –17 –238 –120 Bermuda 87,551 75,091 74,406 67,311 5,801 –12,105 4,136 –19,226 384 –7,988 Cayman Islands 897,766 658,718 649,735 625,450 135,222 –241,911 –8,816 –159,846 4,470 –34,243 Gibraltar 10,794 6,081 8,207 6,931 4,319 –1,255 1,004 –1,193 2,280 –1,889 Guernsey 34,661 30,954 27,765 28,553 10,969 –729 –272 –535 –2,413 –1,298 Hong Kong SAR 81,819 69,609 64,664 72,677 13,762 –11,574 –106 –8,563 –3,568 6,274 Isle of Man 20,735 21,975 21,799 24,521 4,937 3,479 –120 19 249 693 Jersey 212,774 164,854 149,507 155,363 80,032 –31,131 –438 –13,136 –12,716 –2,138 Lebanon 4,078 3,884 3,441 3,868 780 –810 –416 –954 –360 320 Macao SAR 2,197 3,496 3,904 3,873 1,243 1,275 757 52 423 –50 Mauritius 8,411 9,269 8,736 9,092 4,328 900 –2,264 479 –472 254 Netherlands Antilles 20,936 19,173 18,784 18,805 7,289 –1,917 –699 –549 20 –294 Panama 54,436 68,119 66,934 67,089 9,873 7,883 1,874 –577 1,686 –983 Samoa 1,096 1,398 1,293 1,283 252 280 131 –84 –89 –19 Singapore 41,018 39,605 36,583 36,767 13,917 –1,369 –3,170 –4,488 –2,220 –676 Vanuatu 111 69 61 67 –124 –43 –19 –10 –6 4 West Indies UK 91,611 86,425 76,924 77,868 11,992 –727 8,167 –18,482 –8,183 –2,165
Liabilitiesii) Other 2,084,042 2,087,667 1,902,357 1,903,708 453,504 13,336 –87,961 –83,609 –167,434 –27,052
Australia 46,168 39,582 37,687 47,952 6,765 –4,396 –3,008 –2,366 –1,190 8,929 Canada 54,675 56,105 58,974 60,688 11,484 –1,502 –3,104 –4,445 3,892 –51 Japan 145,525 126,031 101,320 115,362 17,560 –34,797 11,865 –30,406 –20,264 11,202
(of which in JPY) 77,848 51,082 36,645 46,226 526 –44,453 11,938 –37,423 –11,106 8,494 New Zealand 10,582 7,266 7,198 7,397 1,936 –2,787 –2,726 –525 66 –142 United States 1,827,085 1,858,678 1,697,170 1,672,305 415,753 56,818 –90,931 –45,867 –149,942 –46,986
(of which in USD) 1,499,172 1,561,876 1,402,227 1,362,745 368,261 62,057 –83,614 –24,198 –159,649 –39,959
Offshore centres 1,536,966 1,385,569 1,327,988 1,334,890 237,963 –109,255 34,101 –138,547 –36,981 –34,253 Aruba 877 1,127 1,174 1,036 17 269 56 221 66 –159 Bahamas 54,717 46,885 46,490 45,844 –1,904 –7,795 4,062 –9,697 362 –1,760 Bahrain 6,751 5,670 6,031 5,410 855 –859 –580 –19 420 –774 Barbados 20,441 12,617 16,991 18,322 2,448 –6,232 –1,219 –3,376 4,634 587 Bermuda 95,400 60,981 56,386 61,469 4,057 –33,630 –4,810 –22,271 –4,014 4,039 Cayman Islands 571,570 545,434 489,179 482,733 67,290 –27,627 26,468 –36,853 –47,678 –15,804 Gibraltar 8,833 6,461 7,603 5,597 –272 –1,360 1,328 –4,767 1,255 –2,347 Guernsey 68,943 79,799 78,699 81,796 37,307 18,549 4,425 7,632 837 –987 Hong Kong SAR 151,681 115,829 122,519 115,557 52,719 –35,543 5,430 –45,309 8,158 –9,996 Isle of Man 25,548 16,386 15,995 18,901 1,869 –5,321 –3,734 –330 –2,183 1,237 Jersey 109,190 96,420 94,795 106,062 27,004 8,175 3,606 –6,616 141 1,969 Lebanon 12,486 12,116 11,320 11,172 644 –596 –109 –715 –633 –428 Macao SAR 4,247 3,932 4,249 3,843 1,052 –329 –391 –418 348 –456 Mauritius 13,214 9,143 7,748 8,908 3,418 –3,152 –1,682 –2,218 –1,223 897 Netherlands Antilles 20,769 19,449 18,305 17,083 1,294 –1,408 –2,843 2,012 –607 –1,760 Panama 90,082 93,138 87,101 86,140 16,167 5,866 4,218 –1,090 –4,128 –3,515 Samoa 4,396 5,539 6,718 7,824 563 1,187 774 325 1,217 1,010 Singapore 64,810 56,129 54,957 56,418 14,921 –6,931 2,907 –6,874 –162 –101 Vanuatu 604 286 285 292 60 –312 –46 –172 4 –1 West Indies UK 207,767 189,645 192,581 191,951 4,004 –16,470 –6,033 –9,223 5,614 –5,137
Table 6B (cont.)
Amounts outstanding Estimated exchange rate adjusted changes
BIS Quarterly Review, December 2009 A 29

Vis-à-vis countries Dec 2007 Dec 2008 Mar 2009 Jun 2009 2007 2008 Q3 2008 Q4 2008 Q1 2009 Q2 2009
AssetsDeveloping countries 1,205,695 1,241,731 1,196,247 1,226,040 300,253 52,778 –2,977 –77,523 –22,877 2,352
i) Africa & Middle East 247,693 271,054 272,495 281,683 64,961 27,084 –8,855 2,893 5,205 3,837 Algeria 1,673 1,266 1,162 1,206 –416 –373 –68 –115 –70 3 Angola 2,360 3,489 3,565 3,707 –584 1,209 508 –480 125 68 Benin 81 71 67 74 –9 –7 17 –14 –1 3 Botswana 165 83 73 82 33 –82 –3 15 –9 7 Burkina Faso 309 299 284 347 –13 3 –14 –16 –6 51 Burundi 42 43 40 42 1 1 – –2 1 – Cameroon 1,814 1,165 1,097 1,090 –159 –587 –37 –141 –26 –62 Cape Verde 128 126 114 123 4 5 4 – –6 2 Central African Republic 20 15 11 11 3 –4 –1 –5 –3 –1 Chad 117 92 90 85 11 –15 11 –10 – –7 Comoros Islands 20 10 8 10 12 –10 – – –2 2 Congo 386 304 259 261 –90 –75 –15 –6 –35 –9 Congo Democratic Republic 516 488 501 518 122 –9 24 4 29 –6 Côte d’Ivoire 4,040 3,897 3,770 3,994 432 84 30 –96 31 12 Djibouti 207 201 214 246 94 –3 –32 –15 15 28 Egypt 14,063 11,441 11,653 12,428 2,627 –2,482 –679 –1,660 433 487 Equatorial Guinea 40 77 41 20 18 37 16 22 –35 –22 Eritrea 13 12 4 5 – –1 6 –4 –8 1 Ethiopia 30 19 20 30 –9 –12 –8 –14 2 9 Gabon 1,104 759 694 724 335 –310 30 –6 –40 –4 Gambia 92 93 89 89 –2 3 6 –5 –2 –2 Ghana 2,124 2,034 1,940 1,652 475 –42 160 286 –60 –339 Guinea 383 280 266 274 21 –99 14 –73 –4 –5 Guinea-Bissau 4 5 6 7 –2 1 1 1 1 1 Iran 10,192 8,568 8,285 8,179 –367 –1,284 61 –905 –25 –447 Iraq 1,439 1,504 1,431 1,519 128 132 330 –164 –17 15 Israel 8,990 8,040 7,740 7,648 –1,443 –896 –742 –65 –103 –301 Jordan 1,370 1,659 2,274 2,394 300 82 –147 –136 635 84 Kenya 1,362 1,018 1,062 1,081 460 –297 –4 –89 70 –30 Kuwait 18,587 20,909 18,375 18,209 6,944 2,579 2,445 –2,374 –2,297 –401 Lesotho 8 27 18 20 –9 19 7 13 –8 1 Liberia 18,109 20,479 20,964 21,019 1,547 2,086 –184 199 714 –86
LiabilitiesDeveloping countries 830,416 806,983 799,439 813,669 170,347 –12,194 4,913 –23,825 1,698 –3,373
i) Africa & Middle East 285,931 244,282 239,904 250,147 42,505 –32,135 –27,555 –17,385 –958 2,812 Algeria 3,396 3,406 3,243 3,467 –131 153 –246 87 –37 58 Angola 2,062 4,579 3,420 3,422 –147 2,596 1,955 –589 –1,119 –52 Benin 273 227 246 280 84 –38 23 – 27 23 Botswana 302 267 258 259 –12 3 52 –60 –4 –17 Burkina Faso 205 252 230 275 26 57 –8 38 –13 34 Burundi 122 113 111 119 –9 –6 3 –3 1 4 Cameroon 867 960 1,030 1,083 –6 135 107 –39 96 7 Cape Verde 108 89 71 76 16 –14 –8 2 –15 1 Central African Republic 58 81 66 66 –2 26 15 –4 –12 –4 Chad 260 175 202 188 106 –78 –6 –128 30 –18 Comoros Islands 45 50 48 49 – 6 –33 11 –1 –1 Congo 594 697 701 573 102 124 5 78 22 –154 Congo Democratic Republic 1,099 1,078 1,017 1,101 211 13 33 –42 –35 49 Côte d’Ivoire 1,456 1,436 1,278 1,390 54 37 –130 32 –104 45 Djibouti 263 174 156 162 28 –81 –3 –36 –15 – Egypt 14,294 13,649 13,183 13,635 1,745 –247 285 –1,434 –325 181 Equatorial Guinea 563 586 868 965 215 40 20 –175 292 82 Eritrea 26 30 20 21 –14 8 14 –4 –8 – Ethiopia 349 295 274 294 44 –36 15 35 –15 6 Gabon 713 995 746 921 129 314 77 64 –220 139 Gambia 142 120 115 127 –4 –9 –3 –18 –2 3 Ghana 719 743 803 783 –100 69 –30 95 69 –42 Guinea 318 325 319 313 34 22 –10 3 – –16 Guinea-Bissau 43 28 25 42 7 –13 – –17 –1 15 Iran 5,831 3,941 4,638 5,223 –261 –1,599 204 –310 800 297 Iraq 788 586 573 588 55 –163 –60 –27 –6 –3 Israel 23,822 19,687 18,864 19,088 4,710 –3,750 –1,308 –2,895 –593 –237 Jordan 4,807 5,882 5,013 4,131 –21 843 –85 1,230 –835 –998 Kenya 5,103 4,240 4,238 4,527 258 33 104 –121 69 –95 Kuwait 25,204 25,014 22,537 24,670 5,590 775 –729 2,314 –2,244 1,546 Lesotho 24 16 15 17 –2 –7 –5 1 – 1 Liberia 17,080 17,012 16,618 17,255 578 35 935 –193 –198 353
Table 6B (cont.)
Amounts outstanding Estimated exchange rate adjusted changes
A 30 BIS Quarterly Review, December 2009
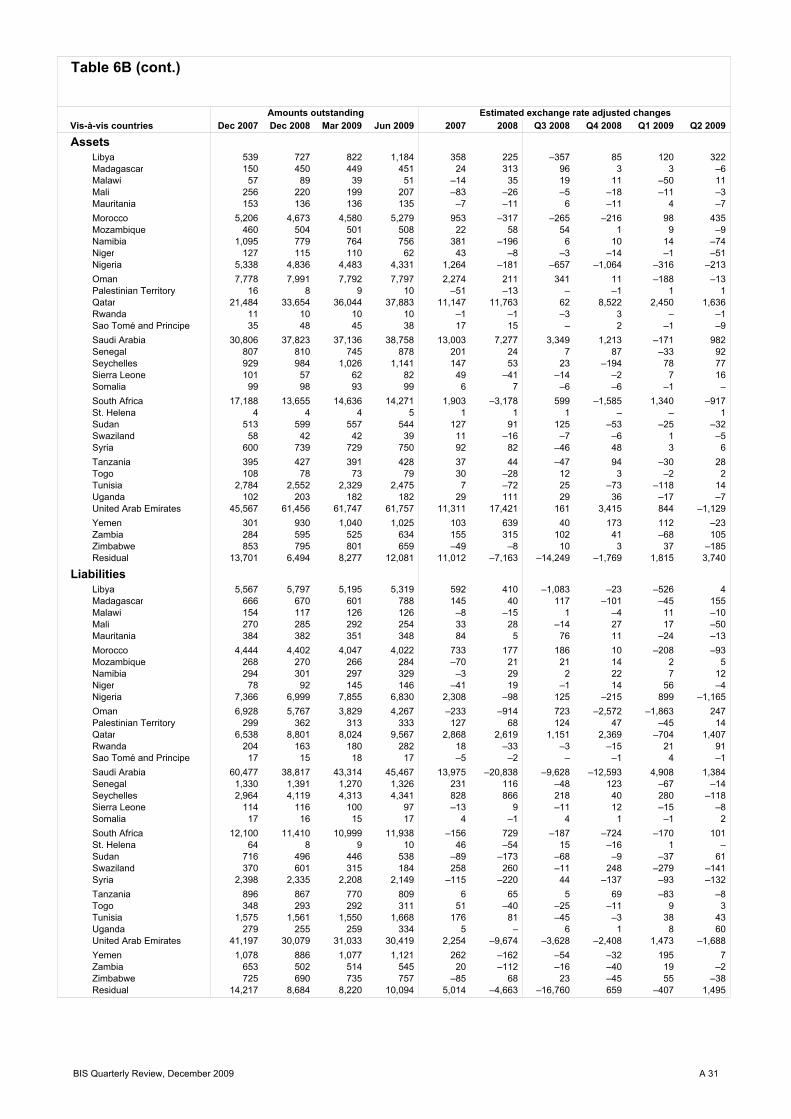
Vis-à-vis countries Dec 2007 Dec 2008 Mar 2009 Jun 2009 2007 2008 Q3 2008 Q4 2008 Q1 2009 Q2 2009
AssetsLibya 539 727 822 1,184 358 225 –357 85 120 322 Madagascar 150 450 449 451 24 313 96 3 3 –6 Malawi 57 89 39 51 –14 35 19 11 –50 11 Mali 256 220 199 207 –83 –26 –5 –18 –11 –3 Mauritania 153 136 136 135 –7 –11 6 –11 4 –7 Morocco 5,206 4,673 4,580 5,279 953 –317 –265 –216 98 435 Mozambique 460 504 501 508 22 58 54 1 9 –9 Namibia 1,095 779 764 756 381 –196 6 10 14 –74 Niger 127 115 110 62 43 –8 –3 –14 –1 –51 Nigeria 5,338 4,836 4,483 4,331 1,264 –181 –657 –1,064 –316 –213 Oman 7,778 7,991 7,792 7,797 2,274 211 341 11 –188 –13 Palestinian Territory 16 8 9 10 –51 –13 – –1 1 1 Qatar 21,484 33,654 36,044 37,883 11,147 11,763 62 8,522 2,450 1,636 Rwanda 11 10 10 10 –1 –1 –3 3 – –1 Sao Tomé and Principe 35 48 45 38 17 15 – 2 –1 –9 Saudi Arabia 30,806 37,823 37,136 38,758 13,003 7,277 3,349 1,213 –171 982 Senegal 807 810 745 878 201 24 7 87 –33 92 Seychelles 929 984 1,026 1,141 147 53 23 –194 78 77 Sierra Leone 101 57 62 82 49 –41 –14 –2 7 16 Somalia 99 98 93 99 6 7 –6 –6 –1 – South Africa 17,188 13,655 14,636 14,271 1,903 –3,178 599 –1,585 1,340 –917 St. Helena 4 4 4 5 1 1 1 – – 1 Sudan 513 599 557 544 127 91 125 –53 –25 –32 Swaziland 58 42 42 39 11 –16 –7 –6 1 –5 Syria 600 739 729 750 92 82 –46 48 3 6 Tanzania 395 427 391 428 37 44 –47 94 –30 28 Togo 108 78 73 79 30 –28 12 3 –2 2 Tunisia 2,784 2,552 2,329 2,475 7 –72 25 –73 –118 14 Uganda 102 203 182 182 29 111 29 36 –17 –7 United Arab Emirates 45,567 61,456 61,747 61,757 11,311 17,421 161 3,415 844 –1,129 Yemen 301 930 1,040 1,025 103 639 40 173 112 –23 Zambia 284 595 525 634 155 315 102 41 –68 105 Zimbabwe 853 795 801 659 –49 –8 10 3 37 –185 Residual 13,701 6,494 8,277 12,081 11,012 –7,163 –14,249 –1,769 1,815 3,740
LiabilitiesLibya 5,567 5,797 5,195 5,319 592 410 –1,083 –23 –526 4 Madagascar 666 670 601 788 145 40 117 –101 –45 155 Malawi 154 117 126 126 –8 –15 1 –4 11 –10 Mali 270 285 292 254 33 28 –14 27 17 –50 Mauritania 384 382 351 348 84 5 76 11 –24 –13 Morocco 4,444 4,402 4,047 4,022 733 177 186 10 –208 –93 Mozambique 268 270 266 284 –70 21 21 14 2 5 Namibia 294 301 297 329 –3 29 2 22 7 12 Niger 78 92 145 146 –41 19 –1 14 56 –4 Nigeria 7,366 6,999 7,855 6,830 2,308 –98 125 –215 899 –1,165 Oman 6,928 5,767 3,829 4,267 –233 –914 723 –2,572 –1,863 247 Palestinian Territory 299 362 313 333 127 68 124 47 –45 14 Qatar 6,538 8,801 8,024 9,567 2,868 2,619 1,151 2,369 –704 1,407 Rwanda 204 163 180 282 18 –33 –3 –15 21 91 Sao Tomé and Principe 17 15 18 17 –5 –2 – –1 4 –1 Saudi Arabia 60,477 38,817 43,314 45,467 13,975 –20,838 –9,628 –12,593 4,908 1,384 Senegal 1,330 1,391 1,270 1,326 231 116 –48 123 –67 –14 Seychelles 2,964 4,119 4,313 4,341 828 866 218 40 280 –118 Sierra Leone 114 116 100 97 –13 9 –11 12 –15 –8 Somalia 17 16 15 17 4 –1 4 1 –1 2 South Africa 12,100 11,410 10,999 11,938 –156 729 –187 –724 –170 101 St. Helena 64 8 9 10 46 –54 15 –16 1 – Sudan 716 496 446 538 –89 –173 –68 –9 –37 61 Swaziland 370 601 315 184 258 260 –11 248 –279 –141 Syria 2,398 2,335 2,208 2,149 –115 –220 44 –137 –93 –132 Tanzania 896 867 770 809 6 65 5 69 –83 –8 Togo 348 293 292 311 51 –40 –25 –11 9 3 Tunisia 1,575 1,561 1,550 1,668 176 81 –45 –3 38 43 Uganda 279 255 259 334 5 – 6 1 8 60 United Arab Emirates 41,197 30,079 31,033 30,419 2,254 –9,674 –3,628 –2,408 1,473 –1,688 Yemen 1,078 886 1,077 1,121 262 –162 –54 –32 195 7 Zambia 653 502 514 545 20 –112 –16 –40 19 –2 Zimbabwe 725 690 735 757 –85 68 23 –45 55 –38 Residual 14,217 8,684 8,220 10,094 5,014 –4,663 –16,760 659 –407 1,495
Table 6B (cont.)
Amounts outstanding Estimated exchange rate adjusted changes
BIS Quarterly Review, December 2009 A 31

Vis-à-vis countries Dec 2007 Dec 2008 Mar 2009 Jun 2009 2007 2008 Q3 2008 Q4 2008 Q1 2009 Q2 2009
Assetsii) Asia & Pacific 303,801 278,167 266,162 275,058 93,404 –24,092 –12,033 –34,689 –7,147 4,020
Afghanistan 100 42 44 81 60 –52 39 –35 2 36 Armenia 104 91 113 114 9 –8 11 –15 25 –3 Azerbaijan 1,004 2,184 2,156 2,317 93 1,193 271 10 13 105 Bangladesh 863 989 895 886 240 133 136 –78 –86 –17 Bhutan 63 59 57 59 –2 –1 – –2 – –1 British Overseas Territories 356 429 394 397 –1,244 119 –51 71 –24 –16 Brunei 199 390 284 439 –57 206 65 94 –103 145 Cambodia 118 180 187 189 25 66 26 45 8 –1 China 66,936 54,004 46,631 50,982 31,151 –11,193 –5,486 –14,293 –6,657 3,517 Chinese Taipei 17,040 12,371 11,909 13,621 2,144 –4,542 –4,477 –4,413 –237 1,431 Fiji 190 25 223 33 39 –163 –102 –64 199 –191 French Polynesia 571 754 766 829 –9 226 3 –13 48 19 Georgia 162 303 294 245 –33 127 –25 44 –4 –55 India 56,180 56,344 56,389 55,997 18,834 –881 874 –4,032 1,204 –1,310 Indonesia 22,478 21,013 20,805 21,395 –410 –1,415 –611 –1,657 347 4 Kazakhstan 4,728 7,256 7,631 7,426 957 2,586 1,203 987 428 –292 Kiribati 4 – – 1 –7 –4 2 –2 – 1 Kyrgyz Republic 25 41 32 37 – 17 13 –8 –8 4 Laos 311 347 351 332 151 37 24 –44 5 –20 Malaysia 20,198 15,386 14,848 14,722 2,488 –4,839 –3,513 –3,452 –307 –380 Maldives 220 299 277 287 15 91 19 –86 –16 3 Marshall Islands 17,107 23,105 24,013 24,176 7,210 5,877 2,989 870 937 129 Micronesia 15 25 – – 14 10 –2 1 –25 –
Liabilitiesii) Asia & Pacific 243,033 233,193 229,986 228,998 87,862 –5,858 19,508 –8,354 –805 –5,350
Afghanistan 199 117 124 90 75 –75 10 1 9 –39 Armenia 163 154 158 170 67 –5 –2 –7 8 4 Azerbaijan 869 694 396 445 264 –99 –308 –71 –282 44 Bangladesh 760 498 482 682 253 –221 19 –392 –8 179 Bhutan 123 9 9 13 114 –114 18 –35 1 3 British Overseas Territories 2,113 1,087 1,412 1,035 1,142 –871 –524 –125 357 –431 Brunei 1,855 2,119 2,203 2,039 570 380 9 401 122 –229 Cambodia 139 122 138 126 30 –10 14 4 18 –14 China 77,074 82,889 73,157 71,677 39,142 5,393 22,930 –2,314 –9,192 –2,254 Chinese Taipei 48,903 50,243 50,825 50,125 10,527 1,831 1,719 1,014 969 –1,357 Fiji 96 105 104 83 2 11 –9 7 2 –27 French Polynesia 302 388 302 295 –33 97 –20 62 –71 –22 Georgia 188 348 345 283 22 170 –10 21 – –75 India 17,369 15,281 16,332 15,518 3,301 –1,389 –794 156 1,178 –1,213 Indonesia 5,431 4,381 4,404 4,347 362 –921 –255 –336 81 –164 Kazakhstan 2,632 3,889 3,616 3,488 1,232 1,028 113 –57 –222 –214 Kiribati 132 100 82 117 – –3 –6 17 –16 24 Kyrgyz Republic 44 56 43 59 8 12 –10 19 –12 15 Laos 116 58 80 75 –48 –56 18 4 23 –11 Malaysia 7,321 6,792 7,078 6,453 1,232 53 –398 –296 375 –868 Maldives 96 84 95 84 –48 –7 –5 –15 12 –13 Marshall Islands 6,269 7,187 7,769 7,622 1,631 948 635 –223 678 –294 Micronesia 17 36 17 18 –2 17 –9 –1 –18 1
Table 6B (cont.)
Amounts outstanding Estimated exchange rate adjusted changes
A 32 BIS Quarterly Review, December 2009

Vis-à-vis countries Dec 2007 Dec 2008 Mar 2009 Jun 2009 2007 2008 Q3 2008 Q4 2008 Q1 2009 Q2 2009
AssetsMongolia 60 88 78 74 10 29 21 –11 –9 –6 Myanmar 39 70 78 65 –12 32 3 16 10 –15 Nauru 11 16 16 13 3 6 – 5 – –3 Nepal 33 26 28 29 –56 –6 –8 –6 2 – New Caledonia 1,028 1,687 1,613 1,648 95 775 54 19 –1 –62 North Korea 48 44 41 84 15 –4 1 3 –1 41 Pakistan 3,256 3,552 3,282 3,536 718 345 329 81 –238 208 Palau 31 34 34 32 6 3 – 4 – –2 Papua New Guinea 228 204 209 198 –188 –15 –35 –21 8 –19 Philippines 12,520 11,110 11,244 10,900 1,277 –1,479 –489 –296 378 –549 Solomon Islands 29 21 21 20 –1 –7 –6 –1 – –1 South Korea 59,042 46,221 40,805 44,424 26,416 –12,664 –3,820 –7,818 –4,425 2,705 Sri Lanka 1,602 1,805 1,636 1,874 385 252 247 –251 –108 165 Tajikistan 4 3 4 3 4 –1 – –2 1 –1 Thailand 8,666 8,650 8,523 8,518 –333 –49 –252 –188 66 –183 Timor Leste 5 5 5 5 2 1 – – – – Tonga –11 3 3 3 –19 15 – 5 – – Turkmenistan 4 2 5 6 – –2 –1 –1 3 1 Tuvalu – 1 1 11 –1 1 – – – 10 US Pacific Islands 1,202 647 614 588 787 –290 37 127 –22 –36 Uzbekistan 153 224 263 419 6 75 175 –94 42 153 Vietnam 4,880 5,769 5,223 5,811 1,807 930 366 –128 –410 436 Wallis/Futuna 25 22 19 20 –2 –2 3 –3 –2 – Residual 1,974 2,326 4,118 2,212 827 371 –66 –56 1,811 –1,930
LiabilitiesMongolia 143 54 25 46 131 –87 –31 20 –28 19 Myanmar 225 310 450 850 8 93 12 107 153 368 Nauru 24 11 10 10 7 –10 –2 –16 –1 –1 Nepal 248 329 388 311 46 87 –22 66 70 –87 New Caledonia 581 713 623 594 116 145 –41 150 –69 –55 North Korea 58 42 70 68 –40 –13 5 –8 29 –6 Pakistan 4,226 2,903 2,618 2,838 179 –1,090 104 65 –249 106 Palau 5 3 4 1 2 – –3 –6 1 –3 Papua New Guinea 546 629 1,442 1,349 –482 107 –264 165 819 –124 Philippines 7,410 6,005 5,957 6,306 1,813 –1,360 –656 177 6 307 Solomon Islands 80 68 70 81 –12 –7 –5 –9 4 7 South Korea 12,919 9,107 9,457 10,361 6,400 –3,267 –214 –3,392 472 677 Sri Lanka 904 679 717 750 102 –111 –12 –205 57 –10 Tajikistan 22 22 24 27 1 2 –42 –11 2 2 Thailand 6,410 6,151 5,981 6,313 953 45 –141 71 –62 94 Timor Leste 11 8 9 6 4 –1 –2 –1 1 –3 Tonga 4 3 1 3 – –1 –5 1 –2 2 Turkmenistan 27 32 39 37 7 6 –9 9 6 –3 Tuvalu – 5 15 14 – 5 1 4 10 –3 US Pacific Islands 235 181 265 209 –92 –44 87 –16 86 –60 Uzbekistan 484 614 755 847 48 161 20 –267 148 66 Vietnam 770 724 689 733 234 –30 93 –126 –20 23 Wallis/Futuna 20 39 48 56 – 22 18 4 10 6 Residual 35,470 27,924 31,158 32,344 18,595 –6,676 –2,518 –2,971 3,738 283
Table 6B (cont.)
Amounts outstanding Estimated exchange rate adjusted changes
BIS Quarterly Review, December 2009 A 33

Vis-à-vis countries Dec 2007 Dec 2008 Mar 2009 Jun 2009 2007 2008 Q3 2008 Q4 2008 Q1 2009 Q2 2009
Assetsiii) Europe 392,791 420,388 395,067 401,187 101,213 37,554 3,576 –18,036 –13,797 –8,222
Albania 156 656 512 668 12 513 50 279 –115 126 Belarus 905 1,012 967 960 319 151 93 –79 –21 –41 Bosnia and Herzegovina 985 1,157 1,424 1,408 288 244 42 –19 308 –96 Bulgaria 8,277 11,141 10,534 11,662 2,009 3,330 494 681 –155 509 Croatia 20,284 23,688 21,936 23,400 5,721 3,607 1,036 196 –716 220 Czech Republic 22,621 24,581 23,488 25,489 3,021 3,626 –675 –636 –138 729 Estonia 3,282 3,095 2,782 2,938 318 –33 –81 –17 –189 4 Hungary 38,025 44,079 42,184 44,571 6,718 8,620 3,062 –3,280 –386 286 Latvia 4,412 4,825 4,695 4,928 2,334 840 112 –101 75 –47 Lithuania 6,710 6,933 6,475 6,413 1,500 869 –249 –155 –158 –441 Macedonia, FYR 255 472 427 467 111 148 59 16 –27 14 Moldova 70 112 96 90 11 46 24 22 –12 –10 Montenegro 326 545 535 572 189 250 38 25 10 10 Poland 59,363 58,957 54,324 57,146 8,929 2,745 93 –2,562 –2,317 118 Romania 19,705 26,762 26,449 26,944 6,580 7,620 2,059 917 762 –975 Russia 92,924 91,490 86,921 83,008 37,158 –3,344 –4,073 –8,134 –3,561 –4,932 Serbia 5,622 6,665 6,254 6,713 2,533 585 50 –255 –129 91 Turkey 96,092 100,257 93,028 91,575 22,459 6,850 2,156 –4,159 –5,349 –3,717 Ukraine 9,199 10,973 9,259 9,623 1,576 1,275 –167 –1,215 –1,534 195 Res. Serbia & Montenegro 43 82 70 96 –341 39 –4 72 –9 22 Residual Europe 3,535 2,906 2,707 2,516 –138 –428 –543 369 –137 –286
Liabilitiesiii) Europe 77,152 93,332 99,855 99,287 10,542 12,539 3,053 –963 8,256 –4,030
Albania 97 89 95 108 32 4 –9 –35 7 9 Belarus 240 303 308 341 28 39 31 –30 14 24 Bosnia and Herzegovina 486 583 447 438 –22 101 57 78 –110 –33 Bulgaria 1,572 1,411 1,434 1,498 121 –208 –161 282 73 –15 Croatia 1,723 1,953 1,799 1,892 125 321 13 79 –90 7 Czech Republic 4,025 5,290 5,964 6,830 –379 1,493 –291 562 847 562 Estonia 614 355 337 384 332 126 –65 110 –7 29 Hungary 3,653 4,492 10,312 10,275 413 627 1,445 –1,429 5,844 –588 Latvia 309 470 426 648 –21 220 42 51 –29 200 Lithuania 634 431 382 448 418 –199 –132 16 –36 49 Macedonia, FYR 229 248 234 236 22 25 6 5 –5 –10 Moldova 88 193 169 150 14 7 8 –3 –20 –24 Montenegro 53 83 101 66 24 32 –12 15 21 –39 Poland 3,741 4,520 4,081 4,449 831 956 –245 535 –300 164 Romania 1,473 1,579 1,476 1,391 296 –37 –74 –9 –51 –149 Russia 21,116 31,060 33,061 31,364 5,759 4,686 –2,065 3,437 2,583 –2,715 Serbia 867 1,067 927 933 537 113 76 –36 –97 –42 Turkey 30,587 33,292 32,129 31,650 2,961 3,750 4,760 –5,413 –678 –1,166 Ukraine 1,791 2,116 2,356 2,263 –159 10 –10 –41 225 –167 Res. Serbia & Montenegro 18 10 25 27 –452 –7 1 3 16 1 Residual Europe 3,836 3,787 3,792 3,896 –11 479 –322 859 49 –125
Table 6B (cont.)
Amounts outstanding Estimated exchange rate adjusted changes
A 34 BIS Quarterly Review, December 2009

Vis-à-vis countries Dec 2007 Dec 2008 Mar 2009 Jun 2009 2007 2008 Q3 2008 Q4 2008 Q1 2009 Q2 2009
Assetsiv) Latin America/Caribbean 261,410 272,122 262,523 268,112 40,678 12,233 14,335 –27,691 –7,139 2,716
Argentina 17,178 13,594 12,842 12,831 4,291 –3,443 –835 –2,371 –628 –127 Belize 1,824 2,387 2,273 2,349 367 399 433 –21 –62 5 Bolivia 400 255 246 243 28 –142 –44 –164 –8 –5 Brazil 73,374 78,796 78,122 84,014 10,861 6,086 4,793 –8,721 126 4,910 Chile 19,688 21,985 24,676 23,680 1,932 2,562 701 –844 2,890 –1,215 Colombia 9,809 8,090 7,894 8,051 2,386 –1,686 –735 –895 –147 98 Costa Rica 4,188 4,276 4,040 3,823 829 91 –34 –359 –229 –225 Cuba 896 714 637 633 –57 –141 25 –144 –56 –27 Dominica 73 94 49 44 9 23 44 7 –44 –5 Dominican Republic 4,075 3,153 3,266 3,340 1,439 –841 –74 –328 146 14 Ecuador 2,745 1,893 2,005 1,849 700 –866 57 –276 120 –162 El Salvador 1,442 1,205 1,137 1,060 261 –230 26 –25 –63 –84 Falkland Islands 61 37 37 40 34 –21 –3 –3 1 – Grenada 75 35 31 33 39 –38 9 –7 –4 2 Guatemala 2,508 3,093 3,064 2,928 203 587 205 –20 –25 –141 Guyana 95 667 950 792 7 584 –282 –151 283 –158 Haiti 83 96 94 95 –47 17 5 –9 – –1 Honduras 790 885 875 791 144 78 21 21 –6 –89 Jamaica 1,582 1,457 1,139 1,139 205 –37 36 –177 –301 –22 Mexico 76,315 83,457 78,619 79,326 10,504 7,340 4,351 –5,174 –4,074 –136 Nicaragua 404 412 399 400 17 10 – –29 –11 –1 Paraguay 697 840 834 790 –90 137 –24 98 2 –49 Peru 6,641 8,493 8,194 7,955 1,376 1,893 466 –747 –260 –288 St. Lucia 199 436 435 262 25 180 11 43 5 –179 St. Vincent 669 601 576 648 – –65 48 –59 –11 54 Surinam 25 28 62 33 9 5 4 –3 35 –31 Trinidad and Tobago 2,583 2,954 2,864 3,143 35 390 115 –24 –85 253 Turks and Caicos 513 467 447 418 –156 24 –16 122 –17 –48 Uruguay 2,432 2,512 2,414 2,594 835 103 –49 –454 –65 154 Venezuela 8,866 6,620 5,940 5,996 –552 –2,229 315 –2,006 –585 –29 Residual 21,180 22,590 18,362 18,812 5,045 1,466 4,768 –4,971 –4,066 248
Int. organisations 38,360 32,048 45,459 42,778 3,801 –2,392 –1,059 –1,660 14,300 3,728 Unallocated 34,544 61,373 52,499 53,324 17,926 27,783 2,699 13,326 –7,151 –1,413
Liabilitiesiv) Latin America/Caribbean 224,300 236,176 229,694 235,237 29,438 13,261 9,908 2,877 –4,794 3,195
Argentina 26,152 26,097 26,339 27,098 3,144 168 326 –844 388 552 Belize 7,504 9,223 8,896 9,194 1,744 1,425 307 268 –146 31 Bolivia 1,935 2,172 2,015 2,024 598 108 306 251 –145 –6 Brazil 24,072 26,291 25,646 23,795 1,453 2,551 2,517 446 –454 –2,131 Chile 9,768 7,823 7,796 6,989 –1,574 –1,968 121 118 30 –882 Colombia 11,494 10,199 10,517 10,844 607 –1,234 –762 –373 344 285 Costa Rica 4,203 4,295 3,921 3,557 508 149 292 –315 –332 –427 Cuba 193 206 212 220 14 22 21 –14 12 –1 Dominica 173 213 198 226 6 28 –8 –13 –11 19 Dominican Republic 5,030 4,705 4,650 4,358 762 –470 –73 –228 –36 –316 Ecuador 4,075 4,626 4,762 4,657 497 563 271 280 147 –119 El Salvador 1,043 1,206 1,331 1,395 275 168 52 122 127 70 Falkland Islands 45 43 43 49 –9 8 –2 4 1 1 Grenada 84 134 199 162 22 55 17 15 69 –47 Guatemala 3,204 3,185 3,200 3,222 440 –15 –4 5 21 14 Guyana 454 225 128 159 –39 –214 –199 13 –96 24 Haiti 344 426 475 408 29 84 1 27 50 –69 Honduras 1,113 1,153 1,167 1,192 177 40 16 27 17 22 Jamaica 1,088 1,104 1,002 1,058 245 89 –77 68 –96 32 Mexico 40,227 43,244 41,335 44,066 2,020 3,026 –388 1,578 –1,658 2,569 Nicaragua 456 632 619 882 54 174 168 –53 –10 260 Paraguay 1,318 1,244 1,215 1,189 81 –58 –24 –28 –18 –40 Peru 5,700 5,126 5,435 5,044 1,056 –530 55 174 335 –426 St. Lucia 287 375 367 414 31 93 –43 160 –3 37 St. Vincent 3,006 3,412 3,179 3,013 –1,049 556 400 –167 –154 –286 Surinam 373 365 350 428 3 8 28 –71 –3 61 Trinidad and Tobago 1,414 1,038 1,087 1,465 158 –326 –189 –138 54 353 Turks and Caicos 1,039 1,454 1,534 1,678 –165 541 635 –897 103 83 Uruguay 7,227 7,469 7,563 7,225 599 314 257 27 157 –412 Venezuela 33,514 37,581 36,339 38,235 4,608 4,378 1,149 –746 –1,000 1,567 Residual 27,765 30,910 28,174 30,991 13,150 3,523 4,736 3,180 –2,487 2,376
Int. organisations 127,161 103,649 105,766 55,635 11,112 –16,551 –1,634 –11,861 4,253 –4,982 Unallocated 548,458 454,342 463,967 520,046 98,216 193 –12,117 –14,577 22,347 34,197
Amounts outstanding Estimated exchange rate adjusted changes
Table 6B (cont.)
BIS Quarterly Review, December 2009 A 35

Table 7A: External loans and deposits of reporting banks vis-à-vis all sectorsVis-à-vis individual countriesin millions of US dollars
Vis-à-vis countries Dec 2007 Dec 2008 Mar 2009 Jun 2009 2007 2008 Q3 2008 Q4 2008 Q1 2009 Q2 2009
LoansAll countries 24,541,175 22,728,743 21,532,000 21,891,364 4,519,024 –1,023,872 189,684 –1,499,082 –678,758 –394,422 Developed Countries 19,207,304 17,453,302 16,492,551 16,844,635 3,504,002 –1,065,419 157,725 –1,213,354 –530,008 –291,524
i) Europe 14,356,416 12,745,307 11,963,624 12,322,520 2,797,490 –866,462 –62,537 –1,073,870 –401,558 –235,458 Austria 135,372 121,741 118,466 109,135 14,361 862 –1,554 –20,749 1,194 –14,993 Andorra 2,374 1,817 2,098 2,187 –471 –490 –83 –36 353 –37 Belgium 564,586 394,345 374,591 378,620 72,586 –131,046 –61,766 –111,507 –7,401 –12,843 Cyprus 41,530 64,746 80,499 92,929 12,782 24,107 2,007 9,694 17,314 8,466 Denmark 212,199 191,539 195,012 211,239 32,745 –3,360 –10,015 –29,332 10,163 6,111 Finland 80,722 89,570 86,961 101,398 17,449 14,807 8,647 –14,424 –101 10,438 France 1,542,406 1,384,783 1,320,274 1,310,163 243,763 –79,914 –70,581 –112,901 –21,131 –70,020 Germany 1,180,510 1,132,254 1,074,265 1,151,702 123,546 5,783 –14,793 –80,484 –15,859 24,461 Greece 92,671 108,118 109,629 120,119 14,780 6,771 13,065 –19,902 5,058 5,024 Iceland 46,022 22,987 21,088 21,526 25,650 –19,398 –4,271 –18,425 –1,100 –648 Ireland 786,766 865,838 793,934 845,549 206,723 144,459 –767 20,760 –49,805 5,914 Italy 675,838 577,962 577,382 610,081 130,370 –58,511 3,357 –100,907 21,316 896 Liechtenstein 8,084 7,508 7,124 7,301 –489 –483 –272 –297 –30 –178 Luxembourg 650,486 741,891 600,367 629,528 151,705 136,927 37,317 22,651 –113,584 –191 Malta 28,861 35,365 32,502 30,737 4,392 7,714 1,981 –1,955 –1,959 –2,767 Netherlands 1,005,853 892,325 837,318 864,518 228,432 –52,861 51,140 –165,441 –26,974 –13,617 Norway 246,559 218,530 197,791 178,856 29,468 –17,250 –1,030 –23,362 –16,059 –26,112 Portugal 208,484 177,166 170,002 176,735 9,664 –21,397 –8,185 –17,454 102 –2,643 Slovakia 15,069 19,694 9,058 9,308 6,832 5,450 1,052 883 –9,731 –277 Slovenia 28,362 31,143 28,718 28,310 6,963 3,414 –864 770 –990 –2,074 Spain 575,914 639,245 632,046 664,012 99,743 106,229 42,486 –32,830 14,107 –5,075 Sweden 245,125 234,752 216,988 223,607 44,326 2,159 11,634 –16,812 –11,921 –922 Switzerland 970,671 671,068 641,717 672,017 315,259 –266,904 7,028 –75,550 –9,406 1,107
(of which in CHF) 132,150 125,833 122,321 127,290 18,290 –13,035 –4,735 –10,503 4,672 –1,558 United Kingdom 5,010,431 4,119,160 3,834,041 3,881,385 1,006,545 –673,571 –67,892 –286,249 –185,186 –145,193
(of which in GBP) 788,163 546,558 570,298 622,561 334,614 –48,720 –25,727 28,261 32,584 –31,720 Vatican 11 1 41 – 8 –3 58 –51 39 –42 Other 1,510 1,759 1,712 1,558 358 39 –239 39 37 –245
DepositsAll Countries 27,129,302 24,282,538 22,985,716 23,273,499 4,685,266 –1,762,656 65,672 –1,751,534 –800,958 –518,362 Developed Countries 18,918,002 17,009,036 15,994,126 16,358,628 3,352,210 –1,132,701 –95,852 –1,256,591 –608,155 –269,071
i) Europe 14,103,069 12,180,850 11,339,953 11,657,096 2,447,329 –1,136,473 16,849 –1,128,697 –484,392 –263,217 Austria 121,954 114,430 120,048 121,732 –7,887 –8,234 –13,441 –18,283 9,753 –4,804 Andorra 8,561 7,753 7,853 5,493 1,475 661 964 –1,342 329 –2,691 Belgium 648,283 460,944 426,860 447,806 139,524 –101,192 82,169 –206,057 –18,133 –3,012 Cyprus 46,981 48,575 54,356 56,631 9,781 3,830 2,084 2,569 6,882 –244 Denmark 158,877 164,352 164,213 151,134 41,081 16,602 –6,788 9,755 4,185 –21,487 Finland 85,614 85,731 91,009 91,075 4,057 7,488 –24,116 –7,787 7,846 –3,770 France 1,141,821 1,074,430 1,005,745 1,052,398 184,079 –1,790 –55,832 –31,072 –33,078 –6,929 Germany 1,937,971 1,917,543 1,762,097 1,846,248 237,352 –6,340 79,867 –117,374 –87,177 –7,238 Greece 79,640 99,130 106,887 120,213 14,736 –4,318 –4,199 –632 11,063 7,133 Iceland 21,715 7,491 7,271 7,066 2,442 –11,484 –3,580 –11,293 –13 –851 Ireland 492,056 529,419 512,744 533,458 87,562 100,368 6,222 22,927 –3,547 –15,783 Italy 354,126 276,734 238,812 254,494 22,656 –58,278 –20,006 –65,367 –26,568 2,457 Liechtenstein 36,917 34,372 30,752 31,444 6,555 –1,565 929 –2,573 –2,427 –737 Luxembourg 787,386 766,278 643,173 658,896 135,334 43,999 26,253 –52,594 –95,758 –15,535 Malta 16,113 17,747 15,986 16,981 1,191 2,886 127 531 –1,158 125 Netherlands 1,006,346 825,829 781,324 765,174 220,233 –131,345 –34,502 –48,596 –19,954 –57,491 Norway 164,260 102,207 91,793 68,730 23,027 –55,634 –19,591 –7,947 –16,229 –26,083 Portugal 113,434 84,651 79,407 81,383 5,227 –21,451 –7,192 –17,813 –2,157 –2,273 Slovakia 4,310 3,425 6,639 6,696 425 –872 32 –930 3,247 –311 Slovenia 6,946 5,034 3,723 3,864 2,608 –1,776 –1,549 –177 –1,096 –59 Spain 323,510 279,468 256,426 252,356 51,965 –16,047 –10,820 –38,088 –13,663 –17,839 Sweden 172,556 138,487 139,577 150,283 39,463 –22,944 11,635 –20,997 3,660 3,991 Switzerland 1,618,558 1,155,544 1,062,897 1,090,043 327,991 –415,071 38,077 –190,050 –59,787 –19,310
(of which in CHF) 128,914 134,264 141,263 131,862 11,137 655 12,363 –26,043 15,566 –16,503 United Kingdom 4,751,832 3,976,647 3,726,586 3,838,615 896,014 –453,659 –29,891 –325,214 –149,931 –71,342
(of which in GBP) 762,077 584,062 515,915 539,706 269,574 8,652 323 85,817 –58,470 –50,248 Vatican 2,258 1,923 1,628 1,724 339 –416 –214 –394 –242 6 Other 1,044 2,706 2,147 3,159 100 106 211 99 –440 857
Amounts outstanding Estimated exchange rate adjusted changes
A 36 BIS Quarterly Review, December 2009

Vis-à-vis countries Dec 2007 Dec 2008 Mar 2009 Jun 2009 2007 2008 Q3 2008 Q4 2008 Q1 2009 Q2 2009
Loansii) Other 4,850,888 4,707,995 4,528,927 4,522,115 706,512 –198,957 220,262 –139,484 –128,450 –56,066
Australia 173,699 172,152 168,855 179,563 64,249 12,993 15,653 –23,027 870 6,797 Canada 272,062 264,102 261,038 261,632 71,857 –5,838 13,463 –3,588 946 –4,746 Japan 521,386 540,258 508,916 619,562 7,468 –39,032 –1,092 –31,580 –11,922 100,058
(of which in JPY) 215,849 239,688 169,523 219,380 59,733 –30,065 6,463 –32,164 –54,649 45,931 New Zealand 25,109 24,023 45,996 66,033 1,292 –568 2,234 –3,777 22,374 18,658 United States 3,858,629 3,707,466 3,544,119 3,395,326 561,642 –166,501 190,006 –77,506 –140,728 –176,828
(of which in USD) 3,221,533 3,215,003 3,081,552 2,913,823 408,385 –32,160 152,561 –13,408 –133,543 –167,318 Offshore centres 3,112,003 2,941,099 2,852,428 2,838,073 438,158 –155,863 –21,432 –124,526 –50,038 –65,914
Aruba 510 550 631 585 63 46 –34 –51 91 –56 Bahamas 241,605 293,442 240,568 206,268 17,878 51,953 –11,375 67,727 –51,733 –36,634 Bahrain 55,291 58,991 49,082 49,012 13,803 4,083 –3,659 3,126 –9,087 –818 Barbados 19,439 19,922 19,307 19,361 –351 2,281 3,539 –747 –366 –577 Bermuda 75,315 61,958 64,936 59,106 8,768 –12,483 3,873 –15,380 3,626 –6,632 Cayman Islands 1,334,585 1,157,710 1,247,512 1,249,579 93,860 –182,790 –40,765 –83,967 97,689 –6,417 Gibraltar 19,586 13,667 15,891 11,050 2,209 –3,013 1,077 –5,022 2,574 –6,039 Guernsey 155,069 159,892 142,779 133,019 36,802 15,244 4,328 3,836 –13,429 –16,579 Hong Kong SAR 239,164 266,975 250,950 253,786 39,043 22,316 8,972 –19,563 –10,891 –1,896 Isle of Man 36,100 32,708 31,665 35,943 9,347 468 –1,539 –1,597 –389 1,419 Jersey 337,817 222,060 204,787 204,681 67,727 –94,701 –20,758 –7,441 –14,184 –10,396 Lebanon 5,865 5,572 5,826 6,592 1,221 –1,065 –178 –586 371 621 Macao SAR 5,295 6,729 10,091 12,143 2,346 1,412 –167 –431 3,433 1,963 Mauritius 12,156 13,077 12,441 12,721 4,958 798 –2,108 –713 –496 115 Netherlands Antilles 16,555 21,141 22,449 21,517 4,168 4,554 1,354 2,243 1,519 –1,161 Panama 63,067 78,392 76,363 79,228 12,261 9,433 2,315 –1,429 931 1,601 Samoa 1,170 1,478 1,355 1,375 336 280 155 –134 –104 10 Singapore 385,180 416,936 356,176 381,592 100,643 19,814 17,263 –40,885 –51,055 18,285 Vanuatu 97 87 78 82 –135 –14 –4 –1 –6 1 West Indies UK 101,574 99,743 89,802 90,691 16,800 1,912 15,583 –24,278 –8,363 –2,522
Depositsii) Other 4,814,933 4,828,186 4,654,173 4,701,532 904,881 3,772 –112,701 –127,894 –123,763 –5,854
Australia 102,793 123,971 117,610 135,910 331 21,000 325 7,574 –4,365 15,293 Canada 139,533 167,400 158,552 161,561 34,453 26,870 1,933 –1,524 –6,760 –318 Japan 673,926 771,310 552,747 558,757 189,647 25,983 33,756 –27,924 –194,033 –6,962
(of which in JPY) 312,681 297,675 194,935 224,096 105,704 –92,917 –12,805 –82,079 –84,497 24,279 New Zealand 16,537 12,661 12,860 12,813 –257 –3,385 713 –1,252 395 –455 United States 3,882,140 3,752,833 3,812,397 3,832,489 680,705 –66,705 –149,368 –104,779 81,004 –13,407
(of which in USD) 3,354,256 3,241,249 3,320,651 3,306,488 603,763 –71,738 –128,128 –105,748 79,402 –14,720 Offshore centres 5,040,840 4,750,810 4,526,096 4,472,226 778,962 –172,740 –20,496 –58,992 –170,547 –161,903
Aruba 1,339 1,525 1,529 1,356 140 202 205 176 25 –198 Bahamas 422,240 492,122 454,202 397,843 38,553 72,529 11,077 51,554 –35,705 –59,665 Bahrain 43,239 34,851 31,019 31,195 3,429 –6,642 –2,439 –4,814 –3,274 –665 Barbados 32,068 20,436 25,544 26,972 1,881 –9,487 –2,579 –3,997 5,405 598 Bermuda 107,546 69,875 63,463 70,217 8,228 –39,125 –5,707 –25,639 –5,483 5,359 Cayman Islands 1,854,077 1,809,647 1,721,960 1,731,640 275,037 –43,376 –61,177 68,078 –73,086 –4,706 Gibraltar 25,356 18,451 19,054 11,533 825 –3,470 –774 –4,985 1,015 –8,577 Guernsey 187,064 188,573 183,369 181,943 16,651 21,569 9,548 –7,556 –2,382 –12,060 Hong Kong SAR 600,111 549,832 528,612 489,775 151,844 –47,563 49,559 –49,576 –11,826 –51,291 Isle of Man 91,489 76,928 79,055 88,186 8,017 –3,888 –11,520 3,047 –3,842 –152 Jersey 586,379 453,026 424,151 443,259 86,571 –73,900 –18,585 –44,300 –18,978 –9,732 Lebanon 33,509 35,372 36,134 39,010 636 1,480 2,125 –325 1,103 2,257 Macao SAR 25,578 25,104 28,933 29,793 3,381 125 3,826 –766 4,173 381 Mauritius 22,266 14,683 13,942 13,948 9,743 –6,870 –18,396 –2,574 –554 –383 Netherlands Antilles 155,486 143,286 132,148 123,842 15,481 –10,415 –4,309 –2,844 –6,453 –13,111 Panama 98,137 102,656 95,728 94,438 19,619 7,474 3,462 552 –4,925 –3,921 Samoa 4,854 6,257 7,568 8,709 1,178 1,454 765 389 1,364 1,024 Singapore 494,276 468,593 441,018 450,458 80,173 –19,179 22,761 –23,689 –19,890 –724 Vanuatu 912 519 487 499 242 –378 –129 –191 –22 –3 West Indies UK 250,017 230,336 229,086 228,828 52,661 –17,432 –453 –12,848 2,116 –5,572
Table 7A (cont.)
Amounts outstanding Estimated exchange rate adjusted changes
BIS Quarterly Review, December 2009 A 37

Vis-à-vis countries Dec 2007 Dec 2008 Mar 2009 Jun 2009 2007 2008 Q3 2008 Q4 2008 Q1 2009 Q2 2009
LoansDeveloping countries 1,883,956 2,006,109 1,865,786 1,895,614 514,198 109,131 45,495 –203,936 –101,667 –13,251
i) Africa & Middle East 417,008 432,080 419,187 423,725 132,513 18,435 9,993 –14,809 –6,347 –4,431 Algeria 2,366 1,958 1,803 1,719 –504 –352 –57 –53 –93 –150 Angola 3,091 7,229 7,180 7,371 –141 4,244 2,363 513 22 72 Benin 107 110 100 104 –17 –13 11 –19 –6 –2 Botswana 138 62 59 83 –81 –78 8 13 –2 21 Burkina Faso 336 343 335 380 –14 23 –9 –13 3 30 Burundi 45 58 42 46 – 13 –1 5 –12 2 Cameroon 1,838 1,385 1,165 1,198 –147 –556 –50 –107 –171 –26 Cape Verde 436 683 849 607 227 264 73 143 176 –264 Central African Republic 20 450 11 11 3 –3 – –5 –426 –1 Chad 120 92 90 85 15 –18 7 –6 – –7 Comoros Islands 24 11 10 12 16 –13 – 1 –1 1 Congo 374 308 260 262 –106 –59 –16 1 –37 –9 Congo Democratic Republic 416 492 500 516 11 95 36 6 24 –7 Côte d’Ivoire 3,906 3,810 3,684 3,931 –332 118 39 –47 28 36 Djibouti 63 158 174 180 8 97 13 10 19 2 Egypt 15,162 15,646 15,623 15,650 3,156 633 459 –621 232 –322 Equatorial Guinea 46 80 47 26 18 36 17 21 –32 –22 Eritrea 5 8 4 3 5 3 8 –2 –4 –1 Ethiopia 37 39 28 38 –3 –13 –4 –15 –10 9 Gabon 665 726 679 677 85 97 81 –64 –21 –36 Gambia 105 94 92 95 14 –9 8 –20 – 1 Ghana 2,356 2,324 2,210 1,943 402 –19 171 208 –80 –322 Guinea 386 266 254 267 12 –98 15 –85 – –1 Guinea-Bissau 7 4 7 14 1 –2 –5 –2 3 6 Iran 25,358 20,006 18,874 18,654 –1,109 –4,687 –1,023 –1,466 –402 –1,089 Iraq 1,581 1,539 1,636 1,808 177 20 294 –387 151 103 Israel 11,659 9,904 9,822 10,688 –1,384 –1,625 –804 –729 130 626 Jordan 2,316 3,421 3,695 4,039 499 391 275 –197 336 264 Kenya 1,692 1,508 1,401 1,382 680 –174 71 –43 –77 –73 Kuwait 34,834 34,517 30,281 26,567 14,094 79 4,128 –6,974 –3,835 –4,145 Lesotho 16 25 17 21 –9 8 –6 4 –7 3 Liberia 17,155 19,416 20,022 20,120 1,353 1,941 –205 186 846 –51
DepositsDeveloping countries 2,526,901 2,130,310 2,072,948 2,041,429 408,745 –338,714 123,880 –288,636 –29,781 –78,577
i) Africa & Middle East 866,337 778,348 709,824 709,979 141,617 –64,091 37,862 –73,052 –57,830 –19,480 Algeria 11,646 6,217 5,570 5,981 –224 –5,282 –3,979 –1,340 –493 216 Angola 9,256 18,403 13,168 11,654 1,287 9,318 5,683 –1,918 –5,162 –1,639 Benin 366 321 309 374 76 –53 34 –44 1 50 Botswana 2,451 1,572 971 1,337 352 –775 465 –619 –587 314 Burkina Faso 343 325 321 384 53 –2 –20 26 7 46 Burundi 345 203 197 205 58 –129 –8 –141 – 1 Cameroon 4,986 1,459 1,547 1,780 3,455 –2,906 1,769 –4,551 134 155 Cape Verde 1,636 1,218 1,421 1,330 502 –271 –73 –597 235 –146 Central African Republic 95 93 84 87 21 1 7 –5 –6 –2 Chad 340 203 261 230 138 –103 7 –182 62 –38 Comoros Islands 58 60 52 52 –8 4 –34 7 –6 –2 Congo 695 891 875 839 95 234 25 70 11 –74 Congo Democratic Republic 1,323 1,227 1,148 1,262 327 –60 34 –82 –53 77 Côte d’Ivoire 2,528 2,626 2,540 2,295 167 148 –686 507 16 –348 Djibouti 648 654 590 741 23 23 –37 23 –56 145 Egypt 40,505 30,197 25,882 28,667 –2,785 –9,006 –3,389 –1,848 –3,942 2,105 Equatorial Guinea 746 838 1,152 1,708 347 103 239 –239 332 523 Eritrea 53 51 53 48 –55 6 12 –6 3 –8 Ethiopia 927 603 580 601 112 –276 68 –124 –11 –2 Gabon 1,230 1,194 940 1,104 73 33 122 –303 –216 117 Gambia 237 181 188 190 42 –37 –12 –21 9 – Ghana 1,511 1,401 1,427 1,447 –267 –43 –67 –107 42 –15 Guinea 450 494 486 494 65 59 13 –13 3 –7 Guinea-Bissau 52 39 29 48 3 –10 13 –23 –7 17 Iran 35,111 41,099 39,394 37,955 1,093 9,436 6,585 –3,630 –31 –3,535 Iraq 1,911 3,071 3,858 3,862 6 1,353 44 184 789 –140 Israel 51,380 34,963 36,434 34,705 2,133 –15,426 –4,404 –8,642 1,826 –2,496 Jordan 16,983 13,289 12,267 10,813 150 –3,953 –536 –1,717 –890 –1,717 Kenya 9,555 8,614 8,380 8,985 1,648 610 1,022 –745 –86 –48 Kuwait 50,931 51,947 47,001 46,284 10,692 2,814 231 4,248 –4,337 –2,299 Lesotho 34 39 27 40 –20 7 –3 6 –11 16 Liberia 17,637 17,884 17,299 17,987 1,257 377 862 169 –380 394
Table 7A (cont.)
Amounts outstanding Estimated exchange rate adjusted changes
A 38 BIS Quarterly Review, December 2009

Vis-à-vis countries Dec 2007 Dec 2008 Mar 2009 Jun 2009 2007 2008 Q3 2008 Q4 2008 Q1 2009 Q2 2009
LoansLibya 824 1,057 1,095 1,427 446 192 –279 39 70 284 Madagascar 189 482 473 477 36 306 99 2 –3 –4 Malawi 72 113 52 57 –34 39 – 10 –61 4 Mali 289 249 232 238 –170 –37 5 –26 –6 –8 Mauritania 251 286 284 244 14 46 108 –49 3 –47 Morocco 5,333 5,673 5,501 5,892 67 639 –69 –341 44 100 Mozambique 489 540 547 559 34 65 66 –3 20 –6 Namibia 1,143 826 815 805 224 –196 33 –19 18 –76 Niger 157 142 117 79 71 –15 2 –14 –19 –41 Nigeria 6,447 10,269 7,075 7,395 1,445 4,062 2,256 –2,697 –3,135 234 Oman 9,135 10,353 9,784 9,765 2,344 1,131 729 22 –526 –69 Palestinian Territory 19 10 13 14 –54 –14 3 –4 2 1 Qatar 32,507 45,728 46,981 49,211 19,001 12,941 –469 11,528 1,395 1,913 Rwanda 18 9 16 10 8 –8 3 –4 7 –7 Sao Tomé and Principe 35 41 43 38 17 8 3 1 4 –7 Saudi Arabia 68,602 74,400 74,598 77,419 29,443 6,877 4,916 –943 1,750 539 Senegal 879 861 804 937 236 10 9 77 –24 89 Seychelles 991 1,070 1,102 1,229 192 65 41 –189 70 86 Sierra Leone 103 58 66 89 43 –42 –12 –4 10 19 Somalia 99 98 93 99 6 7 –7 –5 –1 – South Africa 30,084 28,908 27,037 25,087 5,420 –854 1,021 497 –1,284 –2,702 St. Helena 4 4 4 5 –1 1 – 1 – 1 Sudan 1,262 964 911 914 187 –299 –113 –38 –31 –23 Swaziland 100 40 43 47 42 –60 –115 3 4 2 Syria 728 903 815 858 136 49 –37 54 –72 27 Tanzania 410 454 346 344 65 –43 7 49 –99 –12 Togo 192 253 232 239 57 75 –22 6 –12 –6 Tunisia 3,967 3,799 3,337 3,469 19 143 137 253 –326 –38 Uganda 183 327 297 329 44 155 152 –55 –24 21 United Arab Emirates 88,494 97,737 94,546 94,600 34,568 10,383 12,511 –11,143 –2,190 –1,576 Yemen 377 1,010 1,102 1,096 100 641 63 138 98 –15 Zambia 382 841 770 838 208 449 106 35 –68 64 Zimbabwe 874 807 810 656 –44 –17 –54 –5 35 –196 Residual 35,709 17,096 18,292 20,762 21,423 –18,611 –17,003 –2,237 1,250 2,371
DepositsLibya 79,968 72,335 60,439 63,385 12,749 –5,655 7,910 –19,081 –10,905 1,655 Madagascar 1,477 1,006 1,122 1,387 326 –275 59 –448 146 215 Malawi 216 144 160 169 –56 –44 –22 –22 19 –4 Mali 430 371 377 385 35 –47 –7 25 19 –10 Mauritania 723 513 509 481 73 –190 –50 –104 5 –43 Morocco 12,993 9,392 9,063 8,174 –1,929 –2,980 1,421 –3,412 –8 –1,264 Mozambique 1,329 1,174 1,089 1,414 125 –57 –58 –169 –62 216 Namibia 538 453 407 492 184 –57 65 44 –31 60 Niger 122 133 165 160 –48 19 32 –31 36 –10 Nigeria 36,615 21,858 20,059 19,073 1,332 –13,981 153 –14,553 –1,481 –1,672 Oman 10,715 7,730 5,710 6,005 –167 –2,711 1,171 –2,895 –1,911 87 Palestinian Territory 761 1,063 1,232 1,184 –72 292 111 –65 181 –74 Qatar 17,834 17,074 16,569 17,486 4,951 –431 –291 710 –314 574 Rwanda 673 519 501 642 148 –151 145 –162 –14 127 Sao Tomé and Principe 72 104 88 81 –3 47 31 17 –13 –9 Saudi Arabia 162,759 180,395 159,011 150,907 55,484 16,162 26,671 –6,808 –19,553 –11,340 Senegal 1,694 1,699 1,423 1,451 151 –78 –256 96 –205 –49 Seychelles 3,305 4,559 4,740 4,788 1,036 983 237 51 273 –111 Sierra Leone 186 171 152 158 –15 –7 –31 15 –18 – Somalia 54 47 45 49 3 –4 3 –3 –1 2 South Africa 60,075 44,091 38,314 39,849 8,845 –13,264 –500 –2,679 –5,097 20 St. Helena 64 8 9 10 18 –54 16 –17 1 – Sudan 2,103 1,702 1,534 1,578 186 –188 –344 –314 –141 –34 Swaziland 747 1,220 696 677 251 502 265 295 –497 –47 Syria 25,323 23,573 20,856 19,322 290 –732 320 –949 –2,128 –2,309 Tanzania 2,730 1,801 1,459 1,516 284 –683 84 –301 –321 1 Togo 418 447 410 421 74 54 –29 12 –26 –9 Tunisia 8,432 5,039 4,174 4,294 1,206 –2,870 –871 –1,335 –731 –64 Uganda 1,744 1,732 1,376 1,709 339 260 371 –289 –324 237 United Arab Emirates 109,747 76,336 74,707 79,403 22,647 –29,251 –12,168 1,104 –791 2,575 Yemen 7,597 7,862 7,246 6,033 –235 582 553 –217 –532 –1,437 Zambia 1,070 876 877 1,008 75 –135 –104 –62 9 92 Zimbabwe 1,030 856 903 931 –11 –68 –60 –61 58 –31 Residual 46,824 50,689 49,951 51,868 12,531 4,723 9,047 212 –668 1,518
Table 7A (cont.)
Amounts outstanding Estimated exchange rate adjusted changes
BIS Quarterly Review, December 2009 A 39

Vis-à-vis countries Dec 2007 Dec 2008 Mar 2009 Jun 2009 2007 2008 Q3 2008 Q4 2008 Q1 2009 Q2 2009
Loansii) Asia & Pacific 608,265 586,111 523,821 535,207 126,407 –46,711 –12,884 –133,862 –52,011 2,878
Afghanistan 109 74 73 113 61 –34 47 –30 – 39 Armenia 173 260 232 235 59 87 42 71 –25 –1 Azerbaijan 1,831 3,218 3,065 3,099 572 1,423 578 –312 –96 –34 Bangladesh 1,603 1,909 1,645 1,620 –489 282 708 –855 –247 –45 Bhutan 63 60 57 60 –3 –1 – –3 –1 – British Overseas Territories 247 323 289 285 –1,242 112 –74 83 –28 –16 Brunei 719 763 548 935 107 50 405 –270 –197 365 Cambodia 314 244 247 263 39 –67 117 –254 5 13 China 130,510 113,597 100,547 104,006 27,157 –15,719 –16,926 –46,273 –11,399 1,867 Chinese Taipei 53,615 44,622 37,674 36,488 7,853 –9,482 –2,637 –14,747 –6,446 –1,552 Fiji 137 53 267 73 28 –81 –28 –55 215 –196 French Polynesia 1,460 1,934 1,933 2,061 40 584 26 47 86 12 Georgia 370 532 504 503 141 149 –74 29 –23 –13 India 90,834 113,546 107,731 104,417 31,278 18,903 2,908 –6,757 –3,417 –5,158 Indonesia 40,701 52,578 36,995 38,423 4,391 –2,892 619 –4,927 –14,174 502 Kazakhstan 15,807 15,969 15,303 14,152 2,176 255 –577 10 –506 –1,336 Kiribati 4 – – 1 –7 –4 2 –2 – 1 Kyrgyz Republic 35 53 44 43 5 19 29 –25 –8 –2 Laos 366 405 416 405 199 35 21 –44 14 –14 Malaysia 35,149 25,896 24,741 25,285 7,350 –10,192 –7,548 –9,104 –558 64 Maldives 593 720 657 623 202 137 93 –110 –55 –42 Marshall Islands 17,327 23,343 24,170 24,460 7,307 5,875 2,976 777 869 244 Micronesia 15 25 – – 14 10 –2 1 –25 –
Depositsii) Asia & Pacific 831,603 660,138 682,020 650,641 198,201 –160,175 34,027 –34,658 29,415 –43,046
Afghanistan 1,598 1,525 1,617 1,845 526 59 66 184 121 138 Armenia 708 283 273 310 –151 –342 –52 –283 – 24 Azerbaijan 2,885 1,189 708 713 1,092 –1,200 102 –2,060 –448 –9 Bangladesh 5,040 3,508 3,017 4,458 780 –854 168 –2,137 –477 1,362 Bhutan 405 393 383 354 325 –9 80 –79 –9 –31 British Overseas Territories 2,501 1,088 1,414 1,036 1,366 –1,238 –533 –136 358 –432 Brunei 3,674 4,347 4,999 3,832 1,138 851 –76 825 750 –1,343 Cambodia 493 458 475 445 110 –26 68 –24 20 –35 China 275,987 229,434 237,498 199,502 125,640 –46,395 50,033 –6,037 10,300 –41,346 Chinese Taipei 135,030 117,770 121,354 122,059 35,435 –16,677 2,919 –7,425 4,882 –997 Fiji 195 198 191 370 –31 9 –11 –14 –3 162 French Polynesia 1,130 1,363 1,249 1,278 64 279 –24 136 –70 –28 Georgia 1,064 1,351 1,058 966 427 363 –345 251 –270 –121 India 42,254 35,200 40,577 39,607 –37,787 –6,187 –2,766 8,180 5,678 –1,735 Indonesia 12,592 13,830 12,088 13,363 –28 1,386 –1,250 3,098 –1,635 1,107 Kazakhstan 11,984 13,104 12,755 12,019 6,456 1,045 1,751 –1,438 –165 –975 Kiribati 132 108 93 126 – 5 –6 25 –13 21 Kyrgyz Republic 254 261 261 373 –32 17 –28 20 8 98 Laos 1,262 167 328 329 564 –1,094 –146 –738 162 –8 Malaysia 46,146 18,434 23,381 18,987 17,080 –26,127 –6,729 –8,416 5,169 –4,915 Maldives 129 120 130 156 –5 –3 1 –10 12 22 Marshall Islands 6,594 7,396 7,992 7,887 2,045 839 721 –359 696 –258 Micronesia 17 36 17 18 –2 17 –9 –1 –18 1
Table 7A (cont.)
Amounts outstanding Estimated exchange rate adjusted changes
A 40 BIS Quarterly Review, December 2009

Vis-à-vis countries Dec 2007 Dec 2008 Mar 2009 Jun 2009 2007 2008 Q3 2008 Q4 2008 Q1 2009 Q2 2009
LoansMongolia 113 138 119 108 27 25 24 –18 –17 –13 Myanmar 1,242 1,353 1,274 1,096 23 175 100 12 –27 –241 Nauru 11 16 16 13 4 6 – 5 – –3 Nepal 65 57 51 54 –49 –7 –11 –13 –5 2 New Caledonia 2,720 3,433 3,230 3,334 378 939 135 –26 –53 –91 North Korea 115 62 66 65 –11 –49 –42 3 6 –4 Pakistan 4,693 4,635 4,140 4,559 788 –45 39 –219 –447 363 Palau 35 33 34 32 4 –2 – –1 1 –2 Papua New Guinea 117 202 185 239 –196 91 111 –9 –13 47 Philippines 17,755 14,026 13,063 12,632 1,891 –3,976 –1,366 –1,248 –668 –629 Solomon Islands 27 21 21 20 –4 –5 –9 – – –1 South Korea 153,806 123,655 110,854 123,093 32,973 –31,537 8,416 –48,143 –10,892 10,644 Sri Lanka 2,487 2,779 2,362 2,485 564 292 380 –543 –339 40 Tajikistan 114 30 39 21 18 –85 –15 –92 9 –18 Thailand 20,651 16,708 15,826 15,806 –1,791 –4,405 –1,234 –349 –510 –326 Timor Leste 10 9 9 9 1 1 6 –6 – –1 Tonga 14 10 13 23 1 –4 –1 –1 3 10 Turkmenistan 335 251 215 234 –101 –72 –32 –8 –26 7 Tuvalu – 1 1 11 –1 1 – – – 10 US Pacific Islands 1,205 646 614 590 782 –296 –94 239 –19 –40 Uzbekistan 696 737 704 827 –73 49 165 –61 –14 103 Vietnam 6,684 13,678 8,898 8,644 2,455 2,694 5 –327 –4,468 –451 Wallis/Futuna 25 22 19 20 –2 –2 3 –3 –2 – Residual 3,363 3,485 4,930 3,742 1,494 45 –169 –306 1,482 –1,223
DepositsMongolia 683 94 80 118 306 –591 –103 22 –12 34 Myanmar 360 505 865 1,144 19 158 66 65 372 236 Nauru 24 11 10 10 7 –10 –2 –16 –1 –1 Nepal 1,176 1,538 1,786 2,116 180 425 –27 299 281 272 New Caledonia 1,241 1,188 1,192 2,489 416 – –278 –78 42 1,237 North Korea 398 141 96 86 –24 46 –30 48 –42 –16 Pakistan 15,849 10,247 10,543 11,532 2,197 –4,967 –1,202 1,761 420 820 Palau 5 91 4 1 2 88 –3 82 –87 –3 Papua New Guinea 983 984 2,300 2,597 –81 52 –491 –44 1,329 230 Philippines 25,550 18,410 16,904 15,934 6,491 –6,984 –2,781 2,291 –1,404 –1,100 Solomon Islands 157 150 147 181 –23 5 –2 –33 1 26 South Korea 74,252 49,961 46,859 49,593 19,189 –23,882 –1,161 –1,336 –2,570 2,069 Sri Lanka 2,736 1,253 1,511 1,503 164 –1,327 –452 –947 295 –82 Tajikistan 189 100 78 60 45 –89 –135 –87 –20 –20 Thailand 38,350 23,624 21,703 22,843 3,154 –13,899 –3,064 –1,478 –1,584 700 Timor Leste 12 11 11 12 4 1 –2 2 – 1 Tonga 15 31 30 31 1 17 3 5 –1 – Turkmenistan 9,667 11,815 13,743 15,497 4,603 2,300 1,450 –299 2,000 1,666 Tuvalu 1 14 25 28 – 15 8 6 11 –1 US Pacific Islands 237 182 267 210 –131 –41 87 –12 87 –62 Uzbekistan 5,675 8,238 8,361 9,394 1,003 3,360 1,765 153 263 636 Vietnam 6,236 3,373 4,256 3,437 1,600 –2,585 9 –2,280 935 –887 Wallis/Futuna 140 40 48 56 – –94 18 4 10 6 Residual 95,593 76,574 79,343 81,736 4,070 –16,890 –3,578 –16,349 4,044 491
Table 7A (cont.)
Amounts outstanding Estimated exchange rate adjusted changes
BIS Quarterly Review, December 2009 A 41

Vis-à-vis countries Dec 2007 Dec 2008 Mar 2009 Jun 2009 2007 2008 Q3 2008 Q4 2008 Q1 2009 Q2 2009
Loansiii) Europe 576,984 681,851 635,168 650,580 184,678 114,445 36,595 –28,154 –27,303 –7,658
Albania 290 627 441 580 127 372 27 298 –155 108 Belarus 2,585 3,131 2,724 2,759 1,008 647 341 109 –339 –64 Bosnia and Herzegovina 3,494 3,987 4,144 4,219 882 668 –140 214 336 –167 Bulgaria 12,245 19,844 18,722 19,737 3,668 8,763 2,444 689 –286 –82 Croatia 28,986 33,820 32,563 35,223 4,278 4,884 –1,087 2,965 161 830 Czech Republic 31,859 31,317 27,846 29,874 7,517 1,667 –2,600 –1,576 –2,276 623 Estonia 13,092 14,245 12,609 12,948 4,295 1,785 –93 523 –1,022 –395 Hungary 44,305 64,120 63,045 64,736 10,955 19,433 3,154 2,719 1,504 –1,280 Latvia 19,356 21,571 19,099 19,592 7,018 3,222 853 217 –1,516 –643 Lithuania 15,307 18,797 17,414 17,971 5,652 4,463 1,611 481 –585 –464 Macedonia, FYR 302 467 423 468 116 102 35 5 –25 19 Moldova 406 553 513 514 147 173 59 49 –29 –11 Montenegro 907 1,385 1,328 1,394 663 549 134 56 4 –9 Poland 60,818 73,964 69,910 74,891 24,205 16,359 –491 –6,397 –914 1,537 Romania 43,954 59,512 55,743 56,980 18,347 16,676 3,803 2,689 –1,317 –1,797 Russia 149,151 160,902 147,724 146,743 61,993 9,367 13,048 –21,126 –11,259 –3,015 Serbia 7,229 9,111 8,316 8,930 1,243 1,107 786 156 –391 118 Turkey 112,989 127,461 118,489 120,381 22,550 17,726 11,859 –8,824 –6,671 –983 Ukraine 22,872 30,172 27,361 26,835 10,699 5,862 3,116 –1,795 –2,630 –776 Res. Serbia & Montenegro 38 82 70 96 –720 44 –5 73 –9 22 Residual Europe 6,799 6,783 6,684 5,709 132 578 –259 320 116 –1,227
Depositsiii) Europe 465,954 321,315 324,429 320,700 24,637 –126,190 42,987 –166,468 9,596 –15,441
Albania 1,326 485 439 453 286 –565 –53 –546 –35 –2 Belarus 4,759 2,997 3,432 2,556 3,247 –1,421 –95 –1,531 494 –939 Bosnia and Herzegovina 6,436 2,741 2,138 2,079 759 –3,549 –756 –635 –487 –170 Bulgaria 8,491 7,276 7,488 7,490 189 –1,194 –1,269 1,217 491 –407 Croatia 14,959 9,071 6,479 8,330 2,150 –5,177 –360 –2,186 –2,197 1,447 Czech Republic 20,421 19,998 18,628 20,612 212 2,121 –804 –2,898 –712 1,114 Estonia 3,316 2,901 2,250 2,488 1,380 –201 –130 12 –533 124 Hungary 11,175 11,456 18,857 17,846 1,216 587 5,798 –4,395 7,671 –1,951 Latvia 4,254 2,340 2,782 3,325 1,896 –1,587 –1,438 –1,025 486 421 Lithuania 3,390 1,729 2,485 2,400 859 –1,571 363 –570 798 –208 Macedonia, FYR 1,191 616 683 719 –548 –498 13 –290 86 3 Moldova 842 900 655 663 245 12 –97 111 –227 –26 Montenegro 760 215 241 210 434 –479 99 –455 35 –43 Poland 44,959 21,248 15,882 20,062 4,792 –20,920 –9,768 –23,855 –4,775 3,496 Romania 8,619 3,920 4,085 4,115 1,464 –4,631 –1,201 –1,191 284 –150 Russia 231,229 130,131 145,149 128,305 –1,137 –92,821 51,523 –129,089 16,824 –21,665 Serbia 6,570 3,190 2,295 2,379 3,825 –3,447 –382 –1,342 –767 –45 Turkey 61,007 64,770 62,025 64,901 4,185 5,624 2,919 –2,170 –1,517 1,253 Ukraine 20,629 19,860 16,543 18,690 3,666 –1,321 –1,419 –703 –3,009 1,628 Res. Serbia & Montenegro 846 231 232 355 –3,680 –615 –88 52 2 121 Residual Europe 10,773 15,240 11,661 12,722 897 5,465 132 5,019 –3,316 558
Table 7A (cont.)
Amounts outstanding Estimated exchange rate adjusted changes
A 42 BIS Quarterly Review, December 2009

Vis-à-vis countries Dec 2007 Dec 2008 Mar 2009 Jun 2009 2007 2008 Q3 2008 Q4 2008 Q1 2009 Q2 2009
Loansiv) Latin America/Caribbean 281,699 306,067 287,610 286,102 70,602 22,962 11,790 –27,110 –16,005 –4,041
Argentina 14,937 15,499 13,984 13,491 3,992 872 542 –1,315 –1,381 –623 Belize 1,849 2,388 2,259 2,324 389 373 445 –21 –78 –5 Bolivia 455 324 301 293 60 –130 125 –313 –21 –10 Brazil 94,923 103,965 92,013 95,796 28,520 7,685 1,430 –12,261 –11,237 3,263 Chile 28,590 33,797 34,545 34,773 6,261 4,917 1,826 –2,360 1,097 –118 Colombia 11,680 10,069 8,675 8,223 3,610 –1,559 –507 –1,495 –1,337 –519 Costa Rica 5,221 6,078 5,505 5,031 1,230 859 –268 –69 –566 –484 Cuba 2,815 1,834 1,683 1,659 253 –870 145 –202 –83 –111 Dominica 92 120 70 65 27 30 43 12 –48 –5 Dominican Republic 3,451 3,334 3,320 3,313 937 –71 –6 86 21 –56 Ecuador 2,858 2,126 2,121 2,100 779 –743 105 –338 3 –27 El Salvador 2,085 2,250 2,051 1,860 –101 178 231 –23 –194 –198 Falkland Islands 61 37 37 40 34 –21 –3 –3 1 – Grenada 87 59 56 60 51 –26 6 7 –3 4 Guatemala 3,699 4,214 3,834 3,867 740 517 61 –15 –373 26 Guyana 115 870 1,135 809 9 810 –368 –111 278 –339 Haiti 193 251 208 205 –47 61 5 7 –41 –6 Honduras 1,338 1,368 1,324 1,192 261 13 –33 –83 –40 –138 Jamaica 1,924 1,852 1,450 1,442 253 45 –21 –163 –380 –42 Mexico 65,852 73,575 73,761 69,437 14,707 7,235 4,475 –3,326 639 –4,885 Nicaragua 571 644 608 611 –15 75 –4 –2 –34 1 Paraguay 936 907 860 773 75 –33 25 –79 –39 –93 Peru 10,076 13,487 12,484 11,988 4,434 3,429 1,424 –1,414 –928 –590 St. Lucia 368 579 599 424 108 155 5 41 26 –181 St. Vincent 1,117 1,191 1,139 1,218 440 55 55 –95 4 30 Surinam 33 28 62 33 17 –3 7 –6 35 –31 Trinidad and Tobago 2,924 5,601 5,579 5,799 –18 2,809 2,485 20 51 104 Turks and Caicos 529 500 456 427 –169 40 –5 119 –40 –48 Uruguay 2,292 2,292 2,206 2,351 573 48 –390 –549 –61 121 Venezuela 8,112 6,328 5,648 6,033 –405 –1,735 285 –1,142 –587 276 Residual 12,516 10,500 9,637 10,465 3,602 –2,056 –330 –2,018 –691 643
Int. organisations 50,381 41,118 45,556 50,278 9,880 –7,380 –3,397 –1,748 5,963 3,101 Unallocated 287,531 287,115 275,679 262,764 52,786 95,659 11,293 44,482 –3,008 –26,834
Depositsiv) Latin America/Caribbean 363,007 370,509 356,675 360,109 44,290 11,743 9,004 –14,457 –10,962 –610
Argentina 28,415 27,787 28,408 28,824 3,691 –427 252 –1,109 788 182 Belize 7,766 9,518 9,240 9,537 1,561 1,474 320 269 –94 28 Bolivia 3,270 3,097 2,719 2,464 776 –29 180 468 –354 –276 Brazil 59,023 52,762 53,273 45,457 6,385 –5,842 –5,679 531 919 –8,347 Chile 26,368 21,904 23,345 20,552 3,782 –3,599 2,019 –5,284 1,699 –3,121 Colombia 14,259 12,316 12,874 14,203 1,146 –1,760 –920 –1,055 600 1,268 Costa Rica 6,045 5,720 5,639 5,369 321 –82 180 –912 –39 –338 Cuba 1,836 2,849 2,667 3,387 213 1,226 722 –190 –76 557 Dominica 181 218 204 231 1 24 –11 –12 –10 17 Dominican Republic 7,463 6,430 5,514 5,203 527 –994 –9 –505 –886 –343 Ecuador 5,309 6,056 6,263 6,047 434 789 42 –83 222 –235 El Salvador 1,997 2,268 2,349 2,318 43 329 –130 155 85 –38 Falkland Islands 130 116 117 138 6 23 –4 2 3 4 Grenada 90 183 220 180 24 97 26 43 42 –50 Guatemala 3,704 3,590 4,273 4,053 539 –105 –108 –373 693 –232 Guyana 604 531 444 378 –15 –57 –147 131 –86 –74 Haiti 651 646 738 572 61 –2 67 –222 93 –168 Honduras 3,914 3,081 3,155 3,283 –118 –827 –390 –322 80 120 Jamaica 2,728 2,176 2,037 1,972 278 –479 –296 –488 –128 –104 Mexico 74,518 87,085 73,738 82,016 11,535 13,020 10,058 8,070 –12,771 7,477 Nicaragua 713 1,008 1,239 1,464 58 295 172 –48 234 221 Paraguay 1,636 1,759 1,798 1,995 51 144 –41 85 52 181 Peru 14,767 8,731 9,595 8,585 1,891 –5,887 –3,095 –4,904 908 –1,066 St. Lucia 342 409 393 492 29 72 –49 181 –10 87 St. Vincent 3,043 3,431 3,199 3,024 –1,033 539 392 –173 –151 –296 Surinam 901 1,092 1,162 1,212 65 229 58 70 95 13 Trinidad and Tobago 7,887 9,012 9,166 9,582 1,939 989 77 –281 203 305 Turks and Caicos 1,409 1,872 1,879 2,214 –257 596 573 –822 35 268 Uruguay 12,959 12,552 12,195 12,076 1,572 –321 274 411 –264 –225 Venezuela 52,648 58,860 55,637 57,391 5,740 7,013 4,640 –13,042 –2,870 1,316 Residual 18,431 23,450 23,195 25,890 3,047 5,300 –168 4,953 23 2,258
Int. organisations 241,612 210,055 214,567 224,813 9,028 –13,939 1,595 –20,446 10,235 –891 Unallocated 401,947 182,327 177,979 176,403 136,320 –104,562 56,545 –126,868 –2,710 –7,919
Table 7A (cont.)
Amounts outstanding Estimated exchange rate adjusted changes
BIS Quarterly Review, December 2009 A 43

Vis-à-vis countries Dec 2007 Dec 2008 Mar 2009 Jun 2009 2007 2008 Q3 2008 Q4 2008 Q1 2009 Q2 2009
LoansAll countries 6,442,267 6,167,903 5,914,474 6,033,398 1,119,735 –94,732 152,050 –579,285 –123,883 –68,599 Developed Countries 4,626,384 4,304,740 4,090,100 4,227,218 750,423 –177,197 81,218 –454,698 –117,766 –6,189
i) Europe 2,716,266 2,701,848 2,526,595 2,654,658 481,917 139,884 –69,491 –42,241 –93,013 1,484 Austria 31,019 32,298 28,175 29,806 379 3,081 2,857 –1,257 –2,889 151 Andorra 1,708 1,619 1,566 1,723 285 –1 30 –4 16 59 Belgium 77,088 102,122 92,791 94,630 11,878 28,242 2,194 16,355 –6,090 –2,176 Cyprus 28,418 29,067 28,484 28,331 10,575 1,444 –5,034 –5,183 –182 –734 Denmark 41,360 59,617 54,057 59,487 –2,872 20,541 3,371 3,607 –3,203 2,590 Finland 21,003 25,217 24,428 24,252 4,860 4,995 60 1,091 181 –1,523 France 253,267 288,686 276,050 286,359 26,758 45,324 21,174 –27,997 –2,476 –3,455 Germany 248,890 266,228 274,229 283,751 22,509 21,202 –12,889 9,315 18,934 –5,247 Greece 24,685 27,918 26,589 27,193 –4,159 5,537 7,026 –2,020 –446 –502 Iceland 7,473 6,497 5,551 5,563 2,913 –661 167 –406 –691 –286 Ireland 232,001 223,355 213,678 239,284 78,368 8,095 –15,495 –5,419 –4,038 14,986 Italy 59,689 49,973 44,254 46,527 11,638 1,726 11,413 –4,864 –3,719 –77 Liechtenstein 6,791 5,845 5,107 5,154 –601 –838 –475 –339 –450 –220 Luxembourg 199,330 213,095 190,951 200,533 79,623 32,934 17,946 –4,649 –15,329 81 Malta 7,046 10,144 9,378 9,222 845 2,947 –577 779 –587 –372 Netherlands 293,676 319,396 303,766 298,764 70,883 37,324 –6,636 14,824 –5,812 –18,308 Norway 38,308 34,802 35,569 32,866 5,668 –2,810 –3,113 –28 1,229 –3,869 Portugal 26,556 23,286 22,855 25,005 2,103 –2,104 –1,268 –879 503 785 Slovakia 5,438 7,464 6,586 7,228 1,952 2,332 1,473 –92 –585 237 Slovenia 8,968 11,338 11,008 11,418 2,190 1,907 79 985 166 –244 Spain 106,759 112,337 109,709 113,445 16,034 12,293 10,409 –7,053 1,762 –2,560 Sweden 63,221 56,447 51,019 60,341 4,444 –4,391 –5,693 428 –3,706 6,955 Switzerland 146,150 145,829 140,941 146,540 28,289 –767 5,890 –13,408 334 347
(of which in CHF) 48,842 50,366 45,467 44,322 5,499 –2,224 1,128 421 –1,570 –3,485 United Kingdom 786,907 648,575 569,040 616,381 107,307 –78,485 –102,324 –16,029 –66,084 14,874
(of which in GBP) 147,584 135,999 129,804 135,435 25,405 30,455 –19,233 37,818 –3,965 –13,326 Vatican 1 1 41 – –1 – – – 39 –42 Other 514 692 773 855 46 23 –75 5 112 35
DepositsAll Countries 7,456,430 6,937,713 6,473,657 6,546,339 1,228,715 –311,829 –181,411 –480,486 –343,322 –92,671 Developed Countries 4,958,363 4,588,984 4,184,537 4,290,632 837,408 –229,802 –233,581 –323,554 –317,720 –40,547
i) Europe 2,948,492 2,569,428 2,347,396 2,451,867 398,177 –248,794 –161,647 –238,237 –152,483 –15,485 Austria 20,686 26,002 24,230 22,719 1,708 3,379 –2,256 2,668 –749 –2,697 Andorra 1,786 1,374 1,224 1,419 34 –321 –85 50 –95 113 Belgium 77,800 70,469 65,471 80,913 9,549 –1,871 –52 –5,187 –2,815 11,291 Cyprus 20,427 19,147 19,105 18,521 4,570 –497 837 –2,665 321 –1,249 Denmark 10,214 7,982 7,331 7,992 2,054 –1,273 –694 –1,289 –394 77 Finland 10,910 5,777 10,434 7,454 –2,357 –4,317 –20,064 850 4,594 –3,466 France 171,046 169,889 159,046 182,972 28,146 7,815 –14,694 –18,989 –6,325 15,845 Germany 324,136 303,731 303,450 324,106 6,920 –1,994 –3,734 –14,947 11,631 3,316 Greece 16,328 12,543 12,224 11,981 –1,622 –3,759 –693 –1,703 –14 –711 Iceland 2,495 911 687 772 1,192 –1,369 –1,093 –425 –204 48 Ireland 196,576 224,151 211,510 216,157 43,379 40,325 5,857 5,941 –7,095 –7,659 Italy 58,852 58,460 57,602 58,617 –3,550 2,120 3,495 1,293 1,416 –2,207 Liechtenstein 9,008 7,407 6,430 6,813 363 –1,260 –614 –463 –711 83 Luxembourg 219,764 205,754 170,102 163,572 67,191 –4,620 –6,705 2,553 –28,981 –14,064 Malta 10,785 11,400 11,556 12,008 768 1,146 –58 731 553 –192 Netherlands 292,906 259,806 253,167 274,651 77,661 –20,043 –20,393 –10,452 1,491 6,892 Norway 21,263 12,559 13,937 13,888 574 –8,346 –2,055 –4,182 1,493 –591 Portugal 22,885 18,598 15,624 16,491 4,935 –3,130 –1,364 –1,323 –2,368 6 Slovakia 1,102 1,191 1,326 1,237 –287 129 70 –51 167 –158 Slovenia 1,214 1,311 1,120 1,053 154 –25 9 –154 –135 –128 Spain 50,035 46,937 42,970 40,663 412 –2,081 –726 –5,064 –2,221 –4,658 Sweden 33,572 25,241 22,624 23,351 5,508 –6,874 –2,841 –2,133 –1,967 –452 Switzerland 267,548 226,437 206,201 208,643 42,741 –22,436 19,731 –22,618 –14,222 –5,954
(of which in CHF) 28,512 23,052 22,861 21,411 –1,358 –5,628 1,273 –2,262 1,301 –2,595 United Kingdom 1,105,781 850,707 728,867 754,590 108,343 –219,558 –113,344 –160,870 –105,442 –9,026
(of which in GBP) 106,645 94,823 84,055 87,862 6,111 19,945 12,164 3,887 –9,198 –8,651 Vatican 726 802 637 735 –260 –76 –136 –164 –131 60 Other 647 842 521 549 52 138 –45 354 –280 –2
Table 7B: External loans and deposits of reporting banks vis-à-vis the non-bank sectorVis-à-vis individual countriesin millions of US dollars
Amounts outstanding Estimated exchange rate adjusted changes
A 44 BIS Quarterly Review, December 2009
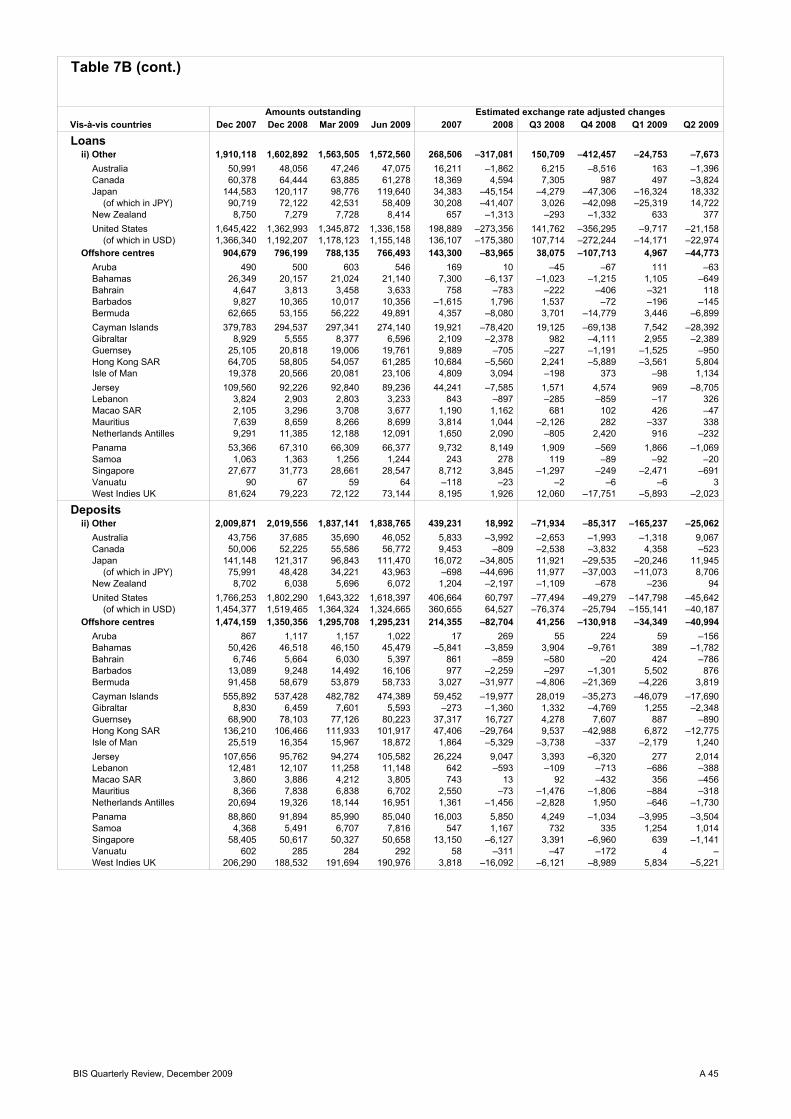
Vis-à-vis countries Dec 2007 Dec 2008 Mar 2009 Jun 2009 2007 2008 Q3 2008 Q4 2008 Q1 2009 Q2 2009
Loansii) Other 1,910,118 1,602,892 1,563,505 1,572,560 268,506 –317,081 150,709 –412,457 –24,753 –7,673
Australia 50,991 48,056 47,246 47,075 16,211 –1,862 6,215 –8,516 163 –1,396 Canada 60,378 64,444 63,885 61,278 18,369 4,594 7,305 987 497 –3,824 Japan 144,583 120,117 98,776 119,640 34,383 –45,154 –4,279 –47,306 –16,324 18,332
(of which in JPY) 90,719 72,122 42,531 58,409 30,208 –41,407 3,026 –42,098 –25,319 14,722 New Zealand 8,750 7,279 7,728 8,414 657 –1,313 –293 –1,332 633 377 United States 1,645,422 1,362,993 1,345,872 1,336,158 198,889 –273,356 141,762 –356,295 –9,717 –21,158
(of which in USD) 1,366,340 1,192,207 1,178,123 1,155,148 136,107 –175,380 107,714 –272,244 –14,171 –22,974 Offshore centres 904,679 796,199 788,135 766,493 143,300 –83,965 38,075 –107,713 4,967 –44,773
Aruba 490 500 603 546 169 10 –45 –67 111 –63 Bahamas 26,349 20,157 21,024 21,140 7,300 –6,137 –1,023 –1,215 1,105 –649 Bahrain 4,647 3,813 3,458 3,633 758 –783 –222 –406 –321 118 Barbados 9,827 10,365 10,017 10,356 –1,615 1,796 1,537 –72 –196 –145 Bermuda 62,665 53,155 56,222 49,891 4,357 –8,080 3,701 –14,779 3,446 –6,899 Cayman Islands 379,783 294,537 297,341 274,140 19,921 –78,420 19,125 –69,138 7,542 –28,392 Gibraltar 8,929 5,555 8,377 6,596 2,109 –2,378 982 –4,111 2,955 –2,389 Guernsey 25,105 20,818 19,006 19,761 9,889 –705 –227 –1,191 –1,525 –950 Hong Kong SAR 64,705 58,805 54,057 61,285 10,684 –5,560 2,241 –5,889 –3,561 5,804 Isle of Man 19,378 20,566 20,081 23,106 4,809 3,094 –198 373 –98 1,134 Jersey 109,560 92,226 92,840 89,236 44,241 –7,585 1,571 4,574 969 –8,705 Lebanon 3,824 2,903 2,803 3,233 843 –897 –285 –859 –17 326 Macao SAR 2,105 3,296 3,708 3,677 1,190 1,162 681 102 426 –47 Mauritius 7,639 8,659 8,266 8,699 3,814 1,044 –2,126 282 –337 338 Netherlands Antilles 9,291 11,385 12,188 12,091 1,650 2,090 –805 2,420 916 –232 Panama 53,366 67,310 66,309 66,377 9,732 8,149 1,909 –569 1,866 –1,069 Samoa 1,063 1,363 1,256 1,244 243 278 119 –89 –92 –20 Singapore 27,677 31,773 28,661 28,547 8,712 3,845 –1,297 –249 –2,471 –691 Vanuatu 90 67 59 64 –118 –23 –2 –6 –6 3 West Indies UK 81,624 79,223 72,122 73,144 8,195 1,926 12,060 –17,751 –5,893 –2,023
Depositsii) Other 2,009,871 2,019,556 1,837,141 1,838,765 439,231 18,992 –71,934 –85,317 –165,237 –25,062
Australia 43,756 37,685 35,690 46,052 5,833 –3,992 –2,653 –1,993 –1,318 9,067 Canada 50,006 52,225 55,586 56,772 9,453 –809 –2,538 –3,832 4,358 –523 Japan 141,148 121,317 96,843 111,470 16,072 –34,805 11,921 –29,535 –20,246 11,945
(of which in JPY) 75,991 48,428 34,221 43,963 –698 –44,696 11,977 –37,003 –11,073 8,706 New Zealand 8,702 6,038 5,696 6,072 1,204 –2,197 –1,109 –678 –236 94 United States 1,766,253 1,802,290 1,643,322 1,618,397 406,664 60,797 –77,494 –49,279 –147,798 –45,642
(of which in USD) 1,454,377 1,519,465 1,364,324 1,324,665 360,655 64,527 –76,374 –25,794 –155,141 –40,187 Offshore centres 1,474,159 1,350,356 1,295,708 1,295,231 214,355 –82,704 41,256 –130,918 –34,349 –40,994
Aruba 867 1,117 1,157 1,022 17 269 55 224 59 –156 Bahamas 50,426 46,518 46,150 45,479 –5,841 –3,859 3,904 –9,761 389 –1,782 Bahrain 6,746 5,664 6,030 5,397 861 –859 –580 –20 424 –786 Barbados 13,089 9,248 14,492 16,106 977 –2,259 –297 –1,301 5,502 876 Bermuda 91,458 58,679 53,879 58,733 3,027 –31,977 –4,806 –21,369 –4,226 3,819 Cayman Islands 555,892 537,428 482,782 474,389 59,452 –19,977 28,019 –35,273 –46,079 –17,690 Gibraltar 8,830 6,459 7,601 5,593 –273 –1,360 1,332 –4,769 1,255 –2,348 Guernsey 68,900 78,103 77,126 80,223 37,317 16,727 4,278 7,607 887 –890 Hong Kong SAR 136,210 106,466 111,933 101,917 47,406 –29,764 9,537 –42,988 6,872 –12,775 Isle of Man 25,519 16,354 15,967 18,872 1,864 –5,329 –3,738 –337 –2,179 1,240 Jersey 107,656 95,762 94,274 105,582 26,224 9,047 3,393 –6,320 277 2,014 Lebanon 12,481 12,107 11,258 11,148 642 –593 –109 –713 –686 –388 Macao SAR 3,860 3,886 4,212 3,805 743 13 92 –432 356 –456 Mauritius 8,366 7,838 6,838 6,702 2,550 –73 –1,476 –1,806 –884 –318 Netherlands Antilles 20,694 19,326 18,144 16,951 1,361 –1,456 –2,828 1,950 –646 –1,730 Panama 88,860 91,894 85,990 85,040 16,003 5,850 4,249 –1,034 –3,995 –3,504 Samoa 4,368 5,491 6,707 7,816 547 1,167 732 335 1,254 1,014 Singapore 58,405 50,617 50,327 50,658 13,150 –6,127 3,391 –6,960 639 –1,141 Vanuatu 602 285 284 292 58 –311 –47 –172 4 – West Indies UK 206,290 188,532 191,694 190,976 3,818 –16,092 –6,121 –8,989 5,834 –5,221
Table 7B (cont.)
Amounts outstanding Estimated exchange rate adjusted changes
BIS Quarterly Review, December 2009 A 45
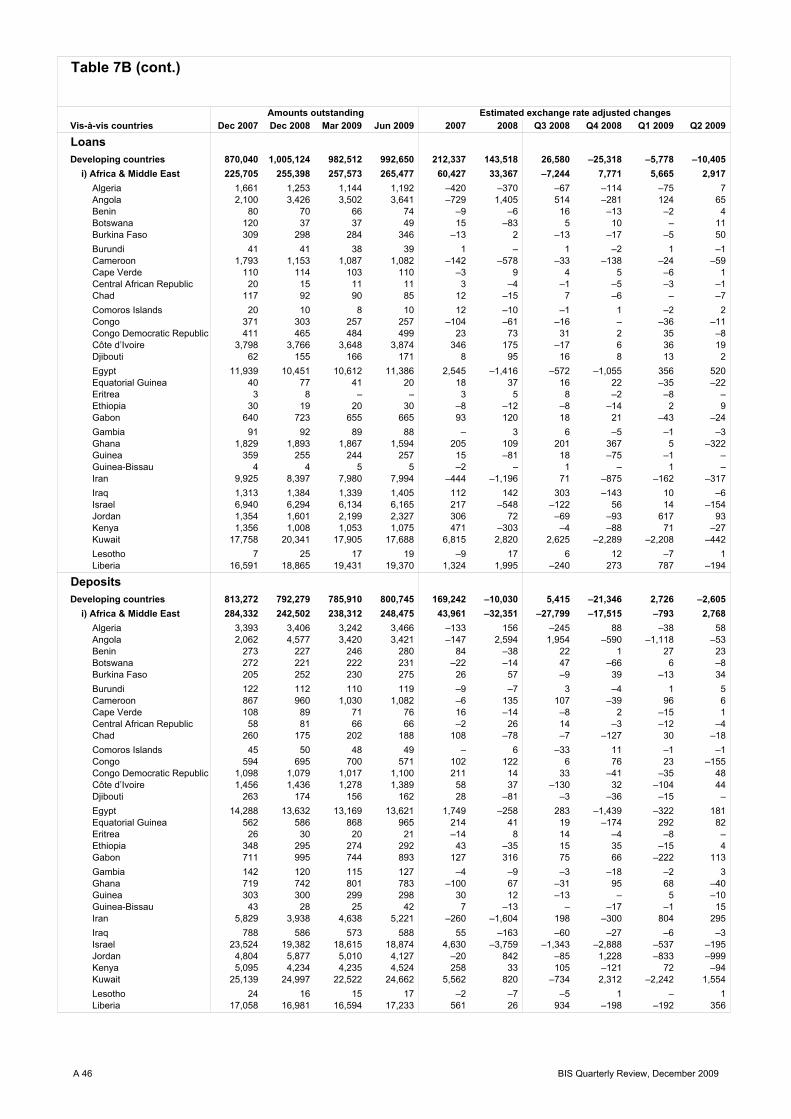
Vis-à-vis countries Dec 2007 Dec 2008 Mar 2009 Jun 2009 2007 2008 Q3 2008 Q4 2008 Q1 2009 Q2 2009
LoansDeveloping countries 870,040 1,005,124 982,512 992,650 212,337 143,518 26,580 –25,318 –5,778 –10,405
i) Africa & Middle East 225,705 255,398 257,573 265,477 60,427 33,367 –7,244 7,771 5,665 2,917 Algeria 1,661 1,253 1,144 1,192 –420 –370 –67 –114 –75 7 Angola 2,100 3,426 3,502 3,641 –729 1,405 514 –281 124 65 Benin 80 70 66 74 –9 –6 16 –13 –2 4 Botswana 120 37 37 49 15 –83 5 10 – 11 Burkina Faso 309 298 284 346 –13 2 –13 –17 –5 50 Burundi 41 41 38 39 1 – 1 –2 1 –1 Cameroon 1,793 1,153 1,087 1,082 –142 –578 –33 –138 –24 –59 Cape Verde 110 114 103 110 –3 9 4 5 –6 1 Central African Republic 20 15 11 11 3 –4 –1 –5 –3 –1 Chad 117 92 90 85 12 –15 7 –6 – –7 Comoros Islands 20 10 8 10 12 –10 –1 1 –2 2 Congo 371 303 257 257 –104 –61 –16 – –36 –11 Congo Democratic Republic 411 465 484 499 23 73 31 2 35 –8 Côte d’Ivoire 3,798 3,766 3,648 3,874 346 175 –17 6 36 19 Djibouti 62 155 166 171 8 95 16 8 13 2 Egypt 11,939 10,451 10,612 11,386 2,545 –1,416 –572 –1,055 356 520 Equatorial Guinea 40 77 41 20 18 37 16 22 –35 –22 Eritrea 3 8 – – 3 5 8 –2 –8 – Ethiopia 30 19 20 30 –8 –12 –8 –14 2 9 Gabon 640 723 655 665 93 120 18 21 –43 –24 Gambia 91 92 89 88 – 3 6 –5 –1 –3 Ghana 1,829 1,893 1,867 1,594 205 109 201 367 5 –322 Guinea 359 255 244 257 15 –81 18 –75 –1 – Guinea-Bissau 4 4 5 5 –2 – 1 – 1 – Iran 9,925 8,397 7,980 7,994 –444 –1,196 71 –875 –162 –317 Iraq 1,313 1,384 1,339 1,405 112 142 303 –143 10 –6 Israel 6,940 6,294 6,134 6,165 217 –548 –122 56 14 –154 Jordan 1,354 1,601 2,199 2,327 306 72 –69 –93 617 93 Kenya 1,356 1,008 1,053 1,075 471 –303 –4 –88 71 –27 Kuwait 17,758 20,341 17,905 17,688 6,815 2,820 2,625 –2,289 –2,208 –442 Lesotho 7 25 17 19 –9 17 6 12 –7 1 Liberia 16,591 18,865 19,431 19,370 1,324 1,995 –240 273 787 –194
DepositsDeveloping countries 813,272 792,279 785,910 800,745 169,242 –10,030 5,415 –21,346 2,726 –2,605
i) Africa & Middle East 284,332 242,502 238,312 248,475 43,961 –32,351 –27,799 –17,515 –793 2,768 Algeria 3,393 3,406 3,242 3,466 –133 156 –245 88 –38 58 Angola 2,062 4,577 3,420 3,421 –147 2,594 1,954 –590 –1,118 –53 Benin 273 227 246 280 84 –38 22 1 27 23 Botswana 272 221 222 231 –22 –14 47 –66 6 –8 Burkina Faso 205 252 230 275 26 57 –9 39 –13 34 Burundi 122 112 110 119 –9 –7 3 –4 1 5 Cameroon 867 960 1,030 1,082 –6 135 107 –39 96 6 Cape Verde 108 89 71 76 16 –14 –8 2 –15 1 Central African Republic 58 81 66 66 –2 26 14 –3 –12 –4 Chad 260 175 202 188 108 –78 –7 –127 30 –18 Comoros Islands 45 50 48 49 – 6 –33 11 –1 –1 Congo 594 695 700 571 102 122 6 76 23 –155 Congo Democratic Republic 1,098 1,079 1,017 1,100 211 14 33 –41 –35 48 Côte d’Ivoire 1,456 1,436 1,278 1,389 58 37 –130 32 –104 44 Djibouti 263 174 156 162 28 –81 –3 –36 –15 – Egypt 14,288 13,632 13,169 13,621 1,749 –258 283 –1,439 –322 181 Equatorial Guinea 562 586 868 965 214 41 19 –174 292 82 Eritrea 26 30 20 21 –14 8 14 –4 –8 – Ethiopia 348 295 274 292 43 –35 15 35 –15 4 Gabon 711 995 744 893 127 316 75 66 –222 113 Gambia 142 120 115 127 –4 –9 –3 –18 –2 3 Ghana 719 742 801 783 –100 67 –31 95 68 –40 Guinea 303 300 299 298 30 12 –13 – 5 –10 Guinea-Bissau 43 28 25 42 7 –13 – –17 –1 15 Iran 5,829 3,938 4,638 5,221 –260 –1,604 198 –300 804 295 Iraq 788 586 573 588 55 –163 –60 –27 –6 –3 Israel 23,524 19,382 18,615 18,874 4,630 –3,759 –1,343 –2,888 –537 –195 Jordan 4,804 5,877 5,010 4,127 –20 842 –85 1,228 –833 –999 Kenya 5,095 4,234 4,235 4,524 258 33 105 –121 72 –94 Kuwait 25,139 24,997 22,522 24,662 5,562 820 –734 2,312 –2,242 1,554 Lesotho 24 16 15 17 –2 –7 –5 1 – 1 Liberia 17,058 16,981 16,594 17,233 561 26 934 –198 –192 356
Table 7B (cont.)
Amounts outstanding Estimated exchange rate adjusted changes
A 46 BIS Quarterly Review, December 2009

Vis-à-vis countries Dec 2007 Dec 2008 Mar 2009 Jun 2009 2007 2008 Q3 2008 Q4 2008 Q1 2009 Q2 2009
LoansLibya 539 727 822 1,184 358 225 –357 86 120 322 Madagascar 150 450 448 451 24 313 95 4 2 –5 Malawi 39 87 37 50 –31 52 18 11 –50 12 Mali 250 217 197 199 –77 –23 –4 –17 –10 –9 Mauritania 148 136 136 135 –12 –6 6 –11 4 –7 Morocco 4,144 4,403 4,360 4,530 352 524 35 –195 137 –73 Mozambique 457 503 498 506 22 60 54 2 7 –8 Namibia 1,094 779 763 754 381 –195 5 12 13 –75 Niger 126 115 110 62 44 –7 –3 –14 –1 –51 Nigeria 3,967 4,671 4,474 4,319 330 990 –402 –155 –163 –217 Oman 7,397 7,923 7,758 7,733 1,971 533 348 36 –155 –43 Palestinian Territory 16 8 9 10 –51 –13 – –1 1 1 Qatar 20,324 32,255 34,961 36,531 10,750 11,723 246 8,841 2,750 1,382 Rwanda 10 8 8 9 – –2 –2 2 – – Sao Tomé and Principe 35 41 36 38 17 8 3 1 –3 – Saudi Arabia 30,026 37,129 36,478 38,111 12,376 7,356 3,276 1,295 –137 994 Senegal 802 807 743 875 198 28 6 96 –32 91 Seychelles 880 974 1,015 1,139 143 81 23 –180 77 86 Sierra Leone 101 57 62 82 49 –41 –14 –2 7 16 Somalia 99 98 93 99 6 7 –7 –5 –1 – South Africa 12,233 9,673 10,516 9,599 1,539 –2,368 251 –352 1,076 –1,281 St. Helena 4 4 4 5 1 1 – 1 – 1 Sudan 506 599 557 544 125 96 125 –44 –25 –32 Swaziland 44 23 31 27 –3 –20 –6 –5 9 –6 Syria 600 739 725 750 93 82 –47 49 –1 10 Tanzania 248 276 272 309 –20 40 –19 76 1 29 Togo 84 78 73 79 31 –3 11 4 –2 2 Tunisia 2,715 2,532 2,311 2,447 –21 –51 48 –37 –117 6 Uganda 98 189 181 182 26 100 26 32 –4 –6 United Arab Emirates 42,385 58,554 58,818 58,997 9,986 17,655 442 4,209 785 –925 Yemen 291 924 1,035 1,024 93 643 37 180 113 –19 Zambia 259 567 514 613 141 312 100 54 –51 96 Zimbabwe 850 787 788 643 –47 –14 9 –1 33 –187 Residual 13,592 6,430 8,224 11,913 10,972 –7,118 –14,254 –1,766 1,825 3,627
DepositsLibya 5,546 5,779 5,193 5,318 585 413 –1,069 –29 –510 5 Madagascar 661 668 599 786 140 43 116 –100 –45 155 Malawi 154 117 126 126 –8 –15 1 –4 11 –10 Mali 270 285 292 254 33 28 –14 27 17 –50 Mauritania 383 382 351 348 83 6 76 11 –24 –13 Morocco 4,436 4,394 4,045 4,020 728 177 180 10 –202 –93 Mozambique 268 270 266 284 –70 21 21 14 2 5 Namibia 294 301 297 329 –3 29 2 22 7 12 Niger 78 91 145 146 –41 18 –1 13 56 –4 Nigeria 7,347 6,859 7,854 6,684 2,296 –219 126 –350 1,038 –1,310 Oman 6,923 5,766 3,828 4,265 –234 –911 725 –2,572 –1,863 246 Palestinian Territory 299 362 313 333 127 68 124 47 –45 14 Qatar 6,537 8,798 8,022 9,565 2,867 2,617 1,148 2,370 –703 1,407 Rwanda 204 162 180 282 18 –33 –3 –15 21 91 Sao Tomé and Principe 17 15 18 17 –5 –2 – –1 4 –1 Saudi Arabia 60,361 38,753 43,245 45,410 13,870 –20,782 –9,654 –12,586 4,903 1,396 Senegal 1,330 1,391 1,270 1,326 231 116 –48 123 –67 –14 Seychelles 2,962 4,115 4,309 4,334 826 865 217 39 280 –121 Sierra Leone 114 116 100 97 –13 9 –11 12 –15 –8 Somalia 17 16 15 17 4 –1 4 1 –1 2 South Africa 12,052 11,329 10,929 11,861 –67 693 –206 –703 –162 97 St. Helena 64 8 9 10 46 –54 15 –16 1 – Sudan 716 496 446 538 –89 –173 –68 –9 –37 61 Swaziland 368 601 315 184 256 262 –11 248 –279 –141 Syria 2,397 2,332 2,203 2,148 –116 –219 45 –137 –96 –128 Tanzania 804 716 653 719 –21 1 –16 48 –50 22 Togo 348 293 292 311 51 –40 –25 –11 9 3 Tunisia 1,573 1,561 1,549 1,667 175 82 –46 –3 38 43 Uganda 279 255 259 334 7 – 6 1 8 60 United Arab Emirates 40,810 29,712 30,667 29,968 2,224 –9,672 –3,618 –2,404 1,458 –1,760 Yemen 1,071 879 1,071 1,121 266 –162 –50 –34 196 13 Zambia 653 501 514 544 22 –112 –16 –40 19 –3 Zimbabwe 725 689 734 724 –85 67 23 –45 54 –67 Residual 13,792 8,217 7,648 9,642 6,708 –4,706 –16,894 665 –512 1,615
Table 7B (cont.)
Amounts outstanding Estimated exchange rate adjusted changes
BIS Quarterly Review, December 2009 A 47

Vis-à-vis countries Dec 2007 Dec 2008 Mar 2009 Jun 2009 2007 2008 Q3 2008 Q4 2008 Q1 2009 Q2 2009
Loansii) Asia & Pacific 181,333 211,272 204,544 206,955 40,055 30,337 4,904 –17,023 –3,200 –1,017
Afghanistan 99 41 43 81 61 –52 38 –34 2 37 Armenia 104 91 104 113 13 –8 11 –15 16 5 Azerbaijan 1,004 2,183 2,154 2,315 93 1,192 251 30 12 105 Bangladesh 828 983 888 881 209 162 136 –81 –87 –15 Bhutan 63 59 57 59 –2 –1 – –2 – –1 British Overseas Territories 217 311 279 275 –1,258 133 –64 85 –26 –16 Brunei 203 380 265 424 –51 192 58 92 –112 150 Cambodia 118 178 183 186 25 64 26 49 6 – China 35,638 40,397 34,670 35,191 11,764 5,944 –1,517 –8,930 –5,276 41 Chinese Taipei 7,755 8,451 7,723 7,535 1,771 653 673 –1,989 –577 –322 Fiji 119 16 216 22 22 –99 –32 –63 200 –195 French Polynesia 546 727 741 803 –3 222 4 –16 49 19 Georgia 151 269 280 234 51 105 10 31 15 –51 India 36,374 47,486 47,951 47,396 10,624 10,003 1,281 561 1,487 –1,349 Indonesia 20,107 19,942 19,683 19,986 –901 –126 8 –1,228 277 –260 Kazakhstan 4,257 6,952 7,286 7,224 1,288 2,718 1,497 1,032 384 –147 Kiribati 4 – – 1 –7 –4 2 –2 – 1 Kyrgyz Republic 25 41 32 37 – 17 13 –8 –8 4 Laos 292 328 334 327 155 36 22 –46 7 –8 Malaysia 11,174 8,939 9,083 8,953 1,317 –2,302 –2,119 –2,496 307 –310 Maldives 220 299 277 287 16 91 19 –86 –16 3 Marshall Islands 17,086 22,927 23,642 23,871 7,197 5,720 2,883 752 744 195 Micronesia 15 25 – – 14 10 –2 1 –25 –
Depositsii) Asia & Pacific 236,622 229,235 226,131 225,377 84,700 –3,498 19,424 –6,785 –731 –5,068
Afghanistan 199 117 124 90 75 –75 10 1 9 –39 Armenia 163 154 158 170 68 –5 –1 –7 8 4 Azerbaijan 869 694 395 444 265 –99 –309 –70 –283 44 Bangladesh 757 495 474 673 251 –220 19 –394 –14 178 Bhutan 123 9 9 13 114 –114 18 –35 1 3 British Overseas Territories 2,097 1,087 1,412 1,035 1,130 –855 –524 –125 357 –431 Brunei 1,845 2,092 2,192 2,027 567 364 –9 402 138 –230 Cambodia 139 122 138 126 30 –10 14 4 18 –14 China 75,658 82,070 72,123 70,838 38,271 5,993 22,728 –2,117 –9,411 –2,050 Chinese Taipei 47,623 48,506 49,487 48,823 10,496 1,348 1,544 737 1,358 –1,308 Fiji 96 98 104 83 5 2 –14 9 8 –27 French Polynesia 302 388 302 295 –33 97 –20 62 –71 –22 Georgia 187 347 345 283 22 170 –10 20 1 –75 India 16,799 15,169 16,262 15,352 3,343 –931 –561 227 1,220 –1,309 Indonesia 5,317 4,312 4,340 4,259 392 –879 –220 –322 84 –184 Kazakhstan 2,632 3,886 3,561 3,432 1,240 1,026 –5 59 –275 –213 Kiribati 132 100 82 117 – –3 –6 17 –16 24 Kyrgyz Republic 44 56 43 59 8 12 –10 19 –12 15 Laos 115 56 79 73 –48 –57 17 3 24 –12 Malaysia 7,259 6,734 7,036 6,413 1,289 54 –411 –300 391 –865 Maldives 96 84 95 84 –48 –7 –5 –15 12 –13 Marshall Islands 6,266 7,185 7,767 7,619 1,632 949 637 –221 678 –295 Micronesia 17 36 17 18 –2 17 –9 –1 –18 1
Table 7B (cont.)
Amounts outstanding Estimated exchange rate adjusted changes
A 48 BIS Quarterly Review, December 2009

Vis-à-vis countries Dec 2007 Dec 2008 Mar 2009 Jun 2009 2007 2008 Q3 2008 Q4 2008 Q1 2009 Q2 2009
LoansMongolia 60 88 78 73 10 29 20 –10 –9 –7 Myanmar 39 70 78 65 –12 32 3 16 10 –15 Nauru 11 16 16 13 4 6 – 5 – –3 Nepal 33 26 28 29 –56 –6 –8 –6 2 – New Caledonia 1,028 1,687 1,613 1,648 95 775 54 19 –1 –62 North Korea 26 33 36 78 – 8 5 4 5 40 Pakistan 3,011 3,457 3,193 3,453 734 497 357 126 –232 214 Palau 30 33 33 32 6 3 – 4 – –1 Papua New Guinea 59 35 24 29 –176 –21 –4 –14 –11 3 Philippines 8,131 7,787 7,520 7,256 732 –539 128 –631 –85 –386 Solomon Islands 27 21 21 20 –3 –5 –5 – – –1 South Korea 18,109 20,568 18,499 22,027 4,126 2,483 693 –4,223 –1,703 3,182 Sri Lanka 1,516 1,643 1,512 1,623 335 172 162 –205 –72 41 Tajikistan 4 3 4 3 4 –1 – –2 1 –1 Thailand 6,000 6,681 6,429 6,248 –824 667 8 41 –104 –318 Timor Leste 5 5 5 5 2 1 – – – – Tonga 8 3 3 3 – –4 –4 –1 – – Turkmenistan 4 2 5 6 – –2 –2 – 3 1 Tuvalu – 1 1 11 –1 1 – – – 10 US Pacific Islands 1,198 646 614 590 784 –292 –96 248 –21 –34 Uzbekistan 153 224 263 419 6 75 175 –94 42 153 Vietnam 3,527 4,917 4,577 4,952 1,073 1,424 286 117 –223 237 Wallis/Futuna 25 22 19 20 –2 –2 3 –3 –2 – Residual 1,930 2,279 4,082 2,151 830 367 –69 –50 1,822 –1,955
DepositsMongolia 143 54 25 46 131 –87 –31 20 –28 19 Myanmar 225 310 450 850 8 93 11 108 153 368 Nauru 24 11 10 10 7 –10 –2 –16 –1 –1 Nepal 248 328 388 311 46 87 –22 66 70 –87 New Caledonia 581 713 623 594 116 145 –41 150 –69 –55 North Korea 58 41 69 67 –23 –14 5 –9 29 –6 Pakistan 4,206 2,875 2,605 2,819 172 –1,098 95 65 –234 101 Palau 5 3 4 1 2 – –3 –6 1 –3 Papua New Guinea 487 511 1,169 1,168 –500 44 –274 129 663 –29 Philippines 7,317 5,925 5,856 6,189 1,830 –1,347 –600 185 –15 292 Solomon Islands 80 68 70 81 –11 –7 –5 –9 4 7 South Korea 10,321 8,358 8,738 9,698 4,077 –1,467 –74 –1,944 491 746 Sri Lanka 902 677 710 742 102 –114 –21 –198 52 –11 Tajikistan 20 21 24 27 – 3 12 –12 3 2 Thailand 6,368 6,111 5,945 6,275 965 46 –147 75 –58 93 Timor Leste 11 8 9 6 4 –1 –2 –1 1 –3 Tonga 4 3 1 3 – –1 –5 1 –2 2 Turkmenistan 27 32 39 37 7 6 –9 9 6 –3 Tuvalu – 5 15 14 – 5 1 4 10 –3 US Pacific Islands 235 181 265 209 –92 –44 87 –16 86 –60 Uzbekistan 484 614 755 844 48 161 20 –267 148 63 Vietnam 685 687 683 728 157 12 54 –81 11 24 Wallis/Futuna 20 39 48 56 – 22 18 4 10 6 Residual 35,436 27,863 31,085 32,276 18,590 –6,704 –2,514 –2,996 3,726 288
Table 7B (cont.)
Amounts outstanding Estimated exchange rate adjusted changes
BIS Quarterly Review, December 2009 A 49

Vis-à-vis countries Dec 2007 Dec 2008 Mar 2009 Jun 2009 2007 2008 Q3 2008 Q4 2008 Q1 2009 Q2 2009
Loansiii) Europe 283,324 335,047 319,900 321,248 86,776 56,487 10,620 –210 –6,664 –9,363
Albania 61 567 405 557 –23 529 47 280 –134 122 Belarus 905 1,010 966 959 319 149 92 –80 –20 –41 Bosnia and Herzegovina 923 1,105 1,361 1,374 270 249 43 –1 295 –65 Bulgaria 6,869 9,899 9,396 10,459 1,550 3,562 552 789 –86 492 Croatia 17,356 21,627 20,296 21,608 5,168 4,318 768 1,085 –383 156 Czech Republic 15,425 16,565 16,138 17,525 2,253 2,159 –928 667 231 515 Estonia 3,035 2,883 2,600 2,747 310 –9 –104 29 –169 6 Hungary 17,465 25,934 25,478 27,676 5,652 9,601 3,191 –1,213 361 1,104 Latvia 3,762 3,986 3,890 4,146 2,258 451 –111 194 71 23 Lithuania 3,683 4,520 3,947 3,677 1,215 1,145 –111 –76 –372 –491 Macedonia, FYR 207 433 388 422 85 155 42 41 –28 11 Moldova 70 109 93 89 12 43 25 20 –12 –8 Montenegro 326 544 533 571 189 249 39 25 9 11 Poland 26,102 29,301 27,869 29,023 4,473 4,759 1,989 –1,937 –340 –250 Romania 17,016 24,482 24,679 24,878 5,676 7,850 1,835 1,831 1,167 –1,160 Russia 74,666 84,500 80,995 76,323 34,211 7,594 –751 889 –2,596 –5,599 Serbia 5,417 6,524 6,111 6,296 2,408 652 676 –240 –132 –171 Turkey 79,117 90,119 84,534 82,680 19,457 13,388 3,558 –2,236 –3,960 –3,827 Ukraine 7,443 7,997 7,516 7,707 1,757 –26 319 –722 –391 82 Res. Serbia & Montenegro 33 82 70 96 –246 49 –6 74 –9 22 Residual Europe 3,443 2,860 2,635 2,435 –133 –383 –545 371 –163 –292
Depositsiii) Europe 75,438 91,095 98,171 97,684 10,032 11,910 3,331 –1,404 8,740 –3,873
Albania 97 89 94 107 32 4 –9 –35 6 9 Belarus 240 303 308 341 28 38 30 –29 14 24 Bosnia and Herzegovina 478 583 447 438 –26 109 58 80 –110 –33 Bulgaria 1,562 1,410 1,433 1,498 111 –197 –143 283 72 –14 Croatia 1,721 1,950 1,795 1,889 127 320 13 77 –91 8 Czech Republic 3,195 4,282 5,279 6,149 –644 1,235 –164 490 1,134 600 Estonia 583 317 329 369 302 118 –77 104 21 23 Hungary 3,449 4,230 10,066 10,047 399 571 1,492 –1,517 5,853 –560 Latvia 300 446 422 644 14 208 41 50 –11 201 Lithuania 616 386 374 435 400 –232 –74 10 –2 44 Macedonia, FYR 229 248 234 236 22 25 5 6 –5 –10 Moldova 86 192 169 150 12 7 8 –3 –19 –24 Montenegro 53 83 101 66 24 32 –12 15 21 –39 Poland 3,434 3,999 3,609 4,114 679 717 –252 330 –265 325 Romania 1,455 1,569 1,471 1,383 283 –29 –79 –7 –46 –152 Russia 21,072 31,003 33,012 31,323 5,766 4,686 –2,057 3,425 2,589 –2,706 Serbia 867 1,067 927 933 537 113 76 –34 –97 –42 Turkey 30,393 33,110 31,981 31,453 2,917 3,757 4,787 –5,416 –647 –1,210 Ukraine 1,790 2,116 2,356 2,263 –157 10 –10 –41 226 –168 Res. Serbia & Montenegro 18 10 25 27 –451 –7 1 3 16 1 Residual Europe 3,800 3,702 3,739 3,819 –12 428 –303 806 80 –149
Table 7B (cont.)
Amounts outstanding Estimated exchange rate adjusted changes
A 50 BIS Quarterly Review, December 2009

Vis-à-vis countries Dec 2007 Dec 2008 Mar 2009 Jun 2009 2007 2008 Q3 2008 Q4 2008 Q1 2009 Q2 2009
Loansiv) Latin America/Caribbean 179,678 203,407 200,495 198,970 25,079 23,327 18,301 –15,856 –1,579 –2,942
Argentina 11,774 12,168 11,546 11,242 2,684 461 685 –1,304 –515 –402 Belize 1,793 2,366 2,244 2,308 356 408 431 –5 –71 –6 Bolivia 388 243 234 231 27 –143 –45 –163 –8 –4 Brazil 40,293 49,859 51,891 51,258 2,296 9,444 5,641 –3,357 2,322 –863 Chile 15,917 18,620 20,806 20,577 1,200 2,809 1,164 –640 2,360 –398 Colombia 7,342 6,365 6,033 5,982 1,892 –932 –534 –827 –300 –93 Costa Rica 3,727 3,942 3,724 3,522 799 219 –38 –280 –211 –210 Cuba 867 710 634 630 –39 –116 30 –138 –55 –27 Dominica 72 94 49 44 8 24 44 7 –44 –5 Dominican Republic 3,081 2,763 2,786 2,843 819 –277 9 67 53 15 Ecuador 2,377 1,760 1,794 1,875 704 –631 115 –201 42 75 El Salvador 1,352 1,087 1,024 965 299 –258 –28 –17 –58 –66 Falkland Islands 61 37 37 40 34 –21 –3 –3 1 – Grenada 73 33 29 32 42 –38 7 –6 –4 3 Guatemala 2,377 2,790 2,708 2,528 298 415 180 –31 –78 –185 Guyana 95 662 945 788 7 579 –282 –151 283 –157 Haiti 83 96 94 95 –47 17 5 –9 – –1 Honduras 750 848 837 751 219 80 20 21 –7 –91 Jamaica 1,409 1,278 985 979 216 –50 –72 –61 –279 –24 Mexico 49,773 57,650 56,792 56,797 8,193 7,232 4,963 –2,476 –599 –285 Nicaragua 378 387 377 378 26 10 –4 –25 –8 –1 Paraguay 687 691 681 651 –83 –2 –22 –23 –2 –35 Peru 4,599 7,019 6,844 6,497 834 2,399 773 –370 –154 –374 St. Lucia 187 424 424 250 25 180 11 43 6 –180 St. Vincent 618 542 526 570 –50 –74 39 –58 –2 28 Surinam 25 28 63 33 10 5 4 –3 36 –32 Trinidad and Tobago 2,257 2,794 2,755 3,035 23 585 169 75 –34 255 Turks and Caicos 512 465 446 417 –155 23 –33 137 –16 –48 Uruguay 1,802 1,979 1,939 2,073 547 199 –38 –369 –17 114 Venezuela 6,351 5,266 4,677 4,528 –922 –1,061 216 –964 –512 –221 Residual 18,658 20,441 16,571 17,051 4,814 1,841 4,896 –4,726 –3,709 278
Int. organisations 18,652 11,515 13,729 12,824 748 –5,080 144 –3,114 2,561 –234 Unallocated 22,512 50,325 39,998 34,213 12,925 27,991 6,033 11,557 –7,867 –6,997
Depositsiv) Latin America/Caribbean 216,880 229,447 223,296 229,209 30,550 13,909 10,460 4,357 –4,490 3,568
Argentina 25,625 25,630 25,881 26,696 3,078 228 333 –886 396 608 Belize 7,485 9,184 8,878 9,166 1,736 1,406 285 279 –125 21 Bolivia 1,909 2,146 1,980 1,958 603 108 308 246 –154 –37 Brazil 22,546 25,548 25,226 23,140 410 3,324 2,525 632 –139 –2,359 Chile 8,328 7,285 7,332 6,610 382 –1,088 207 148 102 –786 Colombia 11,044 10,042 10,387 10,732 382 –941 –847 –174 371 303 Costa Rica 3,809 4,030 3,776 3,510 481 278 323 –222 –212 –329 Cuba 193 206 212 220 14 22 21 –14 12 –1 Dominica 173 213 198 226 6 28 –8 –13 –11 19 Dominican Republic 4,968 4,658 4,604 4,323 766 –455 –76 –230 –35 –305 Ecuador 4,004 4,534 4,675 4,579 488 542 271 265 152 –110 El Salvador 1,032 1,175 1,300 1,368 283 148 50 111 127 74 Falkland Islands 45 43 43 49 –9 8 –2 4 1 1 Grenada 84 134 199 162 22 55 17 15 69 –47 Guatemala 3,130 3,106 3,118 3,171 395 –20 3 –17 18 45 Guyana 454 225 128 159 –39 –214 –199 13 –96 24 Haiti 330 404 457 388 23 76 – 26 54 –71 Honduras 1,067 1,096 1,109 1,129 169 30 10 23 15 18 Jamaica 1,084 1,096 997 1,050 252 84 –78 66 –93 29 Mexico 38,736 40,435 38,240 41,308 2,963 1,705 –323 2,677 –1,959 2,886 Nicaragua 452 627 613 876 52 173 167 –53 –11 260 Paraguay 1,289 1,227 1,197 1,171 63 –47 –20 –28 –18 –40 Peru 5,533 4,974 5,307 4,933 992 –519 29 159 359 –407 St. Lucia 287 375 367 414 31 93 –43 160 –3 37 St. Vincent 3,004 3,410 3,178 3,011 –1,051 556 399 –167 –153 –287 Surinam 373 365 349 428 3 7 28 –72 –3 62 Trinidad and Tobago 1,365 1,026 1,036 1,413 119 –289 –220 –52 15 352 Turks and Caicos 1,037 1,453 1,534 1,675 –164 542 635 –897 104 80 Uruguay 6,940 7,134 7,248 6,976 529 266 318 –23 177 –346 Venezuela 32,897 36,936 35,662 37,482 4,420 4,350 1,653 –789 –1,032 1,492 Residual 27,657 30,730 28,065 30,886 13,154 3,450 4,693 3,170 –2,417 2,381
Int. organisations 125,100 99,950 103,322 54,483 10,451 –18,194 –1,925 –12,066 5,505 –3,689 Unallocated 85,536 106,144 104,180 105,248 –2,741 28,902 7,425 7,398 516 –4,836
Table 7B (cont.)
Amounts outstanding Estimated exchange rate adjusted changes
BIS Quarterly Review, December 2009 A 51

Parent country CDs &of bank securities
Assets Liab. Assets Liab. Assets Liab. Assets Liab. Assets Liab. Liab.
2009 Q2All countries 34,084.4 32,612.8 9,610.8 9,276.1 10,318.5 9,498.4 14,018.2 12,989.2 137.0 849.0 4,116.0 Reporting countries 33,552.1 32,036.2 9,496.5 9,173.6 10,128.4 9,332.5 13,791.3 12,702.8 135.9 827.3 4,026.3
Australia 361.7 608.9 91.4 68.3 125.6 296.1 143.0 235.6 1.6 8.8 312.6 Austria 438.7 324.8 22.8 19.9 217.4 112.1 197.9 181.2 0.5 11.6 0.2 Belgium 910.2 806.9 207.7 179.4 230.6 200.8 470.9 396.1 0.9 30.6 70.6 Canada 744.7 666.8 371.4 306.7 126.1 74.8 247.1 268.2 0.1 17.1 36.0 Chinese Taipei 232.1 265.2 17.3 10.0 92.2 62.1 121.6 172.4 1.1 20.7 0.6 Denmark 336.7 422.9 120.7 101.6 86.2 99.6 127.3 187.6 2.5 34.1 133.8 France 4,021.0 3,847.4 1,080.4 1,003.6 1,581.3 1,537.0 1,334.6 1,184.0 24.7 122.9 669.9 Germany 5,024.6 3,710.8 1,454.8 1,465.4 1,290.3 1,149.2 2,259.2 1,019.4 20.3 76.7 630.2 Ireland 741.2 686.5 236.4 305.1 184.5 214.8 320.1 143.5 0.1 23.0 33.7 Italy 1,102.0 1,094.7 303.2 243.2 395.1 488.1 403.3 335.5 0.4 27.9 182.7 Japan 3,156.1 1,790.1 569.6 509.5 740.0 631.4 1,838.2 618.7 8.3 30.5 42.6 Netherlands 2,057.8 2,102.0 564.6 589.3 614.2 489.4 875.9 983.6 3.1 39.8 271.4 Portugal 236.5 285.5 85.6 31.2 80.4 173.0 70.2 76.1 0.2 5.3 51.1 Spain 974.0 1,004.3 373.6 346.0 179.0 234.7 420.8 392.2 0.5 31.4 154.5 Sweden 647.6 726.6 257.5 159.0 201.7 229.2 184.1 304.0 4.4 34.5 236.4 Switzerland 2,863.8 3,096.9 784.1 1,105.0 1,102.1 707.8 957.9 1,259.3 19.7 24.8 177.1 United Kingdom 3,853.9 3,905.8 970.8 844.3 1,148.1 1,031.6 1,717.1 1,926.4 17.9 103.6 638.5 United States 3,584.9 4,283.2 1,571.6 1,502.8 1,026.0 737.1 977.7 1,894.5 9.6 148.8 134.1 Other 1,674.3 1,921.3 303.7 269.1 487.6 678.4 863.6 948.0 19.4 25.8 225.9 Unallocated 529.9 439.0 108.6 106.7 184.3 177.5 236.6 145.3 0.3 9.5 22.4
Non-rep. countries 482.7 446.9 113.2 102.0 162.7 129.2 205.8 200.8 1.0 14.9 10.3 Developed 21.3 11.9 4.5 4.5 8.0 3.3 8.8 4.0 0.0 – 0.1 Offshore centres 13.5 18.0 1.5 0.7 8.3 3.7 3.8 13.6 0.0 – 0.0 Africa & Mid. East 193.5 201.7 34.1 35.5 81.6 65.8 77.4 89.9 0.3 10.5 3.4 Asia & Pacific 206.4 161.5 68.2 50.5 49.7 43.5 87.9 63.4 0.5 4.1 2.0 Europe 22.2 21.3 1.6 7.9 6.8 8.4 13.6 5.0 0.1 0.0 1.9 Latin America 25.8 32.5 3.3 2.8 8.3 4.5 14.3 24.8 – 0.3 2.9
Consortium Banks 38.6 37.5 0.8 0.2 20.0 19.8 17.7 10.7 0.1 6.8 0.2 Unallocated 10.9 92.1 0.3 0.3 7.4 17.0 3.3 74.9 – – 79.2
2009 Q1All countries 33,241.8 32,021.4 9,374.0 9,180.0 10,150.5 9,294.8 13,602.4 12,615.2 114.9 931.5 3,771.6 Reporting countries 32,721.2 31,419.1 9,268.0 9,060.2 9,961.0 9,117.5 13,378.6 12,342.2 113.6 899.2 3,687.2
Australia 350.0 543.2 85.6 62.4 122.1 265.2 141.0 203.9 1.4 11.7 258.7 Austria 421.0 322.5 22.1 16.8 204.3 120.3 193.8 170.6 0.7 14.9 0.2 Belgium 943.3 863.2 205.9 195.6 248.1 217.5 488.4 428.2 0.9 22.0 66.0 Canada 738.4 668.0 367.3 299.8 120.2 76.9 250.7 273.5 0.1 17.8 32.8 Chinese Taipei 221.6 251.4 18.2 10.6 90.9 62.4 111.1 161.0 1.4 17.4 1.3 Denmark 333.7 435.6 130.8 116.1 80.4 111.4 120.8 176.0 1.7 32.0 123.6 France 3,838.2 3,690.6 1,050.6 991.1 1,492.3 1,433.8 1,278.4 1,123.8 16.9 141.8 613.2 Germany 4,854.9 3,659.1 1,403.2 1,389.4 1,277.8 1,113.4 2,158.0 1,058.6 15.9 97.8 589.6 Ireland 674.0 643.0 210.0 290.5 163.2 199.1 300.7 124.6 0.1 28.8 24.2 Italy 1,071.9 1,047.8 267.5 235.5 392.2 450.3 411.9 332.7 0.3 29.3 171.7 Japan 2,903.2 1,696.6 517.5 450.1 650.7 616.2 1,734.5 602.2 0.5 28.2 38.3 Netherlands 2,058.3 2,090.6 592.3 631.9 610.8 453.4 848.2 963.4 6.9 41.9 243.0 Portugal 228.2 278.6 77.8 33.4 81.9 164.9 68.0 74.5 0.4 5.7 39.9 Spain 886.9 928.8 346.7 311.9 160.0 216.7 379.7 367.9 0.4 32.3 148.4 Sweden 623.5 686.9 222.4 138.9 216.7 235.4 183.5 269.0 0.9 43.6 198.9 Switzerland 2,839.8 3,116.3 817.4 1,141.2 1,090.5 694.2 915.0 1,254.9 16.8 26.0 163.0 United Kingdom 3,788.8 3,752.2 945.9 800.0 1,132.4 1,009.2 1,697.6 1,828.0 12.9 115.1 599.7 United States 3,748.0 4,397.6 1,592.9 1,602.3 1,121.8 828.5 1,020.6 1,824.0 12.7 142.9 138.9 Other 1,630.2 1,876.6 292.4 246.3 477.3 664.3 838.4 929.2 22.0 36.7 211.1 Unallocated 510.3 425.2 100.5 91.0 191.1 175.2 218.1 145.8 0.7 13.2 23.2
Non-rep. countries 468.7 479.8 105.2 119.2 158.7 133.4 203.5 201.8 1.2 25.4 10.5 Developed 22.6 12.5 5.1 3.5 7.8 4.2 9.7 4.8 0.0 – 0.1 Offshore centres 13.7 18.2 1.5 0.5 8.5 3.5 3.6 14.3 0.0 – 0.0 Africa & Mid. East 198.2 207.8 34.1 36.5 82.6 68.8 80.8 90.7 0.6 11.8 3.5 Asia & Pacific 187.3 188.6 58.9 69.3 44.1 42.6 83.7 63.3 0.5 13.3 1.9 Europe 21.8 20.2 2.0 6.5 8.1 8.2 11.7 5.5 0.1 0.0 2.4 Latin America 25.1 32.5 3.6 2.9 7.6 6.0 14.0 23.3 – 0.3 2.7
Consortium Banks 41.2 39.6 0.5 0.2 23.5 23.1 17.1 9.5 0.1 6.9 0.2 Unallocated 10.8 82.8 0.3 0.4 7.2 20.8 3.2 61.6 – – 73.7
authoritiesrelated offices other banks non-banks official monetary
Amounts outstandingTable 8A: International positions by nationality of ownership of reporting banks
In billions of US dollarsTotal positions of which: vis-à-vis
A 52 BIS Quarterly Review, December 2009

Parent country CDs &of bank securities
Assets Liab. Assets Liab. Assets Liab. Assets Liab. Assets Liab. Liab.
2009 Q2All countries –341.5 –472.5 –67.7 –184.5 –244.4 –203.2 –46.7 15.2 17.3 –99.9 199.7 Reporting countries –341.5 –431.4 –73.7 –164.1 –239.7 –187.5 –45.8 8.8 17.6 –88.6 204.0
Australia –4.1 41.8 3.2 4.0 –3.6 17.6 –3.9 23.4 0.2 –3.1 44.0 Austria –2.0 –10.9 –0.4 2.3 3.3 –12.8 –4.8 3.4 –0.2 –3.8 0.0 Belgium –76.1 –93.1 –8.7 –27.4 –28.7 –25.5 –38.7 –47.9 0.0 7.7 1.8 Canada –8.3 –15.1 –0.5 2.2 1.4 –4.0 –9.2 –12.3 0.0 –1.0 1.7 Chinese Taipei 8.4 11.4 –1.1 –0.8 0.2 –1.0 9.6 9.9 –0.3 3.2 –0.7 Denmark –12.5 –29.8 –15.5 –19.3 1.3 –16.4 1.0 4.9 0.6 1.1 5.6 France 29.0 20.3 –9.6 –23.2 25.2 49.6 6.6 18.1 6.7 –24.2 30.1 Germany –23.0 –73.8 –6.8 23.2 –44.5 –43.0 24.4 –31.4 3.8 –22.6 28.0 Ireland –19.3 –13.2 –10.4 –14.0 2.5 –4.8 –11.4 6.7 –0.0 –1.1 8.2 Italy –21.7 –2.0 22.8 –4.0 –17.3 14.5 –27.2 –10.3 0.1 –2.2 2.6 Japan 193.4 61.3 39.5 47.6 79.4 7.6 66.6 4.3 7.8 1.8 2.8 Netherlands –91.1 –76.7 –57.2 –66.4 –24.6 12.5 –5.2 –19.3 –4.0 –3.5 18.1 Portugal –2.9 –5.8 3.6 –3.7 –5.1 0.0 –1.2 –1.6 –0.1 –0.5 8.9 Spain 50.8 39.3 14.1 23.1 10.9 6.4 25.7 11.1 0.1 –1.4 0.1 Sweden 0.5 16.0 26.9 15.4 –23.1 –13.2 –6.6 23.6 3.3 –9.8 28.9 Switzerland –60.5 –112.0 –56.9 –69.0 –27.9 –11.7 22.0 –29.5 2.3 –1.8 7.9 United Kingdom –75.9 –5.8 3.8 24.2 –42.3 –34.8 –41.2 22.2 3.9 –17.4 12.5 United States –232.3 –184.5 –35.3 –107.6 –126.6 –121.2 –67.5 38.7 –2.9 5.6 –5.2 Other 4.9 3.6 4.0 14.4 –2.7 –0.8 7.0 1.7 –3.3 –11.7 9.7 Unallocated 0.2 –1.4 10.6 13.6 –15.3 –4.4 5.2 –6.6 –0.4 –4.1 –1.8
Non-rep. countries 3.5 –43.0 5.7 –20.3 –0.4 –7.8 –1.6 –3.9 –0.3 –11.0 –0.5 Developed –2.5 –1.6 –1.0 0.6 –0.2 –1.1 –1.4 –1.0 – – –0.0 Offshore centres –0.3 –0.5 –0.1 0.3 –0.4 0.1 0.1 –0.8 – – –0.0 Africa & Mid. East –10.2 –11.5 –0.8 –2.6 –4.0 –5.3 –5.1 –1.8 –0.3 –1.8 –0.3 Asia & Pacific 15.8 –30.2 8.3 –19.8 4.9 0.1 2.6 –1.3 –0.0 –9.2 0.1 Europe 0.1 0.7 –0.4 1.3 –1.4 –0.1 1.8 –0.5 0.0 0.0 –0.6 Latin America 0.7 0.0 –0.3 –0.0 0.7 –1.5 0.3 1.5 – 0.0 0.2
Consortium Banks –3.5 –2.9 0.3 0.0 –4.4 –4.1 0.6 1.5 –0.0 –0.3 –0.0 Unallocated –0.0 4.9 –0.0 –0.1 –0.0 –3.8 0.0 8.8 – – –3.8
2009 Q1All countries –891.7 –1,080.7 –99.9 –146.6 –677.3 –364.9 –105.9 –426.8 –8.6 –142.4 68.4 Reporting countries –868.0 –1,075.3 –92.9 –145.7 –673.6 –361.9 –92.7 –423.5 –8.8 –144.2 65.7
Australia –3.4 3.8 8.6 5.4 –4.0 3.6 –9.0 6.6 1.1 –11.8 12.1 Austria –5.9 –5.1 –5.8 –3.1 3.7 8.5 –3.7 –7.4 –0.1 –3.2 0.0 Belgium –71.5 –56.0 –27.1 –14.5 –24.2 –38.0 –20.4 2.3 0.2 –5.9 0.2 Canada –21.5 –6.6 14.3 –10.2 –33.1 5.7 –2.8 3.5 0.0 –5.6 2.3 Chinese Taipei –3.3 –4.3 –1.8 –1.2 7.7 –2.4 –9.6 –4.7 0.3 3.9 –0.0 Denmark –29.9 –22.3 –5.2 –14.0 –19.9 4.1 –4.9 3.0 0.2 –15.4 6.9 France –66.3 –106.1 –3.4 –1.7 –20.9 –87.7 –33.3 –12.1 –8.7 –4.6 16.4 Germany –256.9 –174.6 –83.1 –123.1 –93.3 –40.3 –83.6 –12.8 3.2 1.7 10.8 Ireland –20.2 –50.8 6.4 –1.2 –20.1 –27.6 –5.4 –28.3 –1.1 6.4 –0.6 Italy –20.6 7.2 11.9 –65.3 –31.1 71.3 –1.1 14.9 –0.3 –13.7 4.0 Japan –153.1 –141.5 –83.3 –63.5 –65.0 –76.8 –4.9 2.1 0.1 –3.3 0.9 Netherlands –47.7 –67.1 5.7 40.1 –30.3 –69.0 –27.1 –8.9 3.9 –29.4 8.2 Portugal 5.9 1.5 –0.7 1.5 1.3 –3.6 5.2 4.4 0.1 –0.9 1.2 Spain –15.4 –32.3 4.9 –4.5 –16.3 0.5 –4.0 –25.7 0.0 –2.5 –11.8 Sweden –17.9 8.4 –8.5 –0.4 –0.7 –9.8 –8.8 11.2 0.1 7.5 16.6 Switzerland –120.5 –123.0 47.9 59.1 –157.1 –145.2 –14.8 –27.9 3.5 –8.9 0.9 United Kingdom 49.8 –15.8 50.8 18.7 –117.5 –39.3 117.9 20.6 –1.5 –15.8 18.3 United States –40.1 –235.7 –34.7 20.3 –40.2 115.9 34.8 –338.1 –0.0 –33.7 –6.7 Other –20.9 –47.2 8.1 5.4 –4.3 –39.4 –14.9 –15.8 –9.8 2.7 –14.6 Unallocated –11.5 –7.2 2.2 6.6 –10.2 7.4 –3.4 –9.6 –0.0 –11.6 0.6
Non-rep. countries –25.5 –16.5 –7.2 –0.8 –3.2 –8.2 –15.5 –9.0 0.3 1.5 0.6 Developed 0.7 –0.0 0.1 –0.0 0.9 –0.0 –0.3 0.0 –0.0 – 0.0 Offshore centres –0.5 –0.4 0.5 –0.1 –0.3 –0.2 –0.7 –0.1 – – 0.0 Africa & Mid. East –7.6 –7.0 –0.7 –0.8 –1.6 –3.2 –5.6 0.3 0.3 –3.3 0.4 Asia & Pacific –16.1 –6.3 –7.7 0.4 –0.3 –3.4 –8.1 –8.2 0.0 4.8 –0.2 Europe –2.0 –3.2 0.4 –0.4 –1.8 –2.0 –0.7 –0.8 –0.0 0.0 0.1 Latin America –0.0 0.4 0.1 0.0 –0.0 0.6 –0.2 –0.3 – –0.0 0.3
Consortium Banks 0.9 1.6 –0.1 –0.0 –0.0 2.0 1.1 –0.6 –0.1 0.2 0.0 Unallocated 0.9 9.4 0.3 –0.1 –0.5 3.2 1.1 6.3 – – 2.0
authorities
Estimated exchange rate adjusted changesTable 8B: International positions by nationality of ownership of reporting banks
In billions of US dollarsTotal positions of which: vis-à-vis
related offices other banks non-banks official monetary
BIS Quarterly Review, December 2009 A 53

Total End-June 2009 foreign
claims on a Up to and Over one year Over two Banks Public Sectorcontractual international including one up to two years
Claims vis-à-vis basis claims year yearsA + L A B C D F G
All countries 31,168,185 20,502,470 10,065,183 1,013,764 6,342,557 8,867,026 2,549,886 Developed countries 24,729,033 16,302,245 8,209,275 759,134 4,789,247 7,953,795 2,137,857
Europe 16,482,663 12,329,503 6,417,318 570,484 3,580,508 6,437,070 1,616,451 Austria 331,397 227,434 59,436 6,681 91,721 126,067 50,213 Andorra 2,417 2,416 922 82 1,366 318 63 Belgium 535,735 375,635 228,314 12,514 108,940 203,970 72,925 Cyprus 51,849 43,703 19,582 2,282 19,941 10,077 1,800 Denmark 340,123 245,452 135,946 11,842 68,493 137,805 21,186 Finland 217,302 97,597 32,254 7,414 40,393 29,197 20,146 France 1,742,775 1,531,441 920,514 71,118 341,719 968,572 193,627 Germany 2,173,571 1,512,284 735,767 107,756 557,695 801,888 350,501 Greece 280,949 180,676 47,714 8,561 89,130 41,933 99,540 Iceland 27,651 26,734 16,500 1,657 4,447 17,614 2,120 Ireland 887,464 701,948 347,568 30,117 172,975 303,226 23,000 Italy 1,438,396 952,904 349,464 60,064 337,273 424,235 382,170 Liechtenstein 7,108 7,062 4,808 133 1,483 1,296 – Luxembourg 638,499 538,723 210,622 26,347 192,051 157,559 13,678 Malta 18,212 11,899 5,124 453 4,814 2,221 226 Netherlands 1,162,556 1,103,612 486,342 43,121 421,037 540,413 68,209 Norway 300,115 168,202 88,686 11,103 46,364 60,456 46,407 Portugal 272,232 181,847 55,861 12,248 77,589 79,068 52,575 Slovakia 73,721 18,153 5,724 669 9,200 2,247 6,321 Slovenia 39,335 22,138 5,280 1,626 14,112 7,045 2,241 Spain 1,154,465 868,276 313,460 51,775 291,695 505,426 99,556 Sweden 271,583 213,174 109,118 11,576 66,463 113,790 16,179 Switzerland 652,402 623,829 440,590 12,453 114,641 429,906 19,076 United Kingdom 3,860,551 2,672,313 1,796,177 78,834 506,645 1,471,563 74,664 Vatican 386 386 385 – – 385 – Other 1,869 1,665 1,160 58 321 793 28
Other developed countries 8,246,370 3,972,742 1,791,957 188,650 1,208,739 1,516,725 521,406 Australia 582,673 304,147 106,890 18,821 108,533 162,258 22,004 Canada 535,202 343,180 196,817 13,675 86,232 192,412 59,415 Japan 1,077,996 602,724 480,194 12,940 63,400 399,664 89,586 New Zealand 240,239 42,362 25,688 1,468 12,609 11,494 4,673 United States 5,809,265 2,679,333 981,610 141,747 937,731 750,830 345,659
Offshore centres 2,124,892 1,703,506 790,509 72,848 542,281 275,118 15,784 Aruba 1,188 1,167 209 10 311 187 120 Bahamas 51,614 47,912 36,527 1,220 5,962 12,691 1,034 Bahrain 31,929 22,498 14,431 1,424 6,023 17,814 435 Barbados 6,795 5,454 1,513 232 2,236 1,335 741 Bermuda 80,417 78,176 30,750 2,831 28,685 1,750 277 Cayman Islands 790,787 786,847 309,382 27,474 269,675 69,391 1,477 Gibraltar 7,356 6,348 2,641 192 3,034 291 5 Guernsey 43,634 40,884 12,800 1,495 11,020 4,471 161 Hong Kong SAR 428,091 151,462 89,107 8,714 31,027 56,369 2,377 Isle of Man 39,806 29,095 10,760 2,176 14,782 2,829 8 Jersey 142,457 137,333 55,752 7,456 47,174 12,317 36 Lebanon 5,619 5,396 3,191 542 1,375 828 1,415 Macau SAR 15,669 14,525 8,187 403 5,837 5,955 166 Mauritius 14,102 11,291 6,016 1,443 3,668 1,215 50 Netherlands Antilles 27,889 27,772 14,141 2,460 6,820 4,365 328 Panama 73,635 66,769 18,261 2,660 45,095 2,640 568 Samoa 1,758 1,616 1,123 61 343 9 9 Singapore 260,612 169,291 109,265 5,963 38,104 79,435 6,403 Vanuatu 352 105 46 4 52 8 – West Indies UK 101,182 99,564 66,405 6,089 21,059 1,219 174
Table 9A: Consolidated claims of reporting banks - immediate borrower basisOn individual countries by maturity and sector / Amounts outstanding In millions of US dollars
Maturities SectorsConsolidated cross-border claims in all currencies and local claims in non-local currencies
Total
A 54 BIS Quarterly Review, December 2009
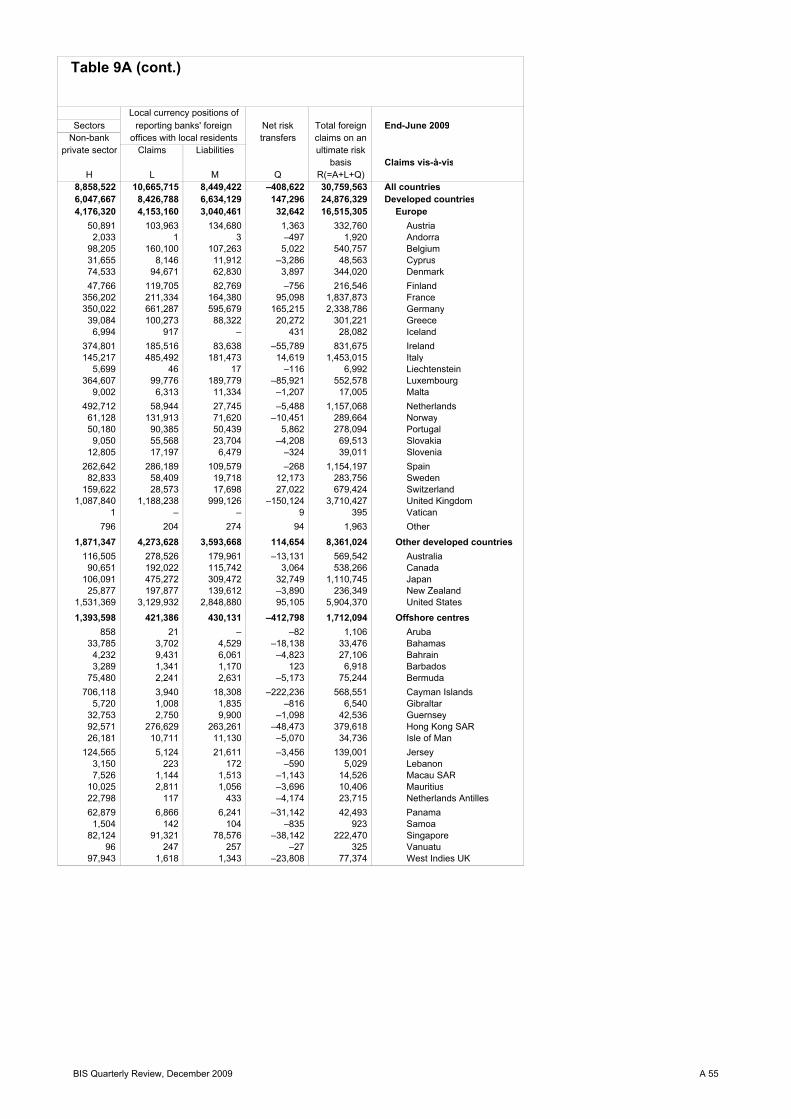
Table 9A (cont.)
Sectors Net risk Total foreign End-June 2009Non-bank transfers claims on an
private sector Claims Liabilities ultimate riskbasis Claims vis-à-vis
H L M Q R(=A+L+Q)8,858,522 10,665,715 8,449,422 –408,622 30,759,563 All countries6,047,667 8,426,788 6,634,129 147,296 24,876,329 Developed countries4,176,320 4,153,160 3,040,461 32,642 16,515,305 Europe
50,891 103,963 134,680 1,363 332,760 Austria2,033 1 3 –497 1,920 Andorra
98,205 160,100 107,263 5,022 540,757 Belgium31,655 8,146 11,912 –3,286 48,563 Cyprus74,533 94,671 62,830 3,897 344,020 Denmark47,766 119,705 82,769 –756 216,546 Finland
356,202 211,334 164,380 95,098 1,837,873 France350,022 661,287 595,679 165,215 2,338,786 Germany39,084 100,273 88,322 20,272 301,221 Greece6,994 917 – 431 28,082 Iceland
374,801 185,516 83,638 –55,789 831,675 Ireland145,217 485,492 181,473 14,619 1,453,015 Italy
5,699 46 17 –116 6,992 Liechtenstein364,607 99,776 189,779 –85,921 552,578 Luxembourg
9,002 6,313 11,334 –1,207 17,005 Malta492,712 58,944 27,745 –5,488 1,157,068 Netherlands61,128 131,913 71,620 –10,451 289,664 Norway50,180 90,385 50,439 5,862 278,094 Portugal9,050 55,568 23,704 –4,208 69,513 Slovakia
12,805 17,197 6,479 –324 39,011 Slovenia262,642 286,189 109,579 –268 1,154,197 Spain82,833 58,409 19,718 12,173 283,756 Sweden
159,622 28,573 17,698 27,022 679,424 Switzerland1,087,840 1,188,238 999,126 –150,124 3,710,427 United Kingdom
1 – – 9 395 Vatican796 204 274 94 1,963 Other
1,871,347 4,273,628 3,593,668 114,654 8,361,024 Other developed countries116,505 278,526 179,961 –13,131 569,542 Australia90,651 192,022 115,742 3,064 538,266 Canada
106,091 475,272 309,472 32,749 1,110,745 Japan25,877 197,877 139,612 –3,890 236,349 New Zealand
1,531,369 3,129,932 2,848,880 95,105 5,904,370 United States
1,393,598 421,386 430,131 –412,798 1,712,094 Offshore centres858 21 – –82 1,106 Aruba
33,785 3,702 4,529 –18,138 33,476 Bahamas4,232 9,431 6,061 –4,823 27,106 Bahrain3,289 1,341 1,170 123 6,918 Barbados
75,480 2,241 2,631 –5,173 75,244 Bermuda706,118 3,940 18,308 –222,236 568,551 Cayman Islands
5,720 1,008 1,835 –816 6,540 Gibraltar32,753 2,750 9,900 –1,098 42,536 Guernsey92,571 276,629 263,261 –48,473 379,618 Hong Kong SAR26,181 10,711 11,130 –5,070 34,736 Isle of Man
124,565 5,124 21,611 –3,456 139,001 Jersey3,150 223 172 –590 5,029 Lebanon7,526 1,144 1,513 –1,143 14,526 Macau SAR
10,025 2,811 1,056 –3,696 10,406 Mauritius22,798 117 433 –4,174 23,715 Netherlands Antilles62,879 6,866 6,241 –31,142 42,493 Panama1,504 142 104 –835 923 Samoa
82,124 91,321 78,576 –38,142 222,470 Singapore96 247 257 –27 325 Vanuatu
97,943 1,618 1,343 –23,808 77,374 West Indies UK
offices with local residents
Local currency positions ofreporting banks' foreign
BIS Quarterly Review, December 2009 A 55

Total End-June 2009 foreign
claims on a Up to and Over one year Over two Banks Public Sectorcontractual international including one up to two years
Claims vis-à-vis basis claims year yearsA + L A B C D F G
Developing countries 4,228,353 2,411,175 1,045,882 177,391 980,039 627,185 337,028 Africa & Middle East 582,626 376,423 157,066 29,384 169,528 100,436 47,269
Algeria 7,859 2,626 1,179 191 1,180 782 807 Angola 6,954 6,495 2,601 187 3,551 1,065 1,921 Benin 159 156 88 26 38 28 – Botswana 2,430 229 184 – 33 29 71 Burkina Faso 867 366 104 87 159 45 39 Burundi 45 45 5 3 33 9 – Cameroon 2,869 1,038 116 470 432 24 212 Cape Verde 1,029 586 376 70 93 358 17 Central African Republic 43 40 33 – 7 – 4 Chad 71 58 11 4 42 1 2 Comoros Islands 14 13 3 3 4 5 – Congo 475 263 111 104 46 27 39 Congo Democratic Republic 542 529 215 23 285 36 198 Côte d’Ivoire 6,348 3,841 646 1,238 1,869 77 1,024 Djibouti 345 269 198 29 41 7 10 Egypt 41,728 21,175 10,288 500 9,528 4,644 5,712 Equatorial Guinea 664 91 77 – 14 68 – Eritrea 6 6 5 – 1 – – Ethiopia 43 42 18 3 18 6 – Gabon 2,013 744 159 64 454 14 396 Gambia 77 67 27 5 23 5 3 Ghana 3,518 2,423 1,061 297 940 273 752 Guinea 403 327 109 66 153 9 184 Guinea-Bissau 17 17 10 – 4 8 – Iran 15,899 15,896 6,410 1,116 8,148 8,290 853 Iraq 2,122 1,823 444 3 1,350 352 1,436 Israel 15,786 12,778 6,792 454 4,073 2,703 2,248 Jordan 3,295 2,134 1,317 52 524 954 163 Kenya 3,838 1,795 874 43 816 183 171 Kuwait 17,911 17,235 8,979 1,958 5,244 4,323 1,925 Lesotho 20 20 2 – 17 1 1 Liberia 30,830 30,824 7,552 1,392 21,453 – – Libya 8,331 407 321 9 42 122 39 Madagascar 1,062 254 89 23 137 18 5 Malawi 44 44 34 1 9 6 1 Mali 340 242 47 26 146 47 18 Mauritania 238 237 117 50 62 100 3 Morocco 27,097 8,212 2,144 684 4,002 3,388 1,640 Mozambique 2,933 1,173 275 134 643 78 99 Namibia 546 546 304 3 235 43 171 Niger 181 169 132 6 28 15 17 Nigeria 8,077 6,501 3,880 686 1,535 2,353 133 Oman 10,304 8,438 2,497 645 5,078 1,628 913 Palestinian Territory 63 63 6 – 55 6 – Qatar 50,767 46,605 17,371 4,323 23,486 11,385 6,506 Rwanda 21 21 4 – 6 10 – Sao Tomé and Principe 39 39 8 – 30 1 – Saudi Arabia 43,573 41,010 22,724 2,572 14,547 17,104 3,276 Senegal 2,661 833 231 236 358 37 39 Seychelles 1,642 1,472 977 251 210 46 13 Sierra Leone 195 155 55 – 98 3 122 Somalia 89 89 1 20 68 – – South Africa 116,610 31,239 12,764 2,385 11,830 13,521 5,956 St. Helena 5 5 – – 5 – – Sudan 423 423 154 11 214 138 228 Swaziland 71 71 18 – 41 8 13
Table 9A (Cont.)
Consolidated cross-border claims in all currencies and local claims in non-local currencies
Total Maturities Sectors
A 56 BIS Quarterly Review, December 2009

Table 9A (Cont.)
Sectors Net risk Total foreign End-June 2009Non-bank transfers claims on an
private sector Claims Liabilities ultimate riskbasis Claims vis-à-vis
H L M Q R(=A+L+Q)1,409,785 1,817,178 1,384,081 –137,348 4,091,005 Developing countries
225,866 206,203 187,104 –23,825 558,801 Africa & Middle East1,030 5,233 4,095 –347 7,512 Algeria3,184 459 1,182 –900 6,054 Angola
127 3 – 1 160 Benin129 2,201 1,961 –22 2,408 Botswana287 501 205 –17 850 Burkina Faso36 – – 1 46 Burundi
802 1,831 1,780 1 2,870 Cameroon212 443 108 –21 1,008 Cape Verde36 3 – –23 20 Central African Republic58 13 – –2 69 Chad8 1 – 10 24 Comoros Islands
196 212 295 4 479 Congo294 13 5 –9 533 Congo Democratic Republic
2,735 2,507 1,267 –166 6,182 Côte d’Ivoire252 76 345 –95 250 Djibouti
10,810 20,553 17,484 –1,551 40,177 Egypt22 573 906 –14 650 Equatorial Guinea6 – – – 6 Eritrea
37 1 – –12 31 Ethiopia335 1,269 1,249 –103 1,910 Gabon57 10 77 –3 74 Gambia
1,397 1,095 957 –148 3,370 Ghana136 76 178 23 426 Guinea
9 – – 2 19 Guinea-Bissau6,754 3 – –5,035 10,864 Iran
33 299 184 –629 1,493 Iraq7,762 3,008 2,383 –1,487 14,299 Israel1,016 1,161 1,151 –31 3,264 Jordan1,439 2,043 1,681 –369 3,469 Kenya
10,921 676 375 300 18,211 Kuwait18 – – –1 19 Lesotho
30,686 6 4 –3,493 27,337 Liberia246 7,924 8,171 101 8,432 Libya231 808 961 –38 1,024 Madagascar35 – – –9 35 Malawi
181 98 98 15 355 Mali133 1 – –13 225 Mauritania
3,182 18,885 14,855 –1,416 25,681 Morocco995 1,760 1,441 –118 2,815 Mozambique332 – – –109 437 Namibia138 12 – –23 158 Niger
4,015 1,576 1,045 –545 7,532 Nigeria5,894 1,866 1,555 –1,415 8,889 Oman
58 – – 6 69 Palestinian Territory28,485 4,162 3,561 694 51,461 Qatar
12 – – – 21 Rwanda38 – – –26 13 Sao Tomé and Principe
20,597 2,563 1,313 –2,209 41,364 Saudi Arabia759 1,828 891 162 2,823 Senegal
1,412 170 341 –366 1,276 Seychelles30 40 59 271 466 Sierra Leone89 – – – 89 Somalia
11,689 85,371 85,669 –1,493 115,117 South Africa5 – – 10 15 St. Helena
57 – – –10 413 Sudan47 – – –14 57 Swaziland
offices with local residents
Local currency positions ofreporting banks' foreign
BIS Quarterly Review, December 2009 A 57

Total End-June 2009 foreign
claims on a Up to and Over one year Over two Banks Public Sectorcontractual international including one up to two years
Claims vis-à-vis basis claims year yearsA + L A B C D F G
Syria 571 570 448 19 71 32 65 Tanzania 1,988 951 531 8 295 97 79 Togo 264 249 62 52 122 186 19 Tunisia 8,076 4,636 1,065 850 2,006 1,812 1,083 Uganda 862 521 238 2 253 71 70 United Arab Emirates 123,106 94,183 39,118 7,798 42,228 23,566 7,956 Yemen 1,356 1,062 429 159 454 103 3 Zambia 2,002 1,222 437 40 439 140 152 Zimbabwe 813 775 553 2 217 27 462 Residual 56 55 38 1 5 19 –
Asia & Pacific 1,283,678 797,116 423,531 47,579 232,066 291,227 87,726 Afghanistan 411 403 96 13 293 19 6 Armenia 541 420 157 40 205 141 62 Azerbaijan 3,375 3,374 972 590 1,763 876 250 Bangladesh 4,859 2,375 1,731 38 563 549 163 Bhutan 58 58 4 – 54 – 56 British Overseas Territories 413 413 129 4 161 1 – Brunei 2,269 625 461 30 116 80 78 Cambodia 272 271 127 38 99 39 3 China 262,028 191,768 118,342 9,154 35,657 88,445 14,592 Chinese Taipei 97,810 40,860 28,219 781 5,332 11,995 6,337 Fiji 1,374 40 23 3 14 5 24 French Polynesia 4,068 2,580 353 187 1,764 1,365 84 Georgia 1,002 914 322 263 275 239 56 India 222,550 147,415 68,621 7,618 54,441 52,147 7,406 Indonesia 71,228 50,275 27,037 2,554 17,135 6,605 12,322 Kazakhstan 13,589 12,625 4,231 1,402 5,853 6,019 366 Kiribati 2 2 – – – – – Kyrgyz Republic 63 63 37 – 25 29 1 Laos 637 637 233 52 331 18 1 Malaysia 102,016 37,045 15,326 2,008 16,468 8,883 5,346 Maldives 962 886 639 27 165 22 78 Marshall Islands 31,989 31,931 6,168 1,360 23,952 5 2 Micronesia – – – – – – – Mongolia 113 113 69 4 39 23 37 Myanmar 1,049 1,049 785 – 264 977 – Nauru – – – – – – – Nepal 271 52 35 5 10 22 – New Caledonia 6,326 3,222 143 232 2,675 1,589 146 North Korea 1,047 1,047 757 247 35 309 335 Pakistan 13,223 4,444 1,639 113 2,390 579 993 Palau 12 8 1 – 7 1 7 Papua New Guinea 1,564 295 103 8 72 3 36 Philippines 24,710 17,879 7,462 973 7,179 3,576 4,912 Solomon Islands 724 590 66 – 524 65 – South Korea 322,900 194,857 113,971 17,697 38,492 91,279 28,486 Sri Lanka 5,179 3,545 1,674 104 1,372 293 1,626 Tajikistan 52 52 15 – 37 22 – Thailand 57,399 21,548 9,923 1,356 6,576 6,818 2,011 Timor Leste 84 84 56 7 19 – – Tonga 166 4 1 – 3 – 3 Turkmenistan 275 275 51 8 162 222 – Tuvalu 15 15 13 – – – – US Pacific Islands 246 246 119 2 128 – – Uzbekistan 673 664 199 87 285 454 21 Vietnam 16,271 12,318 4,979 557 5,750 2,782 1,871 Wallis/Futuna 56 23 – 13 8 – – Residual 9,807 9,806 8,242 4 1,373 4,731 9
Total Maturities Sectors
Table 9A (Cont.)
Consolidated cross-border claims in all currencies and local claims in non-local currencies
A 58 BIS Quarterly Review, December 2009

Table 9A (Cont.)
Sectors Net risk Total foreign End-June 2009Non-bank transfers claims on an
private sector Claims Liabilities ultimate riskbasis Claims vis-à-vis
H L M Q R(=A+L+Q)471 1 – 4 575 Syria776 1,037 834 –196 1,792 Tanzania46 15 – 16 280 Togo
1,746 3,440 1,325 –260 7,816 Tunisia379 341 1,553 –2 860 Uganda
60,772 28,923 24,911 –2,452 120,654 United Arab Emirates956 294 – –169 1,187 Yemen929 780 549 37 2,039 Zambia285 38 100 –98 715 Zimbabwe22 1 – –24 32 Residual
395,422 486,562 365,642 –71,859 1,211,819 Asia & Pacific379 8 20 –102 309 Afghanistan216 121 77 –7 534 Armenia
2,249 1 – –840 2,535 Azerbaijan1,647 2,484 2,409 –632 4,227 Bangladesh
2 – – –44 14 Bhutan413 – – –2 411 British Overseas Territories467 1,644 3,356 –171 2,098 Brunei216 1 – –44 228 Cambodia
75,284 70,260 51,672 –20,611 241,417 China21,087 56,950 41,344 –2,945 94,865 Chinese Taipei
11 1,334 1,196 –2 1,372 Fiji1,132 1,488 1,133 –32 4,036 French Polynesia
620 88 1 –59 943 Georgia83,639 75,135 47,094 –2,498 220,052 India31,002 20,953 18,117 –17,992 53,236 Indonesia6,122 964 831 179 13,768 Kazakhstan
2 – – 35 37 Kiribati33 – – –18 45 Kyrgyz Republic
599 – – –39 598 Laos22,175 64,971 51,907 2,663 104,679 Malaysia
785 76 42 –72 890 Maldives31,822 58 – –3,031 28,958 Marshall Islands
– – – – – Micronesia53 – – 1 114 Mongolia72 – – –10 1,039 Myanmar– – – – – Nauru
31 219 301 –4 267 Nepal1,485 3,104 1,955 –129 6,197 New Caledonia
403 – – –6 1,041 North Korea2,862 8,779 7,572 –1,550 11,673 Pakistan
– 4 4 –7 5 Palau253 1,269 1,814 –52 1,512 Papua New Guinea
9,195 6,831 4,700 –2,655 22,055 Philippines524 134 117 – 724 Solomon Islands
73,483 128,043 93,703 –13,541 309,359 South Korea1,614 1,634 1,051 –263 4,916 Sri Lanka
30 – – –10 42 Tajikistan12,470 35,851 30,694 –7,478 49,921 Thailand
84 – – – 84 Timor Leste1 162 140 – 166 Tonga
52 – – –34 241 Turkmenistan15 – – –10 5 Tuvalu
246 – – –24 222 US Pacific Islands188 9 219 –327 346 Uzbekistan
7,589 3,953 4,115 –4,743 11,528 Vietnam25 33 57 – 56 Wallis/Futuna
4,845 1 1 5,247 15,054 Residual
reporting banks' foreignoffices with local residents
Local currency positions of
BIS Quarterly Review, December 2009 A 59

Total End-June 2009 foreign
claims on a Up to and Over one year Over two Banks Public Sectorcontractual international including one up to two years
Claims vis-à-vis basis claims year yearsA + L A B C D F G
Europe 1,417,132 865,612 307,032 70,548 426,816 162,171 133,523 Albania 6,583 3,176 1,178 248 1,740 234 757 Belarus 3,389 2,778 1,432 212 1,002 1,273 64 Bosnia and Herzegovina 11,473 5,042 1,680 201 2,974 615 196 Bulgaria 43,759 32,278 9,763 2,308 18,807 2,625 4,125 Croatia 82,688 49,044 15,108 5,036 27,346 5,157 7,918 Czech Republic 177,809 37,816 11,318 1,956 19,433 4,985 7,850 Estonia 32,338 27,499 5,932 1,522 17,097 7,378 652 Hungary 152,297 102,175 27,659 7,563 53,635 15,042 21,525 Latvia 34,426 30,726 6,834 2,865 19,142 6,000 2,872 Lithuania 39,507 31,335 7,109 2,340 19,478 7,046 4,174 Macedonia, FYR 2,394 1,619 546 151 846 75 133 Moldova 638 606 200 101 217 247 65 Montenegro 3,623 3,039 981 225 1,780 168 674 Poland 269,389 127,969 28,612 7,205 79,569 12,868 34,083 Romania 118,999 79,169 36,389 7,909 31,860 11,299 12,246 Russia 216,215 174,329 81,168 20,383 64,871 50,277 14,034 Serbia 22,353 15,470 6,388 1,495 6,382 2,313 1,699 Turkey 157,164 114,175 54,021 6,325 48,298 26,337 18,057 Ukraine 40,927 26,438 10,261 2,491 11,982 7,962 2,386 Res. Serbia & Montenegro 130 130 42 – 87 44 5 Residual Europe 1,031 799 411 12 270 226 8
Latin America/Caribbean 944,917 372,024 158,253 29,880 151,629 73,351 68,510 Argentina 34,572 19,616 12,351 1,107 4,986 1,648 5,062 Belize 2,511 2,215 1,787 41 340 6 48 Bolivia 367 358 183 32 138 78 13 Brazil 330,713 123,639 55,675 12,064 37,760 31,613 28,444 Chile 94,027 40,664 17,452 2,859 18,179 10,786 2,223 Colombia 27,333 10,742 4,419 961 4,616 2,008 2,833 Costa Rica 8,976 7,187 2,649 386 3,661 1,723 492 Cuba 1,819 1,740 931 99 593 1,104 200 Dominica 216 101 23 2 53 1 9 Dominican Republic 5,548 4,614 2,159 268 1,928 313 1,922 Ecuador 3,055 2,724 1,692 196 746 384 220 El Salvador 8,438 6,587 1,953 182 4,243 2,227 959 Falkland Islands 61 40 21 1 19 – – Grenada 309 148 41 4 71 – 22 Guatemala 5,040 3,873 1,613 172 2,051 1,420 290 Guyana 1,007 828 338 338 152 – – Haiti 259 177 89 – 86 8 53 Honduras 2,487 1,165 604 81 428 387 84 Jamaica 6,067 3,787 846 238 1,651 486 1,409 Mexico 318,950 93,307 32,982 7,215 49,754 13,333 13,582 Nicaragua 695 569 239 30 300 116 30 Paraguay 2,230 1,438 950 112 143 319 155 Peru 30,336 21,732 9,973 1,885 8,243 4,018 4,301 St. Lucia 1,941 1,548 404 120 395 190 170 St. Vincent 901 803 458 25 274 3 21 Surinam 376 376 15 1 24 106 25 Trinidad and Tobago 9,507 3,919 1,223 111 2,528 138 559 Turks and Caicos 999 622 221 71 277 7 33 Uruguay 7,065 6,044 3,278 233 2,207 501 1,766 Venezuela 35,124 7,473 2,497 570 3,461 387 3,582 Residual 3,988 3,988 1,187 476 2,322 41 3
Int. organisations 70,997 70,674 11,201 3,812 27,066 8,356 58,933 Unallocated 14,910 14,870 8,316 579 3,924 2,572 284
Total Maturities Sectors
Table 9A (Cont.)
Consolidated cross-border claims in all currencies and local claims in non-local currencies
A 60 BIS Quarterly Review, December 2009
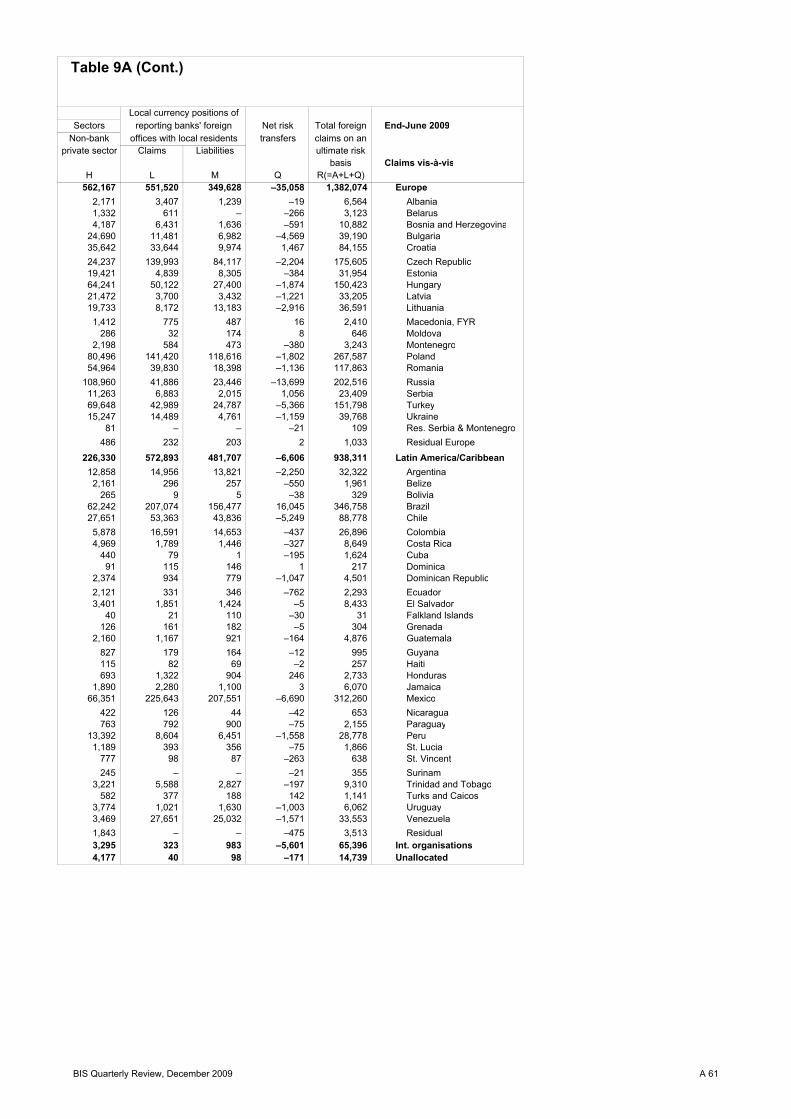
Table 9A (Cont.)
Sectors Net risk Total foreign End-June 2009Non-bank transfers claims on an
private sector Claims Liabilities ultimate riskbasis Claims vis-à-vis
H L M Q R(=A+L+Q)562,167 551,520 349,628 –35,058 1,382,074 Europe
2,171 3,407 1,239 –19 6,564 Albania1,332 611 – –266 3,123 Belarus4,187 6,431 1,636 –591 10,882 Bosnia and Herzegovina
24,690 11,481 6,982 –4,569 39,190 Bulgaria35,642 33,644 9,974 1,467 84,155 Croatia24,237 139,993 84,117 –2,204 175,605 Czech Republic19,421 4,839 8,305 –384 31,954 Estonia64,241 50,122 27,400 –1,874 150,423 Hungary21,472 3,700 3,432 –1,221 33,205 Latvia19,733 8,172 13,183 –2,916 36,591 Lithuania1,412 775 487 16 2,410 Macedonia, FYR
286 32 174 8 646 Moldova2,198 584 473 –380 3,243 Montenegro
80,496 141,420 118,616 –1,802 267,587 Poland54,964 39,830 18,398 –1,136 117,863 Romania
108,960 41,886 23,446 –13,699 202,516 Russia11,263 6,883 2,015 1,056 23,409 Serbia69,648 42,989 24,787 –5,366 151,798 Turkey15,247 14,489 4,761 –1,159 39,768 Ukraine
81 – – –21 109 Res. Serbia & Montenegro486 232 203 2 1,033 Residual Europe
226,330 572,893 481,707 –6,606 938,311 Latin America/Caribbean12,858 14,956 13,821 –2,250 32,322 Argentina2,161 296 257 –550 1,961 Belize
265 9 5 –38 329 Bolivia62,242 207,074 156,477 16,045 346,758 Brazil27,651 53,363 43,836 –5,249 88,778 Chile5,878 16,591 14,653 –437 26,896 Colombia4,969 1,789 1,446 –327 8,649 Costa Rica
440 79 1 –195 1,624 Cuba91 115 146 1 217 Dominica
2,374 934 779 –1,047 4,501 Dominican Republic2,121 331 346 –762 2,293 Ecuador3,401 1,851 1,424 –5 8,433 El Salvador
40 21 110 –30 31 Falkland Islands126 161 182 –5 304 Grenada
2,160 1,167 921 –164 4,876 Guatemala827 179 164 –12 995 Guyana115 82 69 –2 257 Haiti693 1,322 904 246 2,733 Honduras
1,890 2,280 1,100 3 6,070 Jamaica66,351 225,643 207,551 –6,690 312,260 Mexico
422 126 44 –42 653 Nicaragua763 792 900 –75 2,155 Paraguay
13,392 8,604 6,451 –1,558 28,778 Peru1,189 393 356 –75 1,866 St. Lucia
777 98 87 –263 638 St. Vincent245 – – –21 355 Surinam
3,221 5,588 2,827 –197 9,310 Trinidad and Tobago582 377 188 142 1,141 Turks and Caicos
3,774 1,021 1,630 –1,003 6,062 Uruguay3,469 27,651 25,032 –1,571 33,553 Venezuela1,843 – – –475 3,513 Residual3,295 323 983 –5,601 65,396 Int. organisations4,177 40 98 –171 14,739 Unallocated
reporting banks' foreignoffices with local residents
Local currency positions of
BIS Quarterly Review, December 2009 A 61

Table 9B: Consolidated foreign claims of reporting banks - immediate borrower basisOn individual countries by nationality of reporting banks / Amounts outstandingIn millions of US dollarsEnd-June 2009 Total
foreign Australia Austria Belgium Canada France Germany Ireland ItalyClaims vis-à-vis claimsAll countries 31,168,185 465,518 493,790 855,786 693,361 3,566,919 3,462,130 658,675 1,000,118 Developed countries 24,729,033 425,744 242,597 696,537 568,766 2,972,772 2,869,446 594,613 762,761
Europe 16,482,663 167,811 218,276 571,284 136,525 2,005,404 2,119,644 454,225 699,997 Austria 331,397 182 . 8,640 1,052 26,046 103,710 6,278 117,354 Andorra 2,417 ... ... 5 – 346 63 ... 10 Belgium 535,735 2,302 2,384 . 3,756 116,011 38,575 5,744 9,191 Cyprus 51,849 3 2,437 383 ... 3,489 11,138 ... 1,967 Denmark 340,123 723 2,876 4,707 1,705 23,086 53,343 4,391 3,703 Finland 217,302 476 1,101 2,944 ... 6,940 14,143 ... 1,394 France 1,742,775 ... 11,341 91,287 ... . 198,649 21,865 37,530 Germany 2,173,571 ... 50,166 55,729 ... 270,918 . 39,968 300,390 Greece 280,949 29 4,881 6,283 ... 72,998 38,572 8,467 7,786 Iceland 27,651 9 648 1,001 ... 1,667 9,255 877 1,038 Ireland 887,464 ... 6,835 72,354 ... 71,473 183,885 . 22,759 Italy 1,438,396 ... 17,880 45,143 ... 483,340 202,598 46,344 . Liechtenstein 7,108 ... 669 128 – 531 1,614 ... 187 Luxembourg 638,499 1,098 8,273 24,998 ... 109,334 151,162 7,834 33,127 Malta 18,212 ... 2,288 321 132 868 2,727 ... 710 Netherlands 1,162,556 5,128 16,027 81,030 ... 126,290 159,520 16,404 29,022 Norway 300,115 245 1,882 1,098 1,883 20,455 35,284 2,322 3,466 Portugal 272,232 63 2,679 8,221 452 33,957 44,581 5,445 6,771 Slovakia 73,721 – 29,121 9,367 ... 5,401 3,722 ... 17,820 Slovenia 39,335 – 9,724 1,340 ... 3,452 12,302 ... 8,234 Spain 1,154,465 1,013 7,976 43,473 ... 191,442 237,688 31,890 31,958 Sweden 271,583 404 2,124 2,667 1,771 17,069 39,593 4,451 2,479 Switzerland 652,402 2,019 11,275 7,819 ... 54,446 61,912 2,510 11,400 United Kingdom 3,860,551 132,990 25,566 102,345 68,553 365,821 515,172 243,371 51,148 Vatican 386 – ... – – ... – ... ... Other 1,869 – 123 1 – 24 436 ... 553
Other developed countries 8,246,370 255,199 24,321 125,253 419,014 967,368 749,802 140,388 55,405 Australia 582,673 . 2,565 7,598 ... 42,581 53,967 8,392 2,998 Canada 535,202 ... 1,595 6,212 . 30,456 40,006 11,855 2,614 Japan 1,077,996 2,690 544 2,376 4,157 211,484 54,902 15,758 ... New Zealand 240,239 208,517 119 133 621 1,629 3,132 358 97 United States 5,809,265 40,026 19,498 108,934 414,236 681,218 597,795 104,025 49,696
Offshore centres 2,124,892 16,182 11,750 23,534 43,032 161,459 207,954 21,962 22,417 Aruba 1,188 – 28 1 ... 48 – ... 37 Bahamas 51,614 ... 41 36 ... 690 6,217 ... ... Bahrain 31,929 17 744 333 304 4,466 3,431 ... 698 Barbados 6,795 ... ... 46 ... 277 597 ... 36 Bermuda 80,417 433 175 1,990 587 8,183 7,563 ... 1,362 Cayman Islands 790,787 224 4,250 7,512 ... 65,024 82,254 ... 7,273 Gibraltar 7,356 ... 79 6 – 412 745 ... 108 Guernsey 43,634 ... 624 130 ... 1,762 6,632 ... 826 Hong Kong SAR 428,091 7,452 1,876 3,381 4,151 24,677 12,970 ... 1,292 Isle of Man 39,806 ... 280 147 ... 730 5,307 ... 869 Jersey 142,457 118 1,504 2,258 ... 15,562 34,582 ... 3,976 Lebanon 5,619 – ... 27 ... 1,432 111 ... 230 Macau SAR 15,669 222 ... 115 ... 417 505 ... 101 Mauritius 14,102 4 24 23 ... 1,659 3,888 ... 78 Netherlands Antilles 27,889 ... 145 263 ... 1,205 1,283 ... 363 Panama 73,635 10 93 814 ... 5,583 6,098 ... 1,383 Samoa 1,758 ... ... – – 84 8 ... ... Singapore 260,612 6,417 1,434 5,659 ... 21,588 24,295 ... 1,857 Vanuatu 352 276 ... – – 18 20 ... ... West Indies UK 101,182 42 403 793 ... 7,642 11,448 ... 1,226
A 62 BIS Quarterly Review, December 2009

Table 9B (Cont.)
End-June 2009Japan Nether- Portugal Spain Sweden Switzer- United United European
lands land Kingdom States banks Claims vis-à-vis2,383,322 1,636,695 155,696 1,335,904 704,037 1,814,142 3,689,179 2,576,936 20,018,034 All countries1,793,047 1,365,999 113,727 912,710 565,016 1,498,697 2,580,176 1,775,192 15,692,365 Developed countries
806,583 947,617 104,007 710,231 520,042 649,921 1,082,770 1,318,278 10,553,046 Europe6,236 8,756 521 4,765 1,535 11,056 7,590 8,981 299,595 Austria
... 37 37 1,798 2 120 –21 ... 2,403 Andorra28,415 152,258 1,002 9,640 3,440 12,278 37,871 34,691 410,477 Belgium
... 1,918 177 78 1,574 4,183 3,351 681 41,177 Cyprus10,232 11,429 1,254 2,273 123,990 9,900 9,642 17,694 258,278 Denmark6,750 3,606 1,117 3,547 107,346 2,128 8,614 7,401 197,620 Finland
98,739 87,436 7,482 43,389 8,132 70,540 250,269 108,297 855,360 France143,613 173,513 4,586 46,803 78,548 78,152 153,655 208,514 1,298,132 Germany
7,027 11,114 8,970 1,170 846 59,103 12,639 14,125 235,346 Greece347 635 251 465 197 536 702 585 18,291 Iceland
29,233 33,134 18,460 13,923 5,829 14,964 184,360 59,389 654,210 Ireland51,197 71,996 3,817 50,706 3,077 16,786 76,979 50,710 1,032,405 Italy
... 729 4 5 16 ... 609 ... 6,103 Liechtenstein80,185 24,936 3,760 12,874 5,258 55,504 35,605 35,670 480,758 Luxembourg
... 759 349 71 79 522 ... 210 17,391 Malta51,700 . 10,721 21,345 9,299 38,768 92,196 87,850 619,711 Netherlands11,531 6,549 439 5,048 122,480 14,885 9,272 20,085 258,512 Norway3,225 11,182 . 83,530 499 3,503 24,155 4,238 226,899 Portugal
97 1,185 91 143 286 77 ... 1,893 68,110 Slovakia306 509 26 50 2 102 188 675 37,444 Slovenia
26,871 124,384 27,889 . 6,287 13,285 123,670 50,184 857,473 Spain14,690 6,400 372 2,210 . 7,330 14,803 19,554 174,209 Sweden20,968 18,121 2,091 6,643 5,002 . 30,431 34,633 218,470 Switzerland
215,221 197,020 10,591 399,755 35,847 236,131 . 552,218 2,282,444 United Kingdom... – ... – 386 – – ... 386 Vatican... 11 ... – 85 68 2 ... 1,842 Other
986,464 418,382 9,720 202,479 44,974 848,776 1,490,461 456,914 5,139,319 Other developed countries68,990 84,334 528 4,161 2,736 23,221 106,430 72,140 347,971 Australia45,518 39,998 216 2,567 1,685 22,316 77,115 107,714 239,183 Canada
. 20,328 27 1,093 322 104,763 97,516 272,077 517,820 Japan4,534 6,521 12 128 201 515 ... 3,991 19,973 New Zealand
867,422 267,201 8,937 194,530 40,030 697,961 1,209,400 . 4,014,372 United States
389,019 55,149 10,346 23,434 19,408 163,098 495,143 262,780 1,241,559 Offshore centres... 60 ... 80 – 155 13 ... 432 Aruba
1,203 480 330 442 312 11,501 2,189 15,437 23,231 Bahamas1,411 373 1 14 4 502 10,821 1,618 23,426 Bahrain
... 137 1 6 2 39 336 471 1,560 Barbados14,672 3,148 153 648 4,417 6,757 ... 13,990 47,910 Bermuda
223,662 13,008 5,547 11,765 8,656 75,405 78,545 139,244 373,138 Cayman Islands... 266 206 204 442 468 3,327 112 7,006 Gibraltar
4,511 1,783 8 718 121 9,362 13,349 ... 37,507 Guernsey39,820 10,378 385 2,978 1,078 8,110 222,419 33,791 290,256 Hong Kong SAR1,522 974 14 584 238 564 18,250 ... 36,680 Isle of Man
16,551 3,119 130 1,648 1,023 7,365 44,291 ... 121,471 Jersey35 71 ... 8 2 1,241 1,288 494 4,595 Lebanon... 29 1,968 2 – 16 1,922 622 5,128 Macau SAR... 347 74 304 8 518 4,134 1,451 11,279 Mauritius
5,809 2,386 72 450 57 447 3,756 7,765 10,598 Netherlands Antilles31,930 812 524 2,276 186 5,992 ... 2,681 32,555 Panama
... 33 ... – – 311 21 90 457 Samoa47,893 13,341 17 341 2,395 11,594 57,244 31,424 144,602 Singapore
... – ... 1 – 4 7 – 50 Vanuatu
... 4,404 916 965 467 22,747 16,932 13,590 69,678 West Indies UK
BIS Quarterly Review, December 2009 A 63

Table 9B (Cont.)
End-June 2009 Totalforeign Australia Austria Belgium Canada France Germany Ireland Italy
Claims vis-à-vis claimsDeveloping countries 4,228,353 17,401 238,267 134,147 78,377 427,608 367,644 36,848 208,310
Africa & Middle East 582,626 1,369 6,730 7,645 2,187 123,312 52,338 1,271 13,368 Algeria 7,859 – 19 308 – 4,848 128 ... 171 Angola 6,954 – ... 39 ... 647 1,218 ... 3 Benin 159 – ... 7 – 123 2 ... ... Botswana 2,430 ... ... – – 1 21 ... ... Burkina Faso 867 ... ... 2 – 675 – ... 3 Burundi 45 – ... 3 – 30 – ... ... Cameroon 2,869 – 5 20 – 2,022 21 ... 21 Cape Verde 1,029 – ... 2 – 14 4 ... ... Central African Republic 43 – ... – – 7 – ... ... Chad 71 – ... 9 – 45 1 ... ... Comoros Islands 14 – ... – – 12 – ... ... Congo 475 – ... 2 – 400 13 ... ... Congo Democratic Republic 542 – ... 58 – 197 124 ... ... Côte d’Ivoire 6,348 – 100 39 ... 5,063 262 ... 6 Djibouti 345 – ... – – 161 18 ... ... Egypt 41,728 3 471 150 ... 14,694 4,063 ... 5,670 Equatorial Guinea 664 – ... – – 646 – ... ... Eritrea 6 – ... – – ... – ... ... Ethiopia 43 – ... – – 5 1 ... ... Gabon 2,013 – ... 49 – 1,387 99 ... 41 Gambia 77 – ... 1 – 9 1 ... ... Ghana 3,518 – 2 76 – 789 263 ... 69 Guinea 403 – ... – – 378 – ... ... Guinea-Bissau 17 – ... – – 2 – ... ... Iran 15,899 98 311 839 ... 4,534 2,355 ... 979 Iraq 2,122 – 599 6 – 64 881 ... 5 Israel 15,786 1 117 122 268 2,961 2,200 ... 120 Jordan 3,295 – 8 14 ... 245 165 ... 41 Kenya 3,838 1 18 65 ... 398 150 ... 13 Kuwait 17,911 ... 455 396 ... 2,583 2,181 ... 351 Lesotho 20 – ... – – 3 – ... ... Liberia 30,830 – ... 638 ... 2,888 6,505 ... 933 Libya 8,331 – 1 7 ... 7,975 47 ... 15 Madagascar 1,062 – ... 6 – 981 – ... ... Malawi 44 – ... – – 8 1 ... ... Mali 340 – ... 3 – 284 8 ... 4 Mauritania 238 – ... 12 – 158 – ... ... Morocco 27,097 – 27 63 – 22,778 647 ... 37 Mozambique 2,933 – ... 14 – 190 54 ... 7 Namibia 546 – ... 16 – 42 164 ... 33 Niger 181 – ... 4 – 31 4 ... ... Nigeria 8,077 – 11 70 ... 1,151 709 ... 20 Oman 10,304 83 202 166 ... 1,622 1,227 ... 292 Palestinian Territory 63 – ... – – ... – ... ... Qatar 50,767 176 767 1,056 143 7,824 3,672 ... 1,070 Rwanda 21 – ... 4 – 2 1 ... ... Sao Tomé and Principe 39 – ... – – ... – ... ... Saudi Arabia 43,573 140 667 1,278 ... 9,358 4,878 ... 695 Senegal 2,661 ... ... 6 – 2,292 3 ... 2 Seychelles 1,642 – 9 – – 510 75 ... 12 Sierra Leone 195 – ... 122 – ... 3 ... ... Somalia 89 – ... ... – 88 – ... ... South Africa 116,610 151 723 356 486 3,715 8,242 ... 388 St. Helena 5 – ... ... – ... – ... ... Sudan 423 – ... – – 256 3 ... 9 Swaziland 71 – 2 – – 6 20 ... 9
A 64 BIS Quarterly Review, December 2009
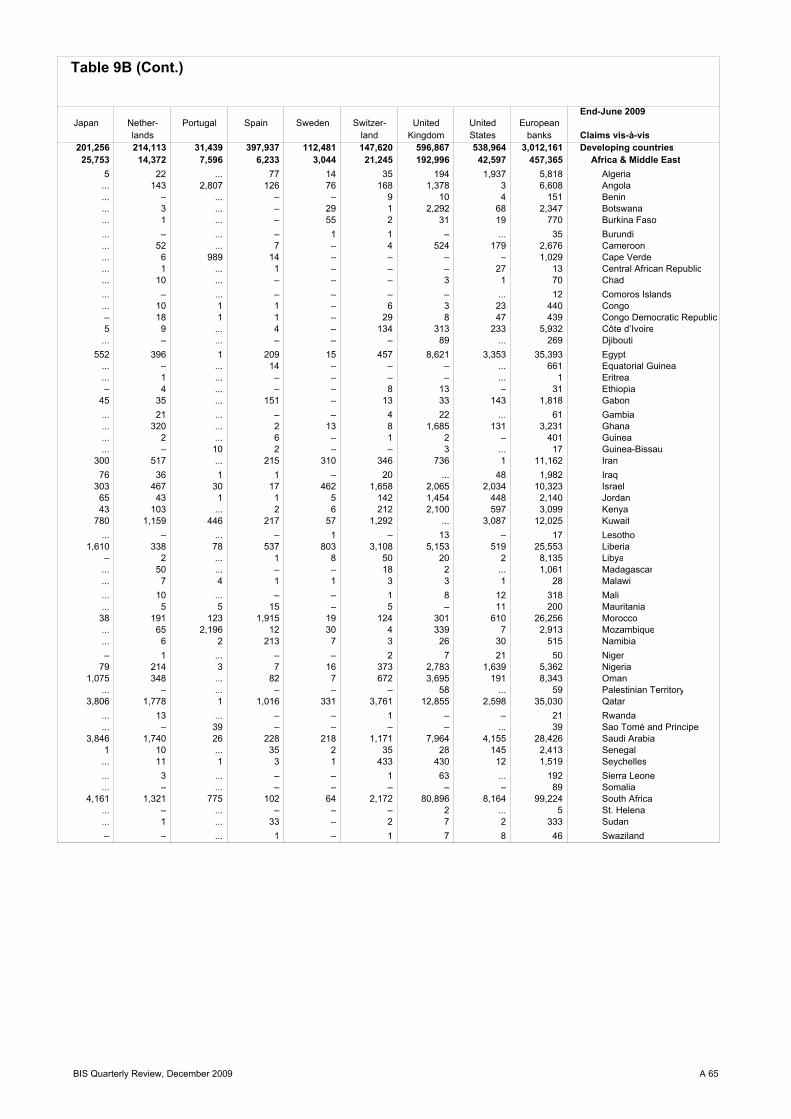
Table 9B (Cont.)
End-June 2009Japan Nether- Portugal Spain Sweden Switzer- United United European
lands land Kingdom States banks Claims vis-à-vis201,256 214,113 31,439 397,937 112,481 147,620 596,867 538,964 3,012,161 Developing countries25,753 14,372 7,596 6,233 3,044 21,245 192,996 42,597 457,365 Africa & Middle East
5 22 ... 77 14 35 194 1,937 5,818 Algeria... 143 2,807 126 76 168 1,378 3 6,608 Angola... – ... – – 9 10 4 151 Benin... 3 ... – 29 1 2,292 68 2,347 Botswana... 1 ... – 55 2 31 19 770 Burkina Faso... – ... – 1 1 – ... 35 Burundi... 52 ... 7 – 4 524 179 2,676 Cameroon... 6 989 14 – – – – 1,029 Cape Verde... 1 ... 1 – – – 27 13 Central African Republic... 10 ... – – – 3 1 70 Chad... – ... – – – – ... 12 Comoros Islands... 10 1 1 – 6 3 23 440 Congo– 18 1 1 – 29 8 47 439 Congo Democratic Republic5 9 ... 4 – 134 313 233 5,932 Côte d’Ivoire... – ... – – – 89 ... 269 Djibouti
552 396 1 209 15 457 8,621 3,353 35,393 Egypt... – ... 14 – – – ... 661 Equatorial Guinea... 1 ... – – – – ... 1 Eritrea– 4 ... – – 8 13 – 31 Ethiopia
45 35 ... 151 – 13 33 143 1,818 Gabon... 21 ... – – 4 22 ... 61 Gambia... 320 ... 2 13 8 1,685 131 3,231 Ghana... 2 ... 6 – 1 2 – 401 Guinea... – 10 2 – – 3 ... 17 Guinea-Bissau
300 517 ... 215 310 346 736 1 11,162 Iran76 36 1 1 – 20 ... 48 1,982 Iraq
303 467 30 17 462 1,658 2,065 2,034 10,323 Israel65 43 1 1 5 142 1,454 448 2,140 Jordan43 103 ... 2 6 212 2,100 597 3,099 Kenya
780 1,159 446 217 57 1,292 ... 3,087 12,025 Kuwait... – ... – 1 – 13 – 17 Lesotho
1,610 338 78 537 803 3,108 5,153 519 25,553 Liberia– 2 ... 1 8 50 20 2 8,135 Libya... 50 ... – – 18 2 ... 1,061 Madagascar... 7 4 1 1 3 3 1 28 Malawi... 10 ... – – 1 8 12 318 Mali... 5 5 15 – 5 – 11 200 Mauritania38 191 123 1,915 19 124 301 610 26,256 Morocco... 65 2,196 12 30 4 339 7 2,913 Mozambique... 6 2 213 7 3 26 30 515 Namibia– 1 ... – – 2 7 21 50 Niger
79 214 3 7 16 373 2,783 1,639 5,362 Nigeria1,075 348 ... 82 7 672 3,695 191 8,343 Oman
... – ... – – – 58 ... 59 Palestinian Territory3,806 1,778 1 1,016 331 3,761 12,855 2,598 35,030 Qatar
... 13 ... – – 1 – – 21 Rwanda
... – 39 – – – – ... 39 Sao Tomé and Principe3,846 1,740 26 228 218 1,171 7,964 4,155 28,426 Saudi Arabia
1 10 ... 35 2 35 28 145 2,413 Senegal... 11 1 3 1 433 430 12 1,519 Seychelles... 3 ... – – 1 63 ... 192 Sierra Leone... – ... – – – – – 89 Somalia
4,161 1,321 775 102 64 2,172 80,896 8,164 99,224 South Africa... – ... – – – 2 ... 5 St. Helena... 1 ... 33 – 2 7 2 333 Sudan– – ... 1 – 1 7 8 46 Swaziland
BIS Quarterly Review, December 2009 A 65

Table 9B (Cont.)
End-June 2009 Totalforeign Australia Austria Belgium Canada France Germany Ireland Italy
Claims vis-à-vis claimsSyria 571 – 2 – – 102 82 ... ... Tanzania 1,988 – ... 4 – 79 5 ... 9 Togo 264 – ... 4 – 207 27 ... ... Tunisia 8,076 – 239 192 – 5,461 559 ... 128 Uganda 862 – ... 14 – 87 5 ... 14 United Arab Emirates 123,106 595 1,906 1,394 685 11,304 10,641 ... ... Yemen 1,356 – 7 1 – 886 18 ... ... Zambia 2,002 1 ... 5 – 63 34 ... ... Zimbabwe 813 1 ... 3 – 21 533 ... ... Residual 56 119 ... ... – ... – ... ...
Asia & Pacific 1,283,678 15,133 6,807 12,004 13,612 100,999 91,208 3,817 10,311 Afghanistan 411 ... 1 1 – 43 1 ... ... Armenia 541 – 10 3 – 85 74 ... ... Azerbaijan 3,375 – 130 70 – 1,168 645 ... 27 Bangladesh 4,859 – ... 23 ... 62 165 ... 22 Bhutan 58 – ... – – ... – ... ... British Overseas Territories 413 – ... ... ... 25 1 ... ... Brunei 2,269 6 ... 18 ... 19 3 ... ... Cambodia 272 ... ... 6 ... 40 3 ... ... China 262,028 ... 1,777 4,462 ... 18,045 14,527 ... 2,389 Chinese Taipei 97,810 ... 4 745 ... 7,006 4,026 ... 29 Fiji 1,374 ... ... 1 – 1 1 ... ... French Polynesia 4,068 ... ... 13 – 3,916 1 ... ... Georgia 1,002 – 1 6 – 427 114 ... 3 India 222,550 1,463 749 1,395 ... 11,952 19,117 ... 1,935 Indonesia 71,228 ... 743 228 321 2,244 7,215 ... 1,260 Kazakhstan 13,589 – 449 276 113 1,342 1,889 ... 848 Kiribati 2 – ... ... – ... – ... ... Kyrgyz Republic 63 ... ... – – 16 7 ... ... Laos 637 ... ... 137 – 133 36 ... ... Malaysia 102,016 116 349 445 ... 2,334 4,432 ... 248 Maldives 962 – ... 10 – 81 78 ... ... Marshall Islands 31,989 – ... 1,177 ... 3,579 10,065 ... 1,310 Micronesia – – ... – – ... – ... ... Mongolia 113 – 3 – – ... 50 ... ... Myanmar 1,049 – ... – – 6 988 ... ... Nauru – – ... ... – ... – ... ... Nepal 271 – ... – – 3 – ... ... New Caledonia 6,326 3 ... 1 – 6,314 – ... ... North Korea 1,047 ... ... ... – 998 18 ... ... Pakistan 13,223 ... 44 6 ... 189 485 ... 29 Palau 12 – ... ... – ... – ... ... Papua New Guinea 1,564 ... ... – ... 4 10 ... ... Philippines 24,710 ... 187 111 201 2,392 2,205 ... 401 Solomon Islands 724 ... ... ... – ... – ... ... South Korea 322,900 ... 1,507 2,306 ... 31,499 18,404 ... 1,320 Sri Lanka 5,179 79 8 17 ... 168 751 ... 102 Tajikistan 52 – ... 1 – ... 14 ... 25 Thailand 57,399 72 144 343 ... 3,161 4,437 ... 77 Timor Leste 84 – ... ... – ... – ... ... Tonga 166 ... ... ... – ... 3 ... ... Turkmenistan 275 – ... ... – ... 175 ... ... Tuvalu 15 – ... ... – ... – ... ... US Pacific Islands 246 – ... ... ... ... – ... ... Uzbekistan 673 – 4 – – 168 187 ... 51 Vietnam 16,271 802 549 203 ... 3,530 1,081 ... 178 Wallis/Futuna 56 – ... ... – 49 – ... ... Residual 9,807 6,216 ... ... – ... – ... ...
A 66 BIS Quarterly Review, December 2009

Table 9B (Cont.)
End-June 2009Japan Nether- Portugal Spain Sweden Switzer- United United European
lands land Kingdom States banks Claims vis-à-vis– 7 ... 2 6 43 13 – 289 Syria1 133 ... 1 76 13 1,286 337 1,636 Tanzania... – ... – – 8 2 – 263 Togo... 63 ... 69 75 64 124 555 7,181 Tunisia... 30 ... – 65 2 354 249 585 Uganda
8,961 4,461 55 890 267 4,559 50,200 10,621 88,624 United Arab Emirates1 90 ... 1 4 6 247 12 1,264 Yemen– 91 ... – – 54 1,362 292 1,611 Zambia... 4 1 1 – 6 239 – 809 Zimbabwe... – ... – ... – 2 21 2 Residual
126,521 68,703 480 5,522 7,230 54,998 269,681 258,379 640,462 Asia & Pacific... 3 ... – – – 11 300 61 Afghanistan– – ... 3 – 7 ... – 484 Armenia
180 310 11 – – 259 43 307 2,784 Azerbaijan... 98 ... 5 68 41 3,204 727 3,745 Bangladesh... – ... – 12 – 2 ... 58 Bhutan... – 1 1 – – 10 ... 366 British Overseas Territories... 7 ... – – 6 1,764 123 1,823 Brunei... 33 ... 1 4 – 10 2 98 Cambodia
31,603 12,838 55 3,311 1,665 10,252 44,784 47,310 114,660 China8,189 5,524 3 43 25 7,992 26,136 25,972 51,585 Chinese Taipei
– – ... – – – – 3 3 Fiji... 3 ... 2 – 96 30 3 4,064 French Polynesia9 107 ... 2 1 97 56 57 875 Georgia
11,501 19,078 104 736 1,036 5,076 47,232 57,816 109,099 India10,092 5,098 17 68 465 5,637 10,162 8,621 33,383 Indonesia
829 2,028 83 130 170 978 ... 1,319 10,074 Kazakhstan... – ... – – – 2 ... 2 Kiribati– 2 ... 25 – 1 – ... 61 Kyrgyz Republic
52 33 ... – 1 – 25 1 371 Laos8,753 1,808 ... 21 425 1,782 28,183 14,374 40,423 Malaysia
... 28 ... 1 1 1 ... 3 454 Maldives
... 561 16 80 969 2,214 5,237 ... 30,226 Marshall Islands
... – ... – – – – ... – Micronesia
... 13 ... 5 2 5 2 – 80 Mongolia– – ... 1 – – 2 ... 998 Myanmar... – ... – – – – ... – Nauru1 10 ... – – 3 240 2 259 Nepal... – ... – – 2 ... 2 6,321 New Caledonia– 18 ... – – – 2 ... 1,036 North Korea
211 2,085 10 4 1,035 2,662 4,525 1,484 11,364 Pakistan... – ... – – – – ... – Palau73 – ... – – 27 8 45 49 Papua New Guinea
3,344 1,549 ... 34 721 980 3,597 5,281 12,606 Philippines... – ... – – – – ... – Solomon Islands
31,041 15,272 19 1,037 250 15,331 78,130 81,504 168,749 South Korea10 179 ... 1 156 67 2,455 295 3,950 Sri Lanka– 10 ... – – – – 2 50 Tajikistan
18,094 1,785 ... 4 95 1,118 9,210 7,188 20,544 Thailand... – 82 – – – 2 ... 84 Timor Leste... – ... – – – – ... 3 Tonga– – ... – 36 – 2 ... 222 Turkmenistan... 3 ... – – – 2 ... 5 Tuvalu... – ... – – – 74 37 78 US Pacific Islands24 42 ... 6 – 20 25 12 535 Uzbekistan
2,515 178 ... 1 93 344 2,378 818 8,695 Vietnam... – ... – – – 7 ... 56 Wallis/Futuna... – 79 – ... – ... 4,771 79 Residual
BIS Quarterly Review, December 2009 A 67

Table 9B (Cont.)
End-June 2009 Totalforeign Australia Austria Belgium Canada France Germany Ireland Italy
Claims vis-à-vis claimsEurope 1,417,132 127 223,700 111,586 1,934 159,706 196,204 30,089 179,247
Albania 6,583 – ... 14 – 707 57 ... 1,177 Belarus 3,389 – 1,764 58 ... 77 771 ... 272 Bosnia and Herzegovina 11,473 – 4,052 9 – 10 3,540 ... 3,664 Bulgaria 43,759 1 5,074 1,899 – 3,759 2,518 ... 8,279 Croatia 82,688 – 24,683 423 ... 6,547 16,936 ... 30,321 Czech Republic 177,809 20 55,715 47,406 ... 32,377 11,270 ... 14,487 Estonia 32,338 – 246 82 ... 142 925 ... 495 Hungary 152,297 ... 36,707 18,298 ... 11,599 32,826 ... 26,515 Latvia 34,426 – 564 17 ... 251 3,833 ... 890 Lithuania 39,507 – 262 53 ... 420 3,215 ... 675 Macedonia, FYR 2,394 – 229 1 – ... 259 ... 26 Moldova 638 – 320 6 – 25 38 ... 234 Montenegro 3,623 – 130 14 – 26 1,149 ... 2,230 Poland 269,389 11 13,609 21,384 ... 21,294 51,767 ... 40,253 Romania 118,999 1 42,549 1,087 ... 15,837 3,928 ... 13,313 Russia 216,215 10 18,063 7,138 309 41,995 38,931 ... 24,179 Serbia 22,353 – 5,881 39 – 1,933 2,904 ... 4,739 Turkey 157,164 80 1,005 13,393 1,446 13,824 17,898 ... ... Ukraine 40,927 – 10,252 265 ... 8,883 3,439 ... 2,797 Res. Serbia & Montenegro 130 – ... ... ... ... – ... ... Residual Europe 1,031 4 ... ... – ... – ... ...
Latin America/Caribbean 944,917 772 1,030 2,912 60,644 43,591 27,894 1,671 5,384 Argentina 34,572 103 28 626 ... 2,804 1,766 ... 440 Belize 2,511 – 9 – ... 76 18 ... 15 Bolivia 367 – ... 8 – 32 37 ... 13 Brazil 330,713 156 228 757 ... 20,626 8,150 ... 1,672 Chile 94,027 265 69 361 ... 3,806 5,532 ... 953 Colombia 27,333 ... 9 46 ... 920 697 ... 26 Costa Rica 8,976 ... 2 9 ... 146 167 ... 25 Cuba 1,819 – 28 27 ... 478 191 ... 92 Dominica 216 – ... – ... 14 1 ... ... Dominican Republic 5,548 ... 3 99 ... 476 425 ... 6 Ecuador 3,055 – 2 4 ... 41 106 ... 17 El Salvador 8,438 ... ... 2 ... 13 208 ... 13 Falkland Islands 61 – ... ... – 3 – ... ... Grenada 309 – ... – ... 3 – ... ... Guatemala 5,040 – 10 3 ... 8 135 ... 25 Guyana 1,007 – ... – ... ... – ... ... Haiti 259 – ... – ... 32 – ... ... Honduras 2,487 ... ... 24 ... 36 36 ... 27 Jamaica 6,067 ... 3 9 ... 39 192 ... 22 Mexico 318,950 68 471 558 ... 11,050 6,173 ... 1,566 Nicaragua 695 – ... 17 ... 1 23 ... ... Paraguay 2,230 – ... 3 ... 32 57 ... 4 Peru 30,336 ... 46 117 ... 1,450 1,034 ... 213 St. Lucia 1,941 – ... – ... 194 – ... ... St. Vincent 901 – 6 – ... 65 137 ... 16 Surinam 376 – ... – ... 4 – ... ... Trinidad and Tobago 9,507 – ... 89 ... 175 1,468 ... ... Turks and Caicos 999 – 6 – ... ... 3 ... ... Uruguay 7,065 1 25 4 ... 208 530 ... 19 Venezuela 35,124 48 19 149 ... 859 808 ... 218 Residual 3,988 131 ... ... – ... – ... ...
Int. organisations 70,997 733 1,176 1,568 2,964 5,080 17,017 ... 5,573 Unallocated 14,910 ... ... ... ... ... 69 ... 1,057
A 68 BIS Quarterly Review, December 2009

Table 9B (Cont.)
End-June 2009Japan Nether- Portugal Spain Sweden Switzer- United United European
lands land Kingdom States banks Claims vis-à-vis23,258 95,336 15,323 10,946 99,866 44,192 36,239 55,657 1,283,690 Europe
– 9 ... – – 7 8 3 6,475 Albania3 65 ... 49 8 129 – 1 3,238 Belarus... 87 ... 1 8 12 5 10 11,423 Bosnia and Herzegovina
110 568 3 80 3 6,384 275 1,961 39,010 Bulgaria544 196 10 45 7 82 331 486 80,652 Croatia
1,013 5,621 10 751 57 304 2,215 3,443 172,152 Czech Republic– 18 ... 18 28,203 12 13 32 32,143 Estonia
2,037 5,660 348 1,278 256 544 ... 3,095 141,070 Hungary82 7 7 28 22,339 27 137 1,010 32,764 Latvia– 120 12 7 27,659 310 30 57 39,161 Lithuania... 8 ... 4 – 11 – 9 2,316 Macedonia, FYR– 5 2 3 – 2 – – 638 Moldova... 18 ... – – 15 – ... 3,594 Montenegro
4,843 33,811 13,330 4,637 7,648 7,998 ... 12,627 246,801 Poland77 9,691 562 274 72 6,768 175 1,284 113,949 Romania
11,008 16,441 286 3,342 9,811 8,713 10,278 13,144 181,549 Russia64 80 7 8 14 1,983 25 ... 22,088 Serbia
3,123 20,483 686 347 300 5,419 ... 17,198 114,843 Turkey354 2,448 57 74 3,481 5,472 502 1,174 38,814 Ukraine
... ... ... ... – ... ... 123 6 Res. Serbia & Montenegro
... – 3 – ... – ... ... 1,004 Residual Europe
25,724 35,702 8,040 375,236 2,341 27,185 97,951 182,331 630,644 Latin America/Caribbean259 2,250 120 13,108 14 845 ... 5,545 26,455 Argentina
... 182 843 10 15 416 163 4 1,868 Belize– 68 ... 113 10 25 12 28 318 Bolivia
15,318 12,363 5,943 129,427 737 16,791 49,687 51,087 246,798 Brazil1,342 5,457 114 48,460 494 337 ... 7,126 70,741 Chile
898 673 11 12,758 96 230 ... 6,016 16,902 Colombia57 79 9 349 42 163 ... 1,670 2,380 Costa Rica26 93 12 419 26 – 12 ... 1,388 Cuba... 1 ... 35 – 3 – ... 56 Dominica... 247 13 354 84 81 161 951 2,010 Dominican Republic92 38 49 452 2 138 487 990 1,358 Ecuador... 25 4 47 5 58 ... 2,695 2,266 El Salvador... – ... 30 – – 28 – 61 Falkland Islands... 4 ... – – 10 8 – 25 Grenada... 31 2 98 10 449 171 2,398 942 Guatemala... 51 ... – – 1 2 44 54 Guyana... – ... 3 – – 8 105 43 Haiti... 87 1 11 27 10 ... 815 1,377 Honduras16 44 2 7 1 112 79 685 562 Jamaica
5,648 12,719 190 128,449 577 5,570 29,529 94,315 197,676 Mexico– 39 6 6 2 4 ... 293 168 Nicaragua... 68 14 865 – 37 ... 299 1,403 Paraguay
1,193 297 9 10,837 32 466 ... 2,832 15,800 Peru... 86 ... – – 17 77 ... 391 St. Lucia... 21 ... – 1 194 53 ... 533 St. Vincent... 29 2 – – – – 1 38 Surinam77 94 1 37 – 97 293 494 2,280 Trinidad and Tobago... 3 ... 1 1 76 94 ... 193 Turks and Caicos
238 178 28 2,989 139 194 685 489 5,107 Uruguay560 475 196 26,371 26 861 553 3,277 30,586 Venezuela
... – 471 – ... – ... 172 865 Residual
... 1,434 174 1,763 100 4,727 16,916 ... 63,262 Int. organisations
... – 10 60 7,032 – 77 ... 8,687 Unallocated
BIS Quarterly Review, December 2009 A 69

Table 9C: Consolidated foreign claims and other exposures of reporting banks - ultimate risk basisOn individual countries by sector and type / Amounts outstandingIn millions of US dollarsEnd-June 2009
Total of whichClaims vis-à-vis of 24 Banks Public sector Non-bank cross-border Derivatives Guarantees Credit
countries private sector claims contracts extended commitmentsS F G H T V W X
All countries 25,680,267 6,212,539 4,492,465 14,777,762 13,756,790 4,717,878 9,129,459 3,915,810 Developed countries 20,165,456 5,345,394 3,519,024 11,143,673 10,960,622 4,289,166 7,874,985 2,894,075 Europe 12,684,467 3,904,975 2,195,262 6,483,382 7,721,677 2,771,145 5,714,124 1,650,947
Austria 315,398 120,718 68,475 125,915 139,189 36,446 54,818 36,239 Andorra 1,908 318 63 1,526 1,155 43 95 356 Belgium 467,083 182,900 80,020 202,974 306,611 72,957 51,942 54,258 Cyprus 38,974 3,466 2,277 33,192 27,829 2,189 2,920 7,426 Denmark 291,533 139,572 27,162 92,845 152,524 41,051 33,273 45,352 Finland 172,997 32,186 21,820 118,259 70,742 35,725 70,537 31,095 France 1,162,259 504,047 210,247 441,739 921,697 356,926 851,280 173,941 Germany 1,740,456 506,110 550,423 673,867 1,048,693 553,914 961,195 233,962 Greece 275,971 40,389 109,426 126,049 163,803 7,156 40,619 61,771 Iceland 19,100 9,922 2,861 6,313 18,045 282 5,966 922 Ireland 679,114 160,631 26,733 490,269 489,411 154,167 66,075 48,693 Italy 1,142,376 200,445 464,667 476,511 675,598 96,015 286,158 95,535 Liechtenstein 4,431 322 – 4,039 4,351 491 1,473 837 Luxembourg 532,401 142,996 17,959 364,386 406,963 49,030 91,612 62,552 Malta 16,682 3,131 480 12,532 9,866 490 817 1,688 Netherlands 764,051 221,522 66,915 472,427 698,656 197,719 314,217 97,983 Norway 247,886 63,974 60,934 122,822 123,380 20,969 31,356 26,084 Portugal 238,937 50,972 60,127 127,770 150,074 12,102 51,326 25,425 Slovakia 66,764 5,234 19,211 40,849 11,887 967 8,411 13,015 Slovenia 38,108 8,102 3,852 26,046 19,705 312 5,156 3,563 Spain 923,897 339,296 117,360 466,705 630,870 62,574 183,012 117,091 Sweden 162,557 70,267 20,033 71,772 141,579 21,410 111,937 29,815 Switzerland 305,653 124,846 24,485 155,246 264,660 118,093 446,961 68,416 United Kingdom 3,074,069 972,569 239,715 1,828,575 1,243,204 929,713 2,042,909 414,270 Vatican 396 395 – – 11 2 2 1 Other 1,466 645 17 754 1,174 402 57 657
Other developed countries 7,480,989 1,440,419 1,323,762 4,660,291 3,238,945 1,518,021 2,160,861 1,243,128 Australia 501,829 142,991 41,795 316,519 234,007 67,222 105,765 70,098 Canada 403,914 86,855 91,734 224,647 198,046 82,932 87,923 88,960 Japan 834,445 203,834 355,976 272,574 307,639 111,210 249,163 53,671 New Zealand 234,513 16,983 11,578 205,870 36,031 14,528 7,666 31,029 United States 5,504,531 989,072 819,109 3,637,210 2,434,964 1,241,768 1,076,585 999,336
Offshore centres 1,608,531 154,174 126,449 1,313,844 1,083,950 193,753 508,546 409,704 Aruba 1,043 186 141 713 1,022 1 329 17 Bahamas 31,002 3,544 1,752 25,338 22,750 1,920 2,951 10,377 Bahrain 22,347 9,609 1,017 11,709 11,276 1,321 1,476 1,942 Barbados 6,442 1,119 1,046 4,277 2,485 4,580 2,235 395 Bermuda 72,763 1,908 528 69,346 67,086 8,973 35,524 26,671 Cayman Islands 529,642 32,819 2,093 487,914 517,138 103,398 329,349 53,898 Gibraltar 5,805 441 87 5,139 4,407 385 105 1,435 Guernsey 40,892 2,216 130 35,090 35,667 2,176 10,393 9,737 Hong Kong SAR 374,013 45,408 81,770 245,303 77,052 20,028 55,168 129,634 Isle of Man 33,186 2,423 425 30,507 20,173 1,709 660 6,420 Jersey 134,954 9,766 254 124,649 125,126 12,067 6,735 69,956 Lebanon 4,359 590 1,522 2,244 3,326 144 1,465 1,928 Macau SAR 6,313 559 513 5,087 3,151 118 783 1,239 Mauritius 10,067 965 557 8,541 6,165 4,708 1,357 1,007 Netherlands Antilles 22,550 1,469 329 20,712 22,269 1,415 3,471 2,658 Panama 38,305 2,689 1,006 34,514 28,570 2,473 11,182 15,695 Samoa 902 18 2 766 755 6 121 1,180 Singapore 203,800 35,865 32,730 133,986 68,967 23,845 39,494 37,872 Vanuatu 322 8 14 300 70 1 34 25 West Indies UK 69,022 2,141 305 66,313 65,693 4,455 5,688 37,609
Consolidated cross-border and local claims in all currencies Other exposuresof which on
A 70 BIS Quarterly Review, December 2009

Table 9C (cont.)
End-June 2009Total of which
Claims vis-à-vis of 24 Banks Public sector Non-bank cross-border Derivatives Guarantees Credit countries private sector claims contracts extended commitments
S F G H T V W XDeveloping countries 3,830,654 704,146 795,570 2,312,812 1,644,528 223,295 745,214 606,246 Africa & Middle East 517,660 94,764 77,586 344,803 297,077 35,922 110,197 102,427
Algeria 7,420 1,254 1,879 4,290 2,398 45 5,689 1,873 Angola 5,726 863 1,821 2,694 3,753 2 1,094 955 Benin 154 19 – 134 154 – 63 20 Botswana 2,400 30 71 2,298 120 17 64 45 Burkina Faso 796 72 100 624 218 – 203 62 Burundi 42 4 – 38 42 – 14 10 Cameroon 2,864 473 608 1,782 1,038 2 454 64 Cape Verde 1,009 367 9 633 533 – 34 183 Central African Republic 19 – – 19 19 – 1 3 Chad 73 – 3 69 73 – 15 3 Comoros Islands 24 7 – 17 21 – – 3 Congo 471 129 49 293 263 – 202 21 Congo Democratic Republic 473 36 172 264 409 5 80 57 Côte d’Ivoire 6,025 172 1,294 4,558 3,804 500 555 175 Djibouti 252 10 1 240 178 – 48 2 Egypt 38,210 5,499 10,496 22,208 14,373 1,052 7,183 6,091 Equatorial Guinea 648 69 485 94 10 – 191 123 Eritrea 6 – – 6 6 – 1 19 Ethiopia 32 6 – 27 32 – 319 286 Gabon 1,909 478 326 1,103 638 – 360 620 Gambia 66 5 2 59 47 – 16 2 Ghana 3,236 404 552 2,279 1,750 48 440 687 Guinea 426 46 191 190 265 – 157 29 Guinea-Bissau 19 8 – 11 19 – – 1 Iran 6,561 2,278 371 3,905 6,554 40 357 3,055 Iraq 1,476 38 1,069 367 1,125 – 1,636 84 Israel 11,528 1,038 4,116 6,347 8,027 2,694 6,467 2,954 Jordan 2,625 527 736 1,363 1,167 88 762 1,029 Kenya 3,403 267 382 2,751 1,011 32 380 463 Kuwait 17,127 4,717 2,268 10,138 16,311 685 2,449 1,744 Lesotho 17 – 1 16 17 – – – Liberia 26,254 109 – 26,144 25,612 801 6,505 9,222 Libya 8,236 6,274 326 1,634 314 36 5,674 2,000 Madagascar 1,023 158 118 746 411 2 239 149 Malawi 19 2 – 17 19 – 12 – Mali 351 78 22 251 255 – 79 52 Mauritania 205 47 – 156 206 – 88 32 Morocco 25,500 4,128 2,404 18,971 13,788 359 5,085 2,960 Mozambique 2,802 316 463 2,021 490 3 304 256 Namibia 436 41 130 264 435 4 54 81 Niger 149 10 27 111 150 – 8 39 Nigeria 6,597 2,222 712 3,661 4,953 73 4,248 1,731 Oman 8,486 1,530 1,333 5,556 6,320 573 756 2,020 Palestinian Territory 65 – – 65 61 – 14 38 Qatar 43,480 5,515 8,054 29,794 38,349 2,479 4,303 6,858 Rwanda 22 10 – 12 22 – 86 – Sao Tomé and Principe 12 1 – 11 12 7 – – Saudi Arabia 35,496 13,456 3,084 18,903 33,439 4,833 11,601 7,533 Senegal 2,737 208 231 2,296 769 – 530 180 Seychelles 1,199 46 72 1,080 911 85 89 1,604 Sierra Leone 464 5 122 336 424 8 7 8 Somalia 89 – – 89 89 – – – South Africa 111,489 15,097 16,479 79,886 25,246 12,044 17,698 10,344 St. Helena 14 – – 14 13 – – – Sudan 323 78 202 43 314 13 31 46 Swaziland 56 15 13 26 56 4 61 5
Consolidated cross-border and local claims in all currencies Other exposuresof which on
BIS Quarterly Review, December 2009 A 71

Table 9C (cont.)
End-June 2009Total of which
Claims vis-à-vis of 24 Banks Public sector Non-bank cross-border Derivatives Guarantees Credit countries private sector claims contracts extended commitments
S F G H T V W XSyria 268 25 34 206 258 1 794 43 Tanzania 1,763 190 433 1,139 313 3 423 217 Togo 281 210 – 71 282 – 29 6 Tunisia 7,398 1,921 1,228 4,250 3,828 135 1,587 1,227 Uganda 842 93 106 642 326 2 84 118 United Arab Emirates 112,680 23,532 13,997 75,001 72,733 9,174 20,064 34,723 Yemen 1,112 333 1 777 753 – 276 166 Zambia 1,946 186 379 1,380 786 37 215 36 Zimbabwe 713 46 477 189 649 1 5 69 Residual 116 66 137 244 116 35 14 1
Asia & Pacific 1,092,732 266,958 213,609 610,847 530,417 104,740 225,431 161,065 Afghanistan 304 56 1 247 296 1 70 12 Armenia 480 122 93 264 202 – 16 135 Azerbaijan 2,452 629 175 1,647 2,450 – 153 720 Bangladesh 4,030 599 681 2,751 927 23 591 1,105 Bhutan 14 – 12 2 2 – 3 3 British Overseas Territories 376 – – 376 312 – 21 7 Brunei 2,091 47 346 1,697 390 60 101 334 Cambodia 186 13 3 171 138 – 9 28 China 196,738 72,714 32,203 91,178 113,657 12,025 35,443 23,056 Chinese Taipei 88,883 14,943 19,837 53,637 25,601 6,183 8,020 21,642 Fiji 1,373 1 1 19 6 1 11 62 French Polynesia 4,039 1,429 232 2,377 2,727 8 50 23 Georgia 900 230 71 597 520 28 64 198 India 190,586 41,484 19,692 129,269 108,024 17,116 24,604 21,086 Indonesia 51,188 6,740 13,672 29,452 26,267 1,380 12,531 13,857 Kazakhstan 12,940 6,034 596 6,276 10,858 676 9,617 1,871 Kiribati 37 35 – 2 37 – – – Kyrgyz Republic 44 24 1 19 43 4 24 16 Laos 405 – – 405 404 27 27 97 Malaysia 100,935 14,887 25,341 60,671 25,525 4,374 17,799 22,515 Maldives 847 35 101 710 320 1 6 65 Marshall Islands 27,603 9 5 27,484 27,115 1,715 980 9,104 Micronesia – – – – – – – 3 Mongolia 84 21 36 27 84 9 7 21 Myanmar 1,039 1,000 – 39 1,030 – – 61 Nauru – – – – – – – – Nepal 264 182 2 80 40 – 16 72 New Caledonia 6,199 1,731 493 3,975 3,702 13 287 51 North Korea 1,036 300 335 401 1,038 14 21 197 Pakistan 11,521 4,276 1,736 5,504 2,419 757 1,695 1,609 Palau 5 1 – 4 1 – – – Papua New Guinea 1,474 7 20 1,395 183 5 – 386 Philippines 21,376 3,607 7,203 10,540 12,229 1,792 17,058 5,927 Solomon Islands 135 – – 127 1 – – 15 South Korea 288,608 82,488 74,986 130,207 127,943 51,238 56,170 21,652 Sri Lanka 4,588 365 1,784 2,406 1,968 464 362 591 Tajikistan 42 15 – 27 42 – 1 – Thailand 47,690 9,594 9,964 28,109 15,451 4,060 9,577 9,642 Timor Leste 84 – – 84 2 – – – Tonga 166 – 3 – 3 – – – Turkmenistan 188 175 – 13 188 17 199 1 Tuvalu 5 – – 5 5 – – – US Pacific Islands 157 – – 157 135 – 3 60 Uzbekistan 221 194 9 18 212 13 102 89 Vietnam 11,216 1,802 2,405 6,983 5,251 63 3,641 3,396 Wallis/Futuna 57 21 – 36 25 – 4 – Residual 10,126 1,148 1,570 11,459 12,644 2,673 26,148 1,356
Consolidated cross-border and local claims in all currencies Other exposuresof which on
A 72 BIS Quarterly Review, December 2009

Table 9C (cont.)
End-June 2009Total of which
Claims vis-à-vis of 24 Banks Public sector Non-bank cross-border Derivatives Guarantees Credit countries private sector claims contracts extended commitments
S F G H T V W XEurope 1,324,749 219,797 252,484 837,371 548,339 34,066 259,499 166,842
Albania 6,500 715 2,291 3,320 1,643 3 137 284 Belarus 2,974 1,051 47 1,718 2,470 2 414 851 Bosnia and Herzegovina 10,842 1,576 736 8,364 2,408 18 756 1,255 Bulgaria 36,552 3,680 3,402 28,179 13,900 384 9,158 7,202 Croatia 83,360 12,084 15,992 54,772 33,390 184 7,808 8,801 Czech Republic 174,215 16,128 39,759 115,839 38,834 5,789 14,735 29,926 Estonia 31,206 9,209 742 21,157 16,709 247 1,663 968 Hungary 143,429 18,627 43,274 79,545 64,407 5,279 23,634 14,695 Latvia 32,307 6,683 2,537 22,988 10,797 354 3,896 812 Lithuania 35,618 7,119 5,009 21,980 22,590 83 2,959 2,477 Macedonia, FYR 2,353 70 252 2,032 609 – 137 287 Moldova 646 249 67 322 501 117 57 44 Montenegro 3,218 205 640 2,371 3,210 – 882 658 Poland 258,859 37,910 71,033 148,263 62,751 8,256 20,901 31,619 Romania 114,664 17,077 19,674 76,698 45,525 2,042 16,582 11,691 Russia 194,610 45,792 18,160 129,521 120,860 8,050 70,355 19,441 Serbia 23,211 5,162 2,354 15,307 11,478 17 2,610 3,122 Turkey 129,831 27,871 23,540 77,829 73,778 3,173 70,331 29,828 Ukraine 39,245 8,087 2,963 26,621 21,919 36 12,300 2,879 Res. Serbia & Montenegro 104 33 – 71 104 – 168 – Residual Europe 1,005 469 12 474 456 32 16 2
Latin America/Caribbean 895,513 122,627 251,891 519,791 268,695 48,567 150,087 175,912 Argentina 30,395 2,170 9,571 18,508 10,458 219 13,401 5,127 Belize 1,795 10 110 1,674 1,392 118 87 901 Bolivia 307 78 16 212 284 2 81 72 Brazil 331,726 61,599 88,723 180,319 121,483 8,589 47,856 66,621 Chile 85,575 10,812 10,336 64,166 26,756 10,792 5,757 25,057 Colombia 23,405 1,522 6,598 15,267 6,085 1,643 8,197 3,968 Costa Rica 5,937 622 893 4,417 1,991 75 595 985 Cuba 1,427 926 231 269 1,337 1 122 291 Dominica 214 1 21 193 99 – 2 6 Dominican Republic 3,365 292 1,191 1,881 2,281 5 335 484 Ecuador 1,677 271 140 1,266 699 4 693 202 El Salvador 6,971 1,174 1,390 4,406 834 41 620 594 Falkland Islands 31 – – 31 10 – – – Grenada 305 1 46 258 115 – 4 6 Guatemala 3,260 1,351 247 1,662 1,866 97 285 731 Guyana 276 1 26 249 97 – 10 36 Haiti 256 2 72 182 114 – 11 17 Honduras 2,507 795 373 1,338 969 119 56 408 Jamaica 6,003 464 2,999 2,503 2,640 65 403 4,164 Mexico 309,595 33,672 105,954 169,915 68,112 22,712 39,045 55,393 Nicaragua 431 107 20 303 177 9 15 308 Paraguay 1,625 326 371 925 249 13 59 285 Peru 26,075 2,588 6,242 17,232 7,116 594 7,010 2,423 St. Lucia 1,779 186 201 1,392 1,256 – 3 54 St. Vincent 586 7 29 550 477 12 34 376 Surinam 353 106 25 222 353 – 1 4 Trinidad and Tobago 9,074 354 2,331 6,387 3,064 137 319 699 Turks and Caicos 1,083 1 32 1,050 706 36 16 125 Uruguay 5,410 157 2,199 3,049 1,671 91 488 571 Venezuela 33,026 2,975 11,278 18,745 4,970 2,572 11,182 5,805 Residual 1,044 57 226 1,220 1,034 621 13,400 199
Int. organisations 61,127 6,329 51,086 3,602 60,483 10,460 638 4,954 Unallocated 14,499 2,496 336 3,831 7,207 1,204 76 831
Consolidated cross-border and local claims in all currencies Other exposuresof which on
BIS Quarterly Review, December 2009 A 73

Table 9D: Consolidated foreign claims of reporting banks - ultimate risk basisOn individual countries by nationality of reporting banks / Amounts outstandingIn millions of US dollarsEnd-June 2009 Total
of 24 Australia Belgium Canada France Germany Italy JapanClaims vis-à-vis countriesAll countries 25,680,267 477,735 829,222 688,322 3,469,479 3,439,463 996,283 2,198,142 Developed countries 20,165,456 440,456 664,438 564,144 2,924,802 2,869,446 773,411 1,791,777 Europe 12,684,467 181,206 548,962 140,668 1,960,819 2,119,644 712,550 730,753
Austria 315,398 265 5,117 1,113 25,024 103,710 121,798 6,206 Andorra 1,908 ... 5 – 337 63 13 ... Belgium 467,083 1,938 ... 3,854 118,486 38,575 10,086 21,420 Cyprus 38,974 3 391 – 2,802 11,138 2,099 ... Denmark 291,533 1,266 4,977 1,868 22,971 53,343 3,770 10,916 Finland 172,997 532 2,970 ... 7,189 14,143 1,532 6,655 France 1,162,259 8,843 117,593 15,819 ... 198,649 40,597 118,648 Germany 1,740,456 10,690 51,166 12,584 279,423 – 306,466 157,815 Greece 275,971 53 6,660 ... 76,454 38,572 8,070 7,403 Iceland 19,100 37 995 206 1,710 9,255 1,036 374 Ireland 679,114 1,639 40,014 12,298 63,169 183,885 22,081 20,927 Italy 1,142,376 10,173 45,240 2,196 478,764 202,598 ... 52,616 Liechtenstein 4,431 ... 90 – 340 1,614 250 ... Luxembourg 532,401 2,096 23,231 2,761 95,278 151,162 32,415 32,625 Malta 16,682 ... 538 ... 433 2,727 391 ... Netherlands 764,051 7,160 75,509 9,372 120,630 159,520 28,387 45,159 Norway 247,886 245 1,132 1,750 20,959 35,284 3,518 11,695 Portugal 238,937 96 10,622 911 34,513 44,581 6,714 3,298 Slovakia 66,764 – 9,501 ... 5,006 3,722 17,132 38 Slovenia 38,108 ... 1,326 ... 3,426 12,302 7,974 286 Spain 923,897 2,076 42,088 2,715 180,099 237,688 31,919 26,838 Sweden 162,557 637 2,490 1,785 18,541 39,593 2,666 15,670 Switzerland 305,653 2,672 8,202 3,892 56,361 61,912 11,839 22,617 United Kingdom 3,074,069 130,785 99,104 66,267 348,880 515,172 51,072 169,547 Vatican 396 – – – ... – ... ... Other 1,466 – 1 – 24 436 722 ...
Other developed countries 7,480,989 259,250 115,476 423,476 963,983 749,802 53,880 1,061,024 Australia 501,829 – 7,435 12,995 39,029 53,967 2,932 65,985 Canada 403,914 8,053 6,217 ... 30,218 40,006 2,095 45,588 Japan 834,445 3,037 1,930 5,443 203,393 54,902 ... ... New Zealand 234,513 205,709 124 470 959 3,132 96 4,241 United States 5,504,531 42,440 99,770 404,568 690,384 597,795 48,757 945,210
Offshore centres 1,608,531 13,933 22,976 42,687 132,093 190,995 20,060 224,382 Aruba 1,043 – 1 ... 11 59 21 ... Bahamas 31,002 ... 40 8,917 1,338 1,079 ... 914 Bahrain 22,347 47 424 267 3,202 1,867 517 1,116 Barbados 6,442 ... 40 4,332 62 941 36 ... Bermuda 72,763 548 1,942 539 5,184 8,166 1,286 14,861 Cayman Islands 529,642 257 6,365 16,277 53,244 69,016 6,699 119,128 Gibraltar 5,805 ... 4 ... 577 1,028 9 ... Guernsey 40,892 ... 130 ... 1,067 8,115 1,091 3,592 Hong Kong SAR 374,013 5,530 3,127 3,890 22,617 11,558 1,017 30,333 Isle of Man 33,186 ... 248 – 678 5,324 684 1,268 Jersey 134,954 118 2,205 ... 15,242 40,780 3,806 12,933 Lebanon 4,359 – 25 ... 1,585 102 11 33 Macau SAR 6,313 152 115 ... 327 332 146 ... Mauritius 10,067 3 21 ... 1,676 1,569 51 ... Netherlands Antilles 22,550 ... 164 2,101 765 2,630 447 3,242 Panama 38,305 7 770 ... 2,676 7,772 982 9,080 Samoa 902 143 – – 40 16 ... ... Singapore 203,800 6,036 5,477 ... 15,436 17,383 1,680 27,882 Vanuatu 322 265 – – 18 17 ... ... West Indies UK 69,022 25 1,878 2,745 6,348 13,241 1,335 ...
A 74 BIS Quarterly Review, December 2009

Table 9D (Cont)
Total End-June 2009Nether- Portugal Switzerland United United European of 24lands Kingdom States banks countries Claims vis-à-vis
1,620,106 161,719 1,797,804 3,733,400 2,492,802 19,424,795 25,680,267 All countries1,373,780 117,881 1,551,287 2,670,192 1,765,781 15,383,356 20,165,456 Developed countries
942,494 107,764 693,374 1,163,174 1,287,973 10,247,190 12,684,467 Europe9,012 692 12,327 7,271 8,411 298,683 315,398 Austria
37 35 84 –10 ... 1,901 1,908 Andorra154,458 1,098 13,037 40,254 36,303 401,114 467,083 Belgium
1,550 103 3,202 3,256 445 38,031 38,974 Cyprus9,965 1,290 11,196 11,725 17,308 258,885 291,533 Denmark3,878 1,117 2,364 9,214 6,384 158,532 172,997 Finland
90,510 7,524 75,573 272,498 113,700 894,881 1,162,259 France181,498 8,153 116,546 179,366 190,787 1,357,442 1,740,456 Germany11,214 9,013 73,251 12,479 14,240 253,731 275,971 Greece
782 282 641 723 625 17,607 19,100 Iceland30,708 18,433 15,737 183,342 55,878 584,807 679,114 Ireland69,021 3,937 20,698 81,657 53,117 1,022,307 1,142,376 Italy
619 3 ... 784 ... 4,431 4,431 Liechtenstein23,648 3,713 46,477 29,194 31,547 441,256 532,401 Luxembourg
791 329 437 5,624 127 16,325 16,682 Malta... 10,464 38,723 103,823 90,139 603,991 764,051 Netherlands
5,058 429 5,460 9,309 20,365 213,133 247,886 Norway13,215 ... 3,313 25,884 4,060 230,478 238,937 Portugal1,014 91 18 515 813 65,794 66,764 Slovakia
501 27 96 196 621 37,069 38,108 Slovenia123,253 28,121 17,677 126,932 52,354 839,060 923,897 Spain
7,333 376 7,797 18,737 22,174 121,140 162,557 Sweden20,368 2,128 ... 40,399 36,772 233,329 305,653 Switzerland
184,052 10,406 228,697 ... 531,803 2,151,428 3,074,069 United Kingdom– ... – – ... 396 396 Vatican9 ... 23 2 ... 1,439 1,466 Other
431,286 10,117 857,913 1,507,018 477,808 5,136,166 7,480,989 Other developed countries83,133 530 24,890 99,320 74,815 332,065 501,829 Australia40,591 291 15,607 84,904 105,357 238,656 403,914 Canada19,879 29 100,363 113,761 292,550 520,864 834,445 Japan5,966 12 1,310 7,465 3,341 19,720 234,513 New Zealand
281,717 9,255 715,743 1,201,568 ... 4,024,861 5,504,531 United States
39,459 11,587 108,622 459,682 208,363 1,062,308 1,608,531 Offshore centres57 ... 164 8 ... 369 1,043 Aruba
523 1,132 4,198 1,403 10,340 10,786 31,002 Bahamas393 1 357 9,884 1,349 17,906 22,347 Bahrain76 1 61 371 425 1,680 6,442 Barbados
1,924 138 5,701 9,525 14,127 41,511 72,763 Bermuda6,049 6,121 45,032 67,968 100,799 288,808 529,642 Cayman Islands
225 193 331 2,661 64 5,730 5,805 Gibraltar1,571 8 9,532 12,550 ... 37,095 40,892 Guernsey8,683 378 7,488 205,965 30,115 266,743 374,013 Hong Kong SAR
173 10 405 17,535 ... 31,858 33,186 Isle of Man2,625 124 5,925 42,563 ... 121,340 134,954 Jersey
71 ... 747 1,296 469 3,841 4,359 Lebanon29 1,956 6 1,512 536 4,479 6,313 Macau SAR
324 73 356 3,709 1,452 8,078 10,067 Mauritius1,382 133 395 3,639 7,029 9,958 22,550 Netherlands Antilles
544 360 2,243 6,704 2,335 25,148 38,305 Panama22 ... 39 63 92 180 902 Samoa
11,202 14 15,873 56,782 31,867 130,771 203,800 Singapore– ... 4 13 – 52 322 Vanuatu
3,586 945 9,765 15,531 7,364 55,975 69,022 West Indies UK
BIS Quarterly Review, December 2009 A 75
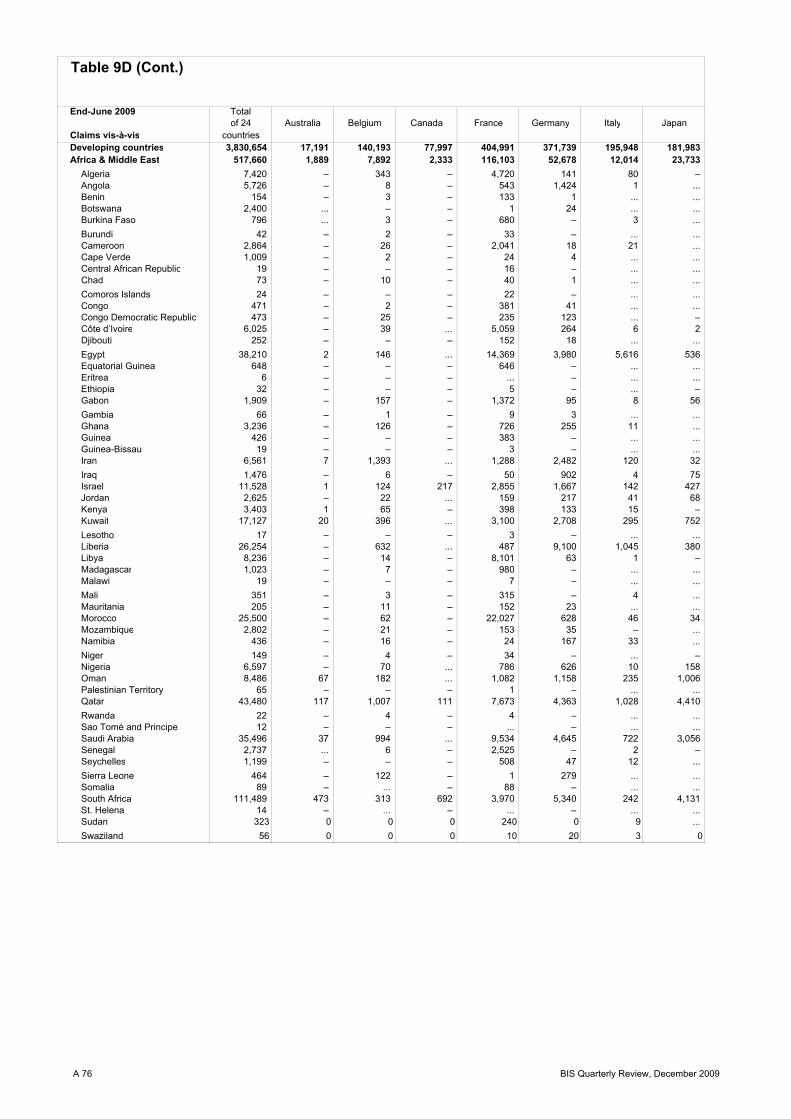
Table 9D (Cont.)
End-June 2009 Totalof 24 Australia Belgium Canada France Germany Italy Japan
Claims vis-à-vis countriesDeveloping countries 3,830,654 17,191 140,193 77,997 404,991 371,739 195,948 181,983 Africa & Middle East 517,660 1,889 7,892 2,333 116,103 52,678 12,014 23,733
Algeria 7,420 – 343 – 4,720 141 80 – Angola 5,726 – 8 – 543 1,424 1 ... Benin 154 – 3 – 133 1 ... ... Botswana 2,400 ... – – 1 24 ... ... Burkina Faso 796 ... 3 – 680 – 3 ... Burundi 42 – 2 – 33 – ... ... Cameroon 2,864 – 26 – 2,041 18 21 ... Cape Verde 1,009 – 2 – 24 4 ... ... Central African Republic 19 – – – 16 – ... ... Chad 73 – 10 – 40 1 ... ... Comoros Islands 24 – – – 22 – ... ... Congo 471 – 2 – 381 41 ... ... Congo Democratic Republic 473 – 25 – 235 123 ... – Côte d’Ivoire 6,025 – 39 ... 5,059 264 6 2 Djibouti 252 – – – 152 18 ... ... Egypt 38,210 2 146 ... 14,369 3,980 5,616 536 Equatorial Guinea 648 – – – 646 – ... ... Eritrea 6 – – – ... – ... ... Ethiopia 32 – – – 5 – ... – Gabon 1,909 – 157 – 1,372 95 8 56 Gambia 66 – 1 – 9 3 ... ... Ghana 3,236 – 126 – 726 255 11 ... Guinea 426 – – – 383 – ... ... Guinea-Bissau 19 – – – 3 – ... ... Iran 6,561 7 1,393 ... 1,288 2,482 120 32 Iraq 1,476 – 6 – 50 902 4 75 Israel 11,528 1 124 217 2,855 1,667 142 427 Jordan 2,625 – 22 ... 159 217 41 68 Kenya 3,403 1 65 – 398 133 15 – Kuwait 17,127 20 396 ... 3,100 2,708 295 752 Lesotho 17 – – – 3 – ... ... Liberia 26,254 – 632 ... 487 9,100 1,045 380 Libya 8,236 – 14 – 8,101 63 1 – Madagascar 1,023 – 7 – 980 – ... ... Malawi 19 – – – 7 – ... ... Mali 351 – 3 – 315 – 4 ... Mauritania 205 – 11 – 152 23 ... ... Morocco 25,500 – 62 – 22,027 628 46 34 Mozambique 2,802 – 21 – 153 35 – ... Namibia 436 – 16 – 24 167 33 ... Niger 149 – 4 – 34 – ... – Nigeria 6,597 – 70 ... 786 626 10 158 Oman 8,486 67 182 ... 1,082 1,158 235 1,006 Palestinian Territory 65 – – – 1 – ... ... Qatar 43,480 117 1,007 111 7,673 4,363 1,028 4,410 Rwanda 22 – 4 – 4 – ... ... Sao Tomé and Principe 12 – – – ... – ... ... Saudi Arabia 35,496 37 994 ... 9,534 4,645 722 3,056 Senegal 2,737 ... 6 – 2,525 – 2 – Seychelles 1,199 – – – 508 47 12 ... Sierra Leone 464 – 122 – 1 279 ... ... Somalia 89 – ... – 88 – ... ... South Africa 111,489 473 313 692 3,970 5,340 242 4,131 St. Helena 14 – ... – ... – ... ... Sudan 323 0 0 0 240 0 9 ... Swaziland 56 0 0 0 10 20 3 0
A 76 BIS Quarterly Review, December 2009

Table 9D (Cont.)
Total End-June 2009Nether- Portugal Switzerland United United European of 24lands Kingdom States banks countries Claims vis-à-vis205,433 32,058 132,051 586,590 518,658 2,914,964 3,830,654 Developing countries13,545 7,203 18,139 189,590 41,223 435,975 517,660 Africa & Middle East
21 ... 19 224 1,838 5,569 7,420 Algeria154 2,578 106 784 3 5,719 5,726 Angola
– ... 7 10 – 154 154 Benin3 7 1 2,291 67 2,328 2,400 Botswana1 ... – 30 19 773 796 Burkina Faso– ... – – ... 36 42 Burundi
51 ... 1 517 170 2,678 2,864 Cameroon6 971 – – – 1,009 1,009 Cape Verde1 2 – – – 19 19 Central African Republic9 ... – 12 1 72 73 Chad– ... – – ... 22 24 Comoros Islands
13 1 3 2 23 445 471 Congo17 1 17 8 46 427 473 Congo Democratic Republic8 ... 109 313 194 5,804 6,025 Côte d’Ivorie– ... 3 2 ... 176 252 Djibouti
223 3 497 8,430 3,165 34,040 38,210 Egypt– ... – – ... 648 648 Equatorial Guinea1 ... – – ... 1 6 Eritrea4 ... 6 12 – 29 32 Ethiopia2 ... 11 48 147 1,705 1,909 Gabon
21 ... – 21 ... 56 66 Gambia127 ... 5 1,826 126 3,089 3,236 Ghana
2 ... – – – 388 426 Guinea– 11 – 3 ... 19 19 Guinea-Bissau
386 ... 339 270 1 6,471 6,561 Iran36 1 17 362 9 1,392 1,476 Iraq
373 30 864 2,054 2,038 8,620 11,528 Israel43 1 37 1,536 441 2,109 2,625 Jordan
103 ... 112 2,004 515 2,850 3,403 Kenya514 403 960 2,757 3,030 12,158 17,127 Kuwait
– ... – 13 – 17 17 Lesotho365 21 2,433 5,265 378 23,680 26,254 Liberia31 ... 3 15 2 8,231 8,236 Libya16 ... 17 2 ... 1,022 1,023 Madagascar2 4 – 2 1 15 19 Malawi1 ... – 8 17 331 351 Mali3 ... 4 – 11 194 205 Mauritania
151 125 70 313 469 24,984 25,500 Morocco65 2,193 2 291 7 2,793 2,802 Mozambique5 3 – 12 8 428 436 Namibia1 ... 1 2 5 43 149 Niger
321 3 274 2,584 1,674 4,697 6,597 Nigeria295 ... 612 3,170 161 7,030 8,486 Oman
– ... – 63 ... 65 65 Palestinian Territory1,869 1 3,996 12,277 2,696 35,035 43,480 Qatar
13 ... 1 – – 22 22 Rwanda– 12 – – ... 12 12 Sao Tomé and Principe
1,820 26 464 7,806 4,131 27,151 35,496 Saudi Arabia10 ... 16 28 141 2,590 2,737 Senegal9 1 137 422 4 1,180 1,199 Seychelles3 ... – 58 ... 463 464 Sierra Leone– ... – – – 89 89 Somalia
1,330 751 2,567 80,736 8,492 96,503 111,489 South Africa– ... – 3 ... 6 14 St. Helena1 ... 0 13 2 315 323 Sudan0 ... 0 8 0 44 56 Swaziland
BIS Quarterly Review, December 2009 A 77

Table 9D (Cont.)
End-June 2009 Totalof 24 Australia Belgium Canada France Germany Italy Japan
Claims vis-à-vis countriesSyria 268 – – – 121 75 ... – Tanzania 1,763 – 4 – 80 3 1 – Togo 281 – 9 – 229 41 ... ... Tunisia 7,398 – 203 – 5,288 609 114 ... Uganda 842 – 38 – 87 4 7 ... United Arab Emirates 112,680 1,046 1,262 734 11,294 10,249 ... 8,610 Yemen 1,112 – 1 – 774 13 ... – Zambia 1,946 1 5 – 63 113 ... – Zimbabwe 713 1 3 – 19 576 ... ... Residual 116 116 ... – ... – ... ...
Asia & Pacific 1,092,732 14,244 12,993 13,623 96,332 85,437 8,380 107,400 Afghanistan 304 ... 1 – 46 1 ... ... Armenia 480 – 3 – 80 73 ... 6 Azerbaijan 2,452 – 70 – 638 641 25 171 Bangladesh 4,030 – 35 ... 39 157 21 ... Bhutan 14 – – – ... – ... ... British Overseas Territories 376 – ... ... 24 – ... ... Brunei 2,091 6 18 ... 18 16 ... ... Cambodia 186 2 6 – 49 3 ... ... China 196,738 2,100 4,295 2,684 16,058 13,386 1,562 24,044 Chinese Taipei 88,883 1,018 738 ... 7,598 3,001 208 8,459 Fiji 1,373 1,351 1 – 1 – ... – French Polynesia 4,039 1 13 – 3,916 9 ... ... Georgia 900 – 6 – 425 114 3 20 India 190,586 1,569 1,543 ... 12,344 17,289 2,565 12,283 Indonesia 51,188 1,797 386 321 1,825 6,077 146 7,653 Kazakhstan 12,940 – 418 112 1,221 1,808 465 1,331 Kiribati 37 – ... – ... 35 ... ... Kyrgyz Republic 44 – – – 16 1 ... – Laos 405 25 179 – 101 52 ... 9 Malaysia 100,935 221 705 ... 2,767 4,490 440 8,801 Maldives 847 – 10 – 32 78 ... ... Marshall Islands 27,603 – 1,228 ... 1,064 12,628 1,179 ... Micronesia – – – – ... – ... ... Mongolia 84 – – – ... 49 ... ... Myanmar 1,039 – – – 7 1,011 ... – Nauru – – ... – ... – ... ... Nepal 264 – – – 3 – ... – New Caledonia 6,199 13 1 – 6,179 – ... ... North Korea 1,036 ... ... – 1,000 14 ... – Pakistan 11,521 2 18 ... 205 275 8 140 Palau 5 – ... – ... – ... ... Papua New Guinea 1,474 1,291 – ... 4 7 ... 73 Philippines 21,376 597 562 ... 1,327 2,362 179 2,904 Solomon Islands 135 135 ... – ... – ... ... South Korea 288,608 3,161 2,104 4,392 34,092 16,986 1,394 25,124 Sri Lanka 4,588 33 19 ... 245 700 8 1 Tajikistan 42 – 1 – ... 4 25 – Thailand 47,690 54 340 ... 2,591 2,815 76 14,671 Timor Leste 84 – ... – ... – ... ... Tonga 166 163 ... – ... 3 ... ... Turkmenistan 188 – ... – ... 175 ... 8 Tuvalu 5 – ... – ... – ... ... US Pacific Islands 157 – ... ... ... – ... ... Uzbekistan 221 – – – 5 188 3 – Vietnam 11,216 701 293 ... 2,362 989 67 1,702 Wallis/Futuna 57 – ... – 50 – ... ... Residual 10,126 4 ... – ... – ... ...
A 78 BIS Quarterly Review, December 2009
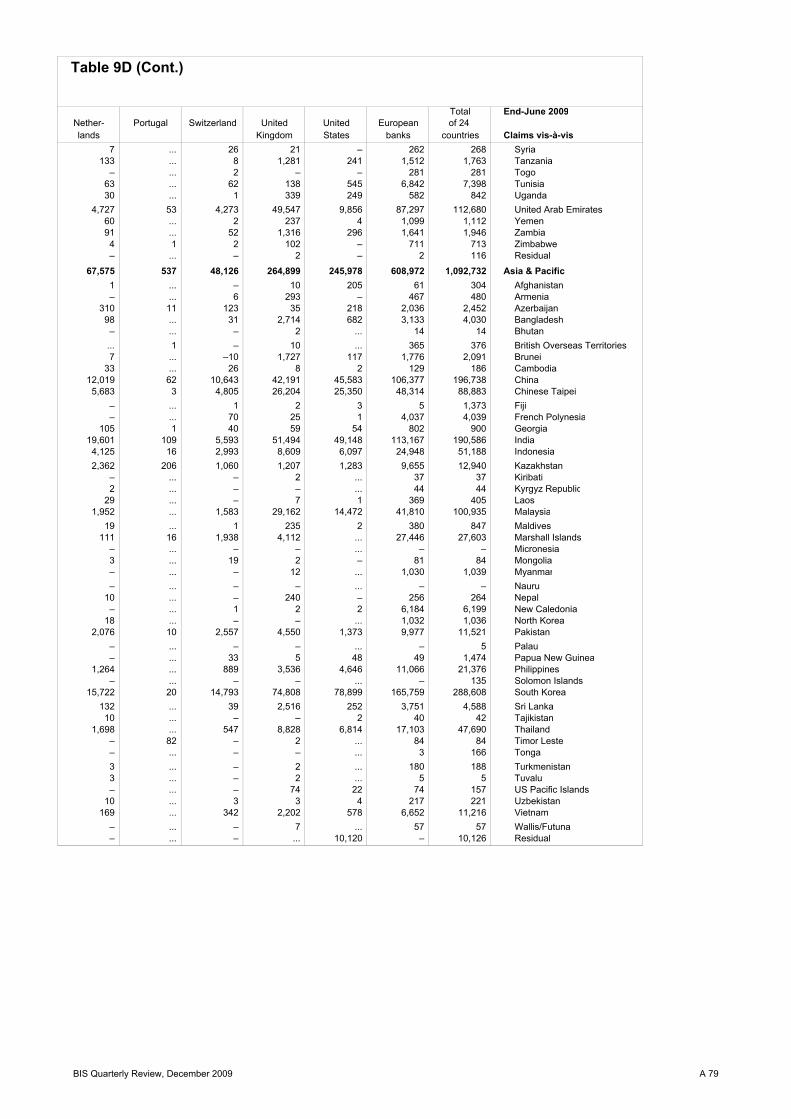
Table 9D (Cont.)
Total End-June 2009Nether- Portugal Switzerland United United European of 24 lands Kingdom States banks countries Claims vis-à-vis
7 ... 26 21 – 262 268 Syria133 ... 8 1,281 241 1,512 1,763 Tanzania
– ... 2 – – 281 281 Togo63 ... 62 138 545 6,842 7,398 Tunisia30 ... 1 339 249 582 842 Uganda
4,727 53 4,273 49,547 9,856 87,297 112,680 United Arab Emirates60 ... 2 237 4 1,099 1,112 Yemen91 ... 52 1,316 296 1,641 1,946 Zambia4 1 2 102 – 711 713 Zimbabwe– ... – 2 – 2 116 Residual
67,575 537 48,126 264,899 245,978 608,972 1,092,732 Asia & Pacific1 ... – 10 205 61 304 Afghanistan– ... 6 293 – 467 480 Armenia
310 11 123 35 218 2,036 2,452 Azerbaijan98 ... 31 2,714 682 3,133 4,030 Bangladesh– ... – 2 ... 14 14 Bhutan... 1 – 10 ... 365 376 British Overseas Territories7 ... –10 1,727 117 1,776 2,091 Brunei
33 ... 26 8 2 129 186 Cambodia12,019 62 10,643 42,191 45,583 106,377 196,738 China5,683 3 4,805 26,204 25,350 48,314 88,883 Chinese Taipei
– ... 1 2 3 5 1,373 Fiji– ... 70 25 1 4,037 4,039 French Polynesia
105 1 40 59 54 802 900 Georgia19,601 109 5,593 51,494 49,148 113,167 190,586 India4,125 16 2,993 8,609 6,097 24,948 51,188 Indonesia2,362 206 1,060 1,207 1,283 9,655 12,940 Kazakhstan
– ... – 2 ... 37 37 Kiribati2 ... – – ... 44 44 Kyrgyz Republic
29 ... – 7 1 369 405 Laos1,952 ... 1,583 29,162 14,472 41,810 100,935 Malaysia
19 ... 1 235 2 380 847 Maldives111 16 1,938 4,112 ... 27,446 27,603 Marshall Islands
– ... – – ... – – Micronesia3 ... 19 2 – 81 84 Mongolia– ... – 12 ... 1,030 1,039 Myanmar– ... – – ... – – Nauru
10 ... – 240 – 256 264 Nepal– ... 1 2 2 6,184 6,199 New Caledonia
18 ... – – ... 1,032 1,036 North Korea2,076 10 2,557 4,550 1,373 9,977 11,521 Pakistan
– ... – – ... – 5 Palau– ... 33 5 48 49 1,474 Papua New Guinea
1,264 ... 889 3,536 4,646 11,066 21,376 Philippines– ... – – ... – 135 Solomon Islands
15,722 20 14,793 74,808 78,899 165,759 288,608 South Korea132 ... 39 2,516 252 3,751 4,588 Sri Lanka10 ... – – 2 40 42 Tajikistan
1,698 ... 547 8,828 6,814 17,103 47,690 Thailand– 82 – 2 ... 84 84 Timor Leste– ... – – ... 3 166 Tonga3 ... – 2 ... 180 188 Turkmenistan3 ... – 2 ... 5 5 Tuvalu– ... – 74 22 74 157 US Pacific Islands
10 ... 3 3 4 217 221 Uzbekistan169 ... 342 2,202 578 6,652 11,216 Vietnam
– ... – 7 ... 57 57 Wallis/Futuna– ... – ... 10,120 – 10,126 Residual
BIS Quarterly Review, December 2009 A 79
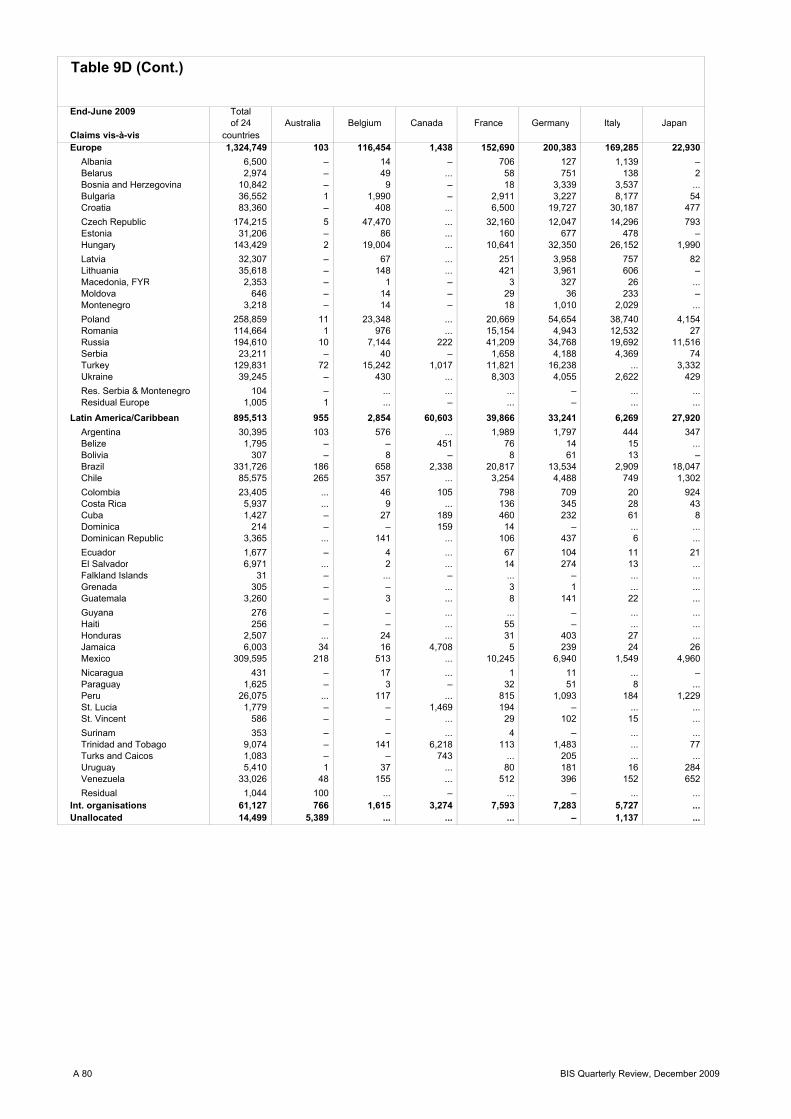
Table 9D (Cont.)
End-June 2009 Totalof 24 Australia Belgium Canada France Germany Italy Japan
Claims vis-à-vis countriesEurope 1,324,749 103 116,454 1,438 152,690 200,383 169,285 22,930
Albania 6,500 – 14 – 706 127 1,139 – Belarus 2,974 – 49 ... 58 751 138 2 Bosnia and Herzegovina 10,842 – 9 – 18 3,339 3,537 ... Bulgaria 36,552 1 1,990 – 2,911 3,227 8,177 54 Croatia 83,360 – 408 ... 6,500 19,727 30,187 477 Czech Republic 174,215 5 47,470 ... 32,160 12,047 14,296 793 Estonia 31,206 – 86 ... 160 677 478 – Hungary 143,429 2 19,004 ... 10,641 32,350 26,152 1,990 Latvia 32,307 – 67 ... 251 3,958 757 82 Lithuania 35,618 – 148 ... 421 3,961 606 – Macedonia, FYR 2,353 – 1 – 3 327 26 ... Moldova 646 – 14 – 29 36 233 – Montenegro 3,218 – 14 – 18 1,010 2,029 ... Poland 258,859 11 23,348 ... 20,669 54,654 38,740 4,154 Romania 114,664 1 976 ... 15,154 4,943 12,532 27 Russia 194,610 10 7,144 222 41,209 34,768 19,692 11,516 Serbia 23,211 – 40 – 1,658 4,188 4,369 74 Turkey 129,831 72 15,242 1,017 11,821 16,238 ... 3,332 Ukraine 39,245 – 430 ... 8,303 4,055 2,622 429 Res. Serbia & Montenegro 104 – ... ... ... – ... ... Residual Europe 1,005 1 ... – ... – ... ...
Latin America/Caribbean 895,513 955 2,854 60,603 39,866 33,241 6,269 27,920 Argentina 30,395 103 576 ... 1,989 1,797 444 347 Belize 1,795 – – 451 76 14 15 ... Bolivia 307 – 8 – 8 61 13 – Brazil 331,726 186 658 2,338 20,817 13,534 2,909 18,047 Chile 85,575 265 357 ... 3,254 4,488 749 1,302 Colombia 23,405 ... 46 105 798 709 20 924 Costa Rica 5,937 ... 9 ... 136 345 28 43 Cuba 1,427 – 27 189 460 232 61 8 Dominica 214 – – 159 14 – ... ... Dominican Republic 3,365 ... 141 ... 106 437 6 ... Ecuador 1,677 – 4 ... 67 104 11 21 El Salvador 6,971 ... 2 ... 14 274 13 ... Falkland Islands 31 – ... – ... – ... ... Grenada 305 – – ... 3 1 ... ... Guatemala 3,260 – 3 ... 8 141 22 ... Guyana 276 – – ... ... – ... ... Haiti 256 – – ... 55 – ... ... Honduras 2,507 ... 24 ... 31 403 27 ... Jamaica 6,003 34 16 4,708 5 239 24 26 Mexico 309,595 218 513 ... 10,245 6,940 1,549 4,960 Nicaragua 431 – 17 ... 1 11 ... – Paraguay 1,625 – 3 – 32 51 8 ... Peru 26,075 ... 117 ... 815 1,093 184 1,229 St. Lucia 1,779 – – 1,469 194 – ... ... St. Vincent 586 – – ... 29 102 15 ... Surinam 353 – – ... 4 – ... ... Trinidad and Tobago 9,074 – 141 6,218 113 1,483 ... 77 Turks and Caicos 1,083 – – 743 ... 205 ... ... Uruguay 5,410 1 37 ... 80 181 16 284 Venezuela 33,026 48 155 ... 512 396 152 652 Residual 1,044 100 ... – ... – ... ...
Int. organisations 61,127 766 1,615 3,274 7,593 7,283 5,727 ... Unallocated 14,499 5,389 ... ... ... – 1,137 ...
A 80 BIS Quarterly Review, December 2009

Table 9D (Cont.)
Total End-June 2009Nether- Portugal Switzerland United United European of 24 lands Kingdom States banks countries Claims vis-à-vis
91,407 15,437 37,277 35,178 50,860 1,245,926 1,324,749 Europe5 ... 2 8 1 6,461 6,500 Albania
63 1 108 – 1 2,949 2,974 Belarus67 ... 7 8 10 10,832 10,842 Bosnia and Herzegovina
420 4 4,272 114 256 36,220 36,552 Bulgaria173 10 143 226 414 82,449 83,360 Croatia
5,635 10 267 2,156 3,316 170,072 174,215 Czech Republic18 ... 6 2 28 31,142 31,206 Estonia
5,292 351 545 2,398 2,985 138,315 143,429 Hungary7 7 36 94 44 32,031 32,307 Latvia
110 12 297 33 55 35,561 35,618 Lithuania8 ... 8 – 6 2,347 2,353 Macedonia, FYR5 4 2 – – 646 646 Moldova6 ... 16 – ... 3,218 3,218 Montenegro
32,968 13,274 7,970 3,406 12,171 242,450 258,859 Poland8,909 561 5,723 128 1,243 113,282 114,664 Romania
15,856 433 6,740 9,374 12,510 167,603 194,610 Russia45 7 1,825 25 ... 23,137 23,211 Serbia
19,981 686 4,149 16,707 16,865 108,391 129,831 Turkey1,839 73 5,161 499 852 37,815 39,245 Ukraine
– ... ... ... 103 1 104 Res. Serbia & Montenegro– 4 – ... ... 1,004 1,005 Residual Europe
32,906 8,881 28,509 96,923 180,597 624,091 895,513 Latin America/Caribbean2,199 324 788 3,954 5,035 24,820 30,395 Argentina
180 593 152 214 2 1,286 1,795 Belize68 ... 10 8 27 280 307 Bolivia
11,333 7,151 19,210 51,957 51,685 258,801 331,726 Brazil5,217 49 303 2,777 6,707 65,820 85,575 Chile
661 4 217 1,214 5,916 16,432 23,405 Colombia84 12 81 1,355 1,567 2,161 5,937 Costa Rica63 12 3 12 ... 1,214 1,427 Cuba1 ... – 5 ... 55 214 Dominica
146 13 35 115 821 1,228 3,365 Dominican Republic13 26 26 417 876 772 1,677 Ecuador25 1 41 1,863 2,670 2,281 6,971 El Salvador– ... – 28 – 31 31 Falkland Islands4 ... 10 2 – 20 305 Grenada
31 2 418 59 2,417 756 3,260 Guatemala51 ... – 2 44 53 276 Guyana– ... – 3 88 61 256 Haiti
86 ... 2 1,044 742 1,695 2,507 Honduras44 2 115 59 670 565 6,003 Jamaica
11,567 194 5,605 28,577 93,778 192,082 309,595 Mexico39 6 – 64 275 142 431 Nicaragua68 2 11 300 290 1,331 1,625 Paraguay
297 9 376 1,126 2,759 14,690 26,075 Peru15 ... 12 77 ... 310 1,779 St. Lucia22 ... 52 53 ... 282 586 St. Vincent11 ... – – – 17 353 Surinam93 1 97 291 490 2,288 9,074 Trinidad and Tobago3 ... 20 94 ... 340 1,083 Turks and Caicos
180 12 136 670 478 4,365 5,410 Uruguay405 186 789 583 2,995 29,237 33,026 Venezuela
– 282 – ... 265 676 1,044 Residual1,434 180 5,844 16,847 ... 55,469 61,127 Int. organisations
– 13 – 89 ... 8,698 14,499 Unallocated
BIS Quarterly Review, December 2009 A 81

Countries 2006 2007 2008 Q3 2007 Q4 2007 Q1 2008 Q2 2008 Q3 2008 Q4 2008 Q1 2009 Q2 2009 Q3 2009
All Countries 2,064.0 2,770.0 1,537.8 687.7 662.7 450.8 445.8 413.7 227.6 178.4 290.7 198.3
Developed Countries 1,722.3 2,256.6 1,173.7 541.9 541.0 369.6 328.7 286.9 188.5 140.7 251.0 150.8 Australia 50.6 81.9 50.2 19.5 23.2 12.5 15.3 12.1 10.3 10.7 7.1 13.9 Austria 6.8 4.9 9.6 1.6 0.5 2.4 4.7 1.9 0.7 – 1.0 0.4 Belgium 21.6 28.2 11.7 2.1 16.5 6.6 1.3 – 3.8 – 2.0 5.5 Canada 61.5 78.5 44.4 25.2 12.2 13.7 7.9 7.7 15.2 3.7 8.8 7.5 Denmark 20.3 9.6 15.6 5.3 0.3 12.1 3.0 0.6 – 0.8 0.1 0.4 Finland 6.3 10.5 7.9 1.6 3.3 – 7.3 0.3 0.3 1.2 6.3 0.4 France 101.1 167.5 76.4 30.2 48.0 34.0 31.5 6.6 4.3 6.0 5.3 8.8 Germany 133.0 126.4 47.0 41.6 37.6 11.6 9.3 13.0 13.1 19.9 24.6 8.2 Greece 7.6 15.1 13.4 4.4 3.6 2.9 3.3 4.1 3.1 – – – Iceland 4.1 5.7 0.3 1.4 – – – 0.3 – – – 2.5 Ireland 7.6 7.1 4.5 1.8 1.2 1.0 1.4 0.4 1.6 0.4 0.5 0.1 Italy 38.9 36.5 23.1 9.0 11.6 1.4 14.3 3.9 3.5 0.4 15.2 3.6 Japan 52.0 75.5 46.4 14.5 11.1 23.5 5.9 12.7 4.2 15.7 6.3 11.8 Luxembourg 24.1 2.9 1.6 1.2 0.1 – 1.1 0.1 0.4 2.8 3.8 – Netherlands 48.6 63.8 36.4 29.8 19.6 17.6 9.1 8.1 1.6 2.6 6.1 11.3 New Zealand 8.4 9.9 8.1 2.1 1.8 2.1 1.9 3.6 0.6 0.4 1.0 0.7 Norway 25.7 20.2 21.1 6.4 2.3 5.1 10.4 4.8 0.7 2.7 1.1 0.9 Portugal 4.8 6.6 8.2 0.2 1.2 1.3 2.2 2.7 2.0 2.9 0.2 1.1 Slovenia 1.8 2.8 2.5 – 1.2 0.1 2.0 0.0 0.3 0.4 0.7 0.2 Spain 76.5 112.4 75.4 22.3 31.5 14.5 8.8 43.5 8.7 16.1 50.1 4.9 Sweden 34.9 31.0 17.8 7.6 1.7 2.4 5.3 8.1 1.9 5.5 – 0.4 Switzerland 16.9 47.7 16.3 5.8 23.1 4.2 2.5 2.1 7.5 0.8 11.2 0.5 United Kingdom 189.4 240.8 191.0 52.0 33.8 86.6 41.2 32.2 31.0 11.0 20.2 8.4 United States 778.3 1,070.3 442.7 255.7 255.1 113.2 138.6 117.6 73.3 36.8 78.3 58.0
Offshore Centres 58.6 70.8 53.4 20.0 16.1 11.1 12.7 24.1 5.5 6.2 5.7 3.6 Bahrain 3.1 9.0 2.1 0.8 – 0.3 0.6 1.2 – – 1.6 – Bermuda 9.1 5.4 6.5 1.0 2.1 0.2 1.7 3.8 0.9 0.5 – 0.2 Cayman Islands 0.3 0.9 – – 0.6 – – – – 0.0 – 0.1 Hong Kong SAR 26.2 28.3 16.2 8.5 5.0 4.2 3.9 6.8 1.3 0.9 0.9 2.6 Macao SAR 1.6 2.6 – – 2.4 – – – – 0.1 0.0 – Singapore 16.0 23.0 24.4 8.5 6.0 5.8 5.8 10.6 2.3 4.6 3.0 0.8
Developing Countries 282.9 442.2 309.6 125.7 105.5 69.9 104.1 102.1 33.5 31.5 34.0 43.4
Africa & Middle East 76.3 125.4 86.8 37.1 35.2 15.0 35.2 32.7 4.0 7.0 15.2 13.6 Egypt 1.9 1.9 6.5 0.4 0.9 1.2 3.7 1.2 0.3 – 0.1 0.4 Israel 2.1 4.1 0.8 1.5 1.5 – 0.3 0.5 – – – – Kuwait 9.1 11.3 4.4 7.6 0.4 1.0 2.9 0.2 0.3 0.1 0.3 2.5 Liberia 0.8 1.2 1.0 0.3 0.2 0.9 – 0.1 – – – – Oman 1.6 3.9 1.0 1.5 – 0.5 0.1 0.5 – – – – Qatar 9.3 21.7 12.0 6.5 8.7 0.9 3.1 6.6 1.4 0.9 0.9 0.7 Saudi Arabia 16.4 23.3 12.5 8.8 0.6 0.7 9.4 2.4 – – 1.1 2.3 South Africa 13.5 11.3 4.2 0.6 4.1 1.7 1.3 0.6 0.6 1.9 1.8 0.9 United Arab Emirates 17.5 42.8 33.3 8.1 17.5 6.9 11.4 13.7 1.4 3.9 8.9 3.2
Asia & Pacific 84.4 134.0 97.1 32.4 39.6 25.5 24.3 34.2 13.1 15.2 11.3 12.1 China 11.3 17.8 17.7 7.6 3.6 5.0 4.8 7.1 0.9 6.3 0.8 1.5 Chinese Taipei 16.4 12.2 11.0 2.1 2.5 1.9 3.8 2.5 2.8 0.3 1.7 1.2 India 15.6 36.0 19.7 7.0 14.0 5.3 4.4 6.8 3.2 3.4 4.1 1.7 Indonesia 2.7 3.5 6.2 0.8 1.2 1.1 1.9 2.2 1.1 0.3 0.9 0.9 Kazakhstan 8.3 7.7 7.0 2.3 0.5 2.4 0.3 3.5 0.9 – 0.2 – Malaysia 8.8 13.4 12.2 1.3 2.6 3.7 1.3 6.4 0.8 1.4 0.7 4.7 South Korea 13.4 31.6 14.8 6.0 12.2 4.7 5.5 3.0 1.6 2.1 2.5 1.0 Thailand 2.6 0.8 1.8 0.5 0.1 – 0.3 1.4 – 0.1 – 0.3 Vietnam 0.7 2.9 2.2 1.3 0.5 0.9 0.5 0.4 0.3 0.4 0.1 –
Europe 69.4 123.9 86.2 32.5 22.7 18.0 31.1 26.3 10.8 4.2 4.0 10.4 Bulgaria 0.3 0.8 0.2 0.5 0.3 – 0.2 0.1 – – 0.0 – Croatia 1.2 1.6 1.4 – 0.5 – 0.5 0.6 0.3 1.0 0.2 – Czech Republic 2.3 5.4 1.7 0.6 3.0 1.2 – 0.5 – 0.7 – 0.7 Hungary 1.4 7.3 2.6 0.1 5.1 0.6 0.5 0.8 0.8 – 0.3 – Latvia 1.3 2.1 0.7 0.5 0.1 0.4 – 0.3 – – – – Poland 5.0 2.6 2.9 0.9 0.7 0.6 1.8 0.5 – – 0.7 – Russia 35.5 81.3 57.6 21.7 9.4 10.9 21.0 17.9 7.8 1.5 0.3 4.7 Turkey 18.6 16.4 14.9 5.9 2.0 3.3 5.4 4.5 1.7 1.0 2.4 4.7 Ukraine 1.9 4.1 2.8 1.8 1.1 0.6 1.1 1.1 0.1 – – 0.1
Latin America & Caribbean 52.8 58.8 39.6 23.8 8.0 11.4 13.6 9.0 5.7 5.0 3.5 7.3 Argentina 3.3 6.5 1.7 3.8 0.4 1.1 0.1 0.2 0.4 0.2 0.1 – Brazil 9.3 23.1 16.0 6.6 5.8 4.8 4.9 2.5 3.9 2.4 1.4 5.0 Chile 4.7 1.9 3.7 1.1 0.1 0.7 2.0 1.0 – 0.1 0.5 0.4 Mexico 26.6 19.0 11.3 11.4 1.1 3.0 3.2 4.0 1.1 2.2 0.5 1.8 Peru 0.8 0.8 3.1 0.6 0.2 0.6 1.9 0.3 0.3 0.1 – – Venezuela 0.1 2.5 2.1 – 0.1 1.2 1.0 – – – – –
Int. organisations 0.2 0.5 1.1 0.2 0.2 0.2 0.2 0.6 0.1 – – 0.5
Table 10: Signed international syndicated credit facilitiesBy nationality of borrowerIn billions of US dollars
A 82 BIS Quarterly Review, December 2009

BIS Quarterly Review, December 2009 A83
Securities markets1
11 International debt securities by residence of issuer .......................................... page A85
12 International debt securities by nationality of issuer A All issuers ........................................................................................................................ A86 B Financial institutions ........................................................................................................ A87 C Corporate issuers ............................................................................................................ A88 D Governments ................................................................................................................... A89
13 International debt securities by type, sector and currency A Money market instruments ............................................................................................... A90 B Bonds and notes .............................................................................................................. A91
14 International debt securities by residence of issuer A Money market instruments ............................................................................................... A92 B Bonds and notes .............................................................................................................. A93
15 International debt securities by nationality of issuer A Money market instruments ............................................................................................... A94 B Bonds and notes .............................................................................................................. A95
16 Domestic debt securities by sector and residence of issuer A All issuers and governments ............................................................................................ A96 B Financial institutions and corporate issuers...................................................................... A97
17 Debt securities with remaining maturity up to one year A Domestic securities.......................................................................................................... A98 B International securities ..................................................................................................... A99
18 Announced international equity issues by nationality of issuer .............................. A100
1 More detailed data and a full set of historical time series are available on the BIS website under
http://www.bis.org/statistics/secstats.htm.


Countries Dec 2007 Dec 2008 Jun 2009 Sep 2009 2007 2008 Q4 2008 Q1 2009 Q2 2009 Q3 2009
All countries 22,710.5 23,861.6 25,902.1 26,897.9 2,976.0 2,429.9 515.2 691.6 842.1 474.6
Developed countries 19,573.1 20,790.3 22,700.8 23,593.6 2,533.9 2,415.0 544.9 677.9 759.5 417.5 Australia 483.5 447.8 472.8 510.8 41.1 0.4 –27.9 –12.4 21.3 24.4 Austria 351.4 367.8 384.5 400.4 41.5 28.5 12.1 11.5 0.5 2.9 Belgium 205.7 262.1 305.2 345.0 40.1 70.8 28.7 9.4 26.9 29.1 Canada 434.2 462.0 513.0 535.4 53.2 73.0 –8.6 13.9 25.0 3.7 Cyprus 12.6 10.2 12.5 13.3 2.4 –1.6 –4.1 –0.7 2.8 0.4 Denmark 110.7 122.9 150.1 160.9 5.4 20.1 6.1 13.8 10.2 6.4 Finland 114.3 111.8 131.6 138.7 –4.7 4.3 1.0 14.2 2.7 2.7 France 1,416.2 1,497.5 1,725.7 1,819.5 131.1 170.2 21.0 56.9 136.0 39.7 Germany 2,191.0 2,149.2 2,139.6 2,186.4 144.7 72.6 52.1 –43.2 0.9 –21.2 Greece 176.1 192.8 252.7 265.4 19.1 27.0 4.9 24.3 28.8 3.7 Iceland 57.4 52.6 46.6 45.8 3.8 0.9 –2.4 –3.1 –2.9 –1.9 Ireland 1,128.9 1,215.3 1,318.7 1,397.2 263.7 171.2 57.8 47.7 23.7 41.5 Italy 929.1 1,010.2 1,084.7 1,159.5 90.5 136.1 69.3 35.4 18.4 36.5 Japan 164.8 186.3 168.8 175.6 6.1 –2.5 –5.9 –5.6 –5.6 –1.7 Luxembourg 458.7 448.4 449.8 478.1 54.4 8.9 –11.4 –7.1 3.9 17.2 Netherlands 1,632.8 1,667.2 1,856.2 1,932.2 184.4 130.6 26.6 84.6 66.2 21.4 New Zealand 19.4 12.5 11.3 9.1 0.5 –5.9 –1.4 –1.2 –0.4 –2.5 Norway 143.7 164.9 174.9 183.5 24.8 29.6 0.8 4.8 1.9 1.9 Portugal 109.7 131.3 161.9 178.0 16.6 29.9 6.4 14.7 12.2 9.9 Slovakia 5.4 5.2 8.1 8.4 1.1 – – – 2.7 – Spain 1,224.1 1,262.2 1,412.9 1,498.6 216.7 118.2 12.2 65.2 55.8 37.3 Sweden 248.0 264.4 322.7 355.4 46.4 33.5 –8.7 21.7 30.7 20.5 Switzerland 25.6 25.7 24.1 25.1 1.7 –0.0 –1.6 –1.6 0.2 0.1 United Kingdom 3,157.6 3,437.5 3,714.2 3,822.3 503.6 715.0 288.6 46.9 36.9 91.1 United States 4,767.2 5,276.0 5,848.5 5,933.0 643.9 582.5 30.4 286.6 258.7 49.1
Offshore centres 1,551.6 1,502.2 1,492.7 1,513.7 312.5 –42.0 –21.0 –15.7 3.4 3.9 Aruba 8.4 8.3 7.6 6.3 –0.9 –1.3 –0.7 –0.0 –0.4 –1.6 Bahamas 8.8 9.2 10.3 10.1 3.1 0.7 –0.8 –0.6 1.6 –0.3 Bermuda 46.9 56.5 66.2 68.7 8.6 9.6 –0.9 6.9 2.7 2.3 Cayman Islands 1,177.1 1,135.3 1,131.1 1,148.3 277.7 –36.6 –12.4 –13.9 7.4 5.1 Hong Kong SAR 49.6 48.4 46.2 46.2 0.6 –0.9 1.0 –3.2 0.9 –0.2 Lebanon 24.0 24.0 25.8 25.5 –0.3 0.1 – 2.1 –0.3 –0.4 Netherlands Antilles 127.9 117.9 108.8 109.5 8.0 –8.2 –4.2 –4.3 –5.3 –2.6 Panama 9.8 9.4 9.7 9.7 0.9 –0.4 –0.0 0.3 –0.0 – Singapore 56.0 53.4 48.1 49.8 7.0 –2.4 –2.8 –2.5 –2.8 1.1 West Indies UK 29.6 27.8 26.6 27.4 6.2 –1.7 –0.1 –0.5 –0.7 0.6
Developing countries 926.6 911.5 941.7 986.8 92.0 –0.3 –27.7 3.1 22.7 34.5
Africa & Middle East 114.8 115.9 125.0 134.4 21.5 4.1 –4.1 –0.8 8.6 8.4 Israel 13.2 14.3 15.5 15.5 –1.5 1.2 – 1.0 0.2 – Qatar 11.3 11.3 13.3 14.8 0.3 – – – 2.0 1.5 South Africa 23.9 20.4 22.1 23.2 7.4 –1.4 –0.0 –0.1 0.7 0.5 Tunisia 3.8 3.9 3.9 3.9 0.0 –0.0 –0.0 – – –0.2 United Arab Emirates 42.7 46.1 50.3 55.1 11.6 4.2 –3.8 –1.8 5.8 4.7
Asia & Pacific 261.0 258.8 269.5 283.6 29.4 –2.9 –10.5 3.4 7.9 11.9 China 20.5 22.5 22.3 23.2 4.6 1.9 –1.5 –0.0 –0.2 0.9 Chinese Taipei 15.4 10.1 7.3 7.0 –3.5 –5.3 –1.6 –1.5 –1.3 –0.4 India 29.3 30.3 28.7 28.2 12.9 1.0 0.6 –0.7 –0.8 –0.7 Indonesia 10.2 13.5 16.7 17.7 2.2 3.3 –0.3 2.7 0.6 0.9 Malaysia 24.9 25.3 21.9 25.7 –1.2 0.4 –0.7 –0.6 –2.8 3.8 Philippines 33.0 31.7 33.0 34.4 0.8 –1.4 –0.3 0.5 0.8 1.2 South Korea 106.5 104.7 119.5 126.9 13.8 –1.9 –6.1 3.7 11.5 6.0 Thailand 9.4 9.1 8.9 8.7 –2.1 –0.6 –0.4 –0.2 –0.0 –0.3
Europe 227.2 237.4 245.8 252.4 21.8 17.1 –2.0 0.0 6.7 1.6 Croatia 7.4 6.1 6.3 5.8 0.1 –1.0 – –0.7 0.8 –0.7 Hungary 34.5 37.4 35.6 38.4 4.2 5.0 –0.2 –1.6 –0.6 1.5 Poland 40.6 42.4 46.5 51.3 1.3 2.8 – 1.9 1.7 3.2 Russia 58.0 63.6 63.5 62.4 6.4 6.7 –0.2 –1.5 1.5 –1.5 Turkey 47.9 47.1 49.2 49.8 5.7 –0.1 –0.6 1.7 0.3 0.2
Latin America & Caribbean 323.6 299.5 301.4 316.5 19.4 –18.7 –11.0 0.5 –0.6 12.7 Argentina 70.5 58.3 56.8 55.5 2.9 –10.9 –7.0 –0.6 –1.3 –2.2 Brazil 82.0 76.2 80.4 85.5 1.9 –3.9 –2.1 0.8 2.1 3.9 Chile 13.6 12.9 12.5 13.3 –0.7 –0.7 – 0.6 –1.1 0.9 Colombia 18.1 17.2 18.3 20.4 1.4 –0.6 – 1.0 0.1 2.0 Mexico 68.8 63.9 64.8 69.0 2.6 –3.4 –1.5 –2.2 2.8 4.1 Peru 11.5 9.7 11.3 12.5 2.0 –1.6 –0.2 1.4 0.2 1.1 Uruguay 9.8 8.6 8.5 9.1 1.0 –1.0 –0.0 –0.0 –0.1 0.5 Venezuela 30.5 33.6 33.5 35.1 7.8 3.2 –0.2 – –0.1 1.5
Int. organisations 659.2 657.6 766.9 803.8 37.7 57.2 19.0 26.4 56.5 18.7
Amounts outstanding Net issues
Table 11: International debt securities - all issuersBy residence of issuerIn billions of US dollars
BIS Quarterly Review, December 2009 A 85

Countries Dec 2007 Dec 2008 Jun 2009 Sep 2009 2007 2008 Q4 2008 Q1 2009 Q2 2009 Q3 2009
All countries 22,710.5 23,861.6 25,902.1 26,897.9 2,976.0 2,429.9 515.2 691.6 842.1 474.6
Developed countries 20,643.2 21,785.5 23,680.2 24,566.4 2,763.2 2,340.9 534.1 673.5 747.3 398.5 Australia 486.0 468.5 492.6 520.6 68.3 16.0 –15.5 –7.0 15.8 16.2 Austria 341.7 352.9 367.3 380.6 41.3 22.7 9.9 8.5 1.6 0.9 Belgium 418.8 480.6 548.6 580.3 66.0 87.0 30.0 26.0 30.9 13.2 Canada 440.1 469.4 518.7 538.6 62.7 73.3 –10.6 12.6 25.0 1.0 Cyprus 7.5 8.4 13.0 14.0 1.5 1.3 0.7 –0.3 4.5 0.6 Denmark 121.2 140.7 166.8 176.3 24.7 28.4 7.0 12.5 10.6 4.5 Finland 110.7 107.6 127.8 134.4 –4.4 3.1 2.6 14.2 3.3 2.1 France 1,607.1 1,687.4 1,905.5 2,015.7 177.0 179.6 8.7 36.4 144.7 51.3 Germany 2,970.6 2,884.8 2,930.9 2,997.3 144.6 65.4 48.0 –10.2 8.2 –21.7 Greece 259.6 287.6 363.3 383.2 36.1 43.9 7.0 34.0 32.1 6.8 Iceland 67.2 58.4 53.3 54.4 4.2 –2.7 –2.7 –3.2 –2.2 –0.1 Ireland 399.6 488.0 549.8 580.1 126.7 119.9 49.2 32.0 17.2 14.2 Italy 1,160.9 1,232.8 1,299.9 1,398.8 119.8 140.8 55.8 30.2 13.3 54.6 Japan 360.5 400.5 389.1 407.2 27.7 9.5 –3.5 2.4 –7.3 1.7 Luxembourg 94.3 100.7 97.9 98.4 –1.7 10.4 7.0 –7.8 4.0 –2.0 Netherlands 1,129.6 1,135.0 1,247.7 1,302.4 90.4 72.6 5.8 50.7 36.1 18.2 New Zealand 8.3 6.0 6.1 6.1 1.6 –1.7 –0.3 –0.1 –0.1 –0.2 Norway 146.3 167.6 177.0 185.6 26.3 29.7 1.2 4.4 1.8 1.8 Portugal 220.4 229.7 273.3 294.2 28.2 23.6 4.1 22.2 15.4 11.2 Slovakia 5.7 5.5 8.4 8.7 1.1 – – – 2.7 – Spain 1,533.4 1,582.4 1,741.0 1,832.5 278.6 159.2 29.1 64.4 52.2 37.4 Sweden 273.0 295.4 352.8 386.9 45.7 41.1 –1.8 21.7 29.4 21.0 Switzerland 401.8 393.5 454.7 469.7 33.7 12.0 –35.5 38.1 15.5 4.6 United Kingdom 2,469.7 2,749.8 3,042.0 3,161.9 330.4 644.9 302.0 70.9 51.7 118.6 United States 5,603.2 6,045.0 6,542.2 6,622.5 1,031.0 559.4 35.8 220.1 238.7 37.8
Offshore centres 230.4 234.3 243.8 254.2 21.5 6.0 –5.7 –3.5 11.8 7.9 Aruba 0.1 0.2 0.2 0.2 0.0 0.1 – – – – Bahamas 1.2 1.3 1.3 1.3 –0.0 0.1 0.0 –0.0 0.0 –0.0 Bermuda 5.2 6.2 9.4 9.5 0.9 1.1 –0.2 1.3 1.9 0.0 Cayman Islands 57.2 61.5 67.4 70.0 6.4 4.4 –2.1 –4.7 10.0 1.0 Hong Kong SAR 67.9 67.8 69.6 75.6 3.9 0.7 –2.0 –0.9 2.3 5.8 Lebanon 24.0 24.0 25.8 25.5 –0.3 0.1 – 2.1 –0.3 –0.4 Netherlands Antilles – – – – – – – – – – Panama 9.4 9.0 9.3 9.3 0.9 –0.3 – 0.3 – – Singapore 51.2 52.8 49.0 51.1 5.3 2.3 –1.4 –1.3 –2.5 1.6 West Indies UK 2.6 1.0 1.0 1.0 2.4 –1.5 –0.0 –0.0 0.0 –0.1
Developing countries 1,177.7 1,184.1 1,211.1 1,273.5 153.7 25.9 –32.2 –4.8 26.5 49.5
Africa & Middle East 146.4 151.4 164.8 177.6 35.4 9.4 –3.3 –1.6 13.3 11.7 Israel 18.3 18.8 19.6 19.7 –1.6 0.7 –0.0 0.7 0.2 0.1 Qatar 11.3 11.6 15.1 16.6 0.3 0.3 – – 3.5 1.5 South Africa 34.1 29.9 31.1 32.8 9.5 –1.2 0.1 –0.5 0.4 1.1 Tunisia 3.8 3.9 3.9 3.9 0.0 –0.0 –0.0 – – –0.2 United Arab Emirates 52.0 59.6 67.2 73.8 19.3 8.9 –3.8 –1.9 9.2 6.3
Asia & Pacific 339.0 346.2 356.2 375.1 42.2 7.1 –11.3 0.2 10.2 15.9 China 38.9 44.8 43.8 43.8 8.6 5.6 –0.5 –1.4 0.4 –0.1 Chinese Taipei 19.1 13.7 10.7 10.5 –3.7 –5.5 –1.6 –1.5 –1.5 –0.4 India 37.8 40.8 40.1 39.3 14.8 3.4 0.8 –1.5 0.8 –1.0 Indonesia 20.0 24.0 27.5 29.6 1.8 3.9 –0.2 2.9 0.6 2.0 Malaysia 33.1 33.1 30.1 35.5 0.2 0.2 –0.6 –0.6 –2.4 5.0 Philippines 32.4 31.9 33.1 34.5 0.0 –0.8 –0.3 0.5 0.8 1.2 South Korea 111.8 108.6 123.4 132.5 11.4 –3.5 –8.0 3.2 11.9 7.5 Thailand 10.2 9.9 9.2 9.1 –2.1 –0.6 –0.4 –0.2 –0.5 –0.3
Europe 307.9 322.9 329.7 340.0 51.1 24.2 –5.7 –2.0 7.0 4.4 Croatia 6.7 5.5 5.6 5.8 0.4 –1.0 – –0.7 0.8 –0.0 Hungary 34.2 37.4 35.8 38.5 3.5 5.4 –0.2 –1.6 –0.5 1.5 Poland 43.9 44.7 48.8 54.0 0.0 1.9 –0.9 1.9 1.7 3.5 Russia 131.0 140.8 139.1 139.7 35.8 12.8 –2.8 –3.5 1.8 –0.5 Turkey 51.7 50.7 52.8 53.2 6.0 –0.3 –0.9 1.7 0.3 0.0
Latin America & Caribbean 384.4 363.5 360.4 380.8 25.1 –14.8 –11.8 –1.3 –4.1 17.5 Argentina 65.2 53.8 52.8 53.5 0.3 –10.2 –6.6 –0.3 –1.0 –0.2 Brazil 119.3 118.0 120.2 129.1 4.9 0.7 –2.0 –0.3 1.2 7.5 Chile 10.5 10.2 9.9 10.4 –0.5 –0.3 – 0.6 –0.8 0.4 Colombia 19.5 18.6 19.7 21.7 2.8 –0.6 – 1.0 0.1 2.0 Mexico 96.6 89.3 86.5 90.7 3.0 –5.3 –2.8 –2.9 –0.3 3.8 Peru 12.2 10.7 11.9 12.9 2.7 –1.4 –0.1 1.0 0.1 1.0 Uruguay 9.6 8.4 8.4 8.9 1.0 –1.0 –0.0 –0.0 –0.1 0.5 Venezuela 30.6 33.7 33.6 35.2 7.8 3.2 –0.2 – –0.1 1.5
Int. organisations 659.2 657.6 766.9 803.8 37.7 57.2 19.0 26.4 56.5 18.7
Amounts outstanding Net issues
Table 12A: International debt securities - all issuersBy nationality of issuerIn billions of US dollars
A 86 BIS Quarterly Review, December 2009

Countries Dec 2007 Dec 2008 Jun 2009 Sep 2009 2007 2008 Q4 2008 Q1 2009 Q2 2009 Q3 2009
All countries 17,978.0 18,900.5 20,203.3 20,904.0 2,570.5 1,964.0 425.8 405.6 489.8 294.6
Developed countries 17,308.6 18,212.7 19,513.8 20,176.6 2,437.6 1,935.2 449.8 421.1 475.6 264.0 Australia 451.6 434.3 456.2 481.8 61.2 13.8 –18.0 –6.8 15.1 15.4 Austria 213.4 215.6 221.2 228.7 31.5 7.5 1.6 1.4 2.1 –0.4 Belgium 284.7 336.7 383.5 402.1 48.0 69.1 21.9 19.9 19.2 5.6 Canada 232.3 263.0 286.9 300.6 50.8 68.7 –5.7 8.1 5.8 –1.7 Cyprus 5.3 6.4 8.8 9.9 1.5 1.4 0.5 0.1 2.0 0.8 Denmark 93.3 109.4 124.6 133.4 27.7 23.5 1.1 8.6 4.1 4.9 Finland 39.0 43.4 48.8 51.9 1.0 6.4 3.1 –0.1 4.7 1.5 France 1,260.4 1,335.7 1,480.2 1,558.9 166.0 149.8 9.5 20.9 96.2 33.2 Germany 2,544.2 2,480.2 2,512.5 2,563.0 124.9 62.6 58.2 –4.6 –4.7 –22.9 Greece 89.7 102.2 121.8 129.4 18.6 18.5 3.5 11.0 5.4 3.3 Iceland 62.4 53.9 48.8 50.1 4.1 –2.7 –2.2 –3.1 –2.2 0.2 Ireland 384.7 428.2 473.1 510.8 117.9 73.2 31.3 21.6 12.2 23.7 Italy 834.9 942.3 993.4 1,065.6 100.8 161.1 59.2 24.0 8.4 38.0 Japan 299.4 330.5 332.3 349.3 32.4 11.6 0.2 6.2 –0.7 3.8 Luxembourg 90.7 92.3 79.3 78.2 –1.7 5.7 5.1 –9.5 –4.3 –3.0 Netherlands 1,060.4 1,045.9 1,156.3 1,201.6 93.6 48.7 5.7 42.6 43.7 11.2 New Zealand 3.4 2.8 2.8 2.9 0.9 –0.2 –0.4 0.0 –0.1 0.0 Norway 124.0 146.5 148.2 156.2 25.8 30.1 1.6 1.2 –2.0 1.9 Portugal 159.4 165.2 197.4 213.6 26.7 16.4 1.2 17.8 10.2 9.2 Slovakia 0.3 0.3 0.3 0.3 – – – – – – Spain 1,396.6 1,441.7 1,571.1 1,639.7 271.2 146.5 29.2 53.1 38.0 20.2 Sweden 222.8 255.9 289.5 316.5 34.7 49.1 –0.8 12.0 16.5 16.3 Switzerland 386.5 379.1 438.7 450.9 33.9 12.5 –35.5 37.3 15.0 2.2 United Kingdom 2,182.7 2,468.7 2,719.5 2,828.2 307.5 606.5 291.6 60.1 39.1 106.2 United States 4,884.2 5,130.3 5,416.8 5,447.9 858.5 355.3 –12.2 99.5 152.0 –8.1
Offshore centres 164.0 168.3 170.9 180.5 17.8 6.2 –4.9 –6.6 8.1 7.3 Aruba 0.0 0.0 0.0 0.0 – – – – – – Bahamas 0.0 0.0 0.0 0.0 –0.0 –0.0 0.0 –0.0 0.0 –0.0 Bermuda 4.9 5.0 5.6 5.6 0.6 0.1 –0.2 –0.4 1.0 – Cayman Islands 57.2 61.5 67.4 70.0 6.4 4.4 –2.1 –4.7 10.0 1.0 Hong Kong SAR 50.0 51.0 51.6 58.1 3.3 1.7 –1.8 0.1 0.2 6.3 Lebanon 0.7 0.6 0.6 0.6 –0.2 –0.1 – – – – Netherlands Antilles – – – – – – – – – – Panama 0.6 0.6 0.6 0.6 0.2 – – – – – Singapore 37.7 38.9 34.9 35.4 3.4 1.9 –0.7 –1.3 –2.8 0.2 West Indies UK 2.4 0.9 0.9 0.8 2.4 –1.5 –0.0 –0.0 0.0 –0.1
Developing countries 505.4 519.6 518.6 547.0 115.0 22.6 –19.1 –9.0 6.2 23.3
Africa & Middle East 81.2 82.2 83.7 89.1 25.6 4.5 –3.3 –2.5 2.7 4.8 Israel 5.0 4.9 4.5 4.6 –0.2 –0.1 –0.0 –0.3 –0.1 0.1 Qatar 3.0 3.3 3.3 3.3 0.3 0.3 – – – – South Africa 17.9 16.1 16.5 17.5 7.7 0.4 0.1 –0.4 –0.2 0.7 Tunisia – – – – – – – – – – United Arab Emirates 40.5 42.4 44.0 47.3 12.6 3.1 –3.8 –1.9 3.2 3.1
Asia & Pacific 200.5 208.7 211.1 226.5 34.1 8.2 –7.7 –1.6 4.2 13.3 China 28.5 33.8 32.3 32.1 5.0 4.9 1.0 –1.4 –0.2 –0.2 Chinese Taipei 4.8 4.7 3.8 3.9 –0.8 –0.3 –0.0 –0.1 –0.7 0.0 India 16.1 17.1 16.0 15.6 8.7 1.0 0.7 –1.1 0.1 –0.5 Indonesia 11.6 11.9 11.7 12.9 –0.9 0.1 –0.0 –0.1 –0.0 1.2 Malaysia 23.5 23.8 22.5 27.9 0.5 0.5 –0.6 –0.4 –0.8 5.0 Philippines 4.5 3.9 3.8 4.4 –0.3 –0.8 –0.3 –0.1 – 0.6 South Korea 76.9 75.5 84.1 90.8 12.8 –1.3 –8.0 2.4 6.4 5.5 Thailand 4.9 5.0 4.6 4.3 –0.8 0.1 –0.0 – –0.5 –0.3
Europe 125.1 128.3 125.5 127.3 40.8 7.1 –5.0 –2.4 –0.7 0.1 Croatia 1.2 1.1 1.1 1.2 0.3 – – – – – Hungary 10.6 12.7 11.9 12.2 2.3 3.0 –0.2 –1.0 0.1 –0.1 Poland 3.5 2.0 2.0 2.4 –2.9 –1.4 –0.9 – –0.0 0.3 Russia 87.4 89.9 87.6 88.1 35.0 5.0 –2.9 –2.1 –0.3 –0.3 Turkey 11.4 10.8 11.5 11.2 3.0 –0.6 –0.3 0.7 – –0.4
Latin America & Caribbean 98.5 100.4 98.3 104.1 14.5 2.8 –3.1 –2.5 –0.0 5.1 Argentina 3.1 2.8 2.8 2.9 0.7 –0.3 –0.2 – 0.0 0.1 Brazil 52.8 57.2 56.5 62.3 6.5 4.5 –1.5 –1.0 0.1 5.3 Chile 0.8 0.7 0.7 0.9 0.1 –0.0 – – – 0.2 Colombia 1.9 1.9 1.9 1.9 1.8 – – – – – Mexico 32.5 30.5 29.0 28.6 2.9 –1.2 –1.1 –1.6 –0.1 –0.5 Peru 2.6 2.6 2.8 2.8 0.8 0.0 –0.1 0.0 0.1 0.0 Uruguay 0.2 0.1 – – –0.1 –0.1 – – –0.1 – Venezuela 1.6 1.5 1.4 1.4 –0.1 –0.1 –0.1 – –0.1 –
Amounts outstanding Net issues
Table 12B: International debt securities - financial institutionsBy nationality of issuerIn billions of US dollars
BIS Quarterly Review, December 2009 A 87
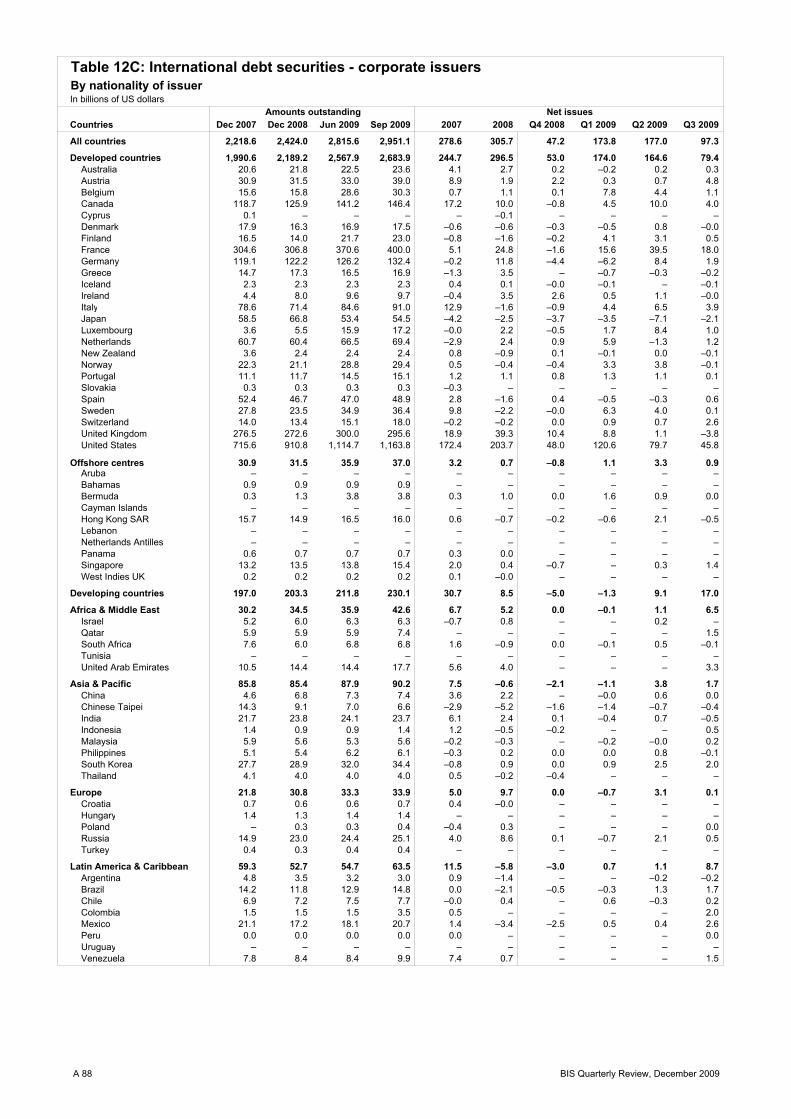
Countries Dec 2007 Dec 2008 Jun 2009 Sep 2009 2007 2008 Q4 2008 Q1 2009 Q2 2009 Q3 2009
All countries 2,218.6 2,424.0 2,815.6 2,951.1 278.6 305.7 47.2 173.8 177.0 97.3
Developed countries 1,990.6 2,189.2 2,567.9 2,683.9 244.7 296.5 53.0 174.0 164.6 79.4 Australia 20.6 21.8 22.5 23.6 4.1 2.7 0.2 –0.2 0.2 0.3 Austria 30.9 31.5 33.0 39.0 8.9 1.9 2.2 0.3 0.7 4.8 Belgium 15.6 15.8 28.6 30.3 0.7 1.1 0.1 7.8 4.4 1.1 Canada 118.7 125.9 141.2 146.4 17.2 10.0 –0.8 4.5 10.0 4.0 Cyprus 0.1 – – – – –0.1 – – – – Denmark 17.9 16.3 16.9 17.5 –0.6 –0.6 –0.3 –0.5 0.8 –0.0 Finland 16.5 14.0 21.7 23.0 –0.8 –1.6 –0.2 4.1 3.1 0.5 France 304.6 306.8 370.6 400.0 5.1 24.8 –1.6 15.6 39.5 18.0 Germany 119.1 122.2 126.2 132.4 –0.2 11.8 –4.4 –6.2 8.4 1.9 Greece 14.7 17.3 16.5 16.9 –1.3 3.5 – –0.7 –0.3 –0.2 Iceland 2.3 2.3 2.3 2.3 0.4 0.1 –0.0 –0.1 – –0.1 Ireland 4.4 8.0 9.6 9.7 –0.4 3.5 2.6 0.5 1.1 –0.0 Italy 78.6 71.4 84.6 91.0 12.9 –1.6 –0.9 4.4 6.5 3.9 Japan 58.5 66.8 53.4 54.5 –4.2 –2.5 –3.7 –3.5 –7.1 –2.1 Luxembourg 3.6 5.5 15.9 17.2 –0.0 2.2 –0.5 1.7 8.4 1.0 Netherlands 60.7 60.4 66.5 69.4 –2.9 2.4 0.9 5.9 –1.3 1.2 New Zealand 3.6 2.4 2.4 2.4 0.8 –0.9 0.1 –0.1 0.0 –0.1 Norway 22.3 21.1 28.8 29.4 0.5 –0.4 –0.4 3.3 3.8 –0.1 Portugal 11.1 11.7 14.5 15.1 1.2 1.1 0.8 1.3 1.1 0.1 Slovakia 0.3 0.3 0.3 0.3 –0.3 – – – – – Spain 52.4 46.7 47.0 48.9 2.8 –1.6 0.4 –0.5 –0.3 0.6 Sweden 27.8 23.5 34.9 36.4 9.8 –2.2 –0.0 6.3 4.0 0.1 Switzerland 14.0 13.4 15.1 18.0 –0.2 –0.2 0.0 0.9 0.7 2.6 United Kingdom 276.5 272.6 300.0 295.6 18.9 39.3 10.4 8.8 1.1 –3.8 United States 715.6 910.8 1,114.7 1,163.8 172.4 203.7 48.0 120.6 79.7 45.8
Offshore centres 30.9 31.5 35.9 37.0 3.2 0.7 –0.8 1.1 3.3 0.9 Aruba – – – – – – – – – – Bahamas 0.9 0.9 0.9 0.9 – – – – – – Bermuda 0.3 1.3 3.8 3.8 0.3 1.0 0.0 1.6 0.9 0.0 Cayman Islands – – – – – – – – – – Hong Kong SAR 15.7 14.9 16.5 16.0 0.6 –0.7 –0.2 –0.6 2.1 –0.5 Lebanon – – – – – – – – – – Netherlands Antilles – – – – – – – – – – Panama 0.6 0.7 0.7 0.7 0.3 0.0 – – – – Singapore 13.2 13.5 13.8 15.4 2.0 0.4 –0.7 – 0.3 1.4 West Indies UK 0.2 0.2 0.2 0.2 0.1 –0.0 – – – –
Developing countries 197.0 203.3 211.8 230.1 30.7 8.5 –5.0 –1.3 9.1 17.0
Africa & Middle East 30.2 34.5 35.9 42.6 6.7 5.2 0.0 –0.1 1.1 6.5 Israel 5.2 6.0 6.3 6.3 –0.7 0.8 – – 0.2 – Qatar 5.9 5.9 5.9 7.4 – – – – – 1.5 South Africa 7.6 6.0 6.8 6.8 1.6 –0.9 0.0 –0.1 0.5 –0.1 Tunisia – – – – – – – – – – United Arab Emirates 10.5 14.4 14.4 17.7 5.6 4.0 – – – 3.3
Asia & Pacific 85.8 85.4 87.9 90.2 7.5 –0.6 –2.1 –1.1 3.8 1.7 China 4.6 6.8 7.3 7.4 3.6 2.2 – –0.0 0.6 0.0 Chinese Taipei 14.3 9.1 7.0 6.6 –2.9 –5.2 –1.6 –1.4 –0.7 –0.4 India 21.7 23.8 24.1 23.7 6.1 2.4 0.1 –0.4 0.7 –0.5 Indonesia 1.4 0.9 0.9 1.4 1.2 –0.5 –0.2 – – 0.5 Malaysia 5.9 5.6 5.3 5.6 –0.2 –0.3 – –0.2 –0.0 0.2 Philippines 5.1 5.4 6.2 6.1 –0.3 0.2 0.0 0.0 0.8 –0.1 South Korea 27.7 28.9 32.0 34.4 –0.8 0.9 0.0 0.9 2.5 2.0 Thailand 4.1 4.0 4.0 4.0 0.5 –0.2 –0.4 – – –
Europe 21.8 30.8 33.3 33.9 5.0 9.7 0.0 –0.7 3.1 0.1 Croatia 0.7 0.6 0.6 0.7 0.4 –0.0 – – – – Hungary 1.4 1.3 1.4 1.4 – – – – – – Poland – 0.3 0.3 0.4 –0.4 0.3 – – – 0.0 Russia 14.9 23.0 24.4 25.1 4.0 8.6 0.1 –0.7 2.1 0.5 Turkey 0.4 0.3 0.4 0.4 – – – – – –
Latin America & Caribbean 59.3 52.7 54.7 63.5 11.5 –5.8 –3.0 0.7 1.1 8.7 Argentina 4.8 3.5 3.2 3.0 0.9 –1.4 – – –0.2 –0.2 Brazil 14.2 11.8 12.9 14.8 0.0 –2.1 –0.5 –0.3 1.3 1.7 Chile 6.9 7.2 7.5 7.7 –0.0 0.4 – 0.6 –0.3 0.2 Colombia 1.5 1.5 1.5 3.5 0.5 – – – – 2.0 Mexico 21.1 17.2 18.1 20.7 1.4 –3.4 –2.5 0.5 0.4 2.6 Peru 0.0 0.0 0.0 0.0 0.0 – – – – 0.0 Uruguay – – – – – – – – – – Venezuela 7.8 8.4 8.4 9.9 7.4 0.7 – – – 1.5
Amounts outstanding Net issues
Table 12C: International debt securities - corporate issuersBy nationality of issuerIn billions of US dollars
A 88 BIS Quarterly Review, December 2009

Countries Dec 2007 Dec 2008 Jun 2009 Sep 2009 2007 2008 Q4 2008 Q1 2009 Q2 2009 Q3 2009
All countries 1,854.8 1,879.4 2,116.2 2,239.0 89.3 103.1 23.2 85.8 118.8 63.9
Developed countries 1,344.0 1,383.6 1,598.5 1,705.9 80.9 109.2 31.3 78.4 107.2 55.0 Australia 13.8 12.3 13.9 15.2 3.0 –0.5 2.3 –0.0 0.5 0.5 Austria 97.4 105.8 113.1 112.9 0.9 13.3 6.1 6.7 –1.2 –3.5 Belgium 118.5 128.2 136.4 147.9 17.3 16.9 8.0 –1.7 7.3 6.6 Canada 89.1 80.5 90.6 91.5 –5.2 –5.4 –4.0 –0.0 9.2 –1.3 Cyprus 2.1 2.0 4.2 4.2 – 0.0 0.2 –0.3 2.5 –0.2 Denmark 10.0 15.0 25.4 25.5 –2.4 5.4 6.2 4.3 5.7 –0.4 Finland 55.3 50.3 57.4 59.5 –4.6 –1.7 –0.3 10.3 –4.4 0.1 France 42.1 44.8 54.7 56.8 5.9 5.1 0.8 –0.0 9.1 0.1 Germany 307.3 282.4 292.1 301.9 20.0 –9.0 –5.8 0.7 4.6 –0.6 Greece 155.2 168.2 225.0 236.8 18.8 21.8 3.6 23.7 27.0 3.7 Iceland 2.5 2.2 2.2 2.1 –0.3 –0.2 –0.4 – – –0.2 Ireland 10.5 51.9 67.1 59.6 9.2 43.2 15.3 9.9 3.9 –9.5 Italy 247.4 219.0 222.0 242.2 6.1 –18.8 –2.5 1.8 –1.7 12.8 Japan 2.6 3.1 3.3 3.5 –0.5 0.5 – –0.3 0.5 – Luxembourg – 2.8 2.8 2.9 – 2.5 2.5 – – – Netherlands 8.5 28.8 25.0 31.4 –0.2 21.6 –0.7 2.2 –6.3 5.8 New Zealand 1.3 0.8 0.9 0.8 0.0 –0.6 –0.1 0.1 – –0.1 Norway – – – – – – – – – – Portugal 49.8 52.7 61.4 65.6 0.3 6.0 2.1 3.1 4.1 1.9 Slovakia 5.2 4.9 7.8 8.1 1.3 – – – 2.7 – Spain 84.4 94.0 123.0 143.8 4.7 14.3 –0.6 11.7 14.5 16.6 Sweden 22.4 15.9 28.5 34.0 1.2 –5.9 –1.1 3.5 8.9 4.5 Switzerland 1.3 1.1 0.8 0.8 –0.1 –0.3 – – –0.2 –0.1 United Kingdom 10.5 8.5 22.4 38.2 4.0 –1.0 – 2.0 11.5 16.3 United States 3.4 3.8 10.7 10.7 0.1 0.4 0.0 –0.0 6.9 0.0
Offshore centres 35.5 34.6 37.0 36.7 0.4 –0.8 – 2.0 0.4 –0.4 Aruba 0.1 0.2 0.2 0.2 0.0 0.1 – – – – Bahamas 0.2 0.3 0.3 0.3 – 0.1 – – – – Bermuda – – – – – – – – – – Cayman Islands – – – – – – – – – – Hong Kong SAR 2.2 1.9 1.4 1.4 – –0.3 – –0.5 – – Lebanon 23.3 23.4 25.2 24.9 –0.1 0.1 – 2.1 –0.3 –0.4 Netherlands Antilles – – – – – – – – – – Panama 8.1 7.7 8.1 8.1 0.5 –0.4 – 0.3 – – Singapore 0.3 0.3 0.3 0.4 – – – – – – West Indies UK – – – – – – – – – –
Developing countries 475.3 461.2 480.7 496.4 8.0 –5.2 –8.1 5.5 11.1 9.2
Africa & Middle East 35.0 34.7 45.2 45.9 3.1 –0.3 –0.0 1.0 9.5 0.3 Israel 8.0 7.9 8.9 8.9 –0.7 – – 1.0 – – Qatar 2.4 2.4 5.9 5.9 – – – – 3.5 – South Africa 8.6 7.8 7.8 8.4 0.1 –0.8 – – – 0.5 Tunisia 3.8 3.9 3.9 3.9 0.0 –0.0 –0.0 – – –0.2 United Arab Emirates 1.0 2.8 8.8 8.8 1.0 1.8 – – 6.0 –
Asia & Pacific 52.7 52.1 57.2 58.4 0.6 –0.5 –1.6 2.9 2.2 1.0 China 5.8 4.2 4.2 4.3 – –1.5 –1.5 – – – Chinese Taipei – – – – – – – – – – India – – – – – – – – – – Indonesia 7.0 11.2 14.9 15.2 1.5 4.2 – 3.0 0.7 0.4 Malaysia 3.7 3.7 2.2 2.1 – – – – –1.5 –0.1 Philippines 22.8 22.6 23.2 24.0 0.6 –0.2 – 0.6 – 0.8 South Korea 7.3 4.2 7.3 7.3 –0.6 –3.0 – – 3.0 – Thailand 1.2 0.9 0.7 0.7 –1.8 –0.4 –0.0 –0.2 – –
Europe 161.0 163.8 170.9 178.8 5.3 7.3 –0.8 1.1 4.6 4.2 Croatia 4.8 3.8 3.9 4.0 –0.3 –0.9 – –0.7 0.8 –0.0 Hungary 22.2 23.3 22.5 24.9 1.2 2.4 – –0.7 –0.5 1.7 Poland 40.4 42.4 46.5 51.3 3.3 3.1 – 1.9 1.7 3.1 Russia 28.6 27.8 27.1 26.5 –3.2 –0.8 – –0.7 – –0.7 Turkey 39.9 39.5 40.9 41.7 3.0 0.2 –0.6 1.0 0.3 0.4
Latin America & Caribbean 226.6 210.5 207.5 213.2 –0.9 –11.8 –5.7 0.6 –5.1 3.7 Argentina 57.3 47.5 46.7 47.6 –1.3 –8.6 –6.4 –0.3 –0.8 – Brazil 52.4 49.0 50.7 52.0 –1.7 –1.7 – 1.0 –0.2 0.5 Chile 2.9 2.3 1.8 1.8 –0.6 –0.6 – – –0.5 – Colombia 16.1 15.2 16.3 16.3 0.5 –0.6 – 1.0 0.1 – Mexico 43.0 41.6 39.4 41.4 –1.3 –0.7 0.8 –1.8 –0.5 1.8 Peru 9.6 8.0 9.1 10.1 1.8 –1.4 – 1.0 – 1.0 Uruguay 9.4 8.3 8.4 8.9 1.1 –0.9 –0.0 –0.0 –0.0 0.5 Venezuela 21.2 23.8 23.8 23.9 0.4 2.7 –0.1 – – –
Amounts outstanding Net issues
Table 12D: International debt securities - governmentsBy nationality of issuerIn billions of US dollars
BIS Quarterly Review, December 2009 A 89

Type, sector and currency Dec 2008 Jun 2009 Sep 2009 Q2 2009 Q3 2009 2007 2008 Q1 2009 Q2 2009 Q3 2009
Total issues 1,131.7 1,018.3 1,077.8 693.0 771.3 198.9 81.0 –69.9 –67.7 40.2
Commercial paper 708.5 671.0 701.9 500.5 533.1 15.0 70.0 –31.7 –24.6 18.1 US dollar 212.6 177.2 181.1 132.5 140.0 52.1 –20.4 –27.3 –8.1 3.9 Euro 340.3 349.5 378.9 266.7 287.7 –26.0 71.9 6.8 –3.3 16.4 Yen 5.9 7.7 5.9 7.2 3.4 8.6 –13.4 0.8 1.3 –2.3 Pound sterling 107.1 102.3 97.4 68.2 71.8 –17.0 31.6 –7.4 –10.0 –2.1 Swiss franc 18.6 13.9 15.9 9.8 12.8 2.6 –1.9 –0.2 –4.1 1.3 Canadian dollar 0.6 0.6 0.6 0.5 0.5 –0.2 –0.6 –0.0 0.0 0.0 Other currencies 23.4 19.8 22.0 15.6 16.9 –5.1 2.7 –4.3 –0.5 0.9
Financial institutions 549.9 550.7 592.8 421.9 457.7 13.0 –32.3 –7.1 –10.3 31.8 Governments 79.0 62.9 56.5 36.4 37.8 4.4 72.6 –10.4 –6.3 –7.2 International organisations 18.8 4.5 4.0 3.6 3.8 4.2 2.9 –5.7 –8.5 –0.6 Corporate issuers 60.7 52.9 48.5 38.6 33.9 –6.5 26.7 –8.6 0.4 –5.9
Other instruments 423.2 347.3 376.0 192.5 238.2 183.8 11.0 –38.2 –43.1 22.1 US dollar 157.6 129.2 136.8 68.8 78.3 44.4 7.4 –23.9 –4.5 7.6 Euro 171.0 142.5 170.7 83.7 120.1 96.1 3.1 –7.9 –21.8 22.6 Yen 26.8 13.7 11.6 5.9 3.9 10.3 3.1 –5.8 –5.9 –3.0 Pound sterling 41.5 37.4 32.8 21.7 23.2 19.8 9.2 –0.3 –8.7 –3.6 Swiss franc 5.5 6.0 6.9 4.5 4.9 2.4 –2.2 2.0 –1.5 0.6 Canadian dollar 1.1 1.2 1.0 0.2 0.3 0.6 –1.5 –0.1 0.1 –0.3 Other currencies 19.7 17.3 16.1 7.6 7.6 10.3 –8.0 –2.1 –0.8 –1.8
Financial institutions 416.8 343.8 372.5 191.4 237.2 184.2 9.6 –36.5 –41.8 22.1 Governments 2.7 0.5 0.8 0.0 0.3 –1.3 1.4 –1.5 –0.6 0.3 International organisations 0.6 1.0 1.2 0.3 0.2 1.5 –1.0 0.3 0.0 0.2 Corporate issuers 3.2 2.0 1.6 0.8 0.5 –0.5 1.0 –0.5 –0.6 –0.5
Currency of issueArgentine peso – – – – – – – – – – Australian dollar 9.8 10.9 12.1 8.5 9.2 –0.7 1.9 –1.0 0.6 0.2 Baht – – 0.0 – 0.0 –0.0 –0.0 – –0.0 0.0 Canadian dollar 1.7 1.7 1.7 0.7 0.7 0.4 –2.1 –0.1 0.1 –0.2 Czech koruna 0.2 0.1 0.0 – 0.0 –0.1 0.2 –0.0 –0.0 –0.1 Danish krone 1.5 0.7 0.4 0.4 0.3 0.1 1.6 –0.5 –0.3 –0.3 Euro 511.4 492.0 549.6 350.4 407.8 70.1 75.0 –1.2 –25.1 38.9 Hong Kong dollar 12.9 12.8 11.7 7.7 6.4 –2.9 –5.9 –0.6 0.5 –1.1 New Taiwan dollar – – – – – 0.2 –0.2 – – – New Zealand dollar 2.4 2.6 3.0 2.0 2.5 –0.9 –1.4 0.5 –0.7 0.1 Norwegian krone 2.8 0.7 1.2 0.7 1.1 –1.4 2.5 –2.3 0.1 0.4 Pound sterling 148.6 139.7 130.3 89.9 95.0 2.8 40.8 –7.7 –18.7 –5.7 Rand 0.4 0.5 0.4 0.0 0.2 –0.0 0.2 –0.0 –0.0 –0.1 Russian rouble 1.2 1.2 1.2 0.1 0.0 1.1 0.1 –0.0 0.1 –0.0 Singapore dollar 1.2 1.8 1.8 0.6 0.8 1.0 –2.1 0.6 0.0 –0.1 Swedish krona 3.4 2.4 3.0 1.0 1.1 0.5 1.5 –0.4 –0.6 0.4 Swiss franc 24.2 19.9 22.8 14.4 17.7 5.0 –4.1 1.8 –5.6 1.9 US dollar 370.1 306.3 317.9 201.3 218.3 96.5 –13.0 –51.2 –12.6 11.5 Yen 32.7 21.5 17.5 13.1 7.3 18.8 –10.3 –5.0 –4.6 –5.3 Zloty 2.1 1.6 1.9 1.4 1.7 0.7 0.2 –0.2 –0.1 0.2
Memorandum item:Domestic moneymarket instruments
Total issues 12,748.3 13,001.4 … … … 640.7 1,451.8 72.5 –26.2 …Commercial paper 2,403.6 1,951.8 … … … –98.2 –259.3 –248.7 –204.1 …Treasury bills 4,973.9 5,597.1 … … … –43.2 1,309.0 341.8 250.6 …Other instruments 5,370.8 5,452.5 … … … 782.1 402.2 –20.6 –72.7 …
Table 13A: International money market instrumentsBy type, sector and currencyIn billions of US dollars
Amounts outstanding Gross issuance Net issues
A 90 BIS Quarterly Review, December 2009

Type, sector and currency Dec 2008 Jun 2009 Sep 2009 Q2 2009 Q3 2009 2007 2008 Q1 2009 Q2 2009 Q3 2009
Total issues 22,729.9 24,883.8 25,820.1 1,675.0 1,226.9 2,777.2 2,349.0 761.5 909.8 434.4
Floating rate 7,894.2 8,337.4 8,496.0 410.9 272.6 1,128.8 1,202.3 126.4 120.2 –7.2 US dollar 2,227.6 2,365.6 2,291.2 175.0 72.0 384.4 176.9 71.2 66.8 –74.4 Euro 4,463.8 4,567.2 4,763.7 180.2 130.1 575.3 520.3 –12.1 44.1 30.8 Yen 178.2 177.4 187.4 6.7 4.4 29.2 17.9 7.5 1.6 –2.6 Pound sterling 812.4 996.6 1,001.2 33.2 51.7 94.1 474.1 57.2 6.6 32.7 Swiss franc 28.9 24.7 25.5 0.8 2.4 0.8 –3.1 –2.2 –1.3 –0.5 Canadian dollar 26.4 28.0 30.4 3.2 2.3 3.5 –4.6 –0.8 1.1 0.1 Other currencies 157.0 177.8 196.6 11.8 9.8 41.5 20.8 5.6 1.3 6.7
Financial institutions 7,553.3 7,977.7 8,121.3 383.5 251.0 1,109.0 1,211.3 116.6 117.2 –12.7 Governments 100.3 103.9 117.3 6.5 11.0 –3.2 –8.9 –1.4 3.5 9.7 International organisations 23.2 45.1 52.8 6.4 7.3 –0.6 –0.1 15.3 5.8 6.7 Corporate issuers 217.4 210.7 204.7 14.5 3.3 23.6 –0.1 –4.1 –6.3 –10.9
Straight fixed rate 14,432.4 16,135.0 16,890.4 1,230.9 926.8 1,613.2 1,139.5 642.2 775.8 429.5 US dollar 5,833.4 6,448.9 6,683.3 510.0 410.0 747.8 507.8 294.1 321.5 234.3 Euro 6,297.9 7,116.3 7,535.1 584.3 374.7 567.5 446.3 294.1 386.9 157.4 Yen 505.7 457.6 484.2 10.2 15.1 38.1 1.7 –12.7 –8.1 –6.0 Pound sterling 882.6 1,108.7 1,123.9 71.6 75.4 134.3 86.3 45.0 51.0 46.5 Swiss franc 294.2 315.8 329.5 17.1 12.6 22.5 19.0 14.9 10.1 –1.9 Canadian dollar 210.1 235.7 251.6 11.2 8.8 45.8 34.0 4.6 8.8 –2.7 Other currencies 408.6 451.9 482.8 26.5 30.3 57.1 44.4 2.3 5.6 1.9
Financial institutions 10,167.9 11,123.9 11,603.6 783.0 654.6 1,237.8 766.3 337.6 427.6 251.8 Governments 1,695.7 1,947.9 2,063.0 148.4 93.0 89.5 38.0 99.3 122.7 60.8 International organisations 615.1 716.4 745.8 77.7 30.0 32.6 55.4 16.4 59.2 12.5 Corporate issuers 1,953.7 2,346.8 2,478.0 221.7 149.2 253.2 279.8 188.9 166.3 104.4
Equity-related 403.3 411.5 433.6 33.3 27.5 35.1 7.2 –7.1 13.9 12.1 US dollar 163.6 179.7 189.5 21.2 12.7 12.4 4.1 0.3 15.8 9.9 Euro 113.3 115.5 123.2 9.3 7.6 7.6 –14.6 –1.5 2.2 3.4 Yen 63.9 52.4 54.1 0.1 0.4 –0.3 1.1 –2.7 –5.4 –2.0 Pound sterling 7.8 9.3 8.3 1.0 1.4 –2.0 2.0 –0.3 0.6 –0.8 Swiss franc 8.6 8.1 8.3 – 0.3 –0.2 –2.5 –0.2 –0.1 –0.2 Canadian dollar 3.7 4.1 5.8 0.1 1.4 1.8 1.6 –0.0 0.2 1.4 Other currencies 42.3 42.4 44.4 1.7 3.7 15.8 15.4 –2.7 0.6 0.4
Financial institutions 212.6 207.2 213.9 6.7 9.8 26.4 9.0 –5.1 –2.9 1.6 Governments 1.7 1.1 1.4 – 1.2 –0.2 –0.1 –0.2 –0.5 0.3 International organisations – – – – – – – – – – Corporate issuers 189.0 203.2 218.3 26.6 16.5 8.9 –1.7 –1.9 17.2 10.2
Convertibles 398.1 407.0 429.3 33.3 27.5 35.9 8.5 –6.8 14.3 12.4 Warrants 5.2 4.5 4.3 – – –0.8 –1.4 –0.3 –0.4 –0.3
Currency of issueArgentine peso 0.7 0.7 0.7 – – 0.2 –0.2 0.1 – – Australian dollar 195.0 227.4 248.0 10.6 12.8 21.8 11.7 –4.4 4.3 0.6 Baht 3.1 3.6 3.6 0.4 – 0.1 0.4 – 0.4 – Canadian dollar 240.1 267.9 287.8 14.4 12.5 51.1 30.9 3.8 10.0 –1.3 Czech koruna 19.3 19.0 20.1 0.2 0.1 5.6 –0.1 –0.8 –0.4 –0.2 Danish krone 7.8 6.0 5.6 0.1 – –0.3 0.1 –0.5 –1.2 –0.6 Euro 10,874.9 11,799.0 12,421.9 773.8 512.3 1,150.4 952.1 280.5 433.2 191.6 Hong Kong dollar 60.5 61.6 62.6 6.4 4.9 5.3 –6.9 –1.5 2.6 1.0 New Taiwan dollar 1.6 1.5 1.6 0.0 – 0.2 –0.5 0.1 –0.2 –0.0 New Zealand dollar 39.0 41.0 41.9 1.4 2.3 4.8 1.5 –1.7 –0.9 –3.2 Norwegian krone 27.9 39.3 48.4 3.3 5.5 0.3 7.1 5.6 2.6 4.6 Pound sterling 1,702.8 2,114.6 2,133.4 105.8 128.4 226.5 562.4 101.9 58.2 78.4 Rand 31.3 38.3 38.1 1.2 1.7 7.9 8.9 0.7 –0.3 –1.3 Russian rouble 12.1 12.2 12.9 1.1 1.1 5.7 4.9 0.1 0.7 0.2 Singapore dollar 31.2 26.8 29.6 0.8 2.5 4.4 6.3 –2.7 –1.3 2.0 Swedish krona 48.4 64.6 71.1 7.4 4.2 9.4 11.7 11.4 2.9 0.4 Swiss franc 331.7 348.7 363.3 17.9 15.3 23.1 13.4 12.4 8.7 –2.6 US dollar 8,224.6 8,994.2 9,164.0 706.2 494.7 1,144.5 688.8 365.6 404.0 169.8 Yen 747.8 687.4 725.7 17.0 19.9 67.0 20.8 –7.8 –11.8 –10.6 Zloty 12.7 11.1 12.6 0.1 0.5 4.7 3.1 –0.5 –0.3 0.5
Memorandum item:Domestic bonds and notes
Total issues 46,806.4 48,983.6 … … … 3,372.9 2,126.5 1,163.0 968.0 …Medium-term notes 570.9 684.2 … … … 93.9 53.2 28.8 27.1 …Bonds 46,235.5 48,299.3 … … … 3,278.9 2,073.3 1,134.2 941.0 …
Table 13B: International bonds and notesBy type, sector and currencyIn billions of US dollars
Amounts outstanding Announced issues Net issues
BIS Quarterly Review, December 2009 A 91

Countries Dec 2008 Jun 2009 Sep 2009 Q2 2009 Q3 2009 2007 2008 Q1 2009 Q2 2009 Q3 2009
All countries 1,131.7 1,018.3 1,077.8 693.0 771.3 198.9 81.0 –69.9 –67.7 40.2
Developed countries 1,074.7 981.3 1,037.2 669.5 744.5 187.8 127.6 –56.0 –61.2 37.3 Australia 41.9 48.1 56.7 41.1 50.9 –4.2 –25.3 –3.4 7.9 7.7 Austria 28.6 21.8 18.2 5.9 9.1 4.4 13.4 0.2 –7.2 –3.8 Belgium 26.1 18.6 43.8 13.8 41.9 –0.7 13.6 –7.8 –0.2 24.2 Canada 3.0 2.9 2.9 1.7 2.2 0.2 1.5 –0.3 0.3 –0.1 Cyprus 1.6 1.0 0.6 0.6 0.4 –0.6 –1.8 –0.7 0.1 –0.3 Denmark 18.8 17.4 19.0 11.6 14.0 –3.0 14.4 0.7 –2.4 1.2 Finland 10.1 14.9 15.6 12.6 14.2 –0.4 4.4 2.6 1.6 0.5 France 81.6 79.7 69.3 59.2 45.4 18.9 29.6 3.5 –6.9 –11.3 Germany 124.1 109.1 106.1 74.4 77.7 60.9 3.9 –12.1 –3.1 –5.1 Greece 7.6 12.4 16.6 10.3 12.1 1.0 7.0 –0.7 5.3 3.7 Iceland 0.5 0.1 – – – –0.3 –1.5 –0.4 –0.0 –0.1 Ireland 123.1 104.1 113.9 58.3 79.1 15.8 –5.9 –9.1 –12.2 6.8 Italy 0.2 5.0 1.4 4.3 – 0.2 –0.0 3.3 1.3 –3.6 Japan 2.1 1.9 2.5 0.7 1.2 0.4 –0.3 –0.3 0.2 0.4 Luxembourg 27.4 29.2 28.9 20.3 17.0 0.0 –0.8 1.2 0.2 –1.1 Netherlands 92.5 87.4 97.9 61.5 72.1 17.2 30.9 1.4 –8.3 8.7 New Zealand 1.1 0.7 0.1 0.5 0.1 1.9 –4.4 –0.1 –0.3 –0.6 Norway 13.8 10.6 10.3 5.7 5.8 7.0 3.6 –0.2 –3.1 –0.6 Portugal 3.9 1.7 2.6 1.6 2.6 0.2 2.7 –2.1 –0.1 0.9 Slovakia – – – – – – – – – – Spain 32.2 45.8 40.2 36.4 27.6 9.7 20.6 13.0 –1.2 –6.6 Sweden 36.3 42.3 45.2 29.6 30.0 13.2 7.2 2.5 2.6 1.8 Switzerland 0.6 0.4 0.5 0.4 0.3 0.5 –0.7 –0.2 0.1 0.0 United Kingdom 310.0 264.9 279.8 193.2 215.1 50.3 7.0 –20.3 –35.8 11.3 United States 87.6 61.3 64.4 25.7 24.7 –4.8 8.4 –26.9 0.2 2.6
Offshore centres 31.5 23.2 25.9 15.6 18.8 5.7 –43.3 –9.1 0.2 2.3 Aruba – – – – – – – – – – Bahamas 1.6 1.5 1.2 0.8 0.6 0.8 0.3 –0.2 0.1 –0.3 Bermuda 0.1 0.1 0.1 – – –0.0 –0.0 – – –0.0 Cayman Islands 22.0 15.0 18.8 11.5 15.2 3.5 –41.4 –8.4 1.1 3.5 Hong Kong SAR 3.2 2.7 2.2 1.3 0.8 –0.2 1.2 –0.0 –0.6 –0.5 Lebanon – – – – – – – – – – Netherlands Antilles 2.5 1.6 1.2 0.4 0.4 2.0 –1.7 –0.4 –0.5 –0.5 Panama – – – – – – – – – – Singapore 2.1 2.3 2.4 1.6 1.8 –0.7 –1.3 –0.0 0.1 0.0 West Indies UK 0.0 0.0 0.0 0.0 0.0 0.0 –0.1 –0.0 –0.0 0.0
Developing countries 6.1 8.3 9.5 4.0 4.1 –0.2 –5.2 0.5 1.7 1.1
Africa & Middle East 1.3 1.2 1.3 1.0 1.2 –1.6 –2.1 –0.1 –0.1 0.1 Israel – – – – – –0.5 – – – – Qatar – – – – – – – – – – South Africa – – – – – – – – – – Tunisia – – – – – – – – – – United Arab Emirates 1.3 1.2 1.3 1.0 1.2 –0.9 –2.0 –0.1 –0.1 0.1
Asia & Pacific 3.3 6.2 6.7 2.9 2.3 2.2 –2.7 0.7 2.2 0.5 China – – – – – – – – – – Chinese Taipei – – – – – – – – – – India – – – – – 0.0 –0.0 – – – Indonesia – – – – – – – – – – Malaysia – – – – – – – – – – Philippines 0.1 – – – – 0.4 –0.4 –0.1 – – South Korea 3.2 6.1 6.6 2.9 2.3 2.0 –2.3 0.7 2.2 0.5 Thailand 0.1 0.1 0.1 – – –0.2 –0.1 0.0 – –
Europe 0.0 – – – – –0.0 –0.1 –0.0 – – Croatia – – – – – 0.0 –0.0 – – – Hungary – – – – – 0.1 –0.0 – – – Poland – – – – – – – – – – Russia – – – – – – – – – – Turkey – – – – – – – – – –
Latin America & Caribbean 1.5 1.0 1.4 0.1 0.5 –0.8 –0.2 –0.0 –0.4 0.4 Argentina 0.1 0.1 0.1 – – – 0.1 – –0.1 – Brazil 1.3 0.9 1.3 0.1 0.5 0.6 –0.3 –0.0 –0.4 0.4 Chile – – – – – – – – – – Colombia – – – – – – – – – – Mexico 0.1 0.1 0.1 0.0 0.0 –0.3 –0.0 –0.0 0.0 –0.0 Peru – – – – – – – – – – Uruguay – – – – – – – – – – Venezuela – – – – – – – – – –
Int. organisations 19.4 5.5 5.1 3.8 4.0 5.6 1.9 –5.3 –8.5 –0.4
Net issuesAmounts outstanding Gross issuance
Table 14A: International money market instruments - all issuersBy residence of issuerIn billions of US dollars
A 92 BIS Quarterly Review, December 2009

Countries Dec 2008 Jun 2009 Sep 2009 Q2 2009 Q3 2009 2007 2008 Q1 2009 Q2 2009 Q3 2009
All countries 22,729.9 24,883.8 25,820.1 1,675.0 1,226.9 2,777.2 2,349.0 761.5 909.8 434.4
Developed countries 19,715.7 21,719.5 22,556.4 1,500.5 1,099.4 2,346.1 2,287.5 733.9 820.6 380.2 Australia 405.9 424.7 454.1 27.5 34.1 45.4 25.8 –9.0 13.4 16.7 Austria 339.2 362.7 382.2 19.1 12.0 37.1 15.1 11.3 7.7 6.7 Belgium 236.0 286.6 301.2 25.2 8.0 40.8 57.2 17.2 27.1 5.0 Canada 459.0 510.0 532.5 38.9 27.1 53.0 71.5 14.2 24.7 3.8 Cyprus 8.6 11.6 12.6 3.6 0.7 3.0 0.2 – 2.7 0.7 Denmark 104.1 132.7 141.9 18.8 9.8 8.4 5.7 13.2 12.6 5.1 Finland 101.7 116.7 123.1 9.7 3.0 –4.3 –0.1 11.6 1.1 2.3 France 1,415.9 1,646.0 1,750.3 183.6 102.4 112.3 140.5 53.5 142.9 51.0 Germany 2,025.2 2,030.5 2,080.2 94.5 81.5 83.8 68.7 –31.1 4.0 –16.1 Greece 185.3 240.3 248.8 22.5 3.0 18.1 20.0 25.0 23.6 –0.0 Iceland 52.1 46.5 45.8 – 0.0 4.1 2.4 –2.8 –2.9 –1.8 Ireland 1,092.2 1,214.7 1,283.3 62.5 68.5 247.9 177.1 56.7 35.9 34.7 Italy 1,010.0 1,079.7 1,158.0 44.4 63.9 90.3 136.1 32.2 17.1 40.1 Japan 184.2 166.9 173.2 3.7 2.6 5.8 –2.2 –5.3 –5.8 –2.1 Luxembourg 421.0 420.6 449.2 19.3 37.1 54.3 9.7 –8.3 3.7 18.3 Netherlands 1,574.7 1,768.8 1,834.3 135.3 68.5 167.2 99.7 83.1 74.4 12.7 New Zealand 11.4 10.6 9.0 – 0.2 –1.4 –1.5 –1.0 –0.1 –1.9 Norway 151.1 164.3 173.3 11.4 8.0 17.8 26.0 5.1 5.0 2.5 Portugal 127.4 160.2 175.3 15.3 10.2 16.4 27.2 16.8 12.3 9.0 Slovakia 5.2 8.1 8.4 2.7 – 1.1 – – 2.7 – Spain 1,230.1 1,367.2 1,458.5 89.5 60.1 207.0 97.6 52.2 57.0 43.9 Sweden 228.1 280.4 310.2 43.6 38.2 33.2 26.3 19.2 28.0 18.7 Switzerland 25.1 23.7 24.6 0.7 3.7 1.2 0.7 –1.4 0.1 0.1 United Kingdom 3,127.5 3,449.3 3,542.5 187.0 180.6 453.4 708.0 67.1 72.7 79.7 United States 5,188.4 5,787.2 5,868.6 441.6 271.6 648.7 574.1 313.5 258.5 46.6
Offshore centres 1,470.6 1,469.4 1,487.7 39.1 35.5 306.8 1.3 –6.7 3.2 1.6 Aruba 8.3 7.6 6.3 – – –0.9 –1.3 –0.0 –0.4 –1.6 Bahamas 7.6 8.8 8.9 1.6 0.1 2.3 0.4 –0.4 1.5 0.0 Bermuda 56.4 66.1 68.7 2.5 2.8 8.6 9.6 6.9 2.7 2.3 Cayman Islands 1,113.3 1,116.1 1,129.5 27.2 22.0 274.2 4.8 –5.5 6.4 1.6 Hong Kong SAR 45.2 43.6 44.0 3.4 2.3 0.7 –2.1 –3.1 1.4 0.3 Lebanon 24.0 25.8 25.5 – – –0.3 0.1 2.1 –0.3 –0.4 Netherlands Antilles 115.3 107.2 108.4 2.8 5.0 6.0 –6.4 –3.8 –4.8 –2.1 Panama 9.4 9.7 9.7 – – 0.9 –0.4 0.3 –0.0 – Singapore 51.3 45.8 47.4 0.5 2.7 7.7 –1.1 –2.4 –2.9 1.0 West Indies UK 27.7 26.6 27.3 0.4 0.7 6.2 –1.7 –0.5 –0.7 0.6
Developing countries 905.4 933.4 977.3 51.3 54.7 92.2 4.9 2.6 21.0 33.4
Africa & Middle East 114.6 123.9 133.0 14.0 7.6 23.1 6.3 –0.7 8.7 8.2 Israel 14.3 15.5 15.5 0.4 – –1.0 1.2 1.0 0.2 – Qatar 11.3 13.3 14.8 3.0 2.2 0.3 – – 2.0 1.5 South Africa 20.4 22.1 23.2 2.4 0.6 7.4 –1.4 –0.1 0.7 0.5 Tunisia 3.9 3.9 3.9 – – 0.0 –0.0 – – –0.2 United Arab Emirates 44.8 49.1 53.8 6.2 4.8 12.5 6.3 –1.7 5.8 4.5
Asia & Pacific 255.4 263.4 276.9 15.7 19.9 27.2 –0.1 2.7 5.7 11.4 China 22.5 22.3 23.2 1.0 2.2 4.6 1.9 –0.0 –0.2 0.9 Chinese Taipei 10.1 7.3 7.0 – – –3.5 –5.3 –1.5 –1.3 –0.4 India 30.3 28.7 28.2 – 1.0 12.9 1.0 –0.7 –0.8 –0.7 Indonesia 13.5 16.7 17.7 0.8 0.9 2.2 3.3 2.7 0.6 0.9 Malaysia 25.3 21.9 25.7 – 5.1 –1.2 0.4 –0.6 –2.8 3.8 Philippines 31.7 33.0 34.4 1.0 1.3 0.4 –1.1 0.6 0.8 1.2 South Korea 101.5 113.4 120.3 12.7 8.8 11.7 0.4 3.0 9.2 5.5 Thailand 9.0 8.7 8.6 – – –1.9 –0.5 –0.2 –0.0 –0.3
Europe 237.3 245.8 252.4 12.1 8.9 21.8 17.2 0.1 6.7 1.6 Croatia 6.1 6.3 5.8 1.1 – 0.1 –0.9 –0.7 0.8 –0.7 Hungary 37.4 35.6 38.4 0.1 2.6 4.1 5.1 –1.6 –0.6 1.5 Poland 42.4 46.5 51.3 2.3 4.3 1.3 2.8 1.9 1.7 3.2 Russia 63.6 63.5 62.4 3.0 0.7 6.4 6.7 –1.5 1.5 –1.5 Turkey 47.1 49.2 49.8 1.5 1.3 5.7 –0.1 1.7 0.3 0.2
Latin America & Caribbean 298.0 300.4 315.0 9.5 18.3 20.2 –18.5 0.5 –0.1 12.2 Argentina 58.2 56.7 55.5 0.1 0.1 2.9 –11.0 –0.6 –1.2 –2.2 Brazil 74.9 79.6 84.2 4.1 5.1 1.3 –3.6 0.9 2.5 3.5 Chile 12.9 12.5 13.3 0.5 0.7 –0.7 –0.7 0.6 –1.1 0.9 Colombia 17.2 18.3 20.4 1.0 2.0 1.4 –0.6 1.0 0.1 2.0 Mexico 63.8 64.7 69.0 3.7 6.5 2.8 –3.4 –2.2 2.8 4.1 Peru 9.7 11.3 12.5 0.2 1.1 2.0 –1.6 1.4 0.2 1.1 Uruguay 8.6 8.5 9.1 – 0.5 1.0 –1.0 –0.0 –0.1 0.5 Venezuela 33.6 33.5 35.1 – 1.4 7.8 3.2 – –0.1 1.5
Int. organisations 638.2 761.5 798.6 84.1 37.3 32.0 55.3 31.7 65.0 19.2
Net issuesAmounts outstanding Announced issues
Table 14B: International bonds and notes - all issuersBy residence of issuerIn billions of US dollars
BIS Quarterly Review, December 2009 A 93

Countries Dec 2008 Jun 2009 Sep 2009 Q2 2009 Q3 2009 2007 2008 Q1 2009 Q2 2009 Q3 2009
All countries 1,131.7 1,018.3 1,077.8 693.0 771.3 198.9 81.0 –69.9 –67.7 40.2
Developed countries 1,086.7 992.0 1,046.0 677.1 750.8 186.8 84.3 –58.4 –60.3 35.1 Australia 27.9 28.6 28.5 23.2 23.6 3.3 –21.7 –0.1 –0.1 –0.4 Austria 28.2 21.3 16.9 5.3 7.6 4.0 13.0 0.0 –7.1 –4.6 Belgium 24.1 22.7 26.6 11.5 13.1 2.9 5.9 0.3 –2.4 3.2 Canada 4.7 7.2 5.9 6.3 5.2 –0.7 –0.1 –0.8 3.4 –1.4 Cyprus 0.7 0.8 0.5 0.6 0.4 –0.1 0.4 –0.3 0.4 –0.3 Denmark 21.1 21.1 21.3 15.2 16.5 –2.9 18.0 1.1 –1.4 –0.1 Finland 7.9 11.7 11.7 9.9 10.5 0.5 3.3 1.8 1.6 –0.1 France 104.9 99.8 116.4 77.8 95.2 19.5 30.1 2.5 –9.7 14.9 Germany 156.5 137.0 132.7 93.6 99.0 69.0 –39.2 –13.2 –7.2 –7.0 Greece 14.2 15.7 18.3 11.9 13.5 4.2 4.9 –2.1 3.4 2.0 Iceland 0.8 0.6 2.0 0.4 1.7 0.2 –2.4 –0.3 0.1 1.4 Ireland 64.5 56.0 55.2 23.9 31.6 –11.0 26.3 –3.2 –6.4 –2.4 Italy 55.6 55.7 59.3 46.1 45.1 28.9 4.6 3.1 –4.3 2.1 Japan 16.9 18.6 20.0 14.1 16.3 0.7 1.4 –0.5 1.8 0.8 Luxembourg 6.0 2.9 2.4 2.6 2.1 0.1 1.5 –3.3 0.4 –0.5 Netherlands 86.4 87.1 101.8 65.1 76.6 –1.9 22.5 3.3 –4.7 13.0 New Zealand 0.1 0.2 0.1 0.2 0.1 0.9 –1.2 0.1 0.0 –0.2 Norway 14.3 10.7 10.4 5.8 5.9 7.2 3.7 –0.7 –3.0 –0.6 Portugal 19.8 24.9 26.8 22.6 24.1 4.7 –1.2 1.5 2.8 1.3 Slovakia – – – – – – – – – – Spain 63.0 89.8 88.9 76.0 69.5 21.7 23.3 23.2 –0.3 –3.2 Sweden 39.6 46.7 49.7 32.8 34.3 12.7 8.1 3.4 2.7 1.9 Switzerland 17.3 17.4 16.4 13.0 12.5 2.5 –10.6 –0.1 –0.3 –1.2 United Kingdom 200.8 145.4 158.3 85.6 110.0 13.8 26.4 –38.2 –24.1 11.6 United States 111.6 70.4 75.8 33.8 36.5 6.8 –32.7 –36.0 –5.7 4.9
Offshore centres 11.7 6.4 10.1 5.1 9.2 2.7 –1.2 –5.5 –0.2 3.6 Aruba – – – – – – – – – – Bahamas 0.0 0.0 0.0 0.0 – –0.0 –0.0 –0.0 0.0 –0.0 Bermuda – – – – – – – – – – Cayman Islands 10.4 5.4 8.5 4.4 8.0 2.7 –1.3 –5.3 –0.1 3.1 Hong Kong SAR 0.6 0.3 0.4 0.1 0.2 –0.3 0.4 –0.2 –0.1 0.1 Lebanon – – – – – – – – – – Netherlands Antilles – – – – – – – – – – Panama – – – – – – – – – – Singapore 0.7 0.7 1.1 0.6 1.0 –0.1 –0.0 –0.0 –0.0 0.4 West Indies UK 0.0 0.0 0.0 0.0 – 0.0 –0.1 –0.0 0.0 –0.0
Developing countries 13.9 14.5 16.6 6.9 7.3 3.7 –4.0 –0.7 1.2 1.9
Africa & Middle East 2.1 1.6 1.9 1.0 1.3 –1.5 –2.4 –0.4 –0.1 0.2 Israel – – – – – –0.5 – – – – Qatar – – – – – – – – – – South Africa 0.8 0.5 0.6 0.1 0.1 0.4 –0.3 –0.3 0.0 0.0 Tunisia – – – – – – – – – – United Arab Emirates 1.3 1.1 1.3 0.9 1.2 –0.9 –2.0 –0.1 –0.1 0.2
Asia & Pacific 4.8 7.6 8.8 3.9 3.5 2.1 –2.8 0.3 2.5 1.1 China 1.2 0.7 0.7 0.3 0.2 0.1 0.4 –0.3 –0.2 –0.0 Chinese Taipei 0.1 0.0 0.0 0.0 0.0 –0.0 0.0 –0.0 –0.0 0.0 India – 0.1 0.1 0.1 0.1 0.1 –0.1 – 0.1 0.0 Indonesia 0.0 0.0 0.0 0.0 – –0.0 0.0 –0.0 0.0 – Malaysia 0.0 0.3 0.5 0.2 0.2 – 0.0 0.0 0.2 0.2 Philippines 0.1 – – – – – 0.1 –0.1 – – South Korea 3.4 6.4 7.4 3.3 3.0 1.9 –3.0 0.5 2.5 0.9 Thailand 0.1 0.1 0.1 – – –0.2 –0.1 0.0 – –
Europe 1.5 1.5 2.1 0.4 0.6 1.0 –0.1 –0.0 0.0 0.6 Croatia – – – – – 0.0 –0.0 – – – Hungary – – – – – 0.0 –0.0 – – – Poland – – – – – – – – – – Russia 1.5 1.5 2.1 0.4 0.6 1.0 –0.0 –0.0 0.0 0.6 Turkey – – – – – – – – – –
Latin America & Caribbean 5.5 3.8 3.8 1.7 1.9 2.0 1.3 –0.6 –1.2 –0.0 Argentina 0.1 0.1 0.1 – – – 0.1 – –0.1 – Brazil 4.6 3.0 3.0 1.1 1.3 2.2 1.2 –0.5 –1.0 –0.1 Chile – – – – – – – – – – Colombia – – – – – – – – – – Mexico 0.8 0.7 0.7 0.6 0.7 –0.2 0.1 –0.1 –0.1 0.1 Peru – – – – – – – – – – Uruguay – – – – – – – – – – Venezuela – – – – – – – – – –
Int. organisations 19.4 5.5 5.1 3.8 4.0 5.6 1.9 –5.3 –8.5 –0.4
Net issuesAmounts outstanding Gross issuance
Table 15A: International money market instruments - all issuersBy nationality of issuerIn billions of US dollars
A 94 BIS Quarterly Review, December 2009

Table 15B: International bonds and notes - all issuersBy nationality of issuerIn billions of US dollars
Countries Dec 2008 Jun 2009 Sep 2009 Q2 2009 Q3 2009 2007 2008 Q1 2009 Q2 2009 Q3 2009
All countries 22,729.9 24,883.8 25,820.1 1,675.0 1,226.9 2,777.2 2,349.0 761.5 909.8 434.4
Developed countries 20,698.9 22,688.3 23,520.3 1,509.2 1,108.2 2,576.3 2,256.5 731.9 807.6 363.3 Australia 440.6 464.0 492.1 27.8 36.5 65.0 37.6 –6.9 15.9 16.6 Austria 324.7 346.0 363.7 19.2 10.2 37.4 9.8 8.4 8.7 5.5 Belgium 456.5 525.9 553.7 40.1 20.8 63.1 81.1 25.7 33.3 10.0 Canada 464.8 511.5 532.7 37.6 26.6 63.4 73.4 13.4 21.6 2.4 Cyprus 7.8 12.2 13.5 5.0 0.8 1.6 0.9 – 4.1 0.8 Denmark 119.6 145.8 155.1 17.7 8.6 27.6 10.4 11.4 12.0 4.7 Finland 99.7 116.2 122.6 9.7 3.0 –4.9 –0.2 12.4 1.8 2.3 France 1,582.5 1,805.7 1,899.3 202.2 94.6 157.4 149.6 33.9 154.4 36.4 Germany 2,728.2 2,793.9 2,864.5 130.7 105.9 75.6 104.5 3.0 15.5 –14.7 Greece 273.5 347.6 364.9 32.1 11.4 32.0 39.0 36.1 28.7 4.8 Iceland 57.6 52.7 52.4 0.7 1.0 4.1 –0.4 –2.9 –2.3 –1.5 Ireland 423.6 493.8 524.9 40.3 40.0 137.6 93.7 35.1 23.7 16.6 Italy 1,177.2 1,244.2 1,339.5 51.1 86.7 90.9 136.2 27.2 17.5 52.5 Japan 383.6 370.5 387.2 10.4 15.7 27.0 8.1 2.9 –9.1 0.8 Luxembourg 94.7 95.0 96.0 9.3 2.5 –1.8 8.9 –4.5 3.7 –1.5 Netherlands 1,048.6 1,160.6 1,200.6 79.8 46.7 92.3 50.1 47.4 40.9 5.1 New Zealand 5.8 5.8 6.0 – – 0.7 –0.5 –0.2 –0.1 – Norway 153.3 166.3 175.2 11.4 8.1 19.1 26.0 5.1 4.8 2.3 Portugal 209.8 248.4 267.5 18.0 12.3 23.5 24.8 20.7 12.6 10.0 Slovakia 5.5 8.4 8.7 2.7 – 1.1 – – 2.7 – Spain 1,519.4 1,651.2 1,743.6 97.1 69.4 256.9 135.9 41.2 52.5 40.7 Sweden 255.8 306.2 337.3 45.0 38.9 33.0 33.0 18.3 26.6 19.1 Switzerland 376.2 437.3 453.3 28.2 24.0 31.2 22.6 38.3 15.7 5.8 United Kingdom 2,549.1 2,896.6 3,003.5 170.6 169.5 316.6 618.5 109.1 75.8 107.1 United States 5,933.4 6,471.8 6,546.7 422.3 270.0 1,024.2 592.1 256.1 244.4 32.9
Offshore centres 222.6 237.4 244.2 20.0 9.5 18.8 7.3 2.0 12.0 4.2 Aruba 0.2 0.2 0.2 – – 0.0 0.1 – – – Bahamas 1.2 1.2 1.2 – – – 0.1 – – – Bermuda 6.2 9.4 9.5 1.9 – 0.9 1.1 1.3 1.9 0.0 Cayman Islands 51.1 62.0 61.5 11.8 0.4 3.7 5.7 0.6 10.1 –2.1 Hong Kong SAR 67.2 69.3 75.2 5.1 6.7 4.2 0.3 –0.7 2.4 5.7 Lebanon 24.0 25.8 25.5 – – –0.3 0.1 2.1 –0.3 –0.4 Netherlands Antilles – – – – – – – – – – Panama 9.0 9.3 9.3 – – 0.9 –0.3 0.3 – – Singapore 52.1 48.4 50.0 0.5 2.4 5.4 2.3 –1.3 –2.5 1.2 West Indies UK 1.0 1.0 1.0 – – 2.4 –1.5 – – –0.0
Developing countries 1,170.2 1,196.6 1,256.9 61.7 71.9 150.0 29.9 –4.1 25.2 47.7
Africa & Middle East 149.3 163.2 175.7 20.4 10.1 36.9 11.9 –1.3 13.4 11.5 Israel 18.8 19.6 19.7 0.4 0.1 –1.1 0.7 0.7 0.2 0.1 Qatar 11.6 15.1 16.6 4.5 2.2 0.3 0.3 – 3.5 1.5 South Africa 29.1 30.6 32.2 2.7 1.3 9.1 –0.9 –0.3 0.4 1.1 Tunisia 3.9 3.9 3.9 – – 0.0 –0.0 – – –0.2 United Arab Emirates 58.3 66.1 72.5 10.6 5.4 20.2 10.9 –1.8 9.3 6.2
Asia & Pacific 341.4 348.6 366.3 19.7 25.8 40.0 9.9 –0.1 7.7 14.8 China 43.7 43.1 43.1 1.9 2.8 8.5 5.2 –1.2 0.6 –0.1 Chinese Taipei 13.7 10.7 10.4 – 0.0 –3.7 –5.5 –1.5 –1.4 –0.4 India 40.8 40.1 39.2 1.5 1.0 14.7 3.5 –1.5 0.7 –1.0 Indonesia 24.0 27.5 29.6 1.3 1.9 1.8 3.8 2.9 0.6 2.0 Malaysia 33.1 29.8 35.0 0.8 6.3 0.2 0.2 –0.7 –2.6 4.8 Philippines 31.8 33.1 34.5 1.0 1.3 0.0 –0.9 0.6 0.8 1.2 South Korea 105.2 116.9 125.1 13.1 10.1 9.5 –0.4 2.7 9.4 6.6 Thailand 9.8 9.1 8.9 – – –1.9 –0.5 –0.2 –0.5 –0.3
Europe 321.4 328.2 337.9 14.5 13.5 50.1 24.3 –2.0 7.0 3.9 Croatia 5.5 5.6 5.8 1.1 – 0.4 –0.9 –0.7 0.8 –0.0 Hungary 37.4 35.8 38.5 0.1 2.6 3.5 5.5 –1.6 –0.5 1.5 Poland 44.7 48.8 54.0 3.0 4.5 0.0 1.9 1.9 1.7 3.5 Russia 139.3 137.6 137.6 4.7 4.1 34.8 12.9 –3.5 1.8 –1.1 Turkey 50.7 52.8 53.2 1.5 1.3 6.0 –0.3 1.7 0.3 0.0
Latin America & Caribbean 358.0 356.7 377.0 7.1 22.6 23.0 –16.1 –0.7 –2.9 17.5 Argentina 53.7 52.7 53.5 0.1 0.5 0.3 –10.3 –0.3 –0.9 –0.2 Brazil 113.4 117.1 126.1 4.8 9.6 2.6 –0.4 0.2 2.2 7.6 Chile 10.2 9.9 10.4 0.3 0.3 –0.5 –0.3 0.6 –0.8 0.4 Colombia 18.6 19.7 21.7 1.0 2.0 2.8 –0.6 1.0 0.1 2.0 Mexico 88.5 85.9 90.0 0.7 6.5 3.2 –5.4 –2.9 –0.2 3.7 Peru 10.7 11.9 12.9 0.1 1.0 2.7 –1.4 1.0 0.1 1.0 Uruguay 8.4 8.4 8.9 – 0.5 1.0 –1.0 –0.0 –0.1 0.5 Venezuela 33.7 33.6 35.2 – 1.4 7.8 3.2 – –0.1 1.5
Int. organisations 638.2 761.5 798.6 84.1 37.3 32.0 55.3 31.7 65.0 19.2
Net issuesAmounts outstanding Announced issues
BIS Quarterly Review, December 2009 A 95

Sector and country Dec 2007 Dec 2008 Mar 2009 Jun 2009 2007 2008 Q3 2008 Q4 2008 Q1 2009 Q2 2009
All issuers 56,259.2 59,554.7 59,065.5 61,985.0 4,013.6 3,578.4 910.1 1,304.1 1,235.5 941.8 Argentina 75.7 66.2 61.9 61.3 0.4 –5.5 –1.0 –4.3 –1.5 0.2 Australia 807.3 635.9 620.4 771.3 192.1 4.8 8.9 –9.1 –10.1 36.3 Austria 377.2 340.7 326.0 359.3 95.5 –21.0 13.3 30.7 0.2 12.6 Belgium 544.6 607.2 603.2 640.7 37.4 95.9 –2.0 41.7 22.1 – Brazil 952.8 858.8 885.7 1,088.3 101.2 180.8 58.9 25.6 18.9 35.3 Canada 1,209.1 1,038.6 1,040.4 1,145.1 –11.6 66.8 –0.3 48.0 31.3 13.1 China 1,687.3 2,209.5 2,190.2 2,306.8 405.9 398.8 107.0 93.3 –18.9 115.4 Czech Republic 105.0 101.1 92.3 108.5 10.6 2.9 –43.7 7.1 –2.7 4.6 Denmark 589.1 591.1 498.9 551.0 44.1 14.5 –1.2 85.6 –57.9 20.2 Finland 141.1 134.8 136.6 133.5 6.6 0.9 –10.4 6.5 7.6 –11.2 France 2,821.0 2,907.0 2,893.2 3,116.2 238.5 244.6 5.6 119.4 111.0 41.7 Germany 2,630.9 2,590.7 2,573.1 2,800.4 115.6 112.6 69.2 5.2 93.6 65.1 Greece 328.1 353.2 365.2 407.6 29.7 44.9 8.7 11.8 26.8 19.1 Hong Kong SAR 51.4 50.2 56.9 66.3 0.6 –1.5 –1.0 0.7 6.7 9.4 India 458.4 426.7 449.9 519.9 88.8 61.5 13.4 6.9 45.1 40.4 Indonesia 85.6 69.8 70.9 80.8 12.1 –5.3 –3.8 3.8 4.9 0.5 Ireland 124.8 111.7 118.8 130.1 –19.6 –6.0 –7.6 –1.4 11.7 3.7 Italy 3,034.3 3,248.9 3,284.8 3,533.0 161.1 396.5 50.9 125.9 174.1 42.6 Japan 8,855.7 11,052.1 10,234.6 10,751.7 83.5 –59.3 –62.8 26.2 11.0 283.8 Malaysia 157.9 172.7 162.1 178.0 17.6 23.1 5.8 2.8 –1.9 10.0 Mexico 352.6 319.5 305.2 349.8 43.1 43.3 0.4 15.2 3.5 18.3 Netherlands 903.0 941.5 901.8 946.4 34.4 84.3 –5.7 77.4 1.5 –11.0 Norway 144.0 135.9 159.6 189.0 7.1 27.5 0.8 18.6 16.7 21.4 Poland 162.6 147.8 127.2 152.0 6.8 17.0 7.7 6.5 3.7 9.7 Portugal 223.6 251.0 253.0 284.8 30.6 41.7 8.8 11.8 12.7 15.4 Singapore 97.2 96.4 93.6 103.3 10.6 –1.2 –7.8 2.8 2.4 5.1 South Africa 120.7 93.8 93.9 123.3 8.5 6.5 4.9 0.0 1.9 6.5 South Korea 1,076.6 863.5 804.6 944.5 101.0 75.8 3.3 13.6 18.1 70.1 Spain 1,644.0 1,749.1 1,772.1 1,976.3 234.2 206.7 49.2 55.4 97.5 90.6 Sweden 389.4 346.1 320.1 341.0 15.4 32.2 22.6 1.8 –8.6 –2.9 Switzerland 242.8 259.0 247.8 270.2 0.7 0.9 1.1 6.7 5.8 8.7 Thailand 140.2 143.4 150.6 163.0 21.2 8.8 –1.6 –2.2 9.6 5.6 Turkey 218.7 180.6 175.1 197.8 2.1 14.8 4.5 5.5 10.5 6.0 United Kingdom 1,359.0 1,220.1 1,268.8 1,541.3 96.4 270.0 58.8 157.2 68.4 71.0 United States 23,314.2 24,530.6 25,038.2 24,913.1 1,818.3 1,216.4 557.1 349.5 507.6 –125.1
Governments 26,858.8 29,851.6 29,733.6 32,096.1 1,129.7 2,505.9 567.6 1,112.7 1,045.2 1,216.7 Argentina 63.1 54.4 50.7 49.4 4.1 –4.7 –0.9 –4.5 –1.0 –0.6 Australia 118.8 106.4 122.4 181.9 10.0 14.7 –0.3 7.8 16.2 34.9 Austria 119.8 110.6 112.6 127.9 4.3 –3.1 1.4 2.4 6.7 7.9 Belgium 389.5 394.0 381.7 405.4 13.2 25.6 –4.0 19.1 4.8 – Brazil 694.1 545.8 564.9 685.2 67.3 24.3 1.0 7.7 14.0 14.1 Canada 739.0 675.2 692.7 771.7 8.0 83.8 9.2 57.5 36.8 18.0 China 1,136.7 1,416.5 1,351.5 1,390.6 284.8 197.4 63.6 14.3 –64.8 38.3 Czech Republic 85.3 81.6 73.9 87.7 5.7 1.6 –45.2 7.1 –2.7 4.4 Denmark 87.2 85.4 82.1 90.2 –5.5 –0.4 –9.6 13.5 1.4 2.9 Finland 74.8 68.8 72.7 67.5 –0.6 –3.1 –9.7 7.9 6.8 –9.4 France 1,491.4 1,470.9 1,471.6 1,638.0 34.9 61.6 –39.0 35.1 63.6 72.3 Germany 1,389.3 1,362.1 1,352.7 1,506.4 26.6 49.7 22.4 24.1 49.1 67.1 Greece 298.6 310.5 324.4 361.4 23.3 29.5 5.8 6.4 27.0 16.2 Hong Kong SAR 18.5 21.0 28.9 37.9 0.6 2.4 –0.3 1.6 7.9 9.0 India 416.9 387.6 403.4 459.2 71.5 54.0 9.4 14.7 35.5 29.5 Indonesia 76.3 62.9 64.3 73.1 10.2 –4.1 –3.3 4.0 4.8 0.3 Ireland 48.4 60.7 72.9 83.8 2.3 15.7 0.2 5.7 14.6 6.2 Italy 1,772.4 1,779.7 1,799.6 1,919.3 44.2 109.6 12.5 20.0 95.6 7.7 Japan 7,145.1 9,113.2 8,499.4 8,957.9 101.4 123.2 –39.2 42.1 72.2 264.4 Malaysia 69.7 76.6 75.5 85.1 6.1 10.5 0.3 3.6 2.7 6.9 Mexico 191.6 174.6 175.7 202.4 22.2 25.0 5.8 7.6 10.8 11.5 Netherlands 307.1 374.5 349.8 359.5 –5.0 80.6 –9.6 77.0 –8.1 –11.6 Norway 47.5 49.5 59.6 70.4 –2.7 14.3 –0.6 9.8 7.5 7.9 Poland 162.6 147.8 127.2 152.0 6.8 17.0 7.7 6.5 3.7 9.7 Portugal 124.2 136.1 135.1 155.4 2.0 19.1 3.7 9.3 4.8 11.5 Singapore 68.1 72.7 71.2 79.8 8.1 4.6 –4.6 2.0 2.4 5.1 South Africa 72.2 57.2 56.6 75.9 0.8 4.8 2.1 1.4 0.5 5.4 South Korea 466.0 337.5 331.6 383.8 9.2 –9.6 –19.3 –0.0 23.8 23.5 Spain 495.6 540.0 559.8 646.0 –7.3 72.5 27.2 37.8 42.5 49.5 Sweden 145.4 112.7 101.3 108.8 –17.7 –8.2 11.7 –2.8 –5.6 –0.1 Switzerland 116.1 119.8 109.6 114.1 –4.3 –3.5 –0.3 1.4 –2.3 –1.3 Thailand 96.9 97.3 104.5 110.8 18.5 4.3 –1.5 –3.6 8.8 1.6 Turkey 218.2 180.2 174.8 197.4 1.7 14.7 4.4 5.5 10.6 6.0 United Kingdom 903.0 826.6 853.5 1,091.5 51.0 196.7 42.4 120.0 40.3 98.8 United States 6,592.4 7,882.0 8,380.2 8,779.1 362.4 1,289.6 534.4 556.7 498.3 398.8
Amounts outstanding Changes in stocks
Table 16A: Domestic debt securitiesBy sector and residence of issuerIn billions of US dollars
A 96 BIS Quarterly Review, December 2009

Sector and country Dec 2007 Dec 2008 Mar 2009 Jun 2009 2007 2008 Q3 2008 Q4 2008 Q1 2009 Q2 2009
Financial institutions 23,247.0 23,168.1 22,918.2 23,166.2 2,438.7 615.3 195.0 –55.4 138.2 –390.8 Argentina 4.3 4.0 3.7 3.7 –0.5 –0.3 –0.1 –0.2 –0.2 0.1 Australia 645.2 499.8 469.2 555.6 185.5 –4.6 11.0 –15.4 –25.8 1.6 Austria 223.8 198.2 184.1 197.4 82.7 –17.7 11.0 25.4 –5.3 1.9 Belgium 115.6 174.3 180.7 191.9 21.9 67.6 0.1 28.5 13.7 – Brazil 250.9 306.2 314.3 395.6 33.0 155.5 57.4 17.5 5.2 21.4 Canada 338.1 253.2 237.1 248.7 –16.3 –22.0 –10.3 –6.9 –9.0 –9.2 China 446.2 607.5 623.1 647.3 92.8 128.1 25.0 38.3 15.7 23.9 Czech Republic 14.5 14.5 13.7 15.5 4.2 1.2 1.4 –0.2 0.1 0.2 Denmark 499.9 503.7 415.0 459.4 49.9 14.9 8.4 72.2 –59.3 17.9 Finland 51.8 55.4 53.9 55.2 7.2 7.0 0.6 0.7 1.0 –2.0 France 1,061.8 1,153.7 1,178.1 1,217.8 189.5 153.4 50.3 67.2 73.3 –32.2 Germany 1,051.9 928.7 924.0 968.7 61.2 –59.1 –0.8 –77.3 35.2 –12.3 Greece 10.5 16.8 15.8 19.5 2.2 7.1 1.3 3.3 –0.3 2.7 Hong Kong SAR 24.0 19.3 18.0 17.7 –1.1 –4.9 –0.8 –0.9 –1.4 –0.2 India 31.3 31.2 37.9 46.3 13.0 7.6 2.8 –5.0 8.4 5.9 Indonesia 4.4 3.3 3.2 3.7 0.8 –0.5 –0.2 0.0 0.1 0.1 Ireland – – – – – – – – – – Italy 933.8 1,055.0 1,070.2 1,165.7 98.7 183.9 22.0 32.7 60.1 28.0 Japan 982.5 1,172.3 1,017.1 1,054.1 –44.6 –53.3 –15.6 –4.1 –70.6 14.1 Malaysia 36.1 40.4 35.6 39.5 –5.4 6.2 3.5 –0.0 –2.8 2.6 Mexico 133.2 119.9 106.0 120.6 20.6 14.7 –6.8 8.1 –7.2 5.5 Netherlands 519.1 491.7 469.0 498.8 30.8 1.1 –0.4 –0.6 –1.1 0.6 Norway 67.5 65.3 76.8 94.0 7.6 14.7 3.4 9.5 8.1 13.4 Poland – – – – – – – – – – Portugal 56.4 68.3 72.3 77.3 20.3 15.8 3.7 3.5 6.9 0.4 Singapore 25.4 17.1 16.2 16.9 5.1 –8.7 –4.0 –0.3 – – South Africa 31.5 23.1 23.0 28.9 5.4 0.6 1.4 –1.9 0.3 0.5 South Korea 379.7 307.9 272.4 302.3 90.3 34.2 13.4 –6.9 –7.7 6.4 Spain 602.8 546.0 550.5 614.1 89.5 –18.7 –2.0 –39.9 27.8 28.3 Sweden 206.6 200.0 183.4 194.2 30.7 36.0 10.0 8.1 –6.5 –2.7 Switzerland 111.0 124.4 121.7 130.4 4.3 6.4 1.8 4.9 5.3 2.2 Thailand 2.3 3.1 3.2 3.5 0.5 1.0 –0.1 –0.3 0.2 0.1 Turkey – – – – – – – – – – United Kingdom 432.9 377.8 389.0 426.8 45.8 74.7 16.5 37.8 17.3 –20.9 United States 13,835.1 13,723.0 13,784.4 13,293.8 1,317.3 –112.1 –15.9 –217.8 61.5 –490.7
Corporate issuers 6,153.4 6,535.0 6,413.8 6,722.7 445.2 457.2 147.5 246.8 52.1 115.9 Argentina 8.3 7.8 7.5 8.2 –3.1 –0.5 –0.0 0.3 –0.3 0.8 Australia 43.3 29.6 28.8 33.8 –3.3 –5.3 –1.7 –1.5 –0.6 –0.2 Austria 33.6 31.9 29.3 34.0 8.4 –0.2 0.9 2.9 –1.2 2.8 Belgium 39.5 38.9 40.9 43.4 2.3 2.7 1.8 –5.9 3.6 – Brazil 7.8 6.7 6.5 7.5 1.0 1.0 0.6 0.5 –0.3 –0.3 Canada 132.1 110.2 110.6 124.7 –3.3 5.0 0.7 –2.5 3.5 4.3 China 104.4 185.5 215.6 268.9 28.3 73.3 18.5 40.6 30.1 53.3 Czech Republic 5.2 5.0 4.7 5.3 0.7 0.2 – 0.2 – – Denmark 2.1 2.0 1.9 1.4 –0.2 0.1 –0.0 –0.0 0.0 –0.6 Finland 14.5 10.6 10.0 10.8 –0.0 –3.0 –1.3 –2.1 –0.2 0.2 France 267.8 282.3 243.5 260.4 14.2 29.6 –5.7 17.0 –25.9 1.6 Germany 189.7 299.9 296.3 325.4 27.7 122.0 47.7 58.4 9.3 10.2 Greece 19.0 25.9 25.0 26.7 4.2 8.3 1.5 2.0 0.2 0.2 Hong Kong SAR 8.8 9.9 10.1 10.7 1.1 1.0 –0.0 –0.0 0.2 0.7 India 10.2 7.9 8.7 14.4 4.3 –0.2 1.2 –2.9 1.2 5.0 Indonesia 4.9 3.6 3.4 4.0 1.1 –0.7 –0.3 –0.2 0.0 0.1 Ireland 76.4 51.1 45.9 46.2 –21.8 –21.7 –7.8 –7.1 –2.9 –2.4 Italy 328.1 414.2 415.0 448.0 18.2 102.9 16.5 73.3 18.5 7.0 Japan 728.2 766.6 718.1 739.7 26.7 –129.2 –8.1 –11.8 9.4 5.4 Malaysia 52.1 55.7 51.1 53.4 16.9 6.4 2.0 –0.8 –1.8 0.5 Mexico 27.8 25.0 23.5 26.8 0.4 3.6 1.4 –0.5 –0.1 1.3 Netherlands 76.8 75.3 83.0 88.1 8.6 2.6 4.3 1.1 10.7 – Norway 29.1 21.1 23.2 24.5 2.2 –1.5 –2.0 –0.7 1.1 0.2 Poland – – – – – – – – – – Portugal 43.0 46.6 45.6 52.1 8.3 6.8 1.3 –1.0 1.0 3.5 Singapore 3.7 6.6 6.3 6.6 –2.6 2.9 0.7 1.1 – – South Africa 17.0 13.4 14.4 18.4 2.3 1.0 1.4 0.5 1.1 0.6 South Korea 231.0 218.1 200.6 258.4 1.6 51.2 9.2 20.5 2.0 40.2 Spain 545.6 663.0 661.8 716.2 152.0 152.8 24.1 57.5 27.2 12.8 Sweden 37.4 33.4 35.4 38.0 2.4 4.4 1.0 –3.5 3.6 –0.1 Switzerland 15.7 14.8 16.6 25.6 0.7 –1.9 –0.5 0.4 2.8 7.9 Thailand 41.1 43.0 42.9 48.7 2.2 3.4 –0.1 1.6 0.6 3.9 Turkey 0.5 0.5 0.3 0.4 0.3 0.1 0.0 0.0 –0.1 0.0 United Kingdom 23.1 15.7 26.4 23.1 –0.5 –1.3 –0.2 –0.6 10.9 –6.9 United States 2,886.7 2,925.6 2,873.5 2,840.3 138.5 38.9 38.6 10.6 –52.1 –33.2
Amounts outstanding Changes in stocks
Table 16B: Domestic debt securitiesBy sector and residence of issuerIn billions of US dollars
BIS Quarterly Review, December 2009 A 97

Countries Dec 2006 Dec 2007 Dec 2008 Mar 2009 Jun 2009 Dec 2006 Dec 2007 Dec 2008 Mar 2009 Jun 2009
All countries 13,381.0 14,997.5 16,462.8 16,752.5 16,667.2 6,273.2 7,337.5 7,056.0 6,897.2 6,939.0 Australia 329.8 541.2 413.9 380.9 457.6 306.6 515.2 390.9 354.4 411.0 Austria 23.5 38.0 32.5 32.3 33.6 5.8 24.3 19.9 8.4 8.1 Belgium 99.6 132.5 136.7 127.3 135.3 29.5 33.8 34.7 33.5 35.6 Brazil 471.0 596.2 536.4 565.3 685.5 178.2 250.9 306.2 314.3 395.6 Canada 306.8 327.4 297.8 290.5 310.9 175.4 176.7 115.2 104.2 106.1 China 538.8 659.4 907.1 851.7 842.4 42.7 53.6 55.8 67.6 70.5 Czech Republic 41.2 50.0 48.6 40.9 47.8 0.1 0.0 0.0 0.0 0.0 Denmark 87.8 90.7 89.4 110.1 130.5 74.8 74.1 79.0 100.5 120.8 Finland 54.7 69.0 64.0 57.1 51.6 31.4 40.9 43.8 42.0 41.0 France 662.6 931.1 1,002.6 986.0 1,055.0 381.6 541.4 535.3 557.8 581.4 Germany 699.9 1,023.7 1,212.2 1,275.6 1,379.5 432.2 691.2 871.1 895.6 896.4 Greece 25.2 33.8 45.0 36.5 46.2 – – – – – Hong Kong SAR 31.4 30.4 27.8 34.5 43.2 19.1 17.9 12.8 11.8 11.1 India 42.9 73.6 68.8 76.0 91.3 15.5 31.3 31.2 37.9 46.3 Ireland 96.2 79.4 60.5 54.8 49.9 – – – – – Italy 371.3 383.5 458.1 502.5 484.4 24.1 23.9 22.6 21.6 23.0 Japan 2,489.0 2,516.1 3,155.7 2,785.6 2,943.4 271.3 296.0 379.2 321.6 353.8 Malaysia 35.1 28.0 25.4 19.7 20.6 31.1 22.4 19.9 15.6 16.9 Mexico 102.8 103.7 89.8 86.9 110.2 30.2 35.9 32.4 25.7 30.9 Netherlands 54.6 56.2 145.7 123.4 102.8 0.7 0.0 – – – New Zealand 3.0 4.1 3.2 6.4 8.4 – – – – – Norway 17.7 24.7 25.9 30.4 44.3 3.9 11.3 6.4 4.0 3.2 Poland 15.2 12.5 20.5 20.1 29.5 – – – – – Portugal 33.6 42.0 51.8 52.1 59.2 1.1 0.6 1.5 4.1 3.9 Singapore 35.8 42.8 31.9 29.8 34.5 12.3 13.5 0.1 0.1 0.1 South Africa 22.8 19.9 22.7 19.6 27.2 5.2 5.8 4.3 4.9 6.0 South Korea 363.6 432.0 349.4 350.9 365.0 171.4 220.8 243.2 253.2 185.2 Spain 185.4 261.8 263.0 284.0 294.7 90.3 148.4 109.9 113.9 107.4 Sweden 75.7 80.3 67.2 59.1 53.6 26.8 36.5 35.9 33.5 28.7 Switzerland 27.2 29.9 35.6 29.6 31.9 8.6 10.9 11.9 13.6 15.3 Thailand 35.1 52.0 52.3 59.6 61.7 0.4 – 0.4 1.0 0.9 Turkey 8.6 8.2 9.4 9.3 8.0 – – – – – United Kingdom 459.3 517.8 504.7 483.7 579.6 379.4 432.9 377.8 389.0 426.8 United States 5,180.9 5,403.9 5,968.6 6,637.7 5,796.0 3,510.6 3,614.9 3,307.3 3,161.6 3,006.1
All countries 6,409.1 6,840.2 8,554.9 9,129.5 9,019.9 698.7 819.7 851.9 725.8 708.3 Australia 13.2 19.2 19.3 22.5 41.6 10.0 6.8 3.7 3.9 5.0 Austria 17.5 13.4 12.4 23.6 25.0 0.2 0.3 0.3 0.3 0.5 Belgium 64.9 90.1 93.0 84.4 89.7 5.2 8.6 9.0 9.4 10.0 Brazil 287.1 337.5 223.4 244.5 282.4 5.7 7.8 6.7 6.5 7.5 Canada 120.9 139.5 173.9 176.3 194.8 10.5 11.2 8.8 10.0 10.0 China 461.2 561.6 789.2 723.6 715.1 34.9 44.2 62.1 60.5 56.8 Czech Republic 41.1 50.0 48.6 40.9 47.8 – – – – – Denmark 13.0 16.6 10.5 9.6 9.7 – – – – – Finland 16.1 19.3 14.6 10.0 4.8 7.2 8.8 5.6 5.1 5.8 France 185.0 271.5 333.6 348.8 403.8 95.9 118.3 133.8 79.5 69.9 Germany 226.6 269.3 268.1 327.4 438.6 41.1 63.2 73.1 52.7 44.5 Greece 25.2 33.8 45.0 36.5 46.2 – – – – – Hong Kong SAR 10.9 11.4 13.9 21.8 30.7 1.4 1.1 1.0 1.0 1.3 India 22.1 32.1 29.7 29.5 30.7 5.3 10.2 7.9 8.7 14.4 Ireland 8.1 3.0 9.4 8.9 3.7 88.1 76.4 51.1 45.9 46.2 Italy 346.8 359.5 434.5 480.0 459.8 0.4 0.1 0.9 0.8 1.5 Japan 2,097.4 2,080.5 2,627.6 2,329.2 2,461.9 120.3 139.6 149.0 134.8 127.8 Malaysia 1.2 1.3 1.2 1.2 1.2 2.8 4.3 4.2 3.0 2.5 Mexico 70.4 66.9 55.1 59.1 77.2 2.3 1.0 2.3 2.1 2.1 Netherlands 53.9 56.2 145.7 123.4 102.8 – – – – – New Zealand 3.0 4.1 3.2 6.4 8.4 – – – – – Norway 10.3 9.1 15.4 22.1 36.5 3.4 4.3 4.1 4.3 4.6 Poland 15.2 12.5 20.5 20.1 29.5 – – – – – Portugal 12.2 13.3 18.7 17.7 21.6 20.3 28.1 31.5 30.3 33.7 Singapore 20.9 27.3 31.8 29.7 34.4 2.5 2.0 0.0 0.0 0.0 South Africa 17.0 13.2 17.3 13.6 19.9 0.6 0.9 1.1 1.2 1.3 South Korea 150.2 144.2 66.4 63.1 129.9 42.1 67.0 39.8 34.5 49.9 Spain 75.3 96.8 119.9 129.9 147.6 19.8 16.6 33.3 40.3 39.8 Sweden 39.3 28.8 18.9 13.0 11.5 9.6 15.0 12.4 12.5 13.4 Switzerland 16.6 15.9 21.3 14.0 14.0 2.0 3.1 2.4 2.0 2.6 Thailand 33.2 49.8 50.0 56.5 58.5 1.5 2.3 1.9 2.1 2.3 Turkey 8.6 8.0 9.2 9.2 7.9 0.0 0.2 0.2 0.1 0.1 United Kingdom 79.8 84.2 126.7 94.1 152.1 0.1 0.7 0.3 0.6 0.7 United States 1,530.7 1,636.3 2,480.1 3,326.4 2,659.4 139.6 152.8 181.1 149.7 130.5
Corporate sector
All issuers
Table 17A: Domestic debt securitiesWith remaining maturity up to one year / Amounts outstanding by sector and residence of issuerIn billions of US dollars
Financial institutions
Governments
A 98 BIS Quarterly Review, December 2009

Countries Dec 2006 Dec 2007 Dec 2008 Mar 2009 Jun 2009 Dec 2006 Dec 2007 Dec 2008 Mar 2009 Jun 2009
All countries 2,958.7 3,738.7 3,898.5 3,629.9 3,769.2 2,509.3 3,182.1 3,305.6 3,078.7 3,228.0 Australia 124.2 127.5 109.6 86.6 102.4 121.0 117.4 102.8 79.5 94.5 Austria 38.2 44.6 60.0 62.1 58.7 27.5 38.1 41.0 36.7 36.4 Belgium 23.1 33.9 39.2 29.5 37.7 17.1 20.4 16.3 14.9 23.1 Brazil 9.1 9.2 5.2 6.4 6.5 2.4 4.4 2.3 2.8 3.2 Canada 38.5 74.2 51.7 54.4 52.4 24.4 43.1 34.2 38.0 38.0 China 0.8 1.9 2.2 2.2 3.6 0.8 0.0 1.7 1.7 3.1 Czech Republic 0.1 0.2 0.8 0.7 – – 0.2 0.4 0.4 – Denmark 21.2 23.8 39.7 39.6 36.9 18.0 18.8 29.7 33.4 30.5 Finland 21.5 20.7 23.1 24.5 20.6 8.9 10.8 16.6 17.9 18.0 France 165.6 228.1 242.5 222.2 255.9 129.2 186.5 203.5 193.1 220.0 Germany 324.8 472.1 530.0 439.7 460.8 283.8 412.2 456.4 382.4 392.0 Greece 9.3 14.5 18.0 15.9 25.1 0.2 0.1 1.4 2.6 3.6 Hong Kong SAR 10.5 9.4 12.4 10.6 9.8 10.5 8.7 10.0 8.3 7.5 India 1.0 0.9 3.8 4.3 4.0 0.3 0.3 0.9 1.2 1.2 Ireland 176.7 229.9 212.7 203.8 203.8 171.7 226.7 178.2 175.7 178.8 Italy 56.5 99.9 76.4 88.3 93.3 42.4 61.8 70.0 75.0 78.7 Japan 19.7 16.2 26.2 23.5 23.8 7.7 7.4 10.2 8.7 13.2 Malaysia 2.9 1.2 5.5 4.9 2.2 2.0 0.8 3.3 2.9 1.7 Mexico 5.0 8.4 8.0 7.6 7.0 0.3 0.1 1.4 0.4 0.5 Netherlands 191.6 263.5 276.8 264.3 271.3 172.7 245.7 251.9 237.0 252.2 New Zealand 6.2 8.5 4.6 4.7 5.9 5.2 6.3 4.3 4.5 5.3 Norway 21.1 29.4 35.1 35.1 34.1 17.1 27.8 33.4 34.1 32.0 Poland 0.3 1.0 3.1 1.4 1.2 – 0.2 – – – Portugal 11.4 11.2 9.8 7.8 18.6 6.7 4.8 4.7 5.2 12.6 Singapore 6.5 7.1 9.4 7.7 6.3 5.8 5.8 9.0 7.3 5.7 South Africa 1.2 2.0 2.0 2.2 1.1 0.2 0.1 0.1 0.4 1.0 South Korea 16.2 21.8 16.1 16.3 20.6 9.7 14.9 14.1 14.5 17.4 Spain 55.3 100.9 129.2 138.5 171.3 48.7 92.4 116.2 126.6 159.8 Sweden 54.1 88.9 86.3 82.7 105.4 49.3 77.5 74.9 75.5 92.3 Switzerland 3.0 3.7 4.1 2.9 3.7 2.4 3.1 2.4 1.4 2.4 Thailand 3.2 1.4 0.6 0.8 1.0 0.8 0.0 0.3 0.7 0.9 Turkey 1.7 4.1 2.6 3.9 4.6 0.2 0.3 0.5 0.5 0.8 United Kingdom 537.8 618.6 644.5 564.0 537.2 496.8 570.9 606.6 526.5 502.6 United States 635.4 746.0 855.4 835.5 848.4 587.6 701.3 782.0 760.1 777.2
All countries 118.9 208.8 220.4 199.2 199.0 233.5 243.5 278.7 257.0 254.7 Australia 1.2 6.1 4.8 4.6 5.3 2.0 3.9 2.0 2.5 2.6 Austria 10.4 4.1 15.7 21.0 18.0 0.4 2.5 3.3 4.5 4.3 Belgium 0.1 9.6 17.5 6.9 7.7 5.9 4.0 5.4 7.8 6.8 Brazil 4.5 2.2 2.2 3.2 2.8 2.3 2.6 0.7 0.4 0.5 Canada 9.2 16.4 10.9 9.3 8.3 4.9 14.7 6.6 7.1 6.1 China – 1.6 0.5 0.5 0.5 0.0 0.3 0.0 – – Czech Republic – – 0.4 0.4 – 0.1 0.0 0.0 – – Denmark 2.3 4.1 8.2 4.8 6.0 0.9 0.9 1.9 1.4 0.4 Finland 10.1 7.9 4.5 4.7 0.4 2.4 2.0 2.0 1.8 2.2 France 0.2 0.2 0.2 0.2 0.2 36.3 41.4 38.8 28.9 35.7 Germany 26.7 46.1 43.7 39.2 47.7 14.2 13.8 29.9 18.2 21.1 Greece 7.4 14.2 15.5 12.8 21.3 1.7 0.2 1.2 0.5 0.2 Hong Kong SAR – 0.3 0.5 – – 0.1 0.3 2.0 2.2 2.3 India – – – – – 0.8 0.5 2.9 3.0 2.8 Ireland – 1.1 27.6 22.8 19.4 5.0 2.2 6.8 5.2 5.5 Italy 10.7 33.9 5.2 7.9 7.0 3.4 4.1 1.3 5.4 7.6 Japan 0.4 – 0.6 0.2 0.2 11.6 8.9 15.5 14.6 10.4 Malaysia – – 1.6 1.6 0.1 0.9 0.3 0.6 0.4 0.4 Mexico 2.3 4.2 3.9 5.0 4.7 2.5 4.1 2.7 2.1 1.8 Netherlands 0.1 0.2 12.0 14.1 7.9 18.8 17.7 13.0 13.1 11.2 New Zealand 0.0 0.6 0.0 0.1 0.1 0.9 1.7 0.2 0.1 0.5 Norway – – – – – 4.0 1.7 1.7 1.0 2.0 Poland 0.3 0.8 3.1 1.4 1.2 – – – – – Portugal 4.0 5.3 2.4 0.3 3.5 0.7 1.1 2.7 2.3 2.5 Singapore – – – – 0.3 0.7 1.3 0.4 0.4 0.2 South Africa 0.9 0.7 1.5 1.5 – 0.1 1.2 0.4 0.3 0.1 South Korea 0.6 3.0 0.1 0.1 0.1 6.0 4.0 2.0 1.8 3.2 Spain 3.5 6.0 7.2 5.5 5.5 3.1 2.6 5.7 6.4 6.0 Sweden 2.5 7.2 8.9 3.6 8.6 2.2 4.2 2.5 3.5 4.4 Switzerland 0.3 0.3 0.4 0.4 0.1 0.2 0.4 1.3 1.1 1.3 Thailand 1.9 1.0 0.3 0.1 0.1 0.4 0.4 – – – Turkey 1.6 3.8 2.1 3.4 3.8 – – – – – United Kingdom – 3.0 – 4.0 4.0 41.0 44.7 38.0 33.5 30.6 United States 0.1 0.1 0.1 0.1 0.1 47.8 44.7 73.4 75.2 71.0
Corporate sector
All issuers
Table 17B: International debt securitiesWith remaining maturity up to one year / Amounts outstanding by sector and residence of issuerIn billions of US dollars
Financial institutions
Governments
BIS Quarterly Review, December 2009 A 99

Countries 2006 2007 2008 Q3 2007 Q4 2007 Q1 2008 Q2 2008 Q3 2008 Q4 2008 Q1 2009 Q2 2009 Q3 2009
All countries 371.3 499.1 392.2 89.6 164.5 49.8 142.2 98.0 102.1 57.1 255.8 172.4
Developed countries 225.2 255.7 305.6 38.4 80.7 26.4 101.2 80.3 97.8 43.1 225.5 124.3 Australia 9.5 16.0 24.8 4.7 3.1 2.8 4.7 4.8 12.5 6.9 12.5 12.5 Austria 11.8 11.9 0.6 – 3.4 – 0.6 0.0 – – – 0.5 Belgium 2.9 5.3 9.9 1.8 2.7 – 0.0 0.0 9.9 0.1 0.7 – Canada 5.2 6.3 11.0 0.8 2.3 2.5 3.6 0.7 4.2 4.9 7.4 11.1 Cyprus 1.2 0.1 2.5 – 0.0 – 2.5 – – – – – Denmark 3.3 1.9 7.4 – 0.4 0.2 7.3 – – 0.1 1.4 1.8 Finland 1.8 2.1 2.1 – 0.7 – 0.3 – 1.8 – 0.7 0.2 France 35.1 53.5 24.2 2.0 30.1 11.9 3.9 7.6 0.8 2.8 8.0 0.4 Germany 24.6 24.3 7.0 1.8 7.6 0.5 1.2 4.2 1.0 0.1 1.1 10.9 Greece 4.4 19.3 0.9 13.0 2.4 – 0.2 0.5 0.2 0.2 0.9 3.8 Iceland 1.3 0.2 0.3 – 0.2 0.1 0.2 – 0.0 – – – Ireland 1.7 1.2 0.2 0.2 0.0 – 0.0 0.1 0.0 1.7 0.1 0.0 Italy 11.3 10.3 11.3 1.9 4.1 2.3 7.8 0.0 1.2 0.0 12.5 0.5 Japan 10.7 3.6 2.9 0.3 1.5 0.1 – 0.4 2.4 1.3 5.4 5.7 Luxembourg 0.4 0.3 – 0.1 – – – – – – 3.2 – Netherlands 8.9 5.7 0.2 2.1 1.3 0.1 0.1 – – 2.0 0.4 3.7 New Zealand 0.0 0.6 0.1 0.0 – 0.0 0.0 0.1 – – 0.5 0.0 Norway 7.1 8.1 2.5 0.5 3.5 0.1 1.6 0.5 0.3 0.2 1.5 1.0 Portugal 1.6 1.3 5.0 0.4 – 0.7 4.0 – 0.3 – 1.7 – Spain 7.4 16.6 10.4 1.5 7.6 0.3 0.4 0.4 9.3 1.6 3.2 1.3 Sweden 3.9 6.6 1.5 1.2 1.1 0.2 0.4 0.4 0.5 1.3 3.9 0.1 Switzerland 14.4 8.1 15.9 0.2 1.2 – 15.7 0.2 0.0 0.1 5.6 8.2 United Kingdom 40.1 38.9 65.7 3.4 5.6 2.7 41.6 13.6 7.8 7.4 42.7 26.3 United States 16.3 12.9 99.0 2.6 1.5 2.0 4.8 46.7 45.5 12.3 112.1 36.0
Offshore centres 21.8 26.3 7.6 7.7 8.6 3.1 3.5 0.9 0.1 4.6 4.3 4.5 Bahamas – – – – – – – – – – – – Bahrain 0.4 0.3 – – – – – – – – – – Bermuda 1.2 1.5 0.7 1.0 0.3 – 0.7 – 0.1 0.1 0.8 – Cayman Islands 0.0 – 1.0 – – 1.0 – – – – – 0.1 Hong Kong SAR 14.8 19.4 4.4 5.5 7.0 2.0 2.1 0.2 0.1 0.9 2.4 2.4 Panama 0.2 – 0.2 – – – 0.2 – – – – – Singapore 4.4 4.9 0.8 1.2 1.3 – 0.6 0.2 0.0 3.6 1.0 1.8
Developing countries 124.3 217.1 79.0 43.5 75.2 20.4 37.6 16.8 4.2 9.5 26.0 43.6
Africa & Middle East 7.3 19.2 15.7 3.1 9.8 1.8 5.7 7.6 0.5 0.9 0.6 2.9 Egypt 0.5 0.9 0.8 0.2 0.7 – 0.5 0.3 – – – – Israel 1.3 3.0 0.9 0.2 0.2 0.1 0.4 0.3 0.1 – 0.3 0.9 Jordan – 0.3 0.0 – 0.3 – – – 0.0 – – – Kuwait – – 6.4 – – – 1.3 5.0 – 0.1 – – Nigeria – 1.7 1.7 1.2 0.3 1.7 0.1 – – – – 0.1 Saudi Arabia 0.4 0.2 1.2 – 0.0 – 1.2 – – – – 0.6 South Africa 3.8 7.7 2.3 0.7 3.8 0.0 0.4 1.5 0.4 0.1 0.3 1.2 United Arab Emirates 0.8 4.2 0.4 – 4.2 0.0 0.4 – – 0.0 – 0.2
Asia & Pacific 85.0 113.9 38.9 24.3 39.2 16.2 15.9 4.1 2.7 7.7 20.1 26.0 China 52.1 63.0 15.6 13.2 26.0 5.9 6.2 2.1 1.4 6.5 12.5 13.3 Chinese Taipei 3.7 5.6 1.2 0.3 2.1 0.1 0.4 0.7 – 0.1 0.4 1.9 Georgia 0.2 – 0.1 – – 0.1 – – – – – – India 10.3 22.9 12.0 5.8 5.4 9.0 1.8 0.2 1.0 0.0 3.8 9.0 Indonesia 0.8 2.6 7.2 0.9 0.8 0.2 6.0 0.9 – 0.0 0.3 0.0 Kazakhstan 4.3 5.1 0.2 1.0 3.2 0.2 0.1 – – – 0.3 0.2 Malaysia 0.9 2.3 0.4 0.7 0.1 0.4 – 0.0 – – 1.8 0.5 Pakistan 0.9 0.7 0.1 – – – 0.1 – – – – – Philippines 1.5 2.9 0.1 1.3 0.1 – 0.1 – – – 0.1 – South Korea 7.4 5.3 1.2 0.6 0.3 0.1 0.7 0.0 0.3 1.0 0.9 1.0 Thailand 2.1 0.7 0.4 0.1 0.3 0.0 0.3 0.1 – 0.1 0.0 0.1
Europe 17.8 37.6 7.1 2.7 8.7 0.2 5.6 0.6 0.7 0.0 0.3 6.9 Croatia 0.2 – – – – – – – – – – – Czech Republic 0.2 0.3 0.0 0.2 0.1 – – 0.0 – – – 0.0 Hungary – 0.2 0.0 – – – – – 0.0 – – – Poland 1.3 0.4 1.5 0.1 0.1 0.1 0.7 0.0 0.7 – 0.3 0.2 Romania 0.2 0.2 – – 0.2 – – – – – – – Russia 13.7 31.4 3.2 1.5 7.5 – 2.6 0.6 – – 0.0 6.6 Turkey 2.0 3.2 1.5 0.7 – – 1.5 0.0 – – 0.1 – Ukraine 0.0 1.5 0.9 0.1 0.6 0.1 0.8 0.0 – 0.0 – 0.1
Latin America & Caribbean 14.2 46.3 17.3 13.5 17.4 2.1 10.4 4.6 0.2 1.0 4.9 7.8 Argentina 0.9 1.1 – 0.3 0.1 – – – – – – – Brazil 10.9 38.5 14.9 9.4 16.0 2.1 8.0 4.6 0.2 1.0 4.9 5.6 Chile 0.1 0.3 – 0.1 0.1 – – – – – – – Mexico 1.7 2.3 2.4 0.3 1.1 – 2.4 – – – – 2.1 Peru 0.6 0.7 – 0.1 0.2 – – – – – – 0.1
Table 18: Announced international equity issuesBy nationality of issuerIn billions of US dollars
A 100 BIS Quarterly Review, December 2009

BIS Quarterly Review, December 2009 A101
Derivatives markets1
19 Amounts outstanding of over-the-counter (OTC) derivatives by risk category and instrument ........................................................................ page A103
20 Amounts outstanding of OTC foreign exchange derivatives A By instrument and counterparty ..................................................................................... A103 B By currency.................................................................................................................... A104 C By instrument, maturity and counterparty....................................................................... A104
21 Amounts outstanding of OTC single-currency interest rate derivatives A By instrument and counterparty ..................................................................................... A105 B By currency.................................................................................................................... A105 C By instrument, maturity and counterparty....................................................................... A106
22 Amounts outstanding of OTC equity-linked and commodity derivatives A Equity-linked and commodity derivatives by instrument and counterparty ...................... A106 B Equity-linked derivatives by instrument and market........................................................ A107 C Equity-linked derivatives by instrument, maturity and counterparty ................................ A107
23 Derivative financial instruments traded on organised exchanges by instrument and location A Notional amounts ........................................................................................................... A108 B Number of contracts....................................................................................................... A108
1 More detailed data and a full set of historical time series are available on the BIS website under
http://www.bis.org/statistics/derstats.htm.

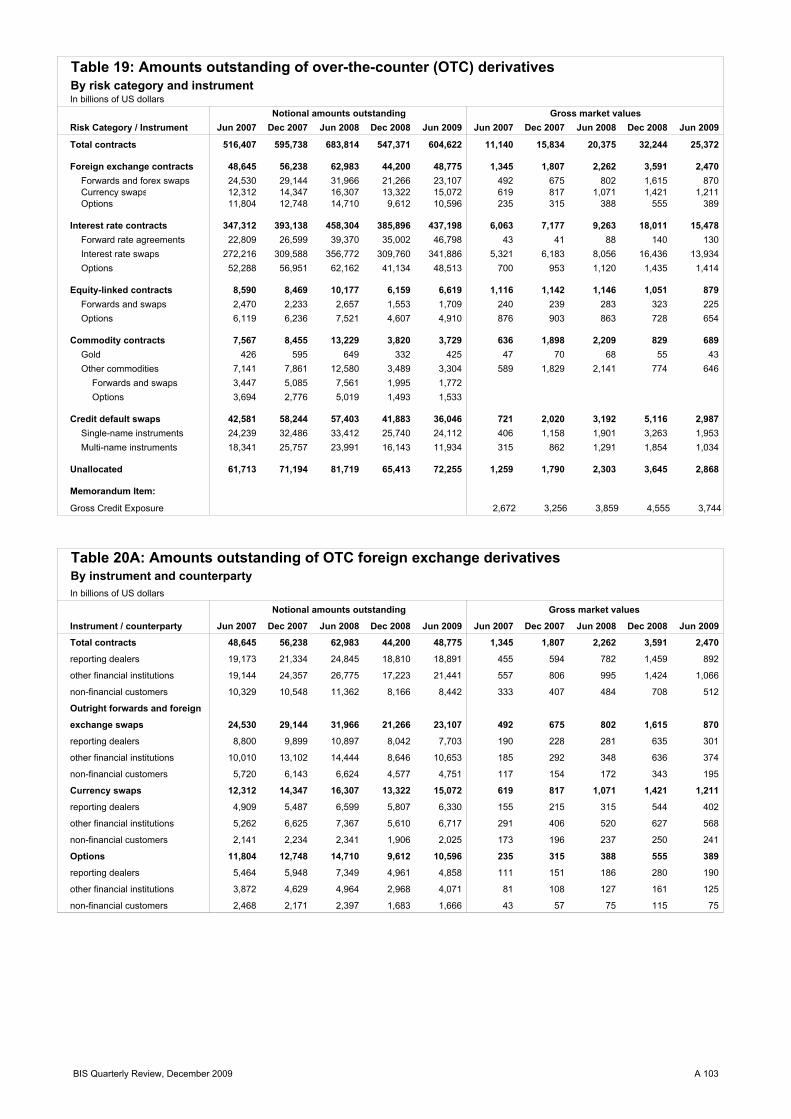
Risk Category / Instrument Jun 2007 Dec 2007 Jun 2008 Dec 2008 Jun 2009 Jun 2007 Dec 2007 Jun 2008 Dec 2008 Jun 2009
Total contracts 516,407 595,738 683,814 547,371 604,622 11,140 15,834 20,375 32,244 25,372
Foreign exchange contracts 48,645 56,238 62,983 44,200 48,775 1,345 1,807 2,262 3,591 2,470 Forwards and forex swaps 24,530 29,144 31,966 21,266 23,107 492 675 802 1,615 870 Currency swaps 12,312 14,347 16,307 13,322 15,072 619 817 1,071 1,421 1,211 Options 11,804 12,748 14,710 9,612 10,596 235 315 388 555 389
Interest rate contracts 347,312 393,138 458,304 385,896 437,198 6,063 7,177 9,263 18,011 15,478 Forward rate agreements 22,809 26,599 39,370 35,002 46,798 43 41 88 140 130 Interest rate swaps 272,216 309,588 356,772 309,760 341,886 5,321 6,183 8,056 16,436 13,934 Options 52,288 56,951 62,162 41,134 48,513 700 953 1,120 1,435 1,414
Equity-linked contracts 8,590 8,469 10,177 6,159 6,619 1,116 1,142 1,146 1,051 879 Forwards and swaps 2,470 2,233 2,657 1,553 1,709 240 239 283 323 225 Options 6,119 6,236 7,521 4,607 4,910 876 903 863 728 654
Commodity contracts 7,567 8,455 13,229 3,820 3,729 636 1,898 2,209 829 689 Gold 426 595 649 332 425 47 70 68 55 43 Other commodities 7,141 7,861 12,580 3,489 3,304 589 1,829 2,141 774 646
Forwards and swaps 3,447 5,085 7,561 1,995 1,772 Options 3,694 2,776 5,019 1,493 1,533
Credit default swaps 42,581 58,244 57,403 41,883 36,046 721 2,020 3,192 5,116 2,987 Single-name instruments 24,239 32,486 33,412 25,740 24,112 406 1,158 1,901 3,263 1,953 Multi-name instruments 18,341 25,757 23,991 16,143 11,934 315 862 1,291 1,854 1,034
Unallocated 61,713 71,194 81,719 65,413 72,255 1,259 1,790 2,303 3,645 2,868
Memorandum Item:
Gross Credit Exposure 2,672 3,256 3,859 4,555 3,744
Instrument / counterparty Jun 2007 Dec 2007 Jun 2008 Dec 2008 Jun 2009 Jun 2007 Dec 2007 Jun 2008 Dec 2008 Jun 2009
Total contracts 48,645 56,238 62,983 44,200 48,775 1,345 1,807 2,262 3,591 2,470
reporting dealers 19,173 21,334 24,845 18,810 18,891 455 594 782 1,459 892
other financial institutions 19,144 24,357 26,775 17,223 21,441 557 806 995 1,424 1,066
non-financial customers 10,329 10,548 11,362 8,166 8,442 333 407 484 708 512
Outright forwards and foreign
exchange swaps 24,530 29,144 31,966 21,266 23,107 492 675 802 1,615 870
reporting dealers 8,800 9,899 10,897 8,042 7,703 190 228 281 635 301
other financial institutions 10,010 13,102 14,444 8,646 10,653 185 292 348 636 374
non-financial customers 5,720 6,143 6,624 4,577 4,751 117 154 172 343 195
Currency swaps 12,312 14,347 16,307 13,322 15,072 619 817 1,071 1,421 1,211
reporting dealers 4,909 5,487 6,599 5,807 6,330 155 215 315 544 402
other financial institutions 5,262 6,625 7,367 5,610 6,717 291 406 520 627 568
non-financial customers 2,141 2,234 2,341 1,906 2,025 173 196 237 250 241
Options 11,804 12,748 14,710 9,612 10,596 235 315 388 555 389
reporting dealers 5,464 5,948 7,349 4,961 4,858 111 151 186 280 190
other financial institutions 3,872 4,629 4,964 2,968 4,071 81 108 127 161 125
non-financial customers 2,468 2,171 2,397 1,683 1,666 43 57 75 115 75
Table 19: Amounts outstanding of over-the-counter (OTC) derivativesBy risk category and instrumentIn billions of US dollars
Notional amounts outstanding Gross market values
Notional amounts outstanding Gross market values
Table 20A: Amounts outstanding of OTC foreign exchange derivativesBy instrument and counterpartyIn billions of US dollars
BIS Quarterly Review, December 2009 A 103

Currency Jun 2007 Dec 2007 Jun 2008 Dec 2008 Jun 2009 Jun 2007 Dec 2007 Jun 2008 Dec 2008 Jun 2009
All currencies 48,645 56,238 62,983 44,200 48,775 1,345 1,807 2,262 3,591 2,470 Australian dollar 2,030 2,227 2,396 1,360 1,741 81 76 105 135 110 Canadian dollar 2,239 2,404 2,226 1,568 1,735 106 134 93 123 95 Danish krone 167 241 224 195 203 3 5 6 10 5 Euro 18,280 21,806 25,963 18,583 20,653 455 790 1,010 1,409 1,032 Hong Kong dollar 902 988 857 608 422 6 5 13 4 3 Japanese yen 10,602 12,857 13,616 11,292 11,438 389 371 433 884 531 New Zealand dollar 56 60 58 28 15 2 2 1 3 1 Norwegian krone 384 420 478 369 223 9 10 14 38 10 Pound sterling 7,770 7,979 8,377 4,732 6,213 174 260 280 633 435 Swedish krona 1,390 1,525 1,589 1,178 1,255 23 29 30 88 54 Swiss franc 3,056 3,662 3,964 3,034 3,072 54 91 119 194 103 Thai baht 5 3 6 3 2 0 0 0 0 0 US dollar 40,513 46,947 52,152 37,516 40,737 1,112 1,471 1,838 2,846 1,961 Other 9,896 11,358 14,060 7,932 9,840 276 370 582 817 600
Table 20C: Amounts outstanding of OTC foreign exchange derivativesBy instrument and maturityIn billions of US dollars
Instrument / maturity Jun 2007 Dec 2007 Jun 2008 Dec 2008 Jun 2009 Jun 2007 Dec 2007 Jun 2008 Dec 2008 Jun 2009
Total contracts 48,645 56,238 62,983 44,200 48,775 19,173 21,334 24,845 18,810 18,891
Maturity of one year or less 36,950 40,316 43,639 31,076 30,302 14,586 5,153 6,040 12,941 12,459
Maturity between 1 and 5 yrs 8,090 8,553 10,701 9,049 9,698 3,182 1,328 1,811 4,081 4,237
Maturity over 5 years 3,606 7,370 8,643 4,075 8,775 1,405 302 357 1,788 2,195
Forwards and swaps 36,842 43,490 48,273 34,588 39,287 13,709 15,386 17,496 13,849 14,291
Maturity of one year or less 27,706 31,172 33,558 24,612 25,644 10,206 11,543 12,549 9,587 9,716
Maturity between 1 and 5 yrs 5,823 6,176 7,623 6,390 6,965 2,237 2,431 3,177 2,733 2,974
Maturity over 5 years 3,312 6,142 7,093 3,585 6,678 1,266 1,412 1,770 1,529 1,600
Options 11,804 12,748 14,710 9,612 10,596 5,464 5,948 7,349 4,961 4,858
Maturity of one year or less 9,244 9,144 10,081 6,463 6,551 4,380 4,553 5,466 3,354 3,190
Maturity between 1 and 5 yrs 2,267 2,377 3,078 2,659 2,581 945 1,166 1,610 1,348 1,284
Maturity over 5 years 293 1,227 1,550 490 1,464 139 229 274 259 384
All counterparties Reporting Dealers
Table 20B: Amounts outstanding of OTC foreign exchange derivativesBy currencyIn billions of US dollars
Notional amounts outstanding Gross market values
A 104 BIS Quarterly Review, December 2009

Table 21A: Amounts outstanding of OTC single-currency interest rate derivativesBy instrument and counterpartyIn billion of US dollars
Instrument / counterparty Jun 2007 Dec 2007 Jun 2008 Dec 2008 Jun 2009 Jun 2007 Dec 2007 Jun 2008 Dec 2008 Jun 2009
Total contracts 347,312 393,138 458,304 385,896 437,198 6,063 7,177 9,263 18,011 15,478
reporting dealers 148,555 157,245 188,982 160,261 148,150 2,375 2,774 3,554 6,889 4,759 other financial institutions 153,370 193,107 223,023 187,885 250,069 2,946 3,786 4,965 10,051 9,928 non-financial customers 45,387 42,786 46,299 37,749 38,979 742 617 745 1,071 790
Forward rate agreements 22,809 26,599 39,370 35,002 46,798 43 41 88 140 130
reporting dealers 10,754 11,903 19,203 20,111 24,157 12 14 34 76 43 other financial institutions 11,035 13,830 18,426 13,616 20,994 27 25 48 58 83 non-financial customers 1,019 865 1,742 1,275 1,648 3 2 6 6 4
Swaps 272,216 309,588 356,772 309,760 341,886 5,321 6,183 8,056 16,436 13,934
reporting dealers 111,324 119,638 140,489 115,651 100,166 1,982 2,271 2,920 5,918 3,988 other financial institutions 123,916 156,948 179,831 162,064 208,114 2,661 3,382 4,480 9,549 9,234 non-financial customers 36,976 33,002 36,452 32,045 33,606 677 530 656 969 712
Options 52,288 56,951 62,162 41,134 48,513 700 953 1,120 1,435 1,414
reporting dealers 26,477 25,704 29,291 24,498 23,827 380 489 599 895 728 other financial institutions 18,418 22,329 24,766 12,206 20,961 258 379 437 444 611 non-financial customers 7,392 8,918 8,106 4,430 3,726 62 85 84 97 75
Table 21B: Amounts outstanding of OTC single-currency interest rate derivativesBy currencyIn billions of US dollars
Currency Jun 2007 Dec 2007 Jun 2008 Dec 2008 Jun 2009 Jun 2007 Dec 2007 Jun 2008 Dec 2008 Jun 2009
All currencies 347,312 393,138 458,304 385,896 437,198 6,063 7,177 9,263 18,011 15,478
Australian dollar 1,538 1,701 2,549 1,607 1,720 21 35 58 82 44
Canadian dollar 2,828 3,014 3,286 2,631 3,227 43 37 60 181 141
Danish krone 234 313 343 264 305 7 8 10 9 11
Euro 127,648 146,082 171,877 146,085 160,646 2,846 2,688 3,910 5,128 6,255
Hong Kong dollar 516 553 682 436 470 4 7 9 20 11
Japanese yen 48,035 53,099 58,056 57,425 57,451 364 401 380 847 800
New Zealand dollar 61 79 97 81 44 1 1 1 4 2
Norwegian krone 1,969 2,381 2,792 1,755 718 11 10 20 25 13
Pound sterling 27,676 28,390 38,619 23,532 32,591 627 430 684 1,161 1,117
Swedish krona 5,155 5,176 6,454 4,503 5,294 48 43 73 114 118
Swiss franc 3,921 4,101 5,253 4,940 4,713 52 42 71 115 121
US dollar 114,371 129,756 149,813 129,898 154,167 1,851 3,219 3,601 9,911 6,473
Other 13,360 18,493 18,484 12,740 15,852 189 257 386 414 372
Notional amounts outstanding Gross market values
Notional amounts outstanding Gross market values
BIS Quarterly Review, December 2009 A 105

Table 21C: Amounts outstanding of OTC single-currency interest rate derivativesBy instrument and maturity In billions of US dollars
Instrument / maturity Jun 2007 Dec 2007 Jun 2008 Dec 2008 Jun 2009 Jun 2007 Dec 2007 Jun 2008 Dec 2008 Jun 2009
Total contracts 347,312 393,138 458,304 385,896 437,198 148,555 157,245 188,982 160,261 148,150
Maturity of one year or less 132,402 127,601 153,181 152,060 159,143 60,108 60,805 79,955 69,256 62,635 Maturity between 1 and 5 years 125,700 134,713 150,096 124,731 128,301 53,469 56,783 63,969 49,514 43,870 Maturity over 5 years 89,210 130,824 155,028 109,104 149,754 34,979 39,658 45,058 41,491 41,644
Forwards and swaps 295,024 336,187 396,142 344,761 388,684 122,078 131,541 159,692 135,763 124,323
Maturity of one year or less 116,496 113,626 138,215 141,043 150,630 53,829 54,880 72,793 63,628 58,058 Maturity between 1 and 5 years 103,900 114,109 128,741 108,035 111,431 41,781 46,349 52,223 39,365 34,271 Maturity over 5 years 74,628 108,451 129,186 95,683 126,623 26,468 30,313 34,675 32,770 31,994
Options 52,288 56,951 62,162 41,134 48,513 26,477 25,704 29,291 24,498 23,827
Maturity of one year or less 15,906 13,975 14,966 11,017 8,513 6,279 5,926 7,162 5,628 4,578 Maturity between 1 and 5 years 21,800 20,604 21,355 16,696 16,870 11,687 10,434 11,746 10,150 9,599 Maturity over 5 years 14,582 22,373 25,841 13,421 23,130 8,511 9,344 10,383 8,721 9,650
Table 22A: Amounts outstanding of OTC equity-linked and commodity derivativesBy instrument and counterpartyIn billions of US dollars
Instrument / counterparty Jun 2007 Dec 2007 Jun 2008 Dec 2008 Jun 2009 Jun 2007 Dec 2007 Jun 2008 Dec 2008 Jun 2009
Total equity contracts 8,590 8,469 10,177 6,159 6,619 1,116 1,142 1,146 1,051 879
Reporting dealers 3,118 3,011 3,479 2,097 2,656 405 398 376 386 367
Other financial institutions 4,473 4,598 5,496 3,295 3,277 549 578 616 531 400
Non-financial institutions 999 861 1,203 767 686 161 166 154 134 112
Forwards and swaps 2,470 2,233 2,657 1,553 1,709 240 239 283 323 225
Reporting dealers 658 637 599 361 447 46 41 52 80 58
Other financial institutions 1,321 1,262 1,489 927 979 146 153 184 192 130
Non-financial institutions 492 334 569 265 283 48 45 47 51 37
Options 6,119 6,236 7,521 4,607 4,910 876 903 863 728 654
Reporting dealers 2,460 2,373 2,879 1,736 2,209 359 357 323 306 309
Other financial institutions 3,152 3,336 4,007 2,368 2,298 403 425 432 339 270
Non-financial institutions 508 527 634 502 403 113 121 108 83 75
Total commodity
Contracts 7,567 8,455 13,229 3,820 3,729 636 1,898 2,209 829 689
Gold 426 595 649 332 425 47 70 68 55 43
Forwards and swaps 141 200 222 116 179 – – – – –
Options 285 395 428 216 246 – – – – –
Other precious metals 88 103 190 96 203 6 11 14 16 32
Forwards and swaps 42 51 86 48 101 – – – – –
Options 46 52 104 48 102 – – – – –
Other commodities 7,053 7,758 12,389 3,392 3,101 583 1,818 2,127 758 614
Forwards and swaps 3,405 5,034 7,474 1,947 1,671 – – – – –
Options 3,649 2,724 4,915 1,446 1,430 – – – – –
All counterparties Reporting Dealers
Notional amounts outstanding Gross market values
A 106 BIS Quarterly Review, December 2009

Table 22B: Amounts outstanding of OTC equity-linked derivativesBy instrument and market In billions of US dollars
Instrument / market Jun 2007 Dec 2007 Jun 2008 Dec 2008 Jun 2009 Jun 2007 Dec 2007 Jun 2008 Dec 2008 Jun 2009
Total contracts 8,590 8,469 10,177 6,159 6,619 1,116 1,142 1,146 1,051 879
US Equities 1,907 1,766 2,064 1,403 1,523 243 232 249 239 202 European Equities 5,059 5,003 6,134 3,862 3,906 621 607 594 582 478 Japanese Equities 788 543 628 368 628 62 50 60 73 93 Other Asian Equities 267 553 514 165 173 127 180 171 91 56 Latin American Equities 228 212 282 99 125 15 18 20 20 8 Other Equities 340 391 556 261 264 47 54 51 45 43
Forwards and swaps 2,470 2,233 2,657 1,553 1,709 240 239 283 323 225
US Equities 795 719 764 474 527 76 73 86 94 55 European Equities 1,289 1,104 1,384 850 937 132 120 145 167 130 Japanese Equities 35 43 70 44 70 4 7 9 14 12 Other Asian Equities 72 74 62 35 34 8 13 14 14 6 Latin American Equities 147 126 135 40 34 9 11 12 15 5 Other Equities 133 166 242 110 107 12 15 18 19 18
Options 6,119 6,236 7,521 4,607 4,910 876 903 863 728 654
US Equities 1,112 1,047 1,300 929 996 168 159 164 145 147 European Equities 3,769 3,899 4,750 3,012 2,968 490 488 449 415 348 Japanese Equities 753 501 558 324 559 58 43 51 59 81 Other Asian Equities 196 479 452 130 139 119 167 157 78 50 Latin American Equities 81 86 146 60 90 6 7 8 5 3 Other Equities 207 225 314 151 158 35 39 34 26 25
Table 22C: Amounts outstanding of OTC equity-linked derivativesBy instrument, maturity and counterpartyIn billions of US dollars
Instrument / maturity Jun 2007 Dec 2007 Jun 2008 Dec 2008 Jun 2009 Jun 2007 Dec 2007 Jun 2008 Dec 2008 Jun 2009
Total contracts 8,590 8,469 10,177 6,159 6,619 3,118 3,011 3,479 2,097 2,656
Maturity of one year or less 4,093 4,672 5,332 2,811 2,937 1,485 1,693 1,893 1,004 1,178
Maturity between 1 and 5 yrs 3,513 2,905 3,793 2,569 2,890 1,365 1,082 1,348 906 1,242
Maturity over 5 years 984 892 1,052 779 791 268 235 238 187 236
Forwards and swaps 2,470 2,233 2,657 1,553 1,709 658 637 599 361 447
Maturity of one year or less 1,383 1,313 1,401 743 843 394 372 377 185 220
Maturity between 1 and 5 yrs 711 657 931 535 630 199 194 175 133 173
Maturity over 5 years 376 263 324 275 235 65 71 48 44 54
Options 6,119 6,236 7,521 4,607 4,910 2,460 2,373 2,879 1,736 2,209
Maturity of one year or less 2,710 3,359 3,931 2,069 2,094 1,091 1,322 1,516 820 957
Maturity between 1 and 5 yrs 2,802 2,248 2,862 2,034 2,260 1,166 887 1,173 773 1,069
Maturity over 5 years 608 629 728 504 556 204 164 190 143 182
Notional amounts outstanding Gross market values
All counterparties Reporting Dealers
BIS Quarterly Review, December 2009 A 107
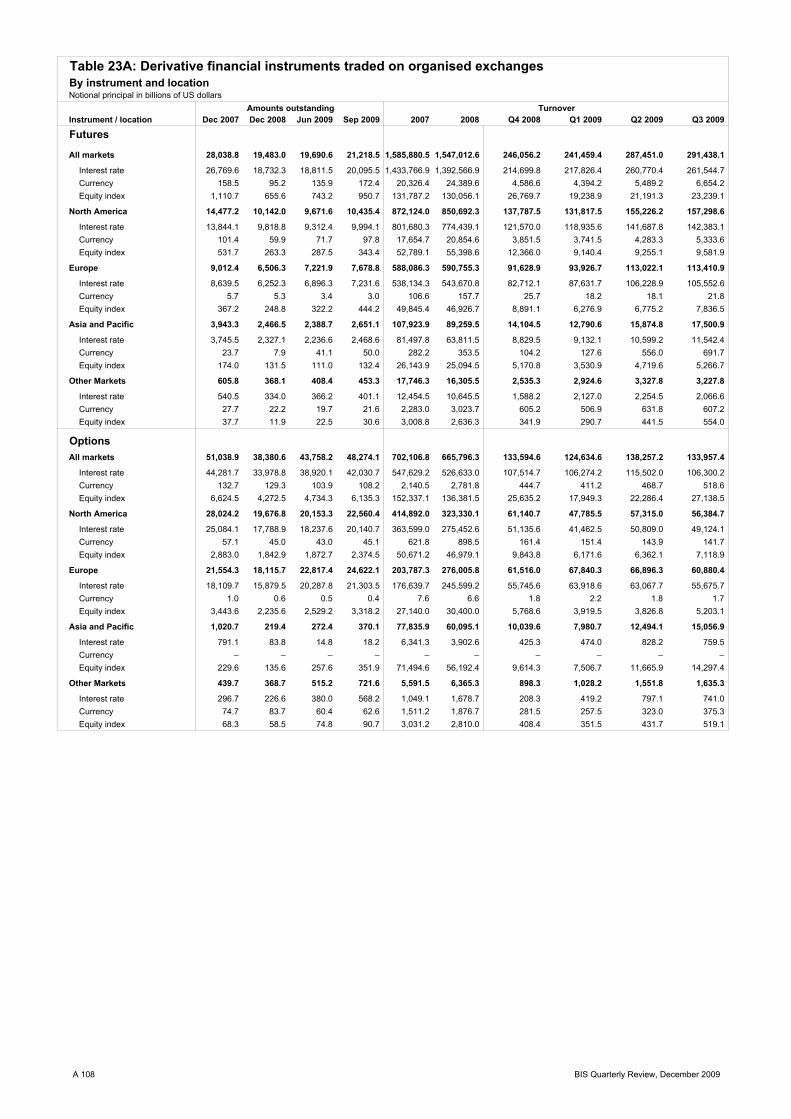
Instrument / location Dec 2007 Dec 2008 Jun 2009 Sep 2009 2007 2008 Q4 2008 Q1 2009 Q2 2009 Q3 2009
Futures
All markets 28,038.8 19,483.0 19,690.6 21,218.5 1,585,880.5 1,547,012.6 246,056.2 241,459.4 287,451.0 291,438.1
Interest rate 26,769.6 18,732.3 18,811.5 20,095.5 1,433,766.9 1,392,566.9 214,699.8 217,826.4 260,770.4 261,544.7 Currency 158.5 95.2 135.9 172.4 20,326.4 24,389.6 4,586.6 4,394.2 5,489.2 6,654.2 Equity index 1,110.7 655.6 743.2 950.7 131,787.2 130,056.1 26,769.7 19,238.9 21,191.3 23,239.1
North America 14,477.2 10,142.0 9,671.6 10,435.4 872,124.0 850,692.3 137,787.5 131,817.5 155,226.2 157,298.6
Interest rate 13,844.1 9,818.8 9,312.4 9,994.1 801,680.3 774,439.1 121,570.0 118,935.6 141,687.8 142,383.1 Currency 101.4 59.9 71.7 97.8 17,654.7 20,854.6 3,851.5 3,741.5 4,283.3 5,333.6 Equity index 531.7 263.3 287.5 343.4 52,789.1 55,398.6 12,366.0 9,140.4 9,255.1 9,581.9
Europe 9,012.4 6,506.3 7,221.9 7,678.8 588,086.3 590,755.3 91,628.9 93,926.7 113,022.1 113,410.9
Interest rate 8,639.5 6,252.3 6,896.3 7,231.6 538,134.3 543,670.8 82,712.1 87,631.7 106,228.9 105,552.6 Currency 5.7 5.3 3.4 3.0 106.6 157.7 25.7 18.2 18.1 21.8 Equity index 367.2 248.8 322.2 444.2 49,845.4 46,926.7 8,891.1 6,276.9 6,775.2 7,836.5
Asia and Pacific 3,943.3 2,466.5 2,388.7 2,651.1 107,923.9 89,259.5 14,104.5 12,790.6 15,874.8 17,500.9
Interest rate 3,745.5 2,327.1 2,236.6 2,468.6 81,497.8 63,811.5 8,829.5 9,132.1 10,599.2 11,542.4 Currency 23.7 7.9 41.1 50.0 282.2 353.5 104.2 127.6 556.0 691.7 Equity index 174.0 131.5 111.0 132.4 26,143.9 25,094.5 5,170.8 3,530.9 4,719.6 5,266.7
Other Markets 605.8 368.1 408.4 453.3 17,746.3 16,305.5 2,535.3 2,924.6 3,327.8 3,227.8
Interest rate 540.5 334.0 366.2 401.1 12,454.5 10,645.5 1,588.2 2,127.0 2,254.5 2,066.6 Currency 27.7 22.2 19.7 21.6 2,283.0 3,023.7 605.2 506.9 631.8 607.2 Equity index 37.7 11.9 22.5 30.6 3,008.8 2,636.3 341.9 290.7 441.5 554.0
OptionsAll markets 51,038.9 38,380.6 43,758.2 48,274.1 702,106.8 665,796.3 133,594.6 124,634.6 138,257.2 133,957.4
Interest rate 44,281.7 33,978.8 38,920.1 42,030.7 547,629.2 526,633.0 107,514.7 106,274.2 115,502.0 106,300.2 Currency 132.7 129.3 103.9 108.2 2,140.5 2,781.8 444.7 411.2 468.7 518.6 Equity index 6,624.5 4,272.5 4,734.3 6,135.3 152,337.1 136,381.5 25,635.2 17,949.3 22,286.4 27,138.5
North America 28,024.2 19,676.8 20,153.3 22,560.4 414,892.0 323,330.1 61,140.7 47,785.5 57,315.0 56,384.7
Interest rate 25,084.1 17,788.9 18,237.6 20,140.7 363,599.0 275,452.6 51,135.6 41,462.5 50,809.0 49,124.1 Currency 57.1 45.0 43.0 45.1 621.8 898.5 161.4 151.4 143.9 141.7 Equity index 2,883.0 1,842.9 1,872.7 2,374.5 50,671.2 46,979.1 9,843.8 6,171.6 6,362.1 7,118.9
Europe 21,554.3 18,115.7 22,817.4 24,622.1 203,787.3 276,005.8 61,516.0 67,840.3 66,896.3 60,880.4
Interest rate 18,109.7 15,879.5 20,287.8 21,303.5 176,639.7 245,599.2 55,745.6 63,918.6 63,067.7 55,675.7 Currency 1.0 0.6 0.5 0.4 7.6 6.6 1.8 2.2 1.8 1.7 Equity index 3,443.6 2,235.6 2,529.2 3,318.2 27,140.0 30,400.0 5,768.6 3,919.5 3,826.8 5,203.1
Asia and Pacific 1,020.7 219.4 272.4 370.1 77,835.9 60,095.1 10,039.6 7,980.7 12,494.1 15,056.9
Interest rate 791.1 83.8 14.8 18.2 6,341.3 3,902.6 425.3 474.0 828.2 759.5 Currency – – – – – – – – – – Equity index 229.6 135.6 257.6 351.9 71,494.6 56,192.4 9,614.3 7,506.7 11,665.9 14,297.4
Other Markets 439.7 368.7 515.2 721.6 5,591.5 6,365.3 898.3 1,028.2 1,551.8 1,635.3
Interest rate 296.7 226.6 380.0 568.2 1,049.1 1,678.7 208.3 419.2 797.1 741.0 Currency 74.7 83.7 60.4 62.6 1,511.2 1,876.7 281.5 257.5 323.0 375.3 Equity index 68.3 58.5 74.8 90.7 3,031.2 2,810.0 408.4 351.5 431.7 519.1
Amounts outstanding Turnover
Table 23A: Derivative financial instruments traded on organised exchangesBy instrument and locationNotional principal in billions of US dollars
A 108 BIS Quarterly Review, December 2009

Instrument / location Dec 2007 Dec 2008 Jun 2009 Sep 2009 2007 2008 Q4 2008 Q1 2009 Q2 2009 Q3 2009
Futures
All markets 139.0 110.4 105.0 101.0 5,359.9 5,484.6 1,202.1 1,119.2 1,161.9 1,150.2
Interest rate 98.1 77.1 69.8 67.6 3,076.6 2,582.9 420.7 443.0 490.3 496.2 Currency 8.2 7.6 7.5 6.2 353.1 433.8 86.3 74.4 90.0 103.3 Equity index 32.7 25.7 27.7 27.2 1,930.2 2,467.9 695.1 601.8 581.6 550.6
North America 96.4 72.3 65.1 62.2 2,410.8 2,373.3 485.8 449.6 461.0 460.0
Interest rate 71.8 57.4 50.5 47.5 1,582.3 1,295.6 194.2 198.2 231.3 242.6 Currency 1.0 0.7 0.8 0.9 146.2 159.0 31.1 31.0 35.9 42.5 Equity index 23.6 14.1 13.8 13.8 682.2 918.6 260.5 220.4 193.8 174.9
Europe 23.3 20.4 19.2 19.8 1,866.1 2,032.3 441.8 413.8 419.8 410.4
Interest rate 11.7 9.3 9.2 9.9 1,100.9 982.8 172.5 175.9 189.1 190.5 Currency 5.7 5.4 3.4 3.1 110.1 164.3 28.9 21.1 19.2 22.3 Equity index 5.9 5.8 6.6 6.9 655.0 885.2 240.3 216.8 211.4 197.6
Asia and Pacific 7.8 5.9 6.5 6.4 666.8 692.5 193.7 165.6 185.7 188.1
Interest rate 4.9 3.0 3.1 3.0 150.1 114.1 18.6 20.6 23.4 24.4 Currency 0.5 0.2 0.8 1.0 5.4 7.0 2.2 2.5 11.1 13.7 Equity index 2.4 2.7 2.6 2.4 511.3 571.3 172.9 142.5 151.2 150.0
Other Markets 11.6 11.8 14.2 12.5 416.3 386.5 80.9 90.1 95.5 91.6
Interest rate 9.7 7.4 7.0 7.2 243.3 190.3 35.4 48.2 46.4 38.7 Currency 1.0 1.3 2.4 1.2 91.3 103.5 24.1 19.7 23.8 24.8 Equity index 0.8 3.1 4.8 4.1 81.8 92.7 21.4 22.2 25.3 28.1
Memorandum items:
Commodity contracts 21.0 20.1 30.8 32.8 1,263.4 1,560.3 417.1 390.8 414.0 511.5
US markets 15.7 15.7 25.1 25.7 482.1 559.5 118.6 132.4 140.5 138.5 Other markets 5.3 4.4 5.7 7.1 781.3 1,000.8 298.5 258.4 273.5 373.0
Options
All markets 130.6 130.0 146.5 160.2 4,525.3 4,851.6 1,275.9 1,100.0 1,216.8 1,221.9
Interest rate 48.2 35.3 42.8 46.4 663.3 617.7 123.8 131.7 141.7 127.4 Currency 3.4 2.8 1.9 2.3 46.4 59.8 10.3 9.2 10.4 11.2 Equity index 79.0 91.9 101.8 111.5 3,815.6 4,174.1 1,141.8 959.1 1,064.7 1,083.3
North America 42.9 33.1 36.4 39.1 735.8 706.3 155.2 127.5 134.5 130.2
Interest rate 25.9 15.6 17.7 17.6 418.5 326.7 56.6 52.5 62.1 55.7 Currency 1.5 0.9 0.5 0.4 7.2 12.3 2.2 1.9 1.5 1.2 Equity index 15.5 16.6 18.3 21.0 310.1 367.3 96.4 73.1 70.9 73.3
Europe 70.6 80.0 89.5 95.3 694.1 907.1 236.5 209.9 180.0 187.5
Interest rate 16.1 14.3 17.7 18.7 215.0 256.2 61.8 68.9 61.9 56.6 Currency 0.3 0.1 0.1 0.1 1.3 1.0 0.3 0.4 0.4 0.7 Equity index 54.2 65.6 71.8 76.5 477.8 649.9 174.4 140.5 117.7 130.2
Asia and Pacific 6.0 5.4 8.2 10.3 2,925.7 3,061.2 849.7 726.6 858.6 860.3
Interest rate 0.9 0.1 0.0 0.0 9.4 5.3 0.6 0.7 1.3 1.2 Currency – – – – – – – – – – Equity index 5.0 5.3 8.2 10.3 2,916.3 3,055.9 849.1 725.9 857.3 859.1
Other Markets 11.1 11.5 12.3 15.5 169.7 177.0 34.5 36.0 43.8 43.8
Interest rate 5.3 5.3 7.4 10.1 20.4 29.6 4.7 9.6 16.5 13.8 Currency 1.7 1.8 1.3 1.9 38.0 46.5 7.9 6.8 8.5 9.3 Equity index 4.2 4.4 3.6 3.6 111.3 101.0 21.9 19.5 18.7 20.7
Memorandum items:
Commodity contracts 17.7 19.5 19.3 21.0 132.0 154.4 32.9 32.0 32.1 34.8
US markets 16.5 18.5 18.0 19.5 120.3 142.0 30.4 27.1 27.8 30.4 Other markets 1.1 1.0 1.2 1.5 11.7 12.4 2.5 4.9 4.3 4.4
Single equity contracts 434.4 341.9 365.5 401.0 3,921.4 5,556.6 1,290.6 1,360.7 1,440.4 1,406.5
US markets 308.4 235.8 236.2 255.9 2,592.1 4,187.4 972.5 998.5 1,111.1 1,051.2 Other markets 126.0 106.1 129.4 145.1 1,329.3 1,369.2 318.1 362.2 329.3 355.3
Contracts outstanding Turnover
Table 23B: Derivative financial instruments traded on organised exchangesBy instrument and locationNumber of contracts in millions
BIS Quarterly Review, December 2009 A 109

A110 BIS Quarterly Review, December 2009
Notes to tables Data for the most recent period are provisional. Data on changes in stocks have been calculated by
converting the relevant stocks into their original currencies using end-of-period exchange rates and subsequently converting the changes in stocks into US dollar amounts using period average rates. Flow or turnover data have been calculated by converting flows and turnover in original currencies into US dollar amounts using period average exchange rates.
Tables 1–8 The data in Tables 1–8 (the BIS international locational banking statistics) cover banks’ unconsolidated gross international on-balance sheet assets and liabilities. These data are based on the residence of the reporting institution and therefore measure the activities of all banking offices residing in each reporting country. Such offices report exclusively on their own unconsolidated business, which thus includes international transactions with any of their own affiliates (for data on the BIS consolidated banking statistics, see Table 9). BIS reporting banks include banks residing in the G10 countries, Australia, Austria, the Bahamas, Bahrain, Bermuda, Brazil, the Cayman Islands, Chile, Chinese Taipei, Cyprus, Denmark, Finland, Greece, Guernsey, Hong Kong SAR, India, Ireland, Isle of Man, Jersey, Korea, Luxembourg, Macao SAR, Malaysia, Mexico, the Netherlands Antilles, Norway, Panama, Portugal, Singapore, Spain and Turkey. Detailed tables, including time-series data in CSV files, guidelines and information on breaks in series in the locational banking statistics, are available on the BIS website under http://www.bis.org/statistics/bankstats.htm .
Table 1 Local positions in foreign currency are available from all reporting banks except those in the United States. For Hong Kong SAR and Singapore, local positions include interbank business only (“Local” refers to positions vis-à-vis residents).
Tables 2–4 “Other” includes Bermuda, Chile, India, Macao SAR, Mexico, Netherlands Antilles and Panama.
Tables 3 A–B The data on external loans and deposits are derived from reporting as such or calculated by subtracting separately reported data on positions other than loans and deposits from total external assets and liabilities. The only exceptions are Bahrain, the Netherlands Antilles and Isle of Man, which do not provide this information separately. Their data on international loans and deposits therefore equal the data on external assets and liabilities shown in Tables 2 A–B.
Tables 5 The positions in domestic currency (item A) cover all reporting countries, except the Netherlands Antilles, Singapore and South Korea, while those in foreign currency (item B) only relate to reporting countries that provide a detailed currency breakdown. The foreign currency positions of countries (Hong Kong SAR, Macao SAR, Netherlands Antilles and Singapore) that do not supply sufficient currency detail are shown in the item “unallocated” (item C).
Tables 5 B Claims on non-banks include the positions of banks in the United States and their offshore branches vis-à-vis official monetary authorities.
Table 5 C Excludes, on the assets side, the positions of banks in the United States and their offshore branches, which are indistinguishably included under positions vis-à-vis non-banks.
Table 5 D The data cover all reporting banks, except those in the United States. For Hong Kong SAR and Singapore, local positions relate to interbank business only.
Table 6 A Positions vis-à-vis Switzerland and vis-à-vis Germany include those vis-à-vis the BIS and ECB respectively. The residual item for Africa & Middle East includes the positions of banks in the United States vis-à-vis regional OPEC countries (including Bahrain).The “Other” item for developed European countries comprises the Faeroe Islands, Greenland and San Marino, which have been merged together due to only partial reporting by reporting central banks. For reasons of confidentiality, positions vis-à-vis certain countries may be included under the residual or unallocated items.
Tables 7 A–B See notes to Tables 3 A–B. In the case of reporting country Singapore, the breakdowns of international loans and deposits by vis-à-vis country have been partly estimated.
Tables 8 A–B The data in principle cover reporting banks’ cross-border positions in all currencies plus local positions in foreign currency. Figures for Latin America include the Caribbean area. Positions vis-à-vis “related offices” cover cross-border positions only. In the case of banks in Canada, such positions are given for Canadian banks only. Claims on official monetary authorities of banks in the United States and their offshore branches are included under positions vis-à-vis non-banks.
Tables 9 The BIS consolidated international banking statistics are based mainly on the country of incorporation of the reporting institutions and measure the international lending activities of banks’ head offices in the reporting countries and all their offices at home and abroad, with positions between offices of the same bank being netted out. In addition, foreign banks in reporting countries are requested to supply information about their international lending activities on an unconsolidated basis. The reporting countries comprise the G10 countries plus Australia, Austria, Brazil, Chile, Chinese Taipei, Denmark, Finland, Greece, Hong Kong SAR, India, Ireland, Luxembourg, Mexico, Norway, Panama, Portugal, Singapore, Spain and Turkey.
The data in Tables 9 A–B cover BIS reporting banks’ worldwide consolidated contractual claims that are not adjusted for risk mitigants, such as guarantees and collateral. In addition, table 9A shows in column Q, as net risk transfers, aggregates on the reallocation of claims from the country of the immediate counterparty to that of the ultimate risk (ie a third-party guarantor or the head office of a legally dependent branch).

BIS Quarterly Review, December 2009 A111
The data in Tables 9 A cover both foreign and international claims, while 9 B -D covers foreign claims only. International claims are defined as BIS reporting banks’ cross-border claims in all currencies plus the local claims of their foreign affiliates in foreign currency. Foreign claims include in addition, reporting banks’ foreign affiliates local claims in local currency, as shown below.
Types of claims
A B C D
Cross-border claims
Local claims of foreign affiliates in foreign currency
Local claims of foreign affiliates in
local currency
Domestic claims in the
reporting country
International claims (A + B)
Foreign claims (A + B + C)
The shaded area indicates claims excluded from the consolidated banking statistics; bold italics indicate claims published within the consolidated banking statistics.
The data on individual nationality groups of reporting banks may differ from data published in national sources because the data presented relate to consolidated claims of domestically owned banks only, while published national sources may in certain cases cover the unconsolidated claims of local subsidiaries and branches of foreign banks as well. Item “Other” for developed European countries comprises the Faeroe Islands, Greenland and San Marino. Denmark reports its data on an unconsolidated basis, Austria and Portugal report on a partially consolidated basis.
Detailed information on breaks in series in the consolidated banking statistics are available on the BIS website under http://www.bis.org/publ/breakstables.pdf. Data of Brazil is rolled forward from the first quarter of 2009.
Table 9 A This table covers the data on consolidated foreign claims of banks in 30 BIS reporting countries vis-à-vis individual countries. A breakdown of international claims by maturity and sector is also provided. The column J “Banks with head offices outside the country of residence” and column K “undisbursed credit commitments and backup facilities” have been discontinued upon introduction of claims on ultimate risk basis since Q4 2004.
Columns E and I which related to “unallocated” maturities and sectors have been removed from the table. Respective data can be calculated by difference.
Column Q on net risk transfers refers to the amounts outstanding of contractual claims which have been reallocated from the country of the immediate counterparty to that of the ultimate borrower as provided by 26 of 30 reporting countries. In principle, the country of the ultimate counterparty (or of ultimate risk) is considered to be the country where the guarantor of a financial claim resides or where the head office of a legally dependent branch is located. However, this definition is not yet consistently applied by all countries. In some cases the data exclude guarantees, while in others they also include claims on legally independent subsidiaries, without any explicit guarantee being given.
Table 9 B This table provides the data on consolidated foreign claims vis-à-vis individual countries by nationality of banks in 30 BIS reporting countries. The grand total in the first column of the table also includes foreign claims of domestically owned banks in Brazil, Chile, Chinese Taipei, Denmark, Finland, Greece, Hong Kong SAR, India, Luxembourg, Mexico, Norway, Panama, Singapore, and Turkey, which are not shown separately in this table, as well as those of local subsidiaries and branches of foreign banks. European banks refer to domestically owned banks of European countries that report claims on an immediate borrower basis (i.e. Austria, Belgium, Denmark, Finland, France, Germany, Greece, Ireland, Italy, Luxembourg, the Netherlands, Norway, Portugal, Spain, Sweden, Switzerland, Turkey and the United Kingdom).
Table 9 C As of current quarter, this table provides a sectoral breakdown of consolidated foreign claims of banks in 24 BIS reporting countries vis-à-vis individual countries on an ultimate risk basis. The grand total in the first column of the table comprises foreign claims of domestically owned banks in Austria, Australia, Belgium, Canada, Chile, Chinese Taipei, Finland, France, Germany, Greece, India, Ireland, Italy, Japan, the Netherlands, Norway, Portugal, Singapore, Spain, Sweden, Switzerland, Turkey, the United Kingdom and the United States. The difference between total and sector components represents unallocated amounts (I) and the difference between total and cross-border claims represents local claims of foreign affiliates in all currencies(U). Data on additional contingent exposures through derivatives (positive market value only), guarantees extended and credit commitments are also shown.
Table 9 D This table provides (as of current quarter) a breakdown of consolidated foreign claims vis-à-vis individual countries on an ultimate risk basis by nationality of reporting banks (in 24 reporting countries). The grand total in the first column of the table also includes foreign claims of domestically owned banks in Austria, Chile, Chinese Taipei, Finland, Greece, India, Ireland, Norway, Singapore, Spain, Sweden and Turkey. European banks refer to domestically owned banks of European countries that report claims on an ultimate risk basis

A112 BIS Quarterly Review, December 2009
(i.e. Austria, Belgium, Finland, France, Germany, Greece, Ireland, Italy, the Netherlands, Norway, Portugal, Spain, Sweden, Switzerland, Turkey and the United Kingdom).
Table 10 The data cover announcements of international syndicated credit facilities that are granted by syndicates consisting of at least two financial institutions (thus excluding bilateral deals) acting as lenders; the nationality of at least one of the syndicate banks must differ from that of the borrower. Facilities taking the form of amendments or derivative-like instruments such as currency swap facilities, interest rate swap facilities, etc. were excluded. Furthermore, only signed facilities with a maturity of at least three months are included. Finally, there are no restrictions on the purposes to which the proceeds of the facilities might be directed and the data therefore also include refinancing facilities. Sources: Dealogic Loan Analytics; BIS.
Tables 11–18 The methodology used to compile the securities statistics and a description of the coverage can be found on pages 13 to 17 of the Guide to the international financial statistics at http://www.bis.org/publ/bispap14.htm. In the sectoral breakdown, “governments” comprise central governments, other governments and central banks. “Financial institutions” comprise commercial banks and other financial institutions. The international debt securities data include “repackaged securities”, for example the new global issues of Argentina, resulting from the April 2005 exchange offer. “Repackaged securities” which are exclusively domestically targeted are allocated to the domestic debt securities database, such as the Argentine “bonos de la reestructuracion – DTO. 1735/04”. For recent changes in the coverage of domestic debt securities data see http://www.bis.org/statistics/coverage.htm
Tables 12 B, 12 C, 12 D, 13 A, 13 B, 16 A, 16 B and 17 B present data based on the sector of the borrower itself and not on the sector of the parent company of the borrower or any guarantor. In Tables 13 A, 14 A and 15 A the data cover commercial paper and notes with an original maturity of up to one year. Gross issuance excludes issues redeemed in the same quarter. In Tables 16 A, 16 B, 17 A and in the memorandum items of Tables 13 A and 13 B, the domestic statistics cover 49 OECD and emerging market countries. The complete list of countries can be seen at http://www.bis.org/statistics/qcsv/anx16a.csv.
The domestic data for Argentina, Peru and Venezuela include local issues in foreign currency. The Chilean domestic debt securities data for financial institutions include “bonos y letras hipotecarias en circulación”. Indian public sector domestic securities exclude those of government-guaranteed bodies. The Brazilian private sector and the Indian corporate sector issues only cover short-term paper, while no stocks data on bonds are available. The Colombian domestic data include only the public non-financial sector. The figures for Indonesia also include government issues for restructuring purposes. For the Netherlands, the source for data on domestic medium-term notes (MTNs) is different from that for data on domestic bonds, and there may therefore be some overlaps. Furthermore, data on domestic commercial paper (CP) include foreign issues in Dutch guilders. Issues of CDs by the Netherlands Bank are included under private short-term notes. French data on short-term notes also include foreign issues. For New Zealand, Poland and Russia, the data on the non-government sector are missing. The partly estimated data for the corporate sector of Singapore relate to issues in Singapore dollar only. UK data include domestically targeted issues in foreign currency by the Bank of England, commercial paper and medium-term notes issued by the private sector are missing. Data for US short-term notes include CDs plus other time deposits. The US data on domestic CP include foreign issues. The data for the financial and non-financial corporate sector of Singapore relate to end-December 2008. The data for Belgium and the government sector of Ireland relate to end-March 2009. The latest available data on amounts outstanding have been carried forward for the periods thereafter.
In Tables 17 A and 17 B, data on remaining maturities of up to one year cover money market instruments and bonds and notes which are due for repayment within one year. For a few countries, no or only partial data are available on long-term domestic debt securities which are due for final repayment within one year.
Tables 19–22 The data are derived from the BIS regular OTC derivatives statistics and cover the notional amounts and gross market values outstanding of the worldwide consolidated OTC derivatives exposure of major banks and dealers in the G10 countries. Figures are adjusted for double-counting and cover foreign exchange, interest rate (single currency contracts only), equity, commodity and credit derivatives (CDS). The notional amount, which is generally used as a reference to calculate cash flows under individual contracts, provides a comparison of market size between related cash and derivatives markets. Gross market value is defined as the sum (in absolute terms) of the positive market value of all reporters’ contracts and the negative market value of their contracts with non-reporting counterparties. It also measures the replacement cost of all outstanding contracts had they been settled in the reporting period.
Table 19 As of June 2007, item “unallocated” covers estimated positions of non-regular reporters based on the most recent Triennial Central Bank Survey 2007. For previous periods, the estimation is based on the Triennial Bank Survey 2004. “Gross credit exposure” includes gross market values after taking into account legally enforceable bilateral netting agreements. This item excludes CDS for all countries except for the US.
Table 20 B Counting both currency sides of every foreign exchange transaction means that the currency breakdown sums to 200% of the aggregate.
Tables 20 C, 21 C The maturity brackets refer to residual maturities. and 22 C Tables 23 A–B Notional principal is calculated as the number of contracts multiplied by the face value of the derivatives
contract, converted into US dollars. In the case of equity index derivatives, the face value is calculated as the product of the contract’s multiplier and the value of the underlying index. The notional amounts and the number of contracts outstanding corresponding to the equity index and single equity options contracts traded in North America were revised due to significant corrections by the data provider. Sources: FOWTRADEdata; Futures Industry Association; various futures and options exchanges; BIS.
Related Documents


