30 JUNE 2019 Platinum International Fund Platinum Unhedged Fund Platinum Asia Fund Platinum European Fund Platinum Japan Fund Platinum International Brands Fund Platinum International Health Care Fund Platinum International Technology Fund Quarterly Report

Welcome message from author
This document is posted to help you gain knowledge. Please leave a comment to let me know what you think about it! Share it to your friends and learn new things together.
Transcript

30 JUNE
2019
Platinum International FundPlatinum Unhedged Fund
Platinum Asia FundPlatinum European Fund
Platinum Japan FundPlatinum International Brands Fund
Platinum International Health Care FundPlatinum International Technology Fund
Quarterly Report


Contents
Performance Returns 2
In Brief 3
Macro Overview 5
by Andrew Clifford, Chief Investment Officer
Fund UpdatesPlatinum International Fund 9
Platinum Unhedged Fund 12
Platinum Asia Fund 15
Platinum European Fund 19
Platinum Japan Fund 22
Platinum International Brands Fund 26
Platinum International Health Care Fund 29
Platinum International Technology Fund 32
Glossary 35
Habitat for Humanity 36
The Platinum Trust quarterly report is available on our website from approximately the 15th of the month following quarter end. Visit www.platinum.com.au/Investing-with-Us/Investment-Updates
1THE PLATINUM TRUST QUARTERLY REPORT 30 JUNE 2019

Performance Returns to 30 June 2019
Platinum International Fund vs. MSCI All Country World Net Index (A$)To 30 June 2019
0%
5%
10%
15%
One year Three years compound p.a. Five years compound p.a. Since inception (30.4.1995)compound p.a.
Fund returns are net of fees and costs, are pre-tax, and assume the reinvestment of distributions. Historical performance is not a reliable indicator of future performance. Source: Platinum Investment Management Limited for fund returns and FactSet for MSCI index returns. See note 1, page 40.
MSCI All Country World Net Index (A$)Platinum International Fund (C Class)
FUND PORTFOLIO VALUE(C CLASS – STANDARD FEE OPTION) (POST 30 JUNE CASH(P CLASS – PERFORMANCE FEE OPTION) DISTRIBUTION A$ MIL)
QUARTER 1 YEAR 2 YEARSCOMPOUND
P.A.
3 YEARSCOMPOUND
P.A.
5 YEARSCOMPOUND
P.A.
SINCEINCEPTION
COMPOUND P.A.
INCEPTION DATE
Platinum International Fund (C Class) 9,828.5 1.6% 0.7% 7.3% 11.8% 9.5% 12.3% 30 Apr 1995
Platinum International Fund (P Class) 10.6 1.6% 1.0% - - - 6.5% 3 Jul 2017
MSCI All Country World Net Index (A$) 4.9% 11.3% 13.1% 13.9% 12.6% 7.0% 30 Apr 1995
Platinum Unhedged Fund (C Class) 294.8 0.7% -1.1% 8.3% 15.6% 10.7% 11.0% 28 Jan 2005
Platinum Unhedged Fund (P Class) 2.2 0.8% -0.8% - - - 7.8% 3 Jul 2017
MSCI All Country World Net Index (A$) 4.9% 11.3% 13.1% 13.9% 12.6% 7.5% 28 Jan 2005
Platinum Asia Fund (C Class) 4,394.2 0.2% 0.4% 8.2% 11.9% 10.3% 14.2% 4 Mar 2003
Platinum Asia Fund (P Class) 6.6 0.3% 0.7% - - - 7.6% 3 Jul 2017
MSCI All Country Asia ex Japan Net Index (A$) 0.6% 4.8% 9.3% 13.7% 11.2% 10.2% 4 Mar 2003
Platinum European Fund (C Class) 884.8 6.6% 1.5% 8.6% 14.9% 10.4% 11.6% 30 Jun 1998
Platinum European Fund (P Class) 4.8 6.7% 1.8% - - - 7.7% 3 Jul 2017
MSCI All Country Europe Net Index (A$) 6.0% 7.8% 8.5% 11.4% 7.4% 3.2% 30 Jun 1998
Platinum Japan Fund (C Class) 750.2 5.8% 3.1% 7.1% 12.5% 14.0% 14.2% 30 Jun 1998
Platinum Japan Fund (P Class) 5.3 5.9% 3.3% - - - 7.1% 3 Jul 2017
MSCI Japan Net Index (A$) 2.3% 0.9% 7.6% 10.2% 10.9% 2.8% 30 Jun 1998
Platinum International Brands Fund (C Class) 669.9 -2.3% -2.1% 7.5% 13.8% 10.5% 12.3% 18 May 2000
Platinum International Brands Fund (P Class) 2.2 -2.3% -1.8% - - - 7.4% 3 Jul 2017
MSCI All Country World Net Index (A$) 4.9% 11.3% 13.1% 13.9% 12.6% 3.4% 18 May 2000
Platinum International Health Care Fund (C Class) 251.5 -2.7% 4.7% 11.2% 13.5% 14.1% 9.7% 10 Nov 2003
Platinum International Health Care Fund (P Class) 3.9 -2.6% 4.9% - - - 10.6% 3 Jul 2017
MSCI All Country World Health Care Net Index (A$) 2.5% 15.4% 12.3% 10.3% 13.7% 9.2% 10 Nov 2003
Platinum International Technology Fund (C Class) 108.6 2.6% 4.7% 8.5% 13.7% 10.8% 9.3% 18 May 2000
Platinum International Technology Fund (P Class) 1.6 2.7% 4.9% - - - 8.9% 3 Jul 2017
MSCI All Country World IT Net Index (A$) 6.5% 15.7% 23.1% 25.8% 22.5% 1.6% 18 May 2000
Fund returns are net of accrued fees and costs, are pre-tax, and assume the reinvestment of distributions. Historical performance is not a reliable indicator of future performance. Source: Platinum Investment Management Limited for Fund returns and FactSet for MSCI index returns. See note 1, page 40.
2 PLATINUM ASSET MANAGEMENT

In Brief
Platinum International Fund• The collapse of US-China trade negotiations, restriction of sales of key US technologies to Huawei, and growing expectations
of interest rate cuts were the key drivers of equity markets over the quarter. Investors sought safe havens in perceived low-risk equities, such as real estate, utilities, infrastructure, and consumer staples, as well as growth stocks, considered immune to the trade issues. Cyclical companies and those facing specific exposure to trade issues generally weakened.
• While the Fund lagged the market over the last year, Ping An Insurance, ICICI Bank, Axis Bank, Weichai Power and Anta Sports provided strong contributions. Offsetting these returns were declines in our energy-related investments, including Transocean, Seven Generations and TechnipFMC, as well as commodity producers Glencore, First Quantum and MMG.
• The Fund's net exposure was reduced from 73% to 62% over the quarter, reflecting a significant increase in short positions (-10% to -22%). The downside risk to markets of a significant escalation in tariffs was, in our view, significant and the additional index short positions reduced market exposure.
• We added to existing holdings that offered good value, including semiconductor and related companies, Micron, Skyworks, Microchip Technology and Sumco. We also added to auto and related businesses such as BMW and Valeo. New positions were made in Ryanair, Owens Corning and BRF (Brazilian producer of pork and poultry). Siemens and Reliance were exited.
• The valuations of the Fund’s holdings compare favourably with market averages and our quantitative indicators lead us to believe that our portfolio is both more profitable and faster growing than our global universe of stocks. This gives us optimism about the Fund’s returns over the medium to long term. However, significant risks remain in the macroeconomic and market environment in the short term. Valuations in the crowded sectors of equity markets, the safe havens and the high growth stocks, are also cause for caution on broader markets.
Platinum Unhedged Fund• While the Fund has delivered a sound annualised return over the past three years, performance was weaker over the past
year, reflecting our holdings in oil and energy, financials and Chinese internet advertising.
• The growing valuation divergence between stocks that investors perceive to offer high growth or safety versus everything else is a very strong driver of market performance today. We don’t think it’s a sensible strategy to pile into growth and safety stocks at ever-higher prices. Instead, the Fund is buying into value on offer, prioritising companies that have clear long-term growth drivers, such as semiconductors (Skyworks, Micron), China (Momo, social media and dating platform) and steady growth at a reasonable price (Booking Holdings).
• The portfolio has a vast number of holdings on extremely attractive starting valuations, and while this doesn't on its own predict when or if these businesses will be rewarded by the market, history has shown us that as long as we are right about the earnings potential of these businesses, good returns should be earnt over the long run.
Platinum Asia Fund• After a strong start to the year, it was a lacklustre quarter for Asia markets. The Fund has however, returned 10.3% for the
year-to-date. Positive contributions over the quarter were largely Asian companies with strong balance sheets, including Meituan Dianping and Ayala Land. Stocks that detracted were mainly US-listed Chinese stocks (ADRs).
• We reduced a number of strong performing stocks early in the quarter, which proved beneficial. We then took advantage of share price weakness to add to existing positions in high quality companies, which were trading on exceptionally low valuations, such as Tencent, Samsung Electronics and SK Hynix. We also initiated new positions in premier Hong Kong real estate companies, Sun Hung Kai Properties, New World Development, and Wheelock and Company.
• A trade truce between the US and China in late June and a reprieve for Huawei has reduced the prospect of a stalling in economic activities in the region. A shift in interest rate policy stances by central banks should be positive for the region’s asset markets and currency value. Given the likelihood of improving economic prospects and attractive valuations, the Fund plans to continue to invest in quality companies with resilient characteristics.
3THE PLATINUM TRUST QUARTERLY REPORT 30 JUNE 2019

Platinum European Fund• Lacklustre growth and lower interest rates spurred further crowding in the so-called ‘bond proxies’ or defensive growth
stocks over the quarter, while cyclical businesses remained deeply out-of-favour.
• Our low exposure to defensive growth stocks and high exposure to cyclical businesses was the primary detractor from year-to-date performance. Our best-performing stocks were Hypoport and Qiwi, while cyclicals, including Glencore and Saras (gas and diesel), detracted.
• While the market narrative on Europe is resoundingly negative, domestic-facing sectors of the economy remain in good shape. Our portfolio continues to be skewed to cyclical businesses, while they may continue to underperform in an environment of high uncertainty, weak growth and low interest rates, the valuations of these stocks are now so low that even with a significant deterioration in commercial circumstances, we expect to still make a respectable return on our investment.
Platinum Japan Fund• The Fund delivered a strong performance over the quarter. Stocks that provided a positive contribution included Nintendo
(console games, +25%), Rakuten (e-commerce, +22%), KDDI (telecommunications, +15%), DeNa (internet, +24%) and Lixil (housing and bathroom products, +15%).
• While sentiment on the Japanese stock market is weak, current valuations are not far from prior market troughs. The combination of two decades of compounded corporate growth, internal reorganisation and disruptive advances, together with the clearly improved corporate governance environment make for a completely different outlook compared with prior decades.
• The market environment is presenting many opportunities and the portfolio is gradually shifting to a mix of high quality companies at multi-decade low valuations and reasonably priced growth companies.
Platinum International Brands Fund• Weakness in our Chinese consumer stocks and US retailers exposed to increased tariffs on their purchases of Chinese goods
were the main detractors from the Fund’s quarterly performance.
• Key positive contributors included Facebook, which gained on its announcement to move into electronic payments with its ‘Libra’ cryptocurrency. Leading Russian lender Sberbank Russia and several Chinese stocks which bucked the overall China weakness, also delivered solid performance.
• We remain conservatively positioned. In an increasingly divided stock environment where perceived certainty and/or growth are very highly valued, and uncertainty regarding the future is heavily penalised, we see little attraction in paying more than 30x earnings for market-favourite consumer stocks that only offer stable or low-growth profits. Instead, we prefer to continue our hunt for out-of-favour companies that can surprise on the upside.
Platinum International Health Care Fund• During the quarter, investors continued to favour companies in the medical technology (medtech) and tool sector, and
remain excited about new bio technology (biotech) IPOs in the US and China.
• Quanterix (+133%), NanoString (+122%) and Roche (+28%) provided a strong contribution to annual performance, while some of the short positions and biotech stocks detracted. During the quarter, we added to a number of our holdings and divested biotechs that had setbacks and have to re-adjust their R&D activities.
• Innovation in the sector is immense, but a firm valuation framework is required to ensure we balance the risk that is inherent in drug development. Tool companies offer a great way of gaining exposure to many different innovations, while clinical research organisations should also find new opportunities in emerging markets.
Platinum International Technology Fund• The Fund returned 4.7% over the financial year. Key positive contributors were PayPal, Xilinx and Twilio, with their share
prices appreciating materially and positions subsequently trimmed. Other contributors were Constellation Software, Oracle, Cisco, Schibsted and Microsoft. Key detractors were Bitauto, Stamps, SINA, Nielsen and Nissha.
• Pockets of the technology industry remain cheap, yet other areas have captured the market’s imagination and are trading at full valuations. We have largely avoided the hottest areas of the market, where we feel little margin of safety is being priced in, however we continue to find select opportunities, which we believe should yield positive results.
4 PLATINUM ASSET MANAGEMENT
Macro Overviewby Andrew Clifford, Chief Investment Officer
Trade war dominates, distracts and detracts
The escalation of protectionist measures by the US government can only detract from economic prospects for the US and the rest of the world. The real question, however, is how significant will the collateral damage be and how readily can it be overcome by other policy measures? In spite of an agreement reached between US President Donald Trump and Chinese President Xi Jinping at the June G20 meeting, the uncertainty created by the trade dispute is likely to continue to weigh on investment decisions the world over.
The events of the last 18 months have created a chaotic environment for any business directly or indirectly involved in world trade. The US government first imposed China-specific tariffs of 25% on US$50 billion of imports in July and August last year. In September, the US imposed 10% tariffs on a further US$200 billion of imports from China, with a threat to escalate these to 25% in January 2019. Then in December, at the G20 meeting in Buenos Aires, the two governments reached an agreement to defer the January tariff increase as they worked towards a resolution.
When trade negotiations broke down in early May this year, the US moved swiftly to increase tariffs to 25% on the US$200 billion of imports from China, and threatened to apply 25% tariffs to an additional US$300 billion of imports, which was essentially the balance of the US’s imports from China. Then at the end of June, at another G20 meeting, there was yet another agreement to negotiate and defer the next round of tariffs.
The US’s trade war with China is only part of the story. The Trump government first imposed tariffs on imports of all solar panels and washing machines in January 2018. Tariffs on steel and aluminium imports (with only a handful of countries exempted) followed shortly after in March 2018. While beneficial for US producers of these goods, the tariffs were detrimental to US manufacturers, as steel and aluminium are essential inputs to their business, and they often compete globally against companies without such imposts. There are also the ongoing threats of tariffs on European auto producers. Closer to the US borders, Canada and Mexico needed to renegotiate the North American Free Trade Agreement (New NAFTA) and on signing, the US threatened to renege on the deal with Mexico over issues
relating to immigration. Most recently, the US government placed restrictions on the sale of US technology to Huawei, the world’s largest producer of telecom and networking equipment. While theoretically based on national security issues, the decision now appears to be on hold post the June G20 meeting.
Implications for business investment
On face value, the one clear message to US businesses is they need to reduce their dependency on China as a source of supply, and indeed many companies are considering this. In theory, it sounds like a simple decision, but in reality, there are numerous challenges. These include, readily finding the quantity of labour with the requisite flexibility, as well as securing the full supply chain of services, such as design, packaging, logistics and financing, that are very well developed in China1. Submissions by US businesses to the recent public hearings on the proposed 25% tariffs on the remaining US$300 billion of China imports, highlight these challenges, with many simply seeing no alternatives to China for acquiring critical inputs to their business. The most likely pathway would be to pass on the tariffs to customers via higher prices with the potential to cause substantial damage to their business and a significant loss of revenues.
Nevertheless, some businesses will pursue alternative supply arrangements for their manufactured goods, which is a risk if a trade agreement is reached with China down the track, as they may be committed to less-than-ideal arrangements. This risk is clearly highlighted by threats to place tariffs on imports from Mexico if they don’t meet the US’s immigrations demands. Until this point, Mexico probably ranked as the next best place to source manufactured goods after China. In such an environment of so much uncertainty, it seems highly likely that companies of all sizes, both in the US and elsewhere, will defer investment where possible until the trade issues have been resolved.
1 See our reports, Observations from a Recent Trip to China, 1 May 2017, https://www.platinum.com.au/Insights-Tools/The-Journal/observations-from-a-recent-trip-to-china and Macro Overview, September 2018, https://www.platinum.com.au/PlatinumSite/media/Reports/ptqtr_0918.pdf
5THE PLATINUM TRUST QUARTERLY REPORT 30 JUNE 2019

The decision to place Huawei on the US “Entity List” in May, which effectively restricts the sale of American-made parts and components to Huawei, creates another more specific area of uncertainty. It is not clear to what extent the bans, will prevent Huawei from manufacturing its product lines, but its inability to access certain key components from US suppliers is likely to dramatically curtail its business. While telecommunication network operators could simply replace the Huawei product with a Samsung, Ericsson, Cisco, or Nokia product, in most cases the networks will need to be re-engineered so they are compatible, which may mean subsequent delays to other investments already in the pipeline.
In addition to the recent ban, legislation passed in the US in 2018 restricted the purchase of Huawei equipment by any entity accessing government funding, with a two-year deadline to remove Huawei equipment from expenditures. In early June this year, the Wall Street Journal reported that the White House’s Acting US Budget Chief was looking to delay the deadline by a further two years due to difficulties in sourcing alternatives to Huawei equipment2. Even where simple fixes are available, the sheer size of Huawei will limit competitors’ ability to fill the gap quickly. As a result of the Huawei bans, investment in communication networks is expected to be on hold as operators look for alternatives. The Huawei bans are however, likely to have a much bigger impact on the broader economy. For every dollar spent on Huawei equipment, there are multiples of dollars spent on the equipment of other vendors and associated services.
The agreement reached between the US and China at the most recent G20 meeting to delay the next round of tariff increases and place a hold on the Huawei ban while further negotiations take place, is undeniably good news. However, it hardly provides the certainty businesses need to make longer-term investment decisions. Ultimately, negative consequences for investment spending and economic growth in the US is to be expected. The US significantly increased tariffs as recently as May this year, which effectively acts as a tax on the US economy, and as such, will weigh on growth. These disruptions come at a time when the US manufacturing sector is already showing signs of weakness as evidenced by a leading survey of manufacturers, the Purchasing Managers’ Index (PMI)3, which fell to a three-year low of 52 in June 2019, well down from 60 in August last year (see Fig. 1).
2 Source: “Acting US Budget Chief Seeks Reprieve on Huawei Ban”, The Wall Street Journal, 10 June 2019
3 The PMI is a good indicator of the economic health of the manufacturing sector, a reading above 50 implies an expansion in activity relative to the previous month and below 50 implies a contraction. Refer to the Glossary, page 40 for a more detailed explanation of PMIs.
Monetary and fiscal measures could play a role
There are other variables at play though that could potentially offset the impact of the trade deliberations. Most notably, the US Federal Reserve and the European Central Bank have both backed away from tightening monetary policy this year. Markets are already pricing in a 70% probability of two to three interest rate cuts in the US this year. Governments are also likely to be more inclined to use fiscal policy via implementing tax cuts and/or increased spending, to encourage growth in the months ahead. These measures could potentially be enough to counter the negative consequences of the US trade policies.
In China, the economy is stabilising after a period of very tight monetary conditions in the first half of 2018, which were a result of the country’s financial reforms. As discussed in past quarterly reports4, interest rates have fallen sharply in China over the past 18 months, signifying easier monetary conditions, and the government’s fiscal stimulus is estimated at 3% of its output (i.e. GDP). While the economy has not responded with the same vigour as it has in past stimulus cycles, this reflects the impact of the trade situation, which has dampened both business and consumer confidence. If required, the Chinese government has the financial resources to add further stimulus to the financial system. As we learned in 2018, at the margin, China is at least as important, if not more so, than the US, in determining economic prospects for the rest of the world, reflecting its size and current growth rate. An optimistic tilt at the current situation is that the Chinese economy has performed well given the set of conditions that it has faced over the last 18 months. Even mildly stronger performance from the world’s second largest economy is likely to improve economic conditions across much of the world.
4 https://www.platinum.com.au/PlatinumSite/media/Reports/ptqtr_0319.pdf
https://www.platinum.com.au/PlatinumSite/media/Reports/ptqtr_1218.pdf
40
45
50
55
60
65
2009 2010 2011 2012 2013 2014 2015 2016 2017 2018
>50 = expansion
<50 = contraction
Fig. 1: ISM Manufacturing Purchasing Managers’ Index - United States
Source: FactSet
6 PLATINUM ASSET MANAGEMENT
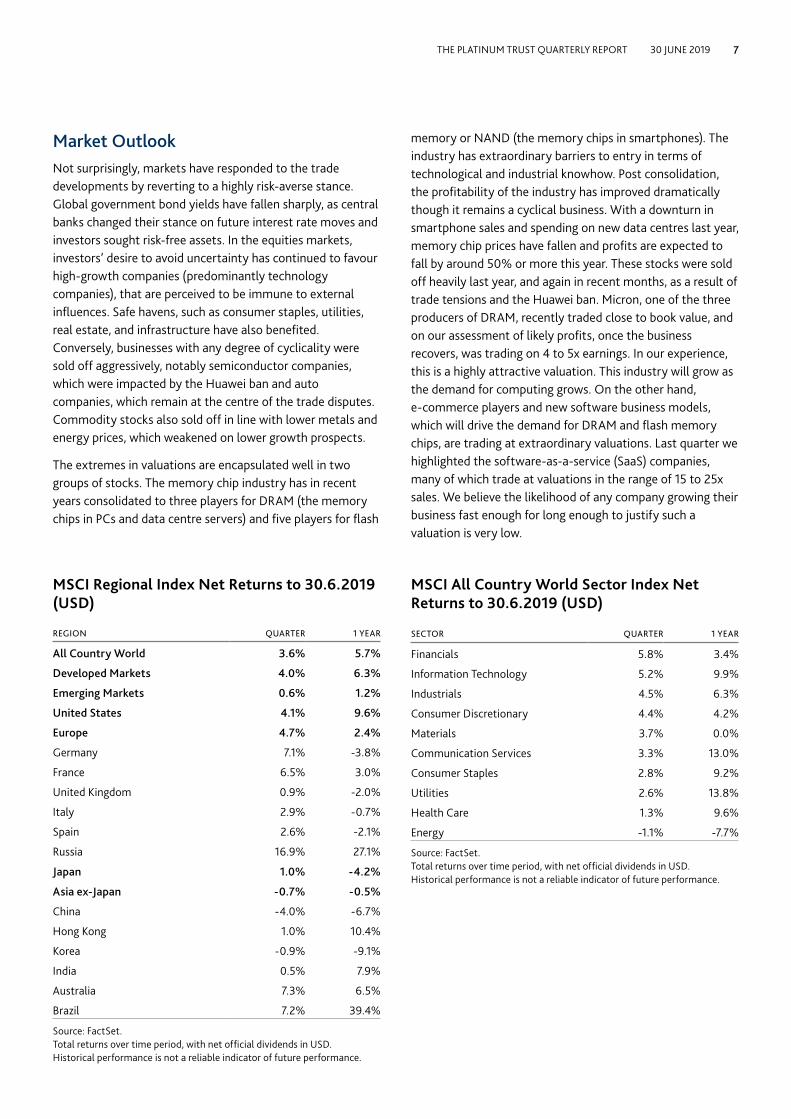
Market OutlookNot surprisingly, markets have responded to the trade developments by reverting to a highly risk-averse stance. Global government bond yields have fallen sharply, as central banks changed their stance on future interest rate moves and investors sought risk-free assets. In the equities markets, investors’ desire to avoid uncertainty has continued to favour high-growth companies (predominantly technology companies), that are perceived to be immune to external influences. Safe havens, such as consumer staples, utilities, real estate, and infrastructure have also benefited. Conversely, businesses with any degree of cyclicality were sold off aggressively, notably semiconductor companies, which were impacted by the Huawei ban and auto companies, which remain at the centre of the trade disputes. Commodity stocks also sold off in line with lower metals and energy prices, which weakened on lower growth prospects.
The extremes in valuations are encapsulated well in two groups of stocks. The memory chip industry has in recent years consolidated to three players for DRAM (the memory chips in PCs and data centre servers) and five players for flash
memory or NAND (the memory chips in smartphones). The industry has extraordinary barriers to entry in terms of technological and industrial knowhow. Post consolidation, the profitability of the industry has improved dramatically though it remains a cyclical business. With a downturn in smartphone sales and spending on new data centres last year, memory chip prices have fallen and profits are expected to fall by around 50% or more this year. These stocks were sold off heavily last year, and again in recent months, as a result of trade tensions and the Huawei ban. Micron, one of the three producers of DRAM, recently traded close to book value, and on our assessment of likely profits, once the business recovers, was trading on 4 to 5x earnings. In our experience, this is a highly attractive valuation. This industry will grow as the demand for computing grows. On the other hand, e-commerce players and new software business models, which will drive the demand for DRAM and flash memory chips, are trading at extraordinary valuations. Last quarter we highlighted the software-as-a-service (SaaS) companies, many of which trade at valuations in the range of 15 to 25x sales. We believe the likelihood of any company growing their business fast enough for long enough to justify such a valuation is very low.
MSCI Regional Index Net Returns to 30.6.2019 (USD)
REGION QUARTER 1 YEAR
All Country World 3.6% 5.7%
Developed Markets 4.0% 6.3%
Emerging Markets 0.6% 1.2%
United States 4.1% 9.6%
Europe 4.7% 2.4%
Germany 7.1% -3.8%
France 6.5% 3.0%
United Kingdom 0.9% -2.0%
Italy 2.9% -0.7%
Spain 2.6% -2.1%
Russia 16.9% 27.1%
Japan 1.0% -4.2%
Asia ex-Japan -0.7% -0.5%
China -4.0% -6.7%
Hong Kong 1.0% 10.4%
Korea -0.9% -9.1%
India 0.5% 7.9%
Australia 7.3% 6.5%
Brazil 7.2% 39.4%
Source: FactSet.Total returns over time period, with net official dividends in USD.Historical performance is not a reliable indicator of future performance.
MSCI All Country World Sector Index Net Returns to 30.6.2019 (USD)
SECTOR QUARTER 1 YEAR
Financials 5.8% 3.4%
Information Technology 5.2% 9.9%
Industrials 4.5% 6.3%
Consumer Discretionary 4.4% 4.2%
Materials 3.7% 0.0%
Communication Services 3.3% 13.0%
Consumer Staples 2.8% 9.2%
Utilities 2.6% 13.8%
Health Care 1.3% 9.6%
Energy -1.1% -7.7%
Source: FactSet.Total returns over time period, with net official dividends in USD.Historical performance is not a reliable indicator of future performance.
7THE PLATINUM TRUST QUARTERLY REPORT 30 JUNE 2019

The contrasting stock market treatment of these two groups of companies is part of a longer-term market phenomenon of growth stocks outperforming value stocks. While we would usually avoid referring to this growth and value categorisation, it helps to highlight the dynamic of investors crowding into growth stocks and avoiding companies with any degree of cyclicality.
Figure 2 shows the performance of US growth stocks over US value stocks in the S&P 500 Index. The descending pattern in the chart over the last 12 years reflects the outperformance of growth over value, with growth stocks rising by far more than value stocks relentlessly since 2007. We would simply note that the last time we were at current levels was in 1999-2000. At this time, tech stock, Cisco Systems (networking equipment) traded at 190x earnings and Diageo (alcoholic beverages) traded on 12x earnings. Cisco’s stock price subsequently fell 85% from its record high in March 2000, and today, remains 30% below its 2000 highs. Meanwhile, Diageo’s stock price subsequently increased seven fold.5
In summary, there are significant parts of the global equity market that are trading at very high, in some cases even exorbitant, valuations. We can’t be bearish enough on these particular companies. It is worth noting that the Nasdaq Stock Market in the US (home of many of the highly valued growth stocks, notably high-tech) has historically had a high correlation with US economic growth. On the other hand, there are groups of stocks globally that trade on attractive valuations versus historical averages. Most of these are cyclical businesses, and although the global economic outlook is problematic, as we outlined earlier in this commentary, our assessment is that their stock prices already more than reflect a recessionary environment.
5 Source: FactSet
40
60
80
100
120
1995 2000 2005 2010 2015
Performance of S&P Value Stocks vs. S&P Growth StocksIndex = 100 as at 30 June 1995
Source: Bloomberg
Fig. 2: Value vs. Growth – Back to 1999-2000 Levels
8 PLATINUM ASSET MANAGEMENT

Platinum International Fund
Value of $20,000 Invested Over Five Years30 June 2014 to 30 June 2019
After fees and costs, before tax, and assuming reinvestment of distributions.Historical performance is not a reliable indicator of future performance.Source: Platinum Investment Management Limited, FactSet.See notes 1 & 2, page 40.
Performance(compound p.a.+, to 30 June 2019)
QUARTER 1YR 3YRS 5YRS SINCE INCEPTION
Platinum Int'l Fund* 2% 1% 12% 9% 12%
MSCI AC World Index^ 5% 11% 14% 13% 7%
+ Excluding quarterly returns.* C Class – standard fee option. Inception date: 30 April 1995.After fees and costs, before tax, and assuming reinvestment of distributions.^ Index returns are those of the MSCI All Country World Net Index in AUD.Source: Platinum Investment Management Limited, FactSet.Historical performance is not a reliable indicator of future performance.See note 1, page 40. Numbers have been subject to rounding adjustments.
Andrew CliffordPortfolio Manager
Clay SmolinskiPortfolio Manager
$15,000
$20,000
$25,000
$30,000
$35,000
$40,000
2014 2016 2018
MSCI AC World Net Index (A$)
Platinum International Fund (C Class)
The Fund (C Class) returned 1.6% for the quarter and 0.7% for the last 12 months. These returns lagged the performance of global equity markets, which returned 4.9% for the quarter and 11.3% for the 12 months.
The collapse of US-China trade negotiations, the US government’s decision to restrict sales of key US technologies to Huawei (China’s telecom equipment provider), and growing expectations of interest rate cuts, were the key drivers of equity markets since early May. Broadly, these concerns saw investors once again seek safe havens in perceived low-risk equities, such as real estate, utilities, infrastructure, and consumer staples. Growth stocks, considered immune to the trade issues, were also sought after. This trend was further reinforced by expectations that lower interest rates would support the already highly generous valuations of these stocks. Generally, more cyclical companies, such as commodity producers, were sold off. Companies facing specific exposure to trade issues, such as auto companies, or to the Huawei ban, such as semiconductor companies, came under selling pressure.
As we outlined in this quarter’s Macro Overview, these moves continue the long-term trend of growth stocks outperforming value stocks, which has resulted in the disparity of valuations between these groups of stocks widening to extreme levels. The last time the relative performance of growth over value was at current levels, was in 1999-2000 at the height of the tech bubble (see Fig. 2, in the Macro Overview).
While we would not categorise ourselves as a ‘classic value’ investor, our approach of avoiding the crowd and seeking out those assets that are out-of-favour with investors, has resulted in the Fund migrating to investment opportunities in China, and cyclical sectors such as semiconductors, autos, energy, and metals, where we assess there is significant value.
While portions of the portfolio have lagged the market over the last year, it is worth noting that our investment approach has performed well in a number of key investments. Positions in Ping An Insurance (Chinese insurance and banking), ICICI Bank and Axis Bank (Indian banks), Weichai Power (Chinese diesel engine manufacturer), and Anta Sports Products (Chinese sports apparel producer), have made strong contributions. Short positions in Nvidia (US graphic microchip producer) and Tesla also made significant
9THE PLATINUM TRUST QUARTERLY REPORT 30 JUNE 2019

Disposition of AssetsREGION 30 JUN 2019 31 MAR 2019 30 JUN 2018
Asia 35% 36% 35%
North America 24% 22% 18%
Europe 16% 18% 21%
Japan 9% 7% 12%
Australia <1% <1% <1
South America <1% 0% <1
Russia <1% 0% <1
Cash 16% 16% 13%
Shorts -22% -10% -15%
See note 3, page 40. Numbers have been subject to rounding adjustments.Source: Platinum Investment Management Limited.
Net Sector Exposures ^
SECTOR 30 JUN 2019 31 MAR 2019 30 JUN 2018
Financials 16% 16% 14%
Communication Services 13% 14% 14%
Industrials 10% 10% 10%
Materials 9% 10% 9%
Information Technology 8% 8% 8%
Energy 5% 6% 9%
Consumer Discretionary 5% 5% 6%
Real Estate 3% 3% 2%
Health Care 2% 2% 6%
Consumer Staples 1% 1% 2%
Utilities <1% <1% 1%
Other* -12% -2% -9%TOTAL NET EXPOSURE 62% 73% 72%
^ A major GICS reclassification was implemented during the December 2018 quarter. The changes affected the Information Technology, Communication Services (previously Telecommunication Services) and Consumer Discretionary sectors. Historical exposures have been updated for continuity.* Includes index short positions.See note 4, page 40. Numbers have been subject to rounding adjustments.Source: Platinum Investment Management Limited.
contributions to performance. Each of these investments were made following our traditional investment approach.
Offsetting these good returns were declines in our energy-related investments, notably Transocean (offshore contract oil drilling services), Seven Generations (Canadian onshore oil and gas producer), and TechnipFMC (oil services), as well as other commodity producers such as Glencore (copper and cobalt, zinc, coal, and trading), First Quantum (copper) and MMG (copper).
Changes to the PortfolioThe net exposure of the portfolio was reduced from 73% to 62% over the quarter. The reduction in the net exposure was a result of a significant increase in short positions from -10% to -22%, predominantly in index futures. This was in response to indications that the US and China were unlikely to conclude a trade agreement anytime soon and the decision to ban sales of US technology to Huawei. The downside risk to markets of a significant escalation in tariffs is, in our view, significant and the additional index short positions were put in place to reduce market exposure. Subsequent to quarter end, the portfolio’s net invested position was increased to 75%, with a number of short positions taken off on improved market sentiment following the trade truce between the US and China.
Over the course of the quarter, we added to a wide range of existing holdings that offered good value after being sold off on concerns around trade and the Huawei bans. These included semiconductor and related companies, Micron Technology, Skyworks Solutions, Microchip Technology and Sumco. Similarly, we added to auto and related businesses such as BMW and Valeo. New positions were added in Ryanair (European budget airline), Owens Corning (US building materials), and BRF (Brazilian producer of pork and poultry). These new investments and additions to existing positions accounted for over 4% of the Fund.
These purchases were funded by exiting positions in Siemens (German industrial conglomerate) and Reliance Industries (Indian Petrochemical and Telecoms), and trimming our holdings across a range of positions such as Schibsted (online classifieds), Equifax (US information solutions), and Alphabet (owner of Google).
Top 10 HoldingsCOMPANY COUNTRY INDUSTRY WEIGHT
Ping An Insurance China Financials 4.3%
Samsung Electronics Korea Info Technology 3.5%
Facebook Inc US Comm Services 3.3%
Alphabet Inc US Comm Services 2.6%
China Overseas Land China Real Estate 2.5%
TechnipFMC Ltd UK Energy 2.5%
Glencore plc Switzerland Materials 2.3%
Intel Corp US Info Technology 2.2%
Bharti Airtel Ltd India Comm Services 2.0%
Jiangsu Yanghe Brewery China Consumer Staples 1.9%
As at 30 June 2019. See note 6, page 40.Source: Platinum Investment Management Limited.
10 PLATINUM ASSET MANAGEMENT
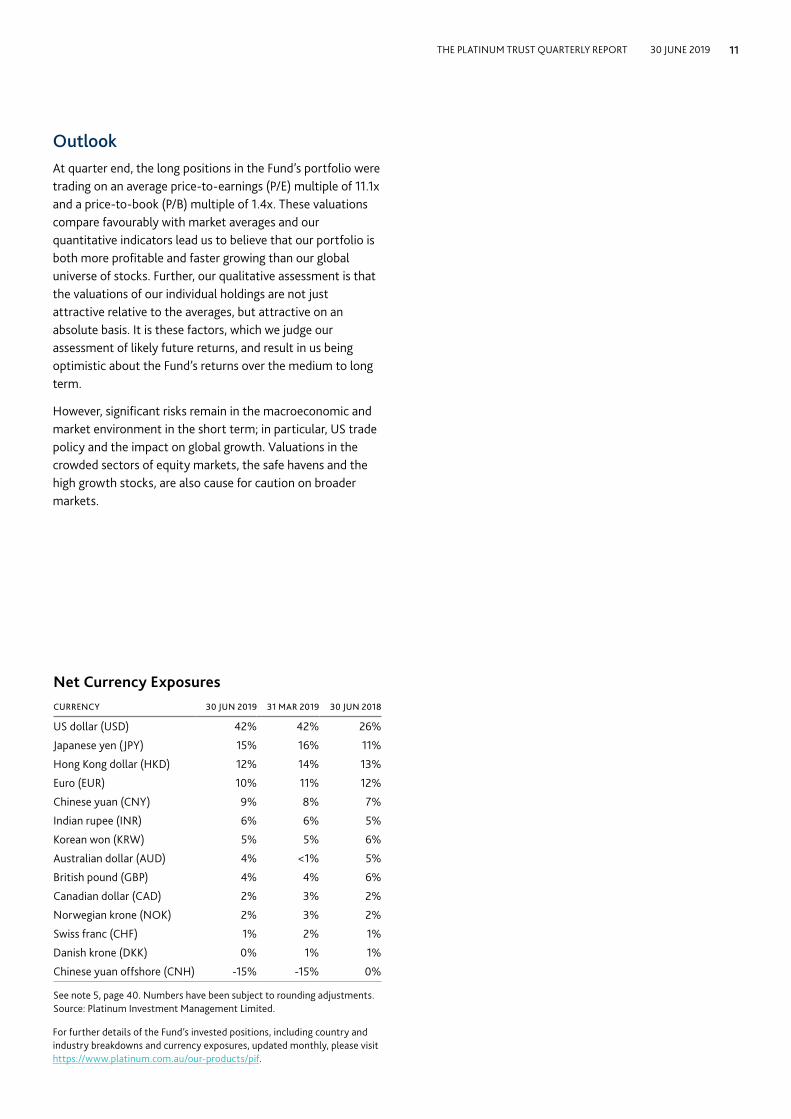
OutlookAt quarter end, the long positions in the Fund’s portfolio were trading on an average price-to-earnings (P/E) multiple of 11.1x and a price-to-book (P/B) multiple of 1.4x. These valuations compare favourably with market averages and our quantitative indicators lead us to believe that our portfolio is both more profitable and faster growing than our global universe of stocks. Further, our qualitative assessment is that the valuations of our individual holdings are not just attractive relative to the averages, but attractive on an absolute basis. It is these factors, which we judge our assessment of likely future returns, and result in us being optimistic about the Fund’s returns over the medium to long term.
However, significant risks remain in the macroeconomic and market environment in the short term; in particular, US trade policy and the impact on global growth. Valuations in the crowded sectors of equity markets, the safe havens and the high growth stocks, are also cause for caution on broader markets.
For further details of the Fund’s invested positions, including country and industry breakdowns and currency exposures, updated monthly, please visit https://www.platinum.com.au/our-products/pif.
Net Currency ExposuresCURRENCY 30 JUN 2019 31 MAR 2019 30 JUN 2018
US dollar (USD) 42% 42% 26%
Japanese yen (JPY) 15% 16% 11%
Hong Kong dollar (HKD) 12% 14% 13%
Euro (EUR) 10% 11% 12%
Chinese yuan (CNY) 9% 8% 7%
Indian rupee (INR) 6% 6% 5%
Korean won (KRW) 5% 5% 6%
Australian dollar (AUD) 4% <1% 5%
British pound (GBP) 4% 4% 6%
Canadian dollar (CAD) 2% 3% 2%
Norwegian krone (NOK) 2% 3% 2%
Swiss franc (CHF) 1% 2% 1%
Danish krone (DKK) 0% 1% 1%
Chinese yuan offshore (CNH) -15% -15% 0%
See note 5, page 40. Numbers have been subject to rounding adjustments.Source: Platinum Investment Management Limited.
11THE PLATINUM TRUST QUARTERLY REPORT 30 JUNE 2019

Platinum Unhedged Fund
Performance(compound p.a.+, to 30 June 2019)
QUARTER 1YR 3YRS 5YRS SINCE INCEPTION
Platinum Unhedged Fund* 1% -1% 16% 11% 11%
MSCI AC World Index^ 5% 11% 14% 13% 7%
+ Excludes quarterly returns* C Class – standard fee option. Inception date: 28 January 2005.After fees and costs, before tax, and assuming reinvestment of distributions.^ Index returns are those of the MSCI All Country World Net Index in AUD.Source: Platinum Investment Management Limited, FactSet.Historical performance is not a reliable indicator of future performance.See note 1, page 40. Numbers have been subject to rounding adjustments.
After fees and costs, before tax, and assuming reinvestment of distributions.Historical performance is not a reliable indicator of future performance.Source: Platinum Investment Management Limited, FactSet.See notes 1 & 2, page 40.
Value of $20,000 Invested Over Five Years30 June 2014 to 30 June 2019
Clay SmolinskiPortfolio Manager
$15,000
$20,000
$25,000
$30,000
$35,000
$40,000
2014 2016 2018
MSCI AC World Net Index (A$)
Platinum Unhedged Fund (C Class)
Over the past three years, the return of the Platinum Unhedged Fund (C Class) has been sound, delivering an annualised return of 15.6%. In dollar terms, $10,000 invested on 30 June 2016 with distributions reinvested is now worth $15,452, for a total cumulative return over the period of 55%1.
However, over the past year, the Fund’s return has been weaker, returning -1%. In our December 2018 quarterly report2, we outlined the factors behind the Fund’s performance in detail, with the brief summary being:
• Oil and Energy – Our oil and energy holdings were the largest detractor from performance over the past year, costing the Fund -4% in total performance. The oil price fell 36% in October 2018, triggering sharp falls in many of our oil-exposed holdings, which have yet to recover.
• Financials – Two of the Fund’s major bank holdings, Raiffeisen Bank International and KB Financial Group, have seen their share prices fall around -20% on the back of macro and political fears.
• Chinese internet advertising – Uncertainty around the US and China trade war has seen Chinese small- and medium-sized businesses pull back on their advertising spend, which has triggered price falls in online advertising platforms such as Weibo and Baidu.
The factors above explain the absolute performance of the Fund over the past year, but the obvious next question is why is the market performing so much better?
The most notable driver in the market today is the growing valuation divergence between stocks that investors perceive to offer high growth or safety versus everything else. This divergence has dramatically accelerated since 2017.
The anecdotal evidence of this difference is evident in3:
1. The valuation of the ‘sure thing’/safety stocks. Those companies investors believe can consistently grow are being awarded very high valuations. A good example is PayPal, which now trades on 53x earnings. High valuations are also being given to relatively slow-growing
1 Historical performance is not a reliable indicator of future performance.
2 https://www.platinum.com.au/PlatinumSite/media/Reports/ptqtr_1218.pdf
3 Source: FactSet as at 30 June 2019
12 PLATINUM ASSET MANAGEMENT
consumer staples stocks, such as Kikkoman (food manufacturer) trading on 34x, Lindt Chocolate on 36x and Diageo (alcoholic beverages) on 27x.
2. The excitement around the high growth software-as-a-service (SaaS) companies, many of which trade on 20-25x sales and have no profits.
3. Recent initial public offering (IPO or float) activity. A good example is Beyond Meat. The company produces heavily processed meat substitutes (commonly known as “veggie-burgers”). From its IPO price of US$25, its share price rose seven fold in a month and it now has a market capitalisation of around US$10 billion, despite only having sales of US$220 million.
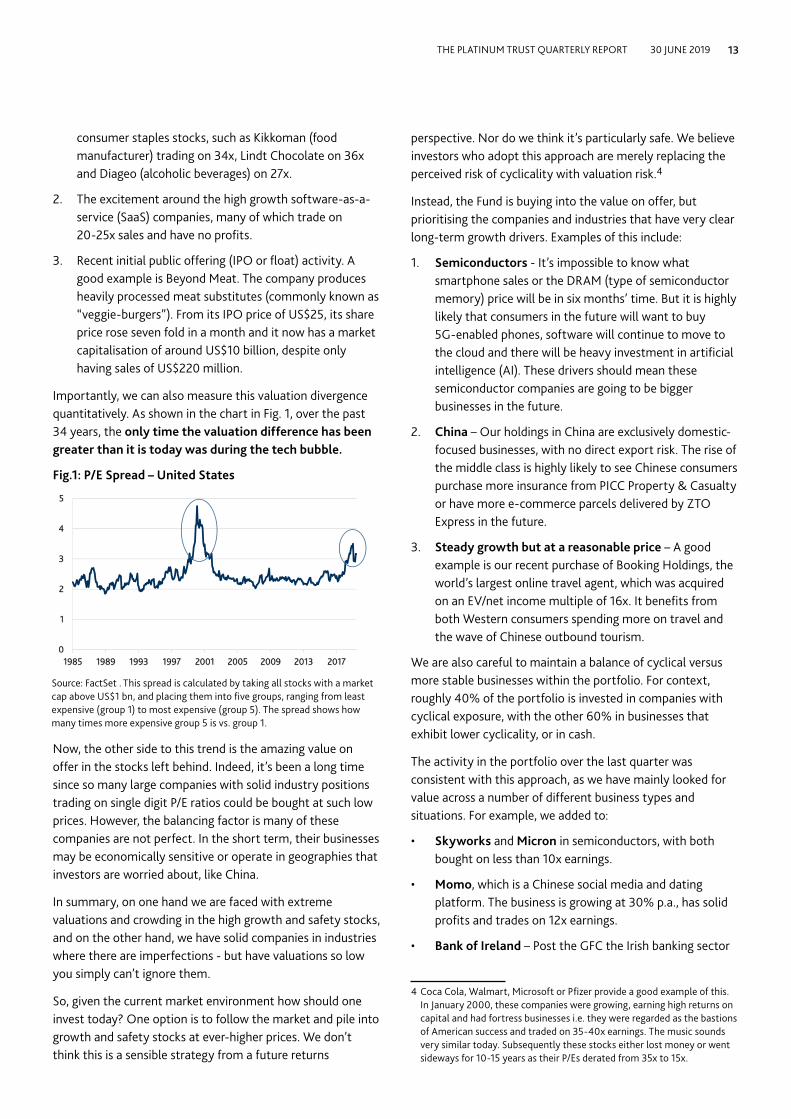
Importantly, we can also measure this valuation divergence quantitatively. As shown in the chart in Fig. 1, over the past 34 years, the only time the valuation difference has been greater than it is today was during the tech bubble.
Fig.1: P/E Spread – United States
Now, the other side to this trend is the amazing value on offer in the stocks left behind. Indeed, it’s been a long time since so many large companies with solid industry positions trading on single digit P/E ratios could be bought at such low prices. However, the balancing factor is many of these companies are not perfect. In the short term, their businesses may be economically sensitive or operate in geographies that investors are worried about, like China.
In summary, on one hand we are faced with extreme valuations and crowding in the high growth and safety stocks, and on the other hand, we have solid companies in industries where there are imperfections - but have valuations so low you simply can’t ignore them.
So, given the current market environment how should one invest today? One option is to follow the market and pile into growth and safety stocks at ever-higher prices. We don’t think this is a sensible strategy from a future returns
perspective. Nor do we think it’s particularly safe. We believe investors who adopt this approach are merely replacing the perceived risk of cyclicality with valuation risk.4
Instead, the Fund is buying into the value on offer, but prioritising the companies and industries that have very clear long-term growth drivers. Examples of this include:
1. Semiconductors - It’s impossible to know what smartphone sales or the DRAM (type of semiconductor memory) price will be in six months’ time. But it is highly likely that consumers in the future will want to buy 5G-enabled phones, software will continue to move to the cloud and there will be heavy investment in artificial intelligence (AI). These drivers should mean these semiconductor companies are going to be bigger businesses in the future.
2. China – Our holdings in China are exclusively domestic-focused businesses, with no direct export risk. The rise of the middle class is highly likely to see Chinese consumers purchase more insurance from PICC Property & Casualty or have more e-commerce parcels delivered by ZTO Express in the future.
3. Steady growth but at a reasonable price – A good example is our recent purchase of Booking Holdings, the world’s largest online travel agent, which was acquired on an EV/net income multiple of 16x. It benefits from both Western consumers spending more on travel and the wave of Chinese outbound tourism.
We are also careful to maintain a balance of cyclical versus more stable businesses within the portfolio. For context, roughly 40% of the portfolio is invested in companies with cyclical exposure, with the other 60% in businesses that exhibit lower cyclicality, or in cash.
The activity in the portfolio over the last quarter was consistent with this approach, as we have mainly looked for value across a number of different business types and situations. For example, we added to:
• Skyworks and Micron in semiconductors, with both bought on less than 10x earnings.
• Momo, which is a Chinese social media and dating platform. The business is growing at 30% p.a., has solid profits and trades on 12x earnings.
• Bank of Ireland – Post the GFC the Irish banking sector
4 Coca Cola, Walmart, Microsoft or Pfizer provide a good example of this. In January 2000, these companies were growing, earning high returns on capital and had fortress businesses i.e. they were regarded as the bastions of American success and traded on 35-40x earnings. The music sounds very similar today. Subsequently these stocks either lost money or went sideways for 10-15 years as their P/Es derated from 35x to 15x.
0
1
2
3
4
5
1985 1989 1993 1997 2001 2005 2009 2013 2017
Source: FactSet . This spread is calculated by taking all stocks with a market cap above US$1 bn, and placing them into five groups, ranging from least expensive (group 1) to most expensive (group 5). The spread shows how many times more expensive group 5 is vs. group 1.
13THE PLATINUM TRUST QUARTERLY REPORT 30 JUNE 2019

For further details of the Fund’s invested positions, including country and industry breakdowns and currency exposures, updated monthly, please visit https://www.platinum.com.au/our-products/puf.
Disposition of Assets
REGION 30 JUN 2019 31 MAR 2019 30 JUN 2018
Asia 34% 37% 37%North America 30% 29% 25%Europe 17% 16% 17%
Japan 4% 3% 6%
Russia 1% 1% 1%
South America 0% <1% <1Cash 16% 15% 14%
See note 3, page 40. Numbers have been subject to rounding adjustments.Source: Platinum Investment Management Limited.
is now effectively a duopoly, the economy is growing nicely and the population is rising again via net immigration and Irish citizens returning home. Given little property development has occurred over the last decade, housing shortages are starting to occur. This is quite an interesting starting point, especially given we are buying the Bank of Ireland at 7x P/E.
OutlookA common question posed to us is, when will the market start to reward a value-based approach again? The discussion usually moves to how the current situation of macro and political uncertainty, low interest rates and the influence of passive ETFs may produce different outcomes to the past. Rather than explain the specific factors present in the market today (refer to the Macro Overview for further details) we can instead look to history to establish the base rate5, which shows that a value-based approach to investing has been the most successful over the long term.
A value approach eventually won out in the tech bubble, the GFC and the European sovereign crisis. Notably, these were all periods that had unique situations and challenges that at the time felt very different to the past.
The portfolio has a vast number of holdings on extremely attractive starting valuations, and while this doesn’t on its own predict when or if these businesses will be rewarded by the market, history has shown us that as long as we are right about the earnings potential of these businesses, good returns should be earnt over the long run.
5 The base rate of probability is established by examining the outcome of similar situations over a long period of time. Humans have a natural tendency to focus on the specific situation/evidence of today when forecasting an outcome, often ignoring more general information, like the past probability of outcomes.
Net Sector Exposures ^
SECTOR 30 JUN 2019 31 MAR 2019 30 JUN 2018
Financials 16% 15% 17%
Industrials 18% 16% 14%
Communication Services 13% 13% 11%
Information Technology 10% 9% 10%
Energy 8% 9% 10%
Consumer Staples 6% 8% 7%
Real Estate 4% 4% 3%
Health Care 3% 3% 3%
Consumer Discretionary 3% 2% 3%
Materials 2% 4% 3%Utilities 0% 1% 5%TOTAL NET EXPOSURE 84% 85% 86%
^ A major GICS reclassification was implemented during the December 2018 quarter. The changes affected the Information Technology, Communication Services (previously Telecommunication Services) and Consumer Discretionary sectors. Historical exposures have been updated for continuity.See note 4, page 40. Numbers have been subject to rounding adjustments.Source: Platinum Investment Management Limited.
Net Currency Exposures
CURRENCY 30 JUN 2019 31 MAR 2019 30 JUN 2018
US dollar (USD) 38% 36% 33%
Euro (EUR) 14% 14% 12%
Hong Kong dollar (HKD) 13% 14% 15%
Japanese yen (JPY) 9% 12% 8%
Chinese yuan (CNY) 6% 8% 7%
Indian rupee (INR) 6% 6% 4%
Korean won (KRW) 4% 4% 4%
Australian dollar (AUD) 4% 0% 6%
British pound (GBP) 3% 3% 3%
Canadian dollar (CAD) 2% 2% 2%
Norwegian krone (NOK) 1% 1% 3%
See note 5, page 40. Numbers have been subject to rounding adjustments.Source: Platinum Investment Management Limited.
Top 10 Holdings
COMPANY COUNTRY INDUSTRY WEIGHT
Applus Services Spain Industrials 3.5%
Kweichow Moutai Co China Consumer Staples 3.3%
Facebook Inc US Comm Services 3.2%
IHS Markit Ltd US Industrials 3.1%
Jiangsu Yanghe Brewery China Consumer Staples 3.1%
Alphabet Inc US Comm Services 2.8%
PICC Prop & Cas China Financials 2.8%
Skyworks Solutions US Info Technology 2.7%
Sanofi SA France Health Care 2.6%
KB Financial Group Korea Financials 2.5%
As at 30 June 2019. See note 6, page 40.Source: Platinum Investment Management Limited.
14 PLATINUM ASSET MANAGEMENT

Platinum Asia Fund
Performance(compound p.a.+, to 30 June 2019)
QUARTER 1YR 3YRS 5YRS SINCE INCEPTION
Platinum Asia Fund* 0% 0% 12% 10% 14%
MSCI AC Asia ex Jp Index^ 1% 5% 14% 11% 10%
+ Excludes quarterly returns* C Class – standard fee option. Inception date: 4 March 2003.After fees and costs, before tax, and assuming reinvestment of distributions.^ Index returns are those of the MSCI All Country Asia ex Japan Net Index in AUD. Source: Platinum Investment Management Limited, FactSet.Historical performance is not a reliable indicator of future performance.See note 1, page 40. Numbers have been subject to rounding adjustments.
After a strong start to the year, it was a somewhat lacklustre quarter for Asia markets. The Fund (C Class) has however returned 10.3% for the calendar year-to-date.
Given the negative market narrative of trade wars and a slowing global economy, the market has perhaps performed better than expected. Stabilisation of the Chinese economy, coupled with expectations of a synchronised easing in global interest rates is proving to be a much-needed tonic for the economic ills. These periods of market uncertainty provide contrarian investors like ourselves, with the perfect opportunity to acquire stocks at attractive prices.
Stocks that contributed positively to the Fund’s performance during the quarter were largely Asian companies with strong balance sheets, which are proving to be remarkably resilient in a generally slower economic environment. Meituan Dianping (Chinese internet platform for lifestyle services) was up 29% over the quarter in local currency terms and Ayala Land (dominant Philippines property developer) was up 13%. Stocks that detracted from the Fund’s performance were mainly US-listed Chinese stocks (ADRs1 ). While fundamentally robust and resilient, these companies were impacted by negative sentiment towards Chinese stocks. We expect some of these companies will opt for a secondary listing on the Hong Kong Stock Exchange, which should be positive for their valuations.
During the quarter, in anticipation of market volatility, we pre-emptively initiated short positions on the Korean and Taiwan equity markets, which helped to cushion some of the market weakness that resulted from the escalation in the trade war between the US and China.
Changes to the PortfolioAt the beginning of the quarter, we took the opportunity to sell down a number of our strong performing stocks to lock in profits, which proved beneficial. The Fund’s net invested position fell from 83% to a low of around 60% in May.
Following share price weakness, the Hong Kong and Chinese markets were trading on valuations significantly below their 15-year averages. We took advantage of the situation mid-way through the quarter and employed some of the cash
1 American Depositary Receipts
Joseph LaiPortfolio Manager
Value of $20,000 Invested Over Five Years30 June 2014 to 30 June 2019
After fees and costs, before tax, and assuming reinvestment of distributions.Historical performance is not a reliable indicator of future performance.Source: Platinum Investment Management Limited, FactSet.See notes 1 & 2, page 40.
$15,000
$20,000
$25,000
$30,000
$35,000
$40,000
2014 2016 2018
MSCI AC Asia ex Japan Net Index (A$)
Platinum Asia Fund (C Class)
15THE PLATINUM TRUST QUARTERLY REPORT 30 JUNE 2019

by adding to existing positions in high-quality companies, which were trading on exceptionally low valuations. These included, Tencent (value-added services and online advertising), Samsung Electronics and SK Hynix (semiconductor).
We also initiated new positions in various Hong Kong real estate companies, including Sun Hung Kai Properties, New World Development, and Wheelock and Company. These are premier Hong Kong based companies, which typically have very resilient and growing rental property businesses and enviable exposure to the Greater Bay Area in the southern part of China. These firms are expected to benefit from the Chinese government’s plans to transform this area into the ‘Silicon Valley’ of China. Trading at significant discounts to book value and on high single digit price to earnings multiples, with dividend yields of around 4% p.a. (supported by recurrent rental income), these stocks are incredibly cheap, especially in a falling interest rate environment.
Overall, given the uncertainty surrounding the outcome of the trade war between the US and China and global markets, the Fund adopted a prudent approach over the quarter, holding an average of around 23% in cash and 4% short positions in stock indices, which we will continue to reduce at an appropriate time.
Net Sector Exposures ^
SECTOR 30 JUN 2019 31 MAR 2019 30 JUN 2018
Financials 20% 24% 21%
Consumer Discretionary 16% 18% 10%
Communication Services 14% 15% 12%
Information Technology 10% 9% 5%
Real Estate 10% 7% 7%
Industrials 4% 3% 6%
Health Care 2% 2% 3%
Utilities 1% 1% 4%
Materials 1% 1% 4%
Consumer Staples 0% 3% 3%
Energy 0% 1% 9%
Other* -2% <1% -2%TOTAL NET EXPOSURE 75% 83% 81%
^ A major GICS reclassification was implemented during the December 2018 quarter. The changes affected the Information Technology, Communication Services (previously Telecommunication Services) and Consumer Discretionary sectors. Historical exposures have been updated for continuity.* Includes index shorts and other positions.See note 4, page 40. Numbers have been subject to rounding adjustments.Source: Platinum Investment Management Limited.
Disposition of Assets
REGION 30 JUN 2019 31 MAR 2019 30 JUN 2018
China^ 34% 43% 45%
Hong Kong 13% 10% 6%
Taiwan 4% 4% 1%
India 12% 12% 12%
Korea 9% 8% 11%
Thailand 4% 4% 4%
Philippines 3% 3% 2%
Vietnam 2% 2% 1%
Malaysia <1% <1% <1%
Singapore 0% 0% 1%
Indonesia 0% 0% 1%
Cash 19% 13% 16%
Shorts -6% -4% -3%
^ Inclusive of all mainland China-based companies, both those listed on exchanges within mainland China and those listed on exchanges outside of mainland China.See note 3, page 40. Numbers have been subject to rounding adjustments.Source: Platinum Investment Management Limited.
CommentaryInvesting in Asia in recent years has felt very similar to the metaphor “The Road Less Travelled”. To invest in interesting and attractively valued opportunities, we have needed to think differently from the crowd, especially during times of uncertainty and fear, and remain vigilant for opportunities. We have sought to lock in profits when sentiment was elevated.
In 2016, the UK’s decision to exit the European Union (Brexit) following a referendum in June, and weak global growth weighed on markets. The extremely negative sentiment prompted the Chinese government to relax its policies to encourage infrastructure spending, property investment and consumption. At that time of market weakness, we increased our exposure to Asian equities and captured the rally in equity markets that unfolded in 2017. We generated a 35% return for our investors in the Fund in 2017.
The market’s positive tone continued in the first half 2018 and we gradually took profits and reduced our exposure.
However, the optimism ended in the second half of 2018 with the Asian markets2 producing a dismal return. China slowed down as the shadow banking reforms, which restricted lending, began to impact the economy and the trade war erupted. By October 2018, when pessimism was at its worst,
2 MSCI AC Asia Ex Japan Index
16 PLATINUM ASSET MANAGEMENT

Top 10 Holdings
COMPANY COUNTRY INDUSTRY WEIGHT
Alibaba Group China Cons Discretionary 4.7%
Tencent Holdings China Comm Services 4.5%
Samsung Electronics Korea Info Technology 4.2%
Taiwan Semiconductor Taiwan Info Technology 3.9%
AIA Group Ltd Hong Kong Financials 3.7%
Ping An Insurance China Financials 3.7%
Meituan Dianping China Cons Discretionary 2.9%
Kasikornbank PCL Thailand Financials 2.9%
Axis Bank Limited India Financials 2.8%
Autohome Inc China Comm Services 2.5%
As at 30 June 2019. See note 6, page 40.Source: Platinum Investment Management Limited.
For further details of the Fund’s invested positions, including country and industry breakdowns and currency exposures, updated monthly, please visit https://www.platinum.com.au/our-products/paf.
we felt it was time to add stocks again. We enjoyed a brief, but powerful rally in equities in early 2019.
As mentioned above, we reduced our exposures again recently as we felt the market was too bullish as trade relations between US and China deteriorated.
The question today is - where to from here?
With regards to the US and China trade conflict, it’s worth noting that China’s exports to the US only represent 4% of China’s national output (i.e. GDP). US-imposed tariffs on China therefore in themselves do not have a major direct impact on the Chinese economy. China has a huge domestic market and 96% of China’s output goes to markets outside the USA.
However, trade uncertainty is having an indirect impact nonetheless on business confidence and consumer sentiment. It not only impacts China, but also the rest of the world. The inter-connectivity of the global economy means there is a huge third-order effect to other countries that supply and manufacture goods and parts for Chinese and US products. Businesses are unlikely to invest when the demand for their products is uncertain. Likewise, consumers will be hesitant to spend (i.e. buy a new car or mobile phone) if they are uncertain about their job.
In this complex situation, there will emerge winners and losers. To the extent some of the factories will migrate out of China, it will be a small loss for China, but it will represent large gains for surrounding countries with low labour costs. Vietnam for example, is seeing double-digit growth for the
same types of Chinese products that the US had imposed tariffs on. We added to our positions in Vietnam during the quarter.
At a company level, the US government’s decision to add Chinese telecommunications company, Huawei to an “Entity List”, which prohibits US companies from conducting business with it, presented opportunities for other companies to benefit. Samsung Electronics for instance, which was trading on book value and 13x price to earnings based on cyclical depressed earnings – offered great value. To the extent Huawei could lose market share in smartphones in Europe, Samsung is ready to capture it. We added to our position in Samsung at lower prices.
One of the major constants in Asia is change. Change can create opportunities. When there is fear in the market, we try to think differently i.e. we take the road less travelled.
The two main themes we are focusing on are:
1. Beneficiaries of the trade conflict.
2. Good quality companies with inherent growth - even in a slowing global economy.
Let’s be clear. Taking the road less travelled does not simply mean positioning towards adventure and risk. In most cases, it means buying what we believe are companies with strong balance sheets at cheap prices.
The prospect of a slow growing global economy due to trade uncertainty, and global central banks cutting rates aggressively to zero in the absence of inflation, is a reality we face.
Net Currency Exposures
CURRENCY 30 JUN 2019 31 MAR 2019 30 JUN 2018
US dollar (USD) 41% 41% 15%
Hong Kong dollar (HKD) 31% 28% 33%
Chinese yuan (CNY) 18% 17% 14%
Indian rupee (INR) 13% 10% 13%
Korean won (KRW) 9% 8% 11%
Taiwan new dollar (TWD) 4% 3% 1%
Vietnamese dong (VND) 2% 2% 1%
Australian dollar (AUD) 2% <1% 5%
Malaysian ringgit (MYR) <1% <1% <1%
Thai baht (THB) -1% 4% 4%
Philippine piso (PHP) -5% 3% 2%
Chinese yuan offshore (CNH) -15% -19% 0%
See note 5, page 40. Numbers have been subject to rounding adjustments.Source: Platinum Investment Management Limited.
17THE PLATINUM TRUST QUARTERLY REPORT 30 JUNE 2019

However, the longer-term fundamentals are still very favourable in the Asia region. With income per capita still very low in China (around US$10,000 per person in 2018) and India (around US$2,000 per person) versus an average of US$40,000 for OECD members3, it will take a great deal to disrupt growth in these countries’ living standards. Both governments are investing heavily in infrastructure, education and technology off a relatively low base, driving economic growth and subsequently higher income levels for many years to come.
India has cleaned up its banking system, implemented the goods and services tax (GST) and introduced a workable bankruptcy code. Reforms to open up the economy are continuing and these will drive internally generated growth.
In 10 years’ time, the banking industry landscape in India will likely be akin to that of Australia, in which a handful of well-run private banks will dominate the market. One stock held in the Fund that is benefiting from the bank reforms, is Axis Bank. Axis is one of India’s private banks that is taking market share, competing against the less-than-competent state-owned banks. We expect Axis Bank’s earnings will increase significantly over the next three years, and is trading on just 20x earnings and 2.5x book value.
China continues to reform its economy by cleaning up the banking system, opening up industries to foreign competition and encouraging technology development.
Life insurance company, AIA is a good example of a company that we expect will benefit from China opening up its market. At present, AIA only operates in five out of the 36 Chinese provinces. It is growing insurance premiums by 25% a year and its expansion into the remaining 31 provinces is expected to provide significant upside to growth. It has done very well selling quality products that understand the needs of customers. We estimate earnings will continue to grow at double digits for a long time, and is trading on just 15x earnings.
3 Source: World Bank, 2018
OutlookWhile uncertainty and risks always exist in investing, what is certain is that valuations of Asian stocks are attractive again.
A trade truce was reached between the US and China at the 2019 G20 Summit in Osaka at the end of June, with both superpowers agreeing to recommence trade negotiations. China’s Huawei also received a reprieve on some of the trade restrictions imposed by the US. Uncertainty has paralysed decision making for businesses and consumers alike. While it is unlikely to supercharge the economic cycle, these developments reduce the prospect of a stalling in economic activities in the region.
With decelerating economic growth globally, central banks in many countries have started cutting interest rates. This marks an interesting turning point for the region. With many of its currencies linked to the US dollar, the region’s interest rate policies reflected the US policies, which has been tightening over the last three years. The US Federal Reserve has shifted its stance in recent months away from further tightening, with the markets now pricing in interest rate cuts in 2019. This reversal is a positive for the region’s asset markets and currency value.
Given the likelihood of improving economic prospects and attractive valuations, the Fund has deployed some of the cash raised into existing and new stock positions, and plans to continue to invest in quality companies with resilient characteristics. Taking the road less travelled may make a difference.
18 PLATINUM ASSET MANAGEMENT

Platinum European Fund
Performance(compound p.a.+, to 30 June 2019)
QUARTER 1YR 3YRS 5YRS SINCE INCEPTION
Platinum European Fund* 7% 2% 15% 10% 12%
MSCI AC Europe Index^ 6% 8% 11% 7% 3%
+ Excludes quarterly returns.* C Class – standard fee option. Inception date: 30 June 1998.After fees and costs, before tax, and assuming reinvestment of distributions.^ Index returns are those of the MSCI All Country Europe Net Index in AUD.Source: Platinum Investment Management Limited, FactSet.Historical performance is not a reliable indicator of future performance.See note 1, page 40. Numbers have been subject to rounding adjustments.
Value of $20,000 Invested Over Five Years30 June 2014 to 30 June 2019
After fees and costs, before tax, and assuming reinvestment of distributions.Historical performance is not a reliable indicator of future performance.Source: Platinum Investment Management Limited, FactSet.See notes 1 & 2, page 40.
Platinum European Fund (C Class)
$15,000
$20,000
$25,000
$30,000
$35,000
2014 2016 2018
MSCI AC Europe Net Index (A$)
Nik DvornakPortfolio Manager
The Platinum European Fund (C Class) returned 6.6% over the quarter.
Evidence of softer global economic growth and resurgent trade tensions between the US and China unsettled markets during the quarter. Deteriorating sentiment was somewhat offset by prospects of further monetary policy stimulus by the US Federal Reserve and the European Central Bank. Equity markets rallied as the quarter drew to a close, as expectations mounted of a trade ‘truce’ being agreed when US President Donald Trump and Chinese President Xi Jinping met at the G20 summit in Osaka, Japan.
The backdrop of lacklustre growth and lower interest rates spurred further crowding in the so-called ‘bond proxies’ or defensive growth stocks. On the other hand, cyclical businesses remain deeply out-of-favour and recent political and economic turbulence will do little to rectify this. Our low exposure to defensive growth stocks and our high exposure to cyclical businesses has been the primary impediment to our year-to-date performance. For a detailed explanation of why we have chosen to position our portfolio this way, we would encourage investors to read our March 2019 Quarterly Report1.
Our best performing positions tended to be businesses where our investment case is playing out. German mortgage platform, Hypoport, continues to take market share as its platform disintermediates the wholesale banking model and gives Germany’s highly fragmented, localised, lenders direct access to a national market. Russian electronic payments network, Qiwi, is growing rapidly thanks to the rise of the sharing economy in Russia and market share gains in processing sports betting payments.
Our worst performing positions tended to be cyclical businesses with evidence of weaker end-user demand. Falling copper, cobalt and thermal coal prices have pressured the stock of global miner, Glencore. Falling prices for gasoline and diesel have similarly weighed on Sardinian oil refiner, Saras.
1 https://www.platinum.com.au/PlatinumSite/media/Reports/ptqtr_0319.pdf
19THE PLATINUM TRUST QUARTERLY REPORT 30 JUNE 2019

Disposition of Assets
REGION 30 JUN 2019 31 MAR 2019 30 JUN 2018
Germany 14% 19% 21%
Norway 11% 9% 8%
Switzerland 10% 11% 10%
UK 9% 10% 14%
Spain 7% 8% 6%
Austria 7% 7% 7%
US* 7% 5% 2%
Romania 6% 5% 2%
France 5% 6% 1%
Poland 3% 3% 0%
Ireland 3% 3% 2%
Italy 2% 2% 3%
Russia 2% 2% 3%
Denmark 2% 2% 2%
Hungary 1% 1% 2%
Netherlands 0% 1% 0%
Cash 9% 7% 16%
Shorts -20% -8% -1%
* Stocks that are listed on US exchanges, but whose businesses are predominantly conducted in Europe.See note 3, page 40. Numbers have been subject to rounding adjustments.Source: Platinum Investment Management Limited.
For further details of the Fund’s invested positions, including country and industry breakdowns and currency exposures, updated monthly, please visit https://www.platinum.com.au/our-products/pef.
Changes to the PortfolioWe sold our holding in German industrial conglomerate, Siemens during the quarter. The more mature parts of the business will likely come under pressure as unease over trade tensions causes businesses to defer or scale back investment intentions. With the stock having been resilient and the sector de-rating, we believe there are better opportunities elsewhere.
We also sold our holding in Scout24 (German online real estate and auto marketplace) and Takeaway.com (Netherlands-based food delivery website). Both stocks have performed well since we bought them but with the investment thesis having partly played out and the market’s valuation having become more ambitious, we have decided to move on.
We significantly increased our position in TGS Nopec. The company acquires and analyses seismic data to help oil and gas companies find new resources. The industry sharply curtailed exploration spending when oil prices fell in 2014 and 2015. The stock trades on 15x earnings and we believe earnings can grow significantly as exploration spending starts to recover.
We also added to our position in Booking Holdings, the world’s largest online travel agent. Travellers use its best-known app, Priceline, to research, compare and book accommodation, flights, cars and other travel-related services. Travel remains a fast-growing industry with a proliferation of accommodation options: hotels, vacation rentals, private apartments or homes, hosted stays, boutique hotels, etc. Travellers need more help navigating these options than ever before, while suppliers are becoming increasingly fragmented and dependent on intermediaries. Successfully connecting the two should remain a vital service and we believe a lucrative endeavour. Booking Holdings is growing 10% p.a. and trades at 16x ex-cash earnings.
OutlookWhile the market narrative on Europe is resoundingly negative, the reality is considerably more upbeat. Despite current account surpluses being present throughout the region, we see little written about the restored competitiveness of European labour and capital in global markets. Labour force participation, which has powered to an unprecedented high of 73% over the last decade, receives little airplay. Similarly, government finances have improved considerably with the aggregate Eurozone fiscal deficit now a mere 0.5% of GDP, yet this too garners little attention.
Net Sector Exposures ^
SECTOR 30 JUN 2019 31 MAR 2019 30 JUN 2018
Industrials 21% 23% 20%
Financials 18% 17% 19%
Health Care 14% 11% 10%
Energy 9% 8% 8%
Consumer Discretionary 8% 9% 7%
Materials 5% 5% 6%
Information Technology 5% 4% 5%
Communication Services 3% 7% 8%
Real Estate 1% 1% 1%
Consumer Staples -2% -2% -1%
Other -11% 3% 0%
TOTAL NET EXPOSURE 71% 85% 83%
^ A major GICS reclassification was implemented during the December 2018 quarter. The changes affected the Information Technology, Communication Services (previously Telecommunication Services) and Consumer Discretionary sectors. Historical exposures have been updated for continuity.See note 4, page 40. Numbers have been subject to rounding adjustments.Source: Platinum Investment Management Limited.
20 PLATINUM ASSET MANAGEMENT

Net Currency Exposures
CURRENCY 30 JUN 2019 31 MAR 2019 30 JUN 2018
Euro (EUR) 34% 41% 34%
Swiss franc (CHF) 21% 15% 6%
Norwegian krone (NOK) 15% 13% 13%
British pound (GBP) 11% 12% 14%
US dollar (USD) 5% 3% 6%
Australian dollar (AUD) 4% <1% 2%
Polish złoty (PLN) 3% 3% 0%
Romanian leu (RON) 3% 3% 7%
Danish krone (DKK) 2% 2% 2%
Hungarian forint (HUF) 1% 1% 3%
Czech koruna (CZK) 0% 8% 11%
See note 5, page 40. Numbers have been subject to rounding adjustments.Source: Platinum Investment Management Limited.
Top 10 Holdings
COMPANY COUNTRY INDUSTRY WEIGHT
Raiffeisen Bank Austria Financials 4.0%
Booking Holdings Inc US Cons Discretionary 3.6%
Roche Holding AG Switzerland Health Care 3.4%
IHS Markit Ltd US Industrials 3.4%
Applus Services Spain Industrials 3.3%
Glencore plc Switzerland Materials 3.2%
Reed Elsevier PLC UK Industrials 3.2%
TechnipFMC Ltd UK Energy 3.1%
Banca Transilvania Romania Financials 3.1%
Golden Ocean Group Norway Industrials 3.0%
As at 30 June 2019. See note 6, page 40.Source: Platinum Investment Management Limited.
While the European economy has slowed over the last few quarters, the weakness is largely confined to exports and manufacturing. This reflects a slowing in global trade and weaker economic growth in China. Domestic-facing sectors of the economy remain in good shape, unemployment has consistently fallen since mid-2013 and wages are growing at 2.5% p.a. and accelerating.
Politics remains a concern. Populist politicians and causes have gained support in recent years. Yet, public support for the European Union (EU) and euro is rising. The latest Eurobarometer survey found that 68% of respondents believe EU membership is beneficial to their country; the highest since 1983. A related survey found that 64% of respondents also believe the euro is good for their country; a record high.
We believe the main risks to Europe lie outside the region. Of particular concern is that the United States is now using tariffs in a wide variety of disputes; the border security dispute with Mexico being a case in point. Businesses making investment decisions will find this new ‘gloves-off’ environment torturous with the likely outcome being that they defer or scale down investments. This will impede global economic growth. Moreover, simmering trade tensions between the United States and Europe are likely to boil over at some point.
Our portfolio continues to be skewed to cyclical businesses. These businesses are particularly sensitive to the above risks. They may continue to underperform in an environment of high uncertainty, weak growth and low interest rates. However, the valuations of these stocks are now so low that even with a significant deterioration in commercial circumstances, we expect to still make a respectable return on our investment. Evidence that global economic growth is more resilient than expected, or a concerted effort by Chinese authorities to stimulate their economy, could be positive catalysts. In these circumstances, we would expect our holdings to perform well.
21THE PLATINUM TRUST QUARTERLY REPORT 30 JUNE 2019
Platinum Japan Fund
Performance(compound p.a.+, to 30 June 2019)
QUARTER 1YR 3YRS 5YRS SINCE INCEPTION
Platinum Japan Fund* 6% 3% 12% 14% 14%
MSCI Japan Index^ 2% 1% 10% 11% 3%
+ Excludes quarterly performance.* C Class – standard fee option. Inception date: 30 June 1998.After fees and costs, before tax, and assuming reinvestment of distributions.^ Index returns are those of the MSCI Japan Net Index in AUD.Source: Platinum Investment Management Limited, FactSet.Historical performance is not a reliable indicator of future performance.See note 1, page 40. Numbers have been subject to rounding adjustments.
Value of $20,000 Invested Over Five Years30 June 2014 to 30 June 2019
After fees and costs, before tax, and assuming reinvestment of distributions.Historical performance is not a reliable indicator of future performance.Source: Platinum Investment Management Limited, FactSet.See notes 1 & 2, page 40.
Scott GilchristPortfolio Manager
$15,000
$20,000
$25,000
$30,000
$35,000
$40,000
$45,000
2014 2016 2018
Platinum Japan Fund (C Class)
MSCI Japan Net Index (A$)
The Fund (C Class) returned +5.8% for the quarter and +3.1% for the year. This is against the backdrop of a weak Japanese stock market, with the Index returning 2.3% over the quarter and 0.9% over the year.
The Fund’s strong performance over the quarter occurred despite conservative positioning, with an average 65% net invested position. Stocks that provided a positive contribution to performance included Nintendo (console games, +25%), Rakuten (e-commerce, +22%), KDDI (telecommunications, +15%), DeNa (internet, +24%) and Lixil (housing and bathroom products, +15%).
A stronger Japanese yen, especially relative to the Australian dollar, also contributed to the Fund’s performance over the quarter and year.
Japanese government bond prices rose to record highs over the quarter. In a further reflection of general investor nervousness, the gold price reached record highs in some currencies, and the global stock of bonds with negative yields reached new highs, climbing to US$13 trillion. The Japanese market is particularly sensitive to this type of environment due to decades of failed monetary experiments and embedded memory of the country's own debt bubble.
This market environment is presenting many opportunities and the portfolio is gradually shifting to a mix of high quality companies at multi-decade low valuations and reasonably priced growth companies.
22 PLATINUM ASSET MANAGEMENT
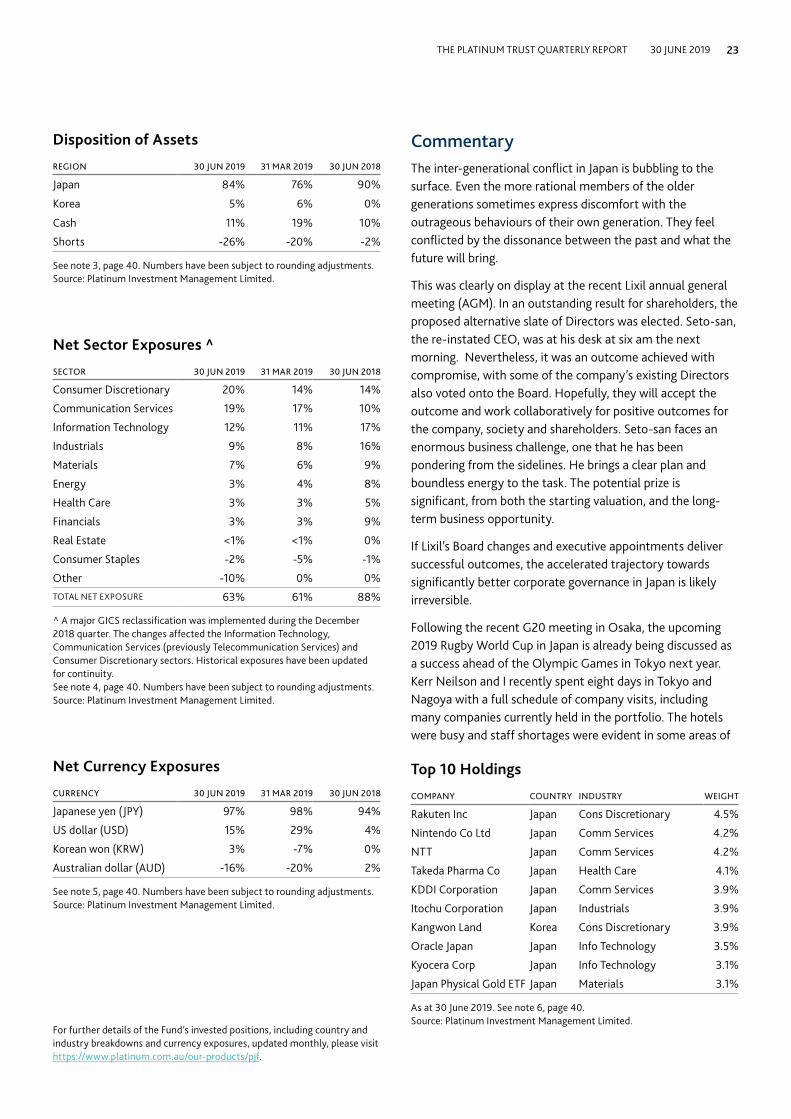
CommentaryThe inter-generational conflict in Japan is bubbling to the surface. Even the more rational members of the older generations sometimes express discomfort with the outrageous behaviours of their own generation. They feel conflicted by the dissonance between the past and what the future will bring.
This was clearly on display at the recent Lixil annual general meeting (AGM). In an outstanding result for shareholders, the proposed alternative slate of Directors was elected. Seto-san, the re-instated CEO, was at his desk at six am the next morning. Nevertheless, it was an outcome achieved with compromise, with some of the company’s existing Directors also voted onto the Board. Hopefully, they will accept the outcome and work collaboratively for positive outcomes for the company, society and shareholders. Seto-san faces an enormous business challenge, one that he has been pondering from the sidelines. He brings a clear plan and boundless energy to the task. The potential prize is significant, from both the starting valuation, and the long-term business opportunity.
If Lixil’s Board changes and executive appointments deliver successful outcomes, the accelerated trajectory towards significantly better corporate governance in Japan is likely irreversible.
Following the recent G20 meeting in Osaka, the upcoming 2019 Rugby World Cup in Japan is already being discussed as a success ahead of the Olympic Games in Tokyo next year. Kerr Neilson and I recently spent eight days in Tokyo and Nagoya with a full schedule of company visits, including many companies currently held in the portfolio. The hotels were busy and staff shortages were evident in some areas of
For further details of the Fund’s invested positions, including country and industry breakdowns and currency exposures, updated monthly, please visit https://www.platinum.com.au/our-products/pjf.
Disposition of Assets
REGION 30 JUN 2019 31 MAR 2019 30 JUN 2018
Japan 84% 76% 90%
Korea 5% 6% 0%
Cash 11% 19% 10%
Shorts -26% -20% -2%
See note 3, page 40. Numbers have been subject to rounding adjustments.Source: Platinum Investment Management Limited.
Net Sector Exposures ^
SECTOR 30 JUN 2019 31 MAR 2019 30 JUN 2018
Consumer Discretionary 20% 14% 14%
Communication Services 19% 17% 10%
Information Technology 12% 11% 17%
Industrials 9% 8% 16%
Materials 7% 6% 9%
Energy 3% 4% 8%
Health Care 3% 3% 5%
Financials 3% 3% 9%
Real Estate <1% <1% 0%
Consumer Staples -2% -5% -1%
Other -10% 0% 0%TOTAL NET EXPOSURE 63% 61% 88%
^ A major GICS reclassification was implemented during the December 2018 quarter. The changes affected the Information Technology, Communication Services (previously Telecommunication Services) and Consumer Discretionary sectors. Historical exposures have been updated for continuity.See note 4, page 40. Numbers have been subject to rounding adjustments.Source: Platinum Investment Management Limited.
Net Currency Exposures
CURRENCY 30 JUN 2019 31 MAR 2019 30 JUN 2018
Japanese yen (JPY) 97% 98% 94%
US dollar (USD) 15% 29% 4%
Korean won (KRW) 3% -7% 0%
Australian dollar (AUD) -16% -20% 2%
See note 5, page 40. Numbers have been subject to rounding adjustments.Source: Platinum Investment Management Limited.
Top 10 Holdings
COMPANY COUNTRY INDUSTRY WEIGHT
Rakuten Inc Japan Cons Discretionary 4.5%
Nintendo Co Ltd Japan Comm Services 4.2%
NTT Japan Comm Services 4.2%
Takeda Pharma Co Japan Health Care 4.1%
KDDI Corporation Japan Comm Services 3.9%
Itochu Corporation Japan Industrials 3.9%
Kangwon Land Korea Cons Discretionary 3.9%
Oracle Japan Japan Info Technology 3.5%
Kyocera Corp Japan Info Technology 3.1%
Japan Physical Gold ETF Japan Materials 3.1%
As at 30 June 2019. See note 6, page 40.Source: Platinum Investment Management Limited.
23THE PLATINUM TRUST QUARTERLY REPORT 30 JUNE 2019
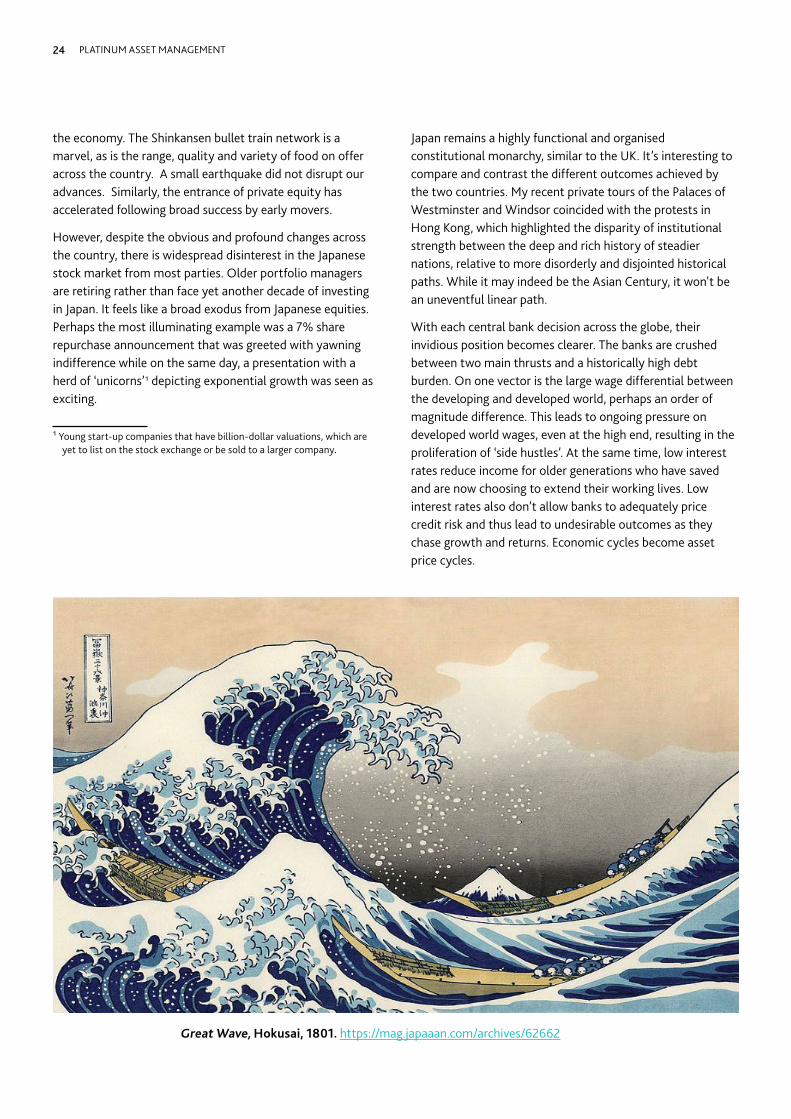
the economy. The Shinkansen bullet train network is a marvel, as is the range, quality and variety of food on offer across the country. A small earthquake did not disrupt our advances. Similarly, the entrance of private equity has accelerated following broad success by early movers.
However, despite the obvious and profound changes across the country, there is widespread disinterest in the Japanese stock market from most parties. Older portfolio managers are retiring rather than face yet another decade of investing in Japan. It feels like a broad exodus from Japanese equities. Perhaps the most illuminating example was a 7% share repurchase announcement that was greeted with yawning indifference while on the same day, a presentation with a herd of ‘unicorns’1 depicting exponential growth was seen as exciting.
1 Young start-up companies that have billion-dollar valuations, which are yet to list on the stock exchange or be sold to a larger company.
Japan remains a highly functional and organised constitutional monarchy, similar to the UK. It’s interesting to compare and contrast the different outcomes achieved by the two countries. My recent private tours of the Palaces of Westminster and Windsor coincided with the protests in Hong Kong, which highlighted the disparity of institutional strength between the deep and rich history of steadier nations, relative to more disorderly and disjointed historical paths. While it may indeed be the Asian Century, it won't be an uneventful linear path.
With each central bank decision across the globe, their invidious position becomes clearer. The banks are crushed between two main thrusts and a historically high debt burden. On one vector is the large wage differential between the developing and developed world, perhaps an order of magnitude difference. This leads to ongoing pressure on developed world wages, even at the high end, resulting in the proliferation of ‘side hustles’. At the same time, low interest rates reduce income for older generations who have saved and are now choosing to extend their working lives. Low interest rates also don’t allow banks to adequately price credit risk and thus lead to undesirable outcomes as they chase growth and returns. Economic cycles become asset price cycles.
Great Wave, Hokusai, 1801. https://mag.japaaan.com/archives/62662
24 PLATINUM ASSET MANAGEMENT

The other dynamic is the broad and ever-present disruption. This was clearly evident throughout our meetings in Japan. PKSHA Technology is selling Artificial Intelligence algorithm chat bots, which can reduce call centre staff by 30%. Toyota is leading its extended group through an extensive program of electrification and automation. Komatsu has led the global industry in driverless mining trucks similar to Rio Tinto’s achievement in automating its Pilbara rail system. Rakuten is building a next-generation network with broad efficiencies, which will lead to disruptive innovation across a wide range of industries. Similarly, CyberAgent (internet media services), Ocado (online grocery supermarket) and ZoZo (online fashion) are building alternatives to existing networks. Robots and factory automation continue to spread. Oracle is bringing cloud computing to the Japanese enterprise market, while Amazon Web Services is now a US $30 billion business, up from US $1.8 billion in 2012, and growing at an unbelievable rate of 40% p.a.. Japanese companies are helping to bring shale gas and liquids to the world in the form of liquefied natural gas (LNG) and low-cost chemicals, while shale oil production continues to grow. Change has been ever-present over the centuries but it has accelerated in recent decades and its effects are far reaching.
OutlookSentiment surrounding the Japanese stock market is undoubtedly weak. Both domestic and international investors are positioned conservatively, and in many cases are completely disengaged. This posture is commensurate with both the current weak global economic environment and the historical context of an almost three decade long bear market.
What is absent so far in this cycle, is complete price and valuation capitulation. Current valuations are not far from prior trough valuations. This is not a baseless conjecture, as the combination of two decades of compounded corporate growth, internal reorganisation and disruptive advances, together with the clearly improved corporate governance environment combine for a completely different outlook compared with prior decades.
The Fund will be taking advantage of any future market weakness to transition the portfolio to being fully invested.
25THE PLATINUM TRUST QUARTERLY REPORT 30 JUNE 2019
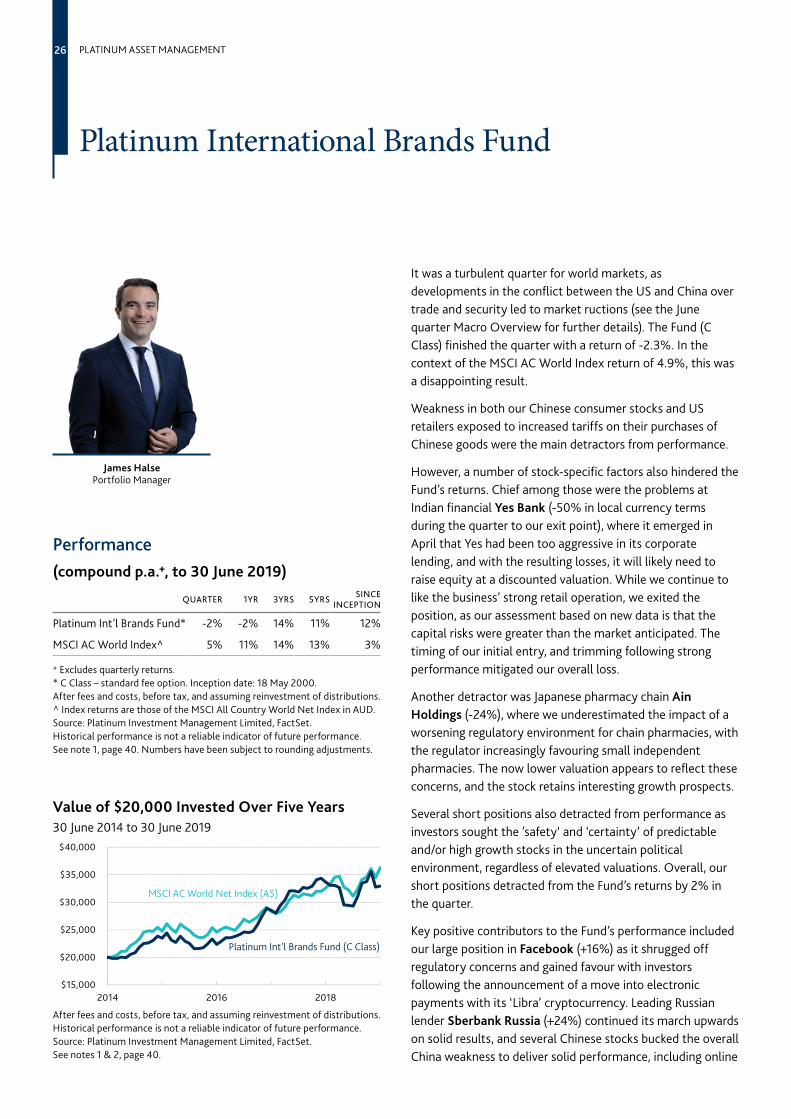
Platinum International Brands Fund
Performance(compound p.a.+, to 30 June 2019)
QUARTER 1YR 3YRS 5YRS SINCE INCEPTION
Platinum Int’l Brands Fund* -2% -2% 14% 11% 12%
MSCI AC World Index^ 5% 11% 14% 13% 3%
+ Excludes quarterly returns.* C Class – standard fee option. Inception date: 18 May 2000.After fees and costs, before tax, and assuming reinvestment of distributions.^ Index returns are those of the MSCI All Country World Net Index in AUD.Source: Platinum Investment Management Limited, FactSet.Historical performance is not a reliable indicator of future performance.See note 1, page 40. Numbers have been subject to rounding adjustments.
Value of $20,000 Invested Over Five Years30 June 2014 to 30 June 2019
After fees and costs, before tax, and assuming reinvestment of distributions.Historical performance is not a reliable indicator of future performance.Source: Platinum Investment Management Limited, FactSet.See notes 1 & 2, page 40.
James HalsePortfolio Manager
$15,000
$20,000
$25,000
$30,000
$35,000
$40,000
2014 2016 2018
MSCI AC World Net Index (A$)
Platinum Int’l Brands Fund (C Class)
It was a turbulent quarter for world markets, as developments in the conflict between the US and China over trade and security led to market ructions (see the June quarter Macro Overview for further details). The Fund (C Class) finished the quarter with a return of -2.3%. In the context of the MSCI AC World Index return of 4.9%, this was a disappointing result.
Weakness in both our Chinese consumer stocks and US retailers exposed to increased tariffs on their purchases of Chinese goods were the main detractors from performance.
However, a number of stock-specific factors also hindered the Fund’s returns. Chief among those were the problems at Indian financial Yes Bank (-50% in local currency terms during the quarter to our exit point), where it emerged in April that Yes had been too aggressive in its corporate lending, and with the resulting losses, it will likely need to raise equity at a discounted valuation. While we continue to like the business’ strong retail operation, we exited the position, as our assessment based on new data is that the capital risks were greater than the market anticipated. The timing of our initial entry, and trimming following strong performance mitigated our overall loss.
Another detractor was Japanese pharmacy chain Ain Holdings (-24%), where we underestimated the impact of a worsening regulatory environment for chain pharmacies, with the regulator increasingly favouring small independent pharmacies. The now lower valuation appears to reflect these concerns, and the stock retains interesting growth prospects.
Several short positions also detracted from performance as investors sought the ’safety‘ and ‘certainty’ of predictable and/or high growth stocks in the uncertain political environment, regardless of elevated valuations. Overall, our short positions detracted from the Fund’s returns by 2% in the quarter.
Key positive contributors to the Fund’s performance included our large position in Facebook (+16%) as it shrugged off regulatory concerns and gained favour with investors following the announcement of a move into electronic payments with its ‘Libra’ cryptocurrency. Leading Russian lender Sberbank Russia (+24%) continued its march upwards on solid results, and several Chinese stocks bucked the overall China weakness to deliver solid performance, including online
26 PLATINUM ASSET MANAGEMENT
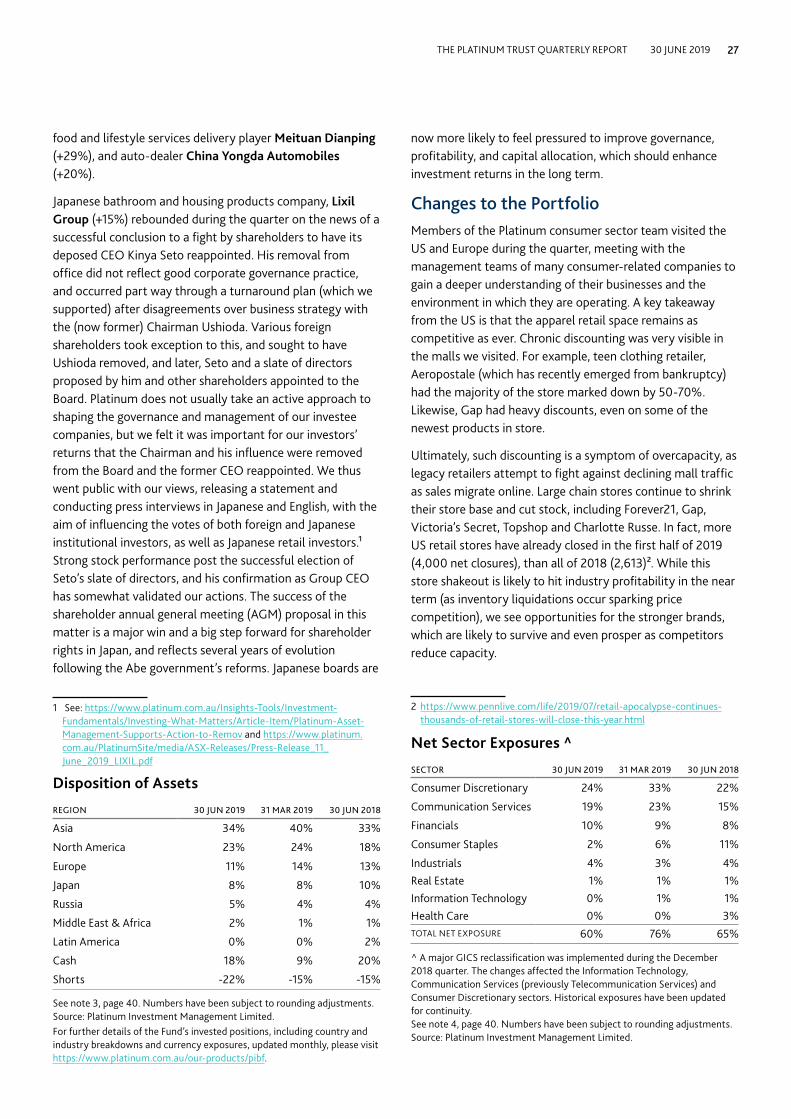
food and lifestyle services delivery player Meituan Dianping (+29%), and auto-dealer China Yongda Automobiles (+20%).
Japanese bathroom and housing products company, Lixil Group (+15%) rebounded during the quarter on the news of a successful conclusion to a fight by shareholders to have its deposed CEO Kinya Seto reappointed. His removal from office did not reflect good corporate governance practice, and occurred part way through a turnaround plan (which we supported) after disagreements over business strategy with the (now former) Chairman Ushioda. Various foreign shareholders took exception to this, and sought to have Ushioda removed, and later, Seto and a slate of directors proposed by him and other shareholders appointed to the Board. Platinum does not usually take an active approach to shaping the governance and management of our investee companies, but we felt it was important for our investors’ returns that the Chairman and his influence were removed from the Board and the former CEO reappointed. We thus went public with our views, releasing a statement and conducting press interviews in Japanese and English, with the aim of influencing the votes of both foreign and Japanese institutional investors, as well as Japanese retail investors.1 Strong stock performance post the successful election of Seto’s slate of directors, and his confirmation as Group CEO has somewhat validated our actions. The success of the shareholder annual general meeting (AGM) proposal in this matter is a major win and a big step forward for shareholder rights in Japan, and reflects several years of evolution following the Abe government’s reforms. Japanese boards are
1 See: https://www.platinum.com.au/Insights-Tools/Investment-Fundamentals/Investing-What-Matters/Article-Item/Platinum-Asset-Management-Supports-Action-to-Remov and https://www.platinum.com.au/PlatinumSite/media/ASX-Releases/Press-Release_11_June_2019_LIXIL.pdf
now more likely to feel pressured to improve governance, profitability, and capital allocation, which should enhance investment returns in the long term.
Changes to the PortfolioMembers of the Platinum consumer sector team visited the US and Europe during the quarter, meeting with the management teams of many consumer-related companies to gain a deeper understanding of their businesses and the environment in which they are operating. A key takeaway from the US is that the apparel retail space remains as competitive as ever. Chronic discounting was very visible in the malls we visited. For example, teen clothing retailer, Aeropostale (which has recently emerged from bankruptcy) had the majority of the store marked down by 50-70%. Likewise, Gap had heavy discounts, even on some of the newest products in store.
Ultimately, such discounting is a symptom of overcapacity, as legacy retailers attempt to fight against declining mall traffic as sales migrate online. Large chain stores continue to shrink their store base and cut stock, including Forever21, Gap, Victoria’s Secret, Topshop and Charlotte Russe. In fact, more US retail stores have already closed in the first half of 2019 (4,000 net closures), than all of 2018 (2,613)2. While this store shakeout is likely to hit industry profitability in the near term (as inventory liquidations occur sparking price competition), we see opportunities for the stronger brands, which are likely to survive and even prosper as competitors reduce capacity.
2 https://www.pennlive.com/life/2019/07/retail-apocalypse-continues-thousands-of-retail-stores-will-close-this-year.html
Net Sector Exposures ^
SECTOR 30 JUN 2019 31 MAR 2019 30 JUN 2018
Consumer Discretionary 24% 33% 22%
Communication Services 19% 23% 15%
Financials 10% 9% 8%
Consumer Staples 2% 6% 11%
Industrials 4% 3% 4%Real Estate 1% 1% 1%Information Technology 0% 1% 1%Health Care 0% 0% 3%TOTAL NET EXPOSURE 60% 76% 65%
^ A major GICS reclassification was implemented during the December 2018 quarter. The changes affected the Information Technology, Communication Services (previously Telecommunication Services) and Consumer Discretionary sectors. Historical exposures have been updated for continuity.See note 4, page 40. Numbers have been subject to rounding adjustments.Source: Platinum Investment Management Limited.
Disposition of Assets
REGION 30 JUN 2019 31 MAR 2019 30 JUN 2018
Asia 34% 40% 33%
North America 23% 24% 18%
Europe 11% 14% 13%
Japan 8% 8% 10%
Russia 5% 4% 4%
Middle East & Africa 2% 1% 1%
Latin America 0% 0% 2%
Cash 18% 9% 20%
Shorts -22% -15% -15%
See note 3, page 40. Numbers have been subject to rounding adjustments.Source: Platinum Investment Management Limited.For further details of the Fund’s invested positions, including country and industry breakdowns and currency exposures, updated monthly, please visit https://www.platinum.com.au/our-products/pibf.
27THE PLATINUM TRUST QUARTERLY REPORT 30 JUNE 2019

Top 10 Holdings
COMPANY COUNTRY INDUSTRY WEIGHT
Facebook Inc US Comm Services 5.4%
Alphabet Inc US Comm Services 4.5%
Meituan Dianping China Cons Discretionary 3.8%
Lixil Group Japan Industrials 3.7%
Alibaba Group China Cons Discretionary 3.2%
Sberbank Russia Russia Financials 3.1%
Autohome Inc China Comm Services 3.1%
Kweichow Moutai China Consumer Staples 3.0%
Zalando Germany Cons Discretionary 2.8%
China ZhengTong Auto China Cons Discretionary 2.8%
As at 30 June 2019. See note 6, page 40.Source: Platinum Investment Management Limited.
Net Currency Exposures
CURRENCY 30 JUN 2019 31 MAR 2019 30 JUN 2018
US dollar (USD) 44% 46% 42%
Euro (EUR) 23% 25% 24%
Hong Kong dollar (HKD) 12% 11% 9%
Chinese yuan (CNY) 6% 7% 5%
Australian dollar (AUD) 6% 0% 7%
Japanese yen (JPY) 4% 4% <1%
Indian rupee (INR) 3% 6% 3%
British pound (GBP) 3% 3% 1%
Norwegian krone (NOK) 3% 3% 3%
Turkish lira (TRY) 2% 1% 0%
Canadian dollar (CAD) 1% 1% 1%
Korean won (KRW) 0% 0% <1%
Sri Lankan rupee (LKR) <1% <1% 1%
Brazilian real (BRL) -2% -1% 2%
Chinese yuan offshore (CNH) -6% -6% 0%
See note 5, page 40. Numbers have been subject to rounding adjustments.Source: Platinum Investment Management Limited.
We added to our position in American Eagle Outfitters (AEO) during the quarter, as we see it being one of the winners in apparel retail. Despite the challenges mentioned, AEO managed to grow its revenue and earnings by 8% in the first quarter of 2019 thanks to its core denim franchise (now the #1 US women’s denim brand/retailer) as well as further expansion of its successful “inclusive” Aerie lingerie sub-brand. This business trades at an enticing earnings yield of roughly 10%.
In accordance with our investment process, we added to many, primarily Chinese, stocks that had experienced sell-offs unjustified by fundamentals, and trimmed many of our stronger performing positions where the stocks had moved closer to our assessment of fundamental value. The latter category included Dutch food delivery marketplace, Takeaway.com (+22% in the quarter), online used-car seller, Carvana (+8%), Yongda, and online fashion retailer, Zalando (+12%).
In addition to exiting our Yes Bank position (discussed above), we also sold our holding in Russian payment platform Qiwi (-12% return from initial acquisition) after reviewing its business mix and in light of other more favourable opportunities in Russia. Additionally, we divested the remainder of our holding in German online real estate and auto classifieds player Scout24 (+26% since initial acquisition) while it was under a takeover bid.
OutlookWith the US economy continuing its record-long expansion, unemployment touching 50-year lows (3.6%)3, near-record high consumer confidence and easy monetary conditions (low inflation, low interest rates), uniformly bullish sentiment across most US consumer companies might be expected. However, the mood across the 25 management teams visited in the US, which sat across a broad suite of consumer categories (travel, leisure, homewares, entertainment, apparel, cosmetics), painted a far more nuanced picture.
The prospect of further tariff increases was arguably the largest concern for most of the management teams, and this may now be weighing on real investment decisions, which could have a flow-on impact on the economy. Signs are also apparent of a weakening in spending amongst high-income earners, likely triggered by President Trump’s tax changes, which cap federal deductions for state and local taxes, and lower the cap on mortgage interest deductions for high value mortgages. This has likely affected property prices as well as the cash flow of higher income earners, particularly in the high-tax, high property-value coastal states.
Given this environment, we remain conservatively positioned at the time of writing, with a net long exposure (after the annual cash distribution) of around 70%. In an increasingly divided stock environment where perceived certainty and/or growth are very highly valued, and uncertainty regarding the future is heavily penalised, we see little attraction in paying more than 30x earnings for market-favourite consumer stocks that only offer stable or low-growth profits. Instead, we prefer to continue our hunt for out-of-favour companies that can surprise on the upside.
3 Source: FactSet, June 2019
28 PLATINUM ASSET MANAGEMENT

Platinum International Health Care Fund
Performance and Changes to the Portfolio(compound p.a.+, to 30 June 2019)
QUARTER 1YR 3YRS 5YRS SINCE INCEPTION
Platinum Int’l HC Fund* -3% 5% 14% 14% 10%
MSCI AC World HC Index^ 3% 15% 10% 14% 9%
+ Excludes quarterly returns.* C Class – standard fee option. Inception date: 10 November 2003.After fees and costs, before tax, and assuming reinvestment of distributions.^ Index returns are those of the MSCI All Country World Health Care Net Index in AUD. Source: Platinum Investment Management Limited, FactSet.Historical performance is not a reliable indicator of future performance.See note 1, page 40. Numbers have been subject to rounding adjustments.
Value of $20,000 Invested Over Five Years30 June 2014 to 30 June 2019
After fees and costs, before tax, and assuming reinvestment of distributions.Historical performance is not a reliable indicator of future performance.Source: Platinum Investment Management Limited, FactSet.See notes 1 & 2, page 40.
During the quarter, investors continued to favour companies in the medical technology (medtech) and tool1 sector, and remain excited about new bio technology (biotech) listings (IPOs) in the US and China. In the US in particular, the trend is towards pre-clinical biotechs with a higher percentage of early-stage investors participating in the listing round (50% vs. 37% in 2016-2018). Consequently, the available free float is limited, resulting in some drastic price moves upon listing. The hope of being part of the next big innovation remains very strong, while several secondary equity offerings require large discounts, highlighting the dichotomy in the biotech market. We have selectively participated in new listings, with a focus on China.
Gene therapy remains a hot topic, while investor fatigue in the area of immune oncology continues. The annual American Society of Clinical Oncology (ASCO) gathering in the US was subdued this year, with limited high-profile immune oncology presentations. The focus has shifted back to mutation-defined cancers, which was further strengthened by the acquisition of Array Biopharma by Pfizer.
Some of the Fund’s short positions, as well as a number of setbacks in our biotechs contributed to the Fund’s disappointing performance over the quarter and the year. Setbacks are part of this sector, while the continued investor bias towards the more expensive medtech and tools sector has also not been helpful.
Quanterix and NanoString Technologies, two companies that focus on disease biomarker detection, provided a strong contribution to annual performance (+133% and +122% respectively, in local currency terms). Both companies are gaining traction with existing and new customers. Swiss company, Roche was also a solid contributor to performance for the year (+28%). The company is managing the loss of exclusivity of its older oncology products well.
Chinese biotech, Zai Lab (+46%) is making good progress with its oncology pipeline in China, while at the same time continuing to license, at very reasonable prices, new pipeline drugs from US biotech companies. Given China’s focus on accelerating the approval of new innovative drugs, Zai Lab is
1 Companies that supply the technologies and instruments for drug discovery and diagnostics
Bianca OgdenPortfolio Manager
$15,000
$20,000
$25,000
$30,000
$35,000
$40,000
$45,000
2014 2016 2018
Platinum Int’l HC Fund (C Class)
MSCI AC World HC Net Index (A$)
29THE PLATINUM TRUST QUARTERLY REPORT 30 JUNE 2019

well positioned to play an important role in the Chinese biotech industry.
During the quarter, we added to a number of our holdings and divested biotechs that had a setback and have to re-adjust their R&D activities.
CommentaryAcquisitions, partnerships and licensing deals are the norm in the biotech and medtech world. They are essential and most of the time make 'strategic sense', but frequently come with a very high price tag or operational issues that are often overlooked. Companies are very quick to offer ‘adjusted profit’ calculations following deals (particularly in biotech) blurring the facts of what really has been spent on external and internal R&D. To us, prudent external capital allocation is as important as internal R&D budgets. A company that has spent years on internal R&D and then acquires a whole new pipeline, is in our view inefficient in managing its own internal R&D engine.
AbbVie’s intentions to acquire Allergan for US$63 bn is a case in point. We have struggled to invest in both of these companies in the past (and at times have actually shorted them) given their reliance on a particular franchise, debt burdens and deal-making track record. AbbVie has a market capitalisation of US$97.1 bn and US$32.6 bn in net debt2, while Allergan has a market capitalisation of US$53.2 bn and $18.9 bn in net debt. Following the deal, the combined entity will have a market cap of about US$125 bn, with roughly US$95 bn in debt and US$17 bn in cash. There are only two
2 AbbVie is estimated to have US$32.9 bn in sales, of which US$18.9 bn will come from Humira (the US patent expires in 2023)
Top 10 Holdings
COMPANY COUNTRY INDUSTRY WEIGHT
SpeeDx Pty Ltd Australia Health Care Providers 3.5%
Sanofi SA France Pharmaceuticals 2.9%
Roche Holding AG Switzerland Pharmaceuticals 2.9%
Telix Pharmaceutical Australia Biotechnology 2.6%
Takeda Pharma Co Japan Pharmaceuticals 2.6%
Quanterix Corp US Life Science 2.5%Zai Lab Ltd China Biotechnology 2.2%NanoString Technologies US Life Science 2.2%
Gilead Sciences Inc US Biotechnology 2.2%
Almirall SA Spain Pharmaceuticals 2.1%
As at 30 June 2019. See note 6, page 40.Source: Platinum Investment Management Limited.
For further details of the Fund’s invested positions, including country and industry breakdowns and currency exposures, updated monthly, please visit https://www.platinum.com.au/our-products/pihcf.
Disposition of Assets
REGION 30 JUN 2019 31 MAR 2019 30 JUN 2018
North America 37% 37% 39%
Europe 27% 24% 34%
Australia 11% 13% 10%
Asia 5% 5% 2%
Japan 5% 4% 4%
Cash 16% 17% 11%
Shorts -6% -8% -1%
See note 3, page 40. Numbers have been subject to rounding adjustments.Source: Platinum Investment Management Limited.
Net Sector Exposures
SECTOR 30 JUN 2019 31 MAR 2019 30 JUN 2018
Health Care 77% 74% 87%
Consumer Staples 1% 1% 0%
Financials 0% 0% 1%TOTAL NET EXPOSURE 78% 75% 88%
See note 4, page 40. Numbers have been subject to rounding adjustments.Source: Platinum Investment Management Limited.
Net Currency Exposures
CURRENCY 30 JUN 2019 31 MAR 2019 30 JUN 2018
US dollar (USD) 50% 51% 44%
Japanese yen (JPY) 17% 16% 4%
Euro (EUR) 10% 10% 20%
Swiss franc (CHF) 8% 7% 5%
British pound (GBP) 7% 8% 10%
Australian dollar (AUD) 3% 2% 12%
Swedish krona (SEK) 2% 2% 2%
Norwegian krone (NOK) 2% 2% 0%
Hong Kong dollar (HKD) 2% 2% 0%
Danish krone (DKK) 1% 1% 1%
Canadian dollar (CAD) <1% <1% 1%
Korean won (KRW) -1% -1% 0%
See note 5, page 40. Numbers have been subject to rounding adjustments.Source: Platinum Investment Management Limited.
other companies with a larger debt burden, General Electric with US$106 bn and Verizon Wireless with US$110 bn. This fact alone has to be taken into consideration.
AbbVie was spun out of Abbott Laboratories in 2013, with the hope that the new entity will be in a better position to focus on diversifying its revenue stream away from Humira, an anti-inflammatory antibody that was approved 17 years ago, and today generates 57% of AbbVie’s sales (which equates to US$18.9 bn in sales this year). The much-hoped
30 PLATINUM ASSET MANAGEMENT

diversification has however, not transpired, despite having the financial resources to do so, with significant cash generated by Humira and higher debt. Since 2013, AbbVie has increased its net debt to US$32.6 bn and invested almost US$26 bn in R&D. It has also completed two significant acquisitions, Pharmacyclics for US$21 bn in 2015 and Stemcentrx in 2016 for US$5.8 bn3. In 2014, AbbVie also made a US$55 bn offer for US/UK, Ireland-domiciled biotech company, Shire but the deal was abandoned due to a change in US tax legislation that no longer 'encouraged' US companies to be domiciled abroad. AbbVie had to pay a US$1.6 bn break-up fee to Shire for pulling out of the deal.
Its investment in R&D, acquisitions and break-up fee amounted to a total outlay of US$54.4 bn over just six years. Along the way, there have been over US$26 bn in buybacks and almost US$28 bn in dividends to placate shareholders.
In terms of new drug launches in that time, AbbVie obtained Imbruvica, a drug for a number of blood cancers via the Pharmacyclics acquisition, and received approval for four more drugs. None of these four drugs are wholly owned by the company and it has to either share profits or pay royalties. There is nothing wrong with licensing or alliance deals, however what is important, is the prices that are paid when these deals occur.
Both AbbVie’s acquisitions, Pharmacyclics and Stemcentrx, stand out. Pharmacyclicis’ blood cancer drug Imbruvica was approved in 2013. Since then it has been a successful drug, but AbbVie has to share the profits with Johnson & Johnson (J&J) who had great foresight in 2011. At that time, Pharmacyclics’ BTK inhibitor (which now has the commercial name of Imbruvica) was in phase 2 trials and seeing its potential, J&J signed a 50/50 alliance with Pharmacyclics for a very modest upfront payment of US$150 million. There were obviously further investment and milestone payments, but it is clear that J&J’s business development team has done very well.
In 2015, AbbVie spent more money acquiring Stemcentrx, a biotech founded in 2008 with a focus on cancer stem cells. Stemcentrx’s valuation was already on the higher side given its well-known investors, but AbbVie was convinced the founders had to be backed. Last year, things started to unravel, with one founder leaving, the lead pipeline asset failing to live up to expectations and in January this year, AbbVie announced a write-off of most of the acquisition cost.
Valuing external assets is crucial and as the Pharmacyclics example shows, some companies are better at it than others are. AbbVie’s capital allocation discipline, in our opinion, is
3 In addition to the US$5.8 bn AbbVie also agreed to pay US$4 bn in future milestones.
more questionable and the Allergan acquisition does not give us confidence things are any different this time. Allergan has been through many changes and it too faces its own set of challenges. In 2014, Valeant set out to acquire Allergan, which did not eventuate; instead, Actavis acquired Allergan in 2015 with the new entity keeping the Allergan name. Allergan’s Botox franchise was (and remains) a key asset, while the plan to source a pipeline of assets externally and efficiently develop them has been less successful. That ‘external R&D’ approach allowed for creative accounting and hence made earnings look promising, but new approvals have been limited. Pfizer must have liked that idea, as well as the Irish domicile, and announced its intention to acquire Allergan in late 2015. The deal did not happen either and Allergan continued on its own journey, selling its generic drugs business to Teva, while continuing to work on its pipeline and expanding its aesthetic franchise. In the end, drug development via licensing turned out to be harder than they anticipated, the share price drifted lower, which together with looming Botox competition and the US opioid crisis, rattled the company. A break-up of the company was on the cards but then along came AbbVie, and Allergan has finally found a new home.
Many deals, such as the AbbVie acquisition of Allergan may look attractive in a spreadsheet, however, in reality it is not that straightforward. Drug development is a difficult business, as the history of both AbbVie and Allergan shows, but despite that, AbbVie is prepared to take on a very large debt burden. Not long ago, AbbVie (and several analysts) sprouted about the long-term sustainability of Humira. We were not convinced then, and neither are we convinced now, that this new entity will be highly innovative.
OutlookAs we have mentioned many times before, innovation in the sector is immense, making it difficult for many generalists to keep up. Many new drug modalities are being tested in the clinic, new diseases are being targeted and on top of that, we have China accelerating new drug approvals. For an investor these are exciting times, but it also requires a firm valuation framework to ensure we balance the risk that is inherent in drug development. Tool companies offer a great way of gaining exposure to many different innovations, while clinical research organisations should also find new opportunities in emerging markets.
The US election next year will increase chatter on the healthcare sector, which should provide some interesting investment opportunities as well.
31THE PLATINUM TRUST QUARTERLY REPORT 30 JUNE 2019

Platinum International Technology Fund
Performance(compound p.a.+, to 30 June 2019)
QUARTER 1YR 3YRS 5YRS SINCE INCEPTION
Platinum Int’l Tech Fund* 3% 5% 14% 11% 9%
MSCI AC World IT Index^ 7% 16% 26% 23% 2%
+ Excludes quarterly returns.* C Class – standard fee option. Inception date: 18 May 2000.After fees and costs, before tax, and assuming reinvestment of distributions.^ Index returns are those of the MSCI All Country World IT Net Index in AUD. Source: Platinum Investment Management Limited, FactSet.Historical performance is not a reliable indicator of future performance.See note 1, page 40. Numbers have been subject to rounding adjustments.
Value of $20,000 Invested Over Five Years30 June 2014 to 30 June 2019
After fees and costs, before tax, and assuming reinvestment of distributions.Historical performance is not a reliable indicator of future performance.Source: Platinum Investment Management Limited, FactSet.See notes 1 & 2, page 40.
Alex BarbiPortfolio Manager
Cameron RobertsonPortfolio Manager
$20,000
$30,000
$40,000
$50,000
$60,000
2014 2016 2018
MSCI AC World IT Net Index (A$)
Platinum Int’l Technology Fund (C Class)
The Fund (C Class) returned 2.6% for the quarter and 4.7% for the financial year ending 30 June. By comparison, the Index returned 6.5% for the quarter and 15.7% for the year.
Due to Index changes over the past year, performance in the technology sector is now strongly influenced by Apple and Microsoft, reflecting their large index weightings of 12% and 13% respectively. In keeping with Platinum’s investment approach, the Fund is managed independently of the Index, and we believe it is prudent risk management to limit stock positions to less than the weightings of the largest index constituents. As a result, the extent to which these two companies’ share prices perform better or worse than average is likely to influence whether the Fund lags or outperforms the Index.
Changes in the Portfolio and CommentaryAs this is the June quarter report, we thought it would be helpful to review the financial year. As usual, over the past 12 months, the team continued to scour the world for good investment opportunities, meeting with over 100 companies in the technology space, as well as partaking in several meetings with industry experts and analysts, and reading innumerable company and industry reports.
The sector as a whole continues to evolve. Cloud computing is growing apace, which is having ramifications across software, hardware, networking equipment, security, and other related areas. In the semiconductor field, the last financial year saw the first commercial scale production of microchips using Extreme Ultra Violet (EUV) technology, which sets the stage for the ongoing miniaturisation of electrical circuits, and the resultant performance and power benefits.
Communications technologies continue to evolve, with early commercial 5G services launched and the first WiFi 6 devices entering the market, both of which facilitate faster data transfer, lower power consumption, more connected devices, and numerous other benefits, putting the foundations in place for smart factories and homes. The rise of electric vehicles continues to gain traction, with sales up more than 40% over the year, and a range of manufacturers entering the fray, with both Jaguar’s I-PACE and Audi’s e-tron making their first customer deliveries during the year. Looking further
32 PLATINUM ASSET MANAGEMENT

afield, drone delivery services are making progress towards widespread commercialisation, with Google’s drone delivery service receiving approval from the aviation regulator for limited commercial operations in Australia (delivery services to include food and drinks, medication and locally-made coffee and chocolate). While in quantum computing, progress appears to be hurtling along, with discussion that ‘quantum supremacy’ (an important, but largely theoretical, milestone) could be achieved within months, which could see computers solve previously unsolvable problems, with significant implications for all facets of life, ranging from science and medicine, to materials and energy in the long term.
Turning to the portfolio, we established positions in a handful of new companies, and exited a range of positions during the year. Regular readers may recall our discussion of newer holdings such as US company Carvana, which is applying the e-commerce model to the used car industry by allowing customers to browse their inventory of over 18,000 cars online and then have the car they choose delivered to their door. Customers love the convenience of the offering, and the business is more than doubling year on year. They are a first mover in this market, tapping into the huge domestic US used car market.
Roku is another relatively new addition to the portfolio. Roku is the leading smart-TV platform in the US, and it is gearing up for international expansion. The company is seeing growth in their platform business in excess of 70% p.a., and we believe they have the potential to be a significantly larger business in the years to come. Criteo is another new and small addition to the portfolio, with a strong position in their advertising technology (ad-tech) niche. This company had fallen out-of-favour with the market, as privacy concerns loomed large over the ad-tech space. The founder has come back to run the business, and new products introduced under his watch are seeing strong early traction. Other new names in the portfolio include companies involved in semiconductor manufacturing equipment, online travel, and smart home security systems. These new holdings replaced companies previously held by the Fund such as, Murata Manufacturing (Japan electronic components), Yangtze Optical Fibre and Cable and Nexon (Japan online and mobile games developer).
During the year, we modestly increased our position in some memory companies, as we have increased conviction that competition is far more rational than in years past following a period of consolidation in the industry, and we believe the market price for those assets is being unduly driven by shorter-term concerns. We also took advantage of the market sell-off leading up to Christmas, adding to positions in companies like Analog Devices, as they continue to benefit
from a great portfolio of products serving smart factories, electric vehicles, 5G, aerospace, and medical diagnostics. Other holdings we added to during the year included software companies, microchip manufacturers, a fibre optic cable manufacturer, and a telecommunications company.
Positions trimmed largely fell into two buckets: the more successful investments where the share price materially appreciated; and those where the investment thesis had not progressed as we expected. The first category includes companies like PayPal, Xilinx (semiconductor) and Twilio. Many readers may not be very familiar with Twilio. This company was introduced to the portfolio less than two years ago, and their core product enables software developers to easily incorporate phone calls, SMS, and other methods of communication into their applications. If you have ever received a call or SMS when using a service like Uber or Airbnb, then there’s a good chance Twilio was powering that communication. Since our initial purchase, Twilio’s shares have more than doubled.
Companies trimmed due to a weakening investment thesis included Bitauto, Nielsen and Nissha. Bitauto is a Chinese online classifieds operation for cars. When we initially invested, we felt the core business could justify the share price, while other assets in their portfolio could have significant option value. In reality, the core business was weaker than we had appreciated, and the ‘option value’ looks increasingly unlikely to yield any material upside. We reduced our position early in the financial year at a modest loss relative to our entry price, and in retrospect we should have sold out completely as our confidence waned. Market data researcher and provider, Nielsen is another holding that has disappointed, currently trading around half the levels where we first bought it for in 2014. At the time of our initial purchase, we felt the market was overly concerned about the health of its TV ratings business. We were largely correct on that front, however, it was actually their other segment, which provides data services to consumer goods companies, that disappointed. We expected this segment to be stable, however Nielsen’s customers have experienced competitive pressure and cut costs in an attempt to defend their margins, resulting in sales headwinds for Nielsen. We reduced the position early in the financial year, and the stock has since de-rated further, although we feel at the current price the market is too harsh in its assessment of the businesses’ value, so have retained a small position.
Other significant positive contributors over the past year included our holdings in Constellation Software, Oracle, Cisco, Schibsted (online classifieds) and Microsoft. Other detractors over the past year included our holdings in SINA (online and mobile media), ams (analogue semiconductors)
33THE PLATINUM TRUST QUARTERLY REPORT 30 JUNE 2019
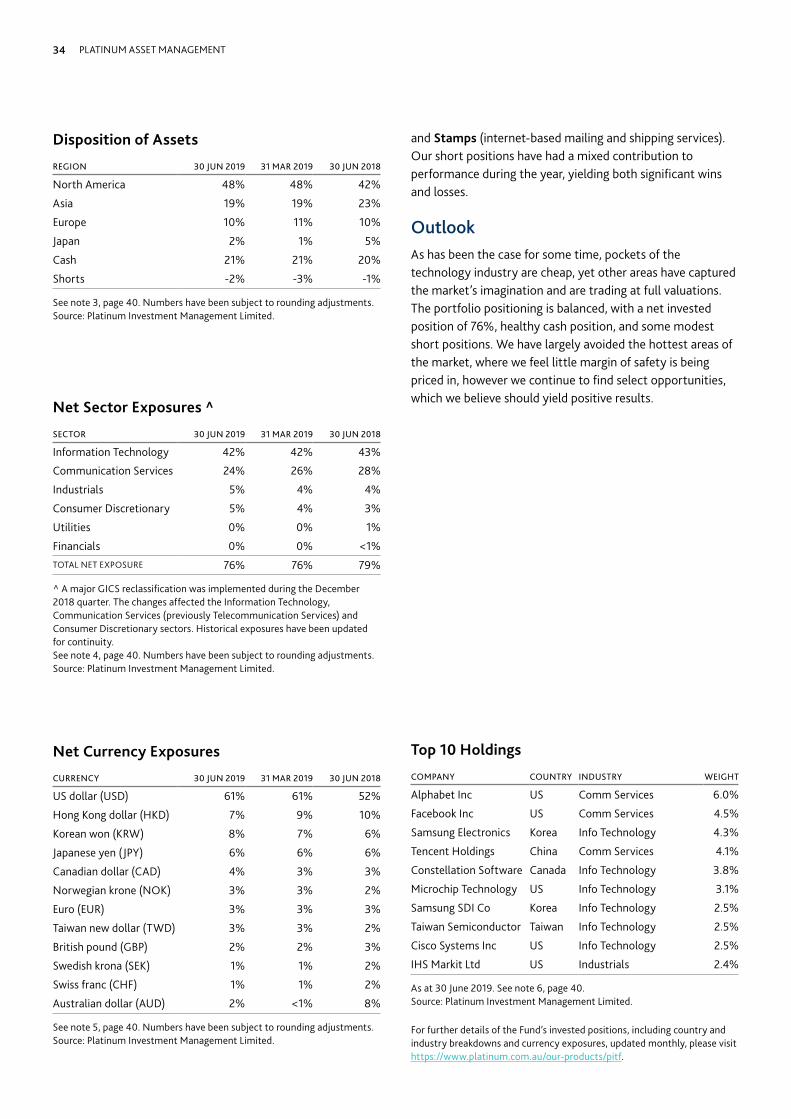
Top 10 Holdings
COMPANY COUNTRY INDUSTRY WEIGHT
Alphabet Inc US Comm Services 6.0%
Facebook Inc US Comm Services 4.5%
Samsung Electronics Korea Info Technology 4.3%
Tencent Holdings China Comm Services 4.1%
Constellation Software Canada Info Technology 3.8%
Microchip Technology US Info Technology 3.1%
Samsung SDI Co Korea Info Technology 2.5%
Taiwan Semiconductor Taiwan Info Technology 2.5%
Cisco Systems Inc US Info Technology 2.5%
IHS Markit Ltd US Industrials 2.4%
As at 30 June 2019. See note 6, page 40.Source: Platinum Investment Management Limited.
Net Sector Exposures ^
SECTOR 30 JUN 2019 31 MAR 2019 30 JUN 2018
Information Technology 42% 42% 43%
Communication Services 24% 26% 28%
Industrials 5% 4% 4%
Consumer Discretionary 5% 4% 3%
Utilities 0% 0% 1%
Financials 0% 0% <1%TOTAL NET EXPOSURE 76% 76% 79%
^ A major GICS reclassification was implemented during the December 2018 quarter. The changes affected the Information Technology, Communication Services (previously Telecommunication Services) and Consumer Discretionary sectors. Historical exposures have been updated for continuity.See note 4, page 40. Numbers have been subject to rounding adjustments.Source: Platinum Investment Management Limited.
and Stamps (internet-based mailing and shipping services). Our short positions have had a mixed contribution to performance during the year, yielding both significant wins and losses.
OutlookAs has been the case for some time, pockets of the technology industry are cheap, yet other areas have captured the market’s imagination and are trading at full valuations. The portfolio positioning is balanced, with a net invested position of 76%, healthy cash position, and some modest short positions. We have largely avoided the hottest areas of the market, where we feel little margin of safety is being priced in, however we continue to find select opportunities, which we believe should yield positive results.
For further details of the Fund’s invested positions, including country and industry breakdowns and currency exposures, updated monthly, please visit https://www.platinum.com.au/our-products/pitf.
Net Currency Exposures
CURRENCY 30 JUN 2019 31 MAR 2019 30 JUN 2018
US dollar (USD) 61% 61% 52%
Hong Kong dollar (HKD) 7% 9% 10%
Korean won (KRW) 8% 7% 6%
Japanese yen (JPY) 6% 6% 6%
Canadian dollar (CAD) 4% 3% 3%
Norwegian krone (NOK) 3% 3% 2%
Euro (EUR) 3% 3% 3%
Taiwan new dollar (TWD) 3% 3% 2%
British pound (GBP) 2% 2% 3%
Swedish krona (SEK) 1% 1% 2%
Swiss franc (CHF) 1% 1% 2%
Australian dollar (AUD) 2% <1% 8%
See note 5, page 40. Numbers have been subject to rounding adjustments.Source: Platinum Investment Management Limited.
Disposition of Assets
REGION 30 JUN 2019 31 MAR 2019 30 JUN 2018
North America 48% 48% 42%
Asia 19% 19% 23%
Europe 10% 11% 10%
Japan 2% 1% 5%
Cash 21% 21% 20%
Shorts -2% -3% -1%
See note 3, page 40. Numbers have been subject to rounding adjustments.Source: Platinum Investment Management Limited.
34 PLATINUM ASSET MANAGEMENT

Glossary
Dividend yield
A ratio that indicates how much a company pays out in dividends each year relative to its share price.
Earnings yield
A company’s earnings per share over a 12-month period divided by its share price and expressed as a percentage, the earnings yield is the reciprocal of the price-to-earnings (P/E) ratio and is a measure of the rate of return on an equity investment.
Enterprise value (EV)
A measure of a company's total market value, EV equals to a company's market capitalisation plus net debt, minority interest and preferred equity, minus cash and cash equivalents.
Price-to-book ratio (P/B)
The ratio of a company’s current share price to its book value (total assets minus intangible assets and liabilities). It is an indicator of the value of a company by comparing its share price to the amount of the company’s assets that each share is entitled to.
Price-to-earnings ratio (P/E)
The ratio of a company’s current share price to its per-share earnings, P/E is used as an indicator of the value of a company by comparing its share price to the amount of per-share earnings the company generates. A high P/E ratio suggests that the company’s share price is expensive relative to the company’s profits, which usually implies that investors are expecting the company’s future profits to grow quickly.
Price-to-sales ratio (P/S)
The ratio that compares a company’s current share price to its revenue, P/S is an indicator of the value placed on each dollar of a company’s sales and is typically calculated by dividing the company’s market capitalisation by its total sales over a 12-month period.
Profit margin
A measure of a company’s profitability, profit margin (also called net margin) is the ratio of net profits to net sales. It is typically expressed as a percentage that shows how much of each dollar of revenue earned by the company is translated into profits.
Purchasing Managers’ Index (PMI)
The PMI is an indicator of the economic health of the manufacturing sector. It is derived from monthly surveys of purchasing executives at private sector companies and is based on five major indicators: new orders, inventory levels, production, supplier deliveries and employment environment. A PMI reading of greater than 50 indicates expansion of the manufacturing sector when compared to the previous month, while a reading of under 50 represents a contraction and a reading at 50 indicates no change.
Return on capital employed (RoCE)
RoCE is a measure of a company’s profitability and the efficiency with which its capital (which includes both equity and long-term debt) is employed. It is calculated as earnings before interest and tax (EBIT) divided by capital employed, where “capital employed” represents the sum of shareholders’ equity and the long-term liabilities. The higher a company’s RoCE ratio, the more efficient its use of capital.
Yield
Yield refers to the income generated from an investment (such as the interest from cash deposits, the dividends from a shareholding, or the rent from a property investment), usually expressed as an annual percentage rate based on the cost of the investment (known as cost yield) or its market price (known as current yield).
For bonds, the yield is the same as the coupon rate (assuming the bond is purchased at par or is trading at par). Any increase or decrease of the yield relative to the coupon rate is approximately inversely proportional to any change in the bond price (yields fall as prices rise, and vice-versa).
Yield curve
A yield curve plots the interest rates (or yields) of comparable debt instruments with different maturities. Starting on the left with the yields of shorter-term instruments, the curve typically slopes upwards to the right, reflecting investors’ desire to be compensated for the uncertainty associated with locking their money away for longer periods of time.
An inverted yield curve occurs when longer-term debt instruments have a lower yield than shorter-term debt instruments, reflecting expectations of weaker economic conditions – and hence lower interest rates – in the future.
35THE PLATINUM TRUST QUARTERLY REPORT 30 JUNE 2019

On 25 April 2015, a 7.8 magnitude earthquake devastated Nepal, resulting in nearly 9,000 fatalities and injuring more than 22,000 people. While the country has been slowly rebuilding, the local community still desperately needs assistance, particularly with the most basic and essential necessity of all – safe housing.
I had always wanted to contribute and give back to the community in a more tangible way than sending money. The opportunity to help the Nepalese to rebuild their lives through Habitat for Humanity ticked all the boxes - and I hope it will be the first of many more experiences to come.
I was privileged to be part of a ‘house build’ team that consisted of 22 diverse, nice-natured, good-humoured and grounded individuals from all ‘walks of life’. We forged long-lasting friendships.
Habitat for Humanity Australia
Platinum’s Human Resources Manager, Kelley Gibson was fortunate to participate in the Habitat for Humanity Australia program in March this year.The program is part of Habitat for Humanity, an international not-for-profit organisation, which has helped to provide more than 22 million people in over 70 countries with safe and decent housing, as well as strength, stability and independence to build better lives.
Kelley provides her thoughts and highlights of the “once-in-a-lifetime” experience below.
Before leaving Kathmandu and embarking on our home build experience, we participated in a cooking class with another not-for-profit organisation, Seven Women. Established in 2007, the Seven Women charity, established by Australian, Stephanie Woollard, supports thousands of disadvantaged and marginalised women in Nepal, by providing them with the learning skills to sustain their lives, support their families and contribute back to their local communities.1
The views of the Himalayas on our 90-minute road trip to Dhulikhel in the Kavre district were breathtaking. The village where we were helping to build a house was a 45-minute hair-raising journey along the Lhasa trade route, which is a single lane dual highway congested with buses, trucks, motorbikes, pedestrians, cows and cars.
Prior to commencing the build, we learnt more about Habitat for Humanity Nepal and the role it plays in partnering with the government in supporting families and helping to rebuild communities. Our role in the house build involved bricklaying, brick moving and mortar mixing (by hand).
Given the size of our group, we had two homes to build: a single-room home for an 89-year old lady; and a two-room home for a family of seven, with a total area of approximately 45 square metres (sqm) – about one fifth the size of the average new Australian home.2 As we were volunteers, we were only allowed to build our two houses 12 brick rows high
1 https://sevenwomen.org/
2 In 2018, the average new Australian freestanding home was 230 sqm. Source: CommSec, ABS https://www.commsec.com.au/content/dam/EN/ResearchNews/2018Reports/November/ECO_Insights_191118_CommSec-Home-Size.pdf
The view of the Himalayas on our journey to Dhulikhel
36 PLATINUM ASSET MANAGEMENT

(i.e. windowsill level), with the two homes to be finished by local masons after we departed. It takes around two months for the whole build to be completed.
Making a ‘hands-on’ contribution to the families and the community is hard to capture in words. it’s easy to make a monetary donation, but the manual labour of laying bricks and mixing mortar was surprisingly rewarding. The joy of receiving approval by our site mason for each brick row laid increased with intensity, the more experienced we became. The ultimate approval for a brick row laid with no required adjustments was only given twice!
We worked alongside the family members and other people in the community. They supported us at various intervals of the build, whether it be carrying 20+ bricks on material hung over their head, ferrying water from the village’s central source or cooking amazing vegetable curries and dishes to feed the hungry workers – we were incredibly well looked after.
There was a handover ceremony to the families at the completion of our part of the house build, with a dedication ceremony followed by flower garlands and gifts presented to all team members, which was humbling.
On leaving Nepal, I realised that the Habitat for Humanity program wasn’t just about building safe houses for families and communities, but it also plays an integral role in breaking the cycle of poverty for families and future generations. Having a roof over their head, allows them to direct their income to other areas in the community, helping it to prosper and grow.
I would recommend the experience to anyone who is keen and able to participate in such a program. The opportunity to contribute to those who have lost so much and endured such hardships in such primitive conditions, but are still able to smile and laugh, is truly heartwarming.
Volunteers were responsible for bricklaying
One of the homes was built for an 89-year old woman.Kelley Gibson and a volunteer with the family of seven who received a new home.
37THE PLATINUM TRUST QUARTERLY REPORT 30 JUNE 2019
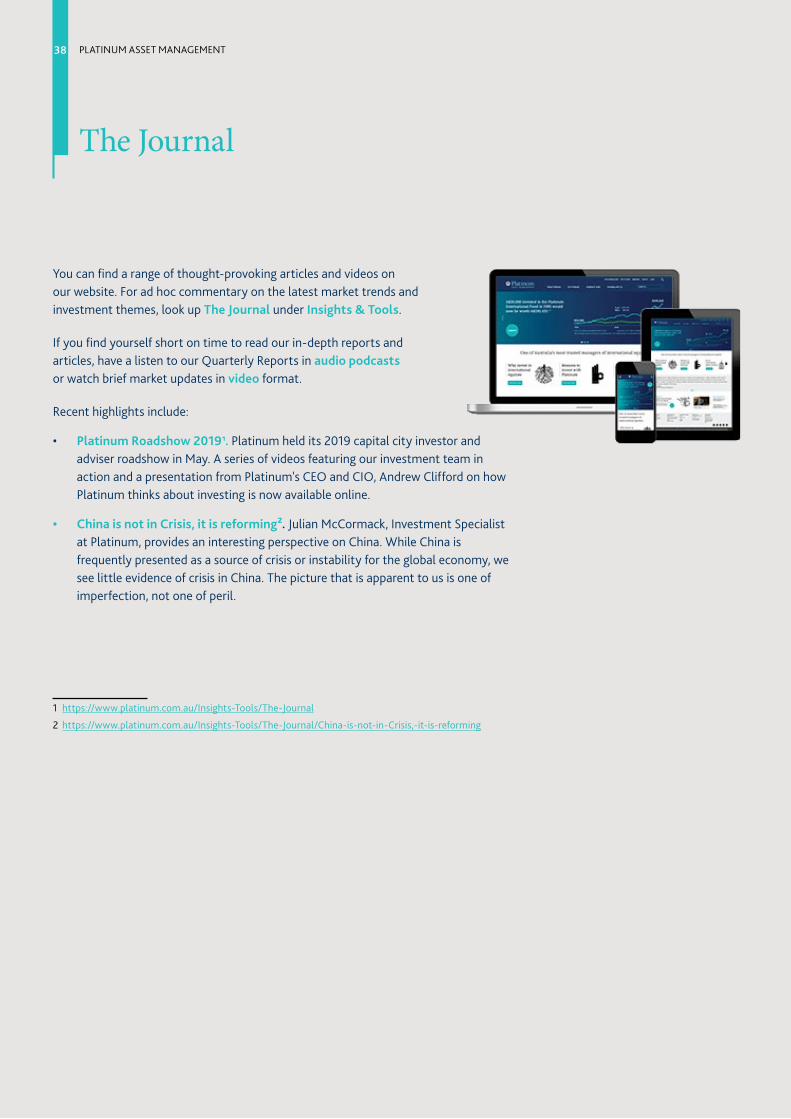
The Journal
You can find a range of thought-provoking articles and videos on our website. For ad hoc commentary on the latest market trends and investment themes, look up The Journal under Insights & Tools.
If you find yourself short on time to read our in-depth reports and articles, have a listen to our Quarterly Reports in audio podcasts or watch brief market updates in video format.
Recent highlights include:
• Platinum Roadshow 20191. Platinum held its 2019 capital city investor and adviser roadshow in May. A series of videos featuring our investment team in action and a presentation from Platinum's CEO and CIO, Andrew Clifford on how Platinum thinks about investing is now available online.
• China is not in Crisis, it is reforming2. Julian McCormack, Investment Specialist at Platinum, provides an interesting perspective on China. While China is frequently presented as a source of crisis or instability for the global economy, we see little evidence of crisis in China. The picture that is apparent to us is one of imperfection, not one of peril.
1 https://www.platinum.com.au/Insights-Tools/The-Journal
2 https://www.platinum.com.au/Insights-Tools/The-Journal/China-is-not-in-Crisis,-it-is-reforming
38 PLATINUM ASSET MANAGEMENT

Some Light Relief
39THE PLATINUM TRUST QUARTERLY REPORT 30 JUNE 2019

Notes1. Fund returns are calculated using the net asset value (NAV) unit price
(which does not include the buy/sell spread) of the stated unit class of the Fund and represent the combined income and capital returns of the stated unit class over the specified period. Fund returns are net of fees and costs, are pre-tax, and assume the reinvestment of distributions. Returns for P Class are net of any accrued investment performance fee.
The MSCI Index returns are in Australian Dollars and are inclusive of net official dividends, but do not reflect fees or expenses. For the purpose of calculating the “since inception” returns of the MSCI Index, the inception date of C Class of the Fund is used. Where applicable, the gross MSCI Index was used prior to 31 December 1998 as the net MSCI Index did not exist then. Fund returns are provided by Platinum Investment Management Limited; MSCI index returns are sourced from FactSet.
Platinum does not invest by reference to the weightings of the Index. A Fund’s underlying assets are chosen through Platinum’s bottom-up investment process and, as a result, the Fund’s holdings may vary considerably to the make-up of the Index that is used as its reference benchmark. Index returns are provided as a reference only.
The investment returns shown are historical and no warranty can be given for future performance. Historical performance is not a reliable indicator of future performance. Due to the volatility in the Fund’s underlying assets and other risk factors associated with investing, investment returns can be negative, particularly in the short-term.
The stated portfolio values of C Class and P Class of the Platinum International Fund (PIF) do not include funds invested in PIF by the Platinum International Fund (Quoted Managed Hedge Fund), a feeder fund that invests primarily in PIF. The stated portfolio values of C Class and P Class of the Platinum Asia Fund (PAF) do not include funds invested in PAF by the Platinum Asia Fund (Quoted Managed Hedge Fund), a feeder fund that invests primarily in PAF.
2. The investment returns depicted in this graph are cumulative on A$20,000 invested in C Class (standard fee option) of the specified Fund over the specified period relative to the specified net MSCI Index in Australian Dollars.
3. The geographic disposition of assets (i.e. the positions listed other than “cash” and “shorts”) represents, as a percentage of the Fund’s net asset value, the Fund’s exposures to the relevant countries/regions through direct securities holdings and long derivatives of stocks and indices.
4. The table shows, as a percentage of the Fund’s net asset value, the Fund’s exposures to the relevant sectors through direct securities holdings as well as both long and short derivatives of stocks and indices. In the case of the Platinum Unhedged Fund, the Fund does not undertake any short-selling. Its net exposures are therefore the same as its long exposures.
5. The table shows the effective net currency exposures of the Fund’s portfolio as a percentage of the Fund’s net asset value, taking into account the Fund’s currency exposures through securities holdings, cash, forwards, and derivatives. The table may not exhaustively list all of the Fund’s currency exposures and may omit some minor exposures.
6. The table shows the Fund’s top 10 long equity positions as a percentage of the Fund’s net asset value, taking into account direct securities holdings and long stock derivatives. The designation “China” in the “Country” column means that the company’s business is predominantly based in mainland China, regardless of whether the company’s securities are listed on exchanges within mainland China or on exchanges outside of mainland China.
DisclaimersThis publication has been prepared by Platinum Investment Management Limited ABN 25 063 565 006 AFSL 221935, trading as Platinum Asset Management (Platinum®). Platinum is the responsible entity and issuer of units in the Platinum Trust® Funds (the “Funds”). This publication contains general information only and is not intended to provide any person with financial advice. It does not take into account any person’s (or class of persons’) investment objectives, financial situation or needs, and should not be used as the basis for making investment, financial or other decisions. You should read the entire Product Disclosure Statement (including any Supplement(s) thereto) for the Platinum Trust® Funds (“PDS”) and consider your particular investment objectives, financial situation and needs before making any investment decision to invest in (or divest from) a Fund. You can obtain a copy of the current PDS from Platinum’s website, www.platinum.com.au or by phoning 1300 726 700 (within Australia), 0800 700 726 (within New Zealand) or +61 2 9255 7500, or by emailing to [email protected]. You should also obtain professional advice before making an investment decision.
Neither Platinum nor any company in the Platinum Group®, including any of their directors, officers or employees (collectively, “Platinum Persons”), guarantee the performance of any of the Funds, the repayment of capital, or the payment of income. The Platinum Group means Platinum Asset Management Limited ABN 13 050 064 287 and all of its subsidiaries and associated entities (including Platinum). To the extent permitted by law, no liability is accepted by any Platinum Person for any loss or damage as a result of any reliance on this information. This publication reflects Platinum’s views and beliefs at the time of preparation, which are subject to change without notice. No representations or warranties are made by any Platinum Person as to their accuracy or reliability. This publication may contain forward-looking statements regarding Platinum’s intent, beliefs or current expectations with respect to market conditions. Readers are cautioned not to place undue reliance on these forward-looking statements. No Platinum Person undertakes any obligation to revise any such forward-looking statements to reflect events and circumstances after the date hereof.
Some numerical figures in this publication have been subject to rounding adjustments. References to individual stock or index performance are in local currency terms, unless otherwise specified.
© Platinum Investment Management Limited 2019. All rights reserved.
MSCI Inc DisclaimerAll data where MSCI is referenced is the property of MSCI Inc. No use or distribution of this data is permitted without the written consent of MSCI Inc. This data is provided “as is” without any warranties by MSCI Inc. MSCI Inc assumes no liability for or in connection with this data. Please see full MSCI Inc disclaimer at www.platinum.com.au/Terms-Conditions.
40 PLATINUM ASSET MANAGEMENT
Platinum Asset Management is a Sydney-based manager specialising in international equities. The investment team uses a thematic stock-picking approach that concentrates on identifying out-of-favour stocks with the objective of achieving superior returns for our clients. We pay no heed to recognised indices. We aim to protect against loss and will hedge stocks, indices and currencies in our endeavours to do so.
The firm was founded in February 1994 by a group of professionals who had built an enviable reputation. The investment team has grown steadily and Platinum now manages nearly A$25 billion. Platinum’s ultimate holding company, Platinum Asset Management Limited (ASX code: PTM), listed on the ASX in May 2007, and Platinum’s staff continue to have relevant interests in the majority of PTM’s issued shares.
Since inception, the Platinum International Fund has achieved superior returns to those of the MSCI AC World Net Index (A$)* and considerably more than interest rates on cash.
Investor services numbers
Monday to Friday, 8.30am – 6.00pm AEST
1300 726 7000800 700 726New Zealand only
Or visit us at our office
Level 8, 7 Macquarie Place, Sydney
* Please refer to page 2.
About us

Level 8, 7 Macquarie PlaceSydney NSW 2000
GPO Box 2724Sydney NSW 2001
Telephone1300 726 700 or +61 2 9255 75000800 700 726 (New Zealand only)
Facsimile+61 2 9254 5590
Websitewww.platinum.com.au
Related Documents