Quarterly report on the results for the fourth quarter and full year ended March 31, 2011 Bharti Airtel Limited (Incorporated as a public limited company on July 7, 1995 under the Companies Act, 1956) Bharti Crescent, 1, Nelson Mandela Road, Vasant Kunj, Phase II, New Delhi – 110 070, India May 05, 2011 The financial statements included in this quarterly report fairly presents in all material respects the financial condition, results of operations, cash flows of the company as of, and for the periods presented in this report. | Mobile Services I Telemedia Services I Enterprise Services | Digital TV Services |

Welcome message from author
This document is posted to help you gain knowledge. Please leave a comment to let me know what you think about it! Share it to your friends and learn new things together.
Transcript
Quarterly report on the results for the fourth quarter and full year ended March 31, 2011
Bharti Airtel Limited
(Incorporated as a public limited company on July 7, 1995 under the Companies Act, 1956) Bharti Crescent, 1, Nelson Mandela Road, Vasant Kunj, Phase II, New Delhi – 110 070, India
May 05, 2011
The financial statements included in this quarterly report fairly presents in all material respects the financial condition, results of operations, cash flows of the company as of, and for the periods presented in this report.
| Mobile Services I Telemedia Services I Enterprise Services | Digital TV Services |
Page 2 of 49
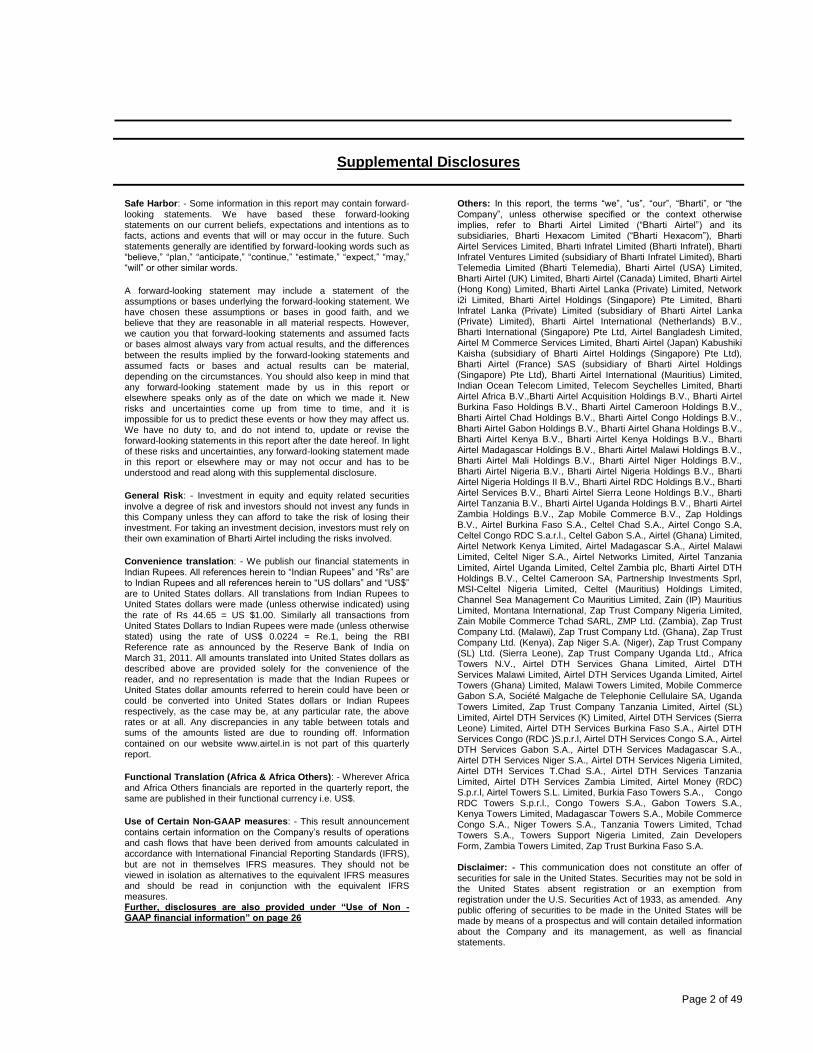
Supplemental Disclosures
Safe Harbor: - Some information in this report may contain forward-looking statements. We have based these forward-looking statements on our current beliefs, expectations and intentions as to facts, actions and events that will or may occur in the future. Such statements generally are identified by forward-looking words such as “believe,” “plan,” “anticipate,” “continue,” “estimate,” “expect,” “may,” “will” or other similar words.
A forward-looking statement may include a statement of the assumptions or bases underlying the forward-looking statement. We have chosen these assumptions or bases in good faith, and we believe that they are reasonable in all material respects. However, we caution you that forward-looking statements and assumed facts or bases almost always vary from actual results, and the differences
between the results implied by the forward-looking statements and assumed facts or bases and actual results can be material, depending on the circumstances. You should also keep in mind that any forward-looking statement made by us in this report or elsewhere speaks only as of the date on which we made it. New risks and uncertainties come up from time to time, and it is impossible for us to predict these events or how they may affect us. We have no duty to, and do not intend to, update or revise the forward-looking statements in this report after the date hereof. In light of these risks and uncertainties, any forward-looking statement made in this report or elsewhere may or may not occur and has to be understood and read along with this supplemental disclosure.
General Risk: - Investment in equity and equity related securities involve a degree of risk and investors should not invest any funds in this Company unless they can afford to take the risk of losing their investment. For taking an investment decision, investors must rely on their own examination of Bharti Airtel including the risks involved.
Convenience translation: - We publish our financial statements in Indian Rupees. All references herein to “Indian Rupees” and “Rs” are to Indian Rupees and all references herein to “US dollars” and “US$” are to United States dollars. All translations from Indian Rupees to United States dollars were made (unless otherwise indicated) using the rate of Rs 44.65 = US $1.00. Similarly all transactions from United States Dollars to Indian Rupees were made (unless otherwise stated) using the rate of US$ 0.0224 = Re.1, being the RBI Reference rate as announced by the Reserve Bank of India on March 31, 2011. All amounts translated into United States dollars as described above are provided solely for the convenience of the reader, and no representation is made that the Indian Rupees or United States dollar amounts referred to herein could have been or could be converted into United States dollars or Indian Rupees respectively, as the case may be, at any particular rate, the above rates or at all. Any discrepancies in any table between totals and sums of the amounts listed are due to rounding off. Information contained on our website www.airtel.in is not part of this quarterly report.
Functional Translation (Africa & Africa Others): - Wherever Africa and Africa Others financials are reported in the quarterly report, the same are published in their functional currency i.e. US$.
Use of Certain Non-GAAP measures: - This result announcement contains certain information on the Company‟s results of operations and cash flows that have been derived from amounts calculated in accordance with International Financial Reporting Standards (IFRS), but are not in themselves IFRS measures. They should not be viewed in isolation as alternatives to the equivalent IFRS measures and should be read in conjunction with the equivalent IFRS measures. Further, disclosures are also provided under “Use of Non - GAAP financial information” on page 26
Others: In this report, the terms “we”, “us”, “our”, “Bharti”, or “the Company”, unless otherwise specified or the context otherwise implies, refer to Bharti Airtel Limited (“Bharti Airtel”) and its subsidiaries, Bharti Hexacom Limited (“Bharti Hexacom”), Bharti Airtel Services Limited, Bharti Infratel Limited (Bharti Infratel), Bharti Infratel Ventures Limited (subsidiary of Bharti Infratel Limited), Bharti Telemedia Limited (Bharti Telemedia), Bharti Airtel (USA) Limited, Bharti Airtel (UK) Limited, Bharti Airtel (Canada) Limited, Bharti Airtel (Hong Kong) Limited, Bharti Airtel Lanka (Private) Limited, Network i2i Limited, Bharti Airtel Holdings (Singapore) Pte Limited, Bharti Infratel Lanka (Private) Limited (subsidiary of Bharti Airtel Lanka (Private) Limited), Bharti Airtel International (Netherlands) B.V., Bharti International (Singapore) Pte Ltd, Airtel Bangladesh Limited, Airtel M Commerce Services Limited, Bharti Airtel (Japan) Kabushiki Kaisha (subsidiary of Bharti Airtel Holdings (Singapore) Pte Ltd), Bharti Airtel (France) SAS (subsidiary of Bharti Airtel Holdings (Singapore) Pte Ltd), Bharti Airtel International (Mauritius) Limited, Indian Ocean Telecom Limited, Telecom Seychelles Limited, Bharti Airtel Africa B.V.,Bharti Airtel Acquisition Holdings B.V., Bharti Airtel Burkina Faso Holdings B.V., Bharti Airtel Cameroon Holdings B.V., Bharti Airtel Chad Holdings B.V., Bharti Airtel Congo Holdings B.V., Bharti Airtel Gabon Holdings B.V., Bharti Airtel Ghana Holdings B.V., Bharti Airtel Kenya B.V., Bharti Airtel Kenya Holdings B.V., Bharti Airtel Madagascar Holdings B.V., Bharti Airtel Malawi Holdings B.V., Bharti Airtel Mali Holdings B.V., Bharti Airtel Niger Holdings B.V., Bharti Airtel Nigeria B.V., Bharti Airtel Nigeria Holdings B.V., Bharti Airtel Nigeria Holdings II B.V., Bharti Airtel RDC Holdings B.V., Bharti Airtel Services B.V., Bharti Airtel Sierra Leone Holdings B.V., Bharti Airtel Tanzania B.V., Bharti Airtel Uganda Holdings B.V., Bharti Airtel Zambia Holdings B.V., Zap Mobile Commerce B.V., Zap Holdings B.V., Airtel Burkina Faso S.A., Celtel Chad S.A., Airtel Congo S.A, Celtel Congo RDC S.a.r.l., Celtel Gabon S.A., Airtel (Ghana) Limited, Airtel Network Kenya Limited, Airtel Madagascar S.A., Airtel Malawi Limited, Celtel Niger S.A., Airtel Networks Limited, Airtel Tanzania Limited, Airtel Uganda Limited, Celtel Zambia plc, Bharti Airtel DTH Holdings B.V., Celtel Cameroon SA, Partnership Investments Sprl, MSI-Celtel Nigeria Limited, Celtel (Mauritius) Holdings Limited, Channel Sea Management Co Mauritius Limited, Zain (IP) Mauritius Limited, Montana International, Zap Trust Company Nigeria Limited, Zain Mobile Commerce Tchad SARL, ZMP Ltd. (Zambia), Zap Trust Company Ltd. (Malawi), Zap Trust Company Ltd. (Ghana), Zap Trust Company Ltd. (Kenya), Zap Niger S.A. (Niger), Zap Trust Company (SL) Ltd. (Sierra Leone), Zap Trust Company Uganda Ltd., Africa Towers N.V., Airtel DTH Services Ghana Limited, Airtel DTH Services Malawi Limited, Airtel DTH Services Uganda Limited, Airtel Towers (Ghana) Limited, Malawi Towers Limited, Mobile Commerce Gabon S.A, Société Malgache de Telephonie Cellulaire SA, Uganda Towers Limited, Zap Trust Company Tanzania Limited, Airtel (SL) Limited, Airtel DTH Services (K) Limited, Airtel DTH Services (Sierra Leone) Limited, Airtel DTH Services Burkina Faso S.A., Airtel DTH Services Congo (RDC )S.p.r.l, Airtel DTH Services Congo S.A., Airtel DTH Services Gabon S.A., Airtel DTH Services Madagascar S.A., Airtel DTH Services Niger S.A., Airtel DTH Services Nigeria Limited, Airtel DTH Services T.Chad S.A., Airtel DTH Services Tanzania Limited, Airtel DTH Services Zambia Limited, Airtel Money (RDC) S.p.r.l, Airtel Towers S.L. Limited, Burkia Faso Towers S.A. , Congo RDC Towers S.p.r.l., Congo Towers S.A., Gabon Towers S.A., Kenya Towers Limited, Madagascar Towers S.A., Mobile Commerce Congo S.A., Niger Towers S.A., Tanzania Towers Limited, Tchad Towers S.A., Towers Support Nigeria Limited, Zain Developers Form, Zambia Towers Limited, Zap Trust Burkina Faso S.A. Disclaimer: - This communication does not constitute an offer of securities for sale in the United States. Securities may not be sold in the United States absent registration or an exemption from registration under the U.S. Securities Act of 1933, as amended. Any public offering of securities to be made in the United States will be made by means of a prospectus and will contain detailed information about the Company and its management, as well as financial statements.
Page 3 of 49
TABLE OF CONTENTS
Section 1 Bharti Airtel – Performance at a glance 4
Section 2 An Overview 5
Section 3 Financial Highlights as per IFRS
3.1 Consolidated - Summary of Consolidated Financial Statements 7
3.2 Region wise - Summary of Consolidated Financial Statements 8
3.3 Segment wise - Summary of Statement of Operations 9
3.4 Region wise & Segment wise - Investment and Contribution 12
Section 4 Operating Highlights 14
Section 5 Management Discussion & Analysis
5.1 India & South Asia 18
5.2 Africa 19
5.3 Results of Operations 21
Section 6 Stock Market Highlights 24
Section 7 Use of Non GAAP Financial Information 26
Annexure Detailed Financial and Related Information
A.1 Consolidated Financial Statements as per IFRS 30
A.2 Trend & Ratio Analysis 33
A.3 Key Accounting Policies as per IFRS 40
Glossary 44
Page 4 of 49
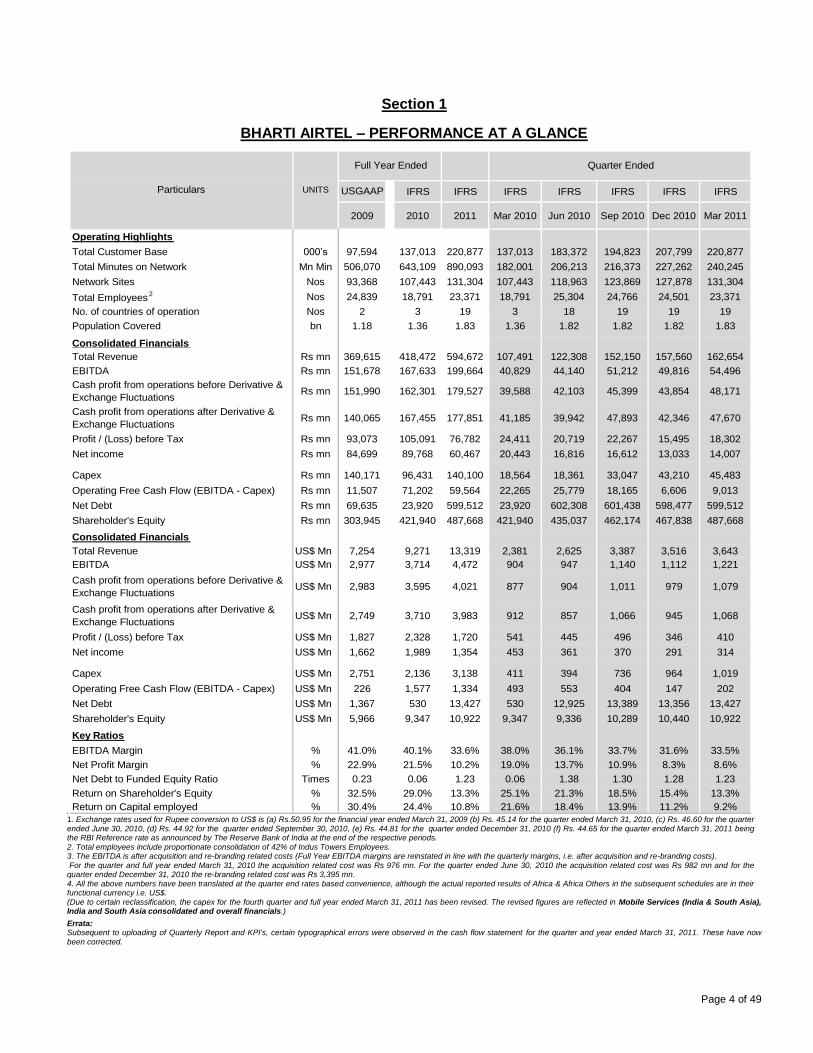
Section 1
BHARTI AIRTEL – PERFORMANCE AT A GLANCE
1.
IFRS IFRS IFRS IFRS IFRS IFRS IFRS
2009 2010 2011 Mar 2010 Jun 2010 Sep 2010 Dec 2010 Mar 2011
Operating Highlights
Total Customer Base 000‟s 97,594 137,013 220,877 137,013 183,372 194,823 207,799 220,877
Total Minutes on Network Mn Min 506,070 643,109 890,093 182,001 206,213 216,373 227,262 240,245
Network Sites Nos 93,368 107,443 131,304 107,443 118,963 123,869 127,878 131,304
Total Employees2 Nos 24,839 18,791 23,371 18,791 25,304 24,766 24,501 23,371
No. of countries of operation Nos 2 3 19 3 18 19 19 19
Population Covered bn 1.18 1.36 1.83 1.36 1.82 1.82 1.82 1.83
Consolidated Financials
Total Revenue Rs mn 369,615 418,472 594,672 107,491 122,308 152,150 157,560 162,654
EBITDA Rs mn 151,678 167,633 199,664 40,829 44,140 51,212 49,816 54,496
Cash profit from operations before Derivative &
Exchange FluctuationsRs mn 151,990 162,301 179,527 39,588 42,103 45,399 43,854 48,171
Cash profit from operations after Derivative &
Exchange FluctuationsRs mn 140,065 167,455 177,851 41,185 39,942 47,893 42,346 47,670
Profit / (Loss) before Tax Rs mn 93,073 105,091 76,782 24,411 20,719 22,267 15,495 18,302
Net income Rs mn 84,699 89,768 60,467 20,443 16,816 16,612 13,033 14,007
Capex Rs mn 140,171 96,431 140,100 18,564 18,361 33,047 43,210 45,483
Operating Free Cash Flow (EBITDA - Capex) Rs mn 11,507 71,202 59,564 22,265 25,779 18,165 6,606 9,013
Net Debt Rs mn 69,635 23,920 599,512 23,920 602,308 601,438 598,477 599,512
Shareholder's Equity Rs mn 303,945 421,940 487,668 421,940 435,037 462,174 467,838 487,668
Consolidated Financials
Total Revenue US$ Mn 7,254 9,271 13,319 2,381 2,625 3,387 3,516 3,643
EBITDA US$ Mn 2,977 3,714 4,472 904 947 1,140 1,112 1,221
Cash profit from operations before Derivative &
Exchange FluctuationsUS$ Mn 2,983 3,595 4,021 877 904 1,011 979 1,079
Cash profit from operations after Derivative &
Exchange FluctuationsUS$ Mn 2,749 3,710 3,983 912 857 1,066 945 1,068
Profit / (Loss) before Tax US$ Mn 1,827 2,328 1,720 541 445 496 346 410
Net income US$ Mn 1,662 1,989 1,354 453 361 370 291 314
Capex US$ Mn 2,751 2,136 3,138 411 394 736 964 1,019
Operating Free Cash Flow (EBITDA - Capex) US$ Mn 226 1,577 1,334 493 553 404 147 202
Net Debt US$ Mn 1,367 530 13,427 530 12,925 13,389 13,356 13,427
Shareholder's Equity US$ Mn 5,966 9,347 10,922 9,347 9,336 10,289 10,440 10,922
0 0 Key Ratios
EBITDA Margin % 41.0% 40.1% 33.6% 38.0% 36.1% 33.7% 31.6% 33.5%
Net Profit Margin % 22.9% 21.5% 10.2% 19.0% 13.7% 10.9% 8.3% 8.6%
Net Debt to Funded Equity Ratio Times 0.23 0.06 1.23 0.06 1.38 1.30 1.28 1.23
Return on Shareholder's Equity % 32.5% 29.0% 13.3% 25.1% 21.3% 18.5% 15.4% 13.3%
Return on Capital employed % 30.4% 24.4% 10.8% 21.6% 18.4% 13.9% 11.2% 9.2%
Particulars UNITS
Full Year Ended
USGAAP
Quarter Ended
1. Exchange rates used for Rupee conversion to US$ is (a) Rs.50.95 for the financial year ended March 31, 2009 (b) Rs. 45.14 for the quarter ended March 31, 2010, (c) Rs. 46.60 for the quarter ended June 30, 2010, (d) Rs. 44.92 for the quarter ended September 30, 2010, (e) Rs. 44.81 for the quarter ended December 31, 2010 (f) Rs. 44.65 for the quarter ended March 31, 2011 being the RBI Reference rate as announced by The Reserve Bank of India at the end of the respective periods. 2. Total employees include proportionate consolidation of 42% of Indus Towers Employees. 3. The EBITDA is after acquisition and re-branding related costs (Full Year EBITDA margins are reinstated in line with the quarterly margins, i.e. after acquisition and re-branding costs). For the quarter and full year ended March 31, 2010 the acquisition related cost was Rs 976 mn. For the quarter ended June 30, 2010 the acquisition related cost was Rs 982 mn and for the quarter ended December 31, 2010 the re-branding related cost was Rs 3,395 mn. 4. All the above numbers have been translated at the quarter end rates based convenience, although the actual reported results of Africa & Africa Others in the subsequent schedules are in their functional currency i.e. US$. (Due to certain reclassification, the capex for the fourth quarter and full year ended March 31, 2011 has been revised. The revised figures are reflected in Mobile Services (India & South Asia), India and South Asia consolidated and overall financials.)
Errata: Subsequent to uploading of Quarterly Report and KPI's, certain typographical errors were observed in the cash flow statement for the quarter and year ended March 31, 2011. These have now been corrected.
Page 5 of 49
Section 2
AN OVERVIEW
2.1 Introduction We are one of world‟s leading providers of telecommunication services with presence in all the 22 licensed jurisdictions (also known as Telecom Circles) in India, and operations in Srilanka, Bangladesh and Africa. We served an aggregate of 220.9 million customers as of March 31, 2011. We are the largest wireless service provider in India, based on the number of customers as of March 31, 2011. We offer an integrated suite of telecom solutions to our enterprise customers, in addition to providing long distance connectivity both nationally and internationally. We also offer Digital TV and IPTV Services. All these services are rendered under a unified brand “airtel”. The company also deploys, owns and manages passive infrastructure pertaining to telecom operations under its subsidiary Bharti Infratel Limited. Bharti Infratel owns 42% of Indus Towers Limited. Bharti Infratel and Indus Towers are amongst top providers of passive infrastructure services in India. 2.2 Business Divisions 2.2.1 India & South Asia Mobile Services (India & South Asia) - We offer mobile services using GSM technology in South Asia across India, Sri Lanka and Bangladesh, serving over 167 million customers in these geographies. We have over 162 million mobile customers in India as on March 31, 2011, which makes us the largest wireless operator in India both in terms of customers with a customer market share of 20% and revenues with a revenue market share of over 30%. We offer post-paid, pre-paid, roaming, internet and other value added services through our extensive sales and distribution network covering over 1.6 million outlets. Our network is present in 5,113 census towns and 452,215 non-census towns and villages in India, covering approximately 86.1% of the country‟s population. We have recently launched 3G services in key cities of the country offering host of innovative services to our customers like Mobile TV entertainment, video calls, live streaming of videos, high definition gaming along with access to high speed internet. Our national long distance infrastructure comprises of 144,557 Rkms of optical fibre, providing us a pan India reach. Airtel Sri Lanka has 1.81 million customers with presence in all 25 administrative districts of Sri Lanka. We have launched 3.5G services in major towns and have created a nation wide distribution network comprising over 26,000 retailers. Airtel Bangladesh has 3.7 million customers and offers mobile services across 64 districts of Bangladesh with a distribution network of over 64,000 retailers across the
country. The burgeoning economy of Bangladesh coupled with low penetration of approx 43% and a strong youth base presents a unique market opportunity for telecom services. Telemedia Services – We provide broadband (DSL), data and telephone services (fixed line) in 87 cities with concerted focus on the various data solutions for the Small & Medium Business (SMB) segment. We had 3.3 million customers as on March 31, 2011 of which 43.1% subscribed to our broadband / internet services. Our product offerings in this segment include fixed-line telephones providing local, national and international long distance voice connectivity, broadband Internet access through DSL, internet leased lines as well as MPLS solutions. We remain strongly committed to our focus on the SMB segment by providing a range of Telecom & Software solutions and aim to achieve revenue leadership in this rapidly growing segment of the ICT market. The strategy of our Telemedia Services business unit is to focus on cities with high revenue potential. Enterprise Services - Enterprise Services is India‟s leading provider of communications services to large Indian and Global Enterprise and Carrier customers. We deliver end to end telecom solutions to corporates by serving as the single point of contact for all telecommunication needs across data, voice, network integration, and managed services. We are regarded as the trusted communications partner to India's leading organizations, helping them to meet the challenges of growth. We own state of the art national and international long distance network infrastructure, enabling us to provide connectivity within India and also connecting India to the world. Our international infrastructure includes ownership of the i2i submarine cable system connecting Chennai to Singapore, consortium ownership of the SMW4 submarine cable system connecting Chennai and Mumbai to Singapore and Europe, and our investments in new cable systems such as Asia America Gateway (AAG), India Middle East and Western Europe (IMEWE), Unity North, EIG (Europe India Gateway) and East Africa Submarine System (EASSy) expanding our global network to over 225,000 Rkms, covering 50 countries across 5 Continents. We also have terrestrial express connectivity to neighboring countries including Nepal, Pakistan, Bhutan and China. Digital TV Services – Airtel digital TV has over 5.6 million customers and continues to add 1 out of every 4 new customers joining the Direct-To-Home (DTH) platform. We also offer Airtel Digital TV recorder and High Definition (HD)
Page 6 of 49
set top boxes delivering superior customer experience. We are the first company in India that provides real integration of all the three screens viz. TV, Mobile and Computers enabling our customers‟ record their favorite TV programs through mobile and web. We continue to expand the distribution, going beyond 9,000 towns and deep into rural India. Passive Infrastructure Services – Bharti Infratel provides passive infrastructure services on a non-discriminatory basis to all telecom operators in India. Bharti Infratel deploys, owns and manages passive infrastructure in 11 circles of India. Infratel also holds 42% share in Indus Towers (a Joint Venture between Bharti Infratel, Vodafone and Idea Cellular). Indus operates in 15 circles (4 circles common with Infratel, 11 circles on exclusive basis). Bharti Infratel has 32,792 towers in 11 circles, excluding the 35,254 towers in 11 circles for which the right of use has been assigned to Indus with effect from January 1, 2009. Indus Towers has a portfolio of 108,586 towers including the towers under right of use. 2.2.2 Africa Mobile Services (Africa) - Airtel Africa has over 44 million customers, across the 16 countries that we operate in. We have made significant progress in establishing Airtel as the most loved Brand in the daily Lives of African people. During the quarter, we have added 2.1 million customers, and we see significant potential in accelerating this as the network rolls out along with enhanced brand presence. The performance during the quarter could have been better, but for the impact that customer registrations has had on the overall customer additions. This notwithstanding, we continue to be excited by the results that we have seen so far. We have seen a strengthening in the rate per minute and have maintained our ARPU despite a marginal drop in MOU per customer as we continue to gain a higher share of the high value customers. Additionally, our non-voice focus also seems to be bearing fruit as we have largely maintained our share of the non-voice revenue in this quarter. Africa Others – It comprises of investment holding companies for Africa mobile operations. 2.3 Partners Strategic Equity Partners - We have a strategic alliance with SingTel, which has enabled us to further enhance and expand our telecommunications networks in India to provide quality service to our customers. The investment made by SingTel in Bharti is one of their largest investments made in the world outside Singapore. Equipment and Technology Partners - We have forged long term strategic partnerships in all areas including equipment and technology, building upon the unique outsourcing business models we have pioneered. Our
business models have enabled us partner with global leaders who share our drive for co-creating innovative and tailor solutions for the markets we operate in. On the GSM/Wireless equipment side, we have partnered with Ericsson, Nokia Siemens Networks (NSN) and Huawei for our Networks in India, Sri Lanka and Bangladesh. We have entered into Supply & Services Contracts for 3G Mobile Services in India with Ericsson, NSN & Huawei. These partners will plan, design, deploy and maintain a state of the art 3G mobile network in Bharti Airtel 3G license circles. We also entered into a strategic contract with Ericsson & Huawei for 2G/2.5G Network expansion in Bangladesh which includes network design, planning, equipment supply, implementation, and project management. Besides 3G Radio access network with strategic partners, we have also partnered with Alcatel Lucent, Huawei, ECI, Tejas Networks and Cisco for Fiber/ Carrier ethernet based 3G backhaul products supply and deployment. Alcatel Lucent (ALU) is our Wire-line Access Network Managed Services partner through a JV Company. They are also responsible for deployment of Fibre/ Copper and service provisioning. However we are free to choose the Electronic Equipment, Switches and Routers from any other competent suppliers and we do purchase equipment from world leaders like Cisco, Juniper, ECI, Tellabs and others in addition to the strategic partners mentioned above. IBM is our strategic partner for all business and enterprise IT systems. Our path breaking contract with IBM caters to, among other things, technology evolution, scale, tariff changes and subscriber growth. We have entered into Global IT Outsourcing contract with IBM covering India, Bangladesh, Sri Lanka and African Regions thereby taking its relationship at Global level. Under this contract, IBM will provide and run all Telecom related IT Systems, Software and Services to support business requirements. It will help Bharti Airtel to derive economics of Scale benefits, scope enhancements and parity, similar customer services and experience across regions. IBM is also our technology partner for Digital Media Exchange, which would enable Airtel‟s presence in Digital Cinema, Digital Signage arena with a host of other Media & Entertainment related services. IBM Daksh, Mphasis, Firstsource, Teleperformance, Aegis, Tech Mahindra and HTMT are our call centre partners and provide an excellent customer experience through dedicated contact center operations. Our existing Call center technology partners are Avaya, Wipro and Cisco. We work with globally renowned organizations such as Comviva, OnMobile, Acision, Yahoo, Google and Cellebrum among others to provide each of our customers with a unique experience in VAS like CRBT (caller ring back tone), SMS, Music on Demand, Email services and other Airtel Live applications. We also have an alliance with RIM for selling Blackberry enterprise services and Blackberry internet services.
Page 7 of 49
SECTION 3
FINANCIAL HIGHLIGHTS This section presents the (1) audited financial results for the fourth quarter and full year ended March 31, 2010, and (2) audited financial results for the fourth quarter and full year ended March 31, 2011 as per International Financial Reporting Standards (IFRS). Detailed financial statements, analysis and other related information is attached to this report as Annexure (page 30 – 32). Also, kindly refer to Section 7 - use of Non - GAAP financial information (page 26) and Glossary (page 44) for detailed definitions.
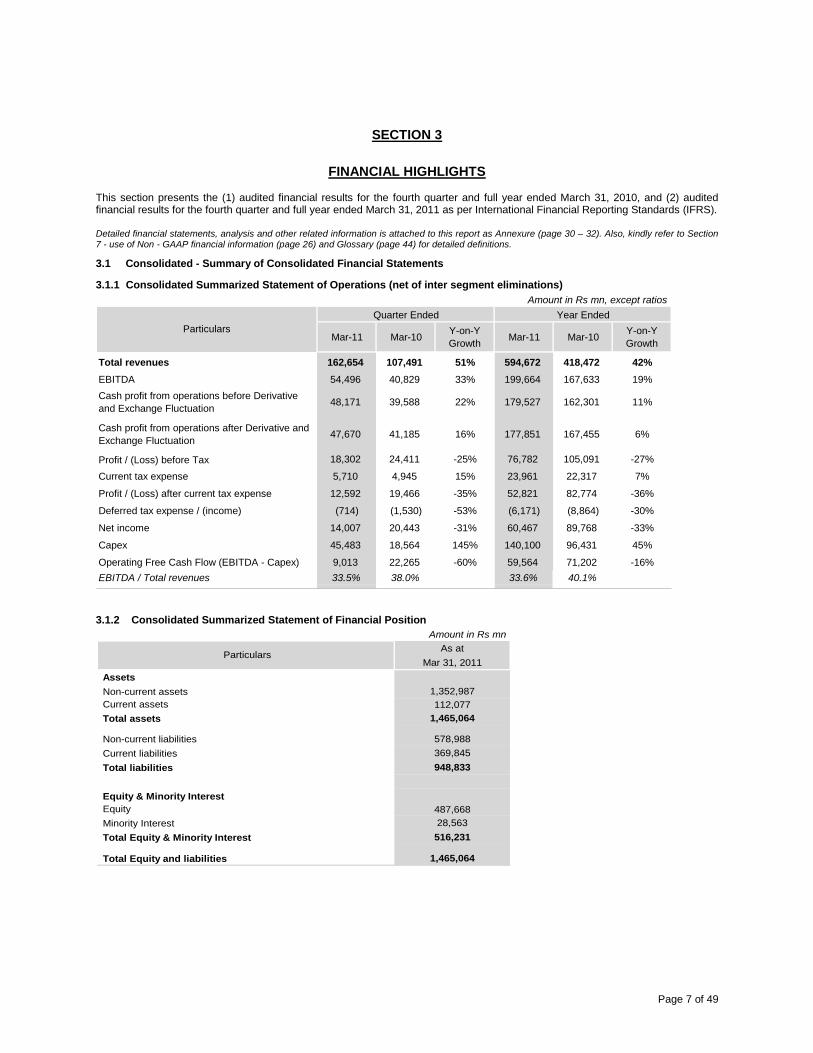
3.1 Consolidated - Summary of Consolidated Financial Statements
3.1.1 Consolidated Summarized Statement of Operations (net of inter segment eliminations)
Amount in Rs mn, except ratios
Quarter Ended Year Ended
Mar-11 Mar-10Y-on-Y
GrowthMar-11 Mar-10
Y-on-Y
Growth
Total revenues 162,654 107,491 51% 594,672 418,472 42%
EBITDA 54,496 40,829 33% 199,664 167,633 19%
Cash profit from operations before Derivative
and Exchange Fluctuation48,171 39,588 22% 179,527 162,301 11%
Cash profit from operations after Derivative and
Exchange Fluctuation47,670 41,185 16% 177,851 167,455 6%
Profit / (Loss) before Tax 18,302 24,411 -25% 76,782 105,091 -27%
Current tax expense 5,710 4,945 15% 23,961 22,317 7%
Profit / (Loss) after current tax expense 12,592 19,466 -35% 52,821 82,774 -36%
Deferred tax expense / (income) (714) (1,530) -53% (6,171) (8,864) -30%
Net income 14,007 20,443 -31% 60,467 89,768 -33%
Capex 45,483 18,564 145% 140,100 96,431 45%
Operating Free Cash Flow (EBITDA - Capex) 9,013 22,265 -60% 59,564 71,202 -16%
EBITDA / Total revenues 33.5% 38.0% 33.6% 40.1%
Particulars
3.1.2 Consolidated Summarized Statement of Financial Position
Amount in Rs mn
As at
Mar 31, 2011
Assets
Non-current assets 1,352,987
Current assets 112,077
Total assets 1,465,064
Non-current liabilities 578,988
Current liabilities 369,845
Total liabilities 948,833
Equity & Minority Interest
Equity 487,668
Minority Interest 28,563
Total Equity & Minority Interest 516,231
Total Equity and liabilities 1,465,064
Particulars
Page 8 of 49
3.2 Region wise - Summary of Consolidated Financial Statements 3.2.1 Summarized Statement of Operations (net of inter segment eliminations)
Amount in Rs mn, except ratios
India & SA AfricaAfrica
OthersTotal
India &
SAAfrica
Africa
OthersTotal India & SA Africa
Africa
OthersTotal
India &
SAAfrica
Africa
OthersTotal
Total revenues 121,195 41,815 - 162,654 107,491 - 107,491 464,445 130,834 - 594,672 418,472 - 418,472
EBITDA 44,343 10,998 (841) 54,496 41,340 (511) 40,829 171,078 31,379 (2,793) 199,664 168,144 (511) 167,633
Cash profit from operations before
Derivative and Exchange Fluctuation42,729 8,726 (3,281) 48,171 40,099 (511) 39,588 165,614 24,543 (10,630) 179,527 162,812 (511) 162,301
Cash profit from operations after
Derivative and Exchange Fluctuation42,654 8,302 (3,282) 47,670 41,696 (511) 41,185 165,942 22,539 (10,630) 177,851 167,966 (511) 167,455
Profit / (Loss) before Tax 21,831 (244) (3,282) 18,302 24,922 (511) 24,411 91,080 (3,667) (10,630) 76,782 105,602 (511) 105,091
Current tax expense 4,535 1,175 - 5,710 4,945 - 4,945 20,411 3,550 - 23,961 22,317 - 22,317
Profit / (Loss) after current tax
expense17,296 (1,419) (3,282) 12,592 19,977 (511) 19,466 70,669 (7,217) (10,630) 52,821 83,285 (511) 82,774
Deferred tax expense / (income) (1,172) 458 - (714) (1,530) - (1,530) (6,414) 243 - (6,171) (8,864) - (8,864)
Net income 18,169 (878) (3,282) 14,007 20,954 (511) 20,443 75,898 (4,801) (10,630) 60,467 90,279 (511) 89,768
EBITDA / Total revenues 36.6% 26.3% 33.5% 38.5% 38.0% 36.8% 24.0% 33.6% 40.2% 40.1%
Capex 28,171 17,312 - 45,483 18,564 - 18,564 104,130 35,970 - 140,100 96,431 - 96,431
Operating Free Cash Flow (EBITDA -
Capex)16,172 (6,314) (841) 9,013 22,776 (511) 22,265 66,947 (4,591) (2,793) 59,564 71,713 (511) 71,202
Year Ended Mar 2011 Year Ended Mar 2010
Particulars
Quarter Ended Mar 2011 Quarter Ended Mar 2010
Page 9 of 49
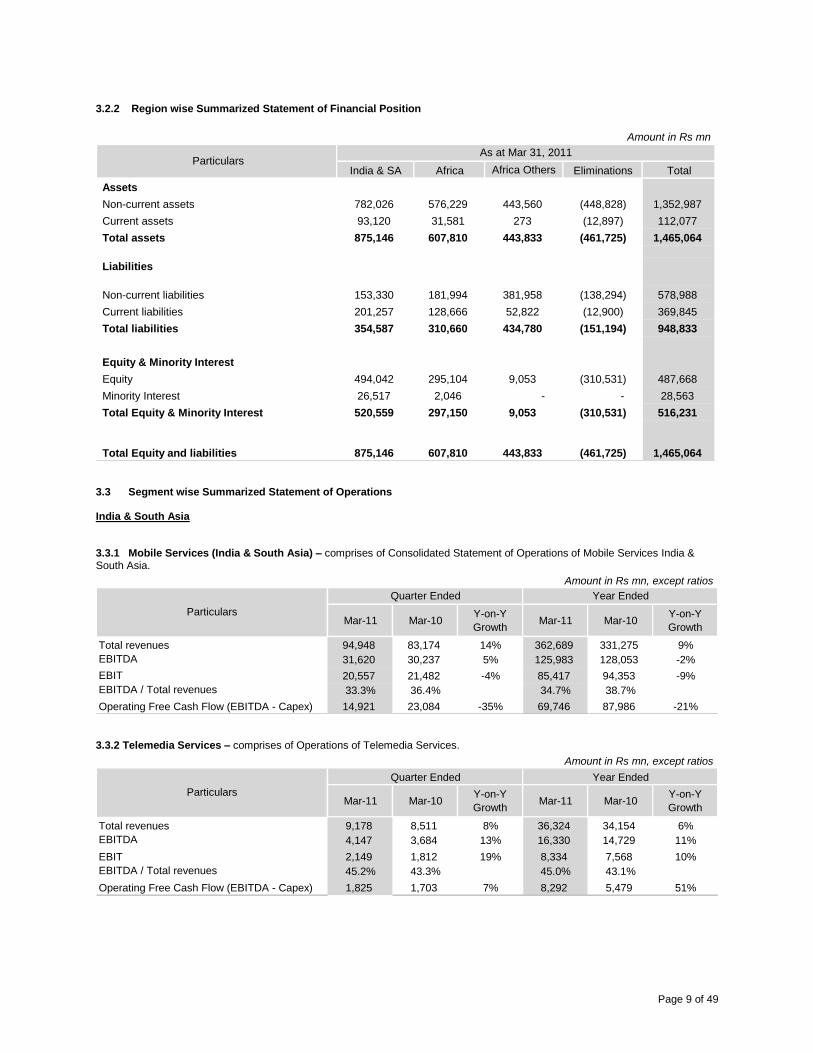
3.2.2 Region wise Summarized Statement of Financial Position
Amount in Rs mn
India & SA Africa Africa Others Eliminations Total
Assets
Non-current assets 782,026 576,229 443,560 (448,828) 1,352,987
Current assets 93,120 31,581 273 (12,897) 112,077
Total assets 875,146 607,810 443,833 (461,725) 1,465,064
Liabilities
Non-current liabilities 153,330 181,994 381,958 (138,294) 578,988
Current liabilities 201,257 128,666 52,822 (12,900) 369,845
Total liabilities 354,587 310,660 434,780 (151,194) 948,833
Equity & Minority Interest
Equity 494,042 295,104 9,053 (310,531) 487,668
Minority Interest 26,517 2,046 - - 28,563
Total Equity & Minority Interest 520,559 297,150 9,053 (310,531) 516,231
Total Equity and liabilities 875,146 607,810 443,833 (461,725) 1,465,064
Particulars As at Mar 31, 2011
3.3 Segment wise Summarized Statement of Operations India & South Asia 3.3.1 Mobile Services (India & South Asia) – comprises of Consolidated Statement of Operations of Mobile Services India & South Asia.
Amount in Rs mn, except ratios
Mar-11 Mar-10Y-on-Y
GrowthMar-11 Mar-10
Y-on-Y
Growth
Total revenues 94,948 83,174 14% 362,689 331,275 9%
EBITDA 31,620 30,237 5% 125,983 128,053 -2%
EBIT 20,557 21,482 -4% 85,417 94,353 -9%
EBITDA / Total revenues 33.3% 36.4% 34.7% 38.7%
Operating Free Cash Flow (EBITDA - Capex) 14,921 23,084 -35% 69,746 87,986 -21%
Particulars
Quarter Ended Year Ended
3.3.2 Telemedia Services – comprises of Operations of Telemedia Services.
Amount in Rs mn, except ratios
Mar-11 Mar-10Y-on-Y
GrowthMar-11 Mar-10
Y-on-Y
Growth
Total revenues 9,178 8,511 8% 36,324 34,154 6%
EBITDA 4,147 3,684 13% 16,330 14,729 11%
EBIT 2,149 1,812 19% 8,334 7,568 10%
EBITDA / Total revenues 45.2% 43.3% 45.0% 43.1%
Operating Free Cash Flow (EBITDA - Capex) 1,825 1,703 7% 8,292 5,479 51%
Particulars
Quarter Ended Year Ended
Page 10 of 49
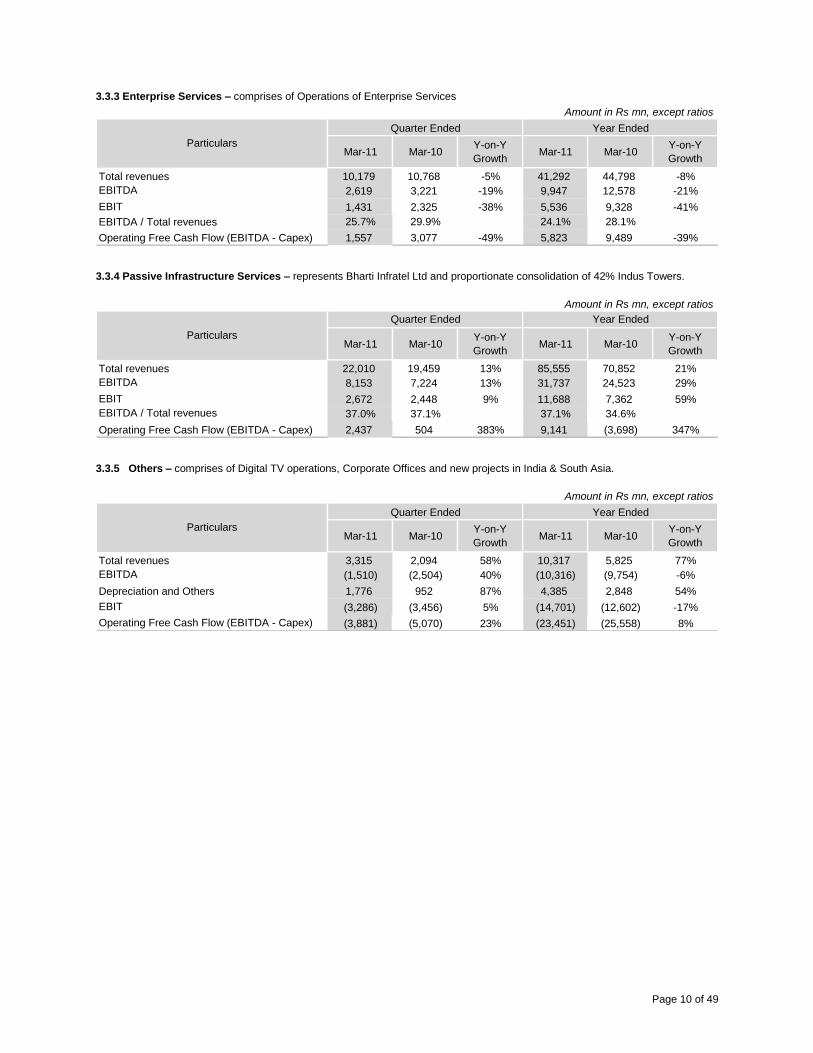
3.3.3 Enterprise Services – comprises of Operations of Enterprise Services
Amount in Rs mn, except ratios
Mar-11 Mar-10Y-on-Y
GrowthMar-11 Mar-10
Y-on-Y
Growth
Total revenues 10,179 10,768 -5% 41,292 44,798 -8%
EBITDA 2,619 3,221 -19% 9,947 12,578 -21%
EBIT 1,431 2,325 -38% 5,536 9,328 -41%
EBITDA / Total revenues 25.7% 29.9% 24.1% 28.1%
Operating Free Cash Flow (EBITDA - Capex) 1,557 3,077 -49% 5,823 9,489 -39%
Particulars
Quarter Ended Year Ended
3.3.4 Passive Infrastructure Services – represents Bharti Infratel Ltd and proportionate consolidation of 42% Indus Towers.
Amount in Rs mn, except ratios
Mar-11 Mar-10Y-on-Y
GrowthMar-11 Mar-10
Y-on-Y
Growth
Total revenues 22,010 19,459 13% 85,555 70,852 21%
EBITDA 8,153 7,224 13% 31,737 24,523 29%
EBIT 2,672 2,448 9% 11,688 7,362 59%
EBITDA / Total revenues 37.0% 37.1% 37.1% 34.6%
Operating Free Cash Flow (EBITDA - Capex) 2,437 504 383% 9,141 (3,698) 347%
Particulars
Quarter Ended Year Ended
3.3.5 Others – comprises of Digital TV operations, Corporate Offices and new projects in India & South Asia.
Amount in Rs mn, except ratios
Mar-11 Mar-10Y-on-Y
GrowthMar-11 Mar-10
Y-on-Y
Growth
Total revenues 3,315 2,094 58% 10,317 5,825 77%
EBITDA (1,510) (2,504) 40% (10,316) (9,754) -6%
Depreciation and Others 1,776 952 87% 4,385 2,848 54%
EBIT (3,286) (3,456) 5% (14,701) (12,602) -17%
Operating Free Cash Flow (EBITDA - Capex) (3,881) (5,070) 23% (23,451) (25,558) 8%
Particulars
Quarter Ended Year Ended
Page 11 of 49
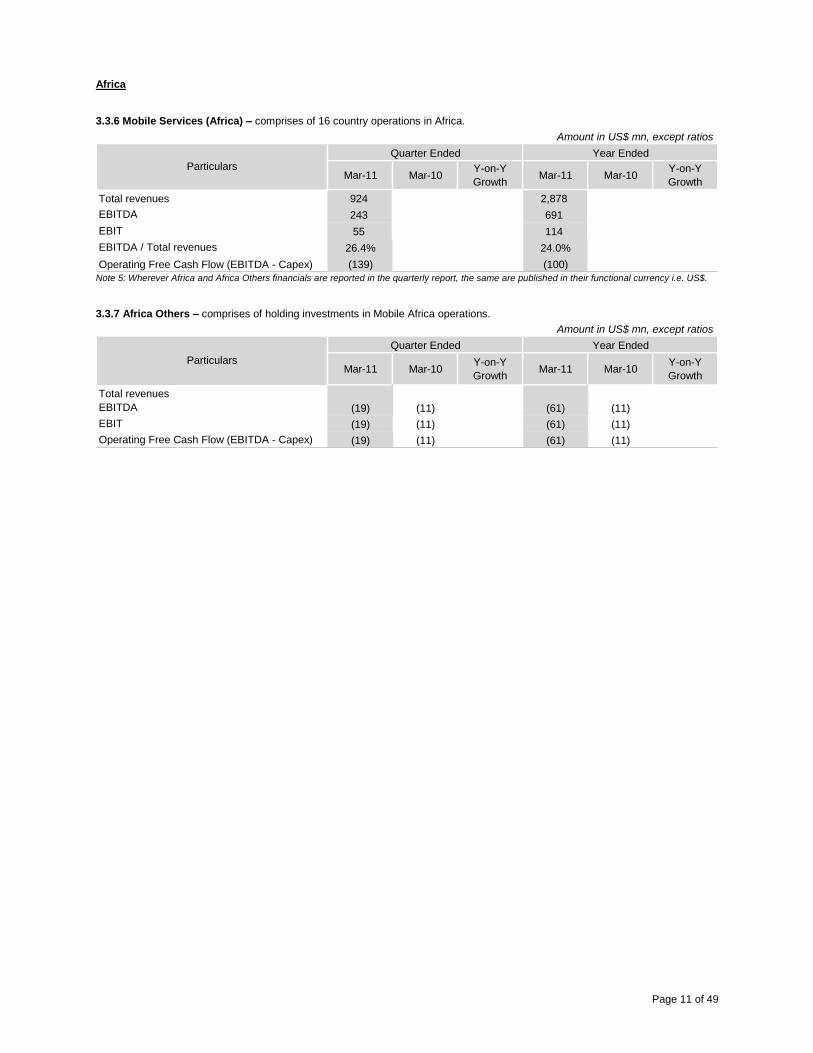
Africa 3.3.6 Mobile Services (Africa) – comprises of 16 country operations in Africa.
Amount in US$ mn, except ratios
Mar-11 Mar-10Y-on-Y
GrowthMar-11 Mar-10
Y-on-Y
Growth
Total revenues 924 2,878
EBITDA 243 691
EBIT 55 114
EBITDA / Total revenues 26.4% 24.0%
Operating Free Cash Flow (EBITDA - Capex) (139) (100)
Particulars
Quarter Ended Year Ended
Note 5: Wherever Africa and Africa Others financials are reported in the quarterly report, the same are published in their functional currency i.e. US$. 3.3.7 Africa Others – comprises of holding investments in Mobile Africa operations.
Amount in US$ mn, except ratios
Mar-11 Mar-10Y-on-Y
GrowthMar-11 Mar-10
Y-on-Y
Growth
Total revenues
EBITDA (19) (11) (61) (11)
EBIT (19) (11) (61) (11)
Operating Free Cash Flow (EBITDA - Capex) (19) (11) (61) (11)
Particulars
Quarter Ended Year Ended
Page 12 of 49
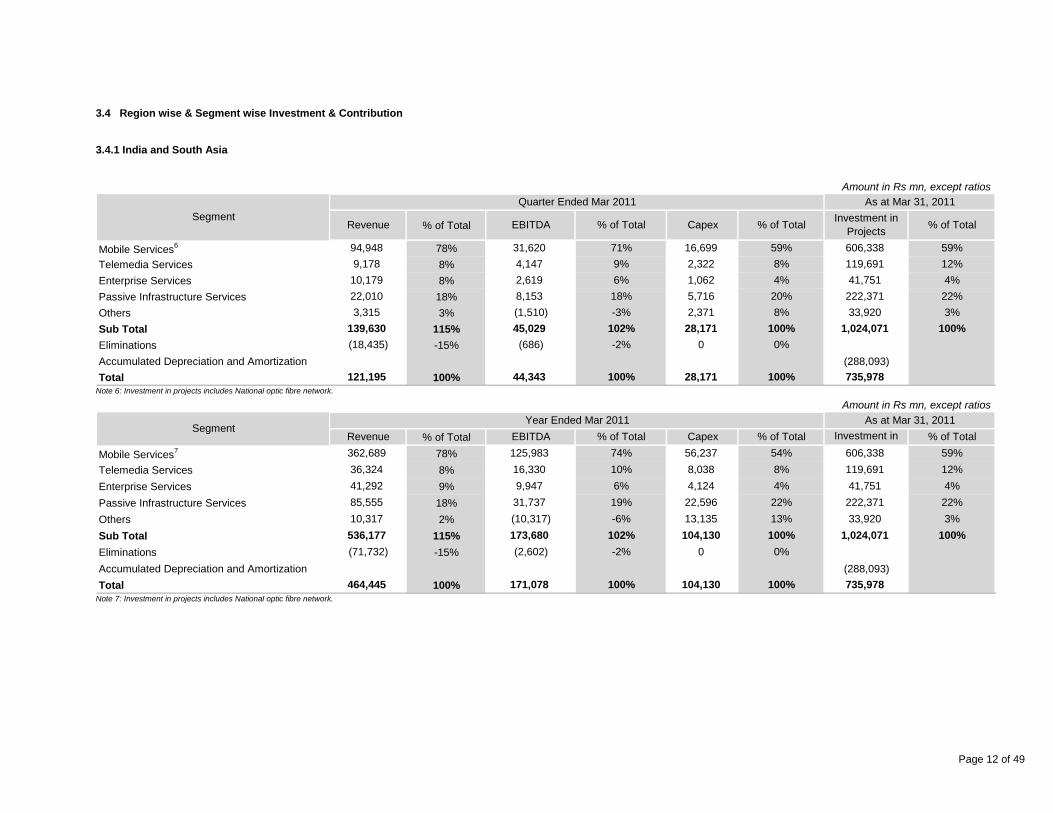
3.4 Region wise & Segment wise Investment & Contribution 3.4.1 India and South Asia
Amount in Rs mn, except ratios
% of Total
Mobile Services6 78%
Telemedia Services 8%
Enterprise Services 8%
Passive Infrastructure Services 18%
Others 3%
Sub Total 115%
Eliminations -15%
Accumulated Depreciation and Amortization (288,093)
Total 100%
22%
33,920 3%
Investment in
Projects% of Total
606,338 59%
119,691 12%
1,024,071
735,978
100%
As at Mar 31, 2011
41,751 4%
222,371
121,195 44,343 100% 28,171 100%
139,630 45,029 102% 28,171 100%
(18,435) (686)
8,153 18% 5,716 20%
-2% 0 0%
4,147 9% 2,322 8%
3,315 (1,510) -3% 2,371 8%
22,010
SegmentRevenue EBITDA % of Total Capex
10,179 2,619 6% 1,062
Quarter Ended Mar 2011
% of Total
94,948 31,620 71% 16,699 59%
4%
9,178
Note 6: Investment in projects includes National optic fibre network.
Amount in Rs mn, except ratios
% of Total
Mobile Services7 78%
Telemedia Services 8%
Enterprise Services 9%
Passive Infrastructure Services 18%
Others 2%
Sub Total 115%
Eliminations -15%
Accumulated Depreciation and Amortization (288,093)
Total 100%
362,689 125,983 74% 56,237 54%
41,292 4,1249,947 6% 4%
SegmentYear Ended Mar 2011
Revenue EBITDA % of Total Capex % of Total
As at Mar 31, 2011
Investment in
Projects
% of Total
606,338 59%
119,691 12%
41,751 4%
222,371 22%
33,920 3%
1,024,071 100%
735,978464,445 171,078 100% 104,130 100%
(71,732) (2,602) -2% 0 0%
536,177 173,680 102% 104,130 100%
10,317 (10,317) -6% 13,135 13%
85,555 31,737 19% 22,596 22%
36,324 16,330 10% 8,038 8%
Note 7: Investment in projects includes National optic fibre network.
Page 13 of 49
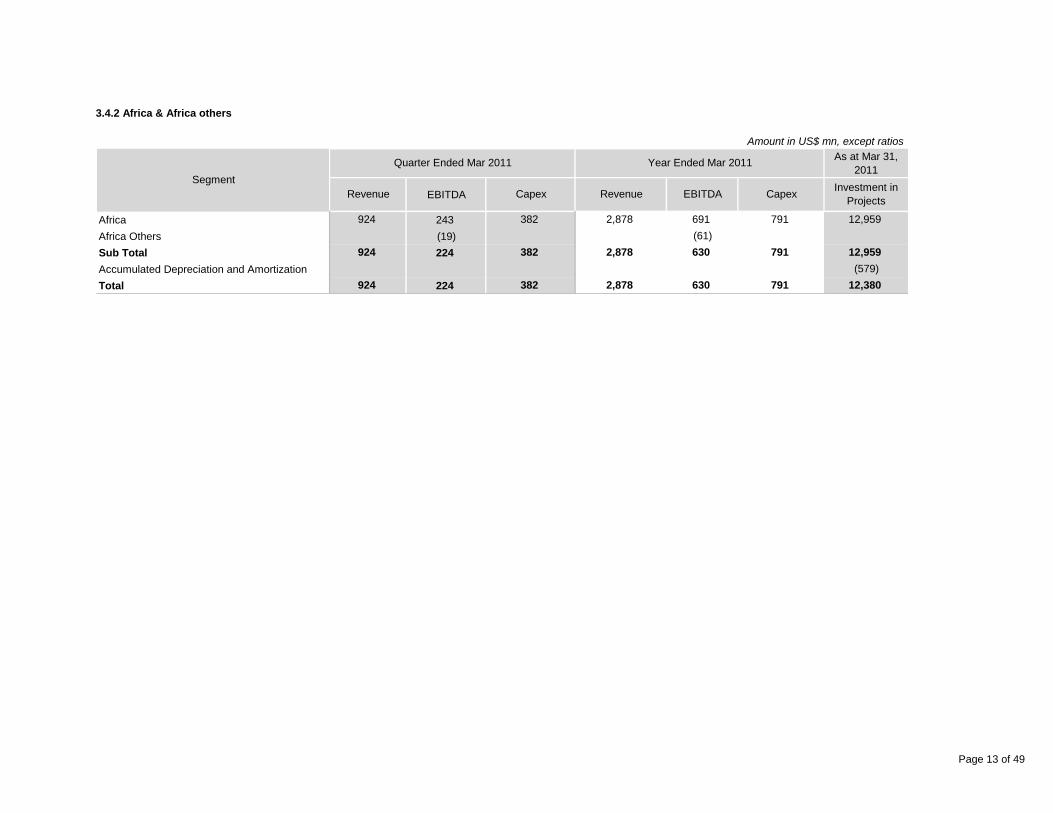
3.4.2 Africa & Africa others
Amount in US$ mn, except ratios
As at Mar 31,
2011
EBITDA
Africa 243
Africa Others (19)
Sub Total 224
Accumulated Depreciation and Amortization
Total 224
(579)
12,959
12,380
924 382 2,878 630 791
Investment in
Projects
12,959
924 382 2,878 630 791
924 382 2,878 691 791
(61)
Segment
Revenue Capex Revenue EBITDA Capex
Quarter Ended Mar 2011 Year Ended Mar 2011
Page 14 of 49
SECTION 4
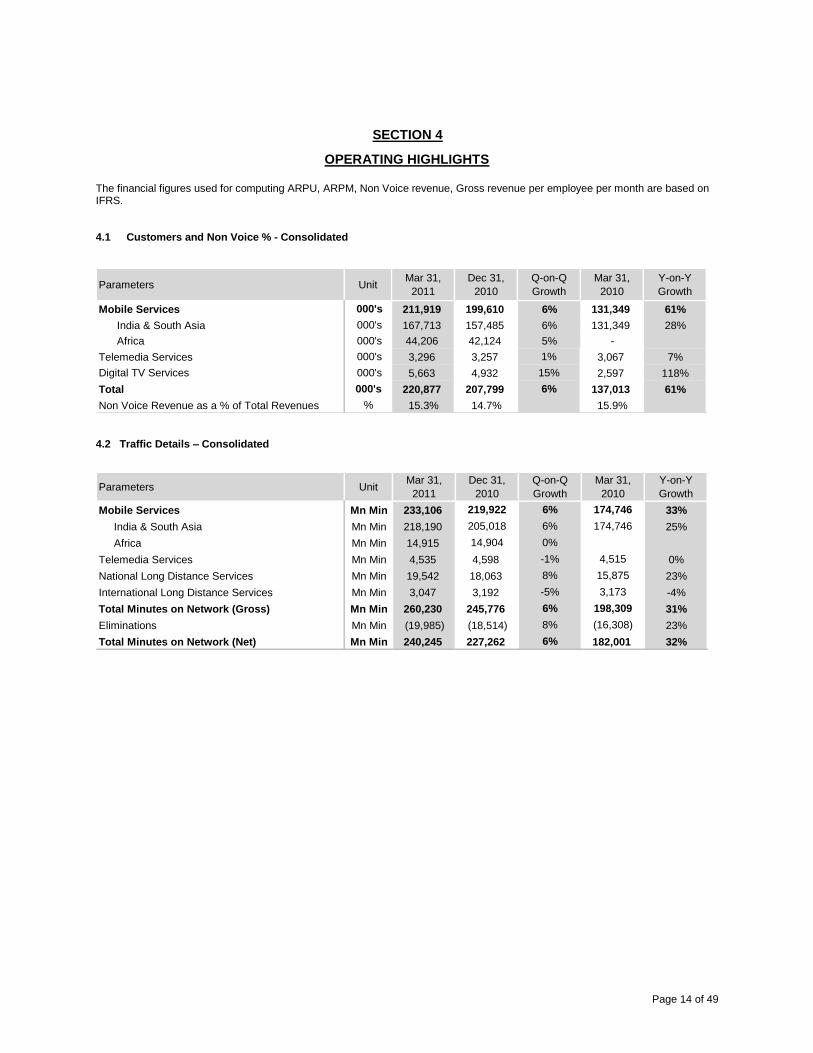
OPERATING HIGHLIGHTS
The financial figures used for computing ARPU, ARPM, Non Voice revenue, Gross revenue per employee per month are based on IFRS. 4.1 Customers and Non Voice % - Consolidated
Parameters UnitMar 31,
2011
Dec 31,
2010
Q-on-Q
Growth
Mar 31,
2010
Y-on-Y
Growth
Mobile Services 000's 211,919 199,610 6% 131,349 61%
India & South Asia 000's 167,713 157,485 6% 131,349 28%
Africa 000's 44,206 42,124 5% -
Telemedia Services 000's 3,296 3,257 1% 3,067 7%
Digital TV Services 000's 5,663 4,932 15% 2,597 118%
Total 000's 220,877 207,799 6% 137,013 61%
Non Voice Revenue as a % of Total Revenues % 15.3% 14.7% 15.9% 4.2 Traffic Details – Consolidated
Parameters UnitMar 31,
2011
Dec 31,
2010
Q-on-Q
Growth
Mar 31,
2010
Y-on-Y
Growth
Mobile Services Mn Min 233,106 219,922 6% 174,746 33%
India & South Asia Mn Min 218,190 205,018 6% 174,746 25%
Africa Mn Min 14,915 14,904 0%
Telemedia Services Mn Min 4,535 4,598 -1% 4,515 0%
National Long Distance Services Mn Min 19,542 18,063 8% 15,875 23%
International Long Distance Services Mn Min 3,047 3,192 -5% 3,173 -4%
Total Minutes on Network (Gross) Mn Min 260,230 245,776 6% 198,309 31%
Eliminations Mn Min (19,985) (18,514) 8% (16,308) 23%
Total Minutes on Network (Net) Mn Min 240,245 227,262 6% 182,001 32%
Page 15 of 49
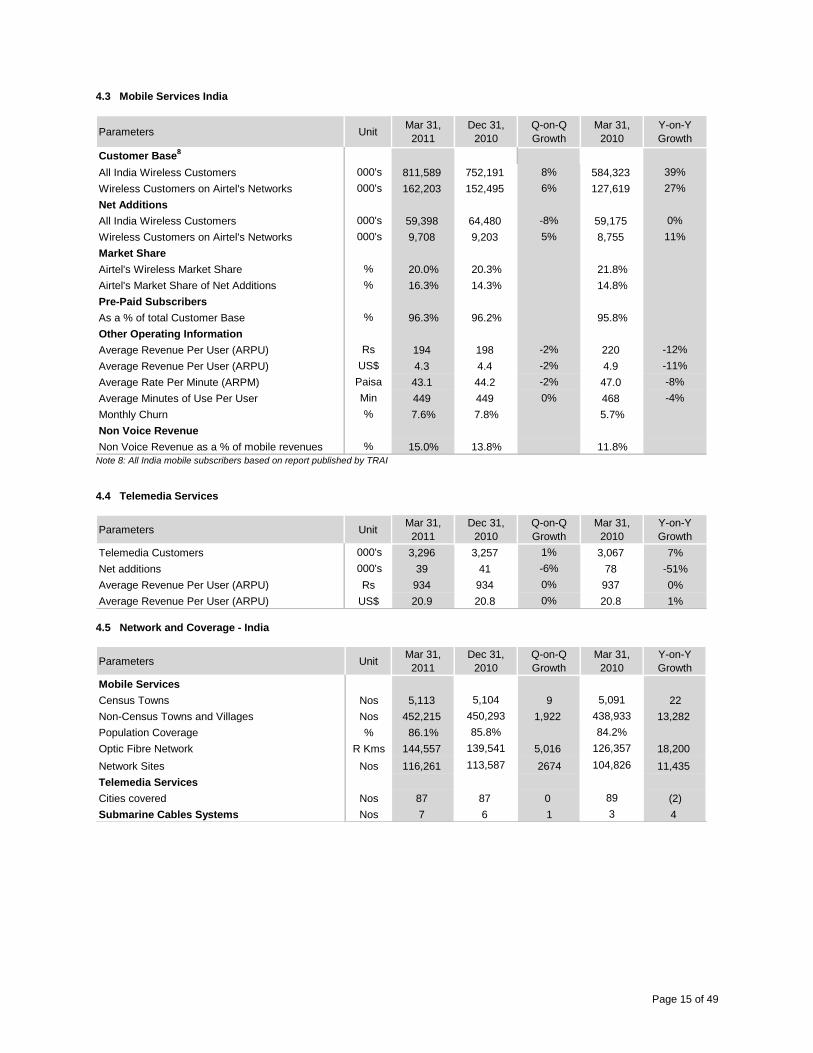
4.3 Mobile Services India
Parameters UnitMar 31,
2011
Dec 31,
2010
Q-on-Q
Growth
Mar 31,
2010
Y-on-Y
Growth
Customer Base8
All India Wireless Customers 000's 811,589 752,191 8% 584,323 39%
Wireless Customers on Airtel's Networks 000's 162,203 152,495 6% 127,619 27%
Net Additions
All India Wireless Customers 000's 59,398 64,480 -8% 59,175 0%
Wireless Customers on Airtel's Networks 000's 9,708 9,203 5% 8,755 11%
Market Share
Airtel's Wireless Market Share % 20.0% 20.3% 21.8%
Airtel's Market Share of Net Additions % 16.3% 14.3% 14.8%
Pre-Paid Subscribers
As a % of total Customer Base % 96.3% 96.2% 95.8%
Other Operating Information
Average Revenue Per User (ARPU) Rs 194 198 -2% 220 -12%
Average Revenue Per User (ARPU) US$ 4.3 4.4 -2% 4.9 -11%
Average Rate Per Minute (ARPM) Paisa 43.1 44.2 -2% 47.0 -8%
Average Minutes of Use Per User Min 449 449 0% 468 -4%
Monthly Churn % 7.6% 7.8% 5.7%
Non Voice Revenue
Non Voice Revenue as a % of mobile revenues % 15.0% 13.8% 11.8% Note 8: All India mobile subscribers based on report published by TRAI
4.4 Telemedia Services
Parameters UnitMar 31,
2011
Dec 31,
2010
Q-on-Q
Growth
Mar 31,
2010
Y-on-Y
Growth
Telemedia Customers 000's 3,296 3,257 1% 3,067 7%
Net additions 000's 39 41 -6% 78 -51%
Average Revenue Per User (ARPU) Rs 934 934 0% 937 0%
Average Revenue Per User (ARPU) US$ 20.9 20.8 0% 20.8 1% 4.5 Network and Coverage - India
Parameters UnitMar 31,
2011
Dec 31,
2010
Q-on-Q
Growth
Mar 31,
2010
Y-on-Y
Growth
Mobile Services
Census Towns Nos 5,113 5,104 9 5,091 22
Non-Census Towns and Villages Nos 452,215 450,293 1,922 438,933 13,282
Population Coverage % 86.1% 85.8% 84.2%
Optic Fibre Network R Kms 144,557 139,541 5,016 126,357 18,200
Network Sites Nos 116,261 113,587 2674 104,826 11,435
Telemedia Services
Cities covered Nos 87 87 0 89 (2)
Submarine Cables Systems Nos 7 6 1 3 4
Page 16 of 49
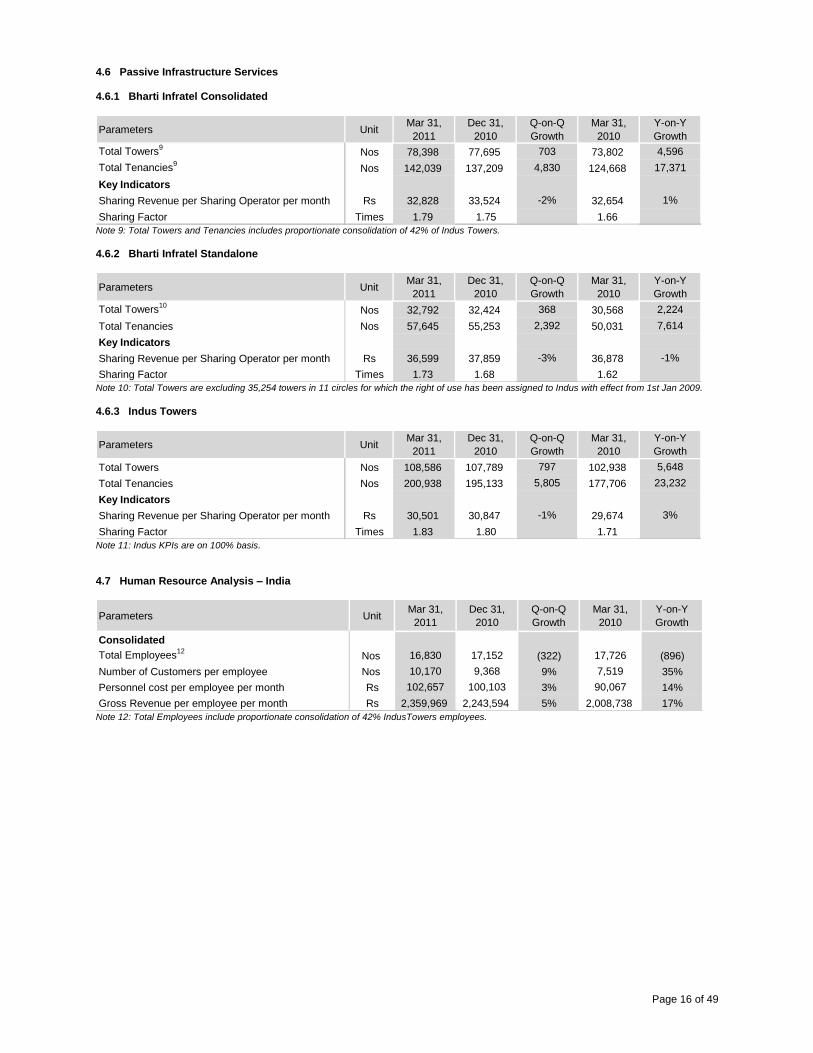
4.6 Passive Infrastructure Services 4.6.1 Bharti Infratel Consolidated
Parameters UnitMar 31,
2011
Dec 31,
2010
Q-on-Q
Growth
Mar 31,
2010
Y-on-Y
Growth
Total Towers9
Nos 78,398 77,695 703 73,802 4,596
Total Tenancies9
Nos 142,039 137,209 4,830 124,668 17,371
Key Indicators
Sharing Revenue per Sharing Operator per month Rs 32,828 33,524 -2% 32,654 1%
Sharing Factor Times 1.79 1.75 1.66 Note 9: Total Towers and Tenancies includes proportionate consolidation of 42% of Indus Towers.
4.6.2 Bharti Infratel Standalone
Parameters UnitMar 31,
2011
Dec 31,
2010
Q-on-Q
Growth
Mar 31,
2010
Y-on-Y
Growth
Total Towers10
Nos 32,792 32,424 368 30,568 2,224
Total Tenancies Nos 57,645 55,253 2,392 50,031 7,614
Key Indicators
Sharing Revenue per Sharing Operator per month Rs 36,599 37,859 -3% 36,878 -1%
Sharing Factor Times 1.73 1.68 1.62 Note 10: Total Towers are excluding 35,254 towers in 11 circles for which the right of use has been assigned to Indus with effect from 1st Jan 2009.
4.6.3 Indus Towers
Parameters UnitMar 31,
2011
Dec 31,
2010
Q-on-Q
Growth
Mar 31,
2010
Y-on-Y
Growth
Total Towers Nos 108,586 107,789 797 102,938 5,648
Total Tenancies Nos 200,938 195,133 5,805 177,706 23,232
Key Indicators
Sharing Revenue per Sharing Operator per month Rs 30,501 30,847 -1% 29,674 3%
Sharing Factor Times 1.83 1.80 1.71 Note 11: Indus KPIs are on 100% basis.
4.7 Human Resource Analysis – India
Parameters UnitMar 31,
2011
Dec 31,
2010
Q-on-Q
Growth
Mar 31,
2010
Y-on-Y
Growth
Consolidated
Total Employees12
Nos 16,830 17,152 (322) 17,726 (896)
Number of Customers per employee Nos 10,170 9,368 9% 7,519 35%
Personnel cost per employee per month Rs 102,657 100,103 3% 90,067 14%
Gross Revenue per employee per month Rs 2,359,969 2,243,594 5% 2,008,738 17% Note 12: Total Employees include proportionate consolidation of 42% IndusTowers employees.
Page 17 of 49
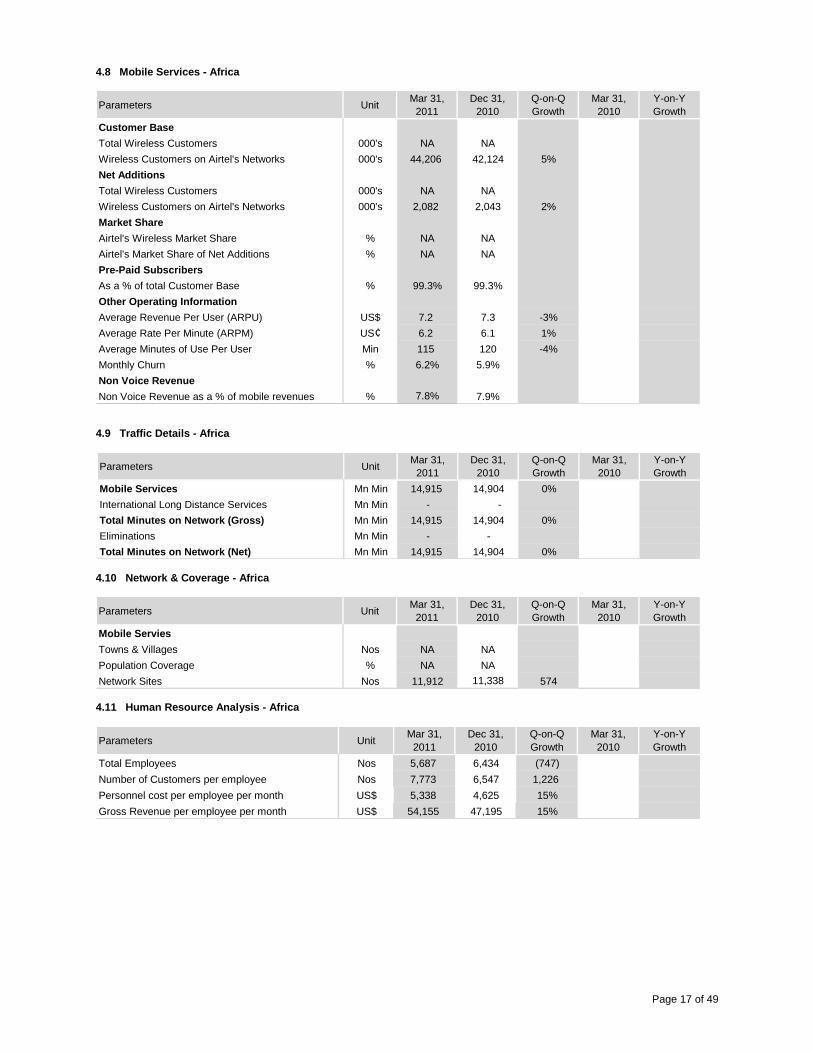
4.8 Mobile Services - Africa
Parameters UnitMar 31,
2011
Dec 31,
2010
Q-on-Q
Growth
Mar 31,
2010
Y-on-Y
Growth
Customer Base
Total Wireless Customers 000's NA NA
Wireless Customers on Airtel's Networks 000's 44,206 42,124 5%
Net Additions
Total Wireless Customers 000's NA NA
Wireless Customers on Airtel's Networks 000's 2,082 2,043 2%
Market Share
Airtel's Wireless Market Share % NA NA
Airtel's Market Share of Net Additions % NA NA
Pre-Paid Subscribers
As a % of total Customer Base % 99.3% 99.3%
Other Operating Information
Average Revenue Per User (ARPU) US$ 7.2 7.3 -3%
Average Rate Per Minute (ARPM) US¢ 6.2 6.1 1%
Average Minutes of Use Per User Min 115 120 -4%
Monthly Churn % 6.2% 5.9%
Non Voice Revenue
Non Voice Revenue as a % of mobile revenues % 7.8% 7.9%
4.9 Traffic Details - Africa
Parameters UnitMar 31,
2011
Dec 31,
2010
Q-on-Q
Growth
Mar 31,
2010
Y-on-Y
Growth
Mobile Services Mn Min 14,915 14,904 0%
International Long Distance Services Mn Min - -
Total Minutes on Network (Gross) Mn Min 14,915 14,904 0%
Eliminations Mn Min - -
Total Minutes on Network (Net) Mn Min 14,915 14,904 0% 4.10 Network & Coverage - Africa
Parameters UnitMar 31,
2011
Dec 31,
2010
Q-on-Q
Growth
Mar 31,
2010
Y-on-Y
Growth
Mobile Servies
Towns & Villages Nos NA NA
Population Coverage % NA NA
Network Sites Nos 11,912 11,338 574 4.11 Human Resource Analysis - Africa
Parameters UnitMar 31,
2011
Dec 31,
2010
Q-on-Q
Growth
Mar 31,
2010
Y-on-Y
Growth
Total Employees Nos 5,687 6,434 (747)
Number of Customers per employee Nos 7,773 6,547 1,226
Personnel cost per employee per month US$ 5,338 4,625 15%
Gross Revenue per employee per month US$ 54,155 47,195 15%
Page 18 of 49
SECTION 5
MANAGEMENT DISCUSSION AND ANALYSIS
5.1 India and South Asia A. Key Industry Developments 1. Mobile Number Portability (MNP):
Pan India MNP service launched on Jan 20, 2011. There are certain operational and technical issues w.r.t. implementation of MNP such as need for introduction of another rejection reason "Port out Cancelled by Customer" basis SMS based cancellation, definition of time for UPC generation, 3 hrs porting window, requirement of network maintenance window, which Industry through its associations are taking up with TRAI in order to make necessary amendments in the existing MNP Regulation.
As per TRAI release 38 lakh customers have applied for porting by end of Feb 2011 across all telecom service areas.
2. DoT Mandate for measurement of EMF from Base station Antenna.
Airtel has submitted the compliance certificate along with the other documents as required by DoT for self certification of Mobile Base Stations. TERM Cell has also done a measurement check at various locations in the Country wherein the BTS emission level was found under the ICNIRP limit.
3. Subscriber Re-verification
Revised Subscriber Verification Guidelines are awaited from DoT which is expected to supersede all previous guidelines. In this regard, ACT has submitted its comments of final draft guidelines basis discussion with all Operators.
DoT has extended permission for continuance of prepaid mobile service in J&K, Assam and NE Circles till March 31, 2011.
4. TRAI revised Regulation on UCC
TRAI had issued “The Telecom Commercial Communications Customer Preference Regulations, 2010” on December 1, 2010. As per the provisions of regulations, the telemarketer‟s registration has started from January 15, 2011 and Customer preference registrations have started from February 10, 2011. Other operational provisions were required to be implemented from March 1, 2011. The said Regulation also provides allocation of separate number series for telemarketers.
Further, DoT has communicated a fresh numbering series
beginning with the number "140‟ on January 31, 2011.
This new number series allocated by DoT are only for mobile services of the licenses and levels for fixed network was to be allocated by DoT after resolving the issue of CLI for telemarketing operations using fixed line network.
However, the number series for fixed network are still not allocated by DoT. Operators have indicated that it will not be possible to provide all the resources for telemarketing from mobile networks and they would require sufficient
time to operationalise the fixed line numbering series once allotted.
Thus, due to non availability of numbering resources from fixed line network from DoT, the date of implementation of relevant clauses of “The Telecom Commercial Communications Customer Preference Regulations, 2010” has been amended by the Authority and exact date of implementation of various clauses would be notified once number resources for telemarketing from fixed line network are allocated by DoT.
TRAI vides the said Regulation has also put a ceiling of 100 SMS per day per SIM. In this regard, a representation has been sent to the Authority to review Regulation and allow the operators to charge high Tariff for all the SMSs beyond the ceiling of 100, so as to disincentives any misuse.
5. TRAI Recommendations on Spectrum Management
and licensing Framework
TRAI in its Recommendations on Spectrum Management and licensing Framework dated May 2010 had recommended that, the 3G price be adopted as the „Current Price‟ of spectrum, the Authority had also stated that it was separately initiating an exercise to further study the subject and would apprise the Government of its findings.
Further, TRAI had entrusted some experts to study the issues involved and provide the value of 1800 MHz Spectrum. These experts submitted their report "The 2010 value of spectrum in 1800 MHz band" on January 30, 2011 with the estimated price of the Pan India spectrum (per MHz) up to 6.2 MHz to be Rs 1,769 Cr and the price of the Pan India spectrum (per MHz) beyond 6.2 MHz to be Rs 4,571 Cr.
Based on the above report, TRAI recommended that the price of the spectrum arrived by the experts be adopted as the best available figures. The Authority also recommended that these prices may be applicable w.e.f. April 2010 prorated for the remaining validity of the respective licences while charging for excess spectrum.
However, Bharti has made a representation to DoT for not considering these recommendations.
6. TRAI Consultation Papers
TRAI has issued the following Consultation Papers: Green Telecom Issues Related to Telecommunications Infrastructure
Policy. “Issues arising out of Provisioning and Pricing of
Services by Mobile Service Providers – in the context of Delivery of Basic Financial Services using Mobile Phones”
Page 19 of 49
B. Key Company Developments
The Board of Directors has recommended a dividend of Re 1 per equity share of Rs 5 each (20 % of face value) for financial year 2010-2011. The payment is subject to the approval of the shareholders in the ensuing Annual General Meeting of the company.
Bharti Airtel won a total of 6 categories in Tele.Net‟s annual Telecom Operator Awards 2011. These categories included Best VAS Offering, Best Operator Performance, Most Admired Operator, Best Enterprise Services Provider, Operator with Best Rural Performance and Best National Mobile Operator
Bharti Airtel successfully launched its 3G services in India spanning across over 21 cities including Bengaluru, Delhi, Mumbai, Chennai, Hyderabad, Patna and Jaipur.
Bharti Airtel‟s partner Ericsson announced that it had deployed world class 3G network infrastructure to support the rollout of Airtel 3G services in Delhi & NCR
Bharti Airtel announced a joint venture with State Bank of India aimed at providing mCommerce services for the unbanked segment in the country
With the objective of facilitating cashless transactions and introducing an easy way for customers to make payments from their mobile devices, Bharti Airtel launched Airtel Money in Gurgaon
Airtel digital TV crossed the milestone of 5 million customers on its platform. The achievement in just 21 months of full scale national operations, is the fastest anywhere in the world.
Bharti airtel launched „airtel broadband TV‟. Adding another dimension to its strategy of multi-screen convergence, airtel broadband TV is a unique service which enables the customers to watch live TV on their computers or laptops. Customers can now watch TV without having to buy an extra TV set or cable connection/set top box or an air antenna by simply subscribing to airtel broadband TV with attractive monthly subscription packs starting at INR 49.
Bharti Airtel announced the launch of EIG submarine cable system. EIG is the third state-of-the-art cable in Bharti Airtel‟s portfolio that stretches from India to Western Europe via Middle East. Bharti Airtel will also provide services related to Network Administration and Network Operations Control functions for EIG. The cable is represented by a consortium of 17 telecom operators along with Bharti Airtel.
Bharti Airtel entered into a strategic partnership with Savvis to further augment and strengthen its managed services portfolio. The collaboration aims to offer innovative managed services to enterprises operating in or expanding into India. Under this exclusive agreement, Savvis will use Airtel‟s world class data centers, unsurpassed bandwidth capacity and network support to expand its services platform in India.
5.2 Africa
Key Industry Developments Congo B • 3G License 3G license was awarded to the Company on 25th
February 2011.
Congo DRC
• 3G License The Regulator has launched a consultation process in order to solicit the operator‟s views on the forthcoming 3G license process
• Numbering fees The Government has reduced the numbering tax from $0.75 to $0.45 from February 2011.
Ghana
MNP Activity The Regulator mandated MNP „Go Live‟ date for 1st July 2011 and the implementation plan is on schedule
Interconnect Rate We are in discussion with the Government for driving the interconnect rates lower based on Long Run Incremental Cost (LRIC) study
Kenya
MNP Mobile Number Portability was launched on 1st April 2011.
Madagascar
3G licence Discussions have commenced for the acquisition of a 3G license
Nigeria
Mobile Number Portability (MNP) Activity Discussions are currently ongoing with the Government and Regulator to support implementation of Mobile Number Portability (MNP) during the ongoing registration program for all new customers
Subscribers Identification (KYC) The registration of existing customers is to be undertaken by the Nigerian Communications Commission (NCC) and is expected to commence in Q1 2012
Uganda
Interconnect Rate We are in discussion with the Government for driving the interconnect rates lower based on Long Run Incremental Cost (LRIC) study
Page 20 of 49
Zambia
Subsidy for rural coverage The Government has waived up to 30% import duty on all passive and active equipment for all new sites across the country. Operators are required to submit the name of the areas for which they are applying for the waiver. Airtel Zambia is preparing to file an application in this regard.
Sierra Leone
KYC (subscriber identification program) The identifying and registration of all mobile phone customers is a growing requirement across the region. By
the year-end we anticipate KYC being mandatory in all the markets. Adequate infrastructure does not exist to register customers at SIM selling points. The company is gearing up to meet this requirement. It is implementing “Over the Air” tools and methodology to enable customers to successfully register via GSM network and also at the time of purchasing SIM. KYC implementation is ongoing in Tanzania, Chad, Burkina Faso, Niger, DRC, Congo B, Gabon, Ghana, Kenya, Madagascar, Nigeria, Uganda & Sierra Leone.
Page 21 of 49
5.3 Results of Operations
The company has reported its (1) audited financial results for the quarter ended March 31, 2010 and full year ended March 31, 2010; (2) audited financial results for the quarter ended March 31, 2011 and full year ended March 31, 2011. The financial statements have been prepared in accordance with International Financial Reporting Standards (IFRS).
Key Highlights - For the full year ended March 31, 2011
Overall customer base at 220.9 million.
Net addition of 83.9 million of total customers in a year.
Market leader with a market share of all India wireless subscribers at 20.0% (21.8% last year).
Total revenues of Rs. 594.7 billion (up 42% Y-o-Y).
EBITDA at Rs 199.7 billion (up 19% Y-o-Y).
Cash profit from operations of Rs 177.9 billion (up 6% Y-o-Y).
Net Profit of Rs. 60.5 billion (down 33% Y-o-Y).
Free cash flow of Rs 59.6 billion (down 16% Y-o-Y).
Key Highlights - For the quarter ended March 31, 2011
Net addition of 13.1 million customers.
Total Revenues of Rs 162.7 billion (up 51% Y-o-Y).
EBITDA Rs 54.5 billion (up 33% Y-o-Y).
Cash profit from operations of Rs 47.7 billion (up 16% Y-o-Y).
Net Income of Rs 14.0 billion (down 31% Y-o-Y).
Bharti Airtel Consolidated
Full year ended March 31, 2011 The consolidated revenues and EBITDA for the year ended March 31, 2011 was Rs 594,672 million and Rs 199,664 million respectively. The consolidated revenues and EBITDA grew by 42% and 19% respectively for the year ended March 31, 2011. The EBITDA margin for the year was 33.6%. The cash profit from operations for the year ended March 31, 2011 was Rs 177,851 million as compared to Rs 167,455 million for the year ended March 31, 2010, a growth of 6% year on year. The net finance cost for the year was Rs 21,812 million.
The earning before tax for the year ended on March 31, 2011 was Rs 76,782 million and the net profit was at Rs 60,467 million leading to an earnings per share of Rs 15.93 The current tax expense for the year was Rs 23,961 million and the deferred tax expense/(income) was Rs (6,171) million.
The capital expenditure for the full year was Rs 140,100 million (US$ 3,138 Million).
Quarter ended March 31, 2011
Customer Base As on March 31, 2011, the company had an aggregate of 220.9 million customers consisting of 211.9 million Mobile, 3.3 million Telemedia and 5.7 million Digital TV customers. Its total customer base as on March 31, 2011 increased by 61.3% compared to the customer base as on March 31, 2010.
Revenues/Turnover During the quarter ended March 31, 2011, the company recorded revenues of Rs 162,654 million, a growth of 51.3% compared to the quarter ended March 31, 2010. Non-voice revenue contributed to approximately 15.3% of the total revenues for the quarter.
Operating Expenses (ex-revenue share license and spectrum fee) During the quarter ended March 31, 2011; the company incurred an operating expenditure of Rs 72,892 million representing 45% of the total revenues. The operating expense comprises: Rs 34,644 million towards network operations costs
(21.3% of total revenues) Rs 1,047 million towards cost of goods sold (0.6% of
total revenues) Rs 9,534 million towards employee costs, (5.9% of
total revenues) and Rs 27,667 million towards selling general and
administrative costs (17% of total revenues).
EBITDA, Finance Cost and Cash Profit from Operations During the quarter ended March 31, 2011, the company had an EBITDA of Rs 54,496 million; growth of 33% compared to the quarter ended March 31, 2010. The reported EBITDA margin for the quarter was 33.5%.
The net finance cost for the quarter ended March 31, 2011 was Rs 6,824 million. The interest on borrowings during the quarter was Rs 5,425 million, the finance charges during the quarter was Rs 1,163 million, the investment income (primarily related to income on marketable securities) was Rs 265 million and expense of Rs 501 million was effect of exchange fluctuation and derivative accounting.
The cash profit from operations after derivative and exchange fluctuations for the quarter was Rs 47,670 million, an increase of 16% as compared to the quarter ended March 31, 2010. During the quarter ended March 31, 2011, the company had depreciation and amortization expenses of Rs 29,702 million. Profit / (Loss) Before Tax (PBT) The Profit / (Loss) before tax for the quarter was Rs 18,302 million, a decrease of 25%, as compared to the quarter ended March 31, 2010. The current tax for the quarter ended March 31, 2011 was Rs 5,710 million and deferred tax expense / (income) was Rs (714) million.
Page 22 of 49
Net income The net income for the quarter ended March 31, 2011 was Rs 14,007 million with a Y-o-Y decline of 31%.
Statement of Financial Position As on March 31, 2011, the company had total assets of Rs 1,465,064 million, and total liabilities of Rs 948,833 million respectively. The difference of Rs 516,231 million was on account of Equity attributable to equity holders of parent and non-controlling interest.
The company had a net debt of Rs 599,512 million (US$ 13,427 million) as on March 31, 2011, resulting in a Net Debt to EBITDA (LTM) of 2.83.
Capital Expenditure During the quarter ended March 31, 2011, the company incurred capital expenditure of Rs 45,483 million.
Human Resources As on March 31, 2011, the company had a total of 23,371 employees.
Mobile Services – India & South Asia
Customer Base, Churn, ARPU and MoU - India As at the end of the quarter the company had 162.2 million GSM mobile customers on its network, which accounted for a market share of 20.0% of the all India mobile market. During the quarter, Bharti‟s share of net additions was 16.3% of all India wireless subscriber net additions.
The average monthly churn for the quarter ended March 31, 2011 was 7.6%.
During the quarter blended ARPU was Rs 194 (US$ 4.3) per month as compared to Rs 198 (US$ 4.4) per month in the quarter ended December 31, 2010. The blended monthly usage per customer, during the quarter was at 449 minutes. The Average rate per minute during the quarter was 43.1 paisa. Non voice revenue, which includes Voice Mail Service, Call Management, Airtel Talkies and other value added services like Hello Tunes, Music on Demand and Airtel Live contributed to approximately 15.0% of the total revenues of the segment.
Revenues, EBITDA and EBIT The revenues for the quarter ended March 31, 2011 for mobile services stood at Rs 94,948 million, a growth of 14.2% over the corresponding quarter last year. The revenue from this segment contributed to 78% of the total revenues of India & South Asia. The EBITDA during the quarter ended March 31, 2011 was Rs 31,620 million representing a growth of 4.6% over the quarter ended March 31, 2010. The EBITDA margin for the quarter ended March 31, 2011 was 33.3%. The EBIT for the quarter ended March 31, 2011 was Rs 20,557 million as compared to Rs 21,482 million for the quarter ended March 31, 2010, a decline of 4.3%.
Capital Expenditure During the quarter ended March 31, 2011, the company incurred a capital expenditure of Rs 16,699 million on its Mobile Services.
Telemedia Services
Customer Base and ARPU At the end of the quarter ended March 31, 2011, the company had its Telemedia operations in 87 cities. During
the quarter, the company added 38,576 customers on its Telemedia networks with 3.3 million customers as on March 31, 2011. The company had approximately 1.42 million customers (43.1%) of the total customer base subscribing to broadband (DSL) services.
The ARPU for the quarter was Rs 934 (US$ 20.9) per month.
Revenues, EBITDA and EBIT For the quarter ended March 31, 2011, the revenues from Telemedia operations of Rs 9,178 million, represented a growth of 7.8% over the corresponding quarter last year. The EBITDA for the quarter was Rs 4,147 million compared to Rs 3,684 million in the corresponding prior year quarter, an increase of 12.6%. The EBITDA margin for this segment was 45.2% for the quarter ended March 31, 2011. The EBIT for the quarter ended March 31, 2011 was Rs 2,149 million.
Capital Expenditure During the quarter ended March 31, 2011, the company incurred a capital expenditure of Rs 2,322 million on its Telemedia Services.
Enterprise Services Revenues, EBITDA and EBIT The revenues for the quarter ended March 31, 2011 for Enterprise services stood at Rs 10,179 million, a decline of 5.5% over the corresponding quarter last year. The revenue from this segment contributed to 8% of the total revenues of India & South Asia. The EBITDA during the quarter ended March 31, 2011 was Rs 2,619 million, a decline of 18.7% over the corresponding quarter last year. The EBITDA margin for the quarter ended March 31, 2011 was 25.7%. The EBIT for the quarter ended March 31, 2011 was Rs 1,431 million as compared to Rs 2,325 million for the quarter ended March 31, 2010, a decline of 38.4%.
Capital Expenditure During the quarter ended March 31, 2011, the company incurred a capital expenditure of Rs 1,062 million on its Enterprise Services.
Passive Infrastructure Services
Revenues, EBITDA and EBIT For the quarter ended March 31, 2011, the revenues from its Passive Infrastructure Services were Rs 22,010 million. The EBITDA for the quarter ended March 31, 2011 was Rs 8,153 million. The EBITDA margin for the quarter ended March 31, 2011 was 37.0%. The EBIT for the quarter ended March 31, 2011 was Rs 2,672 million. Capital Expenditure During the quarter ended March 31, 2011, the company incurred a capital expenditure of Rs 5,716 million on its Passive Infrastructure Services.
Towers and Sharing Operators – Infratel As at the end of the quarter, the company had 32,792 towers. Sharing factor for the quarter ended March 31, 2011 was 1.73 times. Towers and Sharing Operators – Indus Towers As at the end of the quarter, the company had 108,586 towers. Sharing factor for the quarter ended March 31, 2011 was 1.83 times.

Page 23 of 49
Mobile Services - Africa
Customer Base, ARPU and MoU As at the end of the quarter the company had 44.2 million GSM mobile customers on its network. During the quarter, the company added 2.1 million customers. The ARPU for the quarter was US$ 7.2 per month. The blended monthly usage per customer, during the quarter was at 115 minutes.
Revenues, EBITDA and EBIT During the quarter, the revenue for Africa‟s Operation‟s was US$ 924 million and EBITDA was US$ 243 million (EBITDA margin 26.4%). The EBIT for the quarter ended March 31, 2011 was US$ 55 million. Capital Expenditure During the quarter ended March 31, 2011, the company incurred a capital expenditure of US $ 382 million on its African Operation.
Page 24 of 49
SECTION 6
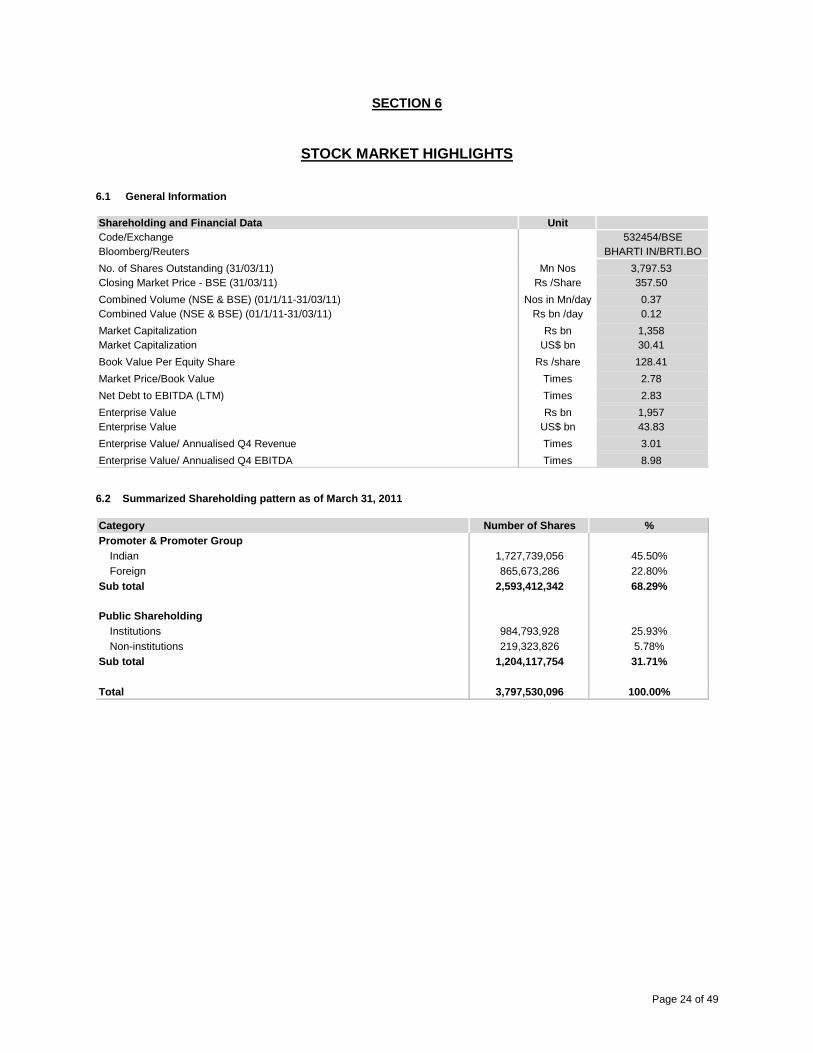
STOCK MARKET HIGHLIGHTS 6.1 General Information
Shareholding and Financial Data Unit
Code/Exchange 532454/BSE
Bloomberg/Reuters BHARTI IN/BRTI.BO
No. of Shares Outstanding (31/03/11) Mn Nos 3,797.53
Closing Market Price - BSE (31/03/11) Rs /Share 357.50
Combined Volume (NSE & BSE) (01/1/11-31/03/11) Nos in Mn/day 0.37
Combined Value (NSE & BSE) (01/1/11-31/03/11) Rs bn /day 0.12
Market Capitalization Rs bn 1,358
Market Capitalization US$ bn 30.41
Book Value Per Equity Share Rs /share 128.41
Market Price/Book Value Times 2.78
Net Debt to EBITDA (LTM) Times 2.83
Enterprise Value Rs bn 1,957
Enterprise Value US$ bn 43.83
Enterprise Value/ Annualised Q4 Revenue Times 3.01
Enterprise Value/ Annualised Q4 EBITDA Times 8.98 6.2 Summarized Shareholding pattern as of March 31, 2011
Category Number of Shares %
Promoter & Promoter Group
Indian 1,727,739,056 45.50%
Foreign 865,673,286 22.80%
Sub total 2,593,412,342 68.29%
Public Shareholding
Institutions 984,793,928 25.93%
Non-institutions 219,323,826 5.78%
Sub total 1,204,117,754 31.71%
Total 3,797,530,096 100.00%
Page 25 of 49
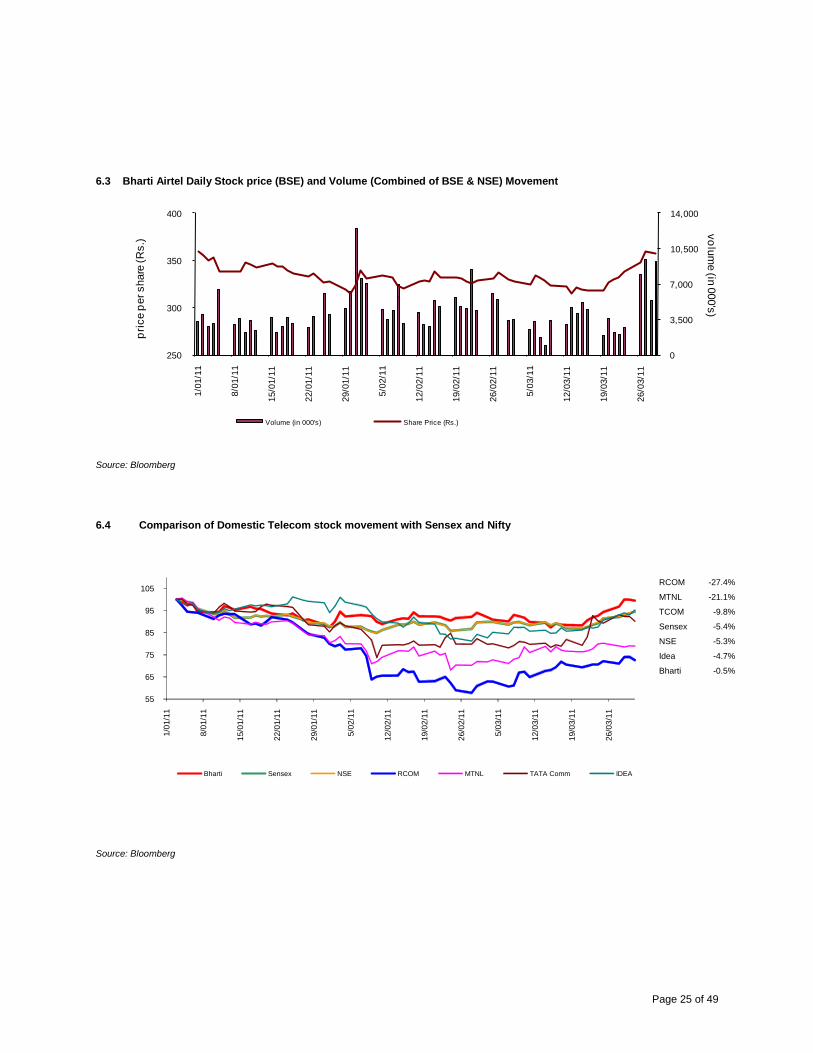
6.3 Bharti Airtel Daily Stock price (BSE) and Volume (Combined of BSE & NSE) Movement
0
3,500
7,000
10,500
14,000
250
300
350
400
1/0
1/1
1
8/0
1/1
1
15
/01
/11
22
/01
/11
29/0
1/1
1
5/0
2/1
1
12/0
2/1
1
19
/02
/11
26/0
2/1
1
5/0
3/1
1
12
/03
/11
19/0
3/1
1
26
/03
/11
vo
lum
e (in
000's
)
pri
ce p
er share
(R
s.)
Volume (in 000's) Share Price (Rs.)
`
Source: Bloomberg
6.4 Comparison of Domestic Telecom stock movement with Sensex and Nifty
RCOM -27.4%
MTNL -21.1%
TCOM -9.8%
Sensex -5.4%
NSE -5.3%
Idea -4.7%
Bharti -0.5%
55
65
75
85
95
105
1/0
1/1
1
8/0
1/1
1
15/0
1/1
1
22/0
1/1
1
29/0
1/1
1
5/0
2/1
1
12/0
2/1
1
19/0
2/1
1
26/0
2/1
1
5/0
3/1
1
12/0
3/1
1
19/0
3/1
1
26/0
3/1
1
Bharti Sensex NSE RCOM MTNL TATA Comm IDEA
Source: Bloomberg
Page 26 of 49
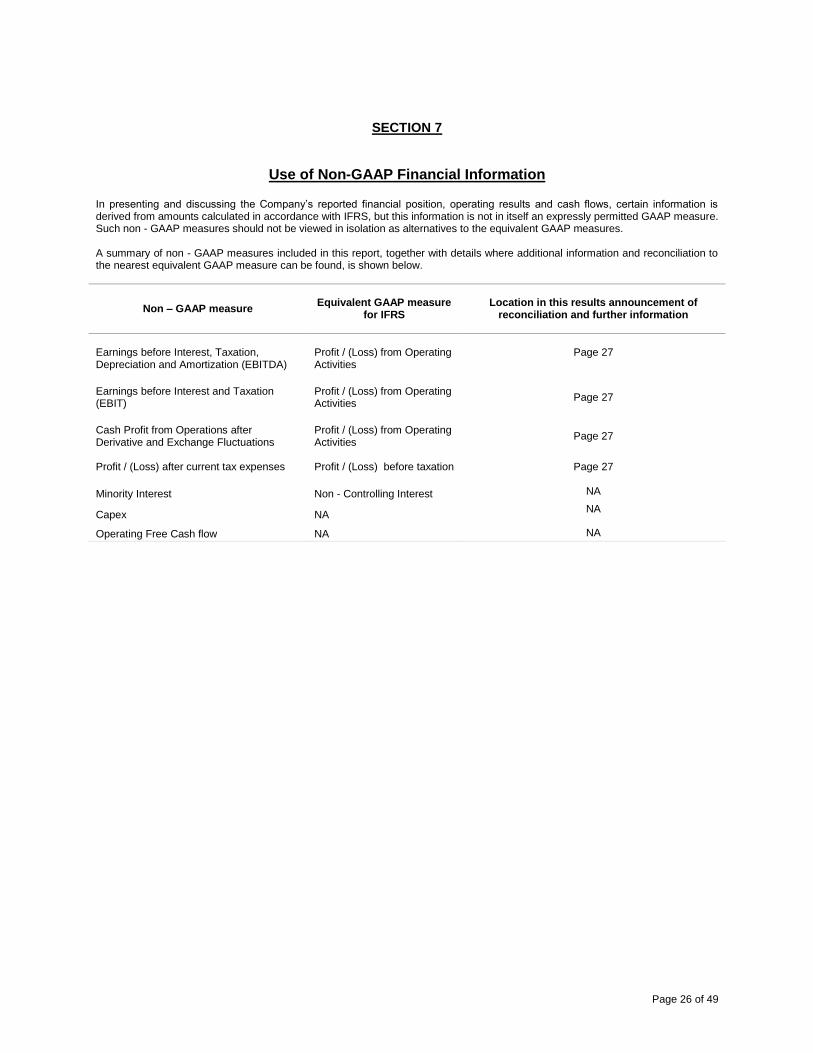
SECTION 7
Use of Non-GAAP Financial Information
In presenting and discussing the Company‟s reported financial position, operating results and cash flows, certain information is derived from amounts calculated in accordance with IFRS, but this information is not in itself an expressly permitted GAAP measure. Such non - GAAP measures should not be viewed in isolation as alternatives to the equivalent GAAP measures. A summary of non - GAAP measures included in this report, together with details where additional information and reconciliation to the nearest equivalent GAAP measure can be found, is shown below.
Non – GAAP measure Equivalent GAAP measure
for IFRS
Location in this results announcement of
reconciliation and further information
Earnings before Interest, Taxation, Depreciation and Amortization (EBITDA)
Profit / (Loss) from Operating Activities
Page 27
Earnings before Interest and Taxation (EBIT)
Profit / (Loss) from Operating Activities
Page 27
Cash Profit from Operations after Derivative and Exchange Fluctuations
Profit / (Loss) from Operating Activities
Page 27
Profit / (Loss) after current tax expenses Profit / (Loss) before taxation Page 27 Minority Interest
Non - Controlling Interest
NA
Capex NA NA
Operating Free Cash flow NA NA
Page 27 of 49
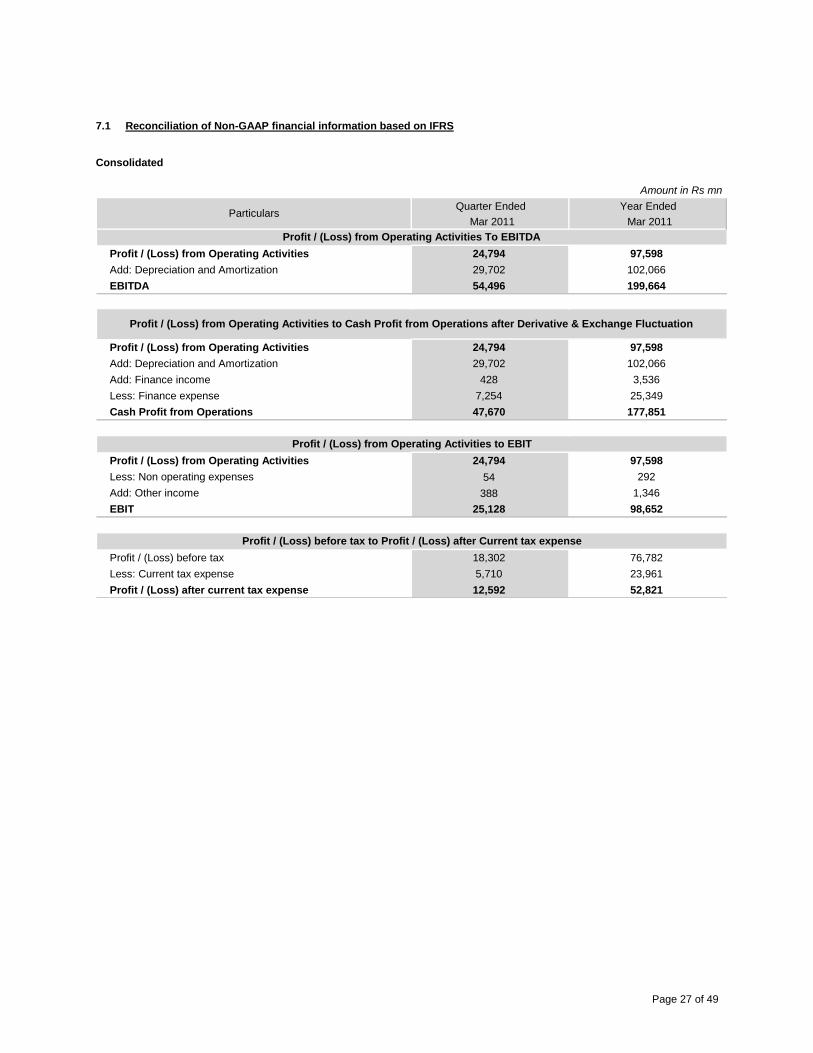
7.1 Reconciliation of Non-GAAP financial information based on IFRS Consolidated
Amount in Rs mn
Quarter Ended Year Ended
Mar 2011 Mar 2011
Profit / (Loss) from Operating Activities 24,794 97,598
Add: Depreciation and Amortization 29,702 102,066
EBITDA 54,496 199,664
Profit / (Loss) from Operating Activities 24,794 97,598
Add: Depreciation and Amortization 29,702 102,066
Add: Finance income 428 3,536
Less: Finance expense 7,254 25,349
Cash Profit from Operations 47,670 177,851
Profit / (Loss) from Operating Activities 24,794 97,598
Less: Non operating expenses 54 292
Add: Other income 388 1,346
EBIT 25,128 98,652
Profit / (Loss) before tax 18,302 76,782
Less: Current tax expense 5,710 23,961
Profit / (Loss) after current tax expense 12,592 52,821
Profit / (Loss) from Operating Activities to EBIT
Profit / (Loss) before tax to Profit / (Loss) after Current tax expense
Particulars
Profit / (Loss) from Operating Activities To EBITDA
Profit / (Loss) from Operating Activities to Cash Profit from Operations after Derivative & Exchange Fluctuation
Page 28 of 49
7.2 Schedules to Financial Statements 7.2.1 India & South Asia 7.2.1.1 Schedule of Operating Expenses
Amount in Rs mn
ParticularsQuarter Ended
Mar 31, 2011
Year Ended
Mar 31, 2011
Access charges 13,127 51,186
Licence fees, revenue share & spectrum charges 12,344 47,515
Network operations costs 28,498 106,236
Cost of goods sold 287 980
Employee costs 4,916 19,629
Selling, general and adminstration expense 17,680 67,821
Operating Expenses 76,852 293,367 7.2.1.2 Schedule of Depreciation & Amortisation
Amount in Rs mn
ParticularsQuarter Ended
Mar 31, 2011
Year Ended
Mar 31, 2011
Fixed Assets 19,728 72,104
Licence Fees 756 1,375
Intangibles 669 2,459
Depreciation and Amortization 21,153 75,938
7.2.1.3 Schedule of Net Debt
Amount in Rs mn
ParticularsAs at
Mar 31, 2011
Long term debt, net of current portion 115,157
Short-term borrowings and current portion of long-term debt 43,163
Less:
Cash and Cash Equivalents 4,408
Restricted Cash 104
Restricted Cash, non-current 413
Short term investments 6,224
Net Debt 147,171 7.2.1.4 Schedule of Finance Cost
Amount in Rs mn
ParticularsQuarter Ended
Mar 31, 2011
Year Ended
Mar 31, 2011
Interest on borrowings 1,620 5,903
Finance Charges 268 1,169
Investment Income (279) (1,610)
Derivatives and exchange fluctuation 76 (328)
Finance cost (net) 1,685 5,134
Note 13: Inter segment borrowing cost / income eliminated within respective segments 7.2.1.5 Schedule of Income Tax
Amount in Rs mn
ParticularsQuarter Ended
Mar 31, 2011
Year Ended
Mar 31, 2011
Current tax expense 4,535 20,411
Deferred tax expense / (income) (1,172) (6,414)
Income tax expense 3,363 13,997
Page 29 of 49
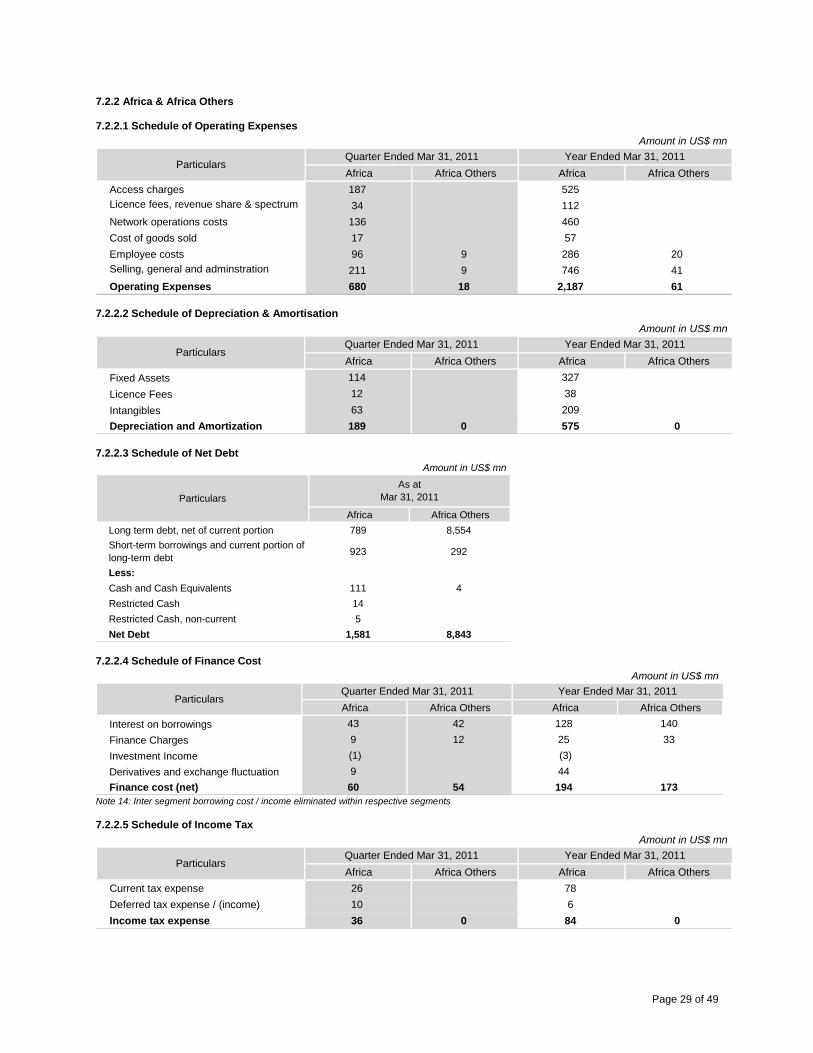
7.2.2 Africa & Africa Others 7.2.2.1 Schedule of Operating Expenses
Amount in US$ mn
Africa Africa Others Africa Africa Others
Access charges 187 525
Licence fees, revenue share & spectrum
charges34 112
Network operations costs 136 460
Cost of goods sold 17 57
Employee costs 96 9 286 20
Selling, general and adminstration
expense211 9 746 41
Operating Expenses 680 18 2,187 61
ParticularsQuarter Ended Mar 31, 2011 Year Ended Mar 31, 2011
7.2.2.2 Schedule of Depreciation & Amortisation
Amount in US$ mn
Africa Africa Others Africa Africa Others
Fixed Assets 114 327
Licence Fees 12 38
Intangibles 63 209
Depreciation and Amortization 189 0 575 0
ParticularsQuarter Ended Mar 31, 2011 Year Ended Mar 31, 2011
7.2.2.3 Schedule of Net Debt
Amount in US$ mn
Africa Africa Others
Long term debt, net of current portion 789 8,554
Short-term borrowings and current portion of
long-term debt923 292
Less:
Cash and Cash Equivalents 111 4
Restricted Cash 14
Restricted Cash, non-current 5
Net Debt 1,581 8,843
Particulars
As at
Mar 31, 2011
7.2.2.4 Schedule of Finance Cost
Amount in US$ mn
Africa Africa Others Africa Africa Others
Interest on borrowings 43 42 128 140
Finance Charges 9 12 25 33
Investment Income (1) (3)
Derivatives and exchange fluctuation 9 44
Finance cost (net) 60 54 194 173
ParticularsQuarter Ended Mar 31, 2011 Year Ended Mar 31, 2011
Note 14: Inter segment borrowing cost / income eliminated within respective segments 7.2.2.5 Schedule of Income Tax
Amount in US$ mn
Africa Africa Others Africa Africa Others
Current tax expense 26 78
Deferred tax expense / (income) 10 6
Income tax expense 36 0 84 0
ParticularsQuarter Ended Mar 31, 2011 Year Ended Mar 31, 2011
Page 30 of 49
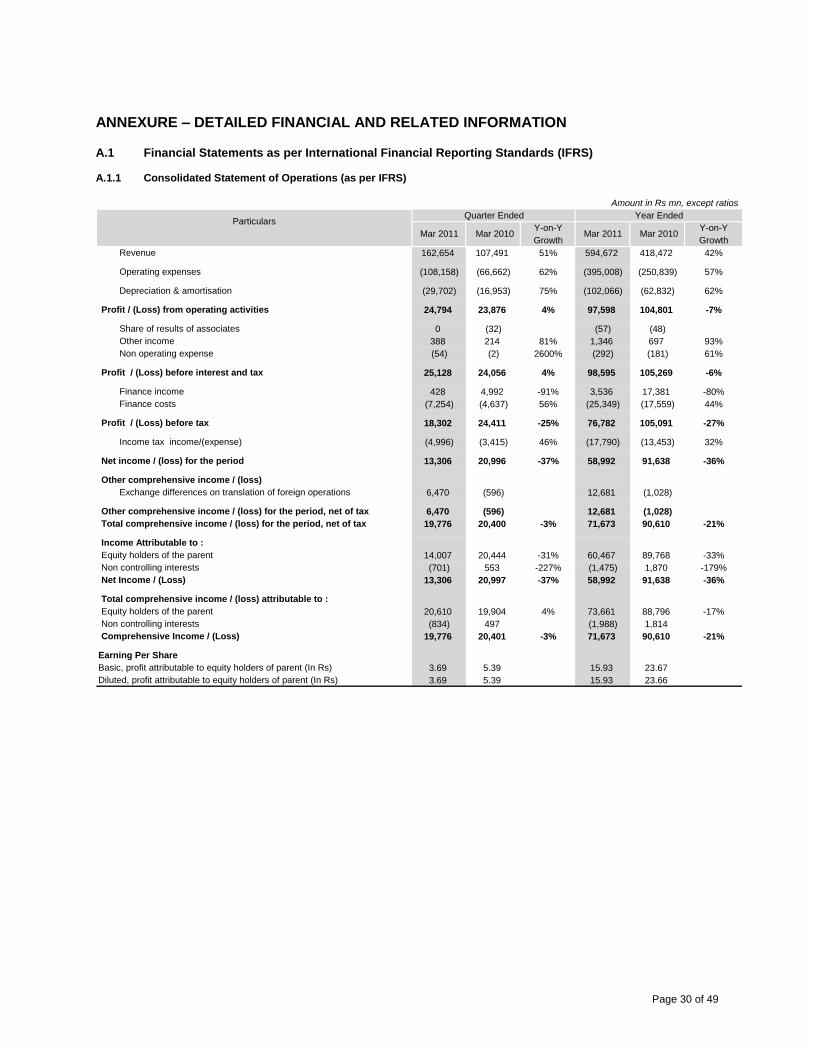
ANNEXURE – DETAILED FINANCIAL AND RELATED INFORMATION A.1 Financial Statements as per International Financial Reporting Standards (IFRS) A.1.1 Consolidated Statement of Operations (as per IFRS)
Amount in Rs mn, except ratios
Y-on-Y Y-on-Y
Growth Growth
Revenue 162,654 107,491 51% 594,672 418,472 42%
Operating expenses (108,158) (66,662) 62% (395,008) (250,839) 57%
Depreciation & amortisation (29,702) (16,953) 75% (102,066) (62,832) 62%
Profit / (Loss) from operating activities 24,794 23,876 4% 97,598 104,801 -7%
Share of results of associates 0 (32) (57) (48)
Other income 388 214 81% 1,346 697 93%
Non operating expense (54) (2) 2600% (292) (181) 61%
Profit / (Loss) before interest and tax 25,128 24,056 4% 98,595 105,269 -6%
Finance income 428 4,992 -91% 3,536 17,381 -80%
Finance costs (7,254) (4,637) 56% (25,349) (17,559) 44%
Profit / (Loss) before tax 18,302 24,411 -25% 76,782 105,091 -27%
Income tax income/(expense) (4,996) (3,415) 46% (17,790) (13,453) 32%
Net income / (loss) for the period 13,306 20,996 -37% 58,992 91,638 -36%
Other comprehensive income / (loss)
Exchange differences on translation of foreign operations 6,470 (596) 12,681 (1,028)
Other comprehensive income / (loss) for the period, net of tax 6,470 (596) 12,681 (1,028)
Total comprehensive income / (loss) for the period, net of tax 19,776 20,400 -3% 71,673 90,610 -21%
Income Attributable to :
Equity holders of the parent 14,007 20,444 -31% 60,467 89,768 -33%
Non controlling interests (701) 553 -227% (1,475) 1,870 -179%
Net Income / (Loss) 13,306 20,997 -37% 58,992 91,638 -36%
Total comprehensive income / (loss) attributable to :
Equity holders of the parent 20,610 19,904 4% 73,661 88,796 -17%
Non controlling interests (834) 497 (1,988) 1,814
Comprehensive Income / (Loss) 19,776 20,401 -3% 71,673 90,610 -21%
Earning Per Share
Basic, profit attributable to equity holders of parent (In Rs) 3.69 5.39 15.93 23.67
Diluted, profit attributable to equity holders of parent (In Rs) 3.69 5.39 15.93 23.66
ParticularsQuarter Ended Year Ended
Mar 2011 Mar 2010 Mar 2011 Mar 2010
Page 31 of 49
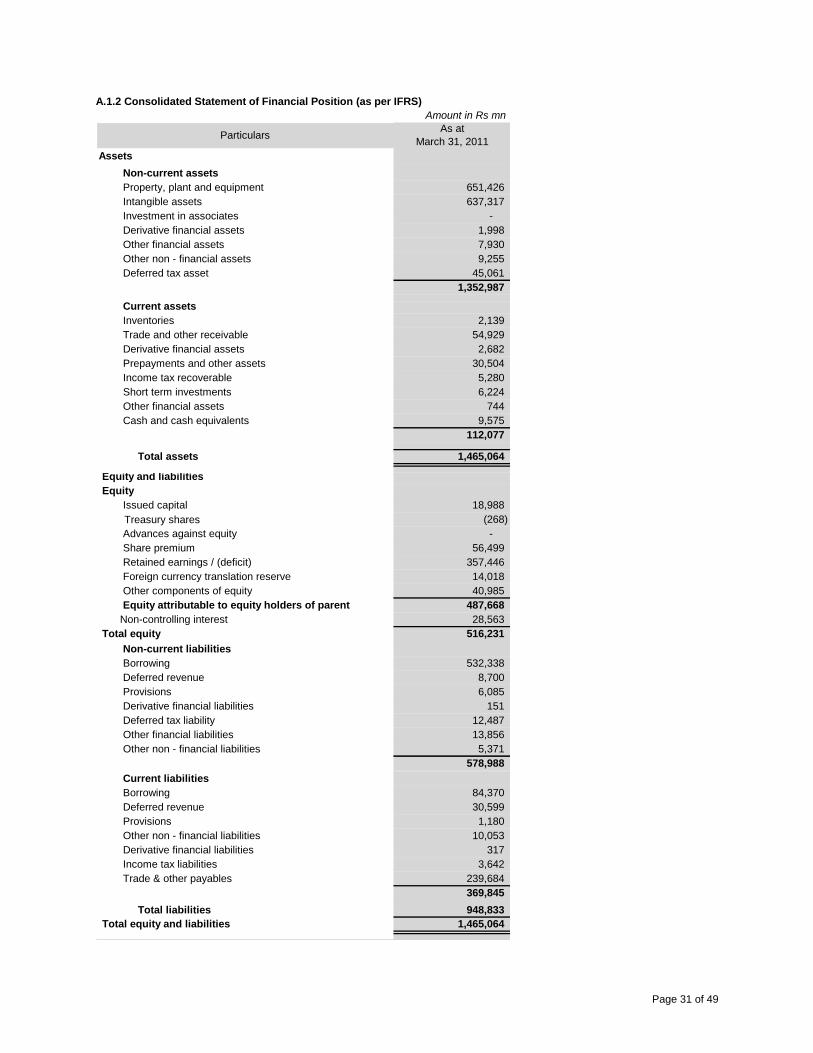
A.1.2 Consolidated Statement of Financial Position (as per IFRS)
Amount in Rs mn
As at
March 31, 2011
Assets
Non-current assets
Property, plant and equipment 651,426
Intangible assets 637,317
Investment in associates -
Derivative financial assets 1,998
Other financial assets 7,930
Other non - financial assets 9,255
Deferred tax asset 45,061
1,352,987
Current assets
Inventories 2,139
Trade and other receivable 54,929
Derivative financial assets 2,682
Prepayments and other assets 30,504
Income tax recoverable 5,280
Short term investments 6,224
Other financial assets 744
Cash and cash equivalents 9,575
112,077
Total assets 1,465,064
Equity and liabilities
Equity
Issued capital 18,988
Treasury shares (268)
Advances against equity -
Share premium 56,499
Retained earnings / (deficit) 357,446
Foreign currency translation reserve 14,018
Other components of equity 40,985
Equity attributable to equity holders of parent 487,668
Non-controlling interest 28,563
Total equity 516,231
Non-current liabilities
Borrowing 532,338
Deferred revenue 8,700
Provisions 6,085
Derivative financial liabilities 151
Deferred tax liability 12,487
Other financial liabilities 13,856
Other non - financial liabilities 5,371
578,988
Current liabilities
Borrowing 84,370
Deferred revenue 30,599
Provisions 1,180
Other non - financial liabilities 10,053
Derivative financial liabilities 317
Income tax liabilities 3,642
Trade & other payables 239,684
369,845
Total liabilities 948,833
Total equity and liabilities 1,465,064
Particulars
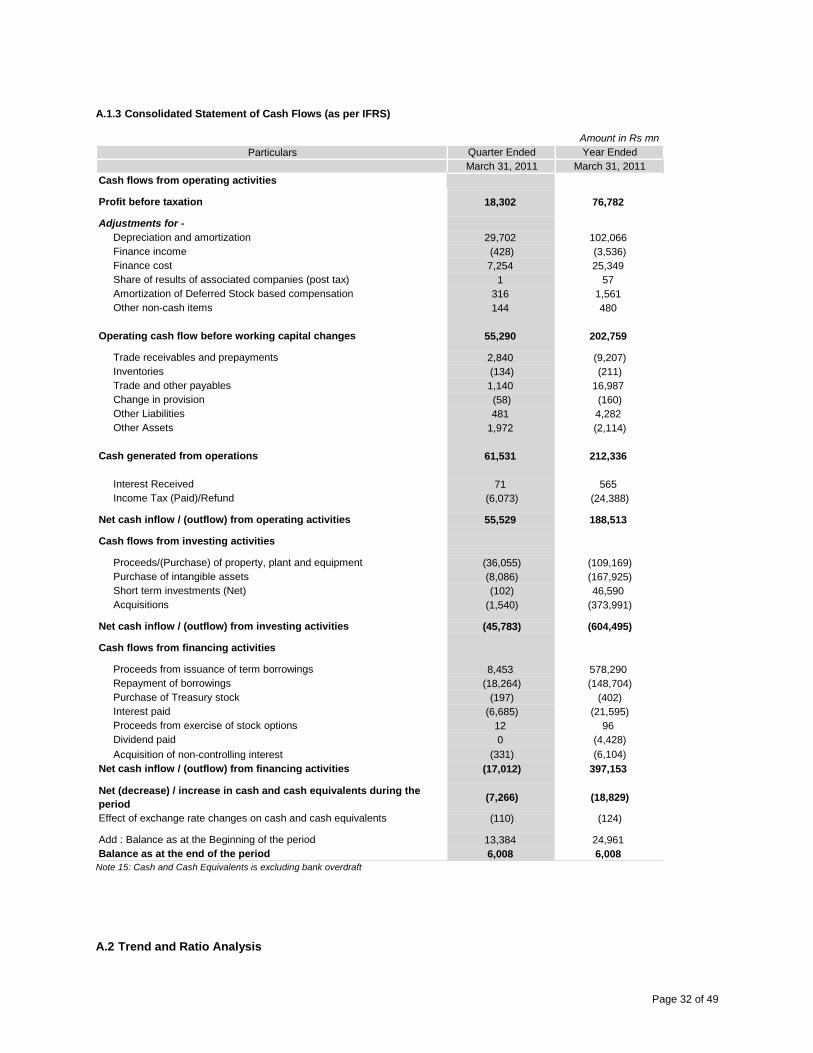
Page 32 of 49
A.1.3 Consolidated Statement of Cash Flows (as per IFRS)
Amount in Rs mn
Particulars Quarter Ended Year Ended
March 31, 2011 March 31, 2011
Cash flows from operating activities
Profit before taxation 18,302 76,782
Adjustments for -
Depreciation and amortization 29,702 102,066
Finance income (428) (3,536)
Finance cost 7,254 25,349
Share of results of associated companies (post tax) 1 57
Amortization of Deferred Stock based compensation 316 1,561
Other non-cash items 144 480
Operating cash flow before working capital changes 55,290 202,759
Trade receivables and prepayments 2,840 (9,207)
Inventories (134) (211)
Trade and other payables 1,140 16,987
Change in provision (58) (160)
Other Liabilities 481 4,282
Other Assets 1,972 (2,114)
Cash generated from operations 61,531 212,336
Interest Received 71 565
Income Tax (Paid)/Refund (6,073) (24,388)
Net cash inflow / (outflow) from operating activities 55,529 188,513
Cash flows from investing activities
Proceeds/(Purchase) of property, plant and equipment (36,055) (109,169)
Purchase of intangible assets (8,086) (167,925)
Short term investments (Net) (102) 46,590
Acquisitions (1,540) (373,991)
Net cash inflow / (outflow) from investing activities (45,783) (604,495)
Cash flows from financing activities
Proceeds from issuance of term borrowings 8,453 578,290
Repayment of borrowings (18,264) (148,704)
Purchase of Treasury stock (197) (402)
Interest paid (6,685) (21,595)
Proceeds from exercise of stock options 12 96
Dividend paid 0 (4,428)
Acquisition of non-controlling interest (331) (6,104)
Net cash inflow / (outflow) from financing activities (17,012) 397,153
Net (decrease) / increase in cash and cash equivalents during the
period(7,266) (18,829)
Effect of exchange rate changes on cash and cash equivalents (110) (124)
Add : Balance as at the Beginning of the period 13,384 24,961
Balance as at the end of the period 6,008 6,008 Note 15: Cash and Cash Equivalents is excluding bank overdraft
A.2 Trend and Ratio Analysis
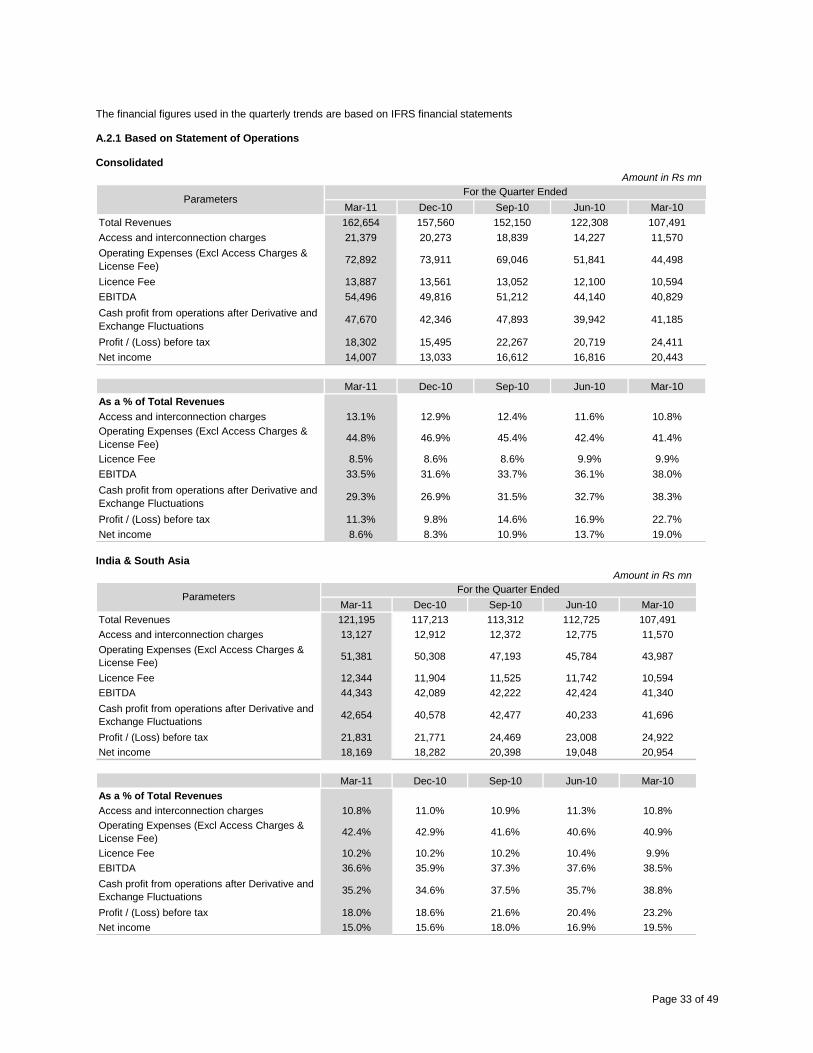
Page 33 of 49
The financial figures used in the quarterly trends are based on IFRS financial statements
A.2.1 Based on Statement of Operations
Consolidated
Amount in Rs mn
Mar-11 Dec-10 Sep-10 Jun-10 Mar-10
Total Revenues 162,654 157,560 152,150 122,308 107,491
Access and interconnection charges 21,379 20,273 18,839 14,227 11,570
Operating Expenses (Excl Access Charges &
License Fee)72,892 73,911 69,046 51,841 44,498
Licence Fee 13,887 13,561 13,052 12,100 10,594
EBITDA 54,496 49,816 51,212 44,140 40,829
Cash profit from operations after Derivative and
Exchange Fluctuations47,670 42,346 47,893 39,942 41,185
Profit / (Loss) before tax 18,302 15,495 22,267 20,719 24,411
Net income 14,007 13,033 16,612 16,816 20,443
Mar-11 Dec-10 Sep-10 Jun-10 Mar-10
As a % of Total Revenues
Access and interconnection charges 13.1% 12.9% 12.4% 11.6% 10.8%
Operating Expenses (Excl Access Charges &
License Fee)44.8% 46.9% 45.4% 42.4% 41.4%
Licence Fee 8.5% 8.6% 8.6% 9.9% 9.9%
EBITDA 33.5% 31.6% 33.7% 36.1% 38.0%
Cash profit from operations after Derivative and
Exchange Fluctuations29.3% 26.9% 31.5% 32.7% 38.3%
Profit / (Loss) before tax 11.3% 9.8% 14.6% 16.9% 22.7%
Net income 8.6% 8.3% 10.9% 13.7% 19.0%
ParametersFor the Quarter Ended
India & South Asia
Amount in Rs mn
Mar-11 Dec-10 Sep-10 Jun-10 Mar-10
Total Revenues 121,195 117,213 113,312 112,725 107,491
Access and interconnection charges 13,127 12,912 12,372 12,775 11,570
Operating Expenses (Excl Access Charges &
License Fee)51,381 50,308 47,193 45,784 43,987
Licence Fee 12,344 11,904 11,525 11,742 10,594
EBITDA 44,343 42,089 42,222 42,424 41,340
Cash profit from operations after Derivative and
Exchange Fluctuations42,654 40,578 42,477 40,233 41,696
Profit / (Loss) before tax 21,831 21,771 24,469 23,008 24,922
Net income 18,169 18,282 20,398 19,048 20,954
Mar-11 Dec-10 Sep-10 Jun-10 Mar-10
As a % of Total Revenues
Access and interconnection charges 10.8% 11.0% 10.9% 11.3% 10.8%
Operating Expenses (Excl Access Charges &
License Fee)42.4% 42.9% 41.6% 40.6% 40.9%
Licence Fee 10.2% 10.2% 10.2% 10.4% 9.9%
EBITDA 36.6% 35.9% 37.3% 37.6% 38.5%
Cash profit from operations after Derivative and
Exchange Fluctuations35.2% 34.6% 37.5% 35.7% 38.8%
Profit / (Loss) before tax 18.0% 18.6% 21.6% 20.4% 23.2%
Net income 15.0% 15.6% 18.0% 16.9% 19.5%
ParametersFor the Quarter Ended
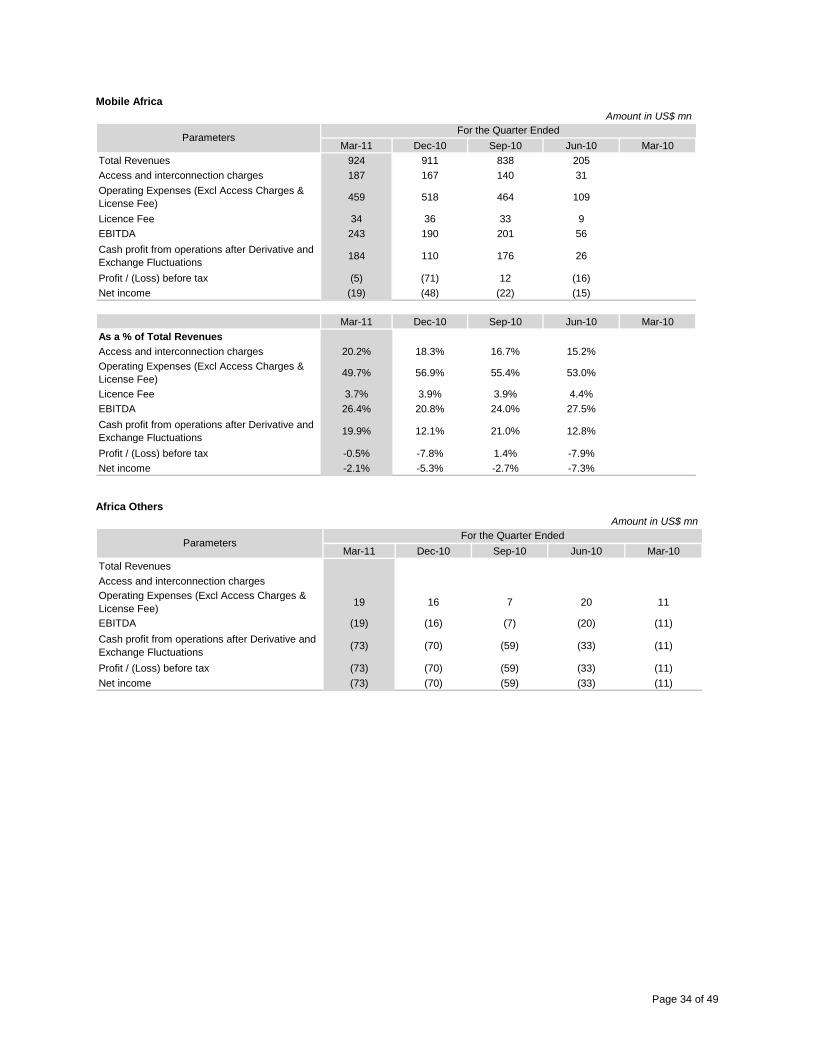
Page 34 of 49
Mobile Africa
Amount in US$ mn
Mar-11 Dec-10 Sep-10 Jun-10 Mar-10
Total Revenues 924 911 838 205
Access and interconnection charges 187 167 140 31
Operating Expenses (Excl Access Charges &
License Fee)459 518 464 109
Licence Fee 34 36 33 9
EBITDA 243 190 201 56
Cash profit from operations after Derivative and
Exchange Fluctuations184 110 176 26
Profit / (Loss) before tax (5) (71) 12 (16)
Net income (19) (48) (22) (15)
Mar-11 Dec-10 Sep-10 Jun-10 Mar-10
As a % of Total Revenues
Access and interconnection charges 20.2% 18.3% 16.7% 15.2%
Operating Expenses (Excl Access Charges &
License Fee)49.7% 56.9% 55.4% 53.0%
Licence Fee 3.7% 3.9% 3.9% 4.4%
EBITDA 26.4% 20.8% 24.0% 27.5%
Cash profit from operations after Derivative and
Exchange Fluctuations19.9% 12.1% 21.0% 12.8%
Profit / (Loss) before tax -0.5% -7.8% 1.4% -7.9%
Net income -2.1% -5.3% -2.7% -7.3%
ParametersFor the Quarter Ended
Africa Others
Amount in US$ mn
Mar-11 Dec-10 Sep-10 Jun-10 Mar-10
Total Revenues
Access and interconnection charges
Operating Expenses (Excl Access Charges &
License Fee)19 16 7 20 11
EBITDA (19) (16) (7) (20) (11)
Cash profit from operations after Derivative and
Exchange Fluctuations(73) (70) (59) (33) (11)
Profit / (Loss) before tax (73) (70) (59) (33) (11)
Net income (73) (70) (59) (33) (11)
ParametersFor the Quarter Ended
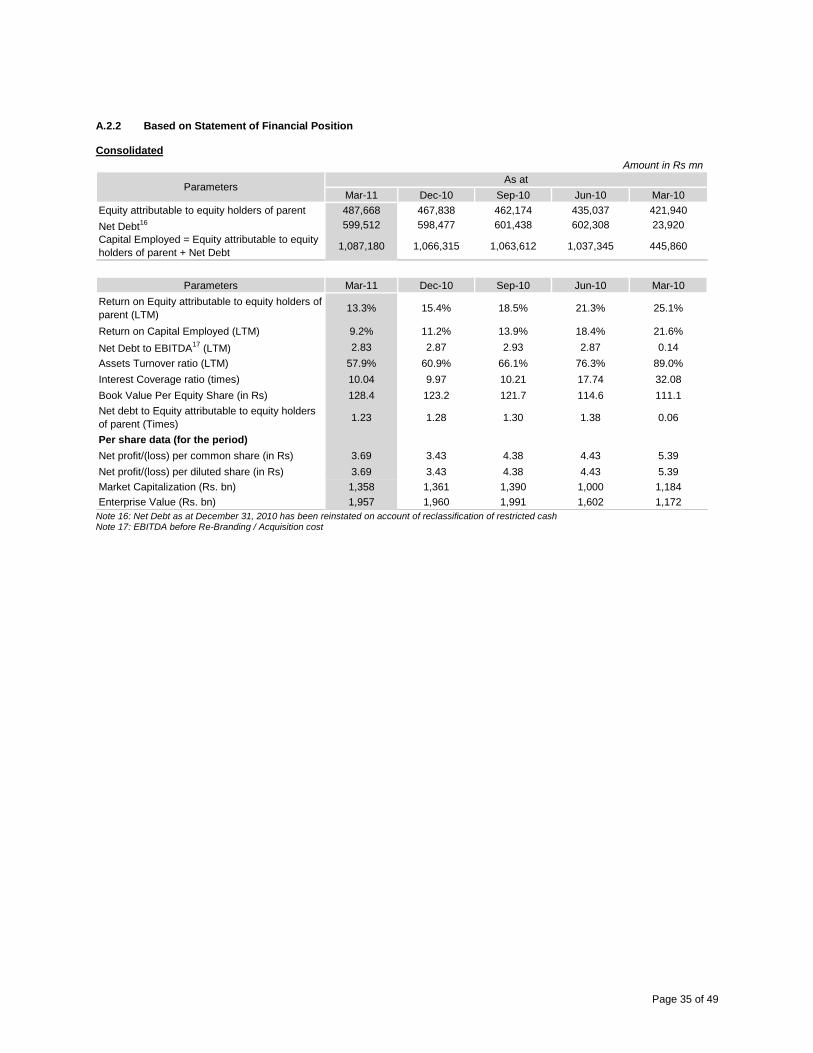
Page 35 of 49
A.2.2 Based on Statement of Financial Position Consolidated
Amount in Rs mn
Mar-11 Dec-10 Sep-10 Jun-10 Mar-10
Equity attributable to equity holders of parent 487,668 467,838 462,174 435,037 421,940
Net Debt16 599,512 598,477 601,438 602,308 23,920
Capital Employed = Equity attributable to equity
holders of parent + Net Debt1,087,180 1,066,315 1,063,612 1,037,345 445,860
Parameters Mar-11 Dec-10 Sep-10 Jun-10 Mar-10
Return on Equity attributable to equity holders of
parent (LTM)13.3% 15.4% 18.5% 21.3% 25.1%
Return on Capital Employed (LTM) 9.2% 11.2% 13.9% 18.4% 21.6%
Net Debt to EBITDA17
(LTM) 2.83 2.87 2.93 2.87 0.14
Assets Turnover ratio (LTM) 57.9% 60.9% 66.1% 76.3% 89.0%
Interest Coverage ratio (times) 10.04 9.97 10.21 17.74 32.08
Book Value Per Equity Share (in Rs) 128.4 123.2 121.7 114.6 111.1
Net debt to Equity attributable to equity holders
of parent (Times) 1.23 1.28 1.30 1.38 0.06
Per share data (for the period)
Net profit/(loss) per common share (in Rs) 3.69 3.43 4.38 4.43 5.39
Net profit/(loss) per diluted share (in Rs) 3.69 3.43 4.38 4.43 5.39
Market Capitalization (Rs. bn) 1,358 1,361 1,390 1,000 1,184
Enterprise Value (Rs. bn) 1,957 1,960 1,991 1,602 1,172
ParametersAs at
Note 16: Net Debt as at December 31, 2010 has been reinstated on account of reclassification of restricted cash Note 17: EBITDA before Re-Branding / Acquisition cost
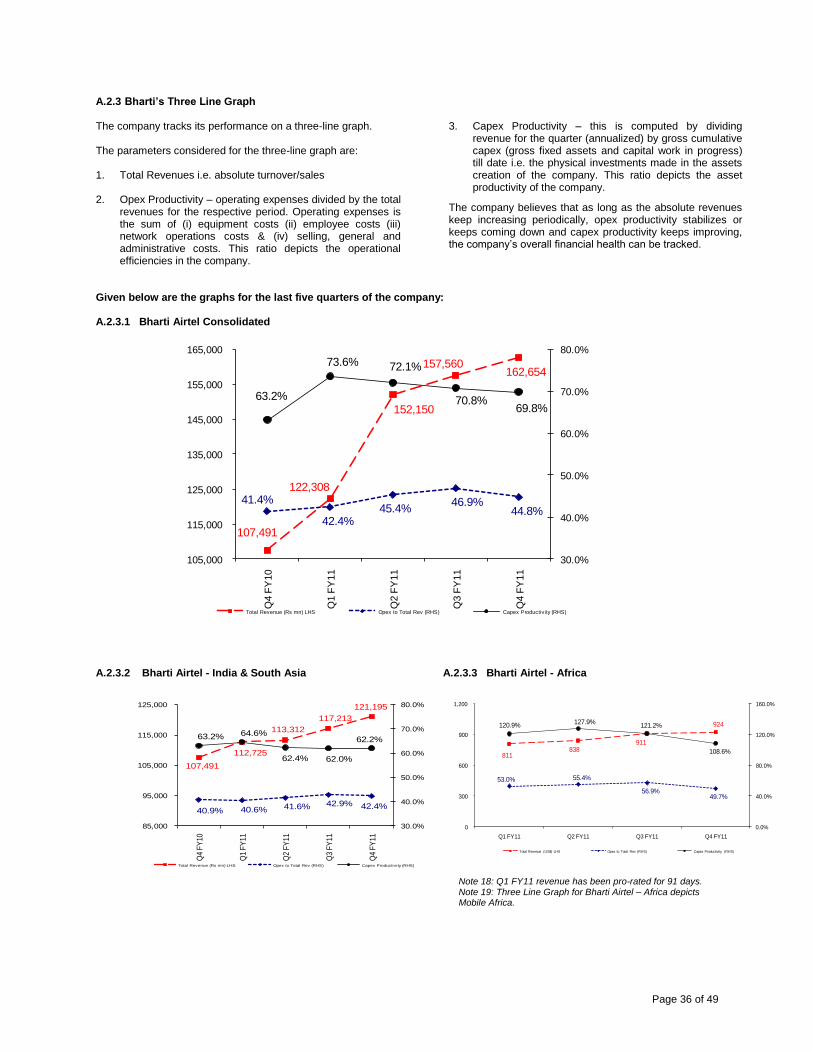
Page 36 of 49
A.2.3 Bharti’s Three Line Graph
The company tracks its performance on a three-line graph.
The parameters considered for the three-line graph are:
1. Total Revenues i.e. absolute turnover/sales 2. Opex Productivity – operating expenses divided by the total
revenues for the respective period. Operating expenses is the sum of (i) equipment costs (ii) employee costs (iii) network operations costs & (iv) selling, general and administrative costs. This ratio depicts the operational efficiencies in the company.
3. Capex Productivity – this is computed by dividing revenue for the quarter (annualized) by gross cumulative capex (gross fixed assets and capital work in progress) till date i.e. the physical investments made in the assets creation of the company. This ratio depicts the asset productivity of the company.
The company believes that as long as the absolute revenues keep increasing periodically, opex productivity stabilizes or keeps coming down and capex productivity keeps improving, the company‟s overall financial health can be tracked.
Given below are the graphs for the last five quarters of the company: A.2.3.1 Bharti Airtel Consolidated
107,491
122,308
152,150
157,560 162,654
41.4%
42.4%45.4%
46.9%44.8%
63.2%
73.6% 72.1%
70.8%69.8%
30.0%
40.0%
50.0%
60.0%
70.0%
80.0%
105,000
115,000
125,000
135,000
145,000
155,000
165,000
Q4 F
Y10
Q1 F
Y11
Q2 F
Y11
Q3 F
Y11
Q4 F
Y11
Total Revenue (Rs mn) LHS Opex to Total Rev (RHS) Capex Productivity (RHS)
A.2.3.2 Bharti Airtel - India & South Asia
107,491
112,725
113,312
117,213
121,195
40.9% 40.6% 41.6% 42.9% 42.4%
63.2% 64.6%
62.4% 62.0%
62.2%
30.0%
40.0%
50.0%
60.0%
70.0%
80.0%
85,000
95,000
105,000
115,000
125,000
Q4
FY
10
Q1
FY
11
Q2
FY
11
Q3
FY
11
Q4
FY
11
Total Revenue (Rs mn) LHS Opex to Total Rev (RHS) Capex Productivity (RHS)
A.2.3.3 Bharti Airtel - Africa
811 838
911
924
53.0% 55.4%
56.9%49.7%
120.9%127.9%
121.2%
108.6%
0.0%
40.0%
80.0%
120.0%
160.0%
0
300
600
900
1,200
Q1 FY11 Q2 FY11 Q3 FY11 Q4 FY11
Total Revenue (US$) LHS Opex to Total Rev (RHS) Capex Productivity (RHS)
Note 18: Q1 FY11 revenue has been pro-rated for 91 days. Note 19: Three Line Graph for Bharti Airtel – Africa depicts Mobile Africa.
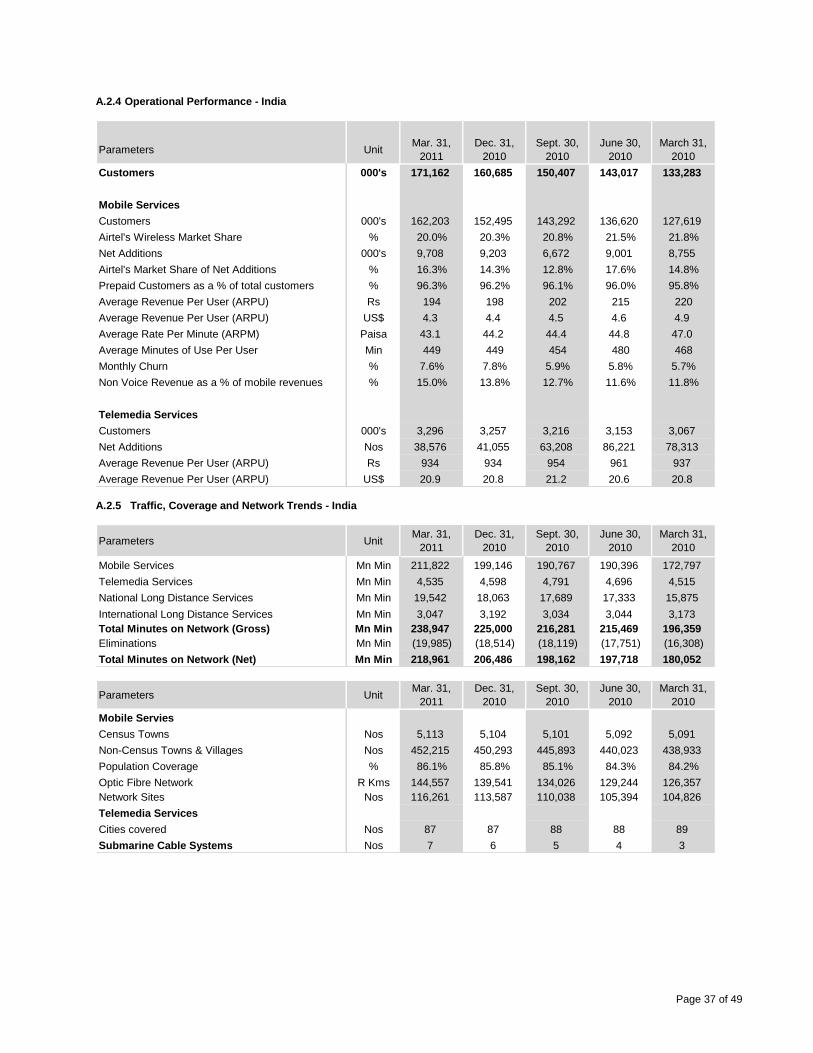
Page 37 of 49
A.2.4 Operational Performance - India
Parameters UnitMar. 31,
2011
Dec. 31,
2010
Sept. 30,
2010
June 30,
2010
March 31,
2010
Customers 000's 171,162 160,685 150,407 143,017 133,283
Mobile Services
Customers 000's 162,203 152,495 143,292 136,620 127,619
Airtel's Wireless Market Share % 20.0% 20.3% 20.8% 21.5% 21.8%
Net Additions 000's 9,708 9,203 6,672 9,001 8,755
Airtel's Market Share of Net Additions % 16.3% 14.3% 12.8% 17.6% 14.8%
Prepaid Customers as a % of total customers % 96.3% 96.2% 96.1% 96.0% 95.8%
Average Revenue Per User (ARPU) Rs 194 198 202 215 220
Average Revenue Per User (ARPU) US$ 4.3 4.4 4.5 4.6 4.9
Average Rate Per Minute (ARPM) Paisa 43.1 44.2 44.4 44.8 47.0
Average Minutes of Use Per User Min 449 449 454 480 468
Monthly Churn % 7.6% 7.8% 5.9% 5.8% 5.7%
Non Voice Revenue as a % of mobile revenues % 15.0% 13.8% 12.7% 11.6% 11.8%
Telemedia Services
Customers 000's 3,296 3,257 3,216 3,153 3,067
Net Additions Nos 38,576 41,055 63,208 86,221 78,313
Average Revenue Per User (ARPU) Rs 934 934 954 961 937
Average Revenue Per User (ARPU) US$ 20.9 20.8 21.2 20.6 20.8 A.2.5 Traffic, Coverage and Network Trends - India
Parameters UnitMar. 31,
2011
Dec. 31,
2010
Sept. 30,
2010
June 30,
2010
March 31,
2010
Mobile Services Mn Min 211,822 199,146 190,767 190,396 172,797
Telemedia Services Mn Min 4,535 4,598 4,791 4,696 4,515
National Long Distance Services Mn Min 19,542 18,063 17,689 17,333 15,875
International Long Distance Services Mn Min 3,047 3,192 3,034 3,044 3,173
Total Minutes on Network (Gross) Mn Min 238,947 225,000 216,281 215,469 196,359
Eliminations Mn Min (19,985) (18,514) (18,119) (17,751) (16,308)
Total Minutes on Network (Net) Mn Min 218,961 206,486 198,162 197,718 180,052
Parameters UnitMar. 31,
2011
Dec. 31,
2010
Sept. 30,
2010
June 30,
2010
March 31,
2010
Mobile Servies
Census Towns Nos 5,113 5,104 5,101 5,092 5,091
Non-Census Towns & Villages Nos 452,215 450,293 445,893 440,023 438,933
Population Coverage % 86.1% 85.8% 85.1% 84.3% 84.2%
Optic Fibre Network R Kms 144,557 139,541 134,026 129,244 126,357
Network Sites Nos 116,261 113,587 110,038 105,394 104,826
Telemedia Services
Cities covered Nos 87 87 88 88 89
Submarine Cable Systems Nos 7 6 5 4 3
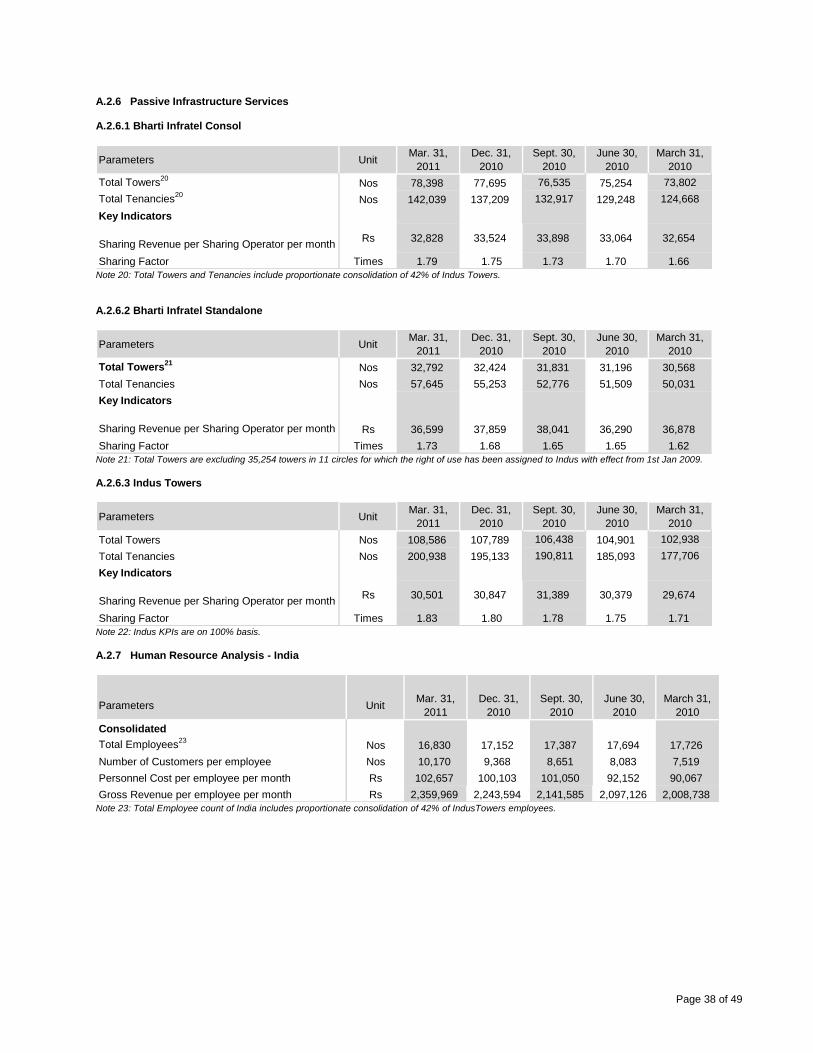
Page 38 of 49
A.2.6 Passive Infrastructure Services A.2.6.1 Bharti Infratel Consol
Parameters UnitMar. 31,
2011
Dec. 31,
2010
Sept. 30,
2010
June 30,
2010
March 31,
2010
Total Towers20
Nos 78,398 77,695 76,535 75,254 73,802
Total Tenancies20
Nos 142,039 137,209 132,917 129,248 124,668
Key Indicators
Sharing Revenue per Sharing Operator per monthRs 32,828 33,524 33,898 33,064 32,654
Sharing Factor Times 1.79 1.75 1.73 1.70 1.66 Note 20: Total Towers and Tenancies include proportionate consolidation of 42% of Indus Towers.
A.2.6.2 Bharti Infratel Standalone
Parameters UnitMar. 31,
2011
Dec. 31,
2010
Sept. 30,
2010
June 30,
2010
March 31,
2010
Total Towers21
Nos 32,792 32,424 31,831 31,196 30,568
Total Tenancies Nos 57,645 55,253 52,776 51,509 50,031
Key Indicators
Sharing Revenue per Sharing Operator per month Rs 36,599 37,859 38,041 36,290 36,878
Sharing Factor Times 1.73 1.68 1.65 1.65 1.62 Note 21: Total Towers are excluding 35,254 towers in 11 circles for which the right of use has been assigned to Indus with effect from 1st Jan 2009.
A.2.6.3 Indus Towers
Parameters UnitMar. 31,
2011
Dec. 31,
2010
Sept. 30,
2010
June 30,
2010
March 31,
2010
Total Towers Nos 108,586 107,789 106,438 104,901 102,938
Total Tenancies Nos 200,938 195,133 190,811 185,093 177,706
Key Indicators
Sharing Revenue per Sharing Operator per monthRs 30,501 30,847 31,389 30,379 29,674
Sharing Factor Times 1.83 1.80 1.78 1.75 1.71 Note 22: Indus KPIs are on 100% basis. A.2.7 Human Resource Analysis - India
Parameters UnitMar. 31,
2011
Dec. 31,
2010
Sept. 30,
2010
June 30,
2010
March 31,
2010
Consolidated
Total Employees23
Nos 16,830 17,152 17,387 17,694 17,726
Number of Customers per employee Nos 10,170 9,368 8,651 8,083 7,519
Personnel Cost per employee per month Rs 102,657 100,103 101,050 92,152 90,067
Gross Revenue per employee per month Rs 2,359,969 2,243,594 2,141,585 2,097,126 2,008,738 Note 23: Total Employee count of India includes proportionate consolidation of 42% of IndusTowers employees.
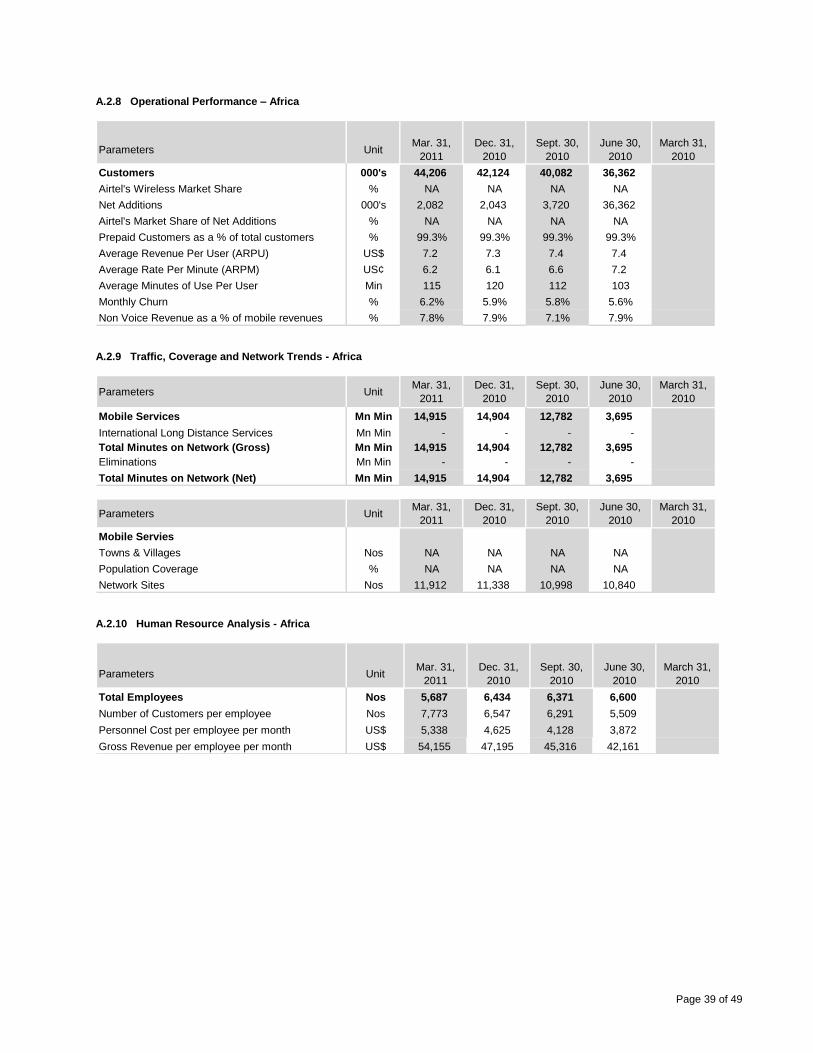
Page 39 of 49
A.2.8 Operational Performance – Africa
Parameters UnitMar. 31,
2011
Dec. 31,
2010
Sept. 30,
2010
June 30,
2010
March 31,
2010
Customers 000's 44,206 42,124 40,082 36,362
Airtel's Wireless Market Share % NA NA NA NA
Net Additions 000's 2,082 2,043 3,720 36,362
Airtel's Market Share of Net Additions % NA NA NA NA
Prepaid Customers as a % of total customers % 99.3% 99.3% 99.3% 99.3%
Average Revenue Per User (ARPU) US$ 7.2 7.3 7.4 7.4
Average Rate Per Minute (ARPM) US¢ 6.2 6.1 6.6 7.2
Average Minutes of Use Per User Min 115 120 112 103
Monthly Churn % 6.2% 5.9% 5.8% 5.6%
Non Voice Revenue as a % of mobile revenues % 7.8% 7.9% 7.1% 7.9% A.2.9 Traffic, Coverage and Network Trends - Africa
Parameters UnitMar. 31,
2011
Dec. 31,
2010
Sept. 30,
2010
June 30,
2010
March 31,
2010
Mobile Services Mn Min 14,915 14,904 12,782 3,695
International Long Distance Services Mn Min - - - -
Total Minutes on Network (Gross) Mn Min 14,915 14,904 12,782 3,695
Eliminations Mn Min - - - -
Total Minutes on Network (Net) Mn Min 14,915 14,904 12,782 3,695
Parameters UnitMar. 31,
2011
Dec. 31,
2010
Sept. 30,
2010
June 30,
2010
March 31,
2010
Mobile Servies
Towns & Villages Nos NA NA NA NA
Population Coverage % NA NA NA NA
Network Sites Nos 11,912 11,338 10,998 10,840 A.2.10 Human Resource Analysis - Africa
Parameters UnitMar. 31,
2011
Dec. 31,
2010
Sept. 30,
2010
June 30,
2010
March 31,
2010
Total Employees Nos 5,687 6,434 6,371 6,600
Number of Customers per employee Nos 7,773 6,547 6,291 5,509
Personnel Cost per employee per month US$ 5,338 4,625 4,128 3,872
Gross Revenue per employee per month US$ 54,155 47,195 45,316 42,161
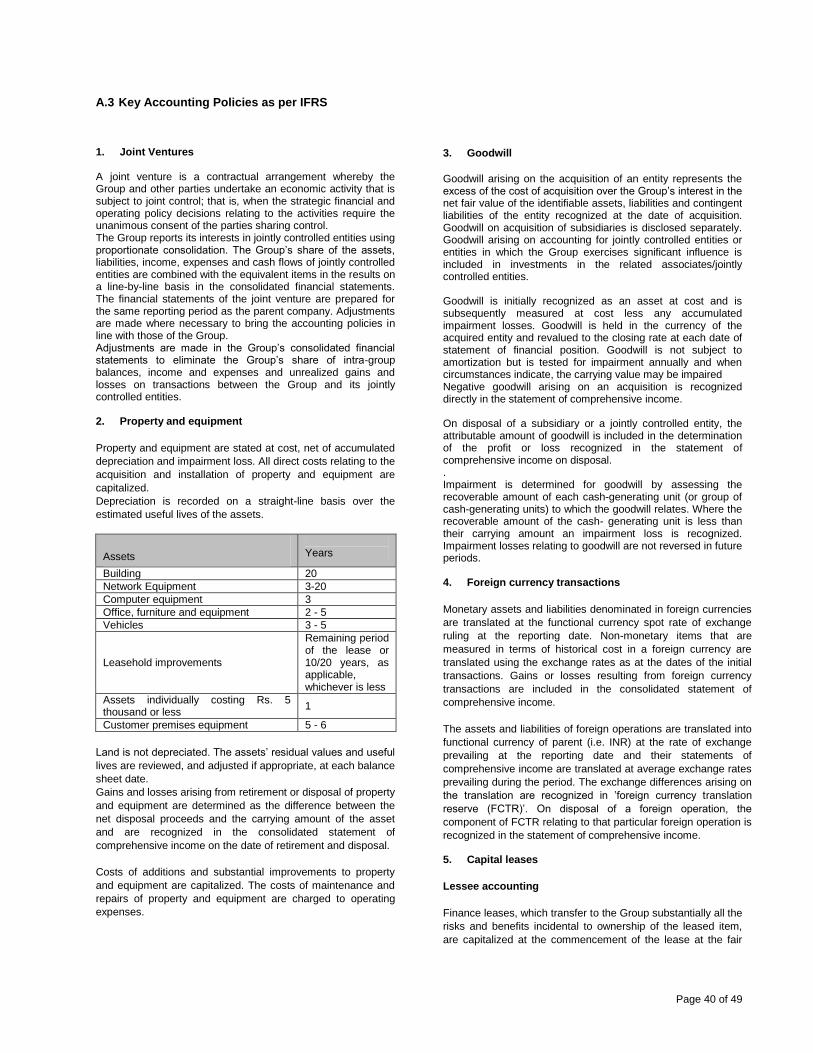
Page 40 of 49
A.3 Key Accounting Policies as per IFRS 1. Joint Ventures A joint venture is a contractual arrangement whereby the Group and other parties undertake an economic activity that is subject to joint control; that is, when the strategic financial and operating policy decisions relating to the activities require the unanimous consent of the parties sharing control. The Group reports its interests in jointly controlled entities using proportionate consolidation. The Group‟s share of the assets, liabilities, income, expenses and cash flows of jointly controlled entities are combined with the equivalent items in the results on a line-by-line basis in the consolidated financial statements. The financial statements of the joint venture are prepared for the same reporting period as the parent company. Adjustments are made where necessary to bring the accounting policies in line with those of the Group. Adjustments are made in the Group‟s consolidated financial statements to eliminate the Group‟s share of intra-group balances, income and expenses and unrealized gains and losses on transactions between the Group and its jointly controlled entities. 2. Property and equipment
Property and equipment are stated at cost, net of accumulated
depreciation and impairment loss. All direct costs relating to the
acquisition and installation of property and equipment are
capitalized.
Depreciation is recorded on a straight-line basis over the
estimated useful lives of the assets.
Assets
Years
Building 20
Network Equipment 3-20
Computer equipment 3
Office, furniture and equipment 2 - 5
Vehicles 3 - 5
Leasehold improvements
Remaining period of the lease or 10/20 years, as applicable, whichever is less
Assets individually costing Rs. 5 thousand or less
1
Customer premises equipment 5 - 6
Land is not depreciated. The assets‟ residual values and useful
lives are reviewed, and adjusted if appropriate, at each balance
sheet date.
Gains and losses arising from retirement or disposal of property
and equipment are determined as the difference between the
net disposal proceeds and the carrying amount of the asset
and are recognized in the consolidated statement of
comprehensive income on the date of retirement and disposal.
Costs of additions and substantial improvements to property
and equipment are capitalized. The costs of maintenance and
repairs of property and equipment are charged to operating
expenses.
3. Goodwill
Goodwill arising on the acquisition of an entity represents the excess of the cost of acquisition over the Group‟s interest in the net fair value of the identifiable assets, liabilities and contingent liabilities of the entity recognized at the date of acquisition. Goodwill on acquisition of subsidiaries is disclosed separately. Goodwill arising on accounting for jointly controlled entities or entities in which the Group exercises significant influence is included in investments in the related associates/jointly controlled entities. Goodwill is initially recognized as an asset at cost and is subsequently measured at cost less any accumulated impairment losses. Goodwill is held in the currency of the acquired entity and revalued to the closing rate at each date of statement of financial position. Goodwill is not subject to amortization but is tested for impairment annually and when circumstances indicate, the carrying value may be impaired Negative goodwill arising on an acquisition is recognized directly in the statement of comprehensive income. On disposal of a subsidiary or a jointly controlled entity, the attributable amount of goodwill is included in the determination of the profit or loss recognized in the statement of comprehensive income on disposal. . Impairment is determined for goodwill by assessing the recoverable amount of each cash-generating unit (or group of cash-generating units) to which the goodwill relates. Where the recoverable amount of the cash- generating unit is less than their carrying amount an impairment loss is recognized. Impairment losses relating to goodwill are not reversed in future periods. 4. Foreign currency transactions
Monetary assets and liabilities denominated in foreign currencies
are translated at the functional currency spot rate of exchange
ruling at the reporting date. Non-monetary items that are
measured in terms of historical cost in a foreign currency are
translated using the exchange rates as at the dates of the initial
transactions. Gains or losses resulting from foreign currency
transactions are included in the consolidated statement of
comprehensive income.
The assets and liabilities of foreign operations are translated into
functional currency of parent (i.e. INR) at the rate of exchange
prevailing at the reporting date and their statements of
comprehensive income are translated at average exchange rates
prevailing during the period. The exchange differences arising on
the translation are recognized in ‟foreign currency translation
reserve (FCTR)‟. On disposal of a foreign operation, the
component of FCTR relating to that particular foreign operation is
recognized in the statement of comprehensive income. 5. Capital leases
Lessee accounting
Finance leases, which transfer to the Group substantially all the
risks and benefits incidental to ownership of the leased item,
are capitalized at the commencement of the lease at the fair
Page 41 of 49
value of the leased property or, if lower, at the present value of
the minimum lease payments. Lease payments are
apportioned between finance charges and reduction of the
lease liability so as to achieve a constant rate of interest on the
remaining balance of the liability. Finance charges are
recognized in the statement of comprehensive income.
Amortization of leased assets is computed on straight line
basis over the shorter of useful life of the assets or remaining
lease period. Amortization charge for capital leases is included
in depreciation expense for the period.
Lessor accounting
Assets leased to others under capital leases are recognized as
receivables at an amount equal to the net investment in the
leased assets. The finance income is recognized based on
periodic rate of return on the net investment of the lessor
outstanding in respect of the capital lease.
6. Indefeasible right to use (IRU)
The Group enters into agreements for leasing assets under
„Indefeasible right to use‟ with third parties. Under the
arrangement the assets are taken or given on lease over the
substantial part of the asset life. However the title to the assets
and associated risks are retained by the lessor. Hence, such
arrangements are recognized as operating lease. Direct
expenditures incurred in connection with agreements are
capitalized and expensed over the term of the agreement.
The contracted price is received in advance and is recognized
as revenue during the period of the agreement. Unearned IRU
revenue net of the amount recognizable within one year is
disclosed as unearned income in non-current liabilities and the
amount recognizable within one year as unearned income in
current liabilities.
Exchange of network capabilities with other telecommunication
service providers are recorded as non-monetary transactions
and measured at the carrying amount of capacities
relinquished, as these exchanges are for similar productive
assets used to provide telecommunication services to
customers.
7. Impairment of long – lived assets and intangible assets
The Group reviews its long-lived assets, including identifiable intangibles with finite lives, for impairment whenever events or changes in business circumstances indicate that the carrying amount of assets may not be fully recoverable. Such circumstances include, though are not limited to, significant or sustained declines in revenues or earnings and material adverse changes in the economic climate. For assets that the Group intends to hold for use, if the total of the expected future undiscounted cash flows produced by the asset or asset Group is less than the carrying amount of the assets, a loss is recognized for the difference between the fair value and carrying value of the assets. For assets the Group intends to dispose of by sale, a loss is recognized for the amount by which the estimated fair value, less cost to sell, is less than the carrying value of the assets. Fair value is determined based on quoted market prices, if available, or other valuation techniques including discounted future net cash flows.
8. Revenue recognition
(i) Service revenues Service revenues include amounts invoiced for usage charges, fixed monthly subscription charges and VSAT/ internet usage charges, roaming charges, activation fees, processing fees and fees for value added services („VAS‟). Service revenues also include revenues associated with access and interconnection for usage of the telephone network of other operators for local, domestic long distance and international calls. Service revenues are recognized as the services are rendered and are stated net of discounts, waivers and taxes. Revenues from pre-paid cards are recognized based on actual usage. Activation revenue and related activation costs, not exceeding the activation revenue, are deferred and amortized over the estimated customer relationship period. The excess of activation costs over activation revenue, if any, are expensed as incurred. Subscriber acquisition costs are expensed as incurred. On introduction of new prepaid products, processing fees on recharge coupons is being recognized over the estimated customer relationship period or coupon validity period, whichever is lower. Service revenues from the internet and VSAT business comprise revenues from registration, installation and provision of internet and satellite services. Registration fee and installation charges are deferred and amortized over their expected customer relationship period of 12 months. Service revenue is recognized from the date of satisfactory installation of equipment and software at the customer site and provisioning of internet and satellite services. Revenue from prepaid dialup packs is recognized on an actual usage basis and is net of sales returns and discounts. Revenues from national and international long distance operations comprise revenue from provision of voice services which are recognized on completion of services while revenue from provision of bandwidth services is recognized over the period of arrangement. Unbilled receivables represent revenues recognized from the bill cycle date to the end of each month. These are billed in subsequent periods based on the terms of the billing plans. Unearned income includes amounts received in advance on pre-paid cards and advance monthly rentals on post-paid. The related services are expected to be performed within the next operating cycle. (ii) Equipment sales Equipment sales consist primarily of revenues from sale of VSAT and internet equipment (hardware) and related accessories to subscribers. Equipment sales are treated as activation revenue and are deferred and amortized over the customer relationship period. (iii) Multiple element arrangements The Group has entered into certain multiple-element revenue arrangements. These arrangements involve the delivery or performance of multiple products, services or rights to use assets including VSAT and internet equipment, internet and satellite services, set top boxes and subscription fees on DTH, indefeasible right to use and hardware and equipment maintenance. The Group evaluates all deliverables in an arrangement to determine whether they represent separate units of accounting at the inception of the arrangement in
Page 42 of 49
accordance “Revenue Arrangements with Multiple Deliverables” applying the hierarchy in IAS 8.12. Revenue is determined for each of the units of accounting on the basis of their fair values Arrangements involving the delivery of bundled products or services shall be separated into individual elements, each with own separate revenue contribution. Total arrangement consideration related to the bundled contract is allocated among the different elements based on their relative fair values (i.e., a ratio of the fair value of each element to the aggregated fair value of the bundled deliverables is generated). Where the Group has determined that the fair value of individual element is not ascertainable, equipment sales for these these arrangements are deferred and amortized over the term of the arrangement. 9. License fees
Acquired licenses are shown at historical cost. Licenses
acquired in a business combination are recognized at fair value
at the acquisition date. License and spectrum entry fees are
measured at cost less accumulated amortization. Amortization
is charged to the statement of comprehensive income on a
straight-line basis over the period of the license from the date
of commencement of commercial operations in the respective
jurisdiction and is disclosed as components of depreciation and
amortization. The amortization period is determined primarily
by reference to the unexpired license period.
Group‟s shares of licenses acquired under business
combination are accounted for at their respective fair values as
at the date of acquisition. The amounts are amortized on a
straight-line basis over the remaining period of the license from
the date of acquisition of respective circles.
The revenue-share fee on license and spectrum is computed
as per the licensing agreement and is expensed as incurred.
10. Other intangible assets
Other intangible assets comprising enterprise resource
planning software, bandwidth capacities, brands, customer
relationships, distribution networks, licenses and non-compete
clauses, are capitalized at the Group‟s share of respective fair
values on the date of an acquisition. Amortization is charged to
the statement of comprehensive income on a straight-line basis
over the estimated useful lives of intangible assets from the
date they are available for use or placed in service. The
intangibles are amortized as follows:
Software is amortized over the period of its license, not
exceeding three years. Software up to Rs 500 thousand
is amortised over a period of 1 year.
Bandwidth capacities are amortized over the period of
the agreement.
Brand: Over the period of their expected benefits, not
exceeding the life of the licenses and are written off in
their entirety when no longer in use.
Distribution network : Over estimated useful life
Customer base: The estimated life of such
relationships.
11. Income-taxes
Income tax assets and liabilities for the current and prior
periods are measured at the amount expected to be recovered
from or paid to the taxation authorities, and is provided using
the liability method on temporary differences at the reporting
date between the tax bases of assets and liabilities and their
carrying amounts for financial reporting purposes. Deferred tax
liabilities are recognized for all taxable temporary differences,
except:
Where the deferred tax liability arises from the initial
recognition of goodwill or of an asset or liability in a
transaction that is not a business combination and, at
the time of the transaction, affects neither the
accounting profit nor taxable profit or loss.
In respect of taxable temporary differences associated
with investments in subsidiaries, associates and
interests in joint ventures, where the timing of the
reversal of the temporary differences can be controlled
and it is probable that the temporary differences will not
reverse in the foreseeable future.
The tax rates and tax laws used to compute the amount are
those that are enacted or substantively enacted, by the
reporting date, in the countries where the Group operates and
generates taxable income.
12. Borrowing costs Borrowing costs directly attributable to the acquisition, construction or production of an asset that necessarily takes a substantial period of time to get ready for its intended use or sale are capitalized as part of the cost of the respective assets. The interest cost incurred for funding a qualifying asset during the construction period is capitalized based on actual investment in the asset at the average interest rate. All other borrowing costs are expensed in the period they occur. Borrowing costs consist of interest and other costs that the Group incurs in connection with the borrowing of funds. 13. Derivative financial instruments
The Group enters into derivative instruments, including interest
rate swaps and foreign currency forward contracts, to manage
interest rate movements of its debt obligations and foreign
currency exposures related to the import of equipment used in
operations and its foreign currency denominated debt
instruments.
All derivative instruments are recorded on the balance sheet at
their fair value. Changes in the fair value of derivatives are
recorded each period in current earnings or in other
comprehensive income, depending on whether a derivative is
designated as part of a hedging relationship and, if it is,
depending on the type of hedging relationship.
14. Asset Retirement Obligations
Asset retirement obligations (ARO) are provided for those
operating lease arrangements where the Group has a binding
obligation at the end of the lease period to restore the leased
premises in a condition similar to inception of lease. ARO are
provided at the present value of expected costs to settle the
obligation using discounted cash flows and are recognized as
part of the cost of that particular asset. The cash flows are
discounted at a current pre-tax rate that reflects the risks
specific to the decommissioning liability. The unwinding of the
discount is expensed as incurred and recognized in the
statement of comprehensive income as a finance cost. The
estimated future costs of decommissioning are reviewed
Page 43 of 49
annually and adjusted as appropriate. Changes in the
estimated future costs or in the discount rate applied are added
to or deducted from the cost of the asset.
15. Allowance for uncollectible accounts receivable
The allowance for uncollectible accounts receivable reflects
management‟s best estimate of probable losses inherent in the
accounts receivable balance. Management primarily
determines the allowance based on the aging of accounts
receivable balances and historical write-off experience, net of
recoveries. The Group provides for amounts outstanding net of
security deposits, or in specific cases where management is of
the view that the amounts are not recoverable. Amounts due
from debtors that have been outstanding, though fully provided,
are evaluated on a regular basis by the management and are
written off, if as a result of such evaluation, it is determined that
these amounts will not be collected.
16. Issuance of Stock by Subsidiaries
At the time a subsidiary sells its stock to unrelated parties at a price less than or in excess of its book value, the Company's investment in that subsidiary's net assets changes. The Company's policy is to record such changes in its consolidated statement of changes in equity.
Page 44 of 49
GLOSSARY
Technical and Industry Terms
Company Related
3G Third Generation of Mobile Telephony. ARPU (for Mobile and Telemedia Services) ARPM (Average Rate Per Minute)
Average revenue per customer per month is computed by: dividing the total revenues, excluding equipment sales during the relevant period by the average customers; and dividing the result by the number of months in the relevant period. Average Rate Per Minute is computed by: Dividing the total revenues by total minutes.
Asset Turnover
Asset Turnover is defined as total revenues, for the preceding (last) 12 months from the end of the relevant period, divided by average assets. Asset is defined as the sum of non current assets and net current assets. Net current assets are computed by subtracting current liabilities from current assets. Average assets are calculated by considering average of quarterly average for the preceding (last) four quarters from the end of the relevant period.
Average Minutes of Use per user
Average minutes of usage per customer per month is calculated by dividing the total minutes of usage (incoming, outgoing and in-roaming) on our network during the relevant period by the average customers; and dividing the result by the number of months in the relevant period.
Average Sharing Operators
Average Sharing Operators are derived by computing the average of the monthly average sharing operators for the relevant period
Average Customers Average customers are derived by computing the average of the monthly average customers for the relevant period.
Average Towers Bn
Average towers are derived by computing the average of the monthly average towers for the relevant period Billion
Book Value Per Equity Share
Total stockholder‟s equity as at the end of the relevant period divided by issued and outstanding equity shares as at the end of the relevant period.
Capex It includes investment in gross fixed assets and capital work in progress for the quarter.
Capital Employed Capital Employed is defined as sum of equity attributable to equity holders of parent and net debt.
Cash Profit From Operations
It is not a IFRS measure and is defined as operating income adjusted for depreciation and amortization, pre-operating costs, interest expense and interest income.
Churn
Churn is calculated by dividing the total number of disconnections during the relevant period by the average customers; and dividing the result by the number of months in the relevant period.
Customers Per Employee
Number of customers on networks of a business unit as at end of the relevant period divided by number of employees in the respective business unit as at end of the relevant period.
DTH Direct to Home broadcast service
Earnings Per Basic Share.
It is computed by dividing net income attributable to ordinary shareholders by the weighted average number of ordinary shares outstanding during the period.
Earnings Per Diluted Share
The calculation of Net Profit/ (loss) per diluted share adjusts net profit or loss and the weighted average number of ordinary shares outstanding, to give effect to all dilutive potential ordinary shares that were outstanding during the year.
Net profit or loss attributable to ordinary shareholders is adjusted for the after-tax effect of the following: (1) dividends on potential ordinary shares (for example, dilutive convertible preferred shares); (2) interest recognized on potential ordinary shares (for example, dilutive convertible debt); and (3) any other changes in income or expense resulting from the conversion of dilutive potential ordinary shares (e.g., an entity‟s contribution to its non-discretionary employee profit-sharing plan may be revised based on changes in net profit due to the effects of items discussed above).
EBITDA Earnings/ (loss) before interest, taxation, depreciation and amortization. It is not a IFRS measure and is defined as operating income adjusted for depreciation and amortization and pre-operating costs.
EBITDA Margin It is computed by dividing EBITDA for the relevant period by total revenues for the relevant period.
EBIT Earnings / (Loss) before interest, taxation for the relevant period.
Page 45 of 49
Gross Revenue per Employee per month
It is computed by dividing the Gross Revenue (net of inter-segment eliminations) by the closing number of employees in a given business unit and number of months in the relevant period.
ILD International Long Distance Services.
Profit / (Loss) after current tax expense
It is not a IFRS measure and is defined as Profit / (Loss) before taxation adjusted for current tax expense.
Interest Coverage Ratio EBITDA for the relevant period divided by interest on borrowing for the relevant period.
Investments in projects The investment in projects comprises gross fixed assets, intangible assets, capital work in progress, gross goodwill, investment in JV‟s and one-time entry fee paid towards acquisition of licenses.
ICT Information Communication Technology
IPTV
Internet Protocol TV. IPTV is the method of delivering and viewing television programmes using an IP transmission and service infrastructure, which can deliver digital television to the customers. IPTV when offered using an IP network and high speed broadband technology becomes interactive because of availability of return path and is capable of providing Video on Demand (VOD), time shifted television and many other exciting programmes.
LTM Last twelve months.
Market Capitalization Mn
Number of issued and outstanding shares as at end of the period multiplied by closing market price (BSE) as at end of the period. Million
MNP
Mobile Network Portability
MoU
Minutes of Usage. Duration in minutes for which a customer uses the network. It is typically expressed over a period of one month.
MPLS Multi Protocol Label Switching Network Site
Comprises of Base Transmission System (BTS) which holds the radio transreceivers (TRXs) that define a cell and coordinates the radio links protocols with the mobile device. It includes all the Ground based, Roof top and In Building Solutions as at the end of the period.
Net Debt It is not a IFRS measure and is defined as the long-term debt, net of current portion plus short-term borrowings and current portion of long-term debt minus cash and cash equivalents, restricted cash, restricted cash non-current, short-term investments and investments as at the end of the relevant period.
Net Debt to EBITDA It is computed by dividing net debt as at the end of the relevant period by EBITDA for preceding (last) 12 months from the end of the relevant period.
Net Debt to Funded Equity Ratio
It is computed by dividing net debt as at the end of the relevant period by Equity attributable to equity holders of parent as at the end of the relevant period.
Net Revenues It is not IFRS measure and is defined as total revenues adjusted for access charges for the relevant period.
NLD National Long Distance Services.
Non Voice Revenue as a % of consolidated revenue
It is computed by dividing the total non-voice revenue of the company (consolidated) by the total revenues for the relevant period. Non-voice revenues include VAS Revenues for Mobile, VAS and Internet Revenues for Telemedia Services and Bandwidth and Internet Revenues for Enterprise Services.
Non Voice Revenue as a % of Mobile Revenue
It is computed by dividing the total non voice revenue of mobile services by the total revenues of mobile services for the relevant period. Non voice revenue for mobile services includes revenues from value added services (including SMS, GPRS, MMS, Ring Back Tones etc.).
Operating Cash flow It is computed by subtracting capex from EBITDA after acquisition related costs.
Return On Capital Employed (ROCE)
For the full year ended March 31, 2009, 2010 and 2011. ROCE is computed by dividing the sum of net profit and finance cost (net) for the period by average (of opening and closing) capital employed. For the quarterly computation, it is computed by dividing the sum of net profit and finance cost (net) for the preceding (last) 12 months from the end of the relevant period by average capital employed. Average capital employed is calculated by considering average of quarterly average for the preceding (last) four quarters from the end of the relevant period.
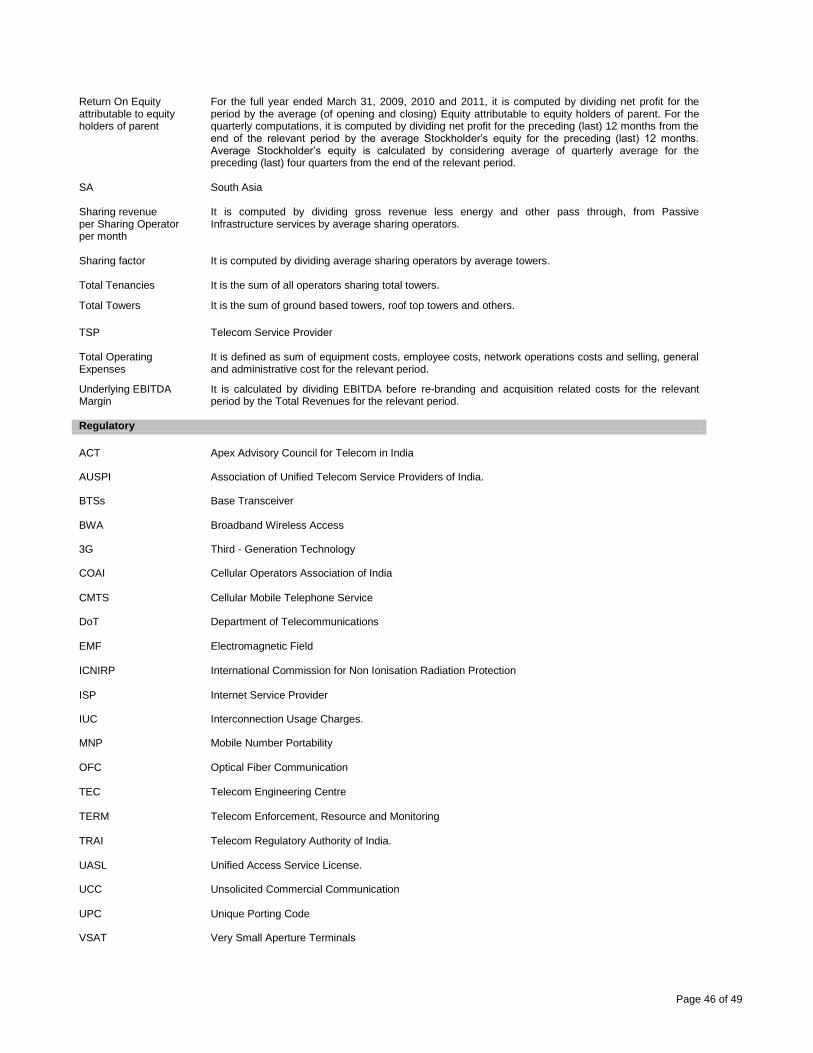
Page 46 of 49
Return On Equity attributable to equity holders of parent
For the full year ended March 31, 2009, 2010 and 2011, it is computed by dividing net profit for the period by the average (of opening and closing) Equity attributable to equity holders of parent. For the quarterly computations, it is computed by dividing net profit for the preceding (last) 12 months from the end of the relevant period by the average Stockholder‟s equity for the preceding (last) 12 months. Average Stockholder‟s equity is calculated by considering average of quarterly average for the preceding (last) four quarters from the end of the relevant period.
SA South Asia Sharing revenue per Sharing Operator per month
It is computed by dividing gross revenue less energy and other pass through, from Passive Infrastructure services by average sharing operators.
Sharing factor It is computed by dividing average sharing operators by average towers.
Total Tenancies It is the sum of all operators sharing total towers.
Total Towers It is the sum of ground based towers, roof top towers and others.
TSP Telecom Service Provider Total Operating Expenses
It is defined as sum of equipment costs, employee costs, network operations costs and selling, general and administrative cost for the relevant period.
Underlying EBITDA Margin
It is calculated by dividing EBITDA before re-branding and acquisition related costs for the relevant period by the Total Revenues for the relevant period.
Regulatory
ACT Apex Advisory Council for Telecom in India
AUSPI
Association of Unified Telecom Service Providers of India.
BTSs Base Transceiver
BWA Broadband Wireless Access
3G Third - Generation Technology
COAI Cellular Operators Association of India
CMTS Cellular Mobile Telephone Service
DoT Department of Telecommunications
EMF Electromagnetic Field
ICNIRP International Commission for Non Ionisation Radiation Protection
ISP Internet Service Provider
IUC Interconnection Usage Charges.
MNP
Mobile Number Portability
OFC Optical Fiber Communication
TEC TERM
Telecom Engineering Centre Telecom Enforcement, Resource and Monitoring
TRAI
Telecom Regulatory Authority of India.
UASL Unified Access Service License.
UCC Unsolicited Commercial Communication
UPC Unique Porting Code
VSAT Very Small Aperture Terminals
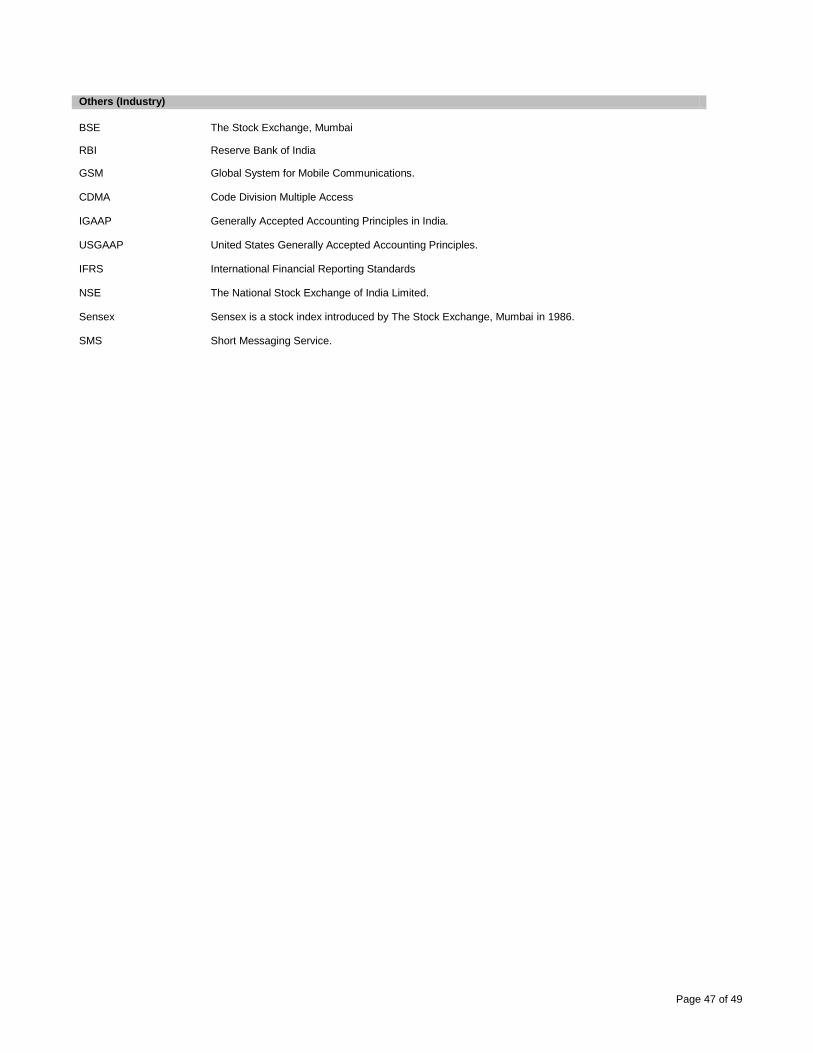
Page 47 of 49
Others (Industry)
BSE The Stock Exchange, Mumbai
RBI Reserve Bank of India
GSM Global System for Mobile Communications.
CDMA Code Division Multiple Access
IGAAP Generally Accepted Accounting Principles in India.
USGAAP United States Generally Accepted Accounting Principles.
IFRS International Financial Reporting Standards
NSE The National Stock Exchange of India Limited.
Sensex Sensex is a stock index introduced by The Stock Exchange, Mumbai in 1986.
SMS
Short Messaging Service.

Page 48 of 49
This page has been left blank intentionally.

Page 49 of 49
Written correspondence to be sent to: Bharti Airtel Limited Investor Relations
[email protected] http://www.airtel.in
Related Documents


![Quarterly report for the first quarter (Q1) ended on June 30, 2015 [Company Update]](https://static.cupdf.com/doc/110x72/577cb4101a28aba7118c48b3/quarterly-report-for-the-first-quarter-q1-ended-on-june-30-2015-company.jpg)


