2010 quarterly report on Hera Group as at 31 th March 0331 2010

Quarterly report on Hera Group as at 31 march 2010
May 30, 2015
Welcome message from author
This document is posted to help you gain knowledge. Please leave a comment to let me know what you think about it! Share it to your friends and learn new things together.
Transcript
2010quarterly report on Hera Group as at 31th March
03312010
0 - Introduction
Mission
Highlights
Strategic approach
Business Sectors
Share performance
1 - Directors' Report
1.01 Hera Group Performance as at 31 March 2010 001
1.01.01 Financial and economic results 001
1.02 Investments 004
1.03 Analysis by Business Area 008
1.03.01 Gas area 010
1.03.02 Electricity area 012
1.03.03 Integrated Water Cycle Area 014
1.03.04 Waste Management Area 015
1.03.05 Other services Area 017
1.04 Analysis of the Net Financial Position 018
1.05 Human resources 019
- Accounting Statements and Explanatory Notes
2.01 Income statement
2.01.01 Consolidated income statement 020
2.01.02 Aggregate income statement 021
2.01.03 Earnings per share 022
2.02 Consolidated Balance Sheet 023
2.03 Consolidated Cash Flow Statement 025
2.04 Statement of changes in shareholders’ equity 026
2.03 Consolidated explanatory notes 027
2.04 Consolidated net financial indebtedness 030
2.05 Equity Investments: List of Companies 031

Introduction
Hera's Mission "Hera’s goal is to be the best multi-utility in Italy for its customers,
workforce and shareholders. It aims to achieve this through further
development of an original corporate model capable of innovation and
of forging strong links with the areas in which it operates by respecting
the local environment”.
For Hera, being the best means inspiring the pride and trust of:
customers, who receive, thanks to Hera’s responsiveness to their needs,
quality services that satisfy their expectations; the women and men who
work at Hera, whose skills, engagement and passion are the foundation of
the company’s success; shareholders, confident that the economic value of
the company will continue to be generated, in full respect for the principles of
social responsibility; the areas in which Hera operates, where economic,
social and environmental health represent the promise of a sustainable
future; and suppliers, key elements in the value chain and partners for
growth".
Introduction
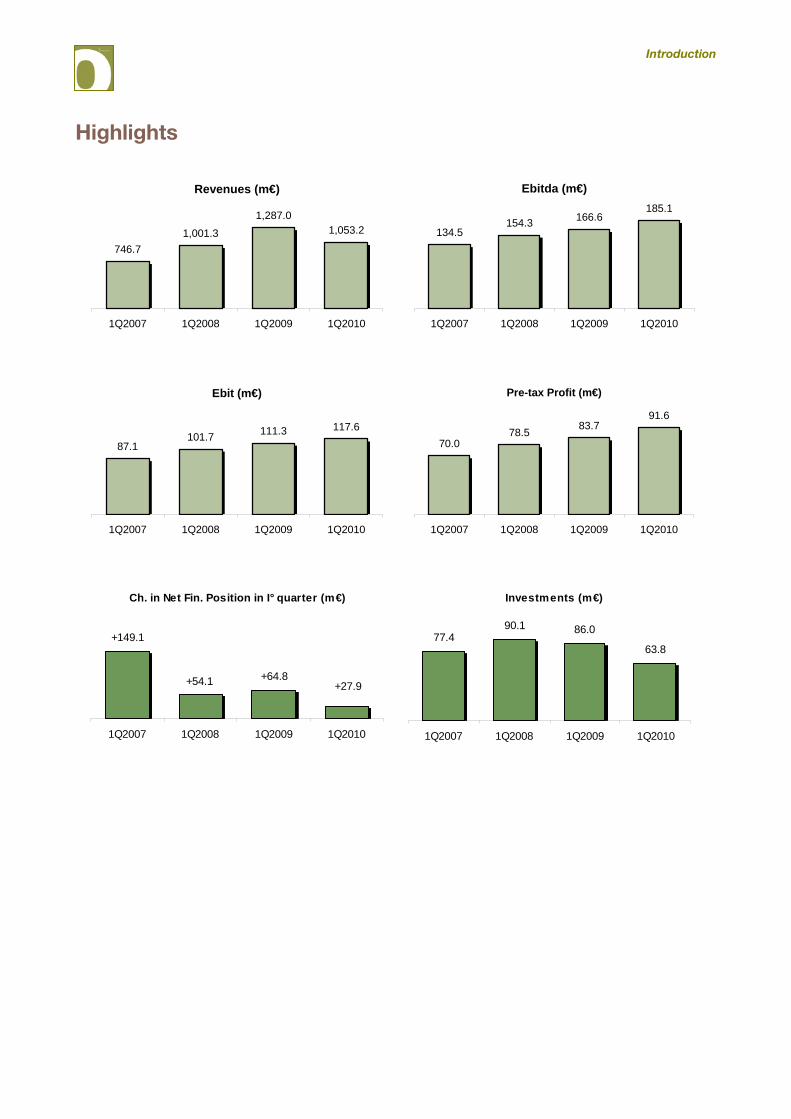
Highlights
Revenues (m€)
746.71,001.3
1,287.01,053.2
1Q2007 1Q2008 1Q2009 1Q2010
Ebitda (m€)
134.5154.3 166.6
185.1
1Q2007 1Q2008 1Q2009 1Q2010
Ebit (m€)
87.1101.7 111.3 117.6
1Q2007 1Q2008 1Q2009 1Q2010
Pre-tax Profit (m€)
70.078.5 83.7
91.6
1Q2007 1Q2008 1Q2009 1Q2010
Ch. in Net Fin. Position in I° quarter (m€)
+149.1
+64.8+27.9+54.1
1Q2007 1Q2008 1Q2009 1Q2010
Investments (m€)
77.490.1 86.0
63.8
1Q2007 1Q2008 1Q2009 1Q2010
Introduction
Introduction In the first quarter of 2010, the Hera Group recorded a growth in all operating results until net profit, despite Italy’s macro-economic situation is still affected by a serious global financial crisis. The results achieved benefited from the economic contribution of plants started in 2009, which have been operating since the beginning of the year, as well as from the contribution due to the usual growth factors in both regulated and deregulated activities.
The contribution of the new plants was however partial insofar that the waste-to-energy plant in Modena has been operating at full production for only two months due to its yearly ordinary maintenance operations. Moreover, the new 80 MW cogeneration plant in Imola has mainly operated with the production of heat and also benefited from the favourable winter weather trend. As for electric production, the plants recorded low production levels due to the unfavourable price levels of the energy market.
The decrease in prices of electricity, due to the reduced demand affected by the economic downturn, was added to the decrease in prices of gas invoiced to residential customers. According to segment regulations, prices of gas, as it is known, are affected by the fluctuations of the cost of gas with a 9 month delay. These price trends of the energy commodity resulted in both a reduction of turnover and a decrease in procurement costs causing an increase in the Group profit margin.
The growth strategy on deregulated markets, which was supported by a solid trade structure, an effective cross selling policy and an efficient customer assistance, continued in the first quarter as well, to
support the growth in electricity sales, thus restricting the effect of decrease in the above-mentioned
prices and demand on turnover. Thanks to colder winter temperatures, an increase in volumes of gas sold was recorded due to higher consumption, especially of residential customers. Volumes also increased thanks to a wider captive client base resulting from a commercial action which offset the effects of competition.
Waste disposal recorded a +7% growth which results, on the one hand, from the slight recovery of
industrial production (+1.7% in Italy in the first quarter according to Confindustria’s estimates), with a consequent recovery in demand of waste treatment of the business clients and, on the other hand, from the enlargement of the market share due to the strengthening of the treatment plant capacity with the new WTE plant (with a capacity of around 180,000 tons/year). The positive growth was therefore influenced by the reduced possibility of using the plants in landfills, given the difficult access of vehicles due to snowfalls this winter.
Even the concession managed activities for the distribution of energy, collection of urban waste and integrated water services contributed to the growth in profit in the first quarter, mainly due to the tariff adjustments in accordance with the national legally guaranteed returns and the new tariff systems. Specifically, the national authorities agreed certain verification procedures for gas distribution in 2009, and established definitive tariff levels for this year based on the revaluation of assets due to the adoption of a punctual measurement system of the invested system instead of the “parametric” system used in past times.
Introduction
The external line development strategy also contributed to the improved results. This strategy envisages
lower leasing fees for gas and district heating networks acquired in 2009 from leasing companies, while Hera’s share of profits, related to the acquisition of 25% of Aimag, occurred at end 2009, has not been recorded yet and is awaiting for the approval of the Aimag's annual financial statements by the Board of Directors. The operational results for this quarter improved with respect to the same period in the previous year, thanks to the contribution of all business strategic areas (Waste management, Energy and Networks) of the Group, with the help of all growth factors, both internal and external. Moreover, these developments supported the growth of the Group consolidated net profit, in spite of the increase in amortisation and financial charges, which were respectively influenced by the operation of new plants and the replacement of short-term financial debts with the issue, at year end, of a ten-year Eurobond, fixed rate, amounting to Euro 500 million. Over the first quarter, the Group's financial position underwent no significant changes compared to 31 December 2009, in spite of the seasonal cash absorption of net working capital (connected with the invoicing of gas sold in winter months) thanks to both the reduction in investments connected with plants, almost completed, and the growing cash generation of assets. The first quarter, therefore, represents a consolidation situation of the solid financial structure and investments that will allow to increase returns on the invested capital with a following higher satisfaction of shareholders to whom, following resolutions in the Shareholders' Meetings held on 30 April, a dividend of Euro 0.08 per share will be distributed for a total amount of Euro 89,201,100.32.
Introduction
Strategic approach Hera aims to create value through a multi-stakeholder approach and focus on achieving growth in
accordance with all internal and external development guidelines to benefit from both the economies of scale and to pool resources resulting from mergers with multi-utility companies operating in the sector.
Hera has always pursued operational efficiency strategies, leveraging an innovative organizational model
based on consolidating certain general functions and maintaining strong roots in the areas served. In 2010 the corporate reorganization is operative, thus facilitating a further rationalization of operating costs.
The Group has always been focused on the development of open markets, which led to significant results in 2009 despite the recession. Special attention was placed on the cross-selling policies of the services to the customer base. The development of market share in the deregulated electricity and special waste treatment markets is currently supported by a strategy to develop plant capacities that has reached its execution final stage. At end of 2009, three new plants were completed and started. During the year, they will contribute to achieve yearly targets. The objective in regulated markets was to strengthen supervision in the reference area, by strengthening asset ownership and taking part in tenders in both reference and neighbouring areas. Hera also continues to pursue development opportunities for outside lines, both through the aggregation of multi-business firms in neighbouring areas, and with upstream companies in the chain of deregulated
activities. The multi-business development line is focused on companies that operate in areas that border
the reference areas, allowing greater economies of scale to be achieved, which support the management
efficiency processes. These are the criteria which led Hera to acquire 25% of Aimag's share capital. Mono-business operations are pursued with the aim of strengthening waste treatment activities, taking advantage
of special favourable market conditions, or energy activities to pursue the development of sales with a balanced upstream integration policy in electricity generation. Hera lays out its strategies in a business plan that is updated on an annual basis. The most recent update dates back to September 2009 (with a five-year plan to 2013) and indicates that the strategy is to achieve further market growth in both deregulated activities and upstream activities, in addition to confirming its focus on achieving synergy between costs and revenues, on developing new plants where electricity is generated from renewable sources, and on strengthening its plant base. The plan sets out the growth objectives that mainly rely on factors that are already in place, through development by internal growth lines (new plants recently started up or at an advanced stage of construction, future tariffs that have already been agreed for regulated activities, corporate restructuring already carried out). The planned growth envisages a cash generation aimed at covering the investment program and an increasing dividend flow, in addition to the maintenance of the current financial structure. Hera’s strategy also aims at developing a corporate sustainable development through a multi-stakeholder approach. On 29 March 2009, the Board of Directors approved the 2009 sustainability financial statements, which highlights the added value growth for the seventh consecutive year. This proves the concreteness of Hera’s sustainable approach in asset management.
Introduction
Business Sectors Hera maintains balance between its regulated activities (integrated water service, collection and disposal of urban waste, distribution of methane gas, electricity and district heating) and its deregulated activities (sales of methane gas and electricity, special waste disposal and public lighting) in terms of contribution to the EBITDA. The efficiency and low risk associated with this balanced multi-business approach can be appreciated judging from the continued and uninterrupted growth of the consolidated EBITDA over the years, even in a difficult year like 2009.
Hera is the leading domestic operator in the waste management sector by quantity of waste collected and
disposed of: urban waste collection is regulated by a concession that will expire in 2012, while the disposal of special waste is a deregulated market business. The tariffs for 2008-2012 have been agreed to with local authorities. Over the last seven years, the list of plant infrastructures has grown to 77 plants, capable of covering the entire range of possible waste treatments and recoveries, confirming the excellence of the Group on a national level. Hera is also one of the main operators in Italy that generates electricity from waste, and is the only company that has managed to build and put five new WTE plants into operation in Italy over the last few years, increasing installed capacity to over 100 megawatts and 860,000 tons/year. Herambiente Spa was established in July 2009, and is the special purpose entity created to facilitate supervision of the market and to exploit its unique professional experience gained from managing these plants to the full. With respect to the lack of infrastructure in the Italian waste treatment sector, which culminated in the waste emergencies in Campania and Sicily, calls for tenders have been put in place to build new WTE plants in some regions of Italy. Herambiente is already preparing for participation in these calls for tenders in order to gain a foothold in this rapidly developing market. The Hera Group is the second largest operator in Italy in the management of the complete water cycle, i.e. from the distribution of drinking water to the collection and purification of wastewater. Hera is the only operator performing this service in seven provinces in Emilia Romagna and the Marches in accordance with long-term concession agreement contracts (on average up to 2022). The tariffs for 2008-2012 have been agreed with local authorities. Increased efficiency in the management of more than 25,000 kilometres of water networks, economies of scale in purchasing and adjustment of 2008-2012 tariffs to meet legal requirements were the key factors behind the growth, combined with the contribution of growth from external lines.
Introduction
Hera has almost complete coverage of the reference area in the gas sector. It is the largest of the “local” companies and the fourth on a national level in terms of volumes distributed. With over 1.1 million customers, Hera sells over 2.8 billion cubic metres of gas per year. The Group has a direct transportation capacity from abroad, for about 400 million m3 of gas through the TAG gas pipeline. The future Galsi gas pipeline between Italy and Algeria will add almost one billion m3 per year to this capacity.
Since its establishment, Hera has pursued a “dual fuel” sales strategy, allowing it to develop the electricity market at moderate growth rates, both through cross-selling to existing customers, and through expansion
to new markets. Hera is one of the leading 10 Italian operators, and also one of the companies with the highest growth rates. The development of sales was accompanied by the simultaneous balanced development of energy availability through the formation of joint ventures for the purchase of shares in combined cycle plants, the development of its own of generation plants from renewable or similar sources and the start-up of cogeneration plants.
Introduction
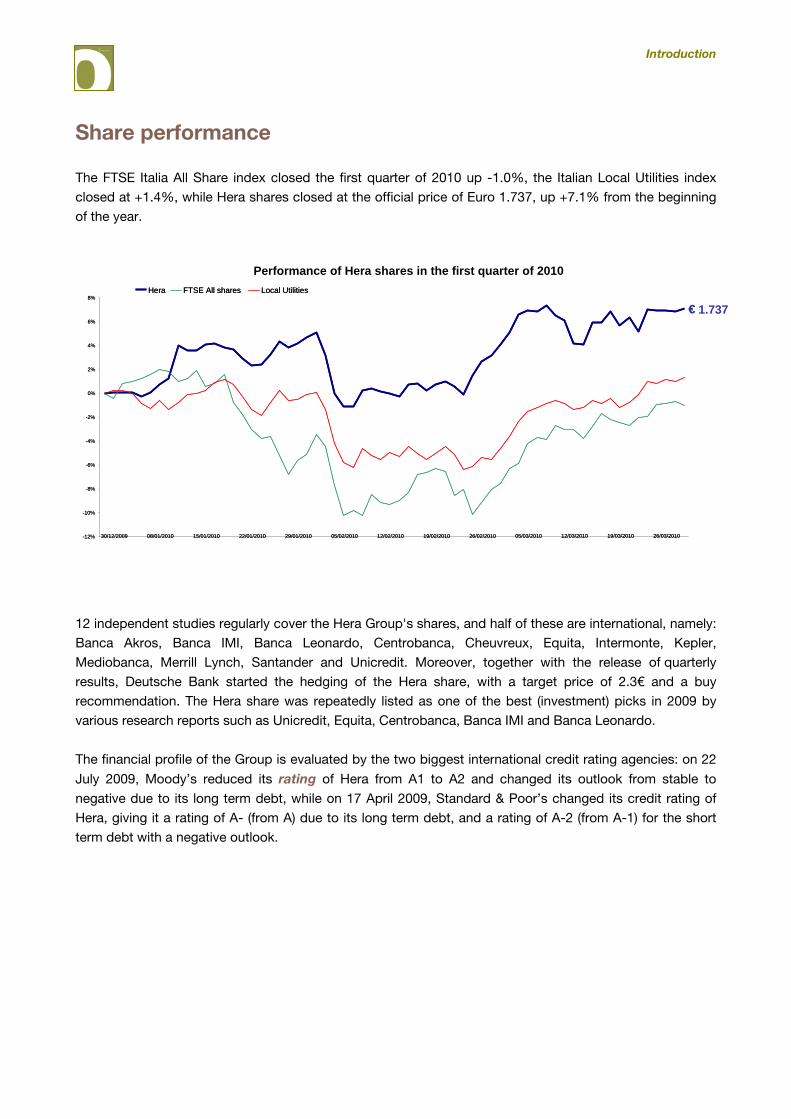
Share performance The FTSE Italia All Share index closed the first quarter of 2010 up -1.0%, the Italian Local Utilities index closed at +1.4%, while Hera shares closed at the official price of Euro 1.737, up +7.1% from the beginning of the year. 12 independent studies regularly cover the Hera Group's shares, and half of these are international, namely: Banca Akros, Banca IMI, Banca Leonardo, Centrobanca, Cheuvreux, Equita, Intermonte, Kepler, Mediobanca, Merrill Lynch, Santander and Unicredit. Moreover, together with the release of quarterly results, Deutsche Bank started the hedging of the Hera share, with a target price of 2.3€ and a buy recommendation. The Hera share was repeatedly listed as one of the best (investment) picks in 2009 by various research reports such as Unicredit, Equita, Centrobanca, Banca IMI and Banca Leonardo. The financial profile of the Group is evaluated by the two biggest international credit rating agencies: on 22
July 2009, Moody’s reduced its rating of Hera from A1 to A2 and changed its outlook from stable to
negative due to its long term debt, while on 17 April 2009, Standard & Poor’s changed its credit rating of Hera, giving it a rating of A- (from A) due to its long term debt, and a rating of A-2 (from A-1) for the short term debt with a negative outlook.
-12%
-10%
-8% -6% -4% -2% 0%
2%
4%
6%
8%
30/12/2009 08/01/2010 15/01/2010 22/01/2010 29/01/2010 05/02/2010 12/02/2010 19/02/2010 26/02/2010 05/03/2010 12/03/2010 19/03/2010 26/03/2010
Hera FTSE All shares Local Utilities € 1.737
Performance of Hera shares in the first quarter of 2010
-12%
-10%
-8% -6% -4% -2% 0%
2%
4%
6%
8%
30/12/2009 08/01/2010 15/01/2010 22/01/2010 29/01/2010 05/02/2010 12/02/2010 19/02/2010 26/02/2010 05/03/2010 12/03/2010 19/03/2010 26/03/2010
Hera FTSE All shares Local Utilities €
Introduction
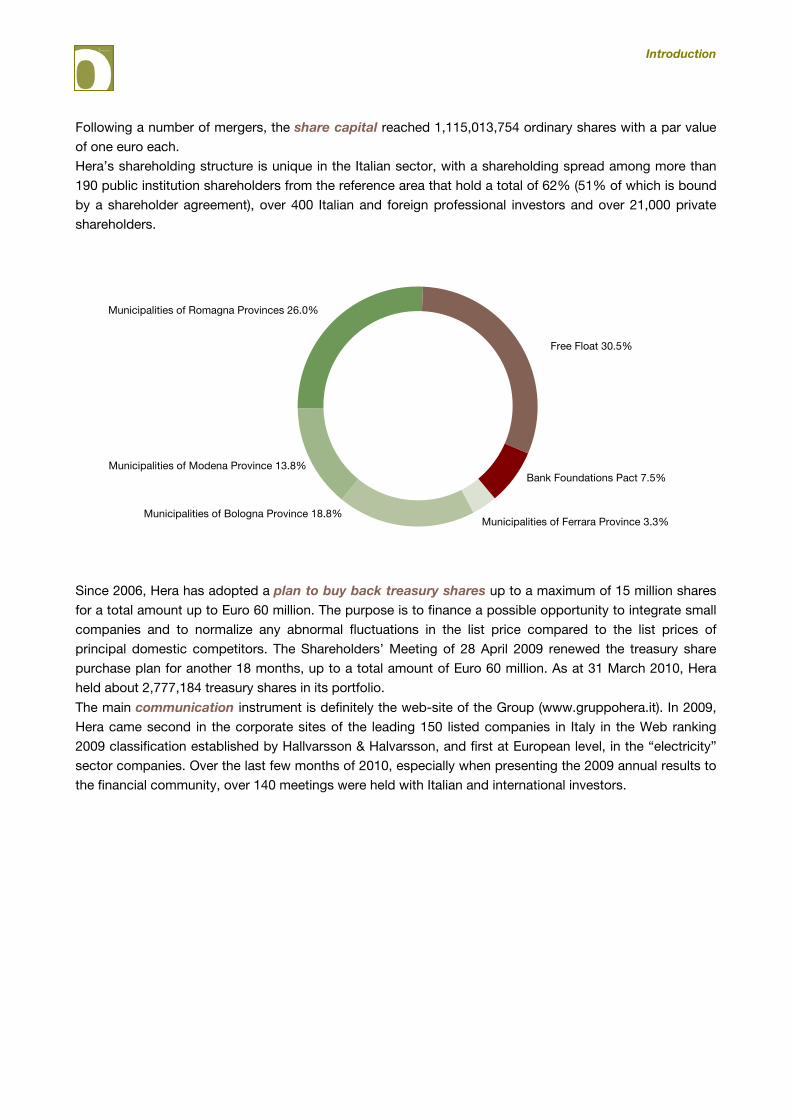
Following a number of mergers, the share capital reached 1,115,013,754 ordinary shares with a par value of one euro each. Hera’s shareholding structure is unique in the Italian sector, with a shareholding spread among more than 190 public institution shareholders from the reference area that hold a total of 62% (51% of which is bound by a shareholder agreement), over 400 Italian and foreign professional investors and over 21,000 private shareholders.
Since 2006, Hera has adopted a plan to buy back treasury shares up to a maximum of 15 million shares
for a total amount up to Euro 60 million. The purpose is to finance a possible opportunity to integrate small companies and to normalize any abnormal fluctuations in the list price compared to the list prices of principal domestic competitors. The Shareholders’ Meeting of 28 April 2009 renewed the treasury share purchase plan for another 18 months, up to a total amount of Euro 60 million. As at 31 March 2010, Hera held about 2,777,184 treasury shares in its portfolio. The main communication instrument is definitely the web-site of the Group (www.gruppohera.it). In 2009, Hera came second in the corporate sites of the leading 150 listed companies in Italy in the Web ranking 2009 classification established by Hallvarsson & Halvarsson, and first at European level, in the “electricity” sector companies. Over the last few months of 2010, especially when presenting the 2009 annual results to the financial community, over 140 meetings were held with Italian and international investors.
Free Float 30.5%
Bank Foundations Pact 7.5%
Municipalities of Ferrara Province 3.3%Municipalities of Bologna Province 18.8%
Municipalities of Modena Province 13.8%
Municipalities of Romagna Provinces 26.0%
1Directors’ Report
Directos’ Report
Hera Group – Consolidated Quarterly Report as at 31 March 2010 BoD of 13 May 2010
1
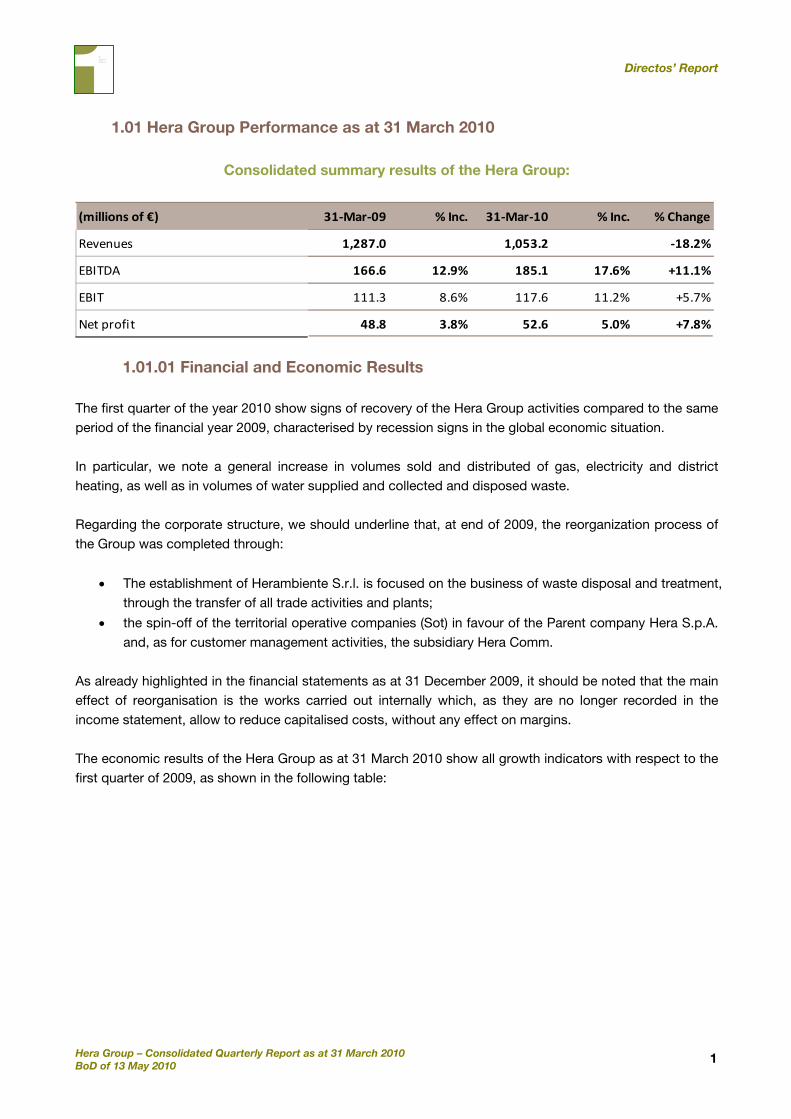
1.01 Hera Group Performance as at 31 March 2010
Consolidated summary results of the Hera Group:
(millions of €) 31‐Mar‐09 % Inc. 31‐Mar‐10 % Inc. % Change
Revenues 1,287.0 1,053.2 ‐18.2%
EBITDA 166.6 12.9% 185.1 17.6% +11.1%
EBIT 111.3 8.6% 117.6 11.2% +5.7%
Net profit 48.8 3.8% 52.6 5.0% +7.8%
1.01.01 Financial and Economic Results The first quarter of the year 2010 show signs of recovery of the Hera Group activities compared to the same period of the financial year 2009, characterised by recession signs in the global economic situation. In particular, we note a general increase in volumes sold and distributed of gas, electricity and district heating, as well as in volumes of water supplied and collected and disposed waste. Regarding the corporate structure, we should underline that, at end of 2009, the reorganization process of the Group was completed through:
• The establishment of Herambiente S.r.l. is focused on the business of waste disposal and treatment, through the transfer of all trade activities and plants;
• the spin-off of the territorial operative companies (Sot) in favour of the Parent company Hera S.p.A. and, as for customer management activities, the subsidiary Hera Comm.
As already highlighted in the financial statements as at 31 December 2009, it should be noted that the main effect of reorganisation is the works carried out internally which, as they are no longer recorded in the income statement, allow to reduce capitalised costs, without any effect on margins. The economic results of the Hera Group as at 31 March 2010 show all growth indicators with respect to the first quarter of 2009, as shown in the following table:
Directos’ Report
Hera Group – Consolidated Quarterly Report as at 31 March 2010 BoD of 13 May 2010
2
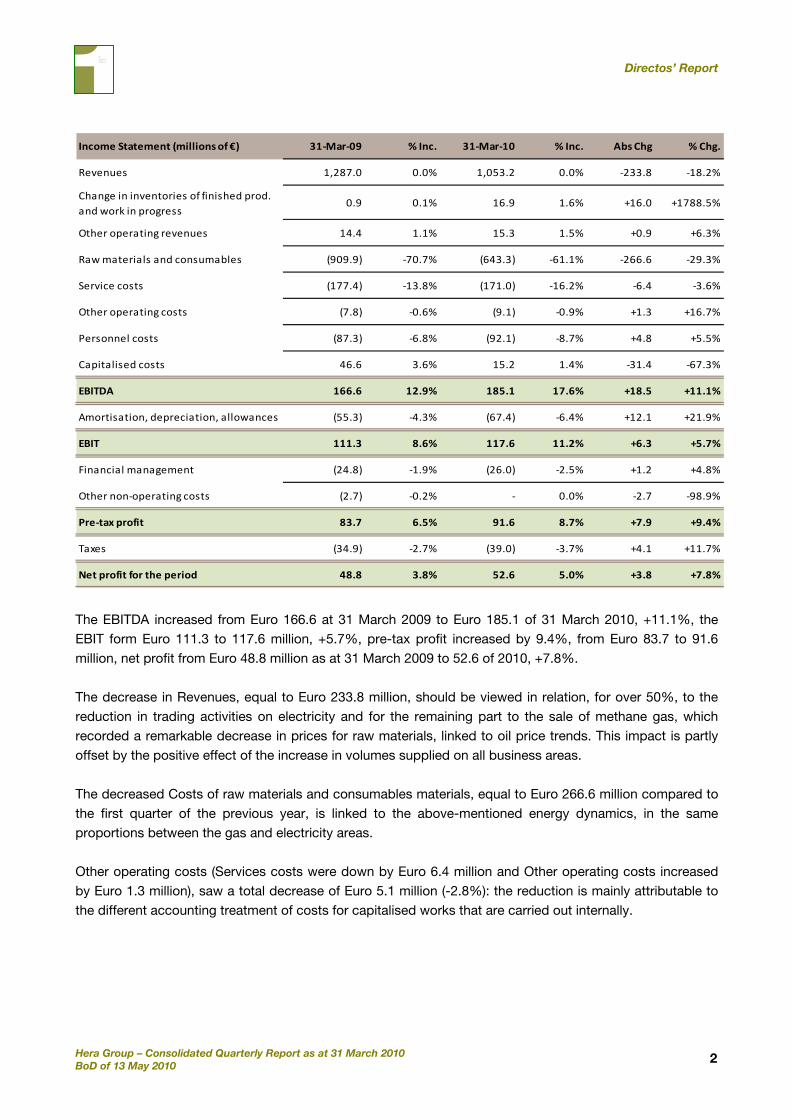
Income Statement (millions of €) 31‐Mar‐09 % Inc. 31‐Mar‐10 % Inc. Abs Chg % Chg.
Revenues 1,287.0 0.0% 1,053.2 0.0% ‐233.8 ‐18.2%
Change in inventories of finished prod. and work in progress
0.9 0.1% 16.9 1.6% +16.0 +1788.5%
Other operating revenues 14.4 1.1% 15.3 1.5% +0.9 +6.3%
Raw materials and consumables (909.9) ‐70.7% (643.3) ‐61.1% ‐266.6 ‐29.3%
Service costs (177.4) ‐13.8% (171.0) ‐16.2% ‐6.4 ‐3.6%
Other operating costs (7.8) ‐0.6% (9.1) ‐0.9% +1.3 +16.7%
Personnel costs (87.3) ‐6.8% (92.1) ‐8.7% +4.8 +5.5%
Capitalised costs 46.6 3.6% 15.2 1.4% ‐31.4 ‐67.3%
EBITDA 166.6 12.9% 185.1 17.6% +18.5 +11.1%
Amortisation, depreciation, allowances (55.3) ‐4.3% (67.4) ‐6.4% +12.1 +21.9%
EBIT 111.3 8.6% 117.6 11.2% +6.3 +5.7%
Financial management (24.8) ‐1.9% (26.0) ‐2.5% +1.2 +4.8%
Other non‐operating costs (2.7) ‐0.2% ‐ 0.0% ‐2.7 ‐98.9%
Pre‐tax profit 83.7 6.5% 91.6 8.7% +7.9 +9.4%
Taxes (34.9) ‐2.7% (39.0) ‐3.7% +4.1 +11.7%
Net profit for the period 48.8 3.8% 52.6 5.0% +3.8 +7.8%
The EBITDA increased from Euro 166.6 at 31 March 2009 to Euro 185.1 of 31 March 2010, +11.1%, the EBIT form Euro 111.3 to 117.6 million, +5.7%, pre-tax profit increased by 9.4%, from Euro 83.7 to 91.6 million, net profit from Euro 48.8 million as at 31 March 2009 to 52.6 of 2010, +7.8%. The decrease in Revenues, equal to Euro 233.8 million, should be viewed in relation, for over 50%, to the reduction in trading activities on electricity and for the remaining part to the sale of methane gas, which recorded a remarkable decrease in prices for raw materials, linked to oil price trends. This impact is partly offset by the positive effect of the increase in volumes supplied on all business areas. The decreased Costs of raw materials and consumables materials, equal to Euro 266.6 million compared to the first quarter of the previous year, is linked to the above-mentioned energy dynamics, in the same proportions between the gas and electricity areas. Other operating costs (Services costs were down by Euro 6.4 million and Other operating costs increased by Euro 1.3 million), saw a total decrease of Euro 5.1 million (-2.8%): the reduction is mainly attributable to the different accounting treatment of costs for capitalised works that are carried out internally.
Directos’ Report
Hera Group – Consolidated Quarterly Report as at 31 March 2010 BoD of 13 May 2010
3
The increase in Personnel costs, from Euro 87.3 million in the first quarter 2009, to Euro 92.1 million in 2010 (+5.5%), is to be connected with the evolution of contractual dynamics and the effects of the changes is the scope of consolidation. The reduction of Capitalised costs, which decreased from Euro 46.6 to Euro 15.2 million, is connected to the different accounting treatment of investment works carried out internally, due to the already mentioned spin-off of the territorial operative companies as from 31 December 2009. The consolidated EBITDA of the Group as at 31 March 2010 increased from Euro 166.6 as at 31 March 2009, to Euro 185.1 million in 2010 (+11.1%), mainly due to the recovery of the demand for collection and disposal services, within the Waste Management area, as well as to higher volumes of water and energy supplied. Depreciation, Amortisation and Provisions increased by 21.9%, from Euro 55.3 million as at 31 March 2009, to Euro 67.4 million as at 31 March 2010. The increase is due to the higher allocation to the Bad debt provision, aligned to the value of 31 December 2009, the consolidation of gas and district heating networks in the areas of Imola, Ravenna and Ferrara, built as from 30 June 2009 and, to a lesser extent, the going into operation of new plants and other minor changes in the scope of consolidation. The first quarter of 2010 therefore shows an EBIT of Euro 117.6 million, up by 5.7% compared to the similar period in 2009. The result of the Financial operations, as at 31 March 2010, is equal to Euro 26.0 million, compared to Euro 24.8 million in 2009. The first quarter of 2010 has not been affected by the extraordinary effects of the payback of the so-called “state aids", which had an impact on the first quarter of 2009 by Euro 2.1 million, as interest expense within Financial operations. The growth reflects the cost of the higher indebtedness. Profits from associated companies amount to Euro 4.3 million, compared to Euro 2.1 million of the first quarter of 2009. It should be also recalled that, at the end of the first quarter of 2009, the Group discounted a further Euro 2.7 million connected with the tax moratorium in item Other non-operating costs. In light of the above, the Pre-Tax Profit rose from Euro 83.7 million at 31 March 2009 to Euro 91.6 million in 2009, an increase of 9.4%, equal to Euro 7.9 million. Taxes increased from Euro 34.9 million in the first quarter of 2009, to Euro 39.0 million in 2010 in the first quarter 2010. The Net Result as at 31 March 2010 therefore stands at Euro 52.6 million, up 7.8% compared to Euro 48.8 million in the same period of 2009.
Directos’ Report
Hera Group – Consolidated Quarterly Report as at 31 March 2010 BoD of 13 May 2010
4
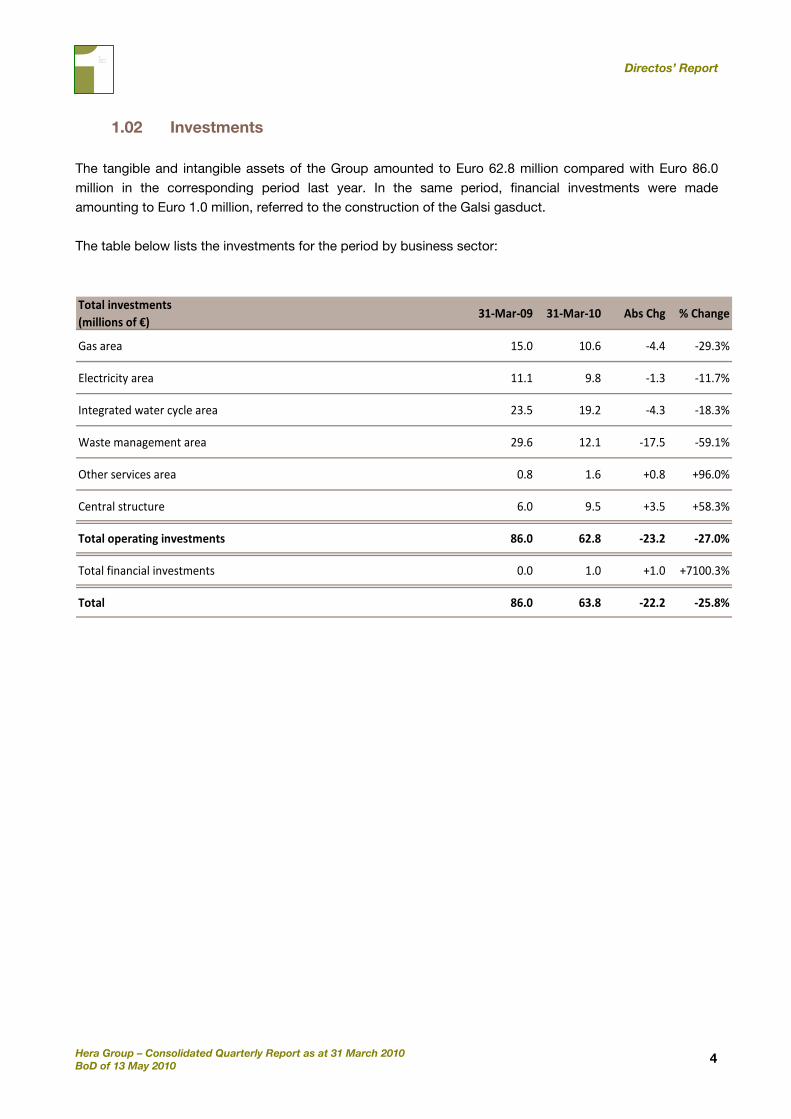
1.02 Investments
The tangible and intangible assets of the Group amounted to Euro 62.8 million compared with Euro 86.0 million in the corresponding period last year. In the same period, financial investments were made amounting to Euro 1.0 million, referred to the construction of the Galsi gasduct. The table below lists the investments for the period by business sector:
Total investments(millions of €)
31‐Mar‐09 31‐Mar‐10 Abs Chg % Change
Gas area 15.0 10.6 ‐4.4 ‐29.3%
Electricity area 11.1 9.8 ‐1.3 ‐11.7%
Integrated water cycle area 23.5 19.2 ‐4.3 ‐18.3%
Waste management area 29.6 12.1 ‐17.5 ‐59.1%
Other services area 0.8 1.6 +0.8 +96.0%
Central structure 6.0 9.5 +3.5 +58.3%
Total operating investments 86.0 62.8 ‐23.2 ‐27.0%
Total financial investments 0.0 1.0 +1.0 +7100.3%
Total 86.0 63.8 ‐22.2 ‐25.8%
Directos’ Report
Hera Group – Consolidated Quarterly Report as at 31 March 2010 BoD of 13 May 2010
5
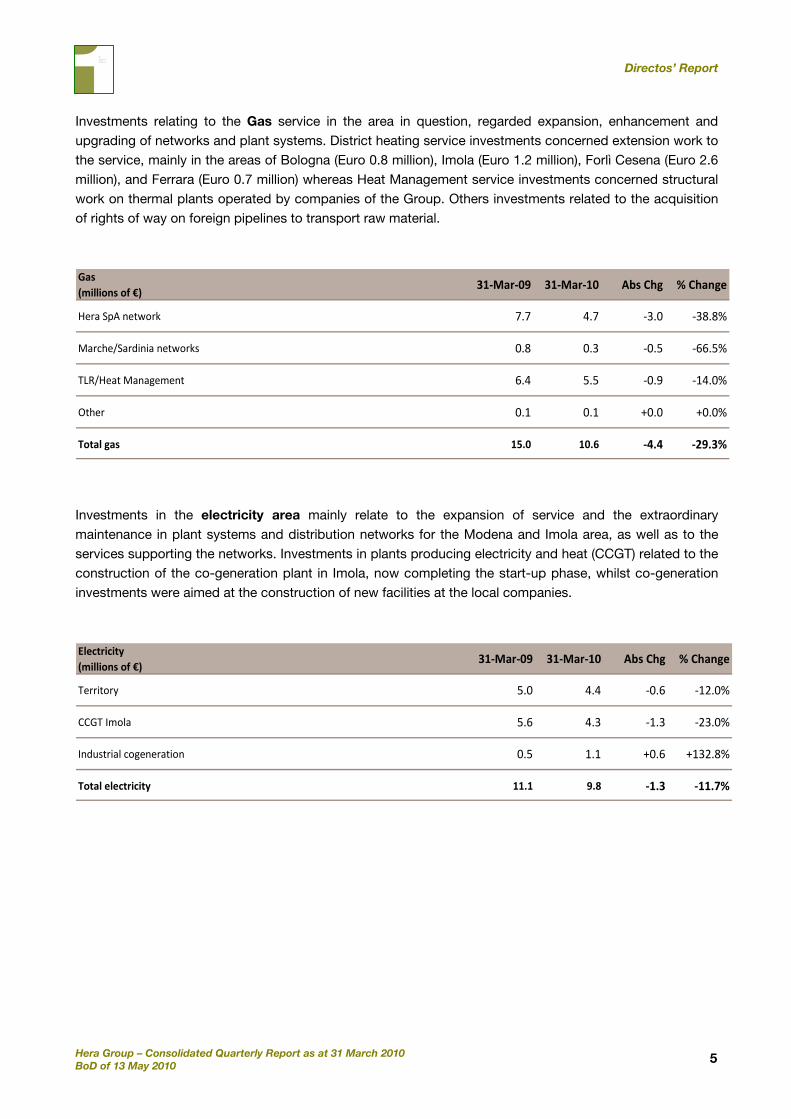
Investments relating to the Gas service in the area in question, regarded expansion, enhancement and upgrading of networks and plant systems. District heating service investments concerned extension work to the service, mainly in the areas of Bologna (Euro 0.8 million), Imola (Euro 1.2 million), Forlì Cesena (Euro 2.6 million), and Ferrara (Euro 0.7 million) whereas Heat Management service investments concerned structural work on thermal plants operated by companies of the Group. Others investments related to the acquisition of rights of way on foreign pipelines to transport raw material. Gas(millions of €)
31‐Mar‐09 31‐Mar‐10 Abs Chg % Change
Hera SpA network 7.7 4.7 ‐3.0 ‐38.8%
Marche/Sardinia networks 0.8 0.3 ‐0.5 ‐66.5%
TLR/Heat Management 6.4 5.5 ‐0.9 ‐14.0%
Other 0.1 0.1 +0.0 +0.0%
Total gas 15.0 10.6 ‐4.4 ‐29.3%
Investments in the electricity area mainly relate to the expansion of service and the extraordinary maintenance in plant systems and distribution networks for the Modena and Imola area, as well as to the services supporting the networks. Investments in plants producing electricity and heat (CCGT) related to the construction of the co-generation plant in Imola, now completing the start-up phase, whilst co-generation investments were aimed at the construction of new facilities at the local companies. Electricity(millions of €)
31‐Mar‐09 31‐Mar‐10 Abs Chg % Change
Territory 5.0 4.4 ‐0.6 ‐12.0%
CCGT Imola 5.6 4.3 ‐1.3 ‐23.0%
Industrial cogeneration 0.5 1.1 +0.6 +132.8%
Total electricity 11.1 9.8 ‐1.3 ‐11.7%
Directos’ Report
Hera Group – Consolidated Quarterly Report as at 31 March 2010 BoD of 13 May 2010
6
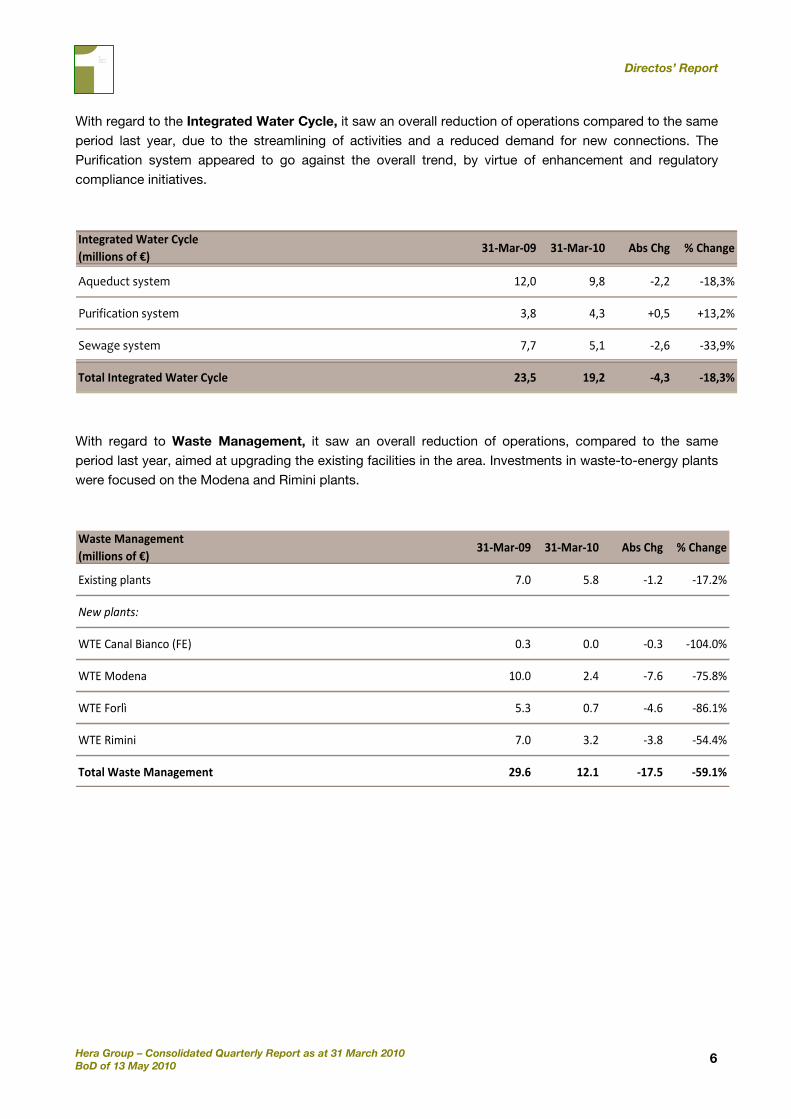
With regard to the Integrated Water Cycle, it saw an overall reduction of operations compared to the same period last year, due to the streamlining of activities and a reduced demand for new connections. The Purification system appeared to go against the overall trend, by virtue of enhancement and regulatory compliance initiatives.
Integrated Water Cycle (millions of €)
31‐Mar‐09 31‐Mar‐10 Abs Chg % Change
Aqueduct system 12,0 9,8 ‐2,2 ‐18,3%
Purification system 3,8 4,3 +0,5 +13,2%
Sewage system 7,7 5,1 ‐2,6 ‐33,9%
Total Integrated Water Cycle 23,5 19,2 ‐4,3 ‐18,3%
With regard to Waste Management, it saw an overall reduction of operations, compared to the same period last year, aimed at upgrading the existing facilities in the area. Investments in waste-to-energy plants were focused on the Modena and Rimini plants.
Waste Management(millions of €)
31‐Mar‐09 31‐Mar‐10 Abs Chg % Change
Existing plants 7.0 5.8 ‐1.2 ‐17.2%
New plants:
WTE Canal Bianco (FE) 0.3 0.0 ‐0.3 ‐104.0%
WTE Modena 10.0 2.4 ‐7.6 ‐75.8%
WTE Forlì 5.3 0.7 ‐4.6 ‐86.1%
WTE Rimini 7.0 3.2 ‐3.8 ‐54.4%
Total Waste Management 29.6 12.1 ‐17.5 ‐59.1%
Directos’ Report
Hera Group – Consolidated Quarterly Report as at 31 March 2010 BoD of 13 May 2010
7
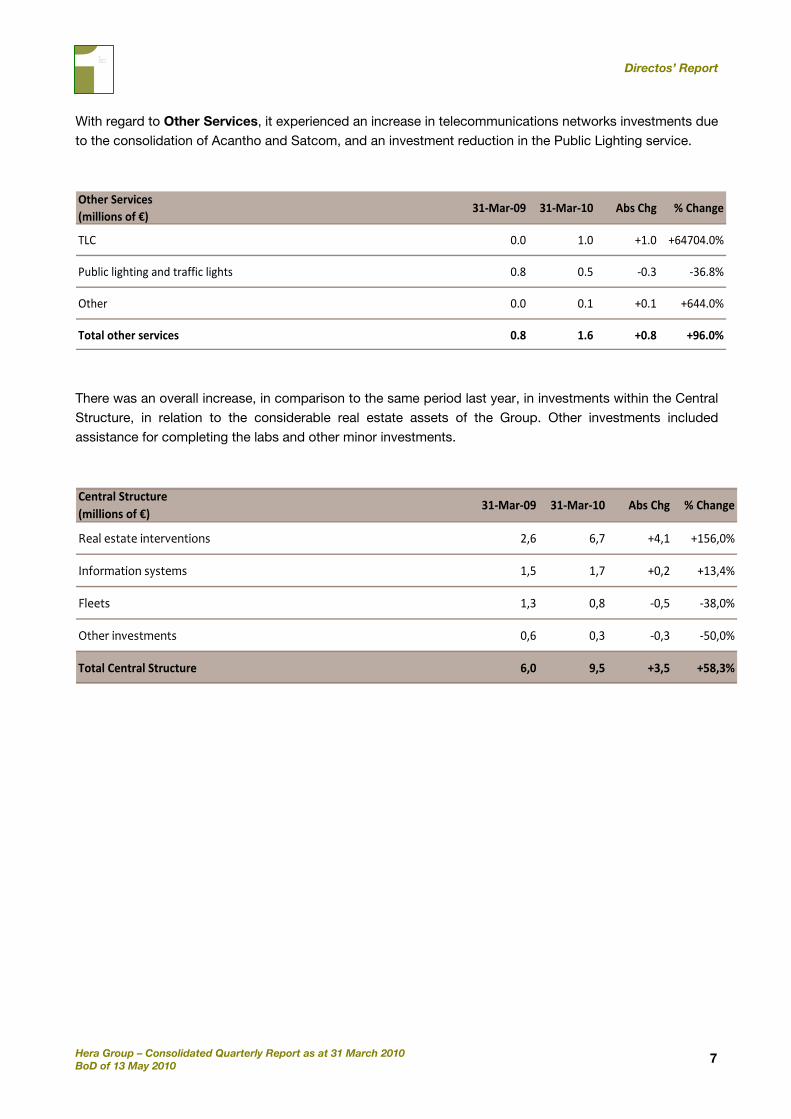
With regard to Other Services, it experienced an increase in telecommunications networks investments due to the consolidation of Acantho and Satcom, and an investment reduction in the Public Lighting service.
Other Services(millions of €)
31‐Mar‐09 31‐Mar‐10 Abs Chg % Change
TLC 0.0 1.0 +1.0 +64704.0%
Public lighting and traffic lights 0.8 0.5 ‐0.3 ‐36.8%
Other 0.0 0.1 +0.1 +644.0%
Total other services 0.8 1.6 +0.8 +96.0%
There was an overall increase, in comparison to the same period last year, in investments within the Central Structure, in relation to the considerable real estate assets of the Group. Other investments included assistance for completing the labs and other minor investments.
Central Structure(millions of €)
31‐Mar‐09 31‐Mar‐10 Abs Chg % Change
Real estate interventions 2,6 6,7 +4,1 +156,0%
Information systems 1,5 1,7 +0,2 +13,4%
Fleets 1,3 0,8 ‐0,5 ‐38,0%
Other investments 0,6 0,3 ‐0,3 ‐50,0%
Total Central Structure 6,0 9,5 +3,5 +58,3%
Directos’ Report
Hera Group – Consolidated Quarterly Report as at 31 March 2010 BoD of 13 May 2010
8
1.03 Analysis by Business Segment
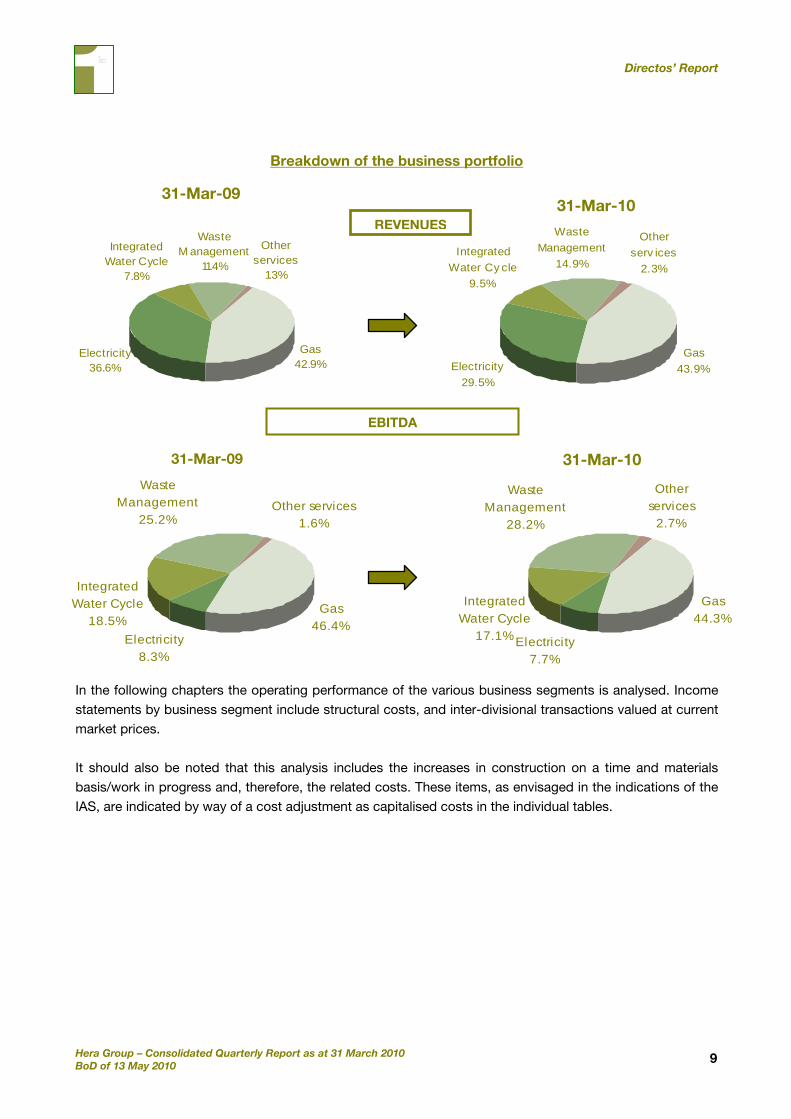
Currently, the Hera Group, to better focus on its industrial structures, defines its business areas as follows: the Gas area includes also the District Heating and Heat Management businesses; the Electricity Area includes, instead, Industrial Micro-cogeneration. An analysis of the operating results achieved in the business segments in which the Group operates is presented below: (i) Gas sector, concerned with the distribution and sale of methane gas and LPG, District heating and Heat Management (ii) Electricity sector, regarding the production, distribution and sale of Electricity, (iii) Integrated Water Cycle sector, including Aqueducts, Purification and Sewage, (iv) Waste Management sector, including Waste Collection, Treatment and Disposal and (v) Other Services sector, including Public Lighting, Telecommunications and other minor services. In light of the above, in order to provide the necessary focus on the performance for the first quarter of 2010, it is hereby described the analysis for the different business segments in which the Group operates, compared to the data of year 2009, reclassified according the new criteria for allocating business to segments. The breakdown and development over the years in terms of Revenues and EBITDA is illustrated in the following charts:
Directos’ Report
Hera Group – Consolidated Quarterly Report as at 31 March 2010 BoD of 13 May 2010
9
Breakdown of the business portfolio
In the following chapters the operating performance of the various business segments is analysed. Income statements by business segment include structural costs, and inter-divisional transactions valued at current market prices. It should also be noted that this analysis includes the increases in construction on a time and materials basis/work in progress and, therefore, the related costs. These items, as envisaged in the indications of the IAS, are indicated by way of a cost adjustment as capitalised costs in the individual tables.
Gas 46.4%
Integrated Water Cycle
18.5%
Waste Management
25.2%Other services
1.6%
Electricity8.3%
Gas 44.3%
Integrated Water Cycle
17.1%
Waste Management
28.2%
Other services
2.7%
Electricity7.7%
REVENUES
31-Mar-0931-Mar-10
EBITDA
31-Mar-09 31-Mar-10
Gas 42.9%
Integrated Water Cycle
7.8%
Waste M anagement
11.4%
Other services
1.3%
Electricity36.6%
Gas 43.9%
Integrated Water Cy cle
9.5%
Waste Management
14.9%
Other serv ices
2.3%
Electricity29.5%
Directos’ Report
Hera Group – Consolidated Quarterly Report as at 31 March 2010 BoD of 13 May 2010
10
1.03.01 Analysis of the Gas Area The Gas area, including sales and distribution of methane and LPG, district heating services and heat management, at the end of the first quarter of 2010, although decreasing by around two percentage points in terms of contribution to profits, shows an increase in profit by 5.9% compared to the same period in 2009, as highlighted in the following table:
(millions of €) 31‐Mar‐09 31‐Mar‐10 Abs Chg % Chg
Area EBITDA 77,3 81,9 +4,6 +5,9%
Group EBITDA 166,6 185,1 +18,5 +11,1%
Percentage weight 46,4% 44,3% ‐2,1 p.p.
The following table shows the main quantitative indicators of the area:
Quantitative Data 31‐Mar‐09 31‐Mar‐10 Abs Chg % Chg
Gas volumes distributed (millions of cubic metres) 1.093,1 1.186,4 +93,3 +8,5%
Gas volumes sold (millions of cubic metres) 1.080,6 1.293,0 +212,4 +19,7%
‐ of which Trading volumes 72,8 218,5 +145,7 +200,0%
Heat volumes delivered (Gwht) 222,4 260,7 +38,3 +17,2%
The volumes of gas distributed changed from 1,093.1 million cubic meters in the first quarter of 2009 to 1,186.4 of the first quarter 2010, up 8.5%. The volumes of gas sold rose from 1,080.6 million cubic meters in 2009 to 1,293.0 in 2010, an increase of 19.7%. The volumes of heat delivered rose from 222.4 Gwht in 2009 to 260.7 in 2010, an increase of 17.2%. A summary of the economic results in the area is shown hereunder:
Income Statement(millions of €)
31‐Mar‐09 % Inc. 31‐Mar‐10 % Inc. Abs Chg % Chg
Revenues 579.6 499.9 ‐79.7 ‐13.8%
Operating costs (498.6) ‐86.0% (403.3) ‐80.7% ‐95.3 ‐19.1%
Personnel costs (18.2) ‐3.1% (18.3) ‐3.7% +0.1 +0.5%
Capitalised costs 14.5 2.5% 3.7 0.7% ‐10.8 ‐74.4%
EBITDA 77.3 13.3% 81.9 16.4% +4.6 +5.9%
Directos’ Report
Hera Group – Consolidated Quarterly Report as at 31 March 2010 BoD of 13 May 2010
11
Revenues decreased by 13.8%, from Euro 579.6 million in 2009 to Euro 499.9 million in 2010, with respect to the decrease in price of raw materials, which similarly affects operating costs, but in the opposite sign: this effect prevails over the positive effect of the increase in volumes sold and distributed. The lower capitalised costs are linked to the different accounting treatment of investment works carried out independently following the merger of local territorial companies in the Parent company. Personnel cost is instead mainly aligned to the first quarter of the previous year. Therefore, as at 31 March 2010, the Group recorded an increase in the EBITDA in this area equal to Euro 4.6 million, from Euro 77.3 million to Euro 81.9 million, with a significant increase in percentage margin, which rose from 13.3% in 2009 to 16.4% in 2010. This result is to be attributed almost entirely to the district heating activities, where higher volumes in heat supplied are accompanied to a remarkable decrease in the average procurement cost of raw materials, previously related to heat sold from the new cogeneration plant in Imola.
Directos’ Report
Hera Group – Consolidated Quarterly Report as at 31 March 2010 BoD of 13 May 2010
12
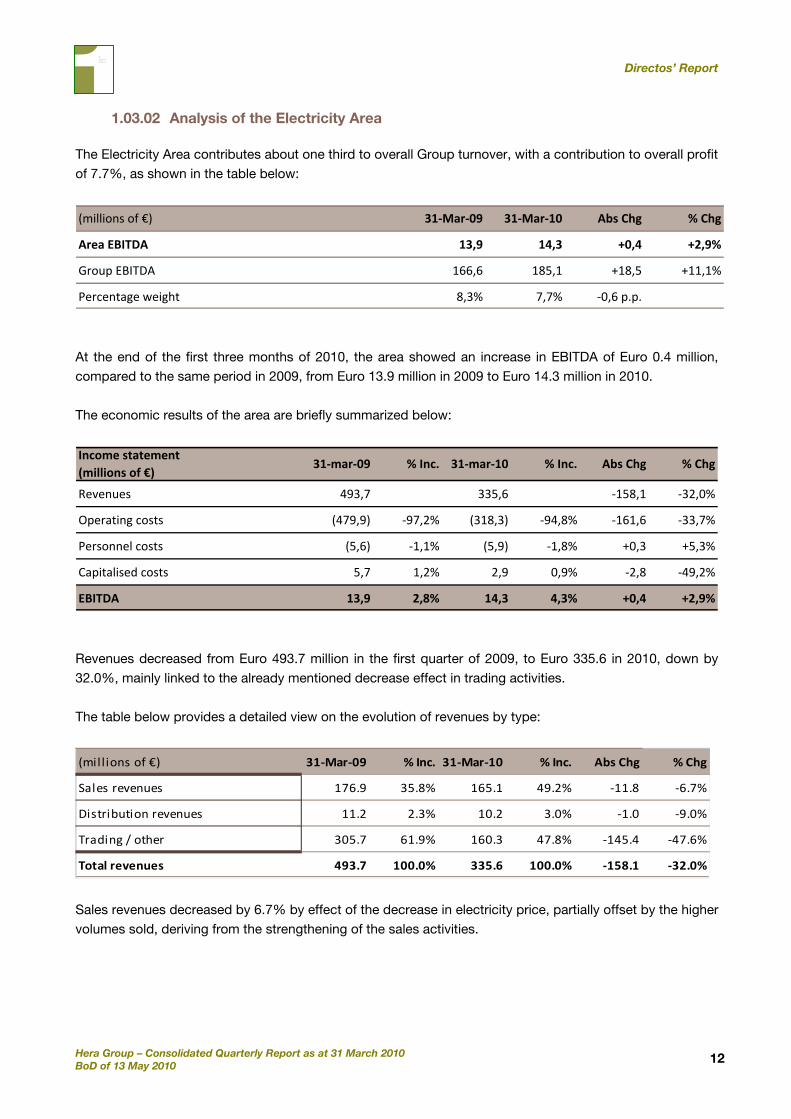
1.03.02 Analysis of the Electricity Area
The Electricity Area contributes about one third to overall Group turnover, with a contribution to overall profit of 7.7%, as shown in the table below:
(millions of €) 31‐Mar‐09 31‐Mar‐10 Abs Chg % Chg
Area EBITDA 13,9 14,3 +0,4 +2,9%
Group EBITDA 166,6 185,1 +18,5 +11,1%
Percentage weight 8,3% 7,7% ‐0,6 p.p.
At the end of the first three months of 2010, the area showed an increase in EBITDA of Euro 0.4 million, compared to the same period in 2009, from Euro 13.9 million in 2009 to Euro 14.3 million in 2010. The economic results of the area are briefly summarized below:
Income statement(millions of €)
31‐mar‐09 % Inc. 31‐mar‐10 % Inc. Abs Chg % Chg
Revenues 493,7 335,6 ‐158,1 ‐32,0%
Operating costs (479,9) ‐97,2% (318,3) ‐94,8% ‐161,6 ‐33,7%
Personnel costs (5,6) ‐1,1% (5,9) ‐1,8% +0,3 +5,3%
Capitalised costs 5,7 1,2% 2,9 0,9% ‐2,8 ‐49,2%
EBITDA 13,9 2,8% 14,3 4,3% +0,4 +2,9%
Revenues decreased from Euro 493.7 million in the first quarter of 2009, to Euro 335.6 in 2010, down by 32.0%, mainly linked to the already mentioned decrease effect in trading activities. The table below provides a detailed view on the evolution of revenues by type:
(millions of €) 31‐Mar‐09 % Inc. 31‐Mar‐10 % Inc. Abs Chg % Chg
Sales revenues 176.9 35.8% 165.1 49.2% ‐11.8 ‐6.7%
Distribution revenues 11.2 2.3% 10.2 3.0% ‐1.0 ‐9.0%
Trading / other 305.7 61.9% 160.3 47.8% ‐145.4 ‐47.6%
Total revenues 493.7 100.0% 335.6 100.0% ‐158.1 ‐32.0%
Sales revenues decreased by 6.7% by effect of the decrease in electricity price, partially offset by the higher volumes sold, deriving from the strengthening of the sales activities.
Directos’ Report
Hera Group – Consolidated Quarterly Report as at 31 March 2010 BoD of 13 May 2010
13
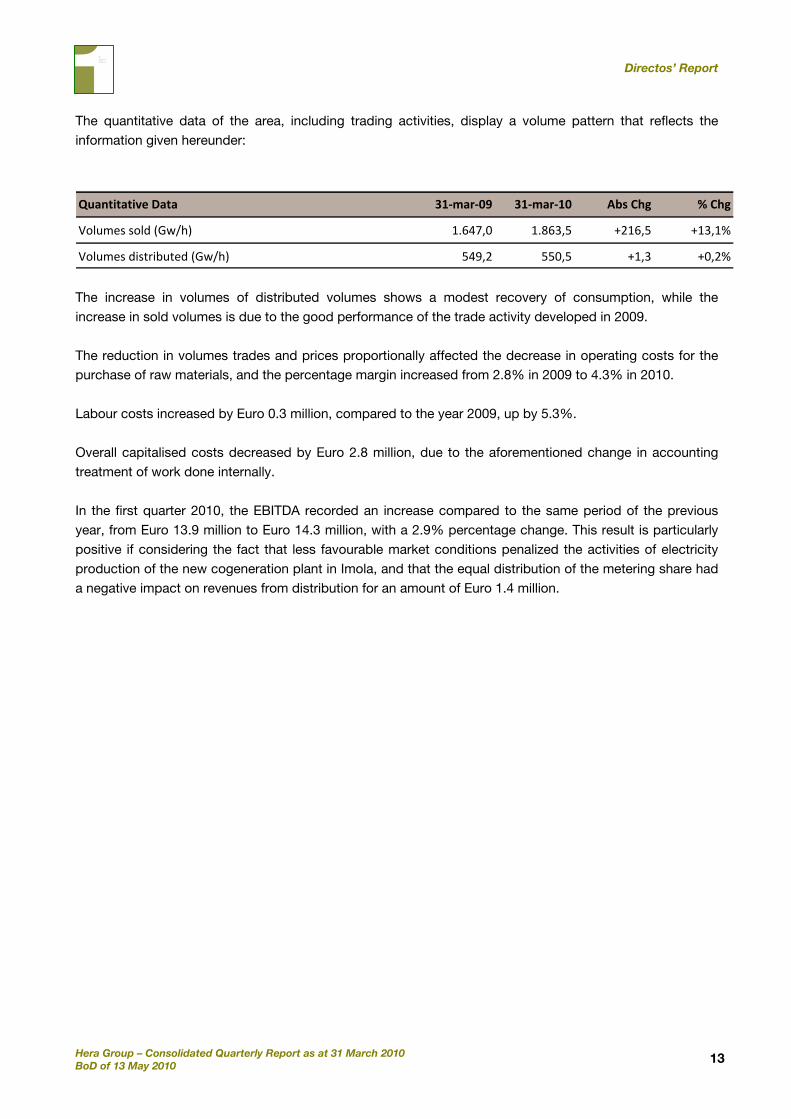
The quantitative data of the area, including trading activities, display a volume pattern that reflects the information given hereunder:
Quantitative Data 31‐mar‐09 31‐mar‐10 Abs Chg % Chg
Volumes sold (Gw/h) 1.647,0 1.863,5 +216,5 +13,1%
Volumes distributed (Gw/h) 549,2 550,5 +1,3 +0,2%
The increase in volumes of distributed volumes shows a modest recovery of consumption, while the increase in sold volumes is due to the good performance of the trade activity developed in 2009. The reduction in volumes trades and prices proportionally affected the decrease in operating costs for the purchase of raw materials, and the percentage margin increased from 2.8% in 2009 to 4.3% in 2010. Labour costs increased by Euro 0.3 million, compared to the year 2009, up by 5.3%. Overall capitalised costs decreased by Euro 2.8 million, due to the aforementioned change in accounting treatment of work done internally. In the first quarter 2010, the EBITDA recorded an increase compared to the same period of the previous year, from Euro 13.9 million to Euro 14.3 million, with a 2.9% percentage change. This result is particularly positive if considering the fact that less favourable market conditions penalized the activities of electricity production of the new cogeneration plant in Imola, and that the equal distribution of the metering share had a negative impact on revenues from distribution for an amount of Euro 1.4 million.
Directos’ Report
Hera Group – Consolidated Quarterly Report as at 31 March 2010 BoD of 13 May 2010
14
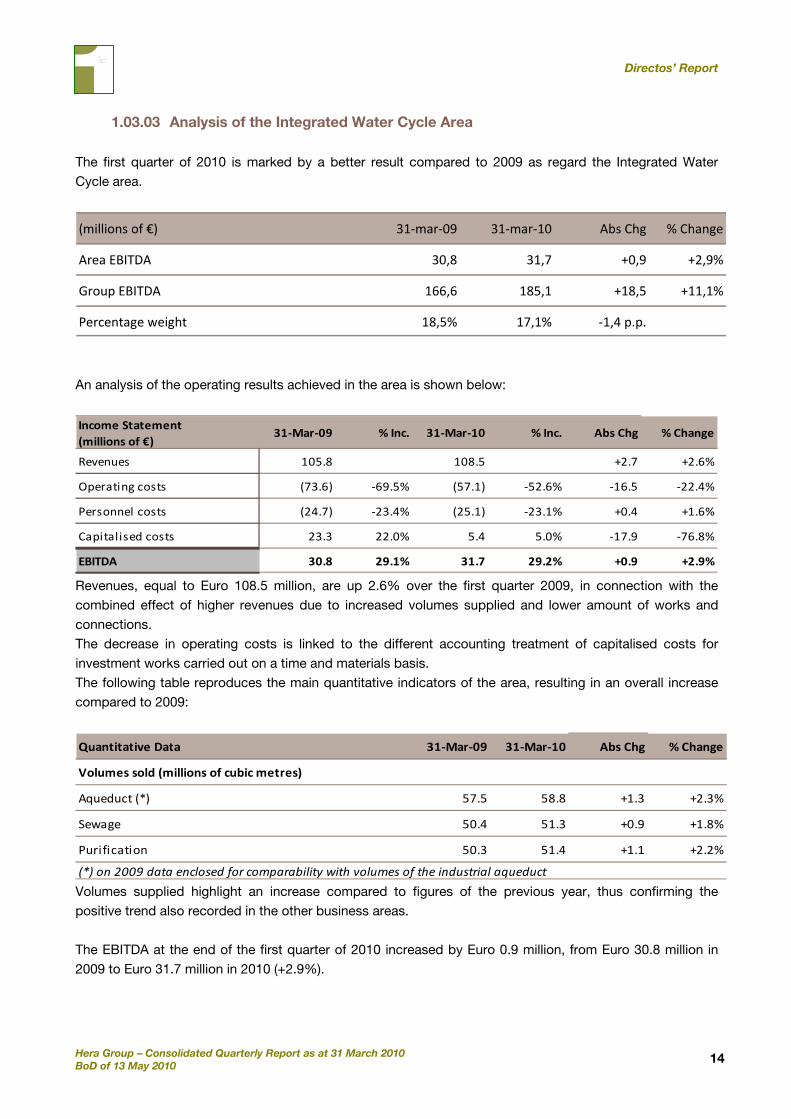
1.03.03 Analysis of the Integrated Water Cycle Area The first quarter of 2010 is marked by a better result compared to 2009 as regard the Integrated Water Cycle area.
(millions of €) 31‐mar‐09 31‐mar‐10 Abs Chg % Change
Area EBITDA 30,8 31,7 +0,9 +2,9%
Group EBITDA 166,6 185,1 +18,5 +11,1%
Percentage weight 18,5% 17,1% ‐1,4 p.p.
An analysis of the operating results achieved in the area is shown below:
Income Statement(millions of €)
31‐Mar‐09 % Inc. 31‐Mar‐10 % Inc. Abs Chg % Change
Revenues 105.8 108.5 +2.7 +2.6%
Operating costs (73.6) ‐69.5% (57.1) ‐52.6% ‐16.5 ‐22.4%
Personnel costs (24.7) ‐23.4% (25.1) ‐23.1% +0.4 +1.6%
Capitalised costs 23.3 22.0% 5.4 5.0% ‐17.9 ‐76.8%
EBITDA 30.8 29.1% 31.7 29.2% +0.9 +2.9%
Revenues, equal to Euro 108.5 million, are up 2.6% over the first quarter 2009, in connection with the combined effect of higher revenues due to increased volumes supplied and lower amount of works and connections. The decrease in operating costs is linked to the different accounting treatment of capitalised costs for investment works carried out on a time and materials basis. The following table reproduces the main quantitative indicators of the area, resulting in an overall increase compared to 2009:
Quantitative Data 31‐Mar‐09 31‐Mar‐10 Abs Chg % Change
Volumes sold (millions of cubic metres)
Aqueduct (*) 57.5 58.8 +1.3 +2.3%
Sewage 50.4 51.3 +0.9 +1.8%
Purification 50.3 51.4 +1.1 +2.2%
(*) on 2009 data enclosed for comparability with volumes of the industrial aqueduct Volumes supplied highlight an increase compared to figures of the previous year, thus confirming the positive trend also recorded in the other business areas. The EBITDA at the end of the first quarter of 2010 increased by Euro 0.9 million, from Euro 30.8 million in 2009 to Euro 31.7 million in 2010 (+2.9%).
Directos’ Report
Hera Group – Consolidated Quarterly Report as at 31 March 2010 BoD of 13 May 2010
15
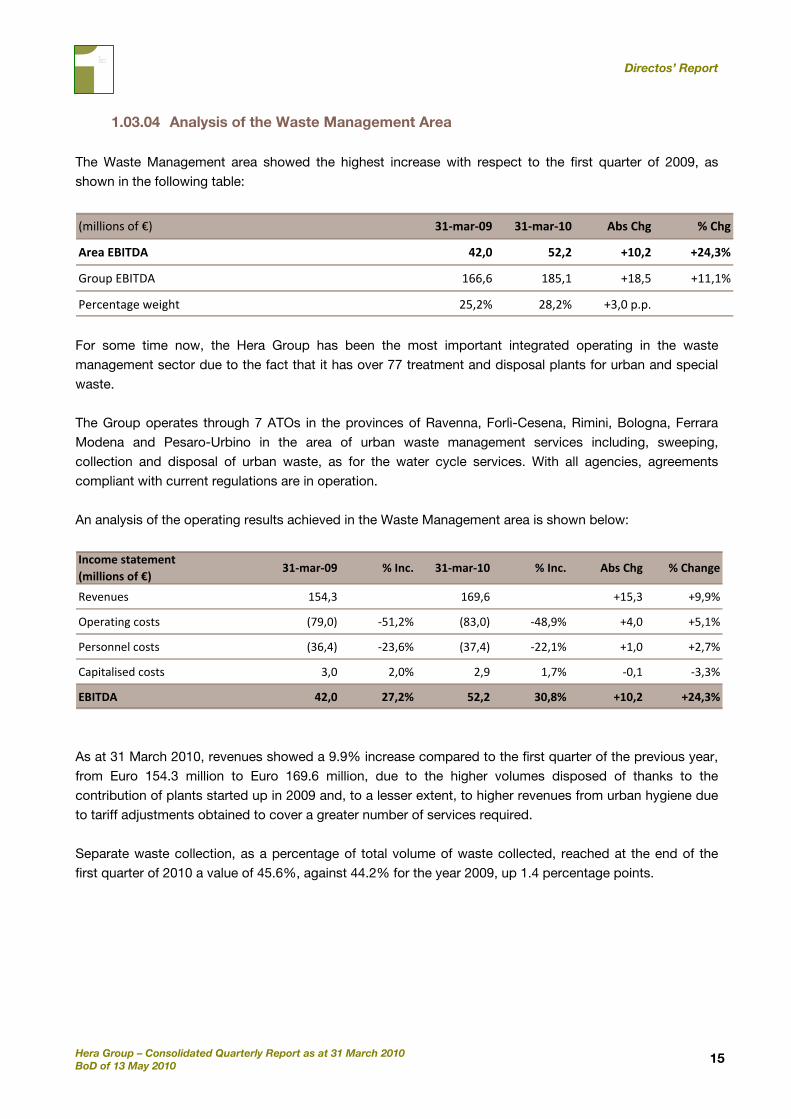
1.03.04 Analysis of the Waste Management Area The Waste Management area showed the highest increase with respect to the first quarter of 2009, as shown in the following table:
(millions of €) 31‐mar‐09 31‐mar‐10 Abs Chg % Chg
Area EBITDA 42,0 52,2 +10,2 +24,3%
Group EBITDA 166,6 185,1 +18,5 +11,1%
Percentage weight 25,2% 28,2% +3,0 p.p.
For some time now, the Hera Group has been the most important integrated operating in the waste management sector due to the fact that it has over 77 treatment and disposal plants for urban and special waste. The Group operates through 7 ATOs in the provinces of Ravenna, Forlì-Cesena, Rimini, Bologna, Ferrara Modena and Pesaro-Urbino in the area of urban waste management services including, sweeping, collection and disposal of urban waste, as for the water cycle services. With all agencies, agreements compliant with current regulations are in operation. An analysis of the operating results achieved in the Waste Management area is shown below:
Income statement(millions of €)
31‐mar‐09 % Inc. 31‐mar‐10 % Inc. Abs Chg % Change
Revenues 154,3 169,6 +15,3 +9,9%
Operating costs (79,0) ‐51,2% (83,0) ‐48,9% +4,0 +5,1%
Personnel costs (36,4) ‐23,6% (37,4) ‐22,1% +1,0 +2,7%
Capitalised costs 3,0 2,0% 2,9 1,7% ‐0,1 ‐3,3%
EBITDA 42,0 27,2% 52,2 30,8% +10,2 +24,3%
As at 31 March 2010, revenues showed a 9.9% increase compared to the first quarter of the previous year, from Euro 154.3 million to Euro 169.6 million, due to the higher volumes disposed of thanks to the contribution of plants started up in 2009 and, to a lesser extent, to higher revenues from urban hygiene due to tariff adjustments obtained to cover a greater number of services required. Separate waste collection, as a percentage of total volume of waste collected, reached at the end of the first quarter of 2010 a value of 45.6%, against 44.2% for the year 2009, up 1.4 percentage points.
Directos’ Report
Hera Group – Consolidated Quarterly Report as at 31 March 2010 BoD of 13 May 2010
16
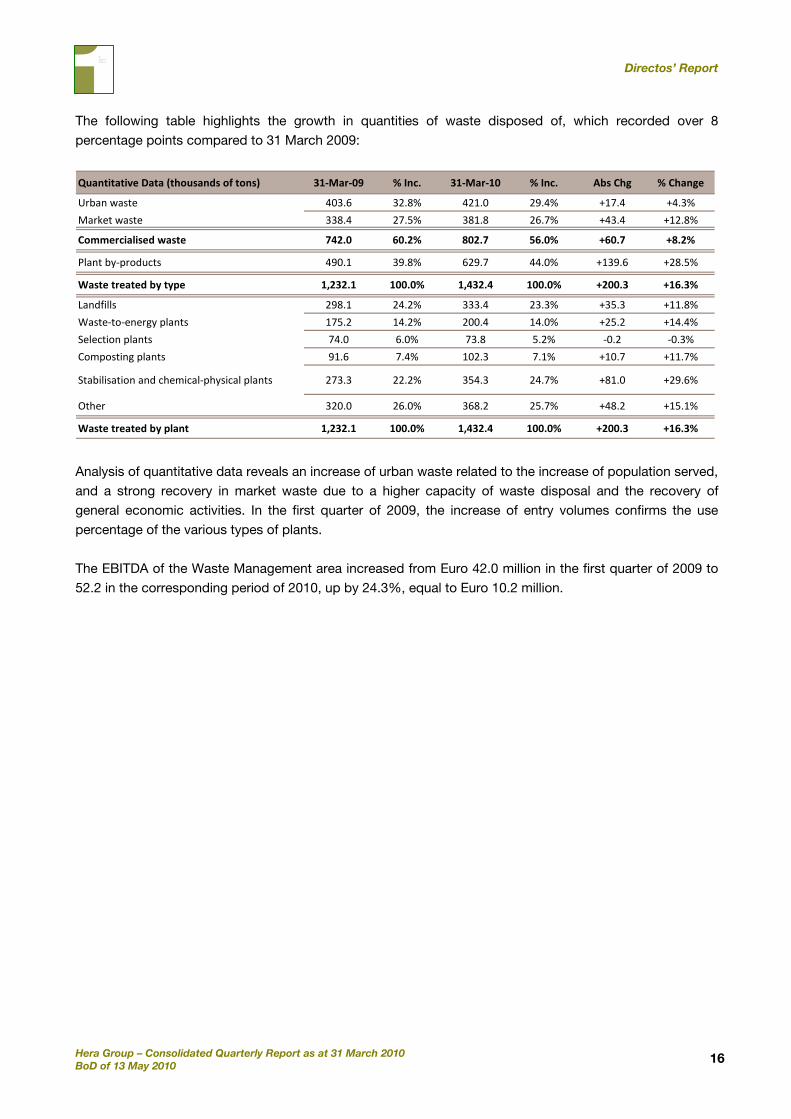
The following table highlights the growth in quantities of waste disposed of, which recorded over 8 percentage points compared to 31 March 2009:
Quantitative Data (thousands of tons) 31‐Mar‐09 % Inc. 31‐Mar‐10 % Inc. Abs Chg % Change
Urban waste 403.6 32.8% 421.0 29.4% +17.4 +4.3%
Market waste 338.4 27.5% 381.8 26.7% +43.4 +12.8%
Commercialised waste 742.0 60.2% 802.7 56.0% +60.7 +8.2%
Plant by‐products 490.1 39.8% 629.7 44.0% +139.6 +28.5%
Waste treated by type 1,232.1 100.0% 1,432.4 100.0% +200.3 +16.3%
Landfills 298.1 24.2% 333.4 23.3% +35.3 +11.8%
Waste‐to‐energy plants 175.2 14.2% 200.4 14.0% +25.2 +14.4%
Selection plants 74.0 6.0% 73.8 5.2% ‐0.2 ‐0.3%
Composting plants 91.6 7.4% 102.3 7.1% +10.7 +11.7%
Stabilisation and chemical‐physical plants 273.3 22.2% 354.3 24.7% +81.0 +29.6%
Other 320.0 26.0% 368.2 25.7% +48.2 +15.1%
Waste treated by plant 1,232.1 100.0% 1,432.4 100.0% +200.3 +16.3%
Analysis of quantitative data reveals an increase of urban waste related to the increase of population served, and a strong recovery in market waste due to a higher capacity of waste disposal and the recovery of general economic activities. In the first quarter of 2009, the increase of entry volumes confirms the use percentage of the various types of plants. The EBITDA of the Waste Management area increased from Euro 42.0 million in the first quarter of 2009 to 52.2 in the corresponding period of 2010, up by 24.3%, equal to Euro 10.2 million.
Directos’ Report
Hera Group – Consolidated Quarterly Report as at 31 March 2010 BoD of 13 May 2010
17
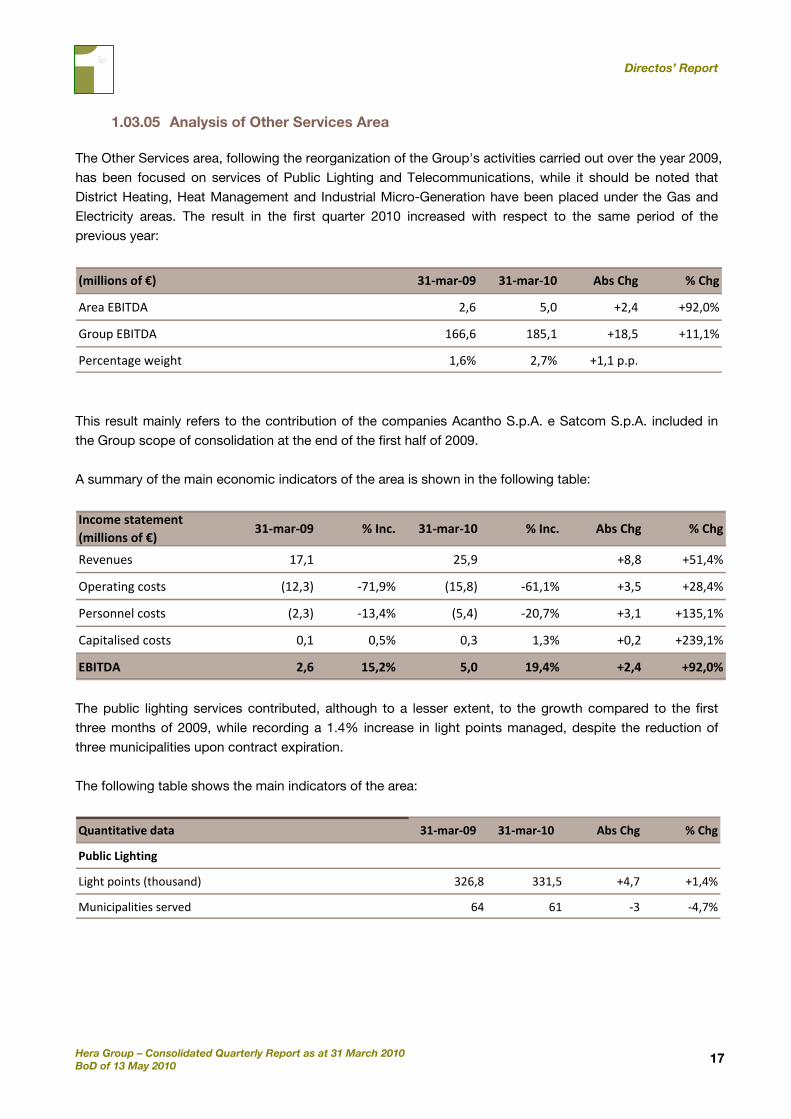
1.03.05 Analysis of Other Services Area The Other Services area, following the reorganization of the Group's activities carried out over the year 2009, has been focused on services of Public Lighting and Telecommunications, while it should be noted that District Heating, Heat Management and Industrial Micro-Generation have been placed under the Gas and Electricity areas. The result in the first quarter 2010 increased with respect to the same period of the previous year:
(millions of €) 31‐mar‐09 31‐mar‐10 Abs Chg % Chg
Area EBITDA 2,6 5,0 +2,4 +92,0%
Group EBITDA 166,6 185,1 +18,5 +11,1%
Percentage weight 1,6% 2,7% +1,1 p.p.
This result mainly refers to the contribution of the companies Acantho S.p.A. e Satcom S.p.A. included in the Group scope of consolidation at the end of the first half of 2009. A summary of the main economic indicators of the area is shown in the following table:
Income statement(millions of €)
31‐mar‐09 % Inc. 31‐mar‐10 % Inc. Abs Chg % Chg
Revenues 17,1 25,9 +8,8 +51,4%
Operating costs (12,3) ‐71,9% (15,8) ‐61,1% +3,5 +28,4%
Personnel costs (2,3) ‐13,4% (5,4) ‐20,7% +3,1 +135,1%
Capitalised costs 0,1 0,5% 0,3 1,3% +0,2 +239,1%
EBITDA 2,6 15,2% 5,0 19,4% +2,4 +92,0%
The public lighting services contributed, although to a lesser extent, to the growth compared to the first three months of 2009, while recording a 1.4% increase in light points managed, despite the reduction of three municipalities upon contract expiration. The following table shows the main indicators of the area:
Quantitative data 31‐mar‐09 31‐mar‐10 Abs Chg % Chg
Public Lighting
Light points (thousand) 326,8 331,5 +4,7 +1,4%
Municipalities served 64 61 ‐3 ‐4,7%
Directos’ Report
Hera Group – Consolidated Quarterly Report as at 31 March 2010 BoD of 13 May 2010
18
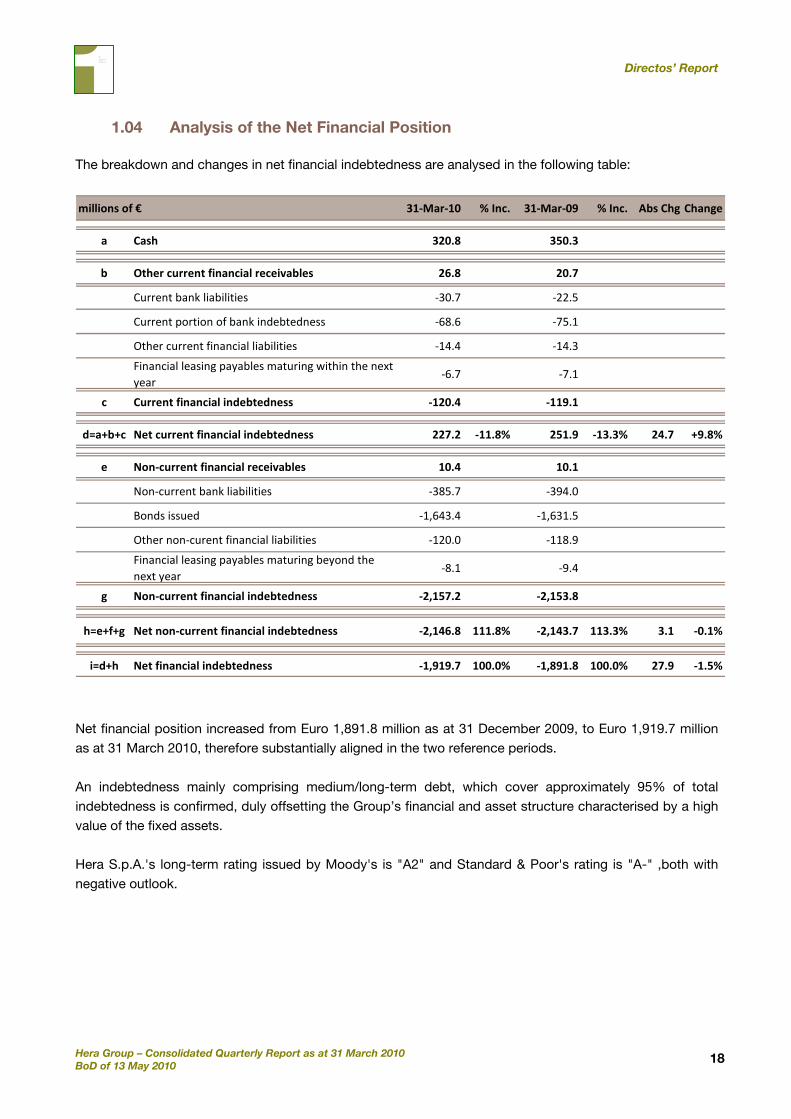
1.04 Analysis of the Net Financial Position
The breakdown and changes in net financial indebtedness are analysed in the following table:
millions of € 31‐Mar‐10 % Inc. 31‐Mar‐09 % Inc. Abs Chg Change
a Cash 320.8 350.3
b Other current financial receivables 26.8 20.7
Current bank liabilities ‐30.7 ‐22.5
Current portion of bank indebtedness ‐68.6 ‐75.1
Other current financial liabilities ‐14.4 ‐14.3
Financial leasing payables maturing within the next year
‐6.7 ‐7.1
c Current financial indebtedness ‐120.4 ‐119.1
d=a+b+c Net current financial indebtedness 227.2 ‐11.8% 251.9 ‐13.3% 24.7 +9.8%
e Non‐current financial receivables 10.4 10.1
Non‐current bank liabilities ‐385.7 ‐394.0
Bonds issued ‐1,643.4 ‐1,631.5
Other non‐curent financial liabilities ‐120.0 ‐118.9
Financial leasing payables maturing beyond the next year
‐8.1 ‐9.4
g Non‐current financial indebtedness ‐2,157.2 ‐2,153.8
h=e+f+g Net non‐current financial indebtedness ‐2,146.8 111.8% ‐2,143.7 113.3% 3.1 ‐0.1%
i=d+h Net financial indebtedness ‐1,919.7 100.0% ‐1,891.8 100.0% 27.9 ‐1.5%
Net financial position increased from Euro 1,891.8 million as at 31 December 2009, to Euro 1,919.7 million as at 31 March 2010, therefore substantially aligned in the two reference periods. An indebtedness mainly comprising medium/long-term debt, which cover approximately 95% of total indebtedness is confirmed, duly offsetting the Group’s financial and asset structure characterised by a high value of the fixed assets. Hera S.p.A.'s long-term rating issued by Moody's is "A2" and Standard & Poor's rating is "A-" ,both with negative outlook.
Directos’ Report
Hera Group – Consolidated Quarterly Report as at 31 March 2010 BoD of 13 May 2010
19
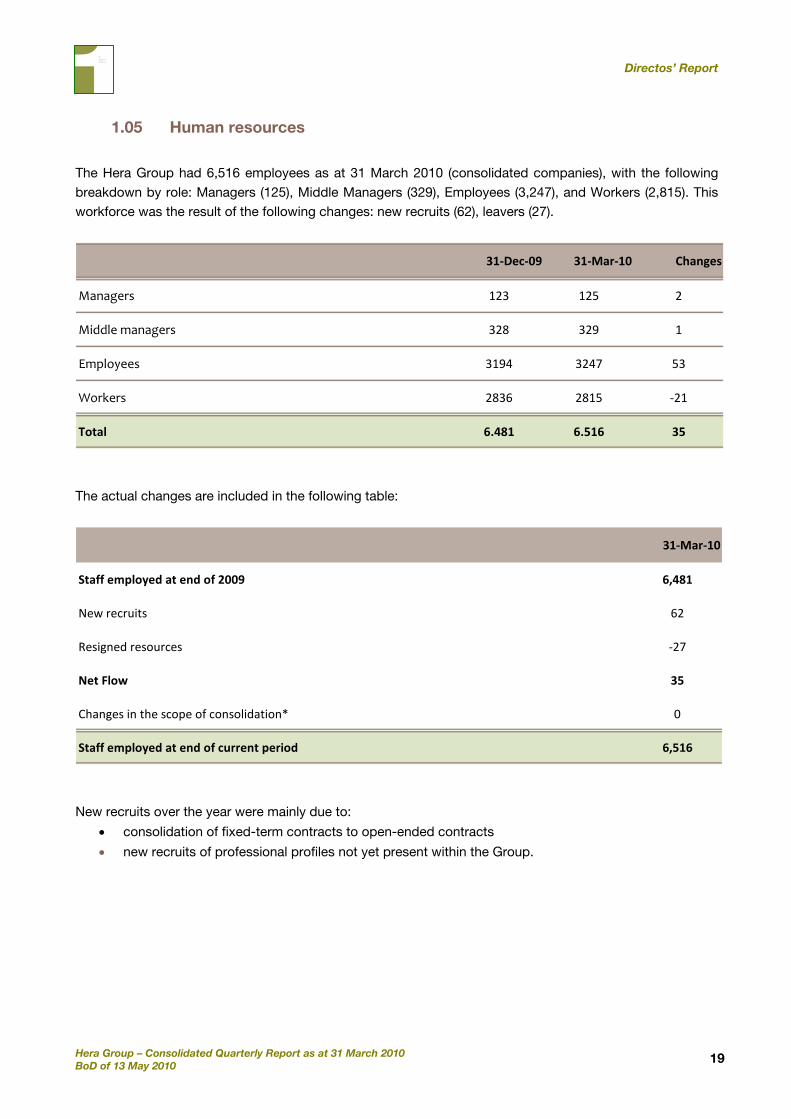
1.05 Human resources
The Hera Group had 6,516 employees as at 31 March 2010 (consolidated companies), with the following breakdown by role: Managers (125), Middle Managers (329), Employees (3,247), and Workers (2,815). This workforce was the result of the following changes: new recruits (62), leavers (27).
31‐Dec‐09 31‐Mar‐10 Changes
Managers 123 125 2
Middle managers 328 329 1
Employees 3194 3247 53
Workers 2836 2815 ‐21
Total 6.481 6.516 35
The actual changes are included in the following table:
31‐Mar‐10
Staff employed at end of 2009 6,481
New recruits 62
Resigned resources ‐27
Net Flow 35
Changes in the scope of consolidation* 0
Staff employed at end of current period 6,516
New recruits over the year were mainly due to:
• consolidation of fixed-term contracts to open-ended contracts
• new recruits of professional profiles not yet present within the Group.
2Consolidated Quarterly Financial
Statements
Accounting statements and explanatory notes
Hera Group – Consolidated Quarterly Report as at 31 March 2010 BoD of 13 May 2010 20
20
2.01 Income statement
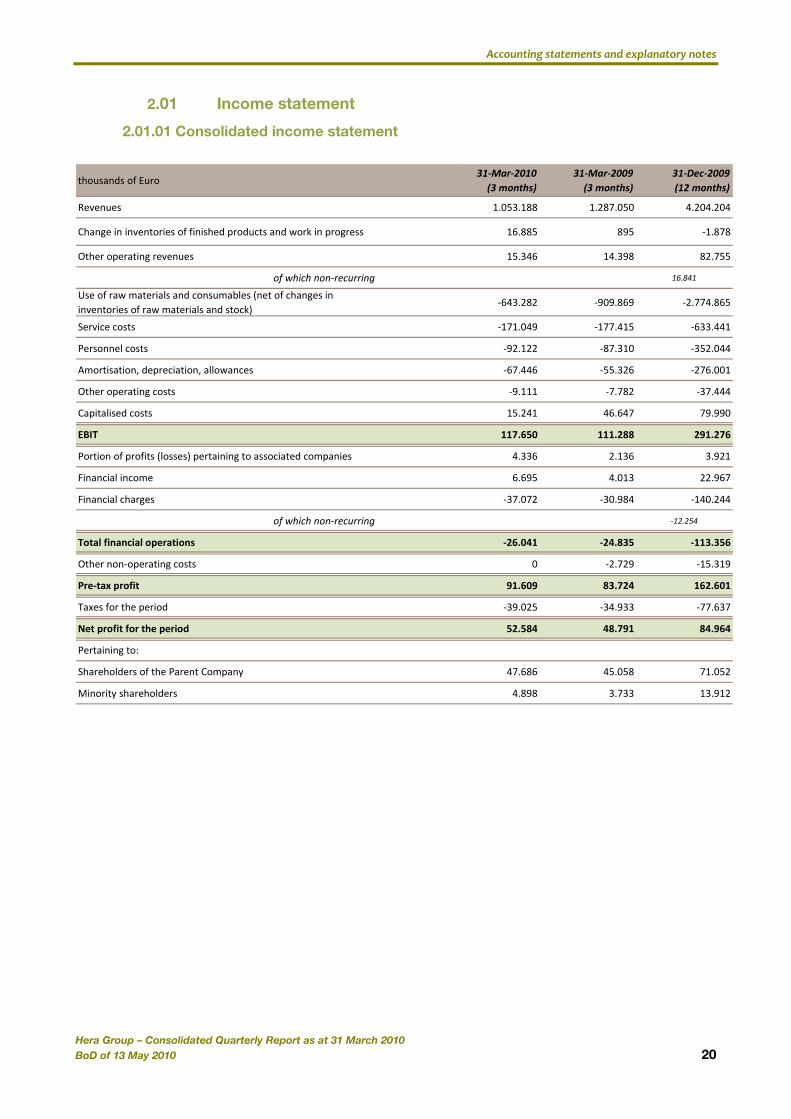
2.01.01 Consolidated income statement
thousands of Euro31‐Mar‐2010(3 months)
31‐Mar‐2009(3 months)
31‐Dec‐2009(12 months)
Revenues 1.053.188 1.287.050 4.204.204
Change in inventories of finished products and work in progress 16.885 895 ‐1.878
Other operating revenues 15.346 14.398 82.755
of which non‐recurring 16.841
Use of raw materials and consumables (net of changes in inventories of raw materials and stock)
‐643.282 ‐909.869 ‐2.774.865
Service costs ‐171.049 ‐177.415 ‐633.441
Personnel costs ‐92.122 ‐87.310 ‐352.044
Amortisation, depreciation, allowances ‐67.446 ‐55.326 ‐276.001
Other operating costs ‐9.111 ‐7.782 ‐37.444
Capitalised costs 15.241 46.647 79.990
EBIT 117.650 111.288 291.276
Portion of profits (losses) pertaining to associated companies 4.336 2.136 3.921
Financial income 6.695 4.013 22.967
Financial charges ‐37.072 ‐30.984 ‐140.244
of which non‐recurring ‐12.254
Total financial operations ‐26.041 ‐24.835 ‐113.356
Other non‐operating costs 0 ‐2.729 ‐15.319
Pre‐tax profit 91.609 83.724 162.601
Taxes for the period ‐39.025 ‐34.933 ‐77.637
Net profit for the period 52.584 48.791 84.964
Pertaining to:
Shareholders of the Parent Company 47.686 45.058 71.052
Minority shareholders 4.898 3.733 13.912
Accounting statements and explanatory notes
Hera Group – Consolidated Quarterly Report as at 31 March 2010 BoD of 13 May 2010 21
21
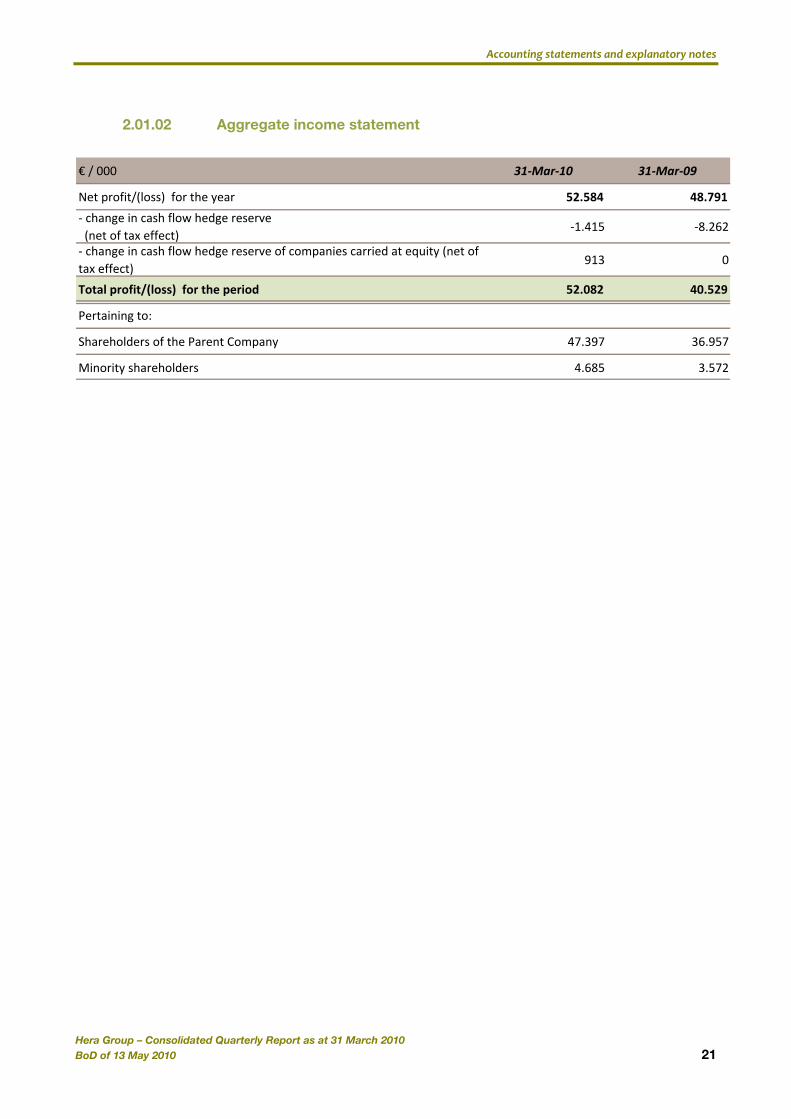
2.01.02 Aggregate income statement
€ / 000 31‐Mar‐10 31‐Mar‐09
Net profit/(loss) for the year 52.584 48.791
‐ change in cash flow hedge reserve (net of tax effect)
‐1.415 ‐8.262
‐ change in cash flow hedge reserve of companies carried at equity (net of tax effect)
913 0
Total profit/(loss) for the period 52.082 40.529
Pertaining to:
Shareholders of the Parent Company 47.397 36.957
Minority shareholders 4.685 3.572
Accounting statements and explanatory notes
Hera Group – Consolidated Quarterly Report as at 31 March 2010 BoD of 13 May 2010 22
22
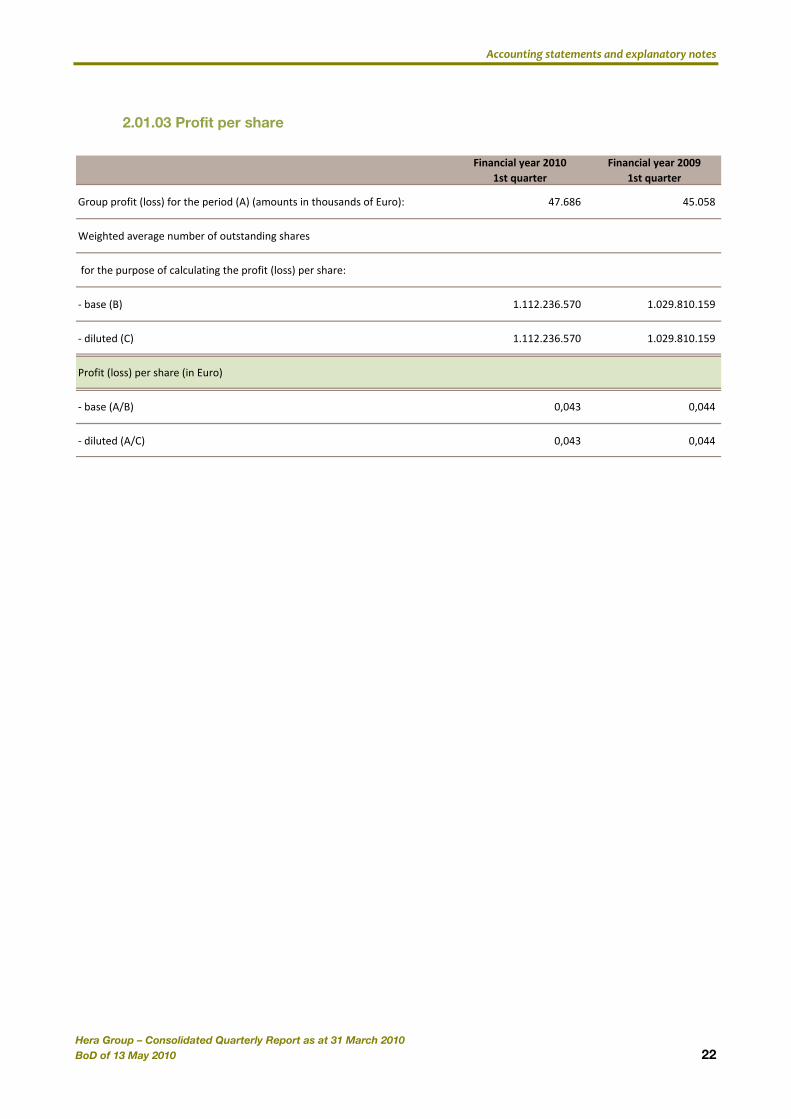
2.01.03 Profit per share
Financial year 20101st quarter
Financial year 20091st quarter
Group profit (loss) for the period (A) (amounts in thousands of Euro): 47.686 45.058
Weighted average number of outstanding shares
for the purpose of calculating the profit (loss) per share:
‐ base (B) 1.112.236.570 1.029.810.159
‐ diluted (C) 1.112.236.570 1.029.810.159
Profit (loss) per share (in Euro)
‐ base (A/B) 0,043 0,044
‐ diluted (A/C) 0,043 0,044
Accounting statements and explanatory notes
Hera Group – Consolidated Quarterly Report as at 31 March 2010 BoD of 13 May 2010 23
23
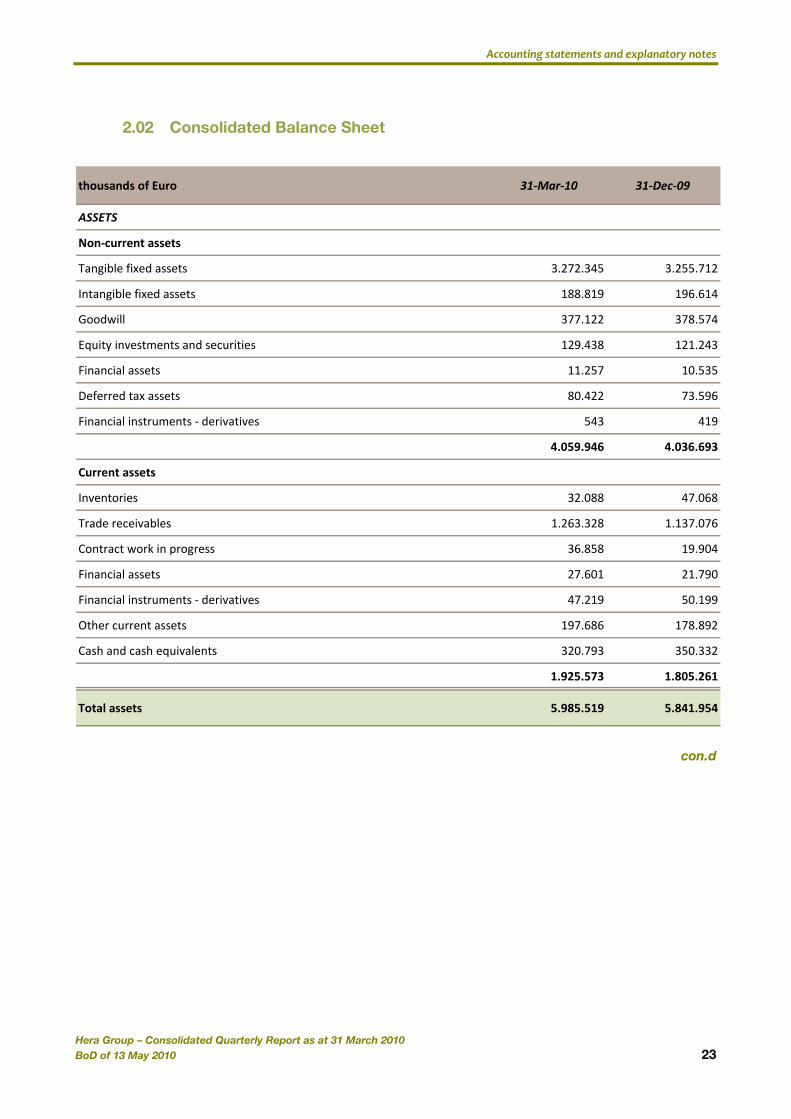
2.02 Consolidated Balance Sheet
thousands of Euro 31‐Mar‐10 31‐Dec‐09
ASSETS
Non‐current assets
Tangible fixed assets 3.272.345 3.255.712
Intangible fixed assets 188.819 196.614
Goodwill 377.122 378.574
Equity investments and securities 129.438 121.243
Financial assets 11.257 10.535
Deferred tax assets 80.422 73.596
Financial instruments ‐ derivatives 543 419
4.059.946 4.036.693
Current assets
Inventories 32.088 47.068
Trade receivables 1.263.328 1.137.076
Contract work in progress 36.858 19.904
Financial assets 27.601 21.790
Financial instruments ‐ derivatives 47.219 50.199
Other current assets 197.686 178.892
Cash and cash equivalents 320.793 350.332
1.925.573 1.805.261
Total assets 5.985.519 5.841.954
con.d
Accounting statements and explanatory notes
Hera Group – Consolidated Quarterly Report as at 31 March 2010 BoD of 13 May 2010 24
24
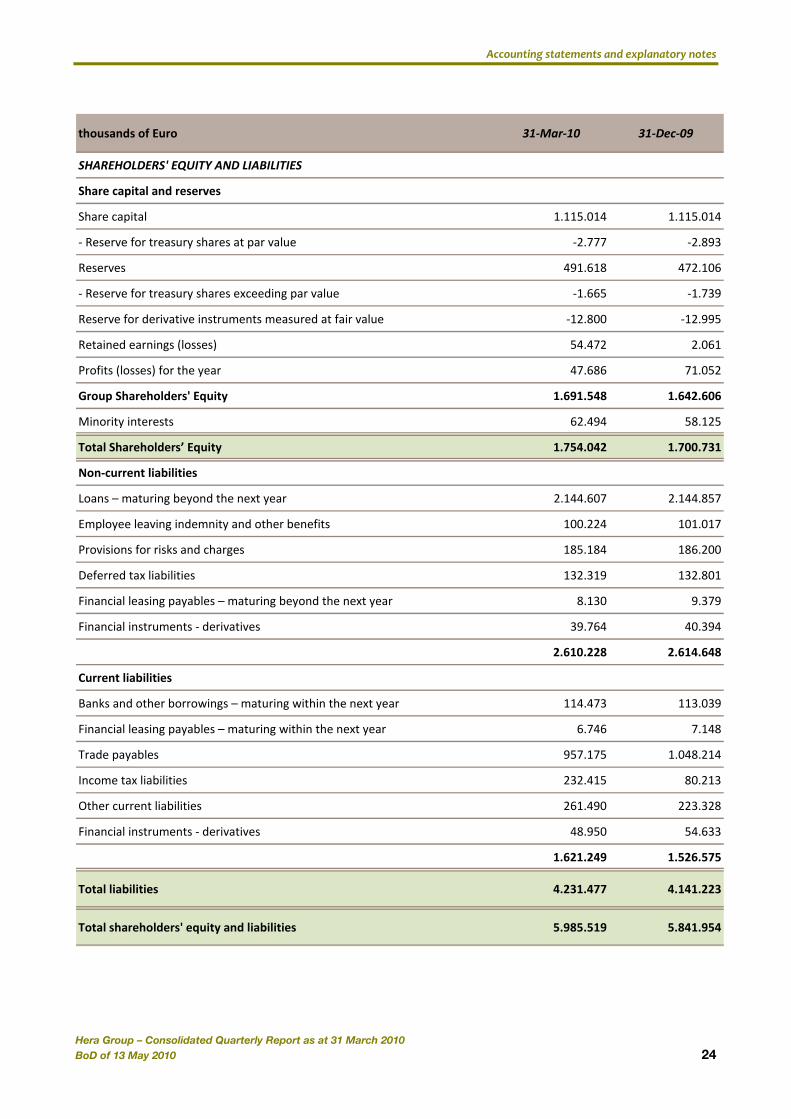
thousands of Euro 31‐Mar‐10 31‐Dec‐09
SHAREHOLDERS' EQUITY AND LIABILITIES
Share capital and reserves
Share capital 1.115.014 1.115.014
‐ Reserve for treasury shares at par value ‐2.777 ‐2.893
Reserves 491.618 472.106
‐ Reserve for treasury shares exceeding par value ‐1.665 ‐1.739
Reserve for derivative instruments measured at fair value ‐12.800 ‐12.995
Retained earnings (losses) 54.472 2.061
Profits (losses) for the year 47.686 71.052
Group Shareholders' Equity 1.691.548 1.642.606
Minority interests 62.494 58.125
Total Shareholders’ Equity 1.754.042 1.700.731
Non‐current liabilities
Loans – maturing beyond the next year 2.144.607 2.144.857
Employee leaving indemnity and other benefits 100.224 101.017
Provisions for risks and charges 185.184 186.200
Deferred tax liabilities 132.319 132.801
Financial leasing payables – maturing beyond the next year 8.130 9.379
Financial instruments ‐ derivatives 39.764 40.394
2.610.228 2.614.648
Current liabilities
Banks and other borrowings – maturing within the next year 114.473 113.039
Financial leasing payables – maturing within the next year 6.746 7.148
Trade payables 957.175 1.048.214
Income tax liabilities 232.415 80.213
Other current liabilities 261.490 223.328
Financial instruments ‐ derivatives 48.950 54.633
1.621.249 1.526.575
Total liabilities 4.231.477 4.141.223
Total shareholders' equity and liabilities 5.985.519 5.841.954
Accounting statements and explanatory notes
Hera Group – Consolidated Quarterly Report as at 31 March 2010 BoD of 13 May 2010 25
25
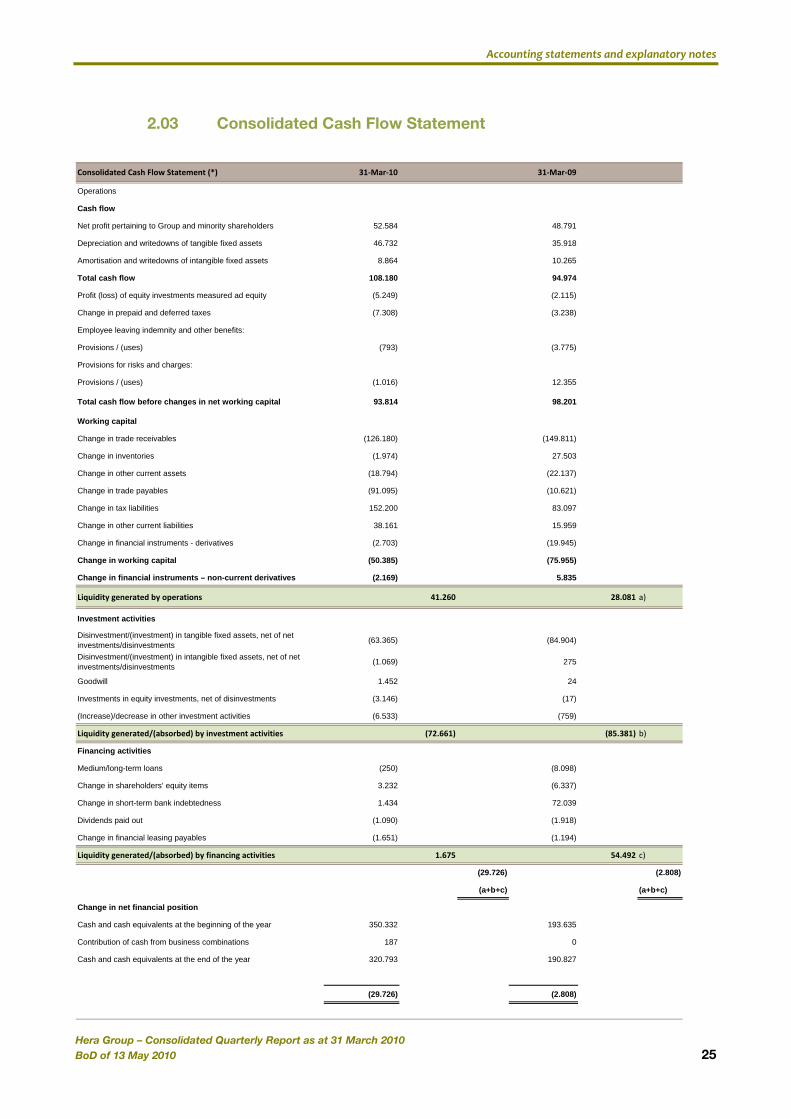
2.03 Consolidated Cash Flow Statement
Consolidated Cash Flow Statement (*) 31‐Mar‐10 31‐Mar‐09
Operations
Cash flow
Net profit pertaining to Group and minority shareholders 52.584 48.791
Depreciation and writedowns of tangible fixed assets 46.732 35.918
Amortisation and writedowns of intangible fixed assets 8.864 10.265
Total cash flow 108.180 94.974
Profit (loss) of equity investments measured ad equity (5.249) (2.115)
Change in prepaid and deferred taxes (7.308) (3.238)
Employee leaving indemnity and other benefits:
Provisions / (uses) (793) (3.775)
Provisions for risks and charges:
Provisions / (uses) (1.016) 12.355
Total cash flow before changes in net working capital 93.814 98.201
Working capital
Change in trade receivables (126.180) (149.811)
Change in inventories (1.974) 27.503
Change in other current assets (18.794) (22.137)
Change in trade payables (91.095) (10.621)
Change in tax liabilities 152.200 83.097
Change in other current liabilities 38.161 15.959
Change in financial instruments - derivatives (2.703) (19.945)
Change in working capital (50.385) (75.955)
Change in financial instruments – non-current derivatives (2.169) 5.835
Liquidity generated by operations 41.260 28.081 a)
Investment activities
Disinvestment/(investment) in tangible fixed assets, net of net investments/disinvestments (63.365) (84.904)
Disinvestment/(investment) in intangible fixed assets, net of net investments/disinvestments (1.069) 275
Goodwill 1.452 24
Investments in equity investments, net of disinvestments (3.146) (17)
(Increase)/decrease in other investment activities (6.533) (759)
Liquidity generated/(absorbed) by investment activities (72.661) (85.381) b)
Financing activities
Medium/long-term loans (250) (8.098)
Change in shareholders’ equity items 3.232 (6.337)
Change in short-term bank indebtedness 1.434 72.039
Dividends paid out (1.090) (1.918)
Change in financial leasing payables (1.651) (1.194)
Liquidity generated/(absorbed) by financing activities 1.675 54.492 c)
(29.726) (2.808)
(a+b+c) (a+b+c)
Change in net financial position
Cash and cash equivalents at the beginning of the year 350.332 193.635
Contribution of cash from business combinations 187 0
Cash and cash equivalents at the end of the year 320.793 190.827
(29.726) (2.808)
Accounting statements and explanatory notes
Hera Group – Consolidated Quarterly Report as at 31 March 2010 BoD of 13 May 2010 26
26
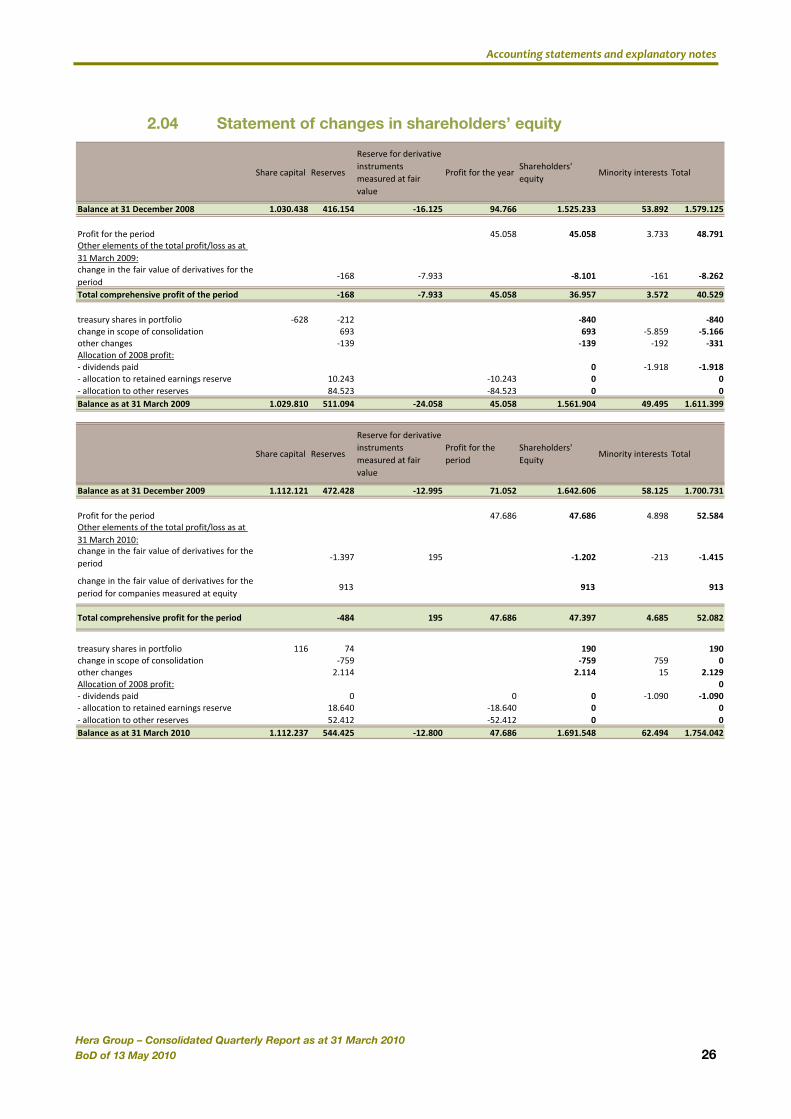
2.04 Statement of changes in shareholders’ equity
Share capital Reserves
Reserve for derivative instruments measured at fair value
Profit for the yearShareholders' equity
Minority interests Total
Balance at 31 December 2008 1.030.438 416.154 ‐16.125 94.766 1.525.233 53.892 1.579.125
Profit for the period 45.058 45.058 3.733 48.791Other elements of the total profit/loss as at 31 March 2009:change in the fair value of derivatives for theperiod
‐168 ‐7.933 ‐8.101 ‐161 ‐8.262
Total comprehensive profit of the period ‐168 ‐7.933 45.058 36.957 3.572 40.529
treasury shares in portfolio ‐628 ‐212 ‐840 ‐840change in scope of consolidation 693 693 ‐5.859 ‐5.166other changes ‐139 ‐139 ‐192 ‐331Allocation of 2008 profit:‐ dividends paid 0 ‐1.918 ‐1.918‐ allocation to retained earnings reserve 10.243 ‐10.243 0 0‐ allocation to other reserves 84.523 ‐84.523 0 0Balance as at 31 March 2009 1.029.810 511.094 ‐24.058 45.058 1.561.904 49.495 1.611.399
Share capital Reserves
Reserve for derivative instruments measured at fair value
Profit for the period
Shareholders' Equity
Minority interests Total
Balance as at 31 December 2009 1.112.121 472.428 ‐12.995 71.052 1.642.606 58.125 1.700.731
Profit for the period 47.686 47.686 4.898 52.584Other elements of the total profit/loss as at 31 March 2010:change in the fair value of derivatives for theperiod
‐1.397 195 ‐1.202 ‐213 ‐1.415
change in the fair value of derivatives for theperiod for companies measured at equity
913 913 913
Total comprehensive profit for the period ‐484 195 47.686 47.397 4.685 52.082
treasury shares in portfolio 116 74 190 190change in scope of consolidation ‐759 ‐759 759 0other changes 2.114 2.114 15 2.129Allocation of 2008 profit: 0‐ dividends paid 0 0 0 ‐1.090 ‐1.090‐ allocation to retained earnings reserve 18.640 ‐18.640 0 0‐ allocation to other reserves 52.412 ‐52.412 0 0Balance as at 31 March 2010 1.112.237 544.425 ‐12.800 47.686 1.691.548 62.494 1.754.042
Accounting statements and explanatory notes
Hera Group – Consolidated Quarterly Report as at 31 March 2010 BoD of 13 May 2010 27
27
2.05 Explanatory Notes
Accounting principles and valuation criteria The consolidated quarterly report as at 31 March 2010 (interim report on operations) was drawn up in observance of Art. 154 ter of Legislative Decree 58/1998 and Art. 82 of the Issuers’ Regulation issued by CONSOB. This report is not subject to audit. This interim report on operations has not been drawn up in compliance with the accounting standards regarding infra-annual reporting (IAS 34 “Interim Financial Reporting”). That being stated, the accounting principles applied to this report on operations are the same as those adopting in drawing up the consolidated financial statements as at 31.12.2009. Please refer to them for full details. The preparation of this interim report on operations requires estimates and assumptions to be made and that have an impact on the value of balance-sheet revenues, costs, assets and liabilities and on disclosures concerning contingent assets and liabilities at the reporting date. If, in the future, these estimates and assumptions, based on the management’s best valuation, should differ from the actual circumstances, they will be amended accordingly to represent the actual situation. Please also note that these valuation procedures, especially those relating to the more complex valuations, such as the determination of any impairment losses on non-current assets, are generally only made definitively at the time the annual report is prepared, except when there are indications of impairment requiring an immediate valuation of any losses in value. Data in this interim report on operations are comparable with those of previous periods, except for unusual or non-recurring transaction, which will be described in detail. In comparing single items in the income statement, it is necessary to take into consideration the changes in the scope of consolidation indicated in the specific paragraph.
Accounting statements and explanatory notes
Hera Group – Consolidated Quarterly Report as at 31 March 2010 BoD of 13 May 2010 28
28
Consolidated Financial Statements
The formats used are the same as those applied for the consolidated financial statements as at 31 December. A decremental format has been used for the income statement, with individual items analysed by type. We believe that this type of disclosure, which is also used by our major competitors, to be in line with international practice and the best representation of company results. Please note that the item “other non-operating costs” has been added to provide more accurate information. It regards taxes of previous years, as is fully explained in the report on operations. It is also noted that, over the first quarter of 2010, atypical and unusual transactions were not accounted for, according to Consob communication no. 6064293 of 28 July 2006. This interim report on operations as at 31 March 2010 is subject to the approval of the Board of Directors on 13 May 2010. All the consolidated income statement schedules are expressed in thousands of Euro, unless otherwise indicated.
Accounting statements and explanatory notes
Hera Group – Consolidated Quarterly Report as at 31 March 2010 BoD of 13 May 2010 29
29
Scope of consolidation
This interim report on operations includes the financial statements of the Parent Company, Hera SpA, and its subsidiaries. Control is obtained when the Parent Company has the power to determine the financial and operational policies of a company, in such a way as to obtain benefits from the company’s activities. Small-scale subsidiaries and those in which the exercise of voting rights is subject to substantial and long-term restrictions are excluded from line-by-line consolidation and valued at cost. Equity investments comprising fixed assets in large-scale associated companies are valued under the equity method. Companies held exclusively for future sale were excluded from consolidation and valued at cost or fair value, whichever is the lesser. These equity investments are recorded as separate items. No companies have been included in the consolidation using the proportional method. Changes to the scope of consolidation in the first three months of 2010 compared with the consolidated financial statements as at 31 December 2009 are shown below. Subsidiaries: On 19 October 2009, Consorzio Akhea Consortile and the subsidiaries Herambiente Srl and Akron Spa, 51% and 49%, respectively, formed the Consorzio Akhea, having the decontamination of sites as corporate object. Consorzio Akhea became operational in January 2010. With effect as from 1 January 2010, the company Aspes Gas Srl (100% owned by Marche Multiservizi SpA) was merged by incorporation in the company Hera Comm Marche Srl (100% owned by Hera Comm Srl), which increased its share capital from Euro 700,000 to Euro 1,458,332. By effect of this transaction, the company Marche Multiservizi SpA becomes majority shareholder in Hera Comm Marche Srl, holding 52% of the share capital. Subsequently, on 2 February 2010, Marche Multiservizi SpA sold 12% of their share to Hera Comm Srl, which therefore returns to be the majority shareholder with 60 of share capital held. This transaction caused a reduction of equity investments in shareholders’ equity of Hera Comm Marche Srl from previous 100% to current 76.26%.

Accounting statements and explanatory notes
Hera Group – Consolidated Quarterly Report as at 31 March 2010 BoD of 13 May 2010 30
30
2.06 Consolidated net financial indebtedness
millions of Euro 31‐Mar‐10 31‐Dec‐09
a Cash 320,8 350,3
b Other current financial receivables 26,8 20,7
Current bank liabilities ‐30,7 ‐22,5
Current portion of bank indebtedness ‐68,6 ‐75,1
Other current financial liabilities ‐14,4 ‐14,3
Financial leasing payables – maturing within the next year ‐6,7 ‐7,1
c Current financial indebtedness ‐120,4 ‐119,1
d=a+b+c Net current financial indebtedness 227,2 251,9
e Non‐current financial receivables 10,4 10,1
Non‐current bank liabilities ‐385,7 ‐394,0
Bonds issued ‐1.643,4 ‐1.631,5
Other non‐current financial liabilities ‐120,0 ‐118,9
Financial leasing payables – maturing beyond the next year ‐8,1 ‐9,4
f Non‐current financial indebtedness ‐2.157,2 ‐2.153,8
g=e+f Net non‐current financial indebtedness ‐2.146,8 ‐2.143,7
h=d+g Net financial indebtedness ‐1.919,7 ‐1.891,8
Accounting statements and explanatory notes
Hera Group – Consolidated Quarterly Report as at 31 March 2010 BoD of 13 May 2010 31
31
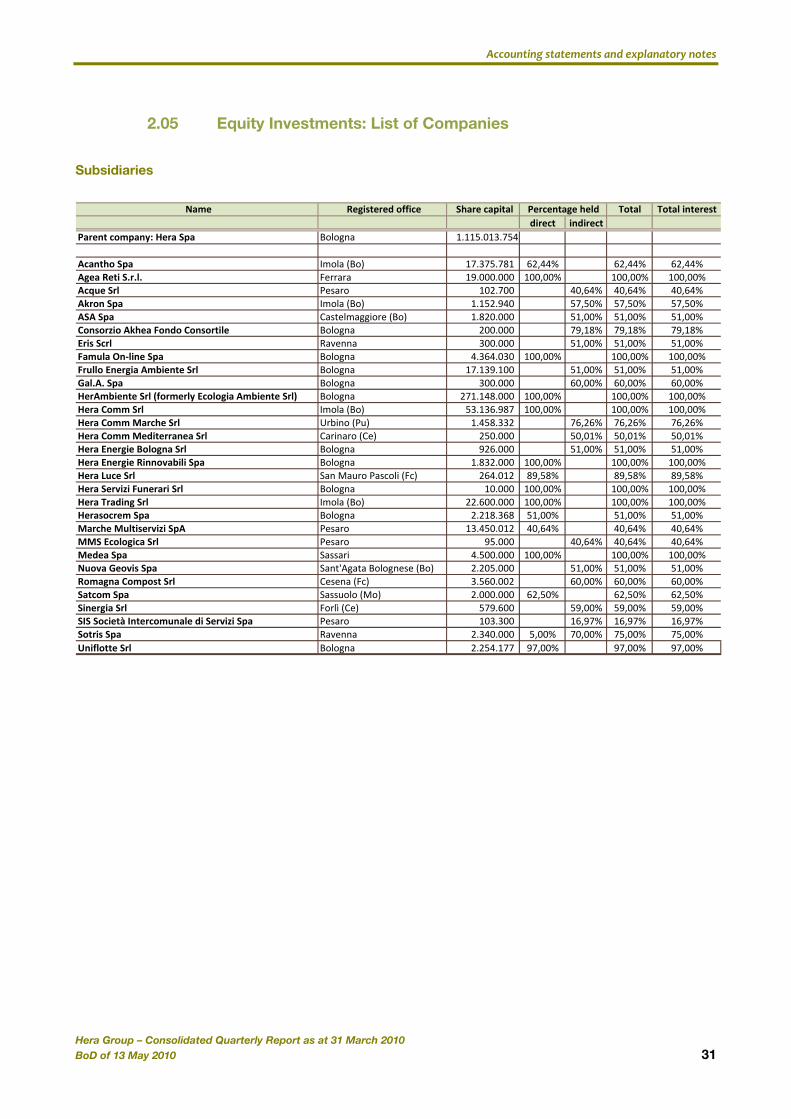
2.05 Equity Investments: List of Companies
Subsidiaries
Name Registered office Share capital Total Total interestdirect indirect
Parent company: Hera Spa Bologna 1.115.013.754
Acantho Spa Imola (Bo) 17.375.781 62,44% 62,44% 62,44%Agea Reti S.r.l. Ferrara 19.000.000 100,00% 100,00% 100,00%Acque Srl Pesaro 102.700 40,64% 40,64% 40,64%Akron Spa Imola (Bo) 1.152.940 57,50% 57,50% 57,50%ASA Spa Castelmaggiore (Bo) 1.820.000 51,00% 51,00% 51,00%Consorzio Akhea Fondo Consortile Bologna 200.000 79,18% 79,18% 79,18%Eris Scrl Ravenna 300.000 51,00% 51,00% 51,00%Famula On‐line Spa Bologna 4.364.030 100,00% 100,00% 100,00%Frullo Energia Ambiente Srl Bologna 17.139.100 51,00% 51,00% 51,00%Gal.A. Spa Bologna 300.000 60,00% 60,00% 60,00%HerAmbiente Srl (formerly Ecologia Ambiente Srl) Bologna 271.148.000 100,00% 100,00% 100,00%Hera Comm Srl Imola (Bo) 53.136.987 100,00% 100,00% 100,00%Hera Comm Marche Srl Urbino (Pu) 1.458.332 76,26% 76,26% 76,26%Hera Comm Mediterranea Srl Carinaro (Ce) 250.000 50,01% 50,01% 50,01%Hera Energie Bologna Srl Bologna 926.000 51,00% 51,00% 51,00%Hera Energie Rinnovabili Spa Bologna 1.832.000 100,00% 100,00% 100,00%Hera Luce Srl San Mauro Pascoli (Fc) 264.012 89,58% 89,58% 89,58%Hera Servizi Funerari Srl Bologna 10.000 100,00% 100,00% 100,00%Hera Trading Srl Imola (Bo) 22.600.000 100,00% 100,00% 100,00%Herasocrem Spa Bologna 2.218.368 51,00% 51,00% 51,00%Marche Multiservizi SpA Pesaro 13.450.012 40,64% 40,64% 40,64%MMS Ecologica Srl Pesaro 95.000 40,64% 40,64% 40,64%Medea Spa Sassari 4.500.000 100,00% 100,00% 100,00%Nuova Geovis Spa Sant'Agata Bolognese (Bo) 2.205.000 51,00% 51,00% 51,00%Romagna Compost Srl Cesena (Fc) 3.560.002 60,00% 60,00% 60,00%Satcom Spa Sassuolo (Mo) 2.000.000 62,50% 62,50% 62,50%Sinergia Srl Forlì (Ce) 579.600 59,00% 59,00% 59,00%SIS Società Intercomunale di Servizi Spa Pesaro 103.300 16,97% 16,97% 16,97%Sotris Spa Ravenna 2.340.000 5,00% 70,00% 75,00% 75,00%Uniflotte Srl Bologna 2.254.177 97,00% 97,00% 97,00%
Percentage held

Accounting statements and explanatory notes
Hera Group – Consolidated Quarterly Report as at 31 March 2010 BoD of 13 May 2010 32
32
Associates companies
Name Registered office Share capital Total Total interestdirect indirect
Adriatica Acque Srl Rimini 89.033 25,44% 25,44% 25,44%Aimag Spa Mirandola (Mo) 78.027.681 25,00% 25,00% 25,00%Dyna Green Srl Milan 30.000 33,33% 33,33% 33,33%Estense Global Service Scrl Ferrara 10.000 23,00% 23,00% 23,00%Feronia Srl Finale Emilia (Mo) 2.430.000 40,00% 40,00% 40,00%FlamEnergy Trading Gmbh Vienna 3.000.000 50,00% 50,00% 50,00%Modena Network Spa Modena 3.000.000 14,00% 18,73% 32,73% 32,73%Oikothen Scarl Siracusa 1.101.730 46,10% 46,10% 46,10%Refri Srl Reggio Emilia 6.800.000 20,00% 20,00% 20,00%Service Imola Srl Borgo Tossignano (Bo) 10.000 40,00% 40,00% 40,00%Set Spa Milan 120.000 39,00% 39,00% 39,00%So.Sel Spa Modena 240.240 26,00% 26,00% 26,00%Sgr Servizi Spa Rimini 5.982.262 29,61% 29,61% 29,61%Tamarete Energia Srl Ortona (Ch) 3.600.000 32,00% 32,00% 32,00%
Percentage held
Accounting statements and explanatory notes
Hera Group – Consolidated Quarterly Report as at 31 March 2010 BoD of 13 May 2010 33
33
HERA S.p.A. Holding Energia Risorse Ambiente Sede legale: Viale Carlo Berti Pichat 2/4 40127 Bologna tel. 051.287.111 fax 051.287.525 www.gruppohera.it C.F./Partita IVA Registro Imprese BO 04245520376 Capitale Sociale int. vers. € 1.115.013.754
Related Documents