Gruppo Hera – Relazione Trimestrale Consolidata al 31 marzo 2014 Progetto in approvazione nel Cda di Hera Spa del 14 maggio 2014 1 QUARTERLY REPORT as at 31 march 2014

Quarterly report as at 31 march 2014
Jan 19, 2015
The Hera Board of Directors approves the 2014 Q1 results
Welcome message from author
This document is posted to help you gain knowledge. Please leave a comment to let me know what you think about it! Share it to your friends and learn new things together.
Transcript
Gruppo Hera – Relazione Trimestrale Consolidata al 31 marzo 2014
Progetto in approvazione nel Cda di Hera Spa del 14 maggio 2014 1
QUARTERLY
REPORT
as at 31 march 2014
Hera Group –Consolidated quarterly report at 31 March 2014
Mission 001
Financial highlights 002
Hera’s sector consolidation 003
Strategic approach and business plan 004
Business sectors 005
Share performance 007
1 - Report on operations Introduction 009
1.01 Group performance for the quarter ended 31 March 2014 010
1.01.01 Operating performance 010
1.02 Analysis by segment 014
1.02.01 Gas segment 016
1.02.02 Electric energy segment 018
1.02.03 Integrated water cycle 019
1.02.04 Environment 020
1.02.05 Other services 022
1.03 Investments 023
1.04 Analysis of net cash/(net borrowings) 030
1.05 Human resources 031
2 Financial statements and explanatory notes 2.01 Consolidated financial statements 032
2.01.01 Income statement 032
2.01.02 Statement of comprehensive income 033
2.01.03 Earnings per share 034
2.01.04 Statement of financial position 035
2.01.05 Cash flow statement 037
2.01.06 Statement of changes in equity 038
2.02 Explanatory notes 039
2.03 Consolidated net borrowings 048
2.04 Equity investments 049
Hera Group –Consolidated quarterly report at 31 March 2014
Approved by Hera Spa’s Board of Directors in the meeting of 14 May 2014 1
Mission
"Hera’s goal is to be the best multi-utility in Italy for its customers, workforce and shareholders. It aims to achieve
this through further development of an original corporate model capable of innovation and of forging strong links
with the areas in which it operates by respecting the local environment”.
“For Hera to be the best means to represent a reason for pride and trust for: customers, who receive, thanks to
Hera’s constant responsiveness to their needs, quality services that satisfy their expectations. The women and men who
work at Hera, whose skills, engagement and passion are the foundation of the company’s success; shareholders,
confident that the economic value of the company will continue to be generated in full respect of the principles of social
responsibility; the reference areas, because economic, social and environmental health represent the promise of a
sustainable future; and suppliers, key elements in the value chain and partners for growth".

Hera Group –Consolidated quarterly report at 31 March 2014
Approved by Hera Spa’s Board of Directors in the meeting of 14 May 2014 2
Key financial data
* 2013 data adjusted in compliance with IFRS11 regulation
^ Figure adjusted with extraordinary income, due to the merger with Acegas Aps
0.46 0.64 0.73 0.75
1.00
1.29 1.05 1.13
1.37 1.44 1.29
1Q'04 1Q'05 1Q'06 1Q'07 1Q'08 1Q'09 1Q'10 1Q'11 1Q'121Q'13*1Q'14
Revenues (mld€)
CAGR +10.9%
99
129 137 135154 167
185
224 225271 276
1Q'04 1Q'05 1Q'06 1Q'07 1Q'08 1Q'09 1Q'10 1Q'11 1Q'121Q'13*1Q'14
EBITDA (m€)
CAGR +10.8%
46 49 5375 70
87^ 89
1Q'08 1Q'09 1Q'10 1Q'11 1Q'12 1Q'13 1Q'14
Group Net Profit (m€)
CAGR +11.8%
0.36 0.69
0.93 1.32
1.49 1.64 1.92 1.85 2.01
2.57 2.54
1Q'04 1Q'05 1Q'06 1Q'07 1Q'08 1Q'09 1Q'10 1Q'11 1Q'121Q'13*1Q'14
NFP (mld€)
CAGR +21.7%
5.3 5.7 7.0
8.0 8.0 8.0 8.0 9.0 9.0 9.0 9.0
'03 '04 '05 '06 '07 '08 '09 '10 '11 '12 '13
DPS (cent €)
CAGR +5,4%
34 30
59
7790 86
77
60 59 54 54
1Q'04 1Q'05 1Q'06 1Q'07 1Q'08 1Q'09 1Q'10 1Q'11 1Q'121Q'13*1Q'14
Investments (m€)
CAGR +4,7%
Hera Group –Consolidated quarterly report at 31 March 2014
Approved by Hera Spa’s Board of Directors in the meeting of 14 May 2014 3
Hera’s sector consolidation
Hera’s strategy of progressive geographic expansion, through the consolidation of multi-utilities operating in areas
adjoining its main market, led the Group to cover 70% of customers in Emilia-Romagna and to penetrate Le Marche
region.
In 2012 Hera continued along its growth path with the acquisition of Acegas Aps, a multi-utility operating in the provinces of
Padua and Trieste, in Italy’s North-East, thus increasing its own sector consolidation opportunities. In fact, with the Acegas
Aps business combination, the target geographic market has been enlarged to the contiguous regions of Veneto and
Friuli, which feature a high degree of fragmentation, with a large number of small local operators. Between the end of 2013
and the beginning of the current year, Hera’s consolidation process resulted in two further acquisitions, allowing the Group
to establish a firmer footprint in the provinces of Gorizia and Udine, in the Friuli region.
In Gorizia, steps taken to rationalize some joint ventures between Acegas Aps and ENI, the former sold to the latter its
share in the energy sales business, with the transfer of its 30% equity interest in Est Più, in exchange for ENI’s 70% equity
interest in the gas and electricity distribution business (resulting in Hera’s full control of Isontina Reti Gas and Est Reti
Elettriche). The transaction involved the payment of a cash balance of €8 million.
In the first quarter of 2014, in Udine - following the agreement with, Amga Udine – Hera approved the plan of merger with
this local multi-utility; eventually the transaction was approved by the respective shareholders in the general meetings held
in April. The merger will be effective 1 July 2014.
The merger will trigger the transfer of Amga’s gas distribution assets to AcegasAps (which, following this transaction, will
change its name to AcegasApsAgma) and the energy sales and heat management assets to Hera Comm. The companies
managing commercial operations will continue to maintain their separate legal personalities, names and registered offices
in Udine.
The Hera Group and the Amga Group share many common features: the industrial sector in which they operate,
geographic proximity, shareholder structure and growth path. The business combination between the two will make it
possible to harness the respective industrial structures in the gas, electric energy, public lighting, plant management and
co-generation in terms of both economies of scale and control in the supply chain. This thanks also to the transfer to Amga
of the technological platforms and know how developed by the Hera Group.
The Group resulting from the combination with Amga, with its 150,000 delivery points, will have a total of 1.7 million
delivery points in gas distribution, of which nearly 500,000 in the Friuli Venezia Giulia and Veneto regions. The Hera
Group’s customer base for gas and electricity will exceed 2 million, while total public lighting points managed will amount to
about 380,000, of which nearly 85,000 in Friuli Venezia Giulia and Veneto.
The geographical proximity created, as well as the fit in the sales area, will make it possible to achieve synergies for about
€4 million; in addition, the Bulgarian operations will be optimized.
The plan of merger calls for, among others, Hera to increase its share capital by issuing 68,196,128 new shares,
accounting for 4.6% Hera’s post-merger share capital, based on the applicable share exchange ratio. Consolidation in the
new areas continues to be a priority for the Group, which proceeds along the growth strategy that it has been pursuing
since it was established, in view of attractive prospects.

Hera Group –Consolidated quarterly report at 31 March 2014
Approved by Hera Spa’s Board of Directors in the meeting of 14 May 2014 4
Strategic approach and business plan
Hera’s strategic objective is the creation of value for all its stakeholders over the medium and long term, by competing in
liberalized markets and acting in regulated markets. The Group’s purpose is to manage basic public utility services in an
increasingly efficient manner, as shown by the consistent rise of its results since it was established. This was made
possible by the “open” organizational model adopted, which allowed it to grow in size, thanks to its ability to improve
efficiency by extracting synergies from business combinations.
The Group’s strategic imperative is to preserve its customer base by paying great attention to service quality and an
integrated offering of a complete set of basic utility services from its multi-business portfolio. Furthermore, growth
strategies have been aimed at maintaining a balance among the various activities, in
order to achieve a low degree of volatility of the Group's results.
In its first 11 years, the Group’ activities have been constantly driven by five priorities:
growth via business combinations with multi-utility companies operating in geographical areas adjoining those
where the company has operations;
the extraction of synergies from business combinations;
the creation of a solid industrial platform in terms of plants and distribution networks;
the development of the customer base in the liberalized sectors, where more complementary and complete
services can be offered;
constant attention to financial and operating performance and the operational risk.
To ensure higher operational efficiency and a greater exploitation of economies of scale, after the merger/business
combination, each company has been integrated into the original model based on an industrial holding company.
The strategy of focusing on core activities led to a rationalization of the portfolio, a consequent disposal
of minor businesses and a corporate overhaul, in line with the Group’s industrial management rationale and with the intent
to maintain a low risk exposure.
In the liberalized sectors – gas and energy sales, waste treatment and disposal – growth was pursued both via
acquisitions and organically, thanks to the combined offering of energy products (dual fuel) with customers existing within
the Group.
In the waste disposal business, in which Hera is the market leader in Italy, the objective is to extract utmost value from the
significant plant system created. The sector continues to lag behind nationwide, in terms of infrastructures, and Hera
represents a standard of excellence.
These underlying strategies, as adapted to the new scenario, are the backbone of the 2013-2017 business plan.
Expectations for future growth rest primarily on the continuation of efficiency improvement processes, the completion of the
Acegas Aps merger, predictable further expansion by way of external growth lines that have already been identified and
set under way, and, lastly, continuity of the Group’s expansion strategies in liberalized markets. With the performance for
2013 as a whole, the five-year EBITDA growth target was 58% achieved while cash flows reached, twelve months earlier,
levels expected for next year.

Hera Group –Consolidated quarterly report at 31 March 2014
Approved by Hera Spa’s Board of Directors in the meeting of 14 May 2014 5
Business sectors
Hera is the leading domestic operator in the environment sector by quantity of waste collected and treated.
Waste collection, regulated by concession arrangements, has expanded over the years through subsequent
company mergers, eventually covering all of the areas from Modena to Pesaro-Urbino, to Padua, to Trieste. Hera’s
urban waste collection system is based on recycling most (approximately 52%) waste material (glass, paper, plastic,
metals, and biomasses) and the conversion of the remainder into energy, through waste-to-energy plants and biogas
extraction processes.
This efficient system has notably contributed to decreasing the amount of waste disposed of in landfills, thus reducing soil
and environmental pollution, both directly and indirectly.
Waste treatment and disposal activities have also benefited from the significant expansion and upgrading of the plant
system. Today, this plant system is able to meet the demand for treatment and recovery of any kind of waste, and
represents one of the Group’s areas of excellence on a national scale. With a generation of over 1.0 TWh, the Group has
become one of the leading operators engaged in the recovery of electricity from waste.
Hera has been operating since establishment in the management of the Integrated Water Cycle, from network distribution
of drinkable water to collection and purification of waste water, performing these services on an exclusive basis in seven
provinces of Emilia Romagna, the north of Marche and the Triveneto region, on the basis of long-term concession
arrangements (average, 2023).
Following the mergers completed over time, the organic growth of the activities and the investments made, the Group has
become the second largest national operator and the best manager in terms of network efficiency. The water network, as
well as all of the Group’s networks, is currently operated from a single remote control location, ensuring greater efficiency
and lower operating costs.
All the environmental control system – from the analysis before distribution to the collection and purification of waste water
– showed significant progress, ensuring substantial service quality and maximum safety for customers.
The Regulator – AEEGSI – set a tariff system for the 2014-2015 period that put an end to regulatory uncertainty and
provides more guarantees to continue to upgrade plants and develop operating activities.
The Group has an almost complete coverage of the area in which it operates in the gas sector as well. This includes
services in distribution and in methane gas sales and trading, as well as district heating management. Today, Hera is one
of the main “local” utilities and the fourth at the national level in terms of volumes sold. Despite the liberalization of the
sales market, the Group has more than doubled its original customer base in ten years, and now Hera ranks third in the
Italian market.
The distribution network, developed through direct investments and the acquisition of companies, provides extensive
coverage in the market of reference, with over 1.1 million delivery points.
The unstable situation of energy markets has led the Group to follow prudent and flexible procurement policies, diversifying
internal sources and pursuing maximum flexibility through annual agreements. These supply portfolio arrangements have
sheltered Hera from the risk derived from “pre-determinate” material purchase commitments many years in advance, and
allowed it, in recent years, to benefit from the increasing availability of methane gas in the country.
The volume of sales relating to district heating has also nearly doubled over the last 10 years. This way
of supplying heat is more efficient and has lower impact on the environment than independent home heating systems. The
district heating network has been developed in various urban areas across the territory, some of which are near the large
waste-to-energy and co-generation plants built in the last 10 years, thereby exploiting heat sources that would otherwise
not be used.
Hera Group –Consolidated quarterly report at 31 March 2014
Approved by Hera Spa’s Board of Directors in the meeting of 14 May 2014 6
Hera’s “dual fuel" commercial strategy has allowed the electricity market to be developed at a sustained rate
of growth, both through activities of cross-selling to existing customers and through expansion into new
markets. This strategy has made it possible to defend existing customers in the gas sector, as shown above, achieving
important domestic market shares with annual sales of roughly 10 TW.
Commercial development in the electricity sector has been accompanied by a parallel cautious entry
into electricity generation. Hera continues to be an operator with a relatively limited footprint in generation activities; the
greater part of end customer electricity demand is in fact mainly covered by a widely diversified portfolio of bilateral supply
contracts and through purchases on the power exchange.
Electricity distribution has seen major development since Hera’s establishment; the merger with the
Modena multi-utility Meta Spa in 2005 and the acquisition of Enel’s electrical network in the province of Modena
contributed to expanding its grid, which is completely equipped with electronic meters and managed remotely by a control
centre on the cutting edge of technology.
The contribution resulting from the Acegas Aps combination and the acquisition of Est Reti Elettriche are important, in
particular for the development potential and the synergies that can be achieved by an integrated entity of the size of the
new Group.

Approved by H
Share perfor
In the first qu
€2.14), outpe
Despite the o
rose by 14.5
peripheral m
substantially,
fueled by the
international
At 31 Decem
approximatel
The shareho
agreement si
Hera Spa’s Boa
rmance and i
uarter of 2014
erforming both
ongoing fiscal
5% during the
markets, which
, as all its com
e good result
investors. He
mber 2013, H
ly 57.6% of the
older base fe
igned by all M
ard of Directors
investor relat
, the share sh
h the overall m
and political p
e quarter) wa
h boosted all
mponent share
ts for 2013, w
ra’s share hov
era had amo
e 1,421.3 milli
atures 25,000
Municipalities th
s in the meeting
tions
howed the per
market and the
problems and
as driven by
equities. The
es rose. Again
which were p
vered around €
ng its shareh
ion ordinary sh
0 investors, n
hat own, all to
Hera G
g of 14 May 20
rformance dep
e Italian local u
their impact o
the inflow of
e local utilities
nst this positiv
published at t
€2.15 also in t
olders 183 M
hares outstan
none of whom
ogether, 51% o
Group –Consol
014
picted in the c
utilities index.
on the overall e
f liquidity com
s index (which
ve backdrop, w
he end of Ma
the month follo
Municipalities i
ding.
m has contro
of all ordinary
lidated quarte
hart below, ris
economy, the
ming from fore
h was up 21%
which is still u
arch, and the
owing the clos
n the area w
ol over the co
shares outsta
erly report at
sing by 27.6%
Italian marke
eign investors
% for the qua
nchanged, He
e road show
sing of the qua
where it operat
ompany, and
anding.
31 March 201
7
% (from €1.65
t’s index (whic
s into Europe
arter) benefite
era’s share wa
conducted wi
arter.
tes, which ho
a sharehold
14
to
ch
e’s
ed
as
ith
old
er

Approved by H
In the Gener
months, for a
million treasu
In the past 1
macroeconom
was approve
plan to 2017.
In the first q
Akros, Equita
utilities index
target price fo
Goldman Sac
to investors.
Hera places
share in Italy
2014, Hera o
Hera Spa’s Boa
al Meeting he
a maximum a
ury shares.
1 years, share
mic crisis of th
ed at the Gene
.
uarter of 2014
a, ICBPI, Inte
x, with only b
or the next 12
chs started co
high importan
y and abroad (
organized mee
ard of Directors
eld on 23 April
mount of €80
eholder return
he past few ye
eral Meeting o
4, analyst cov
ermonte e Kep
buy/outperform
2-18 months se
overage by ins
nce on direct
Italy, United K
etings with Eur
s in the meeting
2014, the Sh
million and fo
ns have been
ears. The Boa
of Shareholde
verage expan
pler-Cheuvreu
m recommend
et by analysts
serting it in its
interaction wit
Kingdom, Fran
ropean and U
Hera G
g of 14 May 20
hareholders ex
or a total of 4
either consta
ard of Director
ers, with the G
nded, as Gold
ux. Hera is on
dations, withou
is about €2.2
s “Conviction b
th investors, t
nce, Switzerlan
.S. investors,
Group –Consol
014
xtended the sh
40 million shar
nt or growing,
r’s proposal fo
Group fulfilling
man Sachs, B
ne of the mos
ut any hold/n
5 per share.
buy list”, whic
through the or
nd, United Sta
with a numbe
lidated quarte
hare buyback
res. At 31 Ma
, including in t
or a €0.09 divid
the commitme
Banca IMI an
st widely cove
eutral or neg
h includes the
rganization of
ates). Between
r of contacts i
erly report at
program for a
arch 2014, He
the most diffic
dend (in line w
ents made wi
nd Mediobanc
ered compani
ative opinions
e shares most
road shows t
n the first and
in line with pre
31 March 201
8
an additional 1
ra held about
cult times of th
with past year
th the busines
a joined Banc
es in the loca
s. The averag
t recommende
to introduce th
second quart
evious years.
14
18
8
he
rs)
ss
ca
al-
ge
ed
he
ter

cHAPTER 1
Directors’ report
Hera Group –Consolidated quarterly report at 31 March 2014
Approved by Hera Spa’s Board of Directors in the meeting of 14 May 2014 9
Introduction
The quarterly financial statements show improved EBITDA, solely thanks to organic growth, and a further reduction in
borrowings, thus attesting to the improved strength that marks the Group within its sector.
In the first quarter of 2014, gas sales were hit hard by the drop in demand compared to the same period of the previous
year, due to one of the mildest winter ever recorded in the past thirty years (down 28% in terms of Degree Days). Domestic
demand contracted by 18.1% (down 21.6% demand from the office and residential markets).
Electricity sales continued to show a growing number of customers (up 18,000 customers), reflecting the Group’s
commercial strength in an increasingly competitive retail market. This growth offset the drop in domestic consumption
(around -4.5%) mainly due to the continuing negative conditions of the thermo-electric sector and the rather mild winter.
The enlargement of the customer base concerned also a number of “last resort service” customers, a segment where the
Group was awarded a number of contracts in new geographical areas, which contributed to the growth of the results for
the quarter.
The waste collection business showed a slight increase in volumes, reflecting largely stable household consumption levels.
Quantities coming from the free market for special waste continue to rise, as the first quarter witnessed a significant
increase as a result of the commercial policies pursued by the Group with the intent to gain market share, thanks to the
large system of facilities available, that make it a sector leader. During the quarter activities improved the efficiency of the
waste management system: sorted waste collection concerned over 52% of urban collection, while treatments in all types
of plants managed rose; electricity produced out of waste exceeded again 0.2 TWh.
Energy distribution, urban waste collection and integrated water service activities conducted under concession
arrangements, which account for 57% of the Group’s EBITDA, contributed to the growth of the results for the first quarter
of 2014, thanks to the efficiency achieved, the investments made and the tariff adjustments approved by the Authority.
EBITDA for the first quarter of 2014 was slightly up, confirming the uninterrupted growth of the Group since it was
established. This takes on added significance considering the negative effect on EBITDA determined by the adjustments to
the results of joint ventures (IFRS 11), which was applied as of 1 January 2014. The size achieved by the Group, together
with the balanced mix of the activities carried out, showed a low risk of volatility for results during the quarter in light of the
negative scenario effects.
During the quarter, the Group generated positive cash flows, which resulted in the lowering of net borrowings from the
comparable amount at 31 December 2012.
In light of these results and the hoped-for improvement of the macroeconomic scanrio, of which early signs are beginning
to materialize, the Group continues along its growth path, in view of the targets set out in the business plan, which calls for
further growth and value creation for all the stakeholders.
Hera Group –Consolidated quarterly report at 31 March 2014
Approved by Hera Spa’s Board of Directors in the meeting of 14 May 2014 10
1.01 Group performance for the quarter ended 31 March 2014
Group consolidated highlights:
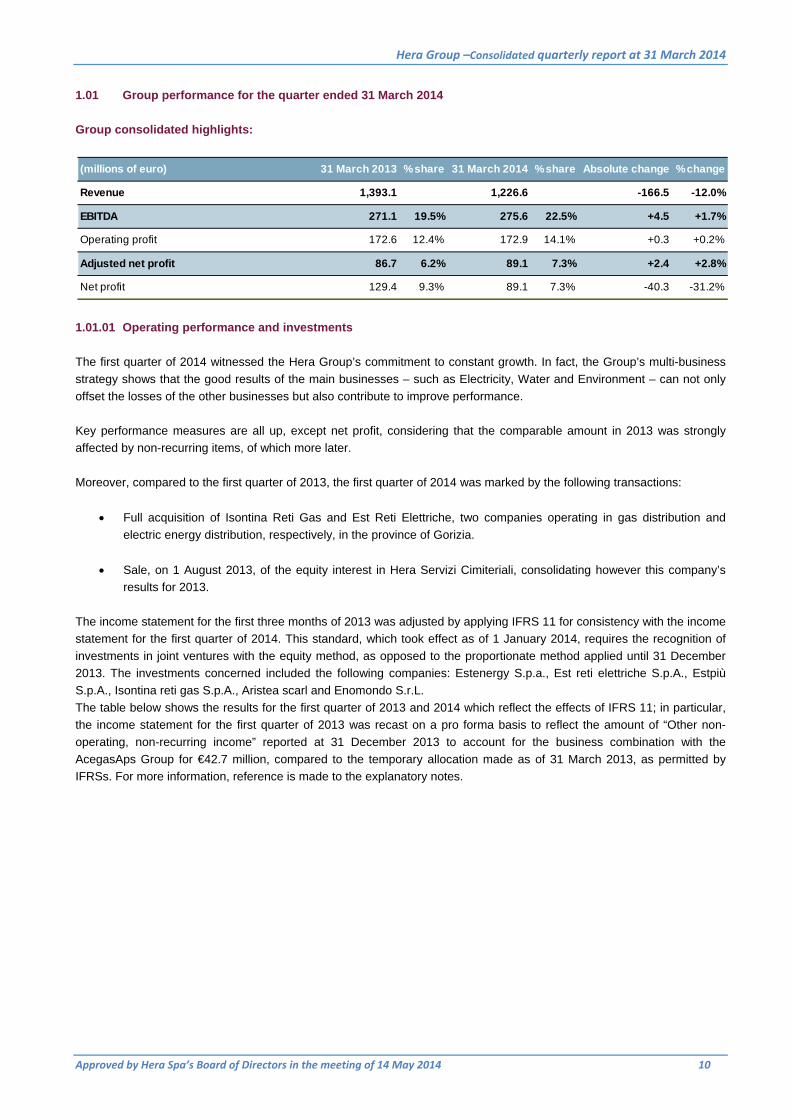
1.01.01 Operating performance and investments
The first quarter of 2014 witnessed the Hera Group’s commitment to constant growth. In fact, the Group’s multi-business
strategy shows that the good results of the main businesses – such as Electricity, Water and Environment – can not only
offset the losses of the other businesses but also contribute to improve performance.
Key performance measures are all up, except net profit, considering that the comparable amount in 2013 was strongly
affected by non-recurring items, of which more later.
Moreover, compared to the first quarter of 2013, the first quarter of 2014 was marked by the following transactions:
Full acquisition of Isontina Reti Gas and Est Reti Elettriche, two companies operating in gas distribution and
electric energy distribution, respectively, in the province of Gorizia.
Sale, on 1 August 2013, of the equity interest in Hera Servizi Cimiteriali, consolidating however this company’s
results for 2013.
The income statement for the first three months of 2013 was adjusted by applying IFRS 11 for consistency with the income
statement for the first quarter of 2014. This standard, which took effect as of 1 January 2014, requires the recognition of
investments in joint ventures with the equity method, as opposed to the proportionate method applied until 31 December
2013. The investments concerned included the following companies: Estenergy S.p.a., Est reti elettriche S.p.A., Estpiù
S.p.A., Isontina reti gas S.p.A., Aristea scarl and Enomondo S.r.L.
The table below shows the results for the first quarter of 2013 and 2014 which reflect the effects of IFRS 11; in particular,
the income statement for the first quarter of 2013 was recast on a pro forma basis to reflect the amount of “Other non-
operating, non-recurring income” reported at 31 December 2013 to account for the business combination with the
AcegasAps Group for €42.7 million, compared to the temporary allocation made as of 31 March 2013, as permitted by
IFRSs. For more information, reference is made to the explanatory notes.
(millions of euro) 31 March 2013 % share 31 March 2014 % share Absolute change % change
Revenue 1,393.1 1,226.6 -166.5 -12.0%
EBITDA 271.1 19.5% 275.6 22.5% +4.5 +1.7%
Operating profit 172.6 12.4% 172.9 14.1% +0.3 +0.2%
Adjusted net profit 86.7 6.2% 89.1 7.3% +2.4 +2.8%
Net profit 129.4 9.3% 89.1 7.3% -40.3 -31.2%

Hera Group –Consolidated quarterly report at 31 March 2014
Approved by Hera Spa’s Board of Directors in the meeting of 14 May 2014 11
As already shown in previous years, the consolidated income statement reflects the adoption of IFRIC 12 “Service
Concession Arrangements” which changed the accounting treatment of transactions for companies that operate in sectors
under concession arrangements. The effect of the application of this interpretation, which has no impact on the results, is
the recognition in the income statement of capital expenditures on assets under concession, to the extent that such assets
are part of network services. Thus, the period under review showed greater “Other operating income” for €32 million in
2014 and for €26.5 million in 2013, lower capitalized costs for €8.7 million in 2014 and €5.1 million in 2013, and greater
service, material and other operating costs for €23.2 million in 2014 and €21.4 million in 2013.
EBITDA grew from €271.1 million for the first quarter of 2013 to €275.6 million for the same period of 2014, reflecting an
increase of €4.5 million, or 1.7%. EBIT went from €172.6 million to €172.9 million while adjusted pre-tax profit was 2.4%
lower, as it fell from €144.0 to 140.5 million. Adjusted net profit rose from €86.7 million at 31 March 2013 to €89.1 million
for the period ended 31 Mach 2014, up 2.8%. Net profit for the period dropped by €40.4 million from the comparable
amount in 2013, due to the effects of non-recurring operating income a year ago.
Revenues declined by €166.5 million, from €1,393.1 million in the first quarter of 2013 to €1,226.6 million for the first
quarter of 2014. The main reasons include: (i) lower revenues from gas sales, from district heating services and heat
operations, due to the lower volumes sold as a result of a particularly mild weather in the first quarter of 2014; (ii) lower
revenues from electric energy sales, due to a decrease in the price of raw material; these negative effects are partly offset
by greater revenues from waste disposal and from regulated activities. For more details, reference is made to the analysis
of the individual segments.
Income statement(millions of euro)
March 2013 % share March 2014 % share Absolute change % change
Revenue 1.393,1 0,0% 1.226,6 0,0% -166,5 -12,0%
Other operating revenues 48,7 3,5% 65,9 5,4% +17,2 +35,3%
Raw materials and other materials (796,5) -57,2% (638,6) -52,1% -157,9 -19,8%
Service costs (243,0) -17,4% (243,2) -19,8% +0,2 +0,1%
Other operating costs (11,2) -0,8% (11,6) -0,9% +0,4 +3,6%
Personnel costs (123,0) -8,8% (127,1) -10,4% +4,1 +3,3%
Capitalised costs 3,1 0,2% 3,7 0,3% +0,6 +19,4%
EBITDA 271,1 19,5% 275,6 22,5% +4,5 +1,7%
Depreciation, Amortisation and Provision (98,5) -7,1% (102,7) -8,4% +4,2 +4,3%
Operating profit 172,6 12,4% 172,9 14,1% +0,3 +0,2%
Financial income/(expense), net (28,6) -2,1% (32,4) -2,6% +3,8 +13,3%
Adjusted pre-tax profit 144,0 10,3% 140,5 11,5% -3,5 -2,4%
Tax (57,3) -4,1% (51,3) -4,2% -6,0 -10,5%
Adjusted net profit 86,7 6,2% 89,1 7,3% +2,4 +2,8%
Other non-operating revenue 42,7 3,1% - 0,0% -42,7 -100,0%
Net profit for the period 129,4 9,3% 89,1 7,3% -40,3 -31,2%
Attributable to:Shareholders of the Parent Company 123,5 8,9% 83,2 6,8% -40,3 -32,6%Non-controlling interests 5,9 0,4% 5,9 0,5% +0,0 +0,2%

Hera Group –Consolidated quarterly report at 31 March 2014
Approved by Hera Spa’s Board of Directors in the meeting of 14 May 2014 12
Other operating income rose by €17.2 million due to the increase in grants related to energy efficiency certificates,
following resolution 13/2014/R/efr of the Authority for electricity, gas and the water system and for the rise in other
revenues related to the application of IFRIC 12.
The €157.9 million decrease in Cost of commodities and materials, compared to the first quarter of 2013, was proportional
to the decline in revenues resulting from lower gas volume sales (about €80 million) and lower cost of electric energy
determined by both lower volumes sold and a lower price (about €70 million).
Other operating costs (Service costs and Other operating expenses up by €0.2 million and €0.4 million respectively) grew
overall by €0.6 million (up 0.2%), and were virtually unchanged from the year earlier amount.
Personnel costs rose by 3.3%, from €123.0 million at 31 March 2013 to €127.1 million, at 31 March 2014. This increase
was due to rising pay scales under the national labour agreement (CCNL) (up 2.9%), partly offset by the average
headcount reduction.
Capitalized costs increased by €0.6 million, from €3.1 million in the first quarter of 2013 to €3.7 million in the first quarter of
2014, due to the increase in self-constructed assets.
Consolidated EBITDA for the quarter ended 31 March 2014 went from €271.1 million to €275.6 million, reflecting a €4.5
million increase (up 1.7%). For more details reference is made to the sections on the individual businesses.
Depreciation, amortization and provisions rose overall by €4.2 million (up 4.3%), from €98.5 million in the first quarter of
2013 to €102.7 million for the same period of 2014. The change was due mainly to: (i) greater depreciation due to new
capital expenditures and greater quantities of waste from the market placed in landfills (about €7 million); (ii) greater
depreciation and provisions due to the adjustment of the rates for some assets related to the gas concessions (about €2
million), offset by lower provisions for litigation with social security entities (about €2.5 million); (iii) lower provisions for
other risks (about €2 million).
Operating profit for the first quarter of 2014 amounted to €172.9 million, up 0.2% on the comparable amount in 2013, which
totalled €172.6 million, for the above reasons.
For the quarter under review, financial expense exceeded financial income by €32.4 million, compared to €28.6 million for
the same period of the previous year.
The increase was due nearly entirely to the lower profit generated by associated companies and joint ventures, for a total
of €4.2 million. Among the latter, in particular, Estenergy S.p.A., a sales company held by AcegasAps, was affected the
most by the unusual thermal season in early 2014.
In light of the above, pre-tax profit went from €144.0 million as of 31 March 2013 to €140.5 million for
the first quarter of 2014, down 2.4%.
Income taxes for the quarter, amounting to €51.3 million, reflect a tax rate of 36.5%, with a significant improvement on the
comparable figure for the previous year (39.8%).
The reasons for this improvement are due mainly to the decrease of 4.0 percentage points of the so-called “Robin Hood
Tax” applicable to the Group companies engaged in the energy sector, in line with current laws.
Hera Group –Consolidated quarterly report at 31 March 2014
Approved by Hera Spa’s Board of Directors in the meeting of 14 May 2014 13
Therefore, adjusted net profit rose by €2.4 million, up 2.8%, from €86.7 million as of 31 March 2013 to €89.1 million as of
31 March 2014.
Earnings per share amount to €0.059 per share, substantially in line with expectations.
Lastly, the acquisition of AcegasAps in 2013 resulted in a bargain purchase of €42.7 million which was accounted for as
other non-operating non-recurring income. This amount was determined as a result of the purchase price allocation
process, where the purchase price of the individual assets and liabilities purchased was compared with the relevant fair
value, as explained extensively in the 2013 annual report.
Thus, net profit for the quarter ended 31 March 2014 settled at €89.1 million, down from €129.4 million at 31 March 2013.
Hera Group –Consolidated quarterly report at 31 March 2014
Approved by Hera Spa’s Board of Directors in the meeting of 14 May 2014 14
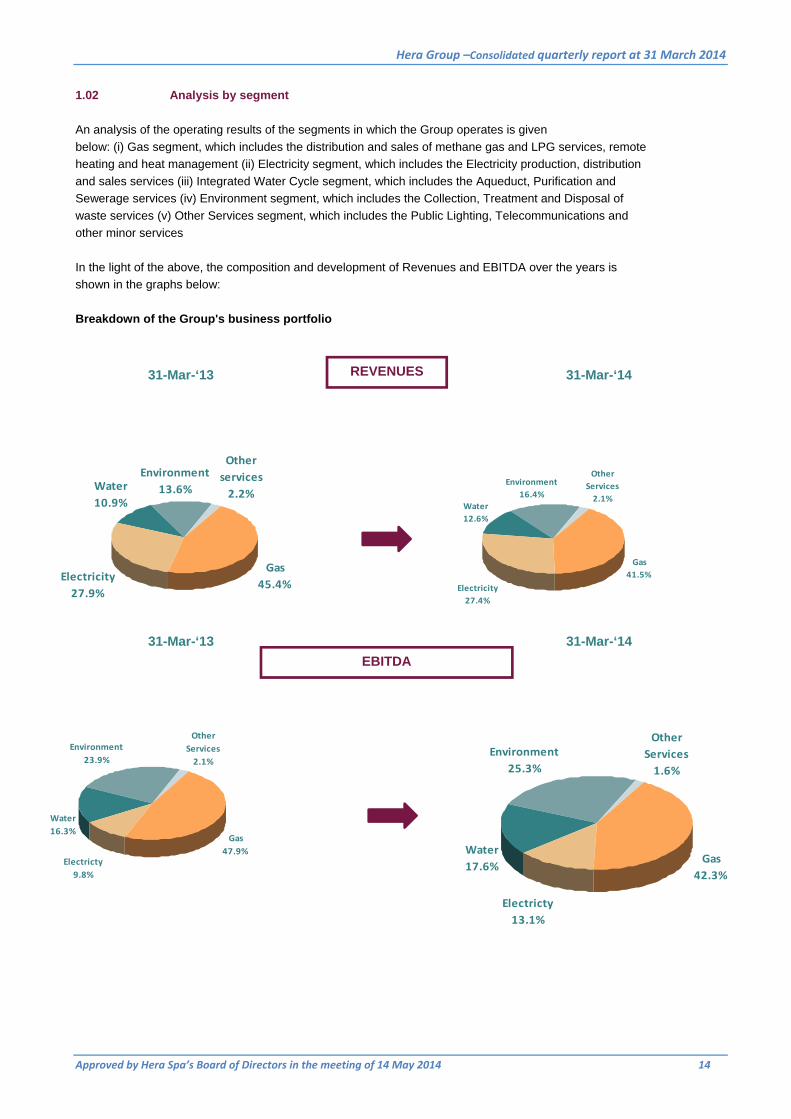
1.02 Analysis by segment
An analysis of the operating results of the segments in which the Group operates is given
below: (i) Gas segment, which includes the distribution and sales of methane gas and LPG services, remote
heating and heat management (ii) Electricity segment, which includes the Electricity production, distribution
and sales services (iii) Integrated Water Cycle segment, which includes the Aqueduct, Purification and
Sewerage services (iv) Environment segment, which includes the Collection, Treatment and Disposal of
waste services (v) Other Services segment, which includes the Public Lighting, Telecommunications and
other minor services
In the light of the above, the composition and development of Revenues and EBITDA over the years is
shown in the graphs below:
Breakdown of the Group's business portfolio
REVENUES
EBITDA
31-Mar-‘13 31-Mar-‘14
31-Mar-‘13 31-Mar-‘14
Gas
41.5%
Water
12.6%
Environment
16.4%
Other
Services
2.1%
Electricity
27.4%
Gas
42.3%
Water
17.6%
Environment
25.3%
Other
Services
1.6%
Electricty
13.1%
Gas
45.4%Electricity
27.9%
Other
services
2.2%
Environment
13.6%Water
10.9%
Gas
47.9%
Water
16.3%
Environment
23.9%
Other
Services
2.1%
Electricty
9.8%

Hera Group –Consolidated quarterly report at 31 March 2014
Approved by Hera Spa’s Board of Directors in the meeting of 14 May 2014 15
An analysis of the operating results broken down by segment is shown below. The Group’s income statements
include corporate headquarter costs and reflect intercompany transactions accounted for at arm’s length.
The income statements for the first quarter of 2013 of the various segments were adjusted to reflect the retrospective
application of IFRS 11.
Compared to 2013, change was introduced in the criteria for the allocation of corporate headquarter costs to the various
segments, using a model that reflects the effects of internal organizational changes and the contributions of the individual
companies to the results of the business areas; for consistency, this change was applied to both the first quarter of 2013
and the first quarter of 2014.
The analysis by business segment considers the increase in revenues and costs, without an impact
on the EBITDA, relating to application of IFRIC 12, as shown in the Group's Consolidated
Income Statement. The segments affected by the application of the above standard are: Methane
distribution services, Power distribution services, all Integrated Water Cycle services and public lighting
services.

Hera Group –Consolidated quarterly report at 31 March 2014
Approved by Hera Spa’s Board of Directors in the meeting of 14 May 2014 16
1.02.01 Gas segment
Compared to the first quarter of 2013, for the quarter ended 31 March 2014 the Gas segment’s contribution to the Group’s
EBITDA fell:
The table below shows the key volumes for the first quarter of 2014 and the first quarter of 2013, which include also the
volumes attributable to the AcegasAps Group. All the figures were adjusted to reflect application of IFRS11.
Distributed volumes dropped from 1,368.1 million cubic metres for the quarter ended 31 March 2013 to 1,059.9 million for
the first quarter of 2014, down 308.2 million cubic metres (down 22.5%). This was due mostly to the particularly mild
weather of the first quarter of 2014, with rather high average temperatures that made the period in question the mildest for
the past thirty years in terms of Degree Days (down 28% vis-à-vis the average for the last thirty years and down 30%
compared to 31 March 2013). The decrease in distributed volumes was partly offset by the line-by-line consolidation of
Isontina Reti Gas, with its contribution of 42 million cubic metres, up 3.3% on the previous year. As a reminder, the lower
volumes distributed are an indicator of thermal conditions in the geographic area in which the Group operates; such
decrease will be made up under the law and the company will collect “regulated” revenues, regardless of volumes for the
period.
Gas volumes sold declined from 1,219.8 million cubic metres in the first quarter of 2013 to 1,050.8 million cubic metres for
the period under review, reflecting a decrease of 169.0 million cubic metres (down 13.9%), due to the mentioned mild
temperatures a 76.7 million cubic metre increase in trading volumes following sales to wholesalers.
Heat volumes sold went from 269.1 GWht in the first quarter of 2013 to 219.4 GWht for the period under review, (down
18.5%); this decrease was due to the abovementioned mild climate, offset only in a small part by an increase of 11,300
customers.
(millions of euro) 31 March 2013 31 March 2014 Absolute change % change
Segment EBITDA 130.0 116.6 -13.4 -10.3%
Group's EBITDA 271.1 275.6 +4.5 +1.7%
Percentage weight 47.9% 42.3% -5.6 p.p.
Quantitative data 31 March 2013 31 March 2014 Absolute change % change
Volumes of gas distributed (millions of cubic 1,368.1 1,059.9 -308.2 -22.5%
Volumes of gas sold (millions of cubic metre 1,219.8 1,050.8 -169.0 -13.9%
- of which trading volumes 235.0 311.7 +76.7 +32.6%
Volumes of heat supplied (Gwht) 269.1 219.4 -49.7 -18.5%

Hera Group –Consolidated quarterly report at 31 March 2014
Approved by Hera Spa’s Board of Directors in the meeting of 14 May 2014 17
A summary of the operating results for the segment is given below:
Segment revenues went down from €688.3 million in the first quarter of 2013 to €561.9 million for the period under review,
down €126.4 million (down 18.4%); the main reasons are:
lower revenues from methane gas sales to end customers (down around €144 million) due both to lower volumes
sold (down around €113 million) and to the lower prices of raw materials as a consequence of the Authority for
Power, Gas and Water's reform, which resulted in the progressive shift from oil indexing to spot market indexing;
lower revenues from district heating sales due to lower volumes (€5 million);
greater revenues from trading activities by about €16.0 million, related to greater volumes sold;
greater revenues for the energy efficiency certificates, following the AEEGSI’s resolution that redefines the price
per unit of these certificates.
Lower gas volumes sold translate also into lower operating costs, which fell by €114.5 million, due to the combined effects
of lower volumes sold for €128 million and higher costs for the increase in trading activities.
EBITDA for the segment declined by €13.4 million (down 10.3%), from €130.0 million to €116.6 million, as a result of the
following: (i) lower trading margins due to the lower pricing mechanisms determined by the cited AEEGSI reform; (ii)
slimmer margins on gas sales and district heating services due to the lower volumes for the cited weather effect, offset by
(iii) higher margins for energy efficiency certificates and (iv) the acquisition of full control over Isontina Reti Gas.
Income statement (millions of euro) 31-Mar-13 % share 31-Mar-14 % share Absolute change % change
Revenues 688.3 561.9 -126.4 -18.4%
Operating costs (526.3) -76.5% (411.8) -73.3% -114.5 -21.8%
Personnel costs (33.1) -4.8% (34.7) -6.2% +1.6 +4.8%
Capitalised costs 1.0 0.1% 1.1 0.2% +0.1 +10.3%
EBITDA 130.0 18.9% 116.6 20.7% -13.4 -10.3%

Hera Group –Consolidated quarterly report at 31 March 2014
Approved by Hera Spa’s Board of Directors in the meeting of 14 May 2014 18
1.02.02 Electric energy segment
In the first quarter of 2014, the Electricity segment showed improvement compared to the first quarter of 2013, both in
terms of results as well as in terms of contribution to consolidated EBITDA, as shown in the table below:
The table below, which does not include trading activities, shows the main volumes for the first quarter of 2014 and the first
quarter of 2013; both sets of figures were adjusted to include the volumes generated by the AcegasAps Group and the
changes introduced by the application of IFRS 11.
The volumes of electric energy sold went from 2.371,3 GWh at 31 March 2013 to 2,2285.43 GWh at 31 March 2014, down
3.6%, in line both with domestic demand (down 3.7%) and the Group’s main geographic market (down 4.8%), despite a
12.3% increase in the number of customers served.
Distributed volumes rose by 0.5%; the contribution of the full consolidation of Est Reti Elettriche amounts to 32.8 GWh,
offsetting the decrease determined, on a like-for-like basis, of the decrease in demand.
Below, the key figures for this segment are provided:
Revenues went from €422.1 million for the first quarter of 2013 to €372.0 million for the period under review, down 11.9%,
due to lower trading revenues, lower volumes sold and the 18.0% decrease in the price of energy (PUN - National Single
Price) compared to the previous year. This decrease was offset by greater regulated revenues derived from the
dispatching service market and the full consolidation of Est Reti Elettriche.
Operating costs fell by €61.5 million (down 15.8%), more than offsetting the decline in revenues from sales to final
customers and trading.
EBITDA grew by €9.6 million (up 36.2%), going from €26.6 to €36.2 million, thanks to higher margins on sales activities,
particularly in the free market and in the last resort service market, to greater revenues from the regulated distribution
market, including the collection of amounts due from before 2014, and the contribution of Est Reti Elettriche.
(millions of euro) 31 March 2013 31 March 2014 Absolute change % change
Segment EBITDA 26.6 36.2 +9.6 +36.2%
Group's EBITDA 271.1 275.6 +4.5 +1.7%
Percentage weight 9.8% 13.1% +3.3 p.p.
Quantitative data 31 March 2013 31 March 2014 Absolute change % change
Volumes sold (Gw/h) 2,371.3 2,285.3 -86.0 -3.6%
Volumes distributed (Gw/h) 740.9 744.9 +4.0 +0.5%
Income statement (millions of euro) March 2013 % share March 2014 % share Absolute change % change
Revenues 422.1 372.0 -50.1 -11.9%
Operating costs (389.1) -92.2% (327.6) -88.1% -61.5 -15.8%
Personnel costs (7.7) -1.8% (9.7) -2.6% +2.0 +25.9%
Capitalised costs 1.2 0.3% 1.5 0.4% +0.3 +24.9%
EBITDA 26.6 6.3% 36.2 9.7% +9.6 +36.2%
Hera Group –Consolidated quarterly report at 31 March 2014
Approved by Hera Spa’s Board of Directors in the meeting of 14 May 2014 19
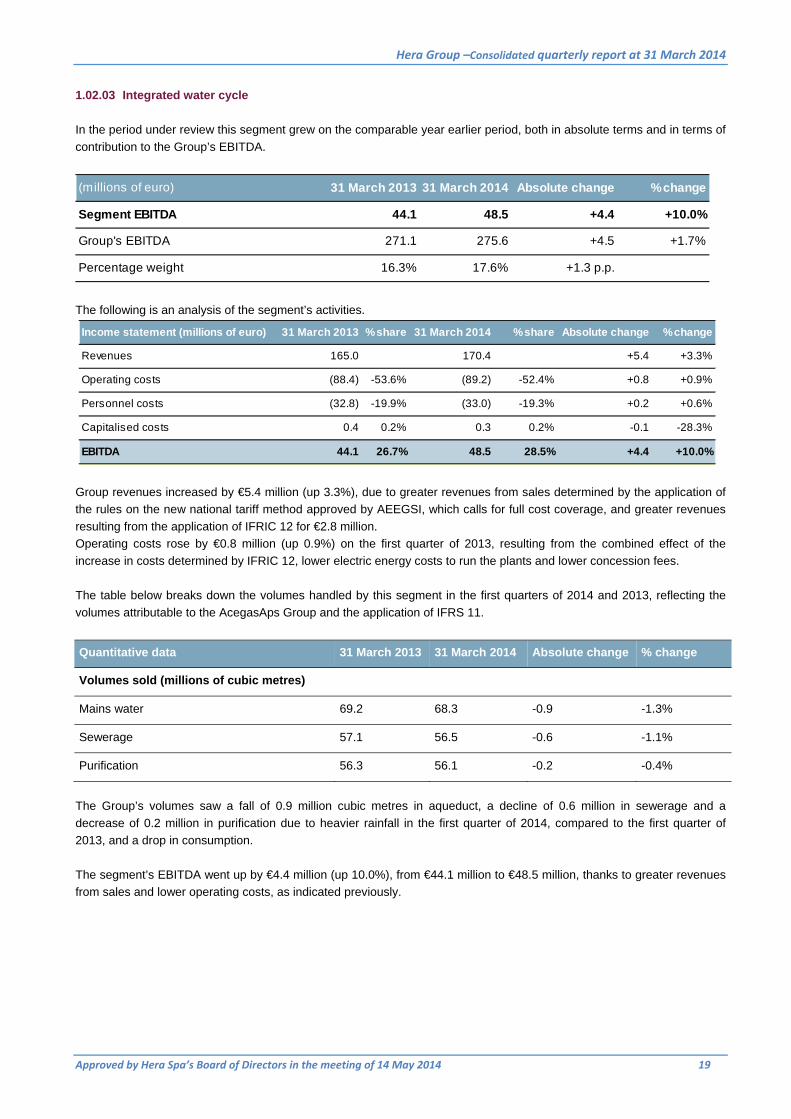
1.02.03 Integrated water cycle
In the period under review this segment grew on the comparable year earlier period, both in absolute terms and in terms of
contribution to the Group’s EBITDA.
The following is an analysis of the segment’s activities.
Group revenues increased by €5.4 million (up 3.3%), due to greater revenues from sales determined by the application of
the rules on the new national tariff method approved by AEEGSI, which calls for full cost coverage, and greater revenues
resulting from the application of IFRIC 12 for €2.8 million.
Operating costs rose by €0.8 million (up 0.9%) on the first quarter of 2013, resulting from the combined effect of the
increase in costs determined by IFRIC 12, lower electric energy costs to run the plants and lower concession fees.
The table below breaks down the volumes handled by this segment in the first quarters of 2014 and 2013, reflecting the
volumes attributable to the AcegasAps Group and the application of IFRS 11.
Quantitative data 31 March 2013 31 March 2014 Absolute change % change
Volumes sold (millions of cubic metres)
Mains water 69.2 68.3 -0.9 -1.3%
Sewerage 57.1 56.5 -0.6 -1.1%
Purification 56.3 56.1 -0.2 -0.4%
The Group’s volumes saw a fall of 0.9 million cubic metres in aqueduct, a decline of 0.6 million in sewerage and a
decrease of 0.2 million in purification due to heavier rainfall in the first quarter of 2014, compared to the first quarter of
2013, and a drop in consumption.
The segment’s EBITDA went up by €4.4 million (up 10.0%), from €44.1 million to €48.5 million, thanks to greater revenues
from sales and lower operating costs, as indicated previously.
(millions of euro) 31 March 2013 31 March 2014 Absolute change % change
Segment EBITDA 44.1 48.5 +4.4 +10.0%
Group's EBITDA 271.1 275.6 +4.5 +1.7%
Percentage weight 16.3% 17.6% +1.3 p.p.
Income statement (millions of euro) 31 March 2013 % share 31 March 2014 % share Absolute change % change
Revenues 165.0 170.4 +5.4 +3.3%
Operating costs (88.4) -53.6% (89.2) -52.4% +0.8 +0.9%
Personnel costs (32.8) -19.9% (33.0) -19.3% +0.2 +0.6%
Capitalised costs 0.4 0.2% 0.3 0.2% -0.1 -28.3%
EBITDA 44.1 26.7% 48.5 28.5% +4.4 +10.0%

Hera Group –Consolidated quarterly report at 31 March 2014
Approved by Hera Spa’s Board of Directors in the meeting of 14 May 2014 20
1.02.04 Environment
For the quarter ended 31 March 2014, the environment segment showed an increase in the relevant EBITDA margin, as
indicated in the table below, and growth in absolute terms.
(millions of euro) 31 March 2013 31 March 2014Absolute
change % change
Segment EBITDA 64.7 69.8 +5.1 +7.9%
Group's EBITDA 271.1 275.6 +4.5 +1.7%
Percentage weight 23.9% 25.3% +1.4 p.p.
The Group applies integrated waste full-cycle processing in 71 treatment and disposal plants managed by HERAmbiente,
besides 3 more plants managed by Gruppo Marche Multiservizi and two AcegasAps waste-to-energy plants.
An analysis of the operating results achieved in the segment is shown below:
For the quarter under review, the Group’s revenues rose by €17.0 million (up 8.3%) on the comparable year-earlier period,
going from €205.7 million to €222.7 million. Such increase was due to the greater volumes disposed of, thanks to the
development of the commercial activity in the areas of central and northern Italy, higher average waste disposal prices and
greater revenues from urban hygiene activities to cover the greater services required.
The segment’s operating costs increased by €10.3 million, in keeping with the larger amount of waste handled and thanks
to the collection and sweeping services provided.
Overall, sorted waste handled by Hera S.p.A. and Marche Multiservizi, accounted for 52.5% of total waste collected in the
quarter ended 31 March 2014, compared to 52.0% in the corresponding quarter of 2013. For AcegasAps, sorted waste
represented 43.5% of the total for the quarter under review compared to 41.7% for the first quarter of 2013. Overall, the
Hera Group showed a rising percentage of sorted waste, which was 51.4% in the first quarter of 2014, compared to 50.7%
in the first quarter of 2013.
Income statement (millions of euro) 31 March 2013 % share 31 March 2014 % share Absolute change % change
Revenues 205.7 222.7 +17.0 +8.3%
Operating costs (98.0) -47.6% (108.3) -48.6% +10.3 +10.5%
Personnel costs (43.4) -21.1% (45.1) -20.2% +1.7 +3.9%
Capitalised costs 0.4 0.2% 0.5 0.2% +0.1 +27.5%
EBITDA 64.7 31.5% 69.8 31.4% +5.1 +7.9%
Hera Group –Consolidated quarterly report at 31 March 2014
Approved by Hera Spa’s Board of Directors in the meeting of 14 May 2014 21
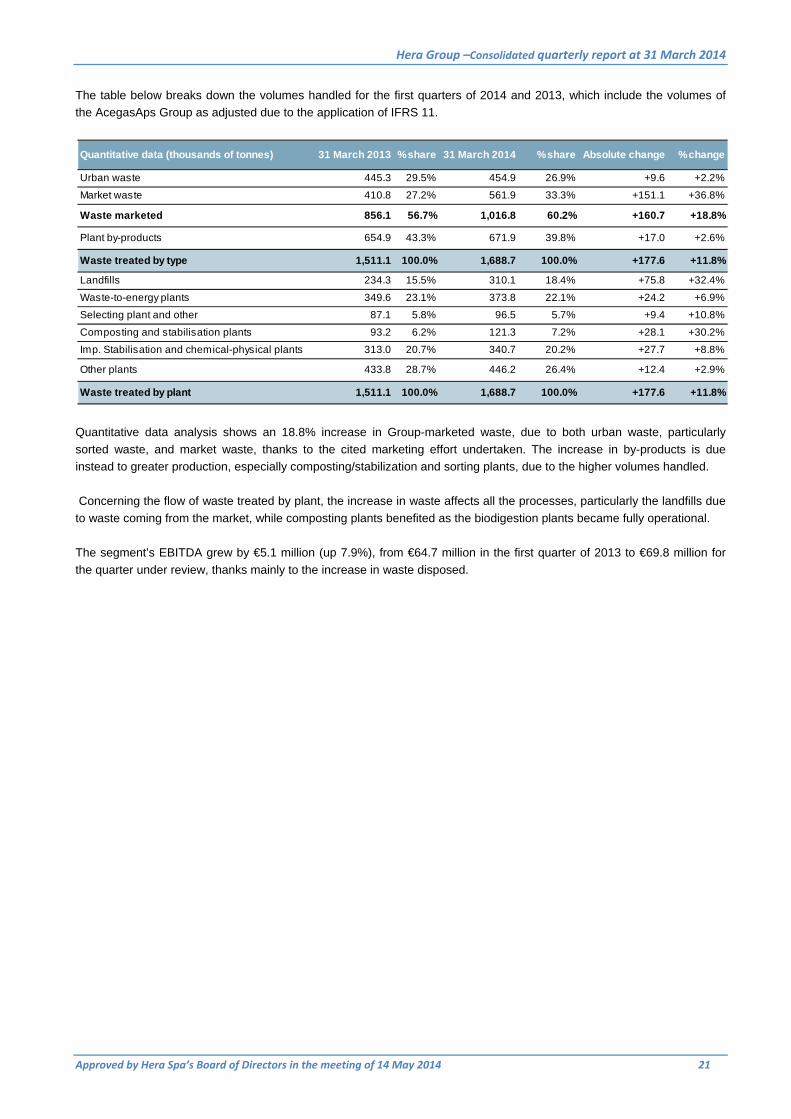
The table below breaks down the volumes handled for the first quarters of 2014 and 2013, which include the volumes of
the AcegasAps Group as adjusted due to the application of IFRS 11.
Quantitative data analysis shows an 18.8% increase in Group-marketed waste, due to both urban waste, particularly
sorted waste, and market waste, thanks to the cited marketing effort undertaken. The increase in by-products is due
instead to greater production, especially composting/stabilization and sorting plants, due to the higher volumes handled.
Concerning the flow of waste treated by plant, the increase in waste affects all the processes, particularly the landfills due
to waste coming from the market, while composting plants benefited as the biodigestion plants became fully operational.
The segment’s EBITDA grew by €5.1 million (up 7.9%), from €64.7 million in the first quarter of 2013 to €69.8 million for
the quarter under review, thanks mainly to the increase in waste disposed.
Quantitative data (thousands of tonnes) 31 March 2013 % share 31 March 2014 % share Absolute change % change
Urban waste 445.3 29.5% 454.9 26.9% +9.6 +2.2%
Market waste 410.8 27.2% 561.9 33.3% +151.1 +36.8%
Waste marketed 856.1 56.7% 1,016.8 60.2% +160.7 +18.8%
Plant by-products 654.9 43.3% 671.9 39.8% +17.0 +2.6%
Waste treated by type 1,511.1 100.0% 1,688.7 100.0% +177.6 +11.8%
Landfills 234.3 15.5% 310.1 18.4% +75.8 +32.4%
Waste-to-energy plants 349.6 23.1% 373.8 22.1% +24.2 +6.9%
Selecting plant and other 87.1 5.8% 96.5 5.7% +9.4 +10.8%
Composting and stabilisation plants 93.2 6.2% 121.3 7.2% +28.1 +30.2%
Imp. Stabilisation and chemical-physical plants 313.0 20.7% 340.7 20.2% +27.7 +8.8%
Other plants 433.8 28.7% 446.2 26.4% +12.4 +2.9%
Waste treated by plant 1,511.1 100.0% 1,688.7 100.0% +177.6 +11.8%

Hera Group –Consolidated quarterly report at 31 March 2014
Approved by Hera Spa’s Board of Directors in the meeting of 14 May 2014 22
1.02.05 Other services
This segment’s EBITDA for the quarter ended 31 March 2014 was down to €4.5 million, from €5.8 million for the first
quarter of 2013.
The table below shows the main operating figures for this segment.
Revenues decreased by €4.9 million due mainly to the disposal of the companies devoted to cemetery services.
The €1.3 million EBITDA decline was due to public lighting, which was affected by the termination of a number of service
contracts and fewer work contracts awarded, due to budget pressures for municipalities, and the cited sale of cemetery
services.
The table below breaks down quantitative data for the first quarters of 2014 and 2013, which include the details of the
AcegasAps Group as adjusted due to the application of IFRS 11.
Lighting points decreased by 15.9 thousand units while the municipalities served rose by 6. These contrasting data can be
explained with the loss of contracts from larger municipalities compared to others with lower public lighting requirements.
(millions of euro) 31 March 2013 31 March 2014 Absolute change % change
Segment EBITDA 5.8 4.5 -1.3 -21.6%
Group's EBITDA 271.1 275.6 +4.5 +1.7%
Percentage weight 2.1% 1.6% -0.5 p.p.
Income statement (millions of euro) 31 March 2013 % share 31 March 2014 % share Absolute change % change
Revenues 33.4 28.5 -4.9 -14.7%
Operating costs (21.7) -65.1% (19.5) -68.4% -2.2 -10.1%
Personnel costs (6.1) -18.2% (4.7) -16.6% -1.4 -23.1%
Capitalised costs 0.2 0.6% 0.2 0.9% +0.0 +0.0%
EBITDA 5.8 17.2% 4.5 15.8% -1.3 -21.6%
Quantitative data 31 March 2013 31 March 2014 Absolute change % change
Public lighting
Lighting points (thousands) 459.1 443.2 -15.9 -3.5%
Municipalities served 114.0 120.0 +6.0 +5.3%

Hera Group –Consolidated quarterly report at 31 March 2014
Approved by Hera Spa’s Board of Directors in the meeting of 14 May 2014 23
1.03 Hera Group’s investments
The Group’s investments amount to a total of €56.2 million, including €2.7 million in capital grants, of which €2.4 million for
the New Investment Fund (FoNI), a component foreseen by the tariff method for the Integrated Water Service. The
Group’s overall investments net of capital grants amount to €53.5 million.
Gross investments in tangibles and intangibles, inclusive of capital grants, amounted to €56.2 million, compared to €53.3
million, plus €0.4 million to acquire minor equity interests, in the corresponding quarter of 2013.
As of the 2013 financial year, particular attention is given to capital grants, in that the new tariff method
for the Integrated Water Cycle sets aside part of the tariff as a share reserved for new investments
(FoNI: New Investment Fund). For this reason, it appears to be more useful to present the investments
gross of capital grants, and to indicate the latter separately.
In the following table, the investments are listed gross of disposals and capital grants, subdivided by
business segment, with capital grants shown as a separate item.
Total Investments
(millions of euro)
Gas segment 8,1 10,4 +2,3 +28,4%
Electricity segment 3,4 4,6 +1,2 +35,3%
Integrated water cycle segment 18,0 21,2 +3,2 +17,8%
Environment segment 8,1 8,5 +0,4 +4,9%
Other services segment 4,7 3,7 -1,0 -21,3%
Corporate headquarters 11,0 7,8 -3,2 -29,1%
Total capital expenditure 53,3 56,2 +2,9 +5,4%
Total equity investments 0,4 0,0 -0,4 -100,0%
Total investments, gross 53,7 56,2 +2,5 +4,7%
Capital grants -0,1 2,7 +2,8 +100,0%
of which for FoNI (New Investment Fund) - 2,3 +2,3 +100,0%
Total investments, net 53,8 53,5 -0,3 -0,6%
31 March 2013 31 March 2014 Absolute change % change
Hera Group –Consolidated quarterly report at 31 March 2014
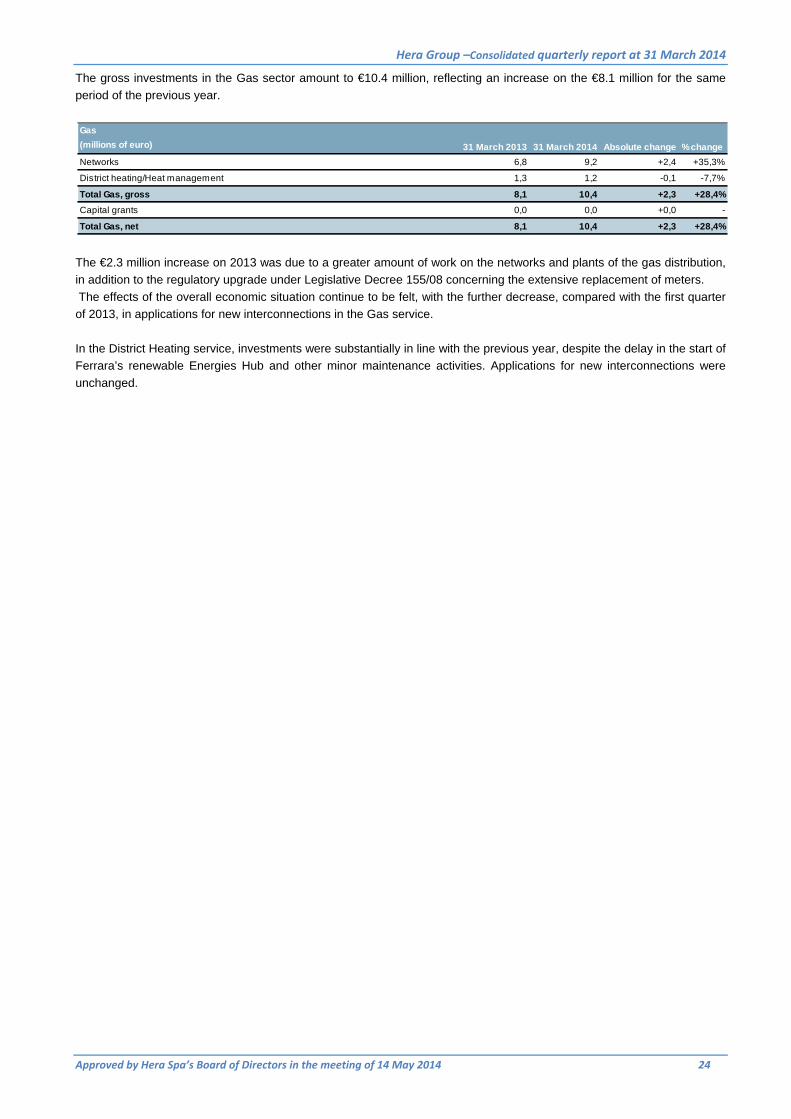
Approved by Hera Spa’s Board of Directors in the meeting of 14 May 2014 24
The gross investments in the Gas sector amount to €10.4 million, reflecting an increase on the €8.1 million for the same
period of the previous year.
The €2.3 million increase on 2013 was due to a greater amount of work on the networks and plants of the gas distribution,
in addition to the regulatory upgrade under Legislative Decree 155/08 concerning the extensive replacement of meters.
The effects of the overall economic situation continue to be felt, with the further decrease, compared with the first quarter
of 2013, in applications for new interconnections in the Gas service.
In the District Heating service, investments were substantially in line with the previous year, despite the delay in the start of
Ferrara’s renewable Energies Hub and other minor maintenance activities. Applications for new interconnections were
unchanged.
Gas
(millions of euro)
Networks 6,8 9,2 +2,4 +35,3%
District heating/Heat management 1,3 1,2 -0,1 -7,7%
Total Gas, gross 8,1 10,4 +2,3 +28,4%
Capital grants 0,0 0,0 +0,0 -
Total Gas, net 8,1 10,4 +2,3 +28,4%
31 March 2013 31 March 2014 Absolute change % change
Hera Group –Consolidated quarterly report at 31 March 2014
Approved by Hera Spa’s Board of Directors in the meeting of 14 May 2014 25
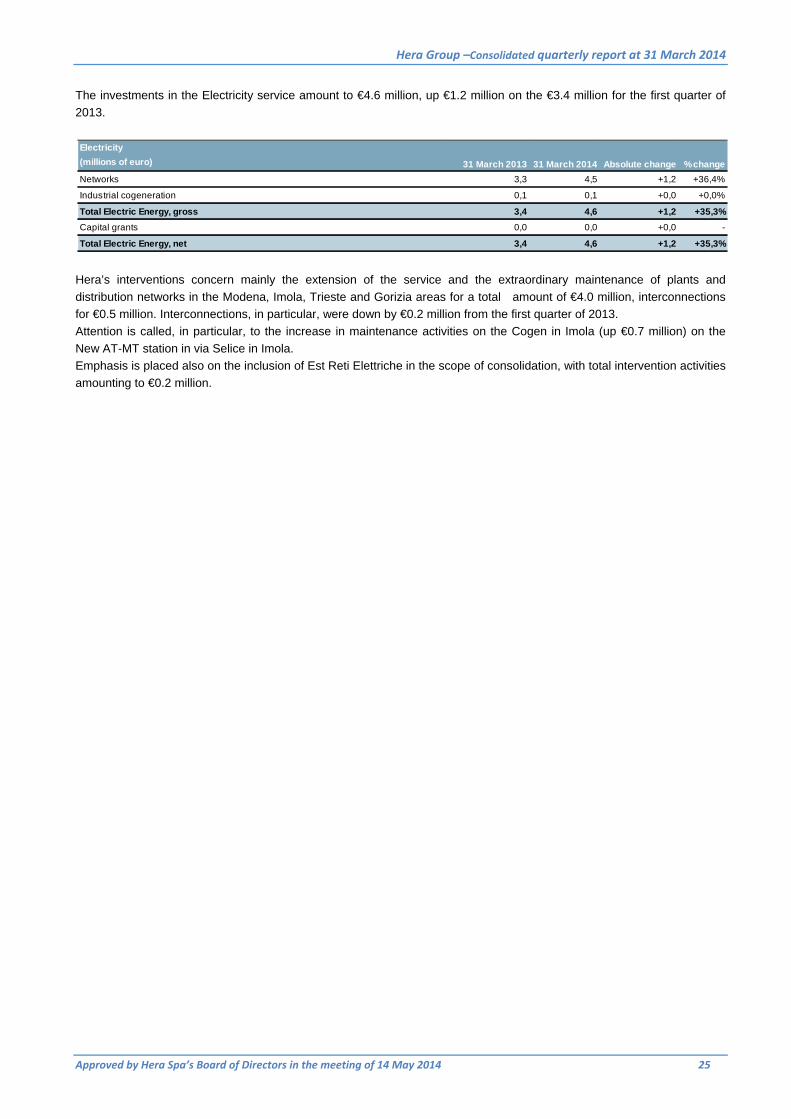
The investments in the Electricity service amount to €4.6 million, up €1.2 million on the €3.4 million for the first quarter of
2013.
Hera’s interventions concern mainly the extension of the service and the extraordinary maintenance of plants and
distribution networks in the Modena, Imola, Trieste and Gorizia areas for a total amount of €4.0 million, interconnections
for €0.5 million. Interconnections, in particular, were down by €0.2 million from the first quarter of 2013.
Attention is called, in particular, to the increase in maintenance activities on the Cogen in Imola (up €0.7 million) on the
New AT-MT station in via Selice in Imola.
Emphasis is placed also on the inclusion of Est Reti Elettriche in the scope of consolidation, with total intervention activities
amounting to €0.2 million.
Electricity
(millions of euro)
Networks 3,3 4,5 +1,2 +36,4%
Industrial cogeneration 0,1 0,1 +0,0 +0,0%
Total Electric Energy, gross 3,4 4,6 +1,2 +35,3%
Capital grants 0,0 0,0 +0,0 -
Total Electric Energy, net 3,4 4,6 +1,2 +35,3%
31 March 2013 31 March 2014 Absolute change % change

Hera Group –Consolidated quarterly report at 31 March 2014
Approved by Hera Spa’s Board of Directors in the meeting of 14 May 2014 26
As regards the Integrated Water Cycle, investments principally concern extensions, network and plant
decontaminations and enhancements, as well as regulatory compliance regarding above all purification
and sewerage. On the whole, interventions in the Integrated Water Cycle amount to €21.2 million, compared to €18.0
million in investments carried out in the first quarter of 2013.
Investments amounting to €11.1 million were made in the Aqueduct, €3.8 million in Purification and €6.2 million in
Sewerage.
The €3.2 million increase on the previous year was due to greater works on the aqueduct, mainly due to planned
maintenance activities on the networks and the sewers, where discharges are constantly upgraded as per Legislative
Decree no. 152/2006.
Also in the water sector, due to the persistence of the crisis in the property sector, applications for new interconnections
were lower than in the first quarter of 2013.
Capital grants, which concern mainly the Integrated Water Service, are due mainly to the tariff components contemplated
by the tariff method for the New Investment Fund (FoNI).
Integrated water cycle
(millions of euro)
Mains water 9,4 11,1 +1,7 +18,1%
Purification 3,8 3,8 +0,0 +0,0%
Sewerage 4,8 6,2 +1,4 +29,2%
Total Integrated Water Cycle, gross 18,0 21,2 +3,2 +17,8%
Capital grants 0,0 2,7 +2,7 +100,0%
of which for FoNI (New Investment Fund) 0,0 2,3 +2,3 +100,0%
Total Integrated Water Cycle, net 18,0 18,5 +0,5 +2,8%
31 March 2013 31 March 2014 Absolute change % change
Hera Group –Consolidated quarterly report at 31 March 2014
Approved by Hera Spa’s Board of Directors in the meeting of 14 May 2014 27
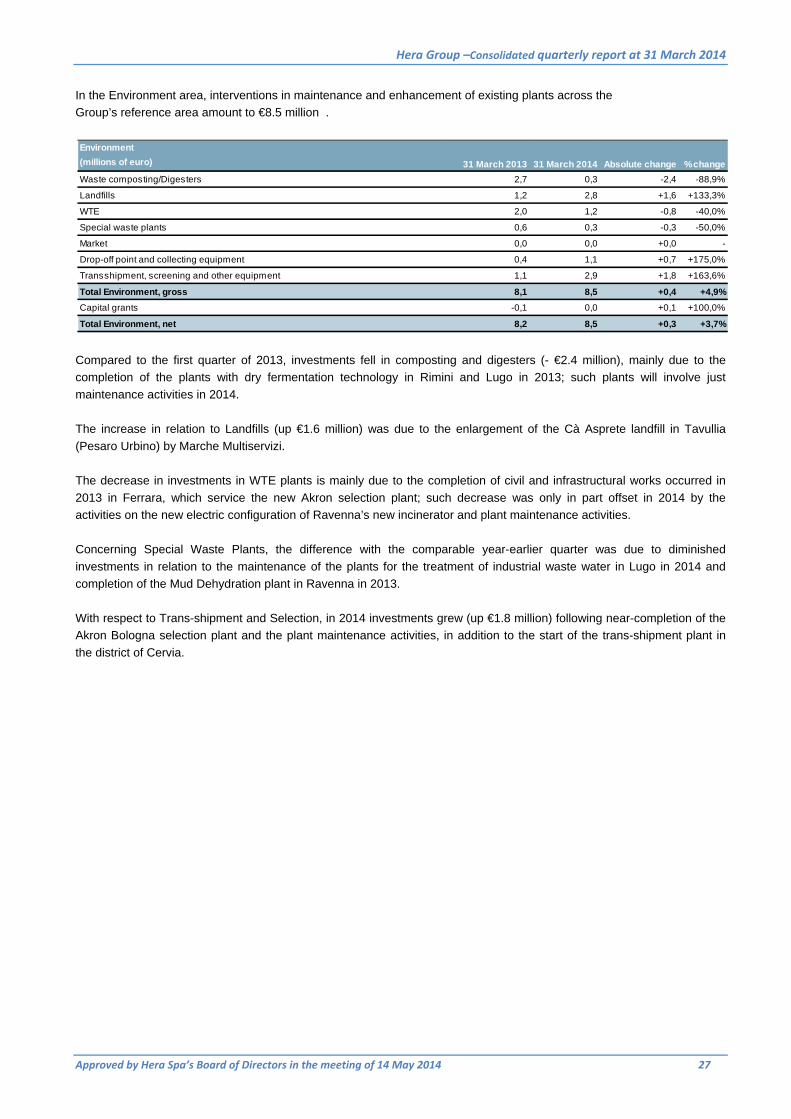
In the Environment area, interventions in maintenance and enhancement of existing plants across the
Group’s reference area amount to €8.5 million .
Compared to the first quarter of 2013, investments fell in composting and digesters (- €2.4 million), mainly due to the
completion of the plants with dry fermentation technology in Rimini and Lugo in 2013; such plants will involve just
maintenance activities in 2014.
The increase in relation to Landfills (up €1.6 million) was due to the enlargement of the Cà Asprete landfill in Tavullia
(Pesaro Urbino) by Marche Multiservizi.
The decrease in investments in WTE plants is mainly due to the completion of civil and infrastructural works occurred in
2013 in Ferrara, which service the new Akron selection plant; such decrease was only in part offset in 2014 by the
activities on the new electric configuration of Ravenna’s new incinerator and plant maintenance activities.
Concerning Special Waste Plants, the difference with the comparable year-earlier quarter was due to diminished
investments in relation to the maintenance of the plants for the treatment of industrial waste water in Lugo in 2014 and
completion of the Mud Dehydration plant in Ravenna in 2013.
With respect to Trans-shipment and Selection, in 2014 investments grew (up €1.8 million) following near-completion of the
Akron Bologna selection plant and the plant maintenance activities, in addition to the start of the trans-shipment plant in
the district of Cervia.
Environment
(millions of euro)
Waste composting/Digesters 2,7 0,3 -2,4 -88,9%
Landfills 1,2 2,8 +1,6 +133,3%
WTE 2,0 1,2 -0,8 -40,0%
Special waste plants 0,6 0,3 -0,3 -50,0%
Market 0,0 0,0 +0,0 -
Drop-off point and collecting equipment 0,4 1,1 +0,7 +175,0%
Transshipment, screening and other equipment 1,1 2,9 +1,8 +163,6%
Total Environment, gross 8,1 8,5 +0,4 +4,9%
Capital grants -0,1 0,0 +0,1 +100,0%
Total Environment, net 8,2 8,5 +0,3 +3,7%
31 March 2013 31 March 2014 Absolute change % change

Hera Group –Consolidated quarterly report at 31 March 2014
Approved by Hera Spa’s Board of Directors in the meeting of 14 May 2014 28
Investments in the Other Services area amounted to €3.7 million, compared to €4.7 million in the corresponding quarter of
2013.
In the Telecommunications segment, attention is called to the €2.6 million invested in networks and TLC and IDC services
and the €1.1 million in the public lighting service; the sub-item “Other” reflects, for the previous year, investments in
Cemetery Services no longer included in the scope of consolidation.
Other services
(millions of euro)
TLC 3,1 2,6 -0,5 -16,1%
Public lighting and traffic lights 1,4 1,1 -0,3 -21,4%
Other 0,2 0,0 -0,2 -100,0%
Total Other Services, gross 4,7 3,7 -1,0 -21,3%
Capital grants 0,0 0,0 +0,0 -
Total Other Services, net 4,7 3,7 -1,0 -21,3%
31 March 2013 31 March 2014 Absolute change % change

Hera Group –Consolidated quarterly report at 31 March 2014
Approved by Hera Spa’s Board of Directors in the meeting of 14 May 2014 29
Headquarters investments concern the property works dedicated to creating new headquarters, as well as investments in
information systems and those necessary for maintaining the company’s vehicle fleet.
“Other investments” include the completion of laboratories and Remote control structures.
Overall, capital expenditure for headquarters fell by €3.2 million from the comparable amount in the first quarter of 2013,
mainly due to a decline in property activities as a result of the completion of the new corporate offices.
Corporate headquarters
(millions of euro)
Property 7,1 3,2 -3,9 -54,9%
Information systems 1,6 2,1 +0,5 +31,3%
Fleets 1,4 1,8 +0,4 +28,6%
Other investments 1,0 0,6 -0,4 -40,0%
Total Corporate Headquarters 11,0 7,8 -3,2 -29,1%
Capital grants 0,0 0,0 +0,0 -
Total Corporate Headquarters, net 11,0 7,8 -3,2 -29,1%
31 March 2013 31 March 2014 Absolute change % change
Hera Group –Consolidated quarterly report at 31 March 2014
Approved by Hera Spa’s Board of Directors in the meeting of 14 May 2014 30
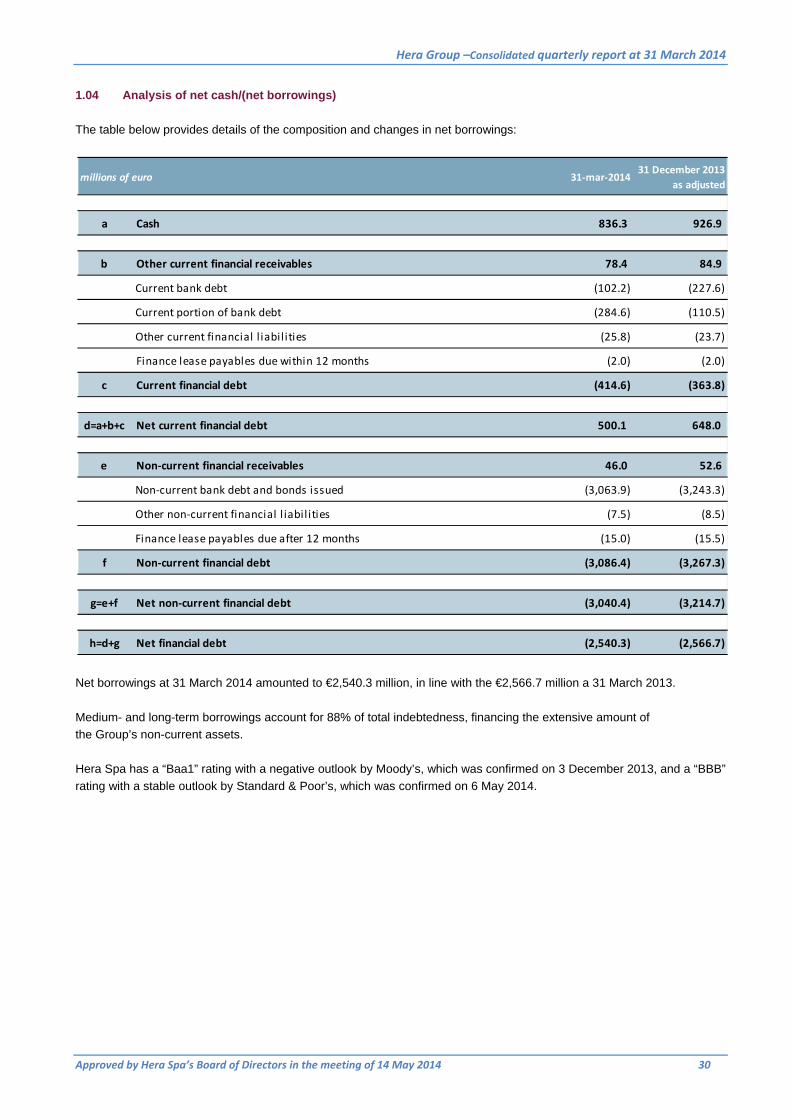
1.04 Analysis of net cash/(net borrowings)
The table below provides details of the composition and changes in net borrowings:
Net borrowings at 31 March 2014 amounted to €2,540.3 million, in line with the €2,566.7 million a 31 March 2013.
Medium- and long-term borrowings account for 88% of total indebtedness, financing the extensive amount of
the Group’s non-current assets.
Hera Spa has a “Baa1” rating with a negative outlook by Moody’s, which was confirmed on 3 December 2013, and a “BBB”
rating with a stable outlook by Standard & Poor’s, which was confirmed on 6 May 2014.
millions of euro 31‐mar‐201431 December 2013
as adjusted
a Cash 836.3 926.9
b Other current financial receivables 78.4 84.9
Current bank debt (102.2) (227.6)
Current portion of bank debt (284.6) (110.5)
Other current financial l iabil ities (25.8) (23.7)
Finance lease payables due within 12 months (2.0) (2.0)
c Current financial debt (414.6) (363.8)
d=a+b+c Net current financial debt 500.1 648.0
e Non‐current financial receivables 46.0 52.6
Non‐current bank debt and bonds issued (3,063.9) (3,243.3)
Other non‐current financial l iabil ities (7.5) (8.5)
Finance lease payables due after 12 months (15.0) (15.5)
f Non‐current financial debt (3,086.4) (3,267.3)
g=e+f Net non‐current financial debt (3,040.4) (3,214.7)
h=d+g Net financial debt (2,540.3) (2,566.7)
Hera Group –Consolidated quarterly report at 31 March 2014
Approved by Hera Spa’s Board of Directors in the meeting of 14 May 2014 31
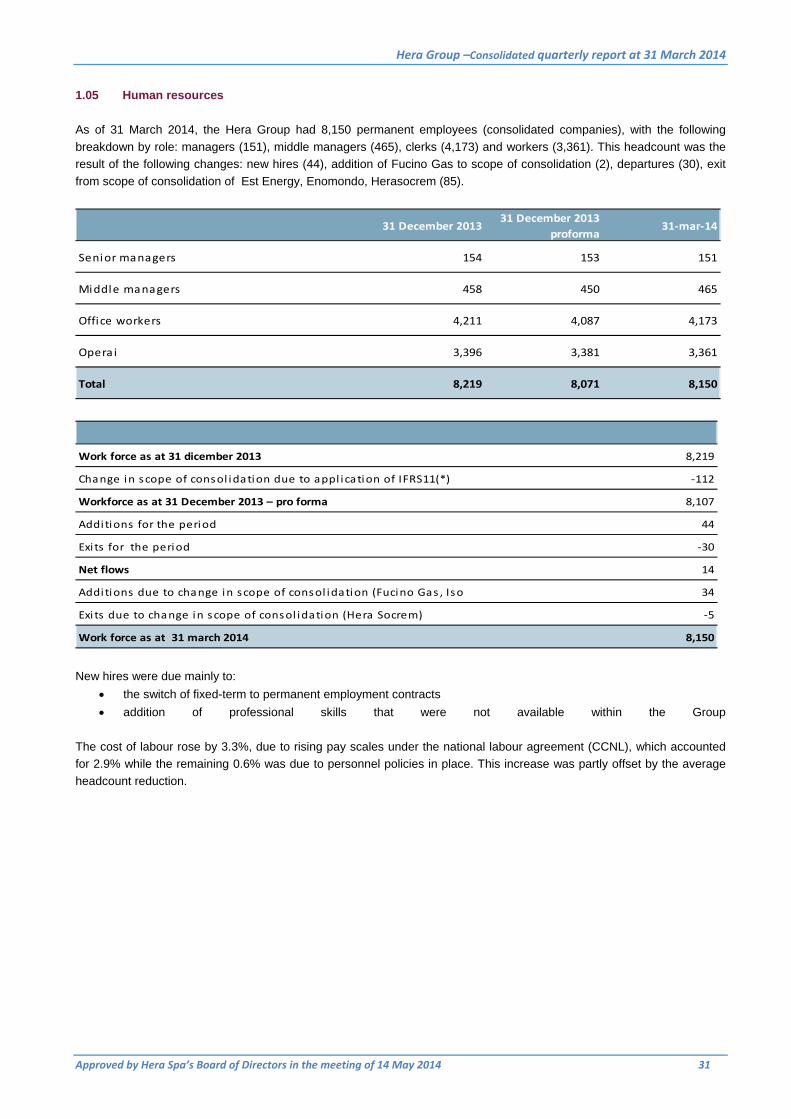
1.05 Human resources
As of 31 March 2014, the Hera Group had 8,150 permanent employees (consolidated companies), with the following
breakdown by role: managers (151), middle managers (465), clerks (4,173) and workers (3,361). This headcount was the
result of the following changes: new hires (44), addition of Fucino Gas to scope of consolidation (2), departures (30), exit
from scope of consolidation of Est Energy, Enomondo, Herasocrem (85).
Work force as at 31 dicember 2013 8,219
Change in scope of consol idation due to appl ication of IFRS11(*) ‐112
Workforce as at 31 December 2013 – pro forma 8,107
Additions for the period 44
Exi ts for the period ‐30
Net flows 14
Additions due to change in scope of consol idation (Fucino Gas , Iso 34
Exi ts due to change in scope of consol idation (Hera Socrem) ‐5
Work force as at 31 march 2014 8,150
New hires were due mainly to:
the switch of fixed-term to permanent employment contracts
addition of professional skills that were not available within the Group
The cost of labour rose by 3.3%, due to rising pay scales under the national labour agreement (CCNL), which accounted
for 2.9% while the remaining 0.6% was due to personnel policies in place. This increase was partly offset by the average
headcount reduction.
31 December 2013
31 December 2013
proforma31‐mar‐14
Senior managers 154 153 151
Middle managers 458 450 465
Office workers 4,211 4,087 4,173
Opera i 3,396 3,381 3,361
Total 8,219 8,071 8,150

cHAPTER 2
Hera Group Consolidated Financial Statements

Hera Group –Consolidated quarterly report at 31 March 2014
Approved by Hera Spa’s Board of Directors in the meeting of 14 May 2014 32
2.01 Consolidated financial statements
2.01.01 Income statement
* The comparative data were adjusted to reflect the changes outlined in the paragraph “Adjustment summary” in the
explanatory notes.
thousands of euros
Revenue 1,226,575 1,393,091 4,456,932
Other operating revenues 65,852 48,703 270,607
Use of raw materia ls and consumables (638,610) (796,519) (2,367,770)
Service costs (243,202) (243,039) (1,029,318)
Personnel costs (127,125) (123,032) (478,609)
Amortisation, depreciation,provis ions (102,708) (98,474) (410,519)
Other operating costs (11,551) (11,178) (59,903)
Capita l i sed costs 3,669 3,086 18,240
Operating profit 172,900 172,638 399,660
Share of profi ts (losses ) of jont ventures and associated co 2,150 6,281 11,501
Financia l income 45,510 22,635 109,376
Financia l expense (80,109) (57,545) (265,938)
Total financial operations (32,449) (28,629) (145,061)
Other non‐recurring non‐operating income 42,709 45,225
Pre‐tax profit 140,451 186,718 299,824
Taxes for the period (51,333) (57,347) (118,116)
Net profit for the period 89,118 129,371 181,708
Attributable to:
Shareholders of the Parent Company 83,215 123,480 164,934
Non‐control l ing interests 5,903 5,891 16,774
Earnings per share
basic 0.059 0.093 0.122
diluted 0.059 0.088 0.118
31 December 2013
(12 months)
adjusted*
31 March 2014
(3 months)
31 March 2013
(3 months)
adjusted*

Hera Group –Consolidated quarterly report at 31 March 2014
Approved by Hera Spa’s Board of Directors in the meeting of 14 May 2014 33
2.01.02 Statement of comprehensive income
Net profit / (loss) for the period 90,118 129,371 181,708
Items reclassifiable to the income statement
Change in the fair value of derivatives for the period 908 1,694 5,342
Tax effect related to the other reclass i fiable i tems of the
comprehens ive income s tatement(251) (490) (1,681)
Other components of OCI ‐ investments accounted for
with equi ty method 21 89 435
Items not reclassifiable to the income statement
Actuaria l gains/(losses) post‐employment benefi ts (28) (7,024)
Tax effect related to the other not reclass i fiable i tems of
the comprehens ive income s tatement1,722
Other components of OCI ‐ investments accounted for
with equi ty method (9)
Total comprehensive income/(loss) for the period 90,768 130,664 180,493
Attributable to:
Shareholders of the Parent Company 84,692 124,373 162,988
Non‐control l ing interests 6,076 6,291 17,505
thousands of euros31 March 2014
(3 months)
31 December 2013
(12 months)
adjusted
31 March 2013
(3 months)
adjusted

Hera Group –Consolidated quarterly report at 31 March 2014
Approved by Hera Spa’s Board of Directors in the meeting of 14 May 2014 34
2.01.03 Earnings per share
thousands of euros
Profit (loss) for the period attributable to the shareholders of
the parent company (A)83,215 123,480 164,934
Interest expense related to the debt component of convertible
bonds 599 1,824
Adjusted profit (loss) for the period attributable to the
shareholders of the parent company (B)83,215 124,079 166,758
Weighted average shares outstanding to calculate earnings
(loss) per share:
‐ basic (C) 1,410,793,744 1,326,786,645 1,349,443,805
‐ diluted (D) 1,410,793,744 1,407,993,142 1,411,280,502
Earnings (loss) per share (in euros)
‐ basic (A/C) 0.059 0.093 0.122
‐ diluted (B/D) 0.059 0.088 0.118
31 March 2014
(3 months)
31 March 2013
(3 months)
adjusted
31 December 2013
(12 months)
adjusted

Hera Group –Consolidated quarterly report at 31 March 2014
Approved by Hera Spa’s Board of Directors in the meeting of 14 May 2014 35
2.01.04 Statement of financial position
thousands of euros 31‐Mar‐2014 31‐Dec‐2013
adjusted*
ASSETS
Non‐current assets
Property,plant and equipment 2,085,559 2,104,981
Intangible assets 2,560,587 2,529,962
Property investments 2,972 2,999
Goodwi l l 378,564 378,564
Non‐control l ing interests 161,050 170,271
Financia l assets 45,985 52,640
Deferred tax assets 156,236 149,028
Financia l ins truments ‐ derivatives 65,148 37,560
Total non‐current assets 5,456,101 5,426,005
Current assets
Inventories 31,869 77,512
Trade receivables 1,628,223 1,357,196
Contract work in progress 21,568 22,830
Financia l assets 78,420 84,851
Financia l ins truments ‐ derivatives 18,776 11,385
Current tax assets 23,349 29,143
Other current assets 290,654 231,165
Cash and cash equiva lents 836,248 926,933
Total current assets 2,929,107 2,741,015
Non‐current assets held for sale 3,300
TOTAL ASSETS 8,385,208 8,170,320

Hera Group –Consolidated quarterly report at 31 March 2014
Approved by Hera Spa’s Board of Directors in the meeting of 14 May 2014 36
* The comparative data were adjusted to reflect the changes outlined in the paragraph “Adjustment summary” in the
explanatory notes.
thousands of euros 31‐Mar‐2014 31‐Dec‐2013
adjusted*
SHAREHOLDERS' EQUITY AND LIABILITIES
Share capital and reserves
Share capita l 1,412,917 1,410,357
Reserves 751,720 585,115
Profi t / (loss ) for the period 83,215 164,934
Group equity 2,247,852 2,160,406
Non‐control l ing interests 151,310 145,317
Total equity 2,399,162 2,305,723
Non‐current liabilities
Borrowings – maturing beyond 12 months 3,109,455 3,267,422
Post‐employment benefi ts 144,727 144,924
Provis ions for ri sks and charges 317,693 314,871
Deferrred tax l i abi l i ties 73,599 74,500
Finance lease payments ‐ maturing beyond 12 months 15,023 15,527
Financia l ins truments ‐ derivatives 30,862 30,321
Total non‐current liabilities 3,691,359 3,847,565
Current liabilities
Banks and other borrowings – maturing within 12 months 412,574 361,874
Finance lease payments ‐ maturing within 12 months 1,961 1,972
Trade payables 1,174,523 1,167,920
Current tax l iabi l i ties 57,474 5,946
Other current l i abi l i ties 618,802 463,999
Financia l ins truments ‐ derivatives 29,353 15,321
Total current liabilities 2,294,687 2,017,032
TOTAL LIABILITIES 5,986,046 5,864,597
TOTAL EQUITY AND LIABILITIES 8,385,208 8,170,320
Hera Group –Consolidated quarterly report at 31 March 2014
Approved by Hera Spa’s Board of Directors in the meeting of 14 May 2014 37
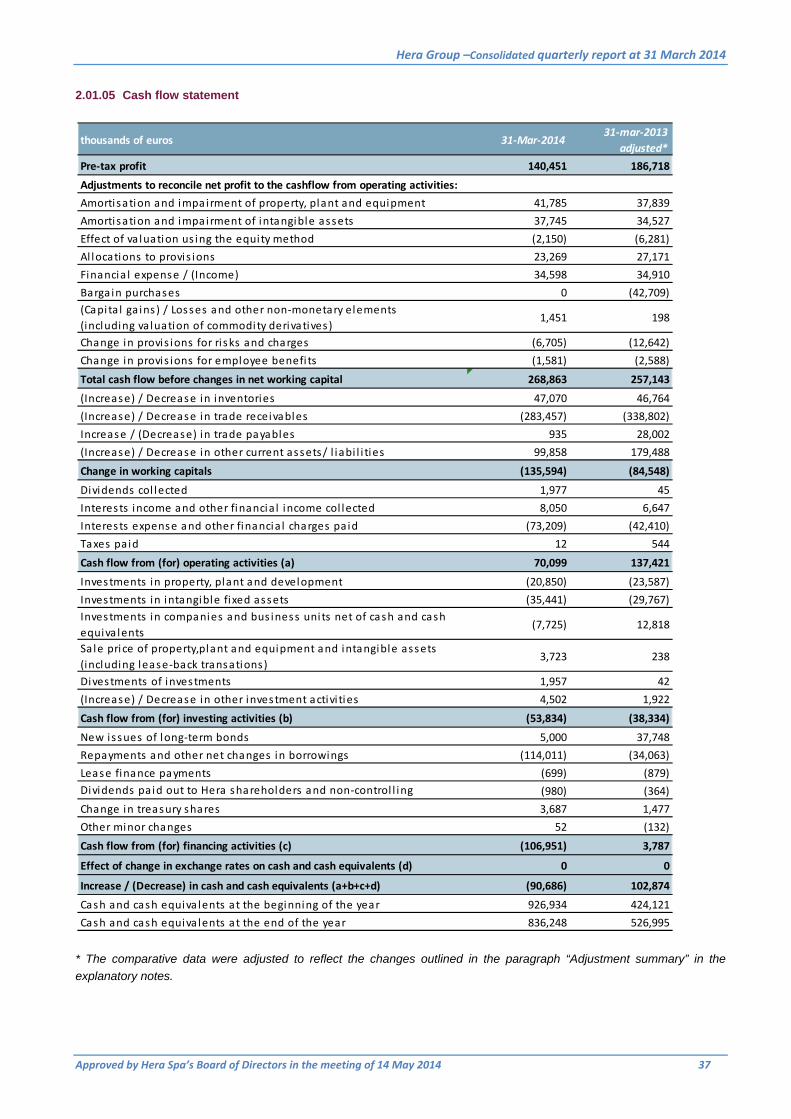
2.01.05 Cash flow statement
* The comparative data were adjusted to reflect the changes outlined in the paragraph “Adjustment summary” in the
explanatory notes.
thousands of euros 31‐Mar‐201431‐mar‐2013
adjusted*
Pre‐tax profit 140,451 186,718
Adjustments to reconcile net profit to the cashflow from operating activities:
Amortisation and impairment of property, plant and equipment 41,785 37,839
Amortisation and impairment of intangible assets 37,745 34,527
Effect of va luation us ing the equity method (2,150) (6,281)
Al locations to provis ions 23,269 27,171
Financia l expense / (Income) 34,598 34,910
Barga in purchases 0 (42,709)
(Capi ta l ga ins ) / Losses and other non‐monetary elements
(including valuation of commodity derivatives )1,451 198
Change in provis ions for ri sks and charges (6,705) (12,642)
Change in provis ions for employee benefi ts (1,581) (2,588)
Total cash flow before changes in net working capital 268,863 257,143
(Increase) / Decrease in inventories 47,070 46,764
(Increase) / Decrease in trade receivables (283,457) (338,802)
Increase / (Decrease) in trade payables 935 28,002
(Increase) / Decrease in other current assets/ l iabi l i ties 99,858 179,488
Change in working capitals (135,594) (84,548)
Dividends col lected 1,977 45
Interests income and other financia l income col lected 8,050 6,647
Interests expense and other financia l charges paid (73,209) (42,410)
Taxes paid 12 544
Cash flow from (for) operating activities (a) 70,099 137,421
Investments in property, plant and development (20,850) (23,587)
Investments in intangible fixed assets (35,441) (29,767)
Investments in companies and bus iness units net of cash and cash
equiva lents(7,725) 12,818
Sa le price of property,plant and equipment and intangible assets
(including lease‐back transations)3,723 238
Divestments of investments 1,957 42
(Increase) / Decrease in other investment activi ties 4,502 1,922
Cash flow from (for) investing activities (b) (53,834) (38,334)
New i s sues of long‐term bonds 5,000 37,748
Repayments and other net changes in borrowings (114,011) (34,063)
Lease finance payments (699) (879)
Dividends paid out to Hera shareholders and non‐control l ing (980) (364)
Change in treasury shares 3,687 1,477
Other minor changes 52 (132)
Cash flow from (for) financing activities (c) (106,951) 3,787
Effect of change in exchange rates on cash and cash equivalents (d) 0 0
Increase / (Decrease) in cash and cash equivalents (a+b+c+d) (90,686) 102,874
Cash and cash equiva lents at the beginning of the year 926,934 424,121
Cash and cash equiva lents at the end of the year 836,248 526,995
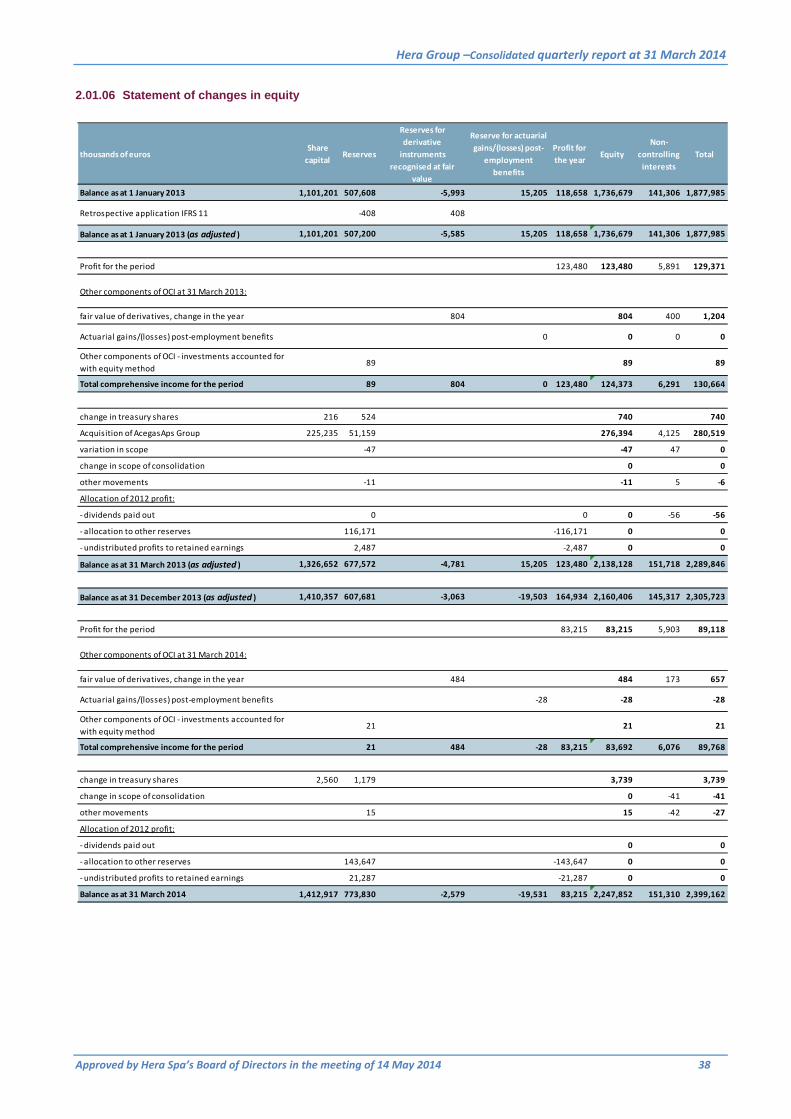
Hera Group –Consolidated quarterly report at 31 March 2014
Approved by Hera Spa’s Board of Directors in the meeting of 14 May 2014 38
2.01.06 Statement of changes in equity
thousands of eurosShare
capitalReserves
Reserves for
derivative
instruments
recognised at fair
value
Reserve for actuarial
gains/(losses) post‐
employment
benefits
Profit for
the yearEquity
Non‐
controlling
interests
Total
Balance as at 1 January 2013 1,101,201 507,608 ‐5,993 15,205 118,658 1,736,679 141,306 1,877,985
Retrospective application IFRS 11 ‐408 408
Balance as at 1 January 2013 (as adjusted ) 1,101,201 507,200 ‐5,585 15,205 118,658 1,736,679 141,306 1,877,985
Profit for the period 123,480 123,480 5,891 129,371
Other components of OCI at 31 March 2013:
fair value of derivatives, change in the year 804 804 400 1,204
Actuarial gains/(losses) post‐employment benefits 0 0 0 0
Other components of OCI ‐ investments accounted for
with equity method 89 89 89
Total comprehensive income for the period 89 804 0 123,480 124,373 6,291 130,664
change in treasury shares 216 524 740 740
Acquisition of AcegasAps Group 225,235 51,159 276,394 4,125 280,519
variation in scope ‐47 ‐47 47 0
change in scope of consolidation 0 0
other movements ‐11 ‐11 5 ‐6
Allocation of 2012 profit:
‐ dividends paid out 0 0 0 ‐56 ‐56
‐ allocation to other reserves 116,171 ‐116,171 0 0
‐ undistributed profits to retained earnings 2,487 ‐2,487 0 0
Balance as at 31 March 2013 (as adjusted ) 1,326,652 677,572 ‐4,781 15,205 123,480 2,138,128 151,718 2,289,846
Balance as at 31 December 2013 (as adjusted ) 1,410,357 607,681 ‐3,063 ‐19,503 164,934 2,160,406 145,317 2,305,723
Profit for the period 83,215 83,215 5,903 89,118
Other components of OCI at 31 March 2014:
fair value of derivatives, change in the year 484 484 173 657
Actuarial gains/(losses) post‐employment benefits ‐28 ‐28 ‐28
Other components of OCI ‐ investments accounted for
with equity method 21 21 21
Total comprehensive income for the period 21 484 ‐28 83,215 83,692 6,076 89,768
change in treasury shares 2,560 1,179 3,739 3,739
change in scope of consolidation 0 ‐41 ‐41
other movements 15 15 ‐42 ‐27
Allocation of 2012 profit:
‐ dividends paid out 0 0
‐ allocation to other reserves 143,647 ‐143,647 0 0
‐ undistributed profits to retained earnings 21,287 ‐21,287 0 0
Balance as at 31 March 2014 1,412,917 773,830 ‐2,579 ‐19,531 83,215 2,247,852 151,310 2,399,162
Hera Group –Consolidated quarterly report at 31 March 2014
Approved by Hera Spa’s Board of Directors in the meeting of 14 May 2014 39
2.02 Explanatory notes
Accounting policies and significant accounting estimates
The consolidated quarterly report for the three months to 31 March 2014 was prepared in accordance with Article 154‐ter
of Legislative Decree 58/1998 and Article 82 of Consob’s Regulation on Issuers. This report has not been audited.
This interim report was not prepared in accordance with IAS 34 - Interim Financial Reporting. However, the accounting
standards adopted for this report are the same as those used to prepare the consolidated financial statements for the year
ended 31 December 2013, to which reference is made for further information, in addition to those applicable as of 1
January 2014.
The preparation of this interim report requires estimates and assumptions to be made concerning the value of revenues,
costs, assets and liabilities and disclosures relating to contingent assets and liabilities at the reporting date. If, in future,
such estimates and assumptions, which are based on the management's best judgment, should differ from actual events,
they will be adjusted accordingly in order to give a true representation of the results of operations.
It should also be noted that some measurement methods, particularly the more complex methods, such as detecting any
impairment of non‐current assets, are generally applied only during the preparation of the annual financial statements,
unless there are indications of impairment which require an immediate impairment test.
Income taxes are recognised based on the best estimate of the weighted average rate for the entire financial year.
The disclosures contained in this interim report are comparable with those for prior periods.
When comparing the individual items in the income statement and the statement of financial position, account should be
taken of the change in the scope of consolidation and the reclassification summaries described in those sections.
Financial statements
The financial statements used are the same as those used for the consolidated financial statements at 31 December 2013.
Specifically, the income statement is presented in vertical format, with the individual items analysed by nature. This
presentation, also used by the company's major competitors, is considered consistent with international practice and is the
one that best represents the company's performance.
The statement of financial position shows the distinction between current and non-current assets and liabilities.
The comprehensive income statement reports separately income and expenses arising from transactions with “non-
shareholders”, distinguishing between items that might be recycled subsequently to profit or loss and those that will not be
recycled subsequently to profit or loss. These changes are also reported separately in the statement of changes in
consolidated equity.
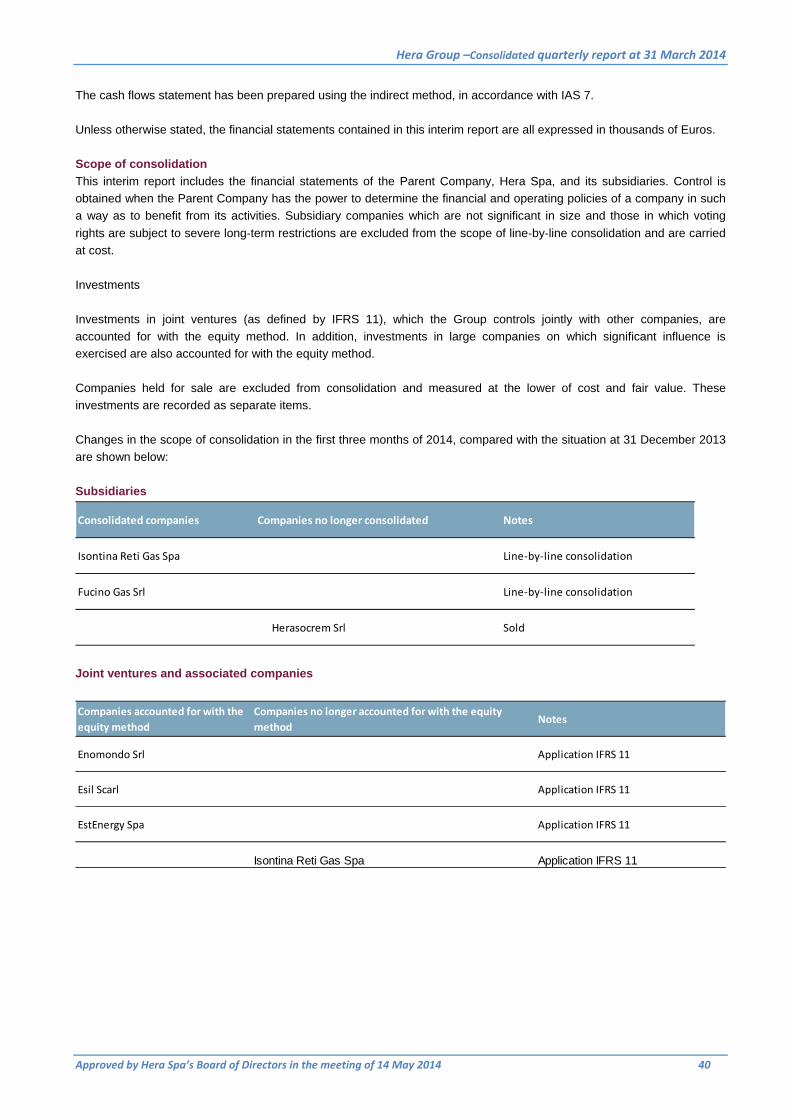
Hera Group –Consolidated quarterly report at 31 March 2014
Approved by Hera Spa’s Board of Directors in the meeting of 14 May 2014 40
The cash flows statement has been prepared using the indirect method, in accordance with IAS 7.
Unless otherwise stated, the financial statements contained in this interim report are all expressed in thousands of Euros.
Scope of consolidation
This interim report includes the financial statements of the Parent Company, Hera Spa, and its subsidiaries. Control is
obtained when the Parent Company has the power to determine the financial and operating policies of a company in such
a way as to benefit from its activities. Subsidiary companies which are not significant in size and those in which voting
rights are subject to severe long‐term restrictions are excluded from the scope of line‐by‐line consolidation and are carried
at cost.
Investments
Investments in joint ventures (as defined by IFRS 11), which the Group controls jointly with other companies, are
accounted for with the equity method. In addition, investments in large companies on which significant influence is
exercised are also accounted for with the equity method.
Companies held for sale are excluded from consolidation and measured at the lower of cost and fair value. These
investments are recorded as separate items.
Changes in the scope of consolidation in the first three months of 2014, compared with the situation at 31 December 2013
are shown below:
Subsidiaries
Joint ventures and associated companies
Consolidated companies Companies no longer consolidated Notes
Isontina Reti Gas Spa Line‐by‐line consolidation
Fucino Gas Srl Line‐by‐line consolidation
Herasocrem Srl Sold
Companies accounted for with the
equity method
Companies no longer accounted for with the equity
methodNotes
Enomondo Srl Application IFRS 11
Esil Scarl Application IFRS 11
EstEnergy Spa Application IFRS 11
Isontina Reti Gas Spa Application IFRS 11
Hera Group –Consolidated quarterly report at 31 March 2014
Approved by Hera Spa’s Board of Directors in the meeting of 14 May 2014 41
On 24 January 2014 AcegasAps S.p.A. acquired the 50% equity interest held by Eni S.p.A. in Isontina Reti Gas S.p.A.,
thus becoming the company’s sole shareholder.
On 6 February 2014, Hera Comm S.r.l. purchased Fucino Gas S.r.l.
On 18 March 2014 Hera S.p.A. sold its 51% stake in Herasocrem S.r.l. to the minority shareholder Socrembologna S.r.l..
The companies included in the scope of consolidation are listed at the end of these notes.
Summary adjustment
As of 1 January 2014 the Group applies IFRS 11 “Joint Arrangements”, introduced by EU Regulation 1254/2012, which
replaced IAS 31 “Interests in Joint Ventures” and SIC 13 “Jointly Controlled Entities–Non-monetary Contributions by
Venturers”. The new standard draws a distinction between joint operation and joint venture, emphasizing the rights and
obligations of the parties to the arrangement, rather than the legal form of the agreement. In the case of joint ventures, in
particular, proportionate consolidation – which was previously contemplated as an alternative to the equity method of
accounting – has been abolished. This is the most significant change for the Group, considering that as of 1 January 2014
several joint ventures were consolidated with the proportionate method, i.e. Enomondo S.r.l., Esil Scarl, Est Energy S.p.A..
Given that these changes are applicable retrospectively, as required by IAS 8 “Accounting policies, changes in accounting
estimates and errors”, the income statement and cash flow statement for the three months ended 31 March 2013 were
restated, as were the income statement and the statement of financial position for the year ended 31 December 2013.
Thus, the restated consolidated financial statements do not include the joint ventures (including those that exited the scope
of consolidation in previous periods); in addition, intercompany transactions with these companies were not eliminated
while investments in them were accounted for with the equity method, recognizing the share of profit (loss) attributable to
them under “Share of profits (losses) of joint ventures and associated companies”.
In addition, the income statement for the first quarter of 2013 was recast on a pro forma basis to reflect the amount of
“Other non-operating, non-recurring income” reported at 31 December 2013 to account for the business combination with
the AcegasAps Group, which was still under way at 31 March 2013. The effects of the business combination were
incorporated also in the cash flow statement. For more details of the process to determine the fair value of the assets and
liabilities purchased, reference is made to the consolidated financial statements for the year ended 31 December 2013.
The restated financial statements are shown below.

Hera Group –Consolidated quarterly report at 31 March 2014
Approved by Hera Spa’s Board of Directors in the meeting of 14 May 2014 42
Restated income statement for the three months ended 31 March 2013
thousands of euros
adjustments
IFRS 11
Revenue 1,450,827 (57,736) 1,393,091
Other operating revenues 48,583 120 48,703
Use of raw materials and consumables (834,493) 37,974 (796,519)
Service costs (251,000) 7,961 (243,039)
Personnel costs (124,075) 1,043 (123,032)
Amortisation, depreciation,provisions (99,694) 1,220 (98,474)
Other operating costs (11,399) 221 (11,178)
Capitalised costs 3,086 0 3,086
Operating profit 181,835 (9,197) 172,638
Share of profit (losses) of joint ventures and associated com 1,759 4,522 6,281
Financial income 22,729 (94) 22,635
Financial expense (58,768) 1,223 (57,545)
Total financial operations (34,280) 5,651 (28,629)
Other non‐recurring non‐operating income 73,810 (31,101) 42,709
Pre‐tax profit 221,365 (3,546) (31,101) 186,718
Taxes for the period (60,893) 3,546 (57,347)
Net profit for the period 160,472 0 (31,101) 129,371
Attributable to:
Shareholders of the Parent Company 154,581 (31,101) 123,480
Non‐controlling interests 5,891 0 5,891
Earnings per share
basic 0.117 0.093
diluted 0.110 0.088
pro forma
IFRS 3
31 March
2013
(3 months)
rettificato
31 March
2014
(3 months)
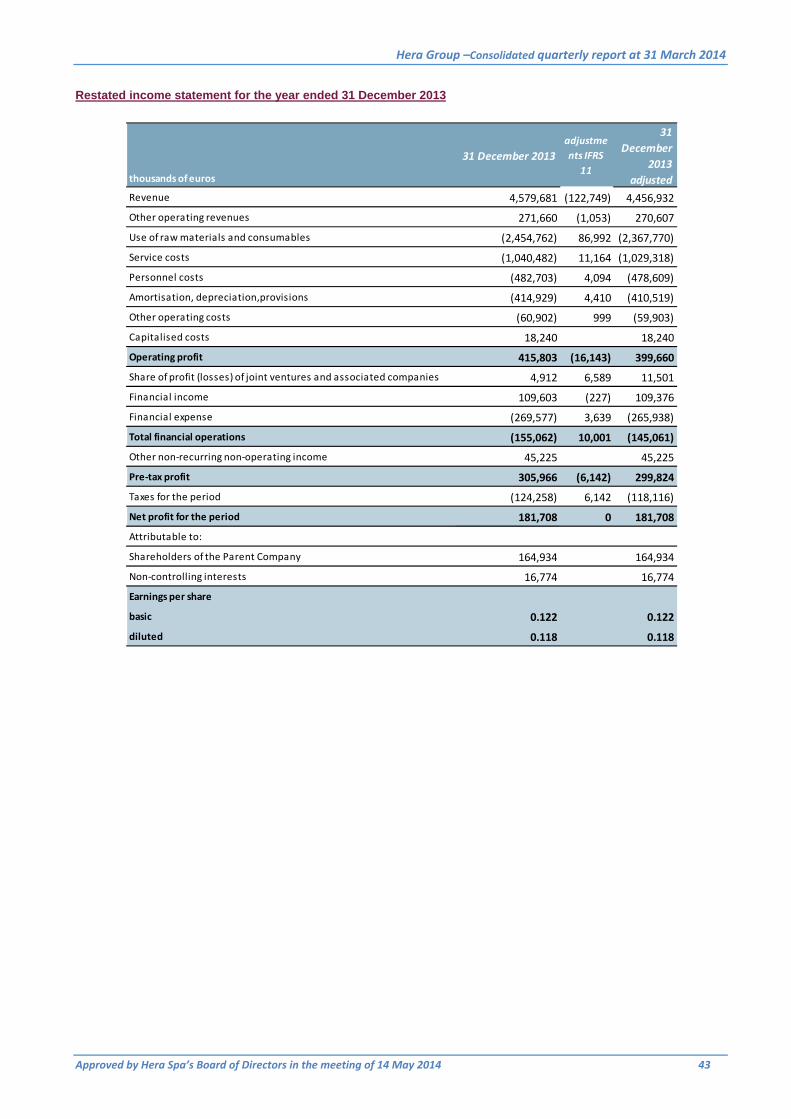
Hera Group –Consolidated quarterly report at 31 March 2014
Approved by Hera Spa’s Board of Directors in the meeting of 14 May 2014 43
Restated income statement for the year ended 31 December 2013
thousands of euros
31 December 2013
adjustme
nts IFRS
11
31
December
2013
adjusted
Revenue 4,579,681 (122,749) 4,456,932
Other operating revenues 271,660 (1,053) 270,607
Use of raw materials and consumables (2,454,762) 86,992 (2,367,770)
Service costs (1,040,482) 11,164 (1,029,318)
Personnel costs (482,703) 4,094 (478,609)
Amortisation, depreciation,provisions (414,929) 4,410 (410,519)
Other operating costs (60,902) 999 (59,903)
Capitalised costs 18,240 18,240
Operating profit 415,803 (16,143) 399,660
Share of profit (losses) of joint ventures and associated companies 4,912 6,589 11,501
Financial income 109,603 (227) 109,376
Financial expense (269,577) 3,639 (265,938)
Total financial operations (155,062) 10,001 (145,061)
Other non‐recurring non‐operating income 45,225 45,225
Pre‐tax profit 305,966 (6,142) 299,824
Taxes for the period (124,258) 6,142 (118,116)
Net profit for the period 181,708 0 181,708
Attributable to:
Shareholders of the Parent Company 164,934 164,934
Non‐controlling interests 16,774 16,774
Earnings per share
basic 0.122 0.122
diluted 0.118 0.118

Hera Group –Consolidated quarterly report at 31 March 2014
Approved by Hera Spa’s Board of Directors in the meeting of 14 May 2014 44
Restated statement of financial position as of 31 December 2013
thousands of euros Adjustments
31
December
2013
IFRS 1 Adjusted
ASSETS
Non‐current assets
Property,plant and equipment 2,129,221 (24,240) 2,104,981
Intangible assets 2,546,160 (16,198) 2,529,962
Property investments 2,999 2,999
Goodwi l l 378,564 378,564
Investments 140,114 30,157 170,271
Financia l assets 52,640 52,640
Deferred tax assets 152,006 (2,978) 149,028
Financia l ins truments ‐ derivatives 37,560 37,560
Total non‐current assets 5,439,264 (13,259) 5,426,005
Current assets
Inventories 77,813 (301) 77,512
Trade receivables 1,397,839 (40,643) 1,357,196
Contract work in progress 22,835 (5) 22,830
Financia l assets 72,229 12,622 84,851
Financia l ins truments ‐ derivatives 11,385 11,385
Current tax assets 29,919 (776) 29,143
Other current assets 237,246 (6,081) 231,165
Cash and cash equiva lents 942,347 (15,414) 926,933
Total current assets 2,791,613 (50,598) 2,741,015
Non‐current assets held for sale 3,300 3,300
TOTAL ASSETS 8,234,177 (63,857) 8,170,320
31
December
2013

Hera Group –Consolidated quarterly report at 31 March 2014
Approved by Hera Spa’s Board of Directors in the meeting of 14 May 2014 45
thousands of euros Adjustments
31
December
2013
IFRS 1 Adjusted
EQUITY AND LIABILITIES
Share capital and reserves
Share capita l 1,410,357 1,410,357
Reserves 585,115 585,115
Profi t / (loss ) for the period 164,934 164,934
Equity attributable to parent company's shareholders 2,160,406 2,160,406
Non‐control l ing interests 145,317 145,317
Total equity 2,305,723 2,305,723
Non‐current liabilities
Borrowings – maturing beyond 12 months 3,277,462 (10,040) 3,267,422
Post‐employment benefi ts 145,355 (431) 144,924
Provis ions for ri sks and charges 315,067 (196) 314,871
Deferrred tax l iabi l i ties 74,716 (216) 74,500
Finance lease payments ‐ maturing beyond 12 months 15,527 15,527
Financia l ins truments ‐ derivatives 30,828 (507) 30,321
Total non‐current liabilities 3,858,955 (11,390) 3,847,565
Current liabilities
Banks and other borrowings – maturing within 12 months 383,181 (21,307) 361,874
Finance lease payments ‐ maturing within 12 months 1,972 1,972
Trade payables 1,192,426 (24,506) 1,167,920
Current tax l iabi l i ties 6,722 (776) 5,946
Other current l iabi l i ties 469,877 (5,878) 463,999
Financia l ins truments ‐ derivatives 15,321 15,321
Total current liabilities 2,069,499 (52,467) 2,017,032
TOTAL LIABILITIES 5,928,454 (63,857) 5,864,597
TOTAL EQUITY AND LIABILITIES 8,234,177 (63,857) 8,170,320
31
December
2013
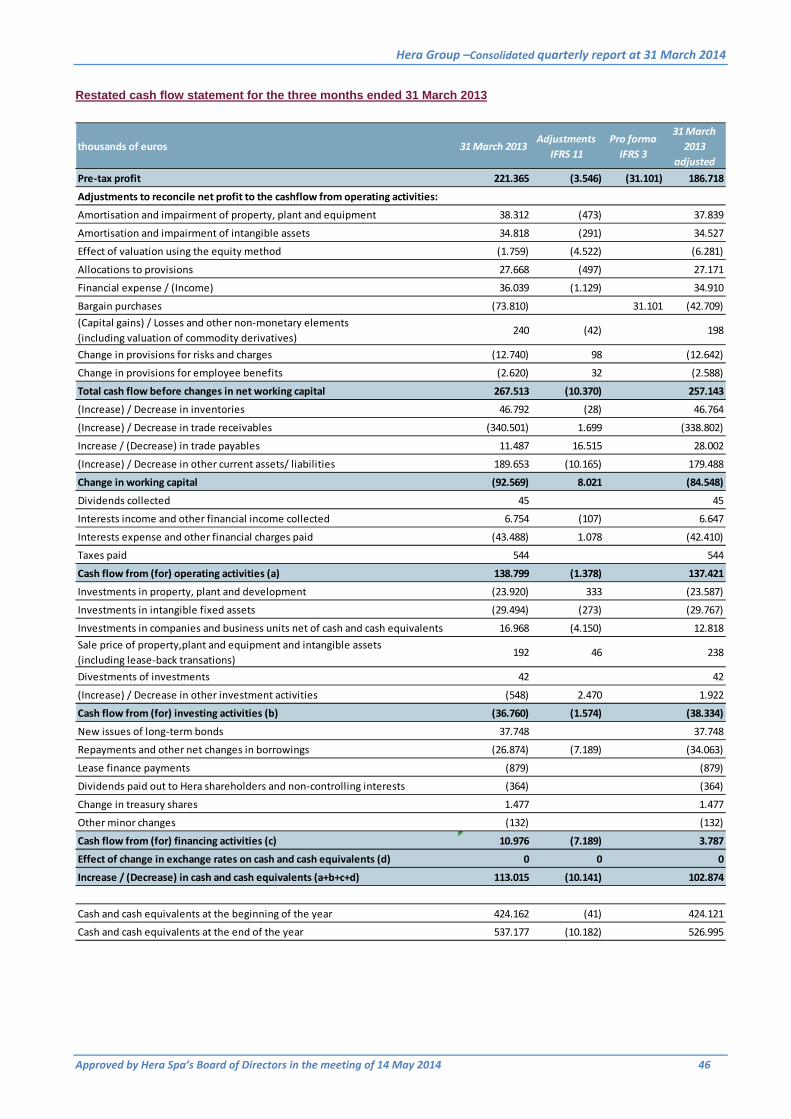
Hera Group –Consolidated quarterly report at 31 March 2014
Approved by Hera Spa’s Board of Directors in the meeting of 14 May 2014 46
Restated cash flow statement for the three months ended 31 March 2013
thousands of euros 31 March 2013Adjustments
IFRS 11
Pro forma
IFRS 3
31 March
2013
adjusted
Pre‐tax profit 221.365 (3.546) (31.101) 186.718
Adjustments to reconcile net profit to the cashflow from operating activities:
Amortisation and impairment of property, plant and equipment 38.312 (473) 37.839
Amortisation and impairment of intangible assets 34.818 (291) 34.527
Effect of valuation using the equity method (1.759) (4.522) (6.281)
Allocations to provisions 27.668 (497) 27.171
Financial expense / (Income) 36.039 (1.129) 34.910
Bargain purchases (73.810) 31.101 (42.709)
(Capital gains) / Losses and other non‐monetary elements
(including valuation of commodity derivatives)240 (42) 198
Change in provisions for risks and charges (12.740) 98 (12.642)
Change in provisions for employee benefits (2.620) 32 (2.588)
Total cash flow before changes in net working capital 267.513 (10.370) 257.143
(Increase) / Decrease in inventories 46.792 (28) 46.764
(Increase) / Decrease in trade receivables (340.501) 1.699 (338.802)
Increase / (Decrease) in trade payables 11.487 16.515 28.002
(Increase) / Decrease in other current assets/ liabilities 189.653 (10.165) 179.488
Change in working capital (92.569) 8.021 (84.548)
Dividends collected 45 45
Interests income and other financial income collected 6.754 (107) 6.647
Interests expense and other financial charges paid (43.488) 1.078 (42.410)
Taxes paid 544 544
Cash flow from (for) operating activities (a) 138.799 (1.378) 137.421
Investments in property, plant and development (23.920) 333 (23.587)
Investments in intangible fixed assets (29.494) (273) (29.767)
Investments in companies and business units net of cash and cash equivalents 16.968 (4.150) 12.818
Sale price of property,plant and equipment and intangible assets
(including lease‐back transations)192 46 238
Divestments of investments 42 42
(Increase) / Decrease in other investment activities (548) 2.470 1.922
Cash flow from (for) investing activities (b) (36.760) (1.574) (38.334)
New issues of long‐term bonds 37.748 37.748
Repayments and other net changes in borrowings (26.874) (7.189) (34.063)
Lease finance payments (879) (879)
Dividends paid out to Hera shareholders and non‐controlling interests (364) (364)
Change in treasury shares 1.477 1.477
Other minor changes (132) (132)
Cash flow from (for) financing activities (c) 10.976 (7.189) 3.787
Effect of change in exchange rates on cash and cash equivalents (d) 0 0 0
Increase / (Decrease) in cash and cash equivalents (a+b+c+d) 113.015 (10.141) 102.874
Cash and cash equivalents at the beginning of the year 424.162 (41) 424.121
Cash and cash equivalents at the end of the year 537.177 (10.182) 526.995

Hera Group –Consolidated quarterly report at 31 March 2014
Approved by Hera Spa’s Board of Directors in the meeting of 14 May 2014 47
Other information
These interim financial statements for the three months ended 31 March 2014 were prepared by the Board of Directors
and approved by it in the meeting of 14 May 2014.

Hera Group –Consolidated quarterly report at 31 March 2014
Approved by Hera Spa’s Board of Directors in the meeting of 14 May 2014 48
2.03 Consolidated net borrowings
millions of euro 31 March 201331 December 2013
as adjusted
a Cash 836.3 926.9
b Other current financial receivables 78.4 84.9
Short‐term bank borrowings (102.2) (227.6)
Current portion of bank borrowings (284.6) (110.5)
Other current borrowings (25.8) (23.7)
Finance lease payments ‐ due within 12 months (2.0) (2.0)
c Current borrowings (414.6) (363.8)
d=a+b+c Net current borrowings 500.1 648.0
e Non‐current financial receivables 46.0 52.6
Non‐current bank borrowings and bonds issued (3,063.9) (3,243.3)
Other non‐current borrowings (7.5) (8.5)
Finance lease payments ‐ due beyond 12 months (15.0) (15.5)
f Non‐current borrowings (3,086.4) (3,267.3)
g=e+f Net non‐current borrowings (3,040.4) (3,214.7)
h=d+g Net borrowings (2,540.3) (2,566.7)

Hera Group –Consolidated quarterly report at 31 March 2014
Approved by Hera Spa’s Board of Directors in the meeting of 14 May 2014 49
2.04 Investments
Subsidiaries
Name Registered office Share capitalTotal equity
investment
direct indi rect
Parent company: Hera Spa Bologna 1,421,342,617
Acantho S.p.A. Imola (BO) 23,573,079 77.36% 77.36%
AcegasAps Spa Trieste 283,690,763 100.00% 100.00%
AcegasAps Service Srl Padua 180,000 100.00% 100.00%
Akron Spa Imola (BO) 1,152,940 43.13% 43.13%
ASA Scpa Castelmaggiore (BO) 1,820,000 38.25% 38.25%
Consorzio Akhea Fondo Consorti le Bologna 200,000 59.38% 59.38%
CST Srl Pordenone 104,000 100.00% 100.00%
Est Reti Elettriche Spa Gorizia 17,450,000 100.00% 100.00%
Feronia Srl Finale Emi l ia (MO) 2,430,000 52.50% 52.50%
Fucino Gas Srl Luco dei Mars i (AQ) 10,000 100.00% 100.00%
Frul lo Energia Ambiente Srl Bologna 17,139,100 38.25% 38.25%
HeraAmbiente Spa Bologna 271,148,000 75.00% 75.00%
Hera Comm Srl Imola (BO) 53,136,987 100.00% 100.00%
Hera Comm Marche Srl Urbino (PU) 1,977,332 70.54% 70.54%
Hera Energie Srl Bologna 926,000 51.00% 51.00%
Hera Energie Rinnovabi l i Spa Bologna 1,832,000 100.00% 100.00%
Hera Luce Srl San Mauro Pascol i (FC) 1,000,000 89.58% 89.58%
Hera Trading Srl Trieste 22,600,000 100.00% 100.00%
Iniziative Ambiental i Srl Padua 110,000 100.00% 100.00%
Ins igna Srl Padua 10,000 100.00% 100.00%
Isontina Reti Gas Spa Gradisca D'Isonzo (GO) 17,450,000 100.00% 100.00%
Marche Multi servizi Spa Pesaro 13,484,242 44.62% 44.62%
Medea Spa Sassari 4,500,000 100.00% 100.00%
MMS Ecologica Srl Pesaro 95,000 44.62% 44.62%
Naturambiente Srl Pesaro 50,000 44.62% 44.62%
Herambiente Servizi Industria l i Srl Bologna 1,748,472 75.00% 75.00%
Ri la Gas AD Sofia (Bulgaria) 33.337.000 lev 100.00% 100.00%
Romagna Compost Srl Cesena 3,560,002 45.00% 45.00%
SiGas d.o.o Pozega (Serbia ) 162.260.057,70 RSD 95.78% 95.78%
Sinergia Srl Forl ì 579,600 59.00% 59.00%
Sinergie Spa Padua 11,168,284 100.00% 100.00%
Società Ita l iana Lining Srl Padua 90,000 100.00% 100.00%
Sotris Spa Ravenna 2,340,000 5.00% 52.50% 57.50%
Svi luppo Ambiente Toscana Srl Bologna 10,000 95.00% 3.75% 98.75%
Trieste Onoranze e Trasporti Funebri Srl Trieste 50,000 100.00% 100.00%
Tri ‐Generazione Srl Padua 100,000 70.00% 70.00%
Uniflotte Srl Bologna 2,254,177 97.00% 97.00%
* Paid‐in capita l of Trigenerazione Srl amounts to €25,000
Jointly controlled associated companies
Name Registered office Share capitalTotal equity
investment
direct indi rect
E.S.I.L Scarl Bologna 10,000 44.79% 44.79%
Enomondo S.r.l . Faenza (RA) 14,000,000 37.50% 37.50%
EstEnergy Spa Trieste 1,718,096 51.00% 51.00%
Associated companies
Name Registered office Share capitalTotal equity
investment
direct indi rect
Aimag Spa Mirandola (MO) 78,027,681 25.00% 25.00%
Elettrogorizia Spa Trieste 5,600,000 33.00% 33.00%
FlameEnergy Trading Gmbh in l iquidation Vienna 3,000,000 50.00% 50.00%
Ghirlandina Solare Srl Concordia Sul la Secchia (MO) 60,000 33.00% 33.00%
Q.Thermo Srl Florence 10,000 39.50% 39.50%
Set Spa Mi lan 120,000 39.00% 39.00%
So.Sel Spa Modena 240,240 26.00% 26.00%
Sgr Servizi Spa Rimini 5,982,262 29.61% 29.61%
Tamarete Energia Srl Ortona (CH) 3,600,000 40.00% 40.00%
* the Aimag's share capita l i s composed of € 67,577,681 ordinary shares and € 10,450,000 of related shares
% held
% held
% held

HERA S.p.A. Holding Energia Risorse Ambiente Sede legale: Viale Carlo Berti Pichat 2/4 40127 Bologna tel. 051.287.111 fax 051.287.525 www.gruppohera.it
Related Documents