QUARTERLY PERFORMANCE REPORTS: 2014/15 - 2nd Quarter EASTERN CAPE Sector: Health Programme / Subprogramme / Performance Measures Target for 2014/15 as per Annual Performance Plan (APP) 1st Quarter Planned output as per APP 1st Quarter Actual output - validated 2nd Quarter Planned output as per APP 2nd Quarter Preliminary output QUARTERLY OUTPUTS Programme 1: Administration Proportion of health facilities connected to the internet - - 0% - 0% Programme 2: District Health Services PHC Utilisation rate 2.8 2.8 2.6 2.8 2.8 OHH registration visit coverage 54.0% 12.0% 145.3% 15.0% 8.8% PHC supervisor visit rate (fixed clinic/CHC/CDC) 91.0% 91.0% 76.5% 91.0% 78.1% Complaint resolution within 25 working days rate 80.0% 80.0% 96.2% 80.0% 95.9% Number of fully fledged District Clinical specialist Teams appointed 3 - - - - Number of fully-fledged Ward Based Outreach Teams appointed 12 3 15 3 7 School ISHP coverage 10.7% 10.7% 36.5% 10.7% 37.8% School Grade 1 screening coverage 22.4% 6.4% 18.0% 10.0% 18.9% School Grade 4 screening coverage 18.1% 6.0% 16.7% 7.1% 28.3% School Grade 8 screening coverage 14.8% 4.0% 7.3% 5.8% 14.4% Percentage of fixed facilities that have conducted gap assessments for compliance against the National 49.0% - 0% - 0% Compliance Rate of PHC Facilities (of National Core Standards) 40.0% 40.0% 0% 40.0% 0% District Hospitals Average Length of Stay 4.9 days 4.9 days 5.2 days 4.9 days 5.2 days Inpatient Bed Utilisation Rate 65.0% 65.0% 57.8% 65.0% 60.9% Expenditure per patient day equivalent (PDE) R 1 380 R 1 380 R 1 943 R 1 380 R 2 008 Complaint Resolution within 25 working days rate 90.0% 90.0% 97.3% 90.0% 102.1% Mental health admission rate - - 0% - 0% Percentage of Hospitals that have conducted gap assessments for compliance against the National 68.2% - 0% - 0% Proportion of hospitals assessed as compliant with the Extreme Measures of National Core Standards 80.0% 80.0% 0% 80.0% 38.5% HIV and AIDS, TB and STI control Total clients remaining on ART (TROA) at end of the month 387 387 18 750 18 187 18 750 12 542 Number of Medical Male Circumcisions conducted 42 000 16 000 379 2 000 237 TB (new pulmonary) defaulter rate 7.0% 7.0% 7.6% 7.0% 8.2% TB AFB sputum result turn-around time under 48 hours rate 73.0% 73.0% 57.5% 73.0% 56.6% TB new client treatment success rate 80.0% 80.0% 77.9% 80.0% 79.4% HIV testing coverage (15-49 Years - Annualised) 49.0% 45.0% 31.2% 47.0% 33.5% TB (new pulmonary) cure rate 75.0% - 0% - 0% TB MDR confirmed treatment initiation rate 100.0% 100.0% 100.0% 100.0% 100.0% Maternal, child and women health Immunisation coverage under 1 year 90.0% 90.0% 76.8% 90.0% 78.4% Vitamin A coverage 12-59 months 55.0% 55.0% 46.1% 55.0% 54.3% Deworming 12-59 months coverage 50.0% 50.0% 40.1% 50.0% 43.6% Child under 2 years underweight for age incidence 0.20 0.20 31.61 0.20 20.13 Measles 1st dose under 1 year coverage 95.0% 95.0% 84.4% 95.0% 85.4% Pneumococcal Vaccine (PCV) 3rd Dose Coverage 90.0% 90.0% 81.1% 90.0% 79.7% Rotavirus (RV) 2nd Dose Coverage 90.0% 90.0% 79.1% 90.0% 85.9% Cervical cancer screening coverage 42.0% 42.0% 46.1% 42.0% 61.3% HPV Vaccine Coverage amongst Grade 4 girls 80.0% 80.0% 82.2% 80.0% 92.7% Antenatal 1st visits before 20 weeks rate 42.0% 42.0% 43.7% 42.0% 48.4% Infant given NVP within 72 hours after birth uptake rate 100.0% 100.0% 101.8% 100.0% 99.8% Infant 1st PCR Test positive around 6 weeks rate 2.8% 2.8% 1.8% 2.8% 1.8% Couple year protection rate 60.0% - 0% - 0% Disease Prevention and Control Hypertension incidence 0.04 0.04 24.50 0.04 20.07 Diabetes incidence 0.00 0.00 7.94 0.00 6.46 Cataract surgery rate (Uninsured Population) 1 050.0 262.5 1 094.6 262.5 1 015.9 Programme 3: Emergency Medical Services EMS operational ambulance coverage 0.50 0.29 0.73 0.48 0.32 EMS P1 urban response under 15 minutes rate 65.0% 65.0% 38.2% 65.0% 41.3% EMS P1 rural response under 40 minutes rate 65.0% 65.0% 44.0% 65.0% 51.3% EMS P1 call response under 60 minutes rate 70.0% 70.0% 65.4% 70.0% 64.6% Programme 4: Provincial Hospital Services General (regional) hospitals Average Length of Stay 4.6 days 4.6 days 5.3 days 4.6 days 4.9 days Inpatient Bed Utilisation Rate 75.0% 75.0% 67.6% 75.0% 69.5% Expenditure per patient day equivalent (PDE) R 2 077 R 2 077 R 2 058 R 2 077 R 2 280 Complaint Resolution within 25 working days rate 80.0% 80.0% 100.0% 80.0% 100.0% Mental health admission rate - - 0% - 0% Percentage of Hospitals that have conducted gap assessments for compliance against the National 100.0% - 0% - 0% Proportion of hospitals assessed as compliant with the Extreme Measures of National Core Standards 80.0% 80.0% 0% 80.0% 0%

Welcome message from author
This document is posted to help you gain knowledge. Please leave a comment to let me know what you think about it! Share it to your friends and learn new things together.
Transcript

QUARTERLY PERFORMANCE REPORTS: 2014/15 - 2nd Quarter
EASTERN CAPE
Sector: Health
Programme / Subprogramme / Performance Measures Target for
2014/15 as per
Annual
Performance
Plan (APP)
1st Quarter
Planned output
as per APP
1st Quarter
Actual output -
validated
2nd Quarter
Planned output
as per APP
2nd Quarter
Preliminary
output
QUARTERLY OUTPUTS
Programme 1: Administration
Proportion of health facilities connected to the internet - - 0% - 0%
Programme 2: District Health Services
PHC Utilisation rate 2.8 2.8 2.6 2.8 2.8
OHH registration visit coverage 54.0% 12.0% 145.3% 15.0% 8.8%
PHC supervisor visit rate (fixed clinic/CHC/CDC) 91.0% 91.0% 76.5% 91.0% 78.1%
Complaint resolution within 25 working days rate 80.0% 80.0% 96.2% 80.0% 95.9%
Number of fully fledged District Clinical specialist Teams appointed 3 - - - -
Number of fully-fledged Ward Based Outreach Teams appointed 12 3 15 3 7
School ISHP coverage 10.7% 10.7% 36.5% 10.7% 37.8%
School Grade 1 screening coverage 22.4% 6.4% 18.0% 10.0% 18.9%
School Grade 4 screening coverage 18.1% 6.0% 16.7% 7.1% 28.3%
School Grade 8 screening coverage 14.8% 4.0% 7.3% 5.8% 14.4%
Percentage of fixed facilities that have conducted gap assessments for compliance against the National 49.0% - 0% - 0%
Compliance Rate of PHC Facilities (of National Core Standards) 40.0% 40.0% 0% 40.0% 0%
District Hospitals
Average Length of Stay 4.9 days 4.9 days 5.2 days 4.9 days 5.2 days
Inpatient Bed Utilisation Rate 65.0% 65.0% 57.8% 65.0% 60.9%
Expenditure per patient day equivalent (PDE) R 1 380 R 1 380 R 1 943 R 1 380 R 2 008
Complaint Resolution within 25 working days rate 90.0% 90.0% 97.3% 90.0% 102.1%
Mental health admission rate - - 0% - 0%
Percentage of Hospitals that have conducted gap assessments for compliance against the National 68.2% - 0% - 0%
Proportion of hospitals assessed as compliant with the Extreme Measures of National Core Standards 80.0% 80.0% 0% 80.0% 38.5%
HIV and AIDS, TB and STI control
Total clients remaining on ART (TROA) at end of the month 387 387 18 750 18 187 18 750 12 542
Number of Medical Male Circumcisions conducted 42 000 16 000 379 2 000 237
TB (new pulmonary) defaulter rate 7.0% 7.0% 7.6% 7.0% 8.2%
TB AFB sputum result turn-around time under 48 hours rate 73.0% 73.0% 57.5% 73.0% 56.6%
TB new client treatment success rate 80.0% 80.0% 77.9% 80.0% 79.4%
HIV testing coverage (15-49 Years - Annualised) 49.0% 45.0% 31.2% 47.0% 33.5%
TB (new pulmonary) cure rate 75.0% - 0% - 0%
TB MDR confirmed treatment initiation rate 100.0% 100.0% 100.0% 100.0% 100.0%
Maternal, child and women health
Immunisation coverage under 1 year 90.0% 90.0% 76.8% 90.0% 78.4%
Vitamin A coverage 12-59 months 55.0% 55.0% 46.1% 55.0% 54.3%
Deworming 12-59 months coverage 50.0% 50.0% 40.1% 50.0% 43.6%
Child under 2 years underweight for age incidence 0.20 0.20 31.61 0.20 20.13
Measles 1st dose under 1 year coverage 95.0% 95.0% 84.4% 95.0% 85.4%
Pneumococcal Vaccine (PCV) 3rd Dose Coverage 90.0% 90.0% 81.1% 90.0% 79.7%
Rotavirus (RV) 2nd Dose Coverage 90.0% 90.0% 79.1% 90.0% 85.9%
Cervical cancer screening coverage 42.0% 42.0% 46.1% 42.0% 61.3%
HPV Vaccine Coverage amongst Grade 4 girls 80.0% 80.0% 82.2% 80.0% 92.7%
Antenatal 1st visits before 20 weeks rate 42.0% 42.0% 43.7% 42.0% 48.4%
Infant given NVP within 72 hours after birth uptake rate 100.0% 100.0% 101.8% 100.0% 99.8%
Infant 1st PCR Test positive around 6 weeks rate 2.8% 2.8% 1.8% 2.8% 1.8%
Couple year protection rate 60.0% - 0% - 0%
Disease Prevention and Control
Hypertension incidence 0.04 0.04 24.50 0.04 20.07
Diabetes incidence 0.00 0.00 7.94 0.00 6.46
Cataract surgery rate (Uninsured Population) 1 050.0 262.5 1 094.6 262.5 1 015.9
Programme 3: Emergency Medical Services
EMS operational ambulance coverage 0.50 0.29 0.73 0.48 0.32
EMS P1 urban response under 15 minutes rate 65.0% 65.0% 38.2% 65.0% 41.3%
EMS P1 rural response under 40 minutes rate 65.0% 65.0% 44.0% 65.0% 51.3%
EMS P1 call response under 60 minutes rate 70.0% 70.0% 65.4% 70.0% 64.6%
Programme 4: Provincial Hospital Services
General (regional) hospitals
Average Length of Stay 4.6 days 4.6 days 5.3 days 4.6 days 4.9 days
Inpatient Bed Utilisation Rate 75.0% 75.0% 67.6% 75.0% 69.5%
Expenditure per patient day equivalent (PDE) R 2 077 R 2 077 R 2 058 R 2 077 R 2 280
Complaint Resolution within 25 working days rate 80.0% 80.0% 100.0% 80.0% 100.0%
Mental health admission rate - - 0% - 0%
Percentage of Hospitals that have conducted gap assessments for compliance against the National 100.0% - 0% - 0%
Proportion of hospitals assessed as compliant with the Extreme Measures of National Core Standards 80.0% 80.0% 0% 80.0% 0%

QUARTERLY PERFORMANCE REPORTS: 2014/15 - 2nd Quarter
EASTERN CAPE
Sector: Health
Programme / Subprogramme / Performance Measures Target for
2014/15 as per
Annual
Performance
Plan (APP)
1st Quarter
Planned output
as per APP
1st Quarter
Actual output -
validated
2nd Quarter
Planned output
as per APP
2nd Quarter
Preliminary
output
QUARTERLY OUTPUTS
Programme 5: Central Hospital Services
Tertiary Hospitals
Average Length of Stay 5.5 days 5.5 days 6.1 days 5.5 days 5.7 days
Inpatient Bed Utilisation Rate 75.0% 75.0% 74.1% 75.0% 76.9%
Expenditure per patient day equivalent (PDE) R 1 923 R 1 900 R 2 644 R 1 900 R 3 157
Complaint Resolution within 25 working days rate 80.0% 80.0% 100.0% 80.0% 100.0%
Mental health admission rate - - 0% - 0%
Percentage of Hospitals that have conducted gap assessments for compliance against the National 100.0% - 0% - 0%
Proportion of hospitals assessed as compliant with the Extreme Measures of National Core Standards 80.0% 100.0% 0% 100.0% 0%
Central Hospitals
Average Length of Stay 5.5 days 5.5 days 7.2 days 5.5 days 7.0 days
Inpatient Bed Utilisation Rate 75.0% 75.0% 91.9% 75.0% 94.1%
Expenditure per patient day equivalent (PDE) R 1 950 R 1 900 R 0 R 1 900 R 0
Complaint Resolution within 25 working days rate 80.0% 80.0% 100.0% 80.0% 100.0%
Mental health admission rate - - 0% - 0%
Percentage of Hospitals that have conducted gap assessments for compliance against the National 100.0% - 0% - 0%
Proportion of hospitals assessed as compliant with the Extreme Measures of National Core Standards 80.0% 80.0% 0% 80.0% 0%
Programme 8: Health Facilities Management
Proportion of Programme 8 budget spent on maintenance (preventative and scheduled) 29.0% 7.3% 14.9% 7.3% 23.6%
Number of districts spending more than 90% of maintenance budget 8 8 8 8 8
1. Information submitted by: Ms. T. Mbengashe Head Official: Health Eastern Cape Tel No (040) 608 1111 Ms. M.T.N. Mbina-Mthembu Head Official: Provincial Treasury Eastern Cape

QUARTERLY PERFORMANCE REPORTS: 2014/15 - 2nd Quarter
FREE STATE
Sector: Health
Programme / Subprogramme / Performance Measures Target for
2014/15 as per
Annual
Performance
Plan (APP)
1st Quarter
Planned output
as per APP
1st Quarter
Actual output -
validated
2nd Quarter
Planned output
as per APP
2nd Quarter
Preliminary
output
QUARTERLY OUTPUTS
Programme 1: Administration
Proportion of health facilities connected to the internet 50.0% 0% 0% 0% 0%
Programme 2: District Health Services
PHC Utilisation rate 3.0 3.0 2.4 3.0 2.5
OHH registration visit coverage 10.9% 10.9% 2.6% 10.9% 2.0%
PHC supervisor visit rate (fixed clinic/CHC/CDC) 85.0% 85.0% 58.5% 85.0% 26.0%
Complaint resolution within 25 working days rate 75.0% 75.0% 92.2% 75.0% 89.2%
Number of fully fledged District Clinical specialist Teams appointed 5 - 5 - 5
Number of fully-fledged Ward Based Outreach Teams appointed 60 - - - -
School ISHP coverage 50.0% 50.0% 70.6% 50.0% 44.1%
School Grade 1 screening coverage 35.5% 35.5% 65.9% 35.5% 35.8%
School Grade 4 screening coverage 47.3% 47.3% 76.0% 47.3% 44.4%
School Grade 8 screening coverage 29.5% 29.5% 15.3% 29.5% 25.3%
Percentage of fixed facilities that have conducted gap assessments for compliance against the National 100.0% 26.6% 22.4% 26.1% 58.6%
Compliance Rate of PHC Facilities (of National Core Standards) 7.5% 0% 0% 0% 0%
District Hospitals
Average Length of Stay 4.0 days 4.0 days 3.4 days 4.0 days 3.2 days
Inpatient Bed Utilisation Rate 70.0% 70.0% 61.5% 70.0% 62.7%
Expenditure per patient day equivalent (PDE) R 2 000 R 2 000 R 2 285 R 2 000 R 1 947
Complaint Resolution within 25 working days rate 75.0% 75.0% 92.8% 75.0% 100.0%
Mental health admission rate 1.0% 1.0% 0.6% 1.0% 0.6%
Percentage of Hospitals that have conducted gap assessments for compliance against the National 100.0% 25.0% 0% 25.0% 12.5%
Proportion of hospitals assessed as compliant with the Extreme Measures of National Core Standards 20.0% 0% 0% 0% 0%
HIV and AIDS, TB and STI control
Total clients remaining on ART (TROA) at end of the month 166 450 142 863 145 703 150 726 151 521
Number of Medical Male Circumcisions conducted 67 268 16 000 7 289 19 268 8 442
TB (new pulmonary) defaulter rate <5% <5% 4.1% <5% 4.1%
TB AFB sputum result turn-around time under 48 hours rate 82.0% 82.0% 79.6% 82.0% 81.1%
TB new client treatment success rate 82.0% 82.0% 82.2% 82.0% 83.3%
HIV testing coverage (15-49 Years - Annualised) 60.0% 60.0% 22.3% 60.0% 18.5%
TB (new pulmonary) cure rate 75.0% 75.0% 75.2% 75.0% 77.1%
TB MDR confirmed treatment initiation rate 90.0% 90.0% 100.0% 90.0% 100.0%
Maternal, child and women health
Immunisation coverage under 1 year 90.0% 90.0% 91.2% 90.0% 82.7%
Vitamin A coverage 12-59 months 60.0% 60.0% 57.5% 60.0% 58.7%
Deworming 12-59 months coverage 60.0% 60.0% 51.9% 60.0% 55.7%
Child under 2 years underweight for age incidence 25.00 25.00 23.76 25.00 22.65
Measles 1st dose under 1 year coverage 90.0% 90.0% 93.0% 90.0% 86.9%
Pneumococcal Vaccine (PCV) 3rd Dose Coverage 90.0% 90.0% 91.5% 90.0% 84.3%
Rotavirus (RV) 2nd Dose Coverage 95.0% 95.0% 96.7% 95.0% 100.2%
Cervical cancer screening coverage 56.0% 56.0% 36.5% 56.0% 34.2%
HPV Vaccine Coverage amongst Grade 4 girls 80.0% 80.0% 81.6% 0% 0%
Antenatal 1st visits before 20 weeks rate 70.0% 70.0% 56.3% 70.0% 58.9%
Infant given NVP within 72 hours after birth uptake rate 100.0% 100.0% 97.9% 100.0% 98.9%
Infant 1st PCR Test positive around 6 weeks rate <2% <2% 1.2% <2% 1.6%
Couple year protection rate 40.0% 40.0% 39.9% 40.0% 40.1%
Disease Prevention and Control
Hypertension incidence 15.7/1000 15.7/1000 13.67 15.70 15.25
Diabetes incidence 1.00 1.00 4.03 1.00 4.00
Cataract surgery rate (Uninsured Population) 1 491/1 000 000 1 491/1 000 000 686.5 1 491/1 000 000 787.6
Programme 3: Emergency Medical Services
EMS operational ambulance coverage 0.58/10 000 0.58/10 000 0.55 0.58/10 000 0.61
EMS P1 urban response under 15 minutes rate 53.2% 53.2% 28.6% 53.2% 37.5%
EMS P1 rural response under 40 minutes rate 67.5% 67.5% 72.0% 67.5% 82.5%
EMS P1 call response under 60 minutes rate 82.9% 82.9% 29.0% 82.9% 22.1%
Programme 4: Provincial Hospital Services
General (regional) hospitals
Average Length of Stay 5.5 days 5.5 days 5.1 days 5.5 days 5.1 days
Inpatient Bed Utilisation Rate 70.0% 70.0% 63.3% 70.0% 68.3%
Expenditure per patient day equivalent (PDE) R 2 600 R 2 600 R 2 657 R 2 600 R 2 440
Complaint Resolution within 25 working days rate 75.0% 75.0% 52.0% 75.0% 40.9%
Mental health admission rate 1.0% 1.0% 0.9% 1.0% 1.0%
Percentage of Hospitals that have conducted gap assessments for compliance against the National 100.0% 25.0% 25.0% 25.0% 50.0%
Proportion of hospitals assessed as compliant with the Extreme Measures of National Core Standards 50.0% 0% 0% 0% 0%

QUARTERLY PERFORMANCE REPORTS: 2014/15 - 2nd Quarter
FREE STATE
Sector: Health
Programme / Subprogramme / Performance Measures Target for
2014/15 as per
Annual
Performance
Plan (APP)
1st Quarter
Planned output
as per APP
1st Quarter
Actual output -
validated
2nd Quarter
Planned output
as per APP
2nd Quarter
Preliminary
output
QUARTERLY OUTPUTS
Programme 5: Central Hospital Services
Tertiary Hospitals
Average Length of Stay 7.5 days 7.5 days 9.8 days 7.5 days 7.2 days
Inpatient Bed Utilisation Rate 75.0% 75.0% 108.4% 75.0% 80.4%
Expenditure per patient day equivalent (PDE) R 4 500 R 4 500 R 2 269 R 4 500 R 2 713
Complaint Resolution within 25 working days rate 75.0% 75.0% 80.0% 75.0% 66.7%
Mental health admission rate 1.0% 1.0% 0% 1.0% 0%
Percentage of Hospitals that have conducted gap assessments for compliance against the National 100.0% 0% 100.0% 100.0% 0%
Proportion of hospitals assessed as compliant with the Extreme Measures of National Core Standards 0% 0% 0% 0% 0%
Central Hospitals
Average Length of Stay 8.0 days 8.0 days 7.3 days 8.0 days 7.0 days
Inpatient Bed Utilisation Rate 75.0% 75.0% 75.3% 75.0% 80.3%
Expenditure per patient day equivalent (PDE) R 4 900 R 4 900 R 4 988 R 4 900 R 3 866
Complaint Resolution within 25 working days rate 75.0% 75.0% 98.5% 75.0% 100.0%
Mental health admission rate 0% 0% 0% 0% 0%
Percentage of Hospitals that have conducted gap assessments for compliance against the National 100.0% 100.0% 100.0% 0% 0%
Proportion of hospitals assessed as compliant with the Extreme Measures of National Core Standards 100.0% 0% 0% 0% 0%
Programme 8: Health Facilities Management
Proportion of Programme 8 budget spent on maintenance (preventative and scheduled) 75.0% 0% 0% 0% 0%
Number of districts spending more than 90% of maintenance budget 5 - - - -
1. Information submitted by: Dr. D. Motau Head Official: Health Free State Tel No (051) 408 1107 Mr. G Mahlatsi Head Official: Provincial Treasury Free State

QUARTERLY PERFORMANCE REPORTS: 2014/15 - 2nd Quarter
GAUTENG
Sector: Health
Programme / Subprogramme / Performance Measures Target for
2014/15 as per
Annual
Performance
Plan (APP)
1st Quarter
Planned output
as per APP
1st Quarter
Actual output -
validated
2nd Quarter
Planned output
as per APP
2nd Quarter
Preliminary
output
QUARTERLY OUTPUTS
Programme 1: Administration
Proportion of health facilities connected to the internet 44.0% 39.0% 44.1% 41.0% 44.1%
Programme 2: District Health Services
PHC Utilisation rate 2.3 2.3 1.8 2.3 1.9
OHH registration visit coverage 5.0% 4.8% 107.0% 4.8% 140.9%
PHC supervisor visit rate (fixed clinic/CHC/CDC) 100.0% 100.0% 83.5% 100.0% 86.0%
Complaint resolution within 25 working days rate 75.0% 75.0% 93.4% 75.0% 90.0%
Number of fully fledged District Clinical specialist Teams appointed 5 5 5 5 5
Number of fully-fledged Ward Based Outreach Teams appointed 140 128 144 134 175
School ISHP coverage 50.0% 50.0% 43.1% 50.0% 39.6%
School Grade 1 screening coverage 40.0% 10.0% 53.3% 12.0% 40.6%
School Grade 4 screening coverage 20.0% 20.0% 52.0% 20.0% 40.4%
School Grade 8 screening coverage 20.0% 20.0% 13.7% 20.0% 24.4%
Percentage of fixed facilities that have conducted gap assessments for compliance against the National 50.0% 13.0% 27.4% 13.0% 20.8%
Compliance Rate of PHC Facilities (of National Core Standards) 5.0% 5.0% 0% 5.0% 1.2%
District Hospitals
Average Length of Stay 3.5 days 3.5 days 4.5 days 3.5 days 4.4 days
Inpatient Bed Utilisation Rate 75.0% 68.0% 60.9% 70.0% 61.9%
Expenditure per patient day equivalent (PDE) R 1 600 R 1 600 R 2 479 R 1 600 R 2 182
Complaint Resolution within 25 working days rate 75.0% 75.0% 98.5% 75.0% 97.3%
Mental health admission rate 1.0% 1.0% 0.3% 1.0% 0.4%
Percentage of Hospitals that have conducted gap assessments for compliance against the National 100.0% 28.0% 27.3% 27.0% 18.2%
Proportion of hospitals assessed as compliant with the Extreme Measures of National Core Standards 20.0% 5.0% 0% 5.0% 0%
HIV and AIDS, TB and STI control
Total clients remaining on ART (TROA) at end of the month 650 000 612 500 640 300 625 000 654 664
Number of Medical Male Circumcisions conducted 208 261 100 000 48 251 150 304 52 658
TB (new pulmonary) defaulter rate 5.0% 5.0% 4.6% 5.0% 4.6%
TB AFB sputum result turn-around time under 48 hours rate 80.0% 80.0% 65.5% 80.0% 65.1%
TB new client treatment success rate 85.0% 85.0% 85.9% 85.0% 85.9%
HIV testing coverage (15-49 Years - Annualised) 39.0% 39.0% 14.2% 39.0% 16.2%
TB (new pulmonary) cure rate 84.0% 84.0% 85.1% 84.0% 85.1%
TB MDR confirmed treatment initiation rate 65.0% 65.0% 50.2% 65.0% 50.2%
Maternal, child and women health
Immunisation coverage under 1 year 90.0% 90.0% 104.6% 90.0% 103.3%
Vitamin A coverage 12-59 months 55.0% 55.0% 58.7% 55.0% 55.7%
Deworming 12-59 months coverage 55.0% 55.0% 46.7% 55.0% 42.2%
Child under 2 years underweight for age incidence 0.02 0.02 9.11 0.02 10.73
Measles 1st dose under 1 year coverage 90.0% 90.0% 106.3% 90.0% 107.4%
Pneumococcal Vaccine (PCV) 3rd Dose Coverage 90.0% 90.0% 103.0% 90.0% 104.4%
Rotavirus (RV) 2nd Dose Coverage 90.0% 90.0% 107.2% 90.0% 113.0%
Cervical cancer screening coverage 68.0% 68.0% 43.4% 68.0% 46.1%
HPV Vaccine Coverage amongst Grade 4 girls 80.0% 80.0% 0% 80.0% 0%
Antenatal 1st visits before 20 weeks rate 45.0% 45.0% 46.5% 45.0% 48.5%
Infant given NVP within 72 hours after birth uptake rate 95.0% 95.0% 98.0% 95.0% 90.8%
Infant 1st PCR Test positive around 6 weeks rate 2.0% 2.0% 1.4% 2.0% 1.1%
Couple year protection rate 50.0% 50.0% 25.3% 50.0% 30.5%
Disease Prevention and Control
Hypertension incidence 0.00 0.00 14.86 0.00 15.11
Diabetes incidence 0.00 0.00 2.23 0.00 2.44
Cataract surgery rate (Uninsured Population) 1300/mil 1300/mil 1 033.5 1300/mil 1 010.5
Programme 3: Emergency Medical Services
EMS operational ambulance coverage 0.06 0.06 0.59 0.06 0.31
EMS P1 urban response under 15 minutes rate 65.0% 65.0% 78.9% 65.0% 82.9%
EMS P1 rural response under 40 minutes rate 100.0% 100.0% 76.2% 100.0% 70.8%
EMS P1 call response under 60 minutes rate 85.0% 85.0% 96.4% 85.0% 95.9%
Programme 4: Provincial Hospital Services
General (regional) hospitals
Average Length of Stay 4.7 days 4.7 days 4.9 days 4.7 days 4.7 days
Inpatient Bed Utilisation Rate 78.0% 78.0% 86.0% 78.0% 83.8%
Expenditure per patient day equivalent (PDE) R 2 000 R 2 000 R 2 270 R 2 000 R 2 245
Complaint Resolution within 25 working days rate 95.0% 95.0% 100.0% 95.0% 100.0%
Mental health admission rate 1.0% 1.0% 0.2% 1.0% 0.2%
Percentage of Hospitals that have conducted gap assessments for compliance against the National 100.0% 28.0% 33.3% 27.0% 22.2%
Proportion of hospitals assessed as compliant with the Extreme Measures of National Core Standards 20.0% 5.0% 0% 5.0% 0%

QUARTERLY PERFORMANCE REPORTS: 2014/15 - 2nd Quarter
GAUTENG
Sector: Health
Programme / Subprogramme / Performance Measures Target for
2014/15 as per
Annual
Performance
Plan (APP)
1st Quarter
Planned output
as per APP
1st Quarter
Actual output -
validated
2nd Quarter
Planned output
as per APP
2nd Quarter
Preliminary
output
QUARTERLY OUTPUTS
Programme 5: Central Hospital Services
Tertiary Hospitals
Average Length of Stay 5.5 days 5.5 days 6.0 days 5.5 days 6.0 days
Inpatient Bed Utilisation Rate 78.0% 78.0% 83.2% 78.0% 86.0%
Expenditure per patient day equivalent (PDE) R 2 500 R 2 500 R 2 560 R 2 500 R 2 295
Complaint Resolution within 25 working days rate 80.0% 80.0% 76.6% 80.0% 100.0%
Mental health admission rate 1.0% 1.0% 0.6% 1.0% 0.6%
Percentage of Hospitals that have conducted gap assessments for compliance against the National 100.0% 34.0% 33.3% 33.0% 66.7%
Proportion of hospitals assessed as compliant with the Extreme Measures of National Core Standards 15.0% 0% 0% 5.0% 0%
Central Hospitals
Average Length of Stay 6.2 days 6.2 days 7.9 days 6.2 days 8.4 days
Inpatient Bed Utilisation Rate 78.0% 78.0% 80.2% 78.0% 86.6%
Expenditure per patient day equivalent (PDE) R 3 275 R 3 275 R 3 971 R 3 275 R 3 304
Complaint Resolution within 25 working days rate 95.0% 95.0% 93.1% 95.0% 96.2%
Mental health admission rate 1.0% 1.0% 0% 1.0% 0%
Percentage of Hospitals that have conducted gap assessments for compliance against the National 100.0% 25.0% 25.0% 25.0% 50.0%
Proportion of hospitals assessed as compliant with the Extreme Measures of National Core Standards 20.0% 5.0% 0% 5.0% 0%
Programme 8: Health Facilities Management
Proportion of Programme 8 budget spent on maintenance (preventative and scheduled) 100.0% 25.0% 9.7% 50.0% 20.9%
Number of districts spending more than 90% of maintenance budget 5 5 - 5 -
1. Information submitted by:Dr T.E. Selabano Acting Head Official: Health Gauteng Tel No (011) 355 3857 Ms. N. Tshabalala Head Official: Provincial Treasury Gauteng

QUARTERLY PERFORMANCE REPORTS: 2014/15 - 2nd Quarter
KWAZULU-NATAL
Sector: Health
Programme / Subprogramme / Performance Measures Target for
2014/15 as per
Annual
Performance
Plan (APP)
1st Quarter
Planned output
as per APP
1st Quarter
Actual output -
validated
2nd Quarter
Planned output
as per APP
2nd Quarter
Preliminary
output
QUARTERLY OUTPUTS
Programme 1: Administration
Proportion of health facilities connected to the internet 25.0% 8.0% 36.1% 15.0% 38.5%
Programme 2: District Health Services
PHC Utilisation rate 3.0 3.0 2.9 3.0 3.1
OHH registration visit coverage 0% 0% 0% 0% 0%
PHC supervisor visit rate (fixed clinic/CHC/CDC) 66.4% 64.0% 64.0% 65.0% 64.4%
Complaint resolution within 25 working days rate 70.0% 61.0% 93.7% 65.0% 83.0%
Number of fully fledged District Clinical specialist Teams appointed 4 1 4 1 -
Number of fully-fledged Ward Based Outreach Teams appointed 57 39 77 45 68
School ISHP coverage 70.0% 65.0% 39.6% 68.0% 25.5%
School Grade 1 screening coverage establish
baseline
establish
baseline
37.9% establish
baseline
20.7%
School Grade 4 screening coverage establish
baseline
establish
baseline
35.1% establish
baseline
22.1%
School Grade 8 screening coverage establish
baseline
establish
baseline
18.6% establish
baseline
11.4%
Percentage of fixed facilities that have conducted gap assessments for compliance against the National 90.0% 85.0% 6.6% 87.0% 7.9%
Compliance Rate of PHC Facilities (of National Core Standards) 25.0% 0% 1.6% 15.0% 1.2%
District Hospitals
Average Length of Stay 5.6 days 5.7 days 5.9 days 5.7 days 6.1 days
Inpatient Bed Utilisation Rate 63.8% 69.0% 62.4% 67.0% 66.8%
Expenditure per patient day equivalent (PDE) R 2 038 R 1 985 R 2 004 R 1 990 R 1 983
Complaint Resolution within 25 working days rate 70.0% 65.0% 92.8% 67.0% 95.6%
Mental health admission rate 1.1% 1.0% 1.0% 1.0% 0.8%
Percentage of Hospitals that have conducted gap assessments for compliance against the National 100.0% 0% 7.5% 0% 10.0%
Proportion of hospitals assessed as compliant with the Extreme Measures of National Core Standards 15.0% 0% 0% 0% 0%
HIV and AIDS, TB and STI control
Total clients remaining on ART (TROA) at end of the month 1 038 556 837 145 866 790 904 281 890 605
Number of Medical Male Circumcisions conducted 291 377 72 844 35 346 82 000 34 004
TB (new pulmonary) defaulter rate 4.5% 4.8% 3.8% 4.7% 3.5%
TB AFB sputum result turn-around time under 48 hours rate 80.0% 76.0% 82.5% 77.0% 85.0%
TB new client treatment success rate 85.0% 83.0% 86.3% 84.0% 81.6%
HIV testing coverage (15-49 Years - Annualised) 58.2% 37.0% 33.4% 43.0% 38.0%
TB (new pulmonary) cure rate 85.0% 81.0% 82.8% 83.0% 83.0%
TB MDR confirmed treatment initiation rate 57.8% 53.5% 0% 55.0% 0%
Maternal, child and women health
Immunisation coverage under 1 year 96.0% 95.8% 86.3% 95.8% 93.3%
Vitamin A coverage 12-59 months 55.0% 54.0% 49.3% 54.0% 66.1%
Deworming 12-59 months coverage determine
baseline
determine
baseline
45.3% determine base 59.6%
Child under 2 years underweight for age incidence 20.00 23.00 29.30 22.00 30.90
Measles 1st dose under 1 year coverage 94.6% 93.5% 88.4% 94.0% 94.6%
Pneumococcal Vaccine (PCV) 3rd Dose Coverage 96.2% 95.1% 88.6% 95.7% 94.4%
Rotavirus (RV) 2nd Dose Coverage 104.4% 103.7% 90.5% 104.0% 100.3%
Cervical cancer screening coverage 79.7% 79.2% 68.0% 79.4% 75.5%
HPV Vaccine Coverage amongst Grade 4 girls determine
baseline
determine
baseline
0% determine base 0%
Antenatal 1st visits before 20 weeks rate 60.0% 55.0% 52.8% 57.0% 57.6%
Infant given NVP within 72 hours after birth uptake rate 98.0% 98.0% 99.4% 98.0% 102.3%
Infant 1st PCR Test positive around 6 weeks rate 1.2% 1.7% 1.3% 1.4% 1.3%
Couple year protection rate 45.0% 40.0% 52.3% 43.0% 37.7%
Disease Prevention and Control
Hypertension incidence 22.80 23.00 20.36 23.00 26.52
Diabetes incidence 2.10 2.10 7.09 2.10 8.22
Cataract surgery rate (Uninsured Population) 749.0 678.0 910.9 688.0 842.5
Programme 3: Emergency Medical Services
EMS operational ambulance coverage 0.26 0.26 0.17 0.26 0.19
EMS P1 urban response under 15 minutes rate 15.0% 10.0% 4.9% 10.0% 5.2%
EMS P1 rural response under 40 minutes rate 40.0% 30.0% 31.5% 35.0% 30.3%
EMS P1 call response under 60 minutes rate 65.0% 50.0% 42.8% 55.0% 40.5%
Programme 4: Provincial Hospital Services
General (regional) hospitals
Average Length of Stay 5.3 days 5.9 days 6.1 days 5.7 days 6.0 days
Inpatient Bed Utilisation Rate 76.5% 75.0% 73.3% 75.5% 79.3%
Expenditure per patient day equivalent (PDE) R 2 241 R 2 195 R 2 487 R 2 150 R 2 322
Complaint Resolution within 25 working days rate 70.0% 63.0% 94.5% 66.0% 98.6%
Mental health admission rate 1.4% 1.2% 1.1% 1.2% 1.0%
Percentage of Hospitals that have conducted gap assessments for compliance against the National 100.0% 50.0% 15.4% 75.0% 0%
Proportion of hospitals assessed as compliant with the Extreme Measures of National Core Standards 23.0% 8.0% 0% 8.0% 0%
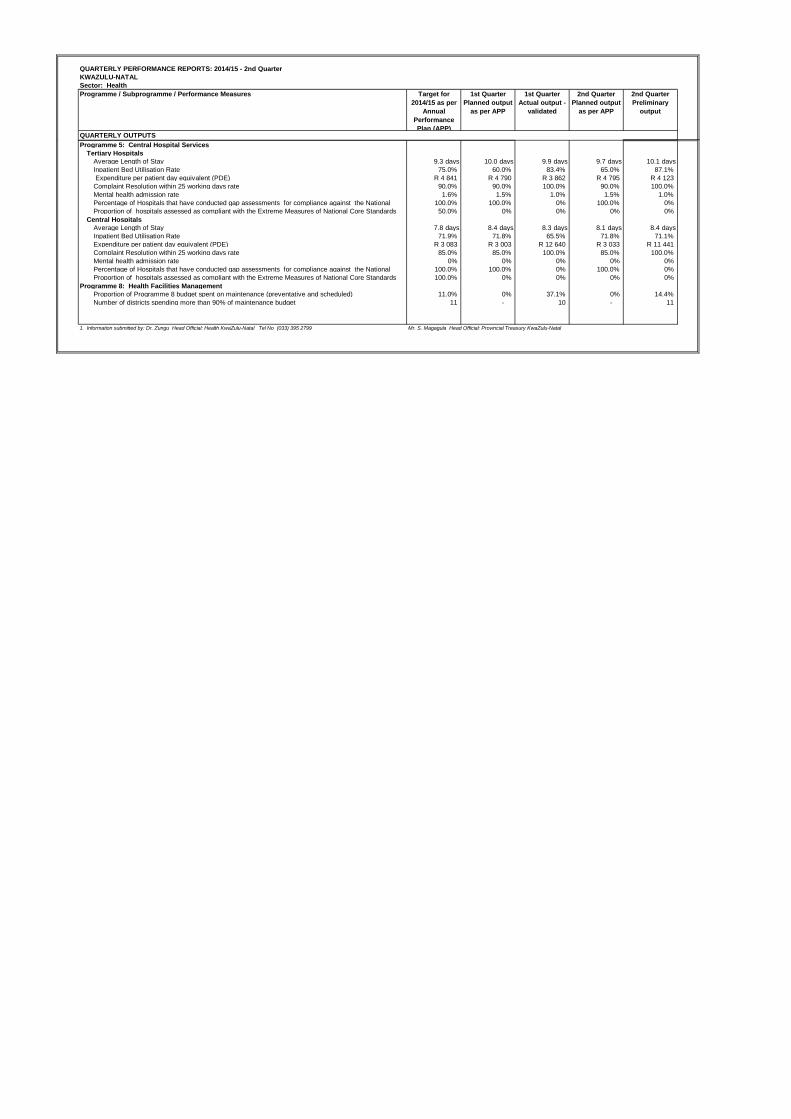
QUARTERLY PERFORMANCE REPORTS: 2014/15 - 2nd Quarter
KWAZULU-NATAL
Sector: Health
Programme / Subprogramme / Performance Measures Target for
2014/15 as per
Annual
Performance
Plan (APP)
1st Quarter
Planned output
as per APP
1st Quarter
Actual output -
validated
2nd Quarter
Planned output
as per APP
2nd Quarter
Preliminary
output
QUARTERLY OUTPUTS
Programme 5: Central Hospital Services
Tertiary Hospitals
Average Length of Stay 9.3 days 10.0 days 9.9 days 9.7 days 10.1 days
Inpatient Bed Utilisation Rate 75.0% 60.0% 83.4% 65.0% 87.1%
Expenditure per patient day equivalent (PDE) R 4 841 R 4 790 R 3 862 R 4 795 R 4 123
Complaint Resolution within 25 working days rate 90.0% 90.0% 100.0% 90.0% 100.0%
Mental health admission rate 1.6% 1.5% 1.0% 1.5% 1.0%
Percentage of Hospitals that have conducted gap assessments for compliance against the National 100.0% 100.0% 0% 100.0% 0%
Proportion of hospitals assessed as compliant with the Extreme Measures of National Core Standards 50.0% 0% 0% 0% 0%
Central Hospitals
Average Length of Stay 7.8 days 8.4 days 8.3 days 8.1 days 8.4 days
Inpatient Bed Utilisation Rate 71.9% 71.8% 65.5% 71.8% 71.1%
Expenditure per patient day equivalent (PDE) R 3 083 R 3 003 R 12 640 R 3 033 R 11 441
Complaint Resolution within 25 working days rate 85.0% 85.0% 100.0% 85.0% 100.0%
Mental health admission rate 0% 0% 0% 0% 0%
Percentage of Hospitals that have conducted gap assessments for compliance against the National 100.0% 100.0% 0% 100.0% 0%
Proportion of hospitals assessed as compliant with the Extreme Measures of National Core Standards 100.0% 0% 0% 0% 0%
Programme 8: Health Facilities Management
Proportion of Programme 8 budget spent on maintenance (preventative and scheduled) 11.0% 0% 37.1% 0% 14.4%
Number of districts spending more than 90% of maintenance budget 11 - 10 - 11
1. Information submitted by: Dr. Zungu Head Official: Health KwaZulu-Natal Tel No (033) 395 2799 Mr. S. Magagula Head Official: Provincial Treasury KwaZulu-Natal

QUARTERLY PERFORMANCE REPORTS: 2014/15 - 2nd Quarter
LIMPOPO
Sector: Health
Programme / Subprogramme / Performance Measures Target for
2014/15 as per
Annual
Performance
Plan (APP)
1st Quarter
Planned output
as per APP
1st Quarter
Actual output -
validated
2nd Quarter
Planned output
as per APP
2nd Quarter
Preliminary
output
QUARTERLY OUTPUTS
Programme 1: Administration
Proportion of health facilities connected to the internet 0% 0% 8.1% 0% 8.1%
Programme 2: District Health Services
PHC Utilisation rate 2.7 2.7 2.6 2.7 2.4
OHH registration visit coverage 12.0% 12.0% 87.3% 12.0% 63.6%
PHC supervisor visit rate (fixed clinic/CHC/CDC) 90.0% 90.0% 87.7% 90.0% 79.1%
Complaint resolution within 25 working days rate 68.0% 68.0% 84.7% 68.0% 92.2%
Number of fully fledged District Clinical specialist Teams appointed 1 1 - 1 -
Number of fully-fledged Ward Based Outreach Teams appointed 75 75 91 75 91
School ISHP coverage 10.0% 0% 9 929.2% 0% 17 065.3%
School Grade 1 screening coverage 10.0% 0% 29.9% 0% 48.7%
School Grade 4 screening coverage 20.0% 0% 15.4% 0% 34.4%
School Grade 8 screening coverage 20.0% 0% 6.7% 0% 11.0%
Percentage of fixed facilities that have conducted gap assessments for compliance against the National 36.0% 0% 5.8% 0% 5.8%
Compliance Rate of PHC Facilities (of National Core Standards) 0% 0% 55.9% 0% 55.9%
District Hospitals
Average Length of Stay 4.4 days 4.4 days 4.4 days 4.4 days 4.3 days
Inpatient Bed Utilisation Rate 70.0% 70.0% 67.7% 70.0% 77.7%
Expenditure per patient day equivalent (PDE) R 2 100 R 2 100 R 2 615 R 2 100 R 2 431
Complaint Resolution within 25 working days rate 80.0% 80.0% 95.9% 80.0% 100.0%
Mental health admission rate 0% 0% 1.9% 0% 2.0%
Percentage of Hospitals that have conducted gap assessments for compliance against the National 100.0% 20.0% 16.7% 50.0% 16.7%
Proportion of hospitals assessed as compliant with the Extreme Measures of National Core Standards 0% 0% 0% 0% 0%
HIV and AIDS, TB and STI control
Total clients remaining on ART (TROA) at end of the month 190 000 188 000 194 118 189 000 -
Number of Medical Male Circumcisions conducted 62 000 3 000 9 796 62 000 -
TB (new pulmonary) defaulter rate <5% <5% 4.2% <5% 4.0%
TB AFB sputum result turn-around time under 48 hours rate 32.0% 32.0% 50.8% 32.0% 50.7%
TB new client treatment success rate 60.0% 60.0% 76.2% 60.0% 26.6%
HIV testing coverage (15-49 Years - Annualised) 99.0% 99.0% 37.5% 99.0% 38.5%
TB (new pulmonary) cure rate 75.0% 75.0% 72.4% 75.0% 72.4%
TB MDR confirmed treatment initiation rate 47.0% 47.0% 100.0% 47.0% 92.9%
Maternal, child and women health
Immunisation coverage under 1 year 90.0% 90.0% 77.1% 90.0% 71.7%
Vitamin A coverage 12-59 months 40.0% 40.0% 36.4% 40.0% 37.6%
Deworming 12-59 months coverage 90.0% 90.0% 28.7% 90.0% 19.1%
Child under 2 years underweight for age incidence 0.44 0.44 24.48 0.44 21.66
Measles 1st dose under 1 year coverage 90.0% 90.0% 89.4% 90.0% 79.3%
Pneumococcal Vaccine (PCV) 3rd Dose Coverage 90.0% 90.0% 86.8% 90.0% 81.6%
Rotavirus (RV) 2nd Dose Coverage 90.0% 90.0% 90.2% 90.0% 91.3%
Cervical cancer screening coverage 55.0% 55.0% 46.7% 55.0% 49.9%
HPV Vaccine Coverage amongst Grade 4 girls 60.0% 0% 50.5% 0% 50.5%
Antenatal 1st visits before 20 weeks rate 45.0% 45.0% 45.4% 45.0% 51.4%
Infant given NVP within 72 hours after birth uptake rate 50.0% 50.0% 98.9% 50.0% 99.6%
Infant 1st PCR Test positive around 6 weeks rate < 2 < 2 2.1% < 2 2.4%
Couple year protection rate 45.0% 45.0% 33.9% 45.0% 37.7%
Disease Prevention and Control
Hypertension incidence 0.16 - 15.76 - 12.10
Diabetes incidence 0.02 - 10.82 - 9.78
Cataract surgery rate (Uninsured Population) 1 000.0 1 000.0 537.5 1 000.0 1 043.6
Programme 3: Emergency Medical Services
EMS operational ambulance coverage 0.30 0.30 0.16 0.30 0.49
EMS P1 urban response under 15 minutes rate 50.0% 50.0% 56.7% 50.0% 35.1%
EMS P1 rural response under 40 minutes rate 53.0% 53.0% 80.1% 53.0% 326.5%
EMS P1 call response under 60 minutes rate 55.0% 55.0% 62.6% 55.0% 339.7%
Programme 4: Provincial Hospital Services
General (regional) hospitals
Average Length of Stay 5.0 days 5.0 days 5.6 days 5.0 days 5.5 days
Inpatient Bed Utilisation Rate 65.0% 65.0% 71.5% 65.0% 79.4%
Expenditure per patient day equivalent (PDE) R 2 544 R 2 544 R 2 470 R 2 544 R 2 096
Complaint Resolution within 25 working days rate 80.0% 80.0% 100.0% 80.0% 100.0%
Mental health admission rate 0% 0% 2.1% 0% 1.7%
Percentage of Hospitals that have conducted gap assessments for compliance against the National 100.0% 100.0% 20.0% 100.0% 20.0%
Proportion of hospitals assessed as compliant with the Extreme Measures of National Core Standards 0% 0% 0% 0% 0%

QUARTERLY PERFORMANCE REPORTS: 2014/15 - 2nd Quarter
LIMPOPO
Sector: Health
Programme / Subprogramme / Performance Measures Target for
2014/15 as per
Annual
Performance
Plan (APP)
1st Quarter
Planned output
as per APP
1st Quarter
Actual output -
validated
2nd Quarter
Planned output
as per APP
2nd Quarter
Preliminary
output
QUARTERLY OUTPUTS
Programme 5: Central Hospital Services
Tertiary Hospitals
Average Length of Stay 7.0 days 7.0 days 7.3 days 7.0 days 7.1 days
Inpatient Bed Utilisation Rate 75.0% 75.0% 74.0% 75.0% 77.4%
Expenditure per patient day equivalent (PDE) R 3 500 R 3 500 R 3 466 R 3 500 R 3 427
Complaint Resolution within 25 working days rate 90.0% 90.0% 100.0% 90.0% 100.0%
Mental health admission rate 0% 0% 0.7% 0% 0.8%
Percentage of Hospitals that have conducted gap assessments for compliance against the National 100.0% 100.0% 0% 100.0% 0%
Proportion of hospitals assessed as compliant with the Extreme Measures of National Core Standards 0% 0% 0% 0% 0%
Central Hospitals
Average Length of Stay
Inpatient Bed Utilisation Rate
Expenditure per patient day equivalent (PDE)
Complaint Resolution within 25 working days rate
Mental health admission rate
Percentage of Hospitals that have conducted gap assessments for compliance against the National
Proportion of hospitals assessed as compliant with the Extreme Measures of National Core Standards
Programme 8: Health Facilities Management
Proportion of Programme 8 budget spent on maintenance (preventative and scheduled) 3.7% 3.7% 20.8% 3.7% 13.8%
Number of districts spending more than 90% of maintenance budget 5 5 5 5 5
1. Information submitted by: Dr S Kabane Head Official: Health Limpopo Tel No (015) 294 6011 Mr. G. Pratt Head Official: Provincial Treasury Limpopo
* This province does not have Central Hospitals
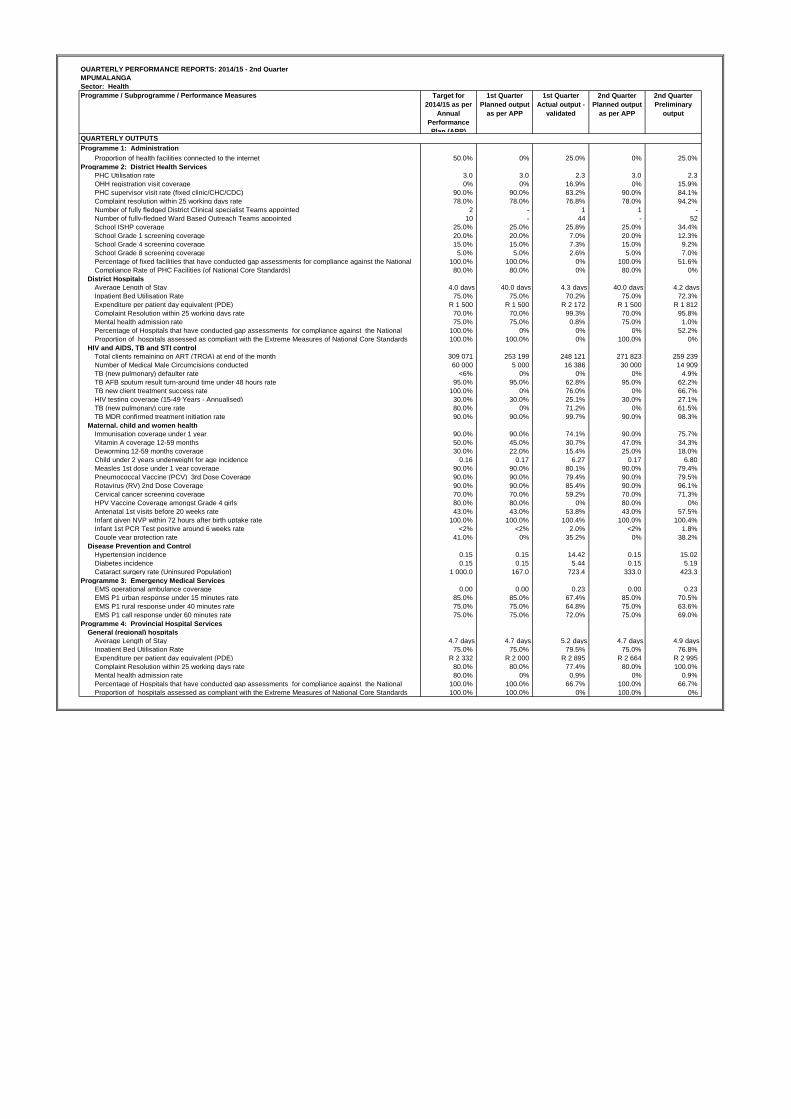
QUARTERLY PERFORMANCE REPORTS: 2014/15 - 2nd Quarter
MPUMALANGA
Sector: Health
Programme / Subprogramme / Performance Measures Target for
2014/15 as per
Annual
Performance
Plan (APP)
1st Quarter
Planned output
as per APP
1st Quarter
Actual output -
validated
2nd Quarter
Planned output
as per APP
2nd Quarter
Preliminary
output
QUARTERLY OUTPUTS
Programme 1: Administration
Proportion of health facilities connected to the internet 50.0% 0% 25.0% 0% 25.0%
Programme 2: District Health Services
PHC Utilisation rate 3.0 3.0 2.3 3.0 2.3
OHH registration visit coverage 0% 0% 16.9% 0% 15.9%
PHC supervisor visit rate (fixed clinic/CHC/CDC) 90.0% 90.0% 83.2% 90.0% 84.1%
Complaint resolution within 25 working days rate 78.0% 78.0% 76.8% 78.0% 94.2%
Number of fully fledged District Clinical specialist Teams appointed 2 - 1 1 -
Number of fully-fledged Ward Based Outreach Teams appointed 10 - 44 - 52
School ISHP coverage 25.0% 25.0% 25.8% 25.0% 34.4%
School Grade 1 screening coverage 20.0% 20.0% 7.0% 20.0% 12.3%
School Grade 4 screening coverage 15.0% 15.0% 7.3% 15.0% 9.2%
School Grade 8 screening coverage 5.0% 5.0% 2.6% 5.0% 7.0%
Percentage of fixed facilities that have conducted gap assessments for compliance against the National 100.0% 100.0% 0% 100.0% 51.6%
Compliance Rate of PHC Facilities (of National Core Standards) 80.0% 80.0% 0% 80.0% 0%
District Hospitals
Average Length of Stay 4.0 days 40.0 days 4.3 days 40.0 days 4.2 days
Inpatient Bed Utilisation Rate 75.0% 75.0% 70.2% 75.0% 72.3%
Expenditure per patient day equivalent (PDE) R 1 500 R 1 500 R 2 172 R 1 500 R 1 812
Complaint Resolution within 25 working days rate 70.0% 70.0% 99.3% 70.0% 95.8%
Mental health admission rate 75.0% 75.0% 0.8% 75.0% 1.0%
Percentage of Hospitals that have conducted gap assessments for compliance against the National 100.0% 0% 0% 0% 52.2%
Proportion of hospitals assessed as compliant with the Extreme Measures of National Core Standards 100.0% 100.0% 0% 100.0% 0%
HIV and AIDS, TB and STI control
Total clients remaining on ART (TROA) at end of the month 309 071 253 199 248 121 271 823 259 239
Number of Medical Male Circumcisions conducted 60 000 5 000 16 386 30 000 14 909
TB (new pulmonary) defaulter rate <6% 0% 0% 0% 4.9%
TB AFB sputum result turn-around time under 48 hours rate 95.0% 95.0% 62.8% 95.0% 62.2%
TB new client treatment success rate 100.0% 0% 76.0% 0% 66.7%
HIV testing coverage (15-49 Years - Annualised) 30.0% 30.0% 25.1% 30.0% 27.1%
TB (new pulmonary) cure rate 80.0% 0% 71.2% 0% 61.5%
TB MDR confirmed treatment initiation rate 90.0% 90.0% 99.7% 90.0% 98.3%
Maternal, child and women health
Immunisation coverage under 1 year 90.0% 90.0% 74.1% 90.0% 75.7%
Vitamin A coverage 12-59 months 50.0% 45.0% 30.7% 47.0% 34.3%
Deworming 12-59 months coverage 30.0% 22.0% 15.4% 25.0% 18.0%
Child under 2 years underweight for age incidence 0.16 0.17 6.27 0.17 6.80
Measles 1st dose under 1 year coverage 90.0% 90.0% 80.1% 90.0% 79.4%
Pneumococcal Vaccine (PCV) 3rd Dose Coverage 90.0% 90.0% 79.4% 90.0% 79.5%
Rotavirus (RV) 2nd Dose Coverage 90.0% 90.0% 85.4% 90.0% 96.1%
Cervical cancer screening coverage 70.0% 70.0% 59.2% 70.0% 71.3%
HPV Vaccine Coverage amongst Grade 4 girls 80.0% 80.0% 0% 80.0% 0%
Antenatal 1st visits before 20 weeks rate 43.0% 43.0% 53.8% 43.0% 57.5%
Infant given NVP within 72 hours after birth uptake rate 100.0% 100.0% 100.4% 100.0% 100.4%
Infant 1st PCR Test positive around 6 weeks rate <2% <2% 2.0% <2% 1.8%
Couple year protection rate 41.0% 0% 35.2% 0% 38.2%
Disease Prevention and Control
Hypertension incidence 0.15 0.15 14.42 0.15 15.02
Diabetes incidence 0.15 0.15 5.44 0.15 5.19
Cataract surgery rate (Uninsured Population) 1 000.0 167.0 723.4 333.0 423.3
Programme 3: Emergency Medical Services
EMS operational ambulance coverage 0.00 0.00 0.23 0.00 0.23
EMS P1 urban response under 15 minutes rate 85.0% 85.0% 67.4% 85.0% 70.5%
EMS P1 rural response under 40 minutes rate 75.0% 75.0% 64.8% 75.0% 63.6%
EMS P1 call response under 60 minutes rate 75.0% 75.0% 72.0% 75.0% 69.0%
Programme 4: Provincial Hospital Services
General (regional) hospitals
Average Length of Stay 4.7 days 4.7 days 5.2 days 4.7 days 4.9 days
Inpatient Bed Utilisation Rate 75.0% 75.0% 79.5% 75.0% 76.8%
Expenditure per patient day equivalent (PDE) R 2 332 R 2 000 R 2 895 R 2 664 R 2 995
Complaint Resolution within 25 working days rate 80.0% 80.0% 77.4% 80.0% 100.0%
Mental health admission rate 80.0% 0% 0.9% 0% 0.9%
Percentage of Hospitals that have conducted gap assessments for compliance against the National 100.0% 100.0% 66.7% 100.0% 66.7%
Proportion of hospitals assessed as compliant with the Extreme Measures of National Core Standards 100.0% 100.0% 0% 100.0% 0%

QUARTERLY PERFORMANCE REPORTS: 2014/15 - 2nd Quarter
MPUMALANGA
Sector: Health
Programme / Subprogramme / Performance Measures Target for
2014/15 as per
Annual
Performance
Plan (APP)
1st Quarter
Planned output
as per APP
1st Quarter
Actual output -
validated
2nd Quarter
Planned output
as per APP
2nd Quarter
Preliminary
output
QUARTERLY OUTPUTS
Programme 5: Central Hospital Services
Tertiary Hospitals
Average Length of Stay 5.3 days 5.3 days 6.7 days 5.3 days 6.7 days
Inpatient Bed Utilisation Rate 75.0% 75.0% 81.1% 75.0% 85.5%
Expenditure per patient day equivalent (PDE) R 2 867 R 2 367 R 4 963 R 3 367 R 3 687
Complaint Resolution within 25 working days rate 80.0% 90.0% 0% 90.0% 0%
Mental health admission rate 80.0% 0% 0% 0% 0%
Percentage of Hospitals that have conducted gap assessments for compliance against the National 100.0% 100.0% 0% 100.0% 0%
Proportion of hospitals assessed as compliant with the Extreme Measures of National Core Standards 100.0% 100.0% 0% 100.0% 0%
Central Hospitals
Average Length of Stay
Inpatient Bed Utilisation Rate
Expenditure per patient day equivalent (PDE)
Complaint Resolution within 25 working days rate
Mental health admission rate
Percentage of Hospitals that have conducted gap assessments for compliance against the National
Proportion of hospitals assessed as compliant with the Extreme Measures of National Core Standards
Programme 8: Health Facilities Management
Proportion of Programme 8 budget spent on maintenance (preventative and scheduled) 25.0% 25.0% 0% 25.0% 0%
Number of districts spending more than 90% of maintenance budget 3 3 - 3 -
1. Information submitted by: Dr S Mohangi Head Official: Health Mpumalanga Tel No (013) 766 3298 Ms. N.Z. Nkamba Head Official: Provincial Treasury Mpumalanga
* This province does not have Central Hospitals
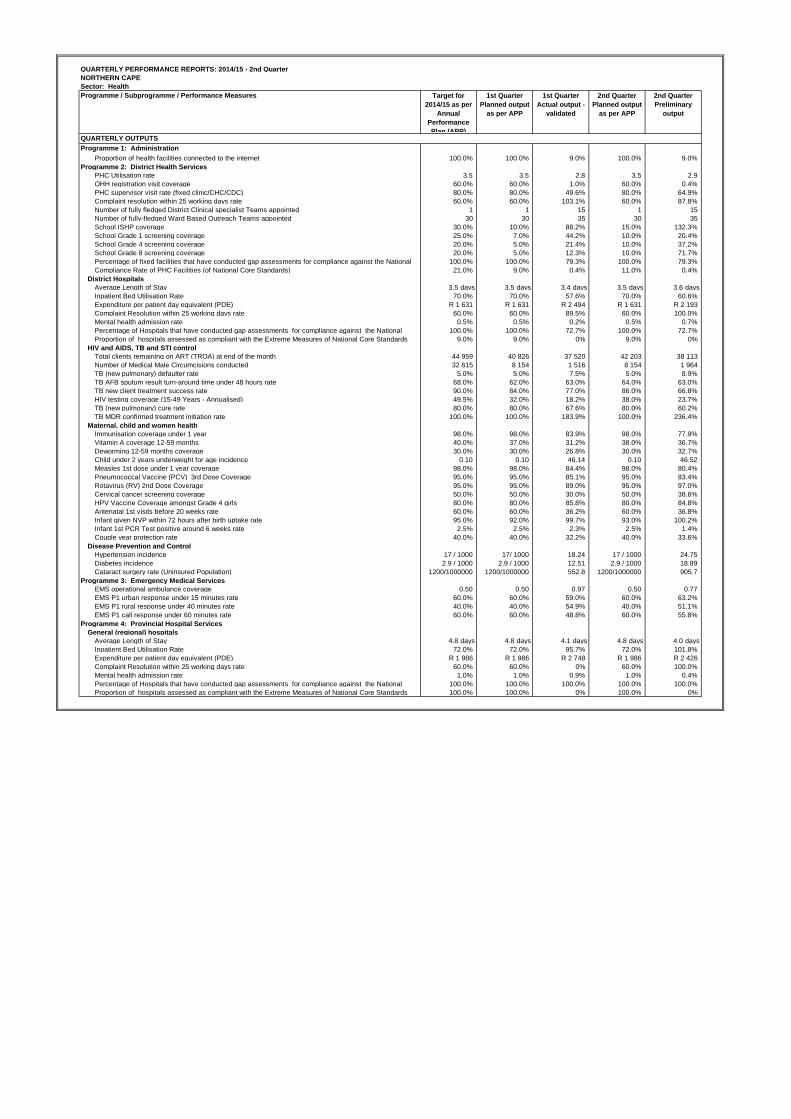
QUARTERLY PERFORMANCE REPORTS: 2014/15 - 2nd Quarter
NORTHERN CAPE
Sector: Health
Programme / Subprogramme / Performance Measures Target for
2014/15 as per
Annual
Performance
Plan (APP)
1st Quarter
Planned output
as per APP
1st Quarter
Actual output -
validated
2nd Quarter
Planned output
as per APP
2nd Quarter
Preliminary
output
QUARTERLY OUTPUTS
Programme 1: Administration
Proportion of health facilities connected to the internet 100.0% 100.0% 9.0% 100.0% 9.0%
Programme 2: District Health Services
PHC Utilisation rate 3.5 3.5 2.8 3.5 2.9
OHH registration visit coverage 60.0% 60.0% 1.0% 60.0% 0.4%
PHC supervisor visit rate (fixed clinic/CHC/CDC) 80.0% 80.0% 49.6% 80.0% 64.9%
Complaint resolution within 25 working days rate 60.0% 60.0% 103.1% 60.0% 87.8%
Number of fully fledged District Clinical specialist Teams appointed 1 1 15 1 15
Number of fully-fledged Ward Based Outreach Teams appointed 30 30 35 30 35
School ISHP coverage 30.0% 10.0% 88.2% 15.0% 132.3%
School Grade 1 screening coverage 25.0% 7.0% 44.2% 10.0% 20.4%
School Grade 4 screening coverage 20.0% 5.0% 21.4% 10.0% 37.2%
School Grade 8 screening coverage 20.0% 5.0% 12.3% 10.0% 71.7%
Percentage of fixed facilities that have conducted gap assessments for compliance against the National 100.0% 100.0% 79.3% 100.0% 79.3%
Compliance Rate of PHC Facilities (of National Core Standards) 21.0% 9.0% 0.4% 11.0% 0.4%
District Hospitals
Average Length of Stay 3.5 days 3.5 days 3.4 days 3.5 days 3.6 days
Inpatient Bed Utilisation Rate 70.0% 70.0% 57.6% 70.0% 60.6%
Expenditure per patient day equivalent (PDE) R 1 631 R 1 631 R 2 494 R 1 631 R 2 193
Complaint Resolution within 25 working days rate 60.0% 60.0% 89.5% 60.0% 100.0%
Mental health admission rate 0.5% 0.5% 0.2% 0.5% 0.7%
Percentage of Hospitals that have conducted gap assessments for compliance against the National 100.0% 100.0% 72.7% 100.0% 72.7%
Proportion of hospitals assessed as compliant with the Extreme Measures of National Core Standards 9.0% 9.0% 0% 9.0% 0%
HIV and AIDS, TB and STI control
Total clients remaining on ART (TROA) at end of the month 44 959 40 826 37 520 42 203 38 113
Number of Medical Male Circumcisions conducted 32 615 8 154 1 516 8 154 1 964
TB (new pulmonary) defaulter rate 5.0% 5.0% 7.5% 5.0% 8.9%
TB AFB sputum result turn-around time under 48 hours rate 68.0% 62.0% 63.0% 64.0% 63.0%
TB new client treatment success rate 90.0% 84.0% 77.0% 86.0% 66.8%
HIV testing coverage (15-49 Years - Annualised) 49.5% 32.0% 18.2% 38.0% 23.7%
TB (new pulmonary) cure rate 80.0% 80.0% 67.6% 80.0% 60.2%
TB MDR confirmed treatment initiation rate 100.0% 100.0% 183.9% 100.0% 236.4%
Maternal, child and women health
Immunisation coverage under 1 year 98.0% 98.0% 83.9% 98.0% 77.9%
Vitamin A coverage 12-59 months 40.0% 37.0% 31.2% 38.0% 36.7%
Deworming 12-59 months coverage 30.0% 30.0% 26.8% 30.0% 32.7%
Child under 2 years underweight for age incidence 0.10 0.10 46.14 0.10 46.52
Measles 1st dose under 1 year coverage 98.0% 98.0% 84.4% 98.0% 80.4%
Pneumococcal Vaccine (PCV) 3rd Dose Coverage 95.0% 95.0% 85.1% 95.0% 83.4%
Rotavirus (RV) 2nd Dose Coverage 95.0% 95.0% 89.0% 95.0% 97.0%
Cervical cancer screening coverage 50.0% 50.0% 30.0% 50.0% 38.6%
HPV Vaccine Coverage amongst Grade 4 girls 80.0% 80.0% 85.8% 80.0% 84.8%
Antenatal 1st visits before 20 weeks rate 60.0% 60.0% 36.2% 60.0% 36.8%
Infant given NVP within 72 hours after birth uptake rate 95.0% 92.0% 99.7% 93.0% 100.2%
Infant 1st PCR Test positive around 6 weeks rate 2.5% 2.5% 2.3% 2.5% 1.4%
Couple year protection rate 40.0% 40.0% 32.2% 40.0% 33.6%
Disease Prevention and Control
Hypertension incidence 17 / 1000 17/ 1000 18.24 17 / 1000 24.75
Diabetes incidence 2.9 / 1000 2.9 / 1000 12.51 2.9 / 1000 18.89
Cataract surgery rate (Uninsured Population) 1200/1000000 1200/1000000 552.8 1200/1000000 905.7
Programme 3: Emergency Medical Services
EMS operational ambulance coverage 0.50 0.50 0.97 0.50 0.77
EMS P1 urban response under 15 minutes rate 60.0% 60.0% 59.0% 60.0% 63.2%
EMS P1 rural response under 40 minutes rate 40.0% 40.0% 54.9% 40.0% 51.1%
EMS P1 call response under 60 minutes rate 60.0% 60.0% 48.8% 60.0% 55.8%
Programme 4: Provincial Hospital Services
General (regional) hospitals
Average Length of Stay 4.8 days 4.8 days 4.1 days 4.8 days 4.0 days
Inpatient Bed Utilisation Rate 72.0% 72.0% 95.7% 72.0% 101.8%
Expenditure per patient day equivalent (PDE) R 1 986 R 1 986 R 2 748 R 1 986 R 2 426
Complaint Resolution within 25 working days rate 60.0% 60.0% 0% 60.0% 100.0%
Mental health admission rate 1.0% 1.0% 0.9% 1.0% 0.4%
Percentage of Hospitals that have conducted gap assessments for compliance against the National 100.0% 100.0% 100.0% 100.0% 100.0%
Proportion of hospitals assessed as compliant with the Extreme Measures of National Core Standards 100.0% 100.0% 0% 100.0% 0%

QUARTERLY PERFORMANCE REPORTS: 2014/15 - 2nd Quarter
NORTHERN CAPE
Sector: Health
Programme / Subprogramme / Performance Measures Target for
2014/15 as per
Annual
Performance
Plan (APP)
1st Quarter
Planned output
as per APP
1st Quarter
Actual output -
validated
2nd Quarter
Planned output
as per APP
2nd Quarter
Preliminary
output
QUARTERLY OUTPUTS
Programme 5: Central Hospital Services
Tertiary Hospitals
Average Length of Stay 5.5 days 5.5 days 6.5 days 5.5 days 6.5 days
Inpatient Bed Utilisation Rate 74.0% 74.0% 70.9% 74.0% 75.2%
Expenditure per patient day equivalent (PDE) R 3 663 R 3 663 R 4 051 R 3 663 R 3 567
Complaint Resolution within 25 working days rate 60.0% 60.0% 100.0% 60.0% 60.7%
Mental health admission rate 2.3% 2.3% 0.6% 2.3% 0.0%
Percentage of Hospitals that have conducted gap assessments for compliance against the National 100.0% 100.0% 0% 100.0% 0%
Proportion of hospitals assessed as compliant with the Extreme Measures of National Core Standards 100.0% 100.0% 0% 100.0% 0%
Central Hospitals
Average Length of Stay
Inpatient Bed Utilisation Rate
Expenditure per patient day equivalent (PDE)
Complaint Resolution within 25 working days rate
Mental health admission rate
Percentage of Hospitals that have conducted gap assessments for compliance against the National
Proportion of hospitals assessed as compliant with the Extreme Measures of National Core Standards
Programme 8: Health Facilities Management
Proportion of Programme 8 budget spent on maintenance (preventative and scheduled) 18.0% 2.0% 36.3% 5.0% 111.9%
Number of districts spending more than 90% of maintenance budget 5 1 - 2 -
1. Information submitted by: Ms. G Matlaopane Head Official: Health Northern Cape Tel No (040) 608 1111 Mr.H.V. Gumbo Acting Head Official: Provincial Treasury Northern Cape
* This province does not have Central Hospitals

QUARTERLY PERFORMANCE REPORTS: 2014/15 - 2nd Quarter
NORTH WEST
Sector: Health
Programme / Subprogramme / Performance Measures Target for
2014/15 as per
Annual
Performance
Plan (APP)
1st Quarter
Planned output
as per APP
1st Quarter
Actual output -
validated
2nd Quarter
Planned output
as per APP
2nd Quarter
Preliminary
output
QUARTERLY OUTPUTS
Programme 1: Administration
Proportion of health facilities connected to the internet 21.0% 0% 37.4% 18.0% 34.3%
Programme 2: District Health Services
PHC Utilisation rate 3.5 3.5 2.3 3.5 2.4
OHH registration visit coverage 36.0% 9.0% 1.6% 9.0% 0.6%
PHC supervisor visit rate (fixed clinic/CHC/CDC) 80.0% 73.0% 23.5% 76.0% 37.5%
Complaint resolution within 25 working days rate 80.0% 78.0% 97.6% 80.0% 99.0%
Number of fully fledged District Clinical specialist Teams appointed 5 5 - 5 -
Number of fully-fledged Ward Based Outreach Teams appointed 296 74 - 74 -
School ISHP coverage 80.0% 20.0% 42.9% 20.0% 60.9%
School Grade 1 screening coverage 70.0% 20.0% 43.1% 20.0% 43.7%
School Grade 4 screening coverage 70.0% 20.0% 20.7% 20.0% 24.6%
School Grade 8 screening coverage 50.0% 15.0% 9.1% 15.0% 24.3%
Percentage of fixed facilities that have conducted gap assessments for compliance against the National 100.0% 100.0% 5.0% 100.0% 4.4%
Compliance Rate of PHC Facilities (of National Core Standards) 100.0% 25.0% 3.1% 25.0% 4.7%
District Hospitals
Average Length of Stay 3.8 days 3.8 days 4.8 days 3.8 days 4.7 days
Inpatient Bed Utilisation Rate 65.0% 65.0% 62.5% 65.0% 59.2%
Expenditure per patient day equivalent (PDE) R 2 300 R 2 300 R 2 402 R 2 300 R 3 926
Complaint Resolution within 25 working days rate 80.0% 80.0% 97.4% 80.0% 96.0%
Mental health admission rate 1.2% 1.2% 0.6% 1.2% 0.7%
Percentage of Hospitals that have conducted gap assessments for compliance against the National 100.0% 100.0% 20.0% 100.0% 40.0%
Proportion of hospitals assessed as compliant with the Extreme Measures of National Core Standards 27.0% 7.0% 0% 7.0% 0%
HIV and AIDS, TB and STI control
Total clients remaining on ART (TROA) at end of the month 226 735 214 184 192 169 218 368 186 212
Number of Medical Male Circumcisions conducted 50 135 12 533 16 899 12 534 15 929
TB (new pulmonary) defaulter rate <5% <5% 2.7% <5% 2.3%
TB AFB sputum result turn-around time under 48 hours rate 80.0% 80.0% 80.4% 80.0% 82.0%
TB new client treatment success rate 82.0% 82.0% 32.8% 82.0% 22.0%
HIV testing coverage (15-49 Years - Annualised) 40.0% 34.0% 29.4% 36.0% 33.1%
TB (new pulmonary) cure rate 80.0% 80.0% 30.3% 80.0% 20.3%
TB MDR confirmed treatment initiation rate 93.0% 93.0% 179.7% 93.0% 320.0%
Maternal, child and women health
Immunisation coverage under 1 year 92.0% 92.0% 78.3% 92.0% 74.2%
Vitamin A coverage 12-59 months 55.0% 47.0% 40.4% 50.0% 42.6%
Deworming 12-59 months coverage 50.0% 47.0% 35.5% 50.0% 38.9%
Child under 2 years underweight for age incidence <25% <29% 24.35 <27% 21.28
Measles 1st dose under 1 year coverage 95.0% 95.0% 83.7% 95.0% 78.4%
Pneumococcal Vaccine (PCV) 3rd Dose Coverage 95.0% 95.0% 82.0% 95.0% 47.7%
Rotavirus (RV) 2nd Dose Coverage 100.0% 100.0% 84.2% 100.0% 88.7%
Cervical cancer screening coverage 70.0% 65.0% 53.5% 66.0% 78.1%
HPV Vaccine Coverage amongst Grade 4 girls 90.0% 90.0% 0% 0% 0%
Antenatal 1st visits before 20 weeks rate 60.0% 53.0% 34.6% 56.0% 35.4%
Infant given NVP within 72 hours after birth uptake rate 99.0% 99.0% 97.8% 99.0% 104.1%
Infant 1st PCR Test positive around 6 weeks rate <2% <2% 1.5% <2% 1.6%
Couple year protection rate 37.0% 33.0% 72.6% 34.0% 78.4%
Disease Prevention and Control
Hypertension incidence 0.20 0.05 14.41 0.05 17.08
Diabetes incidence 0.01 0.00 3.85 0.00 3.26
Cataract surgery rate (Uninsured Population) 800/1m 200/1m 775.8 200/1m 792.7
Programme 3: Emergency Medical Services
EMS operational ambulance coverage 0,25% 0,25% 0.16 0,25% 0.18
EMS P1 urban response under 15 minutes rate 69.0% 69.0% 64.0% 69.0% 59.1%
EMS P1 rural response under 40 minutes rate 71.0% 71.0% 65.3% 71.0% 62.9%
EMS P1 call response under 60 minutes rate 83.0% 83.0% 73.9% 83.0% 62.7%
Programme 4: Provincial Hospital Services
General (regional) hospitals
Average Length of Stay 5.0 days 5.0 days 6.7 days 5.0 days 6.4 days
Inpatient Bed Utilisation Rate 75.0% 75.0% 80.1% 75.0% 84.3%
Expenditure per patient day equivalent (PDE) R 2 300 R 2 300 R 1 996 R 2 300 R 3 034
Complaint Resolution within 25 working days rate 90.0% 90.0% 100.0% 90.0% 100.0%
Mental health admission rate 1.2% 1.2% 2.9% 1.2% 2.9%
Percentage of Hospitals that have conducted gap assessments for compliance against the National 100.0% 100.0% 50.0% 100.0% 100.0%
Proportion of hospitals assessed as compliant with the Extreme Measures of National Core Standards 100.0% 100.0% 0% 100.0% 0%

QUARTERLY PERFORMANCE REPORTS: 2014/15 - 2nd Quarter
NORTH WEST
Sector: Health
Programme / Subprogramme / Performance Measures Target for
2014/15 as per
Annual
Performance
Plan (APP)
1st Quarter
Planned output
as per APP
1st Quarter
Actual output -
validated
2nd Quarter
Planned output
as per APP
2nd Quarter
Preliminary
output
QUARTERLY OUTPUTS
Programme 5: Central Hospital Services
Tertiary Hospitals
Average Length of Stay 5.0 days 5.0 days 6.6 days 5.0 days 4.8 days
Inpatient Bed Utilisation Rate 75.0% 75.0% 38.6% 75.0% 54.2%
Expenditure per patient day equivalent (PDE) R 2 400 R 2 400 R 476 R 2 400 R 805
Complaint Resolution within 25 working days rate 90.0% 90.0% 90.5% 90.0% 96.6%
Mental health admission rate 0% 0% 2.2% 0% 1.3%
Percentage of Hospitals that have conducted gap assessments for compliance against the National 0% 0% 0% 0% 0%
Proportion of hospitals assessed as compliant with the Extreme Measures of National Core Standards 0% 0% 0% 0% 0%
Central Hospitals
Average Length of Stay
Inpatient Bed Utilisation Rate
Expenditure per patient day equivalent (PDE)
Complaint Resolution within 25 working days rate
Mental health admission rate
Percentage of Hospitals that have conducted gap assessments for compliance against the National
Proportion of hospitals assessed as compliant with the Extreme Measures of National Core Standards
Programme 8: Health Facilities Management
Proportion of Programme 8 budget spent on maintenance (preventative and scheduled) 13.0% 0% 7.9% 0% 11.9%
Number of districts spending more than 90% of maintenance budget 4 - 5 - 5
1. Information submitted by: Mr. K. Motlhabane Acting Head Official: Health North West Tel No (018) 388 3843 Mr. N.I. Kunene Acting Head Official: Provincial Treasury North West
* This province does not have Central Hospitals

QUARTERLY PERFORMANCE REPORTS: 2014/15 - 2nd Quarter
WESTERN CAPE
Sector: Health
Programme / Subprogramme / Performance Measures Target for
2014/15 as per
Annual
Performance
Plan (APP)
1st Quarter
Planned output
as per APP
1st Quarter
Actual output -
validated
2nd Quarter
Planned output
as per APP
2nd Quarter
Preliminary
output
QUARTERLY OUTPUTS
Programme 1: Administration
Proportion of health facilities connected to the internet No target set No target set 90.1% No target set 90.1%
Programme 2: District Health Services
PHC Utilisation rate 2.4 2.4 2.3 2.4 2.4
OHH registration visit coverage Not applicable in
W Cape
Not applicable in
W Cape
0% Not applicable in
W Cape
0%
PHC supervisor visit rate (fixed clinic/CHC/CDC) 94.2% 94.2% 82.9% 94.2% 79.0%
Complaint resolution within 25 working days rate 88.6% 88.7% 96.3% 88.7% 96.3%
Number of fully fledged District Clinical specialist Teams appointed Not applicable in
W Cape
Not applicable in
W Cape
- Not applicable in
W Cape
-
Number of fully-fledged Ward Based Outreach Teams appointed Not applicable in
W Cape
Not applicable in
W Cape
- Not applicable in
W Cape
-
School ISHP coverage 61.6% 61.6% 33.8% 61.6% 39.6%
School Grade 1 screening coverage 29.1% 29.1% 22.6% 29.1% 23.6%
School Grade 4 screening coverage No target set No target set 0.2% No target set 0%
School Grade 8 screening coverage No target set No target set 0.1% No target set 0%
Percentage of fixed facilities that have conducted gap assessments for compliance against the National 29.0% 7.2% 0% 7.2% 1.1%
Compliance Rate of PHC Facilities (of National Core Standards) No target set No target set 0% No target set 0%
District Hospitals
Average Length of Stay 3.2 days 3.2 days 3.2 days 3.2 days 3.1 days
Inpatient Bed Utilisation Rate 83.4% 83.4% 89.4% 83.4% 91.6%
Expenditure per patient day equivalent (PDE) R 1 865 R 1 865 R 1 710 R 1 865 R 1 803
Complaint Resolution within 25 working days rate 78.4% 78.4% 88.6% 78.4% 88.1%
Mental health admission rate Not applicable Not applicable 0.8% Not applicable 1.0%
Percentage of Hospitals that have conducted gap assessments for compliance against the National 76.5% 20.6% 0% 20.6% 2.9%
Proportion of hospitals assessed as compliant with the Extreme Measures of National Core Standards No target set No target set 0% No target set 0%
HIV and AIDS, TB and STI control
Total clients remaining on ART (TROA) at end of the month 174 868 149 265 161 283 157 205 162 845
Number of Medical Male Circumcisions conducted 21 502 5 376 4 264 5 376 4 653
TB (new pulmonary) defaulter rate 7.1% 7.1% 13.9% 7.1% 7.5%
TB AFB sputum result turn-around time under 48 hours rate 69.9% 69.9% 71.4% 69.9% 70.3%
TB new client treatment success rate 85.5% 85.5% 79.6% 85.5% 70.6%
HIV testing coverage (15-49 Years - Annualised) 30.7% 30.7% 29.2% 30.7% 28.0%
TB (new pulmonary) cure rate 82.5% 82.5% 82.0% 82.5% 82.1%
TB MDR confirmed treatment initiation rate No target set No target set 0% No target set 0%
Maternal, child and women health
Immunisation coverage under 1 year 91.9% 91.9% 87.5% 91.9% 84.6%
Vitamin A coverage 12-59 months 44.8% 44.8% 48.4% 44.8% 43.6%
Deworming 12-59 months coverage 30.2% 30.2% 41.8% 30.2% 38.7%
Child under 2 years underweight for age incidence 18.00 18.00 17.01 18.00 14.39
Measles 1st dose under 1 year coverage 92.0% 92.0% 91.1% 92.0% 87.6%
Pneumococcal Vaccine (PCV) 3rd Dose Coverage 92.1% 92.1% 88.7% 92.1% 87.7%
Rote Virus (RV) 2nd Dose Coverage 91.5% 91.5% 92.1% 91.5% 97.9%
Cervical cancer screening coverage 57.0% 57.0% 55.1% 57.0% 67.0%
HPV Vaccine Coverage amongst Grade 4 girls No target set No target set 83.5% No target set 0%
Antenatal 1st visits before 20 weeks rate 64.0% 64.0% 62.0% 64.0% 65.0%
Infant given NVP within 72 hours after birth uptake rate 98.6% 98.6% 99.3% 98.6% 99.2%
Infant 1st PCR Test positive around 6 weeks rate 1.7% 1.7% 1.4% 1.7% 1.6%
Couple year protection rate 61.3% 61.3% 58.6% 61.3% 60.2%
Disease Prevention and Control
Hypertension incidence 10.92 4.00 7.66 2.00 9.55
Diabetes incidence 1.51 1.00 3.42 1.00 4.16
Cataract surgery rate (Uninsured Population) 1 724.0 1 909.0 1 755.9 838.0 1 672.1
Programme 3: Emergency Medical Services
EMS operational ambulance coverage 0.00 0.00 0.40 0.00 0.40
EMS P1 urban response under 15 minutes rate 75.0% 75.0% 56.2% 75.0% 58.6%
EMS P1 rural response under 40 minutes rate 90.0% 90.0% 81.0% 90.0% 83.9%
EMS P1 call response under 60 minutes rate 80.0% 80.0% 94.6% 80.0% 94.7%
Programme 4: Provincial Hospital Services
General (regional) hospitals
Average Length of Stay 3.8 days 3.8 days 3.8 days 3.8 days 3.7 days
Inpatient Bed Utilisation Rate 85.6% 85.8% 86.3% 85.2% 83.8%
Expenditure per patient day equivalent (PDE) R 2 618 R 2 646 R 2 421 R 2 561 R 2 649
Complaint Resolution within 25 working days rate 92.7% 92.2% 94.8% 92.2% 98.5%
Mental health admission rate 1.7% 1.6% 1.5% 1.6% 1.2%
Percentage of Hospitals that have conducted gap assessments for compliance against the National 100.0% 0% 0% 0% 0%
Proportion of hospitals assessed as compliant with the Extreme Measures of National Core Standards No target set No target set 0% No target set 0%

QUARTERLY PERFORMANCE REPORTS: 2014/15 - 2nd Quarter
WESTERN CAPE
Sector: Health
Programme / Subprogramme / Performance Measures Target for
2014/15 as per
Annual
Performance
Plan (APP)
1st Quarter
Planned output
as per APP
1st Quarter
Actual output -
validated
2nd Quarter
Planned output
as per APP
2nd Quarter
Preliminary
output
QUARTERLY OUTPUTS
Programme 5: Central Hospital Services
Tertiary Hospitals
Average Length of Stay 3.7 days 3.7 days 3.9 days 3.7 days 3.8 days
Inpatient Bed Utilisation Rate 85.0% 85.0% 86.4% 85.0% 85.7%
Expenditure per patient day equivalent (PDE) R 4 534 R 4 534 R 4 208 R 4 534 R 4 816
Complaint Resolution within 25 working days rate 90.0% 90.6% 67.6% 90.6% 78.9%
Mental health admission rate N/A N/A 0% N/A 0%
Percentage of Hospitals that have conducted gap assessments for compliance against the National 100.0% 0% 0% 0% 0%
Proportion of hospitals assessed as compliant with the Extreme Measures of National Core Standards No target set No target set 0% No target set 0%
Central Hospitals
Average Length of Stay 6.1 days 6.1 days 6.3 days 6.1 days 6.2 days
Inpatient Bed Utilisation Rate 85.6% 85.6% 85.6% 85.6% 89.3%
Expenditure per patient day equivalent (PDE) R 4 236 R 4 236 R 4 274 R 4 236 R 4 097
Complaint Resolution within 25 working days rate 82.5% 82.2% 86.4% 82.2% 90.3%
Mental health admission rate 1.4% 1.4% 1.3% 1.4% 1.3%
Percentage of Hospitals that have conducted gap assessments for compliance against the National 100.0% 0% 0% 0% 0%
Proportion of hospitals assessed as compliant with the Extreme Measures of National Core Standards No target set No target set 0% 0% 0%
Programme 8: Health Facilities Management
Proportion of Programme 8 budget spent on maintenance (preventative and scheduled) 100.0% 100.0% 107.8% 100.0% 71.0%
Number of districts spending more than 90% of maintenance budget No target set No target set - No target set -
1. Information submitted by: Prof. K. Househam Head Official: Health Western Cape Tel No (021) 483 3647 Dr. J.C. Stregmaan Head Official: Provincial Treasury Western Cape
Related Documents