Quarterly financial report 9M/Q3 2011 The Group’s financial figures at a glance 1 Foreword by the board of management 2 Share 4 Interim group management report 6 The Group and the reporting period 6 Results of operations, net assets and financial position of the Group 6 Business and earnings development by segment 9 Employees 13 Opportunities and risks 13 Subsequent events 13 Forecast for 2011 13 Consolidated interim financial statements 15 Consolidated income statement 15 Consolidated statement of comprehensive income 16 Consolidated statement of financial position 17 Consolidated statement of cash flows 18 Consolidated statement of changes in equity 19 Reporting by operating segment 20 Reporting by product group 20 Notes to the condensed consolidated interim financial statements 21 General 21 Selected notes to the consolidated income statement, the consolidated statement of financial position, the consolidated statement of cash flows and other notes 23 Adjusted income statement/reconciliation 25 Financial calendar, contact, imprint, disclaimer 26

Welcome message from author
This document is posted to help you gain knowledge. Please leave a comment to let me know what you think about it! Share it to your friends and learn new things together.
Transcript

Quarterly financial report 9M/Q3 2011
The Group’s financial figures at a glance 1
Foreword by the board of management 2
Share 4
Interim group management report 6
The Group and the reporting period 6
Results of operations, net assets and financial position of the Group 6
Business and earnings development by segment 9
Employees 13
Opportunities and risks 13
Subsequent events 13
Forecast for 2011 13
Consolidated interim financial statements 15
Consolidated income statement 15
Consolidated statement of comprehensive income 16
Consolidated statement of financial position 17
Consolidated statement of cash flows 18
Consolidated statement of changes in equity 19
Reporting by operating segment 20
Reporting by product group 20
Notes to the condensed consolidated interim financial statements 21
General 21
Selected notes to the consolidated income statement,
the consolidated statement of financial position,
the consolidated statement of cash flows and other notes 23
Adjusted income statement/reconciliation 25
Financial calendar, contact, imprint, disclaimer 26
Page 1
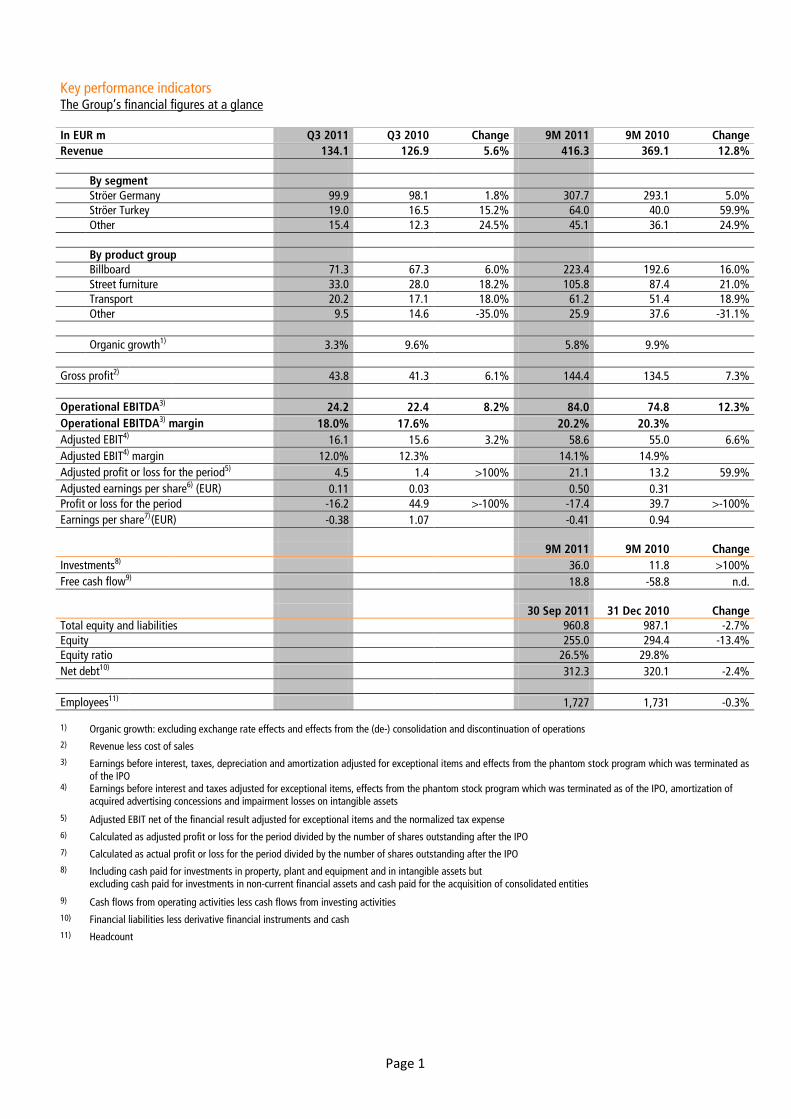
Key performance indicators The Group’s financial figures at a glance In EUR m Q3 2011 Q3 2010 Change 9M 2011 9M 2010 Change Revenue 134.1 126.9 5.6% 416.3 369.1 12.8% By segment Ströer Germany 99.9 98.1 1.8% 307.7 293.1 5.0% Ströer Turkey 19.0 16.5 15.2% 64.0 40.0 59.9% Other 15.4 12.3 24.5% 45.1 36.1 24.9% By product group Billboard 71.3 67.3 6.0% 223.4 192.6 16.0% Street furniture 33.0 28.0 18.2% 105.8 87.4 21.0% Transport 20.2 17.1 18.0% 61.2 51.4 18.9% Other 9.5 14.6 -35.0% 25.9 37.6 -31.1% Organic growth1) 3.3% 9.6%
5.8% 9.9%
Gross profit2) 43.8 41.3 6.1% 144.4 134.5 7.3% Operational EBITDA3) 24.2 22.4 8.2% 84.0 74.8 12.3% Operational EBITDA3) margin 18.0% 17.6% 20.2% 20.3% Adjusted EBIT4) 16.1 15.6 3.2% 58.6 55.0 6.6% Adjusted EBIT4) margin 12.0% 12.3% 14.1% 14.9% Adjusted profit or loss for the period5) 4.5 1.4 >100% 21.1 13.2 59.9% Adjusted earnings per share6) (EUR) 0.11 0.03 0.50 0.31 Profit or loss for the period -16.2 44.9 >-100% -17.4 39.7 >-100% Earnings per share7)
(EUR) -0.38 1.07 -0.41 0.94 9M 2011 9M 2010 Change Investments8) 36.0 11.8 >100% Free cash flow9) 18.8 -58.8 n.d. 30 Sep 2011 31 Dec 2010 Change Total equity and liabilities 960.8 987.1 -2.7% Equity 255.0 294.4 -13.4% Equity ratio 26.5% 29.8% Net debt10) 312.3 320.1 -2.4% Employees11) 1,727 1,731 -0.3%
1) Organic growth: excluding exchange rate effects and effects from the (de-) consolidation and discontinuation of operations 2) Revenue less cost of sales 3) Earnings before interest, taxes, depreciation and amortization adjusted for exceptional items and effects from the phantom stock program which was terminated as
of the IPO 4) Earnings before interest and taxes adjusted for exceptional items, effects from the phantom stock program which was terminated as of the IPO, amortization of
acquired advertising concessions and impairment losses on intangible assets
5) Adjusted EBIT net of the financial result adjusted for exceptional items and the normalized tax expense 6) Calculated as adjusted profit or loss for the period divided by the number of shares outstanding after the IPO 7) Calculated as actual profit or loss for the period divided by the number of shares outstanding after the IPO 8) Including cash paid for investments in property, plant and equipment and in intangible assets but
excluding cash paid for investments in non-current financial assets and cash paid for the acquisition of consolidated entities
9) Cash flows from operating activities less cash flows from investing activities 10) Financial liabilities less derivative financial instruments and cash 11) Headcount

Page 2
Foreword by the board of management
Dear shareholders,
Ströer goes digital! Our Infoscreen brand already has a track record of setting creative and technical standards in moving-picture advertising at local train, tram and bus stations in Germany, which has enabled it to play a key role in the rapid upward trend in the country’s digital out-of-home sector. In 2011, we are again demonstrating our dynamic growth and innovative power in this segment. Firstly, we moved into new dimensions thanks to the nationwide rollout of our out-of-home channel – our network of around 1,000 large-format HD screens – at the 200 most frequented train stations throughout Germany. Secondly, we took another decisive strategic step in expanding our digital reach by recently acquiring ECE flatmedia. This allowed us to create a unique digital platform in Germany that will reach well in excess of 25% of the population. At the beginning of 2012, we will start marketing the ECE flatmedia screens at around 50 shopping centers and we will install additional screens for our out-of-home channel at these centers during the course of the year. These measures will give us greater access to urban shoppers – a particularly relevant target group for advertisers – and will substantially further increase our national and regional customers’ interest in our point-of-sale communications solutions. This is especially important because our customers are changing the way they classify traditional forms of advertising such as radio, TV, print, online and posters. Criteria such as static and moving pictures as well as advertisements inside and outside buildings are now becoming more relevant.
To meet our goal of being the third relevant pillar - alongside TV and the internet - in the moving-picture market for the long term, we bundled our digital expertise in the Ströer Digital segment at our Munich office.
Overall, we continued on our growth path in the first nine months of the year despite growing economic uncertainty. Consolidated revenue was up 12.8% year on year to EUR 416.3m, partly due to the additions made to our investment portfolio in 2010. Adjusted for changes in the consolidated group and effects from exchange rate differences, the Group recorded organic revenue growth of 5.8% in the first nine months of 2011. Operational EBITDA improved 12.3% in the same period to EUR 84.0m, allowing profitability to match the prior-year level. Ströer Germany in particular was instrumental in this positive trend. While Ströer Poland and the giant poster business also saw an increase in their operational EBITDA margins, our performance in Turkey fell short of the prior-year figure due to adverse market conditions, unfavorable currency movements and start-up costs.
There are still no signs of significant changes in government advertising concessions in Germany. The negotiations on the contract for bus and tram stop shelters in Warsaw are continuing and the tender process is expected to reach a conclusion at the beginning of 2012. Ströer therefore has an excellent portfolio of contracts and is in a strong position to take the Group forward.
In view of the acceleration of the structural changes in media use, we continue to expect a generally positive market environment, although the economic and European political situation is not likely to stimulate macroeconomic activity in the short term.

Page 3
We are reiterating our forecast that the Group will record organic revenue growth in the mid-single-digit range for full-year 2011.
Thank you for your trust.
Udo Müller Alfried Bührdel Dirk Wiedenmann

Page 4
Share
Ströer Out-of-Home Media AG’s share price recorded further losses in the third quarter of 2011 in the wake of the European debt crisis and muted investor sentiment toward largely cyclical stocks. On 22 September 2011, the Ströer share fell to its lowest listing in the first nine months of the year (EUR 9.60). However, it recovered to above EUR 10 by the end of September. On 30 September, it closed trading at EUR 10.75, down almost 61% since the start of the year. The SDAX recorded a decrease of just under 17% in the same period. The Ströer share compared with the SDAX (1 January to 30 September 2011)
* 3 Jan 2011 =100, indexed prices, closing prices in Xetra Source: Deutsche Börse Group
Stock exchange listing, market capitalization and trading volume Ströer Out-of-Home Media AG stock is listed in the Prime Standard of the Frankfurt Stock Exchange and has been listed in the SDAX, a selection index of Deutsche Börse, since September 2010. Based on the share price on 30 September 2011, market capitalization came to EUR 453m. A key goal of our investor relations work is to further improve the liquidity of the Ströer share traded continuously on Xetra and thereby boost its attractiveness for investors. In this connection, Ströer Out-of-Home Media AG secured another designated sponsor – Close Brothers Seydler Bank AG – as an exchange broker in July 2011 in addition to J.P. Morgan and Morgan Stanley. The average daily volume of Ströer stock traded on the German stock exchanges was some 44,000 shares in the first nine months of 2011. This represents a significant increase of 36% against the figure for the first six months of just under 33,000. Including over-the-counter trading between investors and brokers, an average of around 144,000 shares were traded daily in the first three quarters. The rise compared with the six-month
*

Page 5
figure of 128,000 shares is mainly due to the share’s significantly higher liquidity at German stock exchanges. This meant that the proportion of OTC transactions fell to 69% in the nine-month period, as against 73% in the first half of the year. Analysts’ coverage The performance of Ströer Out-of-Home Media AG is tracked by 15 teams of analysts. Based on the most recent assessments, 11 of the analysts are giving a “buy” or “overweight” recommendation and 4 say “hold.” The latest broker assessments are available at www.stroeer.de/investor-relations and are presented in the following table: Investment bank Recommendation Berenberg Bank Hold BHF Bank Hold
Citigroup Global Markets Buy Close Brothers Seydler Research Buy
Commerzbank Hold Crédit Agricole Chevreux Buy
Deutsche Bank Buy DZ Bank Buy
Goldman Sachs Buy Hauck & Aufhäuser Institutional Research Buy
J.P. Morgan Buy LGT Bank Attractive
Morgan Stanley Hold The Royal Bank of Scotland Buy
WestLB Buy
Shareholder structure
The total number of Ströer shares issued remained unchanged at 42,098,238. Supervisory board member Dirk Ströer holds 28.43%, CEO Udo Müller holds 28.12% and CFO Alfried Bührdel and board of management member Dirk Wiedenmann together hold around 0.13% of Ströer Out-of-Home Media AG shares. Dirk Ströer, Udo Müller and Alfried Bührdel agreed to a lock-up period of 12 months as part of the IPO which expired on 15 July 2011. As of 30 September 2011, the free float as defined by Deutsche Börse came to 43.45%. According to the notifications made to the Company as of the date of publication of this report on 15 November 2011, the following parties reported to us that they hold more than 3% of the voting rights in Ströer Out-of-Home Media AG: TIAA-CREF (5.69%) and Tiger Global (3.05%). Information on the current shareholder structure is permanently available at www.stroeer.de/investor-relations.

Page 6
Interim group management report
The Group and the reporting period
The Ströer Out-of-Home Media Group is a leading provider of out-of-home media in Europe with key operations in Germany, Turkey and Poland. Through the subsidiaries of the blowUP division, it also has operations in four other European countries. Ströer provides billboard, street furniture and transport media services in all of its core markets.
This interim management report covers the period from 1 January to 30 September 2011.
Results of operations, net assets and financial position of the Group
Results of operations
Consolidated income statement
In EUR m
Q3 2011 Q3 2010 Change
Continuing operations
Revenue 134.1 100.0% 126.9 100.0% 7.1 5.6%
Cost of sales -90.3 -67.3% -85.7 -67.5% -4.6 5.4%
Gross profit 43.8 32.7% 41.3 32.5% 2.5 6.1%
Selling expenses -18.0 -13.4% -16.9 -13.3% -1.1 6.5%
Administrative expenses -18.3 -13.6% -27.5 -21.6% 9.2 -33.5%
Other operating income 2.5 1.9% 66.0 52.0% -63.4 -96.2%
Other operating expenses -3.7 -2.8% -1.6 -1.3% -2.1 >100%
EBIT 6.3 4.7% 61.3 48.3% -54.9 -89.7%
EBITDA 20.6 15.4% 73.9 58.2% -53.2 -72.1%
Operational EBITDA 24.2 18.0% 22.4 17.6% 1.8 8.2%
Financial result -18.3 -13.7% -13.8 -10.9% -4.5 -32.3%
EBT -12.0 -8.9% 47.4 37.3% -59.4 n.d.
Income taxes -4.2 -3.1% -2.5 -2.0% -1.7 69.4%
Post-tax profit or loss from continuing
operations -16.2 -12.1% 44.9 35.4% -61.1 n.d.
Profit or loss for the period -16.2 -12.1% 44.9 35.4% -61.1 n.d.

Page 7
Consolidated income statement
In EUR m
9M 2011 9M 2010 Change
Continuing operations
Revenue 416.3 100.0% 369.1 100.0% 47.2 12.8%
Cost of sales -272.0 -65.3% -234.6 -63.6% -37.4 15.9%
Gross profit 144.4 34.7% 134.5 36.4% 9.9 7.3%
Selling expenses -55.9 -13.4% -51.5 -14.0% -4.4 8.6%
Administrative expenses -56.5 -13.6% -65.8 -17.8% 9.2 -14.0%
Other operating income 9.6 2.3% 72.4 19.6% -62.8 -86.7%
Other operating expenses -12.0 -2.9% -5.0 -1.3% -7.1 >100%
EBIT 29.5 7.1% 84.7 22.9% -55.2 -65.2%
EBITDA 73.8 17.7% 118.0 32.0% -44.3 -37.5%
Operational EBITDA 84.0 20.2% 74.8 20.3% 9.2 12.3%
Financial result -41.9 -10.1% -40.3 -10.9% -1.6 -4.1%
EBT -12.4 -3.0% 44.4 12.0% -56.8 n.d.
Income taxes -4.9 -1.2% -4.7 -1.3% -0.2 4.9%
Post-tax profit or loss from continuing
operations -17.4 -4.2% 39.7 10.8% -57.1 n.d.
Profit or loss for the period -17.4 -4.2% 39.7 10.8% -57.1 n.d.
The Group continued on its growth path in the third quarter. Revenue increased by 12.8% year on year to EUR 416.3m in the first nine months, mainly due to consolidation effects from the additions to the investment portfolio made in the second half of 2010. Adjusted for these changes in the consolidated group and excluding the effects from exchange rate differences, the Group still managed to expand its business volume in Q3.
Operational EBITDA rose 12.3% to EUR 84.0m in line with revenue growth. In addition to the higher gross profit, this reflects the positive effects of maintaining cost ratios in the sales and administrative areas. Despite the increase in revenue, selling expenses as a percentage of revenue were reduced slightly to 13.4%; administrative expenses as a percentage of revenue declined sharply by 4.2 percentage points to 13.6%. It should be noted that administrative expenses in the prior year were heavily impacted by one-time costs of the IPO. Excluding these costs, administrative expenses as a percentage of revenue almost matched the prior-year level.
As explained in the half-year financial report for 2011, other operating expenses are influenced in particular by the effects from a major simplification of the Turkish tax system which most Turkish businesses have taken advantage of and which generally resulted in lump-sum payments for past assessment periods.
Page 8
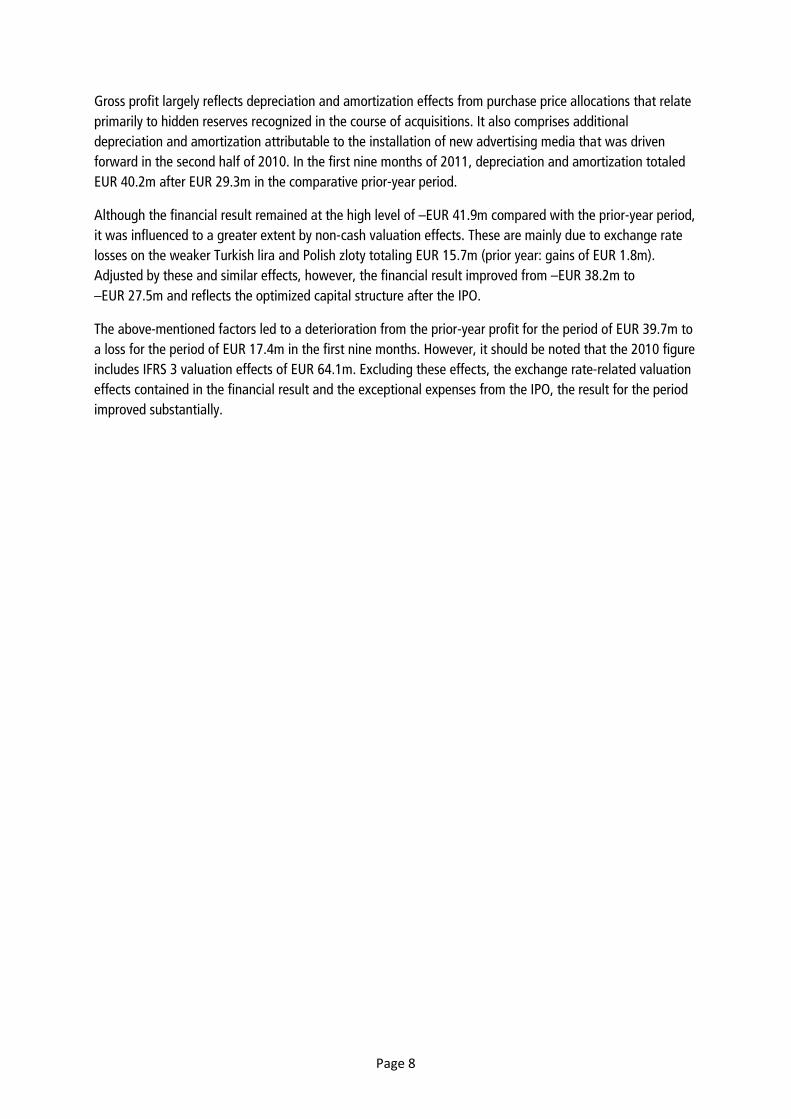
Gross profit largely reflects depreciation and amortization effects from purchase price allocations that relate primarily to hidden reserves recognized in the course of acquisitions. It also comprises additional depreciation and amortization attributable to the installation of new advertising media that was driven forward in the second half of 2010. In the first nine months of 2011, depreciation and amortization totaled EUR 40.2m after EUR 29.3m in the comparative prior-year period.
Although the financial result remained at the high level of –EUR 41.9m compared with the prior-year period, it was influenced to a greater extent by non-cash valuation effects. These are mainly due to exchange rate losses on the weaker Turkish lira and Polish zloty totaling EUR 15.7m (prior year: gains of EUR 1.8m). Adjusted by these and similar effects, however, the financial result improved from –EUR 38.2m to –EUR 27.5m and reflects the optimized capital structure after the IPO.
The above-mentioned factors led to a deterioration from the prior-year profit for the period of EUR 39.7m to a loss for the period of EUR 17.4m in the first nine months. However, it should be noted that the 2010 figure includes IFRS 3 valuation effects of EUR 64.1m. Excluding these effects, the exchange rate-related valuation effects contained in the financial result and the exceptional expenses from the IPO, the result for the period improved substantially.
Page 9
Net assets
Consolidated statement of financial position
In EUR m
30 Sep 2011 31 Dec 2010 Change Assets
Non-current assets
Intangible assets 490.5 531.5 -41.1 -7.7%
Property, plant and equipment 212.3 212.8 -0.5 -0.2%
Tax assets 14.8 9.4 5.4 57.6%
Receivables and other assets 12.3 10.7 1.6 14.6%
729.9 764.5 -34.6 -4.5%
Current assets
Receivables and other assets 101.6 107.2 -5.6 -5.2%
Cash 120.3 106.1 14.1 13.3%
Tax assets 3.5 4.2 -0.7 -17.0%
Inventories 5.6 5.1 0.5 10.6%
231.0 222.6 8.4 3.8%
Total assets 960.8 987.1 -26.2 -2.7%
Equity and liabilities Non-current equity and liabilities Equity 255.0 294.4 -39.4 -13.4%
Debt Financial liabilities 420.1 426.6 -6.5 -1.5%
Deferred tax liabilities 63.4 64.9 -1.5 -2.3%
Provisions 31.3 36.8 -5.5 -15.0%
514.8 528.3 -13.5 -2.6%
Current liabilities Trade payables 80.2 67.9 12.3 18.0%
Financial and other liabilities 78.8 70.3 8.5 12.1%
Provisions 19.4 17.7 1.8 10.0%
Income tax liabilities 12.6 8.4 4.2 49.6%
191.0 164.3 26.7 16.3%
Total equity and liabilities 960.8 987.1 -26.2 -2.7%
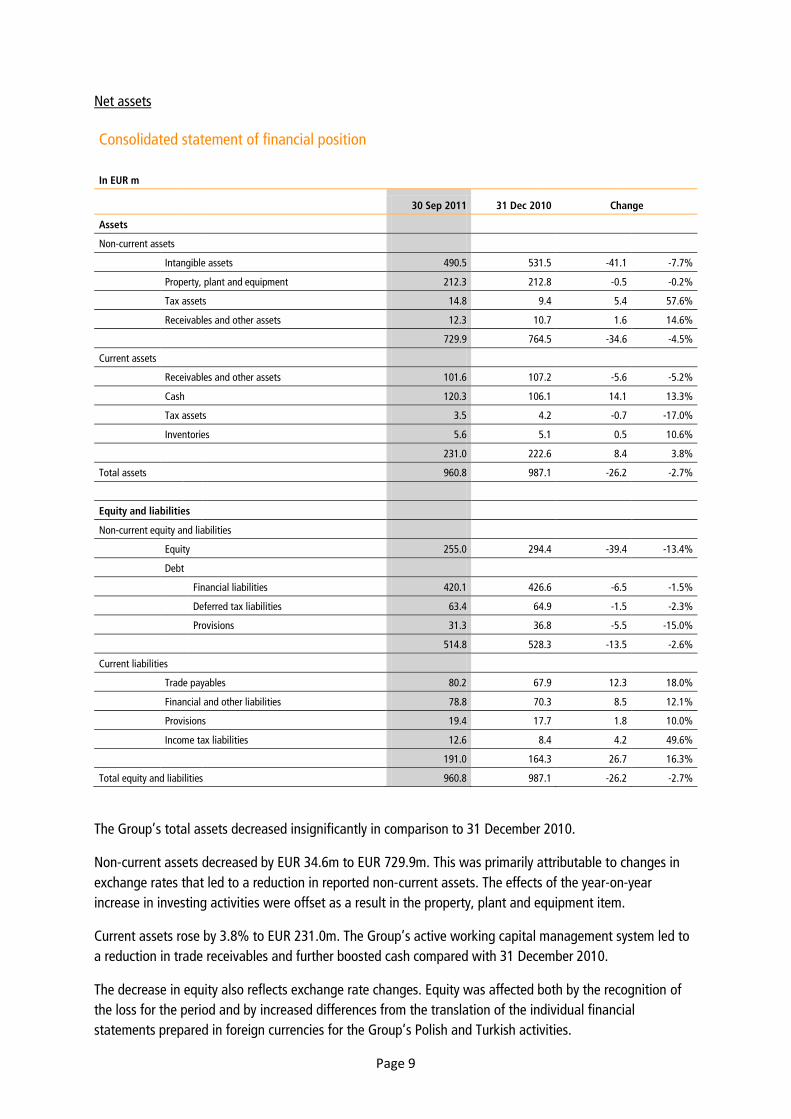
The Group’s total assets decreased insignificantly in comparison to 31 December 2010.
Non-current assets decreased by EUR 34.6m to EUR 729.9m. This was primarily attributable to changes in exchange rates that led to a reduction in reported non-current assets. The effects of the year-on-year increase in investing activities were offset as a result in the property, plant and equipment item.
Current assets rose by 3.8% to EUR 231.0m. The Group’s active working capital management system led to a reduction in trade receivables and further boosted cash compared with 31 December 2010.
The decrease in equity also reflects exchange rate changes. Equity was affected both by the recognition of the loss for the period and by increased differences from the translation of the individual financial statements prepared in foreign currencies for the Group’s Polish and Turkish activities.

Page 10
The reduction in non-current liabilities can be attributed to the positive development of interest rate hedges. Due to the favorable development of the expected term structure, the present values recognized for the interest rate hedges were reduced. The fall in non-current provisions is due to the release of amounts no longer required to settle restoration obligations for advertising media.
The rise in current liabilities is mainly due to revenue-related lease liabilities recognized pro rata temporis.
Financial position
In EUR m 9M 2011 9M 2010
Cash flows from operating activities 54.6 6.6
Cash flows from investing activities -35.7 -65.5
Free cash flow 18.8 -58.8
Cash flows from financing activities -4.7 126.2
Change in cash 14.1 67.4
Cash 120.3 124.7
Due to the improved working capital management system and lower tax and interest payments, the operating cash flow increased significantly in the period under review, up to EUR 54.6m. As of 30 September 2011, cash was above the already high 2010 year-end level despite the uptake in the investing activities. However, it was slightly below the figure for 30 September 2010, which was shaped by the cash inflows from the IPO and did not contain the cash outflow for the acquisition of News Outdoor Poland.
Cash flows from investing activities fell sharply year on year, as the figure for the third quarter of 2010 reflected the increase in the Group’s equity interest in the Turkish company. Nevertheless, they were up by EUR 24.2m on a like-for-like basis.
Net debt
In EUR m
30 Sep 2011 31 Dec 2010 Change
(1) Non-current financial liabilities 420.1 426.6 -6.5 -1.5%
(2) Current financial liabilities 45.9 39.2 6.7 17.2%
(1)+(2) Total financial liabilities 466.0 465.7 0.2 0.1%
(3) Derivative financial instruments 33.5 39.5 -6.1 -15.4%
(1)+(2)-(3) Financial liabilities excl. derivative financial instruments 432.5 426.2 6.3 1.5%
(4) Cash 120.3 106.1 14.1 13.3%
(1)+(2)-(3)-(4) Net debt 312.3 320.1 -7.8 -2.4%
The Group reduced its net debt slightly. This was mainly the result of the positive development of working capital within cash flows from operating activities, which led to the greater release of cash.

Page 11
Business and earnings development by segment
Ströer Germany
In EUR m Q3 2011 Q3 2010 Change 9M 2011 9M 2010 Change
Revenue, thereof 99.9 98.1 1.8 1.8% 307.7 293.1 14.7 5.0%
Billboard 43.9 44.2 -0.3 -0.7% 134.9 132.0 2.8 2.2%
Street furniture 27.5 23.4 4.2 17.8% 89.1 75.2 13.9 18.5%
Transport 20.0 16.7 3.3 19.5% 60.1 50.3 9.8 19.5%
Other 8.5 13.9 -5.3 -38.5% 23.7 35.6 -11.9 -33.4%
Operational EBITDA 22.6 20.8 1.8 8.8% 77.2 69.0 8.2 11.9%
Operational EBITDA margin 22.6% 21.2% up 1.4
percentage points 25.1% 23.5% up1.6
percentage points The Ströer Germany segment continued on its growth path in the third quarter and further increased both revenue and operational EBITDA.
The above-average year-to-date revenue growth recorded by high-margin advertising media in the street furniture and transport product groups was maintained in the third quarter. At the same time, the segment further expanded its successful digital sales activities by increasing revenue by more than 50%. Current surveys by Nielsen also reflect this positive trend: Based on gross advertising revenue, the market research institute identified a sharp increase in advertising expenditure in favor of out-of-home media and reported a year-on-year improvement of 44 basis points in the market share of this form of advertising to 4.5% as of the end of September.
In the “Other” advertising media product group, the decrease in revenue can be attributed to the discontinuation of service activities which are not a focus of the core business, relating to the purchase of additional advertising spaces from third parties by an internal agency. These operations were discontinued at the end of the last fiscal year. This largely explains the difference between the reported and organic revenue growth rate.
Overall, Ströer Germany reported an increase of 160 basis points in the operational EBITDA margin in the period under review. However, the prior-year period was influenced by special effects that reduced margins.
Ströer Turkey
In EUR m Q3 2011 Q3 2010 Change 9M 2011 9M 2010 Change
Revenue, thereof 19.0 16.5 2.5 15.2% 64.0 40.0 24.0 59.9%
Billboard 13.5 11.7 1.7 14.9% 46.8 27.2 19.5 71.8%
Street furniture 5.4 4.5 0.9 20.8% 16.4 12.0 4.4 36.7%
Transport 0.2 0.4 -0.2 -47.9% 0.8 0.8 0.0 2.2%
Operational EBITDA 2.8 2.7 0.1 5.4% 10.9 9.0 1.9 21.2%
Operational EBITDA margin 14.9% 16.3% down 1.4
percentage points 17.0% 22.5% down 5.5
percentage points The development of the Ströer Turkey segment continued to be shaped by the full consolidation performed in September 2010. The comments on revenue and earnings are therefore based on an assumed full consolidation as of 1 January 2010:

Page 12
In EUR m Q3 2011 Q3 2010 Change 9M 2011 9M 2010 Change
Revenue 19.0 23.7 -4.7 -19.8% 64.0 70.7 -6.7 -9.5%
Operational EBITDA 2.8 3.3 -0.5 -14.9% 10.9 15.9 -5.0 -31.6%
Operational EBITDA margin 14.9% 14.0% down 0.9
percentage points 17.0% 22.6% down 5.6
percentage points Adjusted for exchange rate effects, the Ströer Turkey segment recorded low single-digit growth in the first nine months of this year. The slight slowdown in expansion compared with the first half of 2011 is due in particular to a decline in momentum on the Turkish advertising market – which in some cases was significant – in the third quarter. As a result, the uncertainty caused by the law reducing advertising minutes on TV that was introduced at the beginning of the year again led to partial shifts in media budgets in favor of television in Q3. These effects are particularly reflected in sales to national customers for which TV is often the main medium. The Turkish lira continued to devalue against the euro in the third quarter, declining by a further 5.2% compared with the end of Q2 to TRY 2.47. This additionally impacted revenue and operational EBITDA.
The high proportion of advertising concessions with fixed or partially inflation-indexed rental expenses means that the decrease in revenue caused by market-related factors is having a tangible effect on the operational EBITDA margin. At the same time, revenue from certain newly acquired concession rights are only generated in the course of the year even though the related license payments have been due since the beginning of 2011. The Turkey segment improved its margin in the third quarter despite the adverse operating environment.
Other
In EUR m Q3 2011 Q3 2010 Change 9M 2011 9M 2010 Change
Revenue 15.4 12.3 3.0 24.5% 45.1 36.1 9.0 24.9%
Billboard 14.0 11.4 2.6 23.0% 41.8 33.3 8.5 25.4%
Street furniture 0.1 0.1 0.0 -6.7% 0.4 0.3 0.1 18.1%
Transport 0.1 0.1 0.0 -2.1% 0.3 0.4 -0.1 -30.8%
Other 1.2 0.8 0.4 53.4% 2.7 2.1 0.6 26.8%
Operational EBITDA 0.9 0.7 0.3 37.6% 3.2 2.1 1.1 54.2%
Operational EBITDA margin 6.1% 5.5% up 0.6
percentage points 7.0% 5.7% up 1.3
percentage points
The “Other” segment includes our Polish out-of-home activities and the western European giant poster business of the blowUP division.
Revenue only increased due to the initial full consolidation of a new Polish subsidiary acquired in the fourth quarter of 2010.
The performance of the individual operations continued to vary. While the giant poster business recorded growth in the mid-single-digit range in the first nine months, the Polish operations recorded a drop in revenue on a like-for-like basis. Business picked up over the course of the year, improving each quarter, and positive organic revenue growth was posted for the first time in the third quarter.
Page 13
Employees
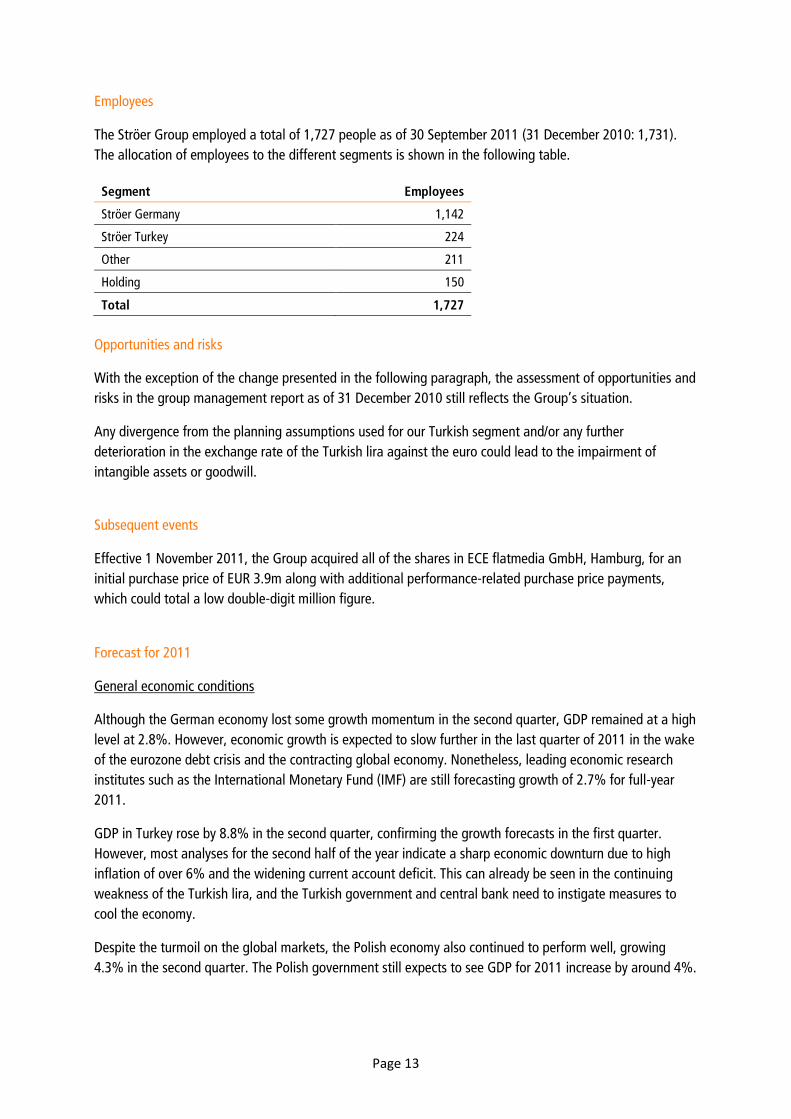
The Ströer Group employed a total of 1,727 people as of 30 September 2011 (31 December 2010: 1,731). The allocation of employees to the different segments is shown in the following table.
Segment Employees
Ströer Germany 1,142
Ströer Turkey 224
Other 211
Holding 150
Total 1,727 Opportunities and risks
With the exception of the change presented in the following paragraph, the assessment of opportunities and risks in the group management report as of 31 December 2010 still reflects the Group’s situation.
Any divergence from the planning assumptions used for our Turkish segment and/or any further deterioration in the exchange rate of the Turkish lira against the euro could lead to the impairment of intangible assets or goodwill.
Subsequent events
Effective 1 November 2011, the Group acquired all of the shares in ECE flatmedia GmbH, Hamburg, for an initial purchase price of EUR 3.9m along with additional performance-related purchase price payments, which could total a low double-digit million figure.
Forecast for 2011
General economic conditions
Although the German economy lost some growth momentum in the second quarter, GDP remained at a high level at 2.8%. However, economic growth is expected to slow further in the last quarter of 2011 in the wake of the eurozone debt crisis and the contracting global economy. Nonetheless, leading economic research institutes such as the International Monetary Fund (IMF) are still forecasting growth of 2.7% for full-year 2011.
GDP in Turkey rose by 8.8% in the second quarter, confirming the growth forecasts in the first quarter. However, most analyses for the second half of the year indicate a sharp economic downturn due to high inflation of over 6% and the widening current account deficit. This can already be seen in the continuing weakness of the Turkish lira, and the Turkish government and central bank need to instigate measures to cool the economy.
Despite the turmoil on the global markets, the Polish economy also continued to perform well, growing 4.3% in the second quarter. The Polish government still expects to see GDP for 2011 increase by around 4%.

Page 14
The industry
The advertising market in Germany is still benefiting from the positive macroeconomic situation. However, the risk that economic growth may let up somewhat at year-end has increased, with some economic research institutes forecasting negative GDP growth for the last quarter of 2011 and the first quarter of 2012. The expected Greek debt cut will not fully resolve the euro debt crisis, which will continue to affect consumer and investor behavior in the future. As regards the structural changes in media use, we still expect to see continued trends indicating a higher market share for out-of-home media. This pattern, which has now been witnessed for some time, is once again reflected in the market research data on the gross advertising market published by Nielsen in September 2011.
Following two quarters of high GDP increases, Turkey is still at risk of overheated domestic demand. The Turkish central bank is addressing this risk with firm monetary and interest rate policy measures. The media market is being significantly influenced by the restrictive TV advertising policy introduced at the start of the year which, despite the substantial price increases for TV advertising times, led to a greater market share for TV and, as a result, largely overshadowed the growth momentum of other media in the year.
The Polish advertising market continued to lag behind the overall national economic development for structural reasons. This was also the case in the out-of-home market, where the continued professionalization and consolidation measures are only gradually making themselves felt. However, the projects initiated, including the industry-wide measurement of the audience reach of all advertising areas (POSTAR), are moving forward. Following the downward development in the first six months, we expect business activities to stabilize in the second half of the year. Nonetheless, the market is likely to remain sensitive to further negative effects from the global economy.
Further outlook for business and earnings development
Ströer’s management is confirming the revenue and margin forecasts made in the report on the first six months of 2011. We therefore still expect to see organic revenue growth for the Group in the mid-single-digit percentage range, which will make it difficult to maintain the operational margin at the prior-year level.

Page 15
2011
Consolidated income statement
In EUR k Q3 2011 Q3 2010 9M 2011 9M 2010
Continuing operationsRevenue 134,064 126,941 416,329 369,092Cost of sales -90,260 -85,668 -271,964 -234,598Gross profit 43,804 41,273 144,365 134,494
Selling expenses -18,020 -16,927 -55,939 -51,490Administrative expenses -18,275 -27,461 -56,540 -65,771Other operating income 2,535 65,959 9,635 72,427Other operating expenses -3,708 -1,593 -12,023 -4,971Finance income 561 2,663 7,656 8,477Finance costs -18,875 -16,511 -49,603 -48,780Profit or loss before taxes -11,978 47,403 -12,449 44,386
Income taxes -4,208 -2,484 -4,913 -4,683Post-tax profit or loss from continuingoperations -16,186 44,919 -17,362 39,703
Profit or loss for the period -16,186 44,919 -17,362 39,703
Thereof attributable to:Owners of the parent -15,161 44,894 -15,667 38,856Non-controlling interests -1,025 25 -1,695 847
Summe (JÜ / JF) -16,186 44,919 -17,362 39,703
Earnings per share (EUR, basic)from continuing operations -0.36 1.91 -0.37 1.65
Earnings per share (EUR, diluted)from continuing operations -0.36 1.03 -0.37 0.89

Page 16
2011
Consolidated statement of comprehensive income
In EUR k Q3 2011 Q3 2010 9M 2011 9M 2010
Profit or loss for the period -16,186 44,919 -17,362 39,703Other comprehensive income
Exchange differences on translating foreign operations -7,715 -2,217 -23,490 -1,176Cash flow hedges -168 1,903 4,956 4,125
Income taxes relating to components of other comprehensive income 55 -603 -1,608 -1,240
Other comprehensive income, net of income taxes -7,828 -917 -20,142 1,709
Total comprehensive income, net of income taxes -24,014 44,002 -37,504 41,412
Thereof attributable to:Owners of the parent -22,369 44,121 -33,541 40,579Non-controlling interests -1,645 -119 -3,963 833
-24,014 44,002 -37,504 41,412

Page 17
2011 30.09.
Consolidated statement of financial positionas of 30 September 2011
Assets (in EUR k) 30 Sep 2011 31 Dec 2010
Non-current assets
Intangible assets 490,455 531,519
Property, plant and equipment 212,317 212,831
Investment property 1,495 1,510
Financial assets 96 96
Trade receivables 272 934
Other financial assets 1,684 2,162
Other non-financial assets 8,754 6,029
Income tax assets 867 845
Deferred tax assets 13,939 8,552
Summe langfristige Vermögenswerte 729,879 764,478
Current assets
Inventories 5,612 5,075
Trade receivables 65,179 73,414
Other financial assets 7,120 8,016
Other non-financial assets 29,284 25,721
Income tax assets 3,512 4,231
Cash 120,261 106,120
Summe kurzfristige Vermögenswerte 230,968 222,577
Summe Aktiva 960,847 987,055
2011 30.09.
Equity and liabilities (in EUR k) 30 Sep 2011 31 Dec 2011Equity
Subscribed capital 42,098 42,098Capital reserves 296,490 296,490Retained earnings -63,029 -42,457Accumulated other comprehensive income -36,590 -18,717
238,969 277,414
Non-controlling interests 16,071 17,028255,040 294,442
Non-current liabilities
Pension provisions and similar obligations 21,007 21,317Other provisions 10,296 15,510Financial liabilities 420,065 426,562Deferred tax liabilities 63,447 64,947
514,818 528,336
Current liabilities
Other provisions 19,444 17,670Financial liabilities 45,911 39,170Trade payables 80,173 67,917Other liabilities 32,908 31,129Income tax liabilities 12,553 8,391
190,989 164,277
Summe Passiva 960,847 987,055

Page 18
Consolidated statement of cash flows 2,011
In EUR k 9M 2011 9M 2010
Cash flows from operating activitiesProfit before interest and taxes from continuing operations 29,498 84,689Write-downs (+) on non-current assets 44,283 33,356Interest paid (-) -21,452 -31,113Interest received (+) 762 1,295Income taxes paid (-)/received (+) -6,550 -6,261Increase (+)/decrease (-) in provisions -3,873 -7,589Other non-cash expenses (+)/income (-) -3,534 -61,315Gain (-)/loss (+) on the disposal of non-current assets 669 887Increase (-)/decrease (+) in inventories, trade receivables
8,371 -10,665Increase (+)/decrease (-) in trade payables
6,382 3,346Cash flows from operating activities 54,556 6,630
Cash flows from investing activities1,506 662
Cash paid (-) for investments in property, plant and equipment -33,594 -10,082Cash paid (-) for investments in intangible assets -2,417 -1,726Cash paid (-) for investments in financial assets -74 0Cash received (+)/paid (-) for the acquisition of
-1,136 -54,319Cash flows from investing activities -35,715 -65,465
Cash flows from financing activitiesCash received (+) from the issue of capital 0 285,466Cash paid (-) to shareholders -1,328 -1,871Cash paid (-) for transaction costs related to borrowings -2,512 -7,623Cash repayments (-) of borrowings -860 -149,741Cash flows from financing activities -4,700 126,232
Cash at the end of the period14,141 67,397
Cash at the beginning of the period 106,120 57,257Cash at the end of the period 120,261 124,654
Composition of cashCash 120,261 124,654Cash at the end of the period 120,261 124,654
consolidated entities
Change in cash
and other assets
and other liabilities
Cash received (+) from the disposal of property, plant and equipment

Page 19
Consolidated statement of changes in equity as of 30 September 2011
Capital reserves Retained earnings Total Non-controlling Total Common shares Preferred shares interests equity
Exchange Cash flowdifferences hedges
on translatingforeign
In EUR k operations
1 Jan 2011 42,098 0 296,490 -42,457 -10,979 -7,738 277,414 17,028 294,442Profit or loss for the period 0 0 0 -15,666 0 0 -15,666 -1,696 -17,362Other comprehensive income 0 0 0 0 -21,221 3,348 -17,873 -2,269 -20,142
Total comprehensive income 0 0 0 -15,666 -21,221 3,348 -33,539 -3,965 -37,504Change in basis of consolidation 0 0 0 0 0 0 0 -569 -569Effects from the sale of ownership interests in subsidiaries without loss of control 0 0 0 1,265 0 0 1,265 -1,265 0Obligation to purchase treasury shares 0 0 0 -6,171 0 0 -6,171 6,171 0Dividends 0 0 0 0 0 0 0 -1,328 -1,32830 Sep 2011 42,098 0 296,490 -63,029 -32,200 -4,390 238,969 16,071 255,040
Capital reserves Retained earnings Total Non-controlling Total Common shares Preferred shares interests equity
Exchange Cash flowdifferences hedges
on translatingforeign
In EUR k operations
1 Jan 2010 474 38 34,509 -81,543 -4,667 -12,424 -63,614 15,528 -48,086Profit or loss for the period 0 0 0 38,856 0 0 38,856 847 39,703Other comprehensive income 0 0 0 -1,161 2,884 1,723 -14 1,709
Total comprehensive income 0 0 0 38,856 -1,161 2,884 40,579 833 41,412Change in basis of consolidation 0 0 0 0 0 0 0 16,944 16,944Capital increase using company funds 21,312 1,728 -8,997 -14,043 0 0 0 0 0Issue of shares 20,312 -1,766 273,415 -10,178 0 0 281,783 0 281,783Direct costs relating to going public (after tax) 0 0 -2,429 0 0 0 -2,429 0 -2,429Obligation to purchase treasury shares 0 0 0 14,568 0 0 14,568 -14,568 0Dividends 0 0 0 -3 0 0 -3 -1,868 -1,87130 Sep 2010 42,098 0 296,498 -52,343 -5,827 -9,540 270,885 16,869 287,754
comprehensive income
Subscribed capital Accumulated othercomprehensive income
Subscribed capital Accumulated other

Page 20
Reporting by operating segment
In EUR kStröer
GermanyStröer
TurkeyOther Reconciliation Group value
In EUR kStröer
GermanyStröer
TurkeyOther Reconciliation Group value
Q3 2011 9M 2011
External revenue 99,760 19,020 15,284 0 134,064 External revenue 307,518 63,760 45,051 0 416,329Internal revenue 159 20 75 -254 0 Internal revenue 213 200 75 -488 0Segment revenue 99,919 19,041 15,358 -254 134,064 Segment revenue 307,731 63,961 45,125 -488 416,329Operational EBITDA 22,615 2,836 938 -2,193 24,196 Operational EBITDA 77,201 10,901 3,181 -7,319 83,964
External revenue 98,137 16,535 12,269 0 126,941 External revenue 293,038 40,003 36,051 0 369,092Internal revenue 4 0 72 -76 0 Internal revenue 12 0 85 -97 0Segment revenue 98,141 16,535 12,341 -76 126,941 Segment revenue 293,050 40,003 36,136 -97 369,092Operational EBITDA 20,782 2,691 682 -1,782 22,373 Operational EBITDA 68,993 8,993 2,063 -5,271 74,778
Reporting by product group
In EUR kBillboard Street furniture Transport Other Group value
In EUR kBillboard Street furniture Transport Other Group value
Q3 2011 9M 2011
External revenue 71,330 33,045 20,225 9,464 134,064 External revenue 223,428 105,806 61,155 25,940 416,329
Q3 2010 9M 2010
External revenue 67,276 27,959 17,146 14,560 126,941 External revenue 192,569 87,447 51,428 37,649 369,092
9M 2010Q3 2010

Page 21
Notes to the condensed consolidated interim financial statements
General
1 Information on the Company and Group
Ströer Out-of-Home Media AG (Ströer) has its registered office at Ströer Allee 1 in Cologne (Germany) and is entered in the commercial register of Cologne Local Court under HRB no. 41548.
The purpose of the entities (the Ströer Group or the Group) included in the condensed consolidated interim financial statements (the consolidated interim financial statements) is the commercialization of out-of-home media. The Group uses all forms of out-of-home media, from traditional billboards and transport media through to digital media to reach its target audience. See the relevant explanations in the notes to the consolidated financial statements as of 31 December 2010 for a detailed description of the Group’s structure and its operating segments.
2 Basis of preparation of the financial statements
The consolidated interim financial statements for the period from 1 January to 30 September 2011 were prepared in accordance with IAS 34, Interim Financial Reporting. The consolidated interim financial statements must be read in conjunction with the consolidated financial statements as of 31 December 2010.
The disclosures required by IAS 34 on changes to items in the consolidated statement of financial position (also known as a balance sheet), the consolidated income statement and the consolidated statement of cash flows are made in the interim group management report.
Due to rounding differences, figures in tables may differ slightly from the actual figures.
The interim consolidated financial statements and interim group management report were not the subject of a review.
3 Accounting policies
The figures disclosed in these consolidated interim financial statements were determined in accordance with International Financial Reporting Standards (IFRSs) as adopted by the EU. The accounting policies applied in the consolidated financial statements as of 31 December 2010 were also applied in these consolidated interim financial statements.
4 Accounting estimates
Preparation of the consolidated interim financial statements in compliance with IFRSs requires management to make assumptions and estimates which have an impact on the figures disclosed in the consolidated financial statements and consolidated interim financial statements. The estimates are based on historical data and other information on the transactions concerned. Actual results may differ from such estimates. The accounting estimates and assumptions applied in the consolidated financial statements as of 31 December 2010 were also used to determine the estimated values presented in these consolidated interim financial statements.

Page 22
5 Related party disclosures
See the consolidated financial statements as of 31 December 2010 for information on related party disclosures. There were no significant changes as of 30 September 2011.
6 Segment information
See the explanations in the consolidated financial statements as of 31 December 2010 for information on the different segments and product groups.
Reconciliation of the segment reporting by operating segment
In EUR k 9M 2011 9M 2010
Total segment results (operational EBITDA) 91,283 80,049
Material items -7,319 -5,271
Group operational EBITDA 83,964 74,778
Adjustment effects -10,183 43,267
EBITDA 73,781 118,045
Amortization and depreciation -44,283 -33,356
Finance income 7,656 8,477
Finance costs -49,603 -48,780
Consolidated profit or loss before income taxes -12,449 44,386
In EUR k Q3 2011 Q3 2010
Total segment results (operational EBITDA) 26,389 24,155
Material items -2,193 -1,782
Group operational EBITDA 24,196 22,373
Adjustment effects -3,549 51,514
EBITDA 20,647 73,887
Amortization and depreciation -14,311 -12,636
Finance income 561 2,663
Finance costs -18,875 -16,511
Consolidated profit or loss before income taxes -11,978 47,403

Page 23
Selected notes to the consolidated income statement, the consolidated statement of financial position, the consolidated statement of cash flows and other notes
7 Seasonality
The Group’s revenue and earnings are seasonal in nature. Revenue and earnings are generally lower in the first and third quarters compared to the second and fourth quarters.
8 Disclosures on business combinations
Acquisition of CBA Iletisim ve Reklam Pazarlama Ltd. Sti., Turkey
With effect as of 2 August 2011, the Group acquired all of the shares in CBA Iletisim ve Reklam Pazarlama Ltd. Sti., Istanbul, Turkey (CBA). The entity is engaged in the commercialization of out-of-home media. The entity was acquired to allow the Group to gain a stronger foothold in the Turkish out-of-home market.
The acquisition gave rise to transaction costs of EUR 22k which were reported under administrative expenses.
The fair values of the assets and liabilities acquired are presented below:
In EUR k
Advertising concessions 115
Property, plant and equipment 642
Deferred tax assets 24
Inventories 20
Trade receivables 596
Financial assets 4
Other assets 182
Cash 35
Pension provisions 1
Trade payables 102
Financial liabilities 1,577
Other liabilities 41
Income tax liabilities 67
Net assets acquired -169
The fair value and gross amount of the receivables acquired break down as follows:
In EUR k Fair value Gross amount
Trade receivables (current) 694 577
Other receivables 186 186
The fair value of the receivables acquired is the best estimate for the expected cash flows from these receivables.

Page 24
The fair value of the assets and liabilities in the purchase price allocation is still provisional. Hence, the fair values of the assets and liabilities acquired and goodwill may be adjusted. In addition, the effect from the price adjustment clauses contained in the purchase agreement cannot be assessed at present. The purchase price and hence goodwill may also be adjusted as a result.
The goodwill breaks down as follows:
In EUR k
Purchase price 1,000
Purchase price payments in subsequent periods
4,500
Non-controlling interests 567
Net assets acquired -169
Goodwill 5,102
The allocation for indirect non-controlling interests was made on the basis of the share in equity/the carrying amount of the equity interest.
Since control was obtained, CBA has contributed the following revenue and profit or loss after taxes which are included in the consolidated income statement.
In EUR k Revenue Profit after taxes
2 Aug to 30 Sep 2011 222 -98
9 Subsequent events
Effective 1 November 2011, the Group acquired all of the shares in ECE flatmedia GmbH, Hamburg, for an initial purchase price of EUR 3.9m along with additional performance-related purchase price payments, which could total a low double-digit million figure. The acquisition serves to extend the Group’s digital advertising media portfolio. No further information required by IFRS 3 on this acquisition can be disclosed at present.
Cologne, 14 November 2011
Ströer Out-of-Home Media AG
Udo Müller Alfried Bührdel Dirk Wiedenmann Chief Executive Officer Chief Financial Officer Member of the Board

Page 25
Adjusted income statement Reconciliation of the consolidated income statement to the non-IFRS figures disclosed in the financial reports
Q3 2011 In EUR m
Income statement
in accordance with IFRSs
Reclassification of amortization,
depreciation and impairment losses
Reclassification of adjustment
items
Income statement for management
accounting purposes
Impairment and amortization
of advertising concessions
Valuation effects from derivatives
Exchange rate effects from
intragroup loans
Tax normalization
Elimination of exceptional items
Adjusted income
statement for Q3 2011
Adjusted income
statement for Q3 2010
Revenue 134.1 134.1 134.1 126.9 Cost of sales -90.3 13.0 -77.3 -77.3 -74.4 Selling expenses -18.0 Administration expenses -18.3 Overheads -36.3 1.3 2.6 -32.3 -32.3 -31.1 Other operating income 2.5 Other operating expenses -3.7 Other operating result -1.2 0.9 -0.2 -0.2 0.8 Operational EBITDA 24.2 24.2 22.4 Amortization and depreciation -14.3 -14.3 6.2 -8.1 -6.8 Operational EBIT 9.9 16.1 15.6 Exceptional items -3.5 -3.5 3.5 0.0 0.0 Finance income 0.6 Finance costs -18.9 Net financial result -18.3 -18.3 1.1 7.9 -9.3 -13.4 Income taxes -4.2 -4.2 2.0 -2.2 -0.7 Profit or loss for the period -16.2 0.0 0.0 -16.2 6.2 1.1 7.9 2.0 3.5 4.6 1.4
9M 2011 In EUR m
Income statement
in accordance with IFRSs
Reclassification of amortization.
depreciation and impairment losses
Reclassification of adjustment
items
Income statement for management
accounting purposes
Impairment and amortization
of advertising concessions
Valuation effects from derivatives
Exchange rate effects from
intragroup loans
Tax normalization
Elimination of exceptional items
Adjusted income
statement for 9M 2011
Adjusted income
statement for 9M 2010
Revenue 416.3 416.3 416.3 369.1 Cost of sales -272.0 40.3 -231.6 -231.6 -205.2 Selling expenses -55.9 Administrative expenses -56.5 Overheads -112.5 4.0 5.5 -103.0 -103.0 -92.1 Other operating income 9.6 Other operating expenses -12.0 Other operating result -2.4 4.7 2.3 2.3 2.9 Operational EBITDA 84.0 84.0 74.8 Amortization and depreciation -44.3 -44.3 19.0 -25.3 -19.8 EBIT 39.7 58.6 55.0 Exceptional items -10.2 -10.2 10.2 0.0 0.0 Finance income 7.7 Finance costs -49.6 Net financial result -41.9 -41.9 -1.2 15.7 -27.5 -35.7 Income taxes -4.9 -4.9 -5.2 -10.1 -6.1 Profit or loss for the period -17.4 0.0 0.0 -17.4 19.0 -1.2 15.7 -5.2 10.2 21.1 13.2

Page 26
Financial calendar Ströer will publish the financial calendar for 2012 on the homepage www.stroeer.de/investor-relations in December 2011. IR contact Press contact Ströer Out-of-Home Media AG Ströer Out-of-Home Media AG Stefan Hütwohl Claudia Fasse Director Group Finance and Investor Relations Director Group Communication Ströer Allee 1 . 50999 Cologne Ströer Allee 1 . 50999 Cologne +49 (0)2236 . 96 45-356 Phone +49 (0)2236 . 96 45-246 Phone +49 (0)2236 . 96 45-6356 Fax +49 (0)2236 . 96 45-6246 Fax [email protected] [email protected] Imprint Publisher Ströer Out-of-Home Media AG Ströer Allee 1 . 50999 Cologne +49 (0)2236 . 96 45-0 Phone +49 (0)2236 . 96 45-299 Fax [email protected] Cologne Local Court HRB no. 41 548 VAT identification no.: DE811763883 This interim report was published on 15 November 2011 and is available in German and English. Disclaimer This interim report contains forward-looking statements which entail risks and uncertainties. The actual business development and results of Ströer Out-of-Home Media AG and of the Group may differ significantly from the assumptions made in this interim report. This interim report does not constitute an offer to sell or an invitation to submit an offer to purchase securities of Ströer Out-of-Home Media AG. There is no obligation to update the statements made in this interim report.
Related Documents