National Credit Union Administration Quarterly Credit Union Data Summary 2019 Q4

Welcome message from author
This document is posted to help you gain knowledge. Please leave a comment to let me know what you think about it! Share it to your friends and learn new things together.
Transcript

National Credit Union AdministrationQuarterly Credit Union
Data Summary2019 Q4

i
Credit Union System Performance Data: 2019 Q4
The Quarterly Credit Union Data Summary provides an overview of the financial performance of federally insured credit unions based on information reported by those credit unions to the National Credit Union Administration in the 2019Q4 Call Report. As of Dec. 31, 2019, there were 5,236 federally insured credit unions with 120.4 million members.
Please direct inquiries about the quarterly performance report to [email protected].
Selected Performance Indicators ■ Total assets in federally insured credit unions rose by $113 billion, or 7.8 percent, over the year ending in
the fourth quarter of 2019, to $1.57 trillion.
■ Total loans outstanding increased $64 billion, or 6.2 percent, over the year to $1.1 trillion. The average outstanding loan balance in the fourth quarter of 2019 was $15,669, up $371, or 2.4 percent, from one year earlier.
■ The delinquency rate at federally insured credit unions was 71 basis points in the fourth quarter of 2019, unchanged from one year earlier. The net charge-off ratio was 56 basis points, down slightly from 58 basis points in the fourth quarter of 2018.
■ Insured shares and deposits rose $85 billion, or 7.4 percent, over the four quarters of 2019, to $1.2 trillion.
■ The loan-to-share ratio stood at 84.0 percent in the fourth quarter of 2019, down from 85.6 percent in the fourth quarter of 2018.
■ The credit union system’s net worth ratio was 11.37 percent in the fourth quarter of 2019, compared with 11.30 percent one year earlier.
■ Net income totaled $14.1 billion at an annual rate in the fourth quarter of 2019, up $1.1 billion, or 8.8 percent, from the same period a year ago.
■ The net interest margin for federally insured credit unions was $47.8 billion in the fourth quarter of 2019, or 3.2 percent of average assets. That compares with $44.3 billion, or 3.1 percent of average assets, in the fourth quarter of 2018.
■ The return on average assets for federally insured credit unions was 94 basis points over the year ending in the fourth quarter of 2019, up from 92 basis points in the fourth quarter of 2018. The median return on average assets across all federally insured credit unions was 60 basis points, up 4 basis points from the fourth quarter of 2018.
■ The number of federally insured credit unions declined to 5,236 in the fourth quarter of 2019, from 5,375 in the fourth quarter of 2018. In the fourth quarter of 2019, there were 3,283 federal credit unions and 1,953 federally insured, state-chartered credit unions. The year-over-year decline is consistent with long-running industry consolidation trends.
■ The number of credit unions with a low-income designation rose to 2,605 in the fourth quarter of 2019 from 2,554 one year earlier.
■ Federally insured credit unions added 4.2 million members over the year, and credit union membership in these institutions reached 120.4 million in the fourth quarter of 2019.

ii
Balance Sheet DetailsAssets
■ Total assets in federally insured credit unions rose by $113 billion, or 7.8 percent, over the year to $1.57 trillion in the fourth quarter of 2019.
■ Cash and equivalents (assets with maturity of three months or less) increased $28.6 billion, or 30.9 percent, to $121.3 billion.
■ Total investments (instruments with maturities in excess of three months) rose $9.9 billion, or 3.9 percent, to $263.2 billion.
• Investments with maturities of less than one year rose $7.3 billion, or 10.1 percent, to $79.7 billion.• Investments with maturities of one to three years rose $5.6 billion, or 6.5 percent, to $91.8 billion.• Investments with maturities of three to five years fell $4.6 billion, or 7.8 percent, to $54.7 billion.• Investments with maturities of five to 10 years declined $0.2 billion, or 0.6 percent, to $31.4 billion.• Investments with maturities greater than 10 years increased $1.8 billion, or 45.7 percent, to $5.7 billion.
■ Total loans outstanding increased $64 billion, or 6.2 percent, over the year, to $1.1 trillion. Credit union loan balances rose over the year in every major category, compared with the fourth quarter of 2018.
• Loans secured by 1- to 4-family residential properties increased $33.4 billion, or 7.5 percent, to $480.3 billion in the fourth quarter of 2019.
• Auto loans increased $9.2 billion, or 2.5 percent, to $375.1 billion. Used auto loans rose $8.8 billion, or 4.0 percent, to $227.5 billion. New auto loans edged up $0.4 billion, or 0.3 percent, to $147.6 billion.
• Credit card balances rose $4.2 billion, or 6.8 percent, to $66.0 billion• Non-federally guaranteed student loans rose $0.4 billion, or 7.4 percent, to $5.5 billion.• Commercial loans, excluding unfunded commitments, increased $10.9 billion, or 15.3 percent, over
the year to $81.8 billion in the fourth quarter of 2019. Commercial loans are not directly comparable to member business loans.
■ The delinquency rate at federally insured credit unions was 71 basis points in the fourth quarter of 2019, unchanged compared with the fourth quarter of 2018. Loan performance was mixed across major categories:
• The delinquency rate on fixed-rate real estate loans was 42 basis points in the fourth quarter, down slightly from 44 basis points one year earlier.
• The credit card delinquency rate rose to 140 basis points from 135 basis points in the fourth quarter of 2018.
• For auto loans, the delinquency rate edged down 1 basis point to 65 basis points in the fourth quarter of 2019.
• The delinquency rate for commercial loans, excluding unfunded commitments, declined to 63 basis points in the fourth quarter of 2019, from 67 basis points in the fourth quarter of 2018.
■ The net charge-off ratio for all federally insured credit unions was 56 basis points in the fourth quarter of 2019, compared with 58 basis points in the fourth quarter of 2018.
Liabilities and Net Worth
■ Credit union shares and deposits rose by $100.0 billion, or 8.2 percent, over the year to $1.32 trillion in the fourth quarter of 2019. Regular shares increased $15.0 billion, or 3.5 percent, to $444.6 billion. Other deposits increased $67.2 billion, or 11.2 percent, to $667.2 billion, led by share certificate accounts, which were up $48.9 billion, or 20.5 percent.
■ The credit union system’s net worth increased by $14.0 billion, or 8.5 percent, over the year to $178.3 billion. The aggregate net worth ratio — net worth as a percentage of assets — stood at 11.37 percent in the fourth quarter of 2019, up from 11.30 percent one year earlier.
iii
Income Statement Details ■ Net income for federally insured credit unions in the fourth quarter of 2019 totaled $14.1 billion at an
annual rate, up $1.1 billion, or 8.8 percent, from the fourth quarter of 2018. Interest income rose $7.2 billion, or 13.4 percent, over the year to $61.3 billion, and non-interest income increased $1.4 billion, or 7.3 percent, to $21.2 billion.
■ Interest expense totaled $13.5 billion annualized in the fourth quarter of 2019, up $3.7 billion, or 38.4 percent, from one year earlier. Non-interest expenses grew $3.9 billion, or 8.7 percent, over the year to $48.4 billion in the fourth quarter. Rising labor expenses, which were up $2.3 billion, or 10.0 percent, accounted for more than half of the increase in non-interest expenses.
■ The aggregate net interest margin widened by $3.5 billion, or 7.9 percent, over the year to $47.8 billion at an annual rate in the fourth quarter of 2019.
■ The credit union system’s provision for loan and lease losses or credit loss expense edged down $0.05 billion, or 0.8 percent, over the year, to $6.5 billion at an annual rate in the fourth quarter of 2019.
Performance by Asset CategoryConsistent with long-running trends, credit unions with assets of at least $1 billion reported the strongest growth in loans, membership, and net worth over the year ending in the fourth quarter of 2019. Credit unions with less than $500 million in assets reported declines in those categories over the year.
■ The number of federally insured credit unions with assets of at least $1 billion increased to 330 in the fourth quarter of 2019 from 308 in the fourth quarter of 2018. These 330 credit unions held $1.1 trillion in assets, or 68 percent of total system assets. Credit unions in this category reported loan growth of 9.7 percent. Membership rose 8.4 percent. Net worth increased 12.4 percent.
■ The number of federally insured credit unions with assets of at least $500 million but less than $1 billion rose to 247 in the fourth quarter of 2019 from 237 in the fourth quarter of 2018. These 247 credit unions held $172.7 billion in total assets, or 11 percent of total system assets. Credit unions in this category reported a 1.9 percent increase in total loans outstanding over the year. Membership rose 0.3 percent, and net worth increased 3.3 percent.
■ The number of federally insured credit unions with at least $100 million but less than $500 million in assets declined to 1,018 in the fourth quarter of 2019 from 1,026 in the fourth quarter of 2018. These 1,018 credit unions held $227.8 billion in total assets, or 15 percent of total system assets. Credit unions in this category reported a 3.0 percent decline in total loans outstanding. Membership fell 4.6 percent. Net worth edged up 0.6 percent.
■ The number of federally insured credit unions with at least $50 million but less than $100 million in assets declined to 677 in the fourth quarter of 2019 from 688 in the fourth quarter of 2018. These 677 credit unions held $48.5 billion in total assets, or 3 percent of total system assets. Credit unions in this category reported a 2.4 percent decrease in total loans. Membership fell 4.3 percent. Net worth rose 1.1 percent.
■ The number of federally insured credit unions with assets of at least $10 million but less than $50 million declined to 1,635 in the fourth quarter of 2019 from 1,695 in the fourth quarter of 2018. These credit unions held $41.3 billion in assets, or 3 percent of total system assets. Credit unions in this category reported a 3.0 percent decrease in loans. Membership declined 5.8 percent. Net worth fell 1.0 percent.
■ The number of federally insured credit unions with less than $10 million in assets declined to 1,329 in the fourth quarter of 2019 from 1,421 in the fourth quarter of 2018. These credit unions held $5.5 billion in assets, or 0.4 percent of total system assets. Credit unions in this category reported a 7.0 percent decline in loans. Membership fell 9.1 percent. Net worth declined 4.6 percent.
iv
Notes to UsersChanges to Quarterly Credit Union Data Summary
Two changes were made to the income statement tables in the Credit Union Data Summary with the release of the 2019Q1 Call Report:
(1) A new variable, interest income on securities held in a trading account, was added to the total interest income section.
The Financial Accounting Standards Board (FASB) on Jan. 5, 2016, issued a new Accounting Standards Update (ASU), Financial Instruments—Overall (Subtopic 825-10): Recognition and Measurement of Financial Assets and Financial Liabilities. The new standard addresses certain aspects of recognition, measurement, presentation, and disclosure of financial instruments. The main objective in developing this new ASU is to enhance the reporting model for financial instruments to provide users of financial statements with more useful information.
This ASU affects all reporting organizations, whether public or private, that hold financial assets or owe financial liabilities. For all nonpublic organizations, including not-for-profit organizations and employee benefit plans, the ASU is effective for fiscal years beginning after Dec. 15, 2018, and interim periods within fiscal years beginning after Dec. 15, 2019.
For additional information on this new accounting standard see:
FASB Accounting Standards Update No. 2016-1: Financial Instruments – Overall (Subtopic 825-10), Recognition and Measurement of Financial Assets and Financial Liabilities, January 2016 https://www.fasb.org/jsp/FASB/Document_C/DocumentPage?cid=1176167762170&acceptedDisclaimer=true
FASB In Focus: Accounting Standards Update, Financial Instruments—Overall (Subtopic 825-10): Recognition and Measurement of Financial Assets and Financial Liabilities, January 5, 2016 https://www.fasb.org/cs/ContentServer?c=Document_C&cid=1176167762630&d=&pagename=FASB%2FDocument_C% 2FDocumentPage
(2) The provision for loan and lease losses variable was expanded to include credit loss expense and is now called provision for loan and lease losses or credit loss expense.
This change stems from a new accounting standard issued by the Financial Accounting Standards Board (FASB), Accounting Standards Update (ASU) No. 2016-13, Topic 326, Financial Instruments – Credit Losses, on June 16, 2016. The new accounting standard introduces the current expected credit losses methodology (CECL) for estimating allowances for credit losses. The new standard applies to all banks, savings associations, credit unions, and financial institution holding companies (hereafter, institutions), regardless of size, that file regulatory reports for which the reporting requirements conform to U.S. generally accepted accounting principles (GAAP).
By issuing CECL, the FASB:
• Removed the “probable” threshold and the “incurred” notion as triggers for credit loss recognition and instead adopted a standard that states that financial instruments carried at amortized cost should reflect the net amount expected to be collected.
• Broadened the range of data that is incorporated into the measurement of credit losses to include forward-looking information, such as reasonable and supportable forecasts, in assessing the collectability of financial assets.
• Introduced a single measurement objective for all financial assets carried at amortized cost.
Effective date for credit unions: For an entity that is not a Public Business Entity (non-PBE), the credit losses standard is effective for fiscal years beginning after Dec. 15, 2022, including interim periods within those fiscal years. Thus, for a non-PBE with a calendar year fiscal year, the standard is effective Jan. 1, 2023, and the entity must first apply the new accounting standard in its financial statements and regulatory reports (e.g., the Call Report) for the quarter ended March 31, 2023. However, the new CECL standard allows for

v
early adoption as of Jan. 1, 2019.
For additional information on this new accounting standard see:
FASB Accounting Standards Update No. 2016-13, Financial Instruments - Credit Losses (Topic 326): Measurement of Credit Losses on Financial Instruments, June 2016 https://www.fasb.org/jsp/FASB/Document_C/DocumentPage?cid=1176168232528&acceptedDisclaimer=true
FASB Accounting Standards Update No. 2018-19, Codification Improvements to Topic 326, Financial Instruments – Credit Losses, November 2018 https://www.fasb.org/jsp/FASB/Document_C/DocumentPage?cid=1176171644373&acceptedDisclaimer=true
FASB Accounting Standard Update No. 2019-05, Financial Instruments – Credit Losses (Topic 326): Targeted Transition Relief, May 2019
https://www.fasb.org/jsp/FASB/Document_C/DocumentPage?cid=1176172668879&acceptedDisclaimer=true
Frequently Asked Questions on the New Accounting Standard on Financial Instruments – Credit Losses https://www.fdic.gov/news/news/financial/2019/fil19020a.pdf
Previous Changes:
Starting with the quarter ending Sept. 30, 2017, data available from the Call Report began to reflect changes made necessary by the member business loan rule that took effect in January 2017. The change was part of NCUA’s Regulatory Modernization Initiative.
The NCUA Board amended the MBL rule to give federally insured credit unions greater flexibility and individual autonomy to safely and soundly provide commercial and business loans to serve their members. The revised rule replaced prescriptive requirements and limitations—such as collateral and security requirements, equity requirements, and loan limits—with a broad principles-based regulatory approach. One immediate result was the elimination of the MBL waiver process, which is no longer needed under a principles-based rule.
The new rule required changes to the member business accounts in the Call Report. Starting with the 2017Q3 Call Report, almost all MBL accounts were deleted and replaced with new commercial loan accounts. A commercial loan is defined as:
Any loan, line of credit, or letter of credit (including any unfunded commitments), and any interest a credit union obtains in such loans made by another lender, to individuals, sole proprietorships, partnerships, corporations, or other business enterprises for commercial, industrial, agricultural, or professional purposes, but not for personal expenditure purposes.1
Some loans that might otherwise be classified as commercial—not for personal expenditure purposes—are not included in the commercial loans definition. These are:
■ Loans made by a corporate credit union; ■ Loans made by a federally insured credit union to another federally insured credit union; ■ Loans made by a federally insured credit union to a credit union service organization; ■ Loans secured by a 1- to 4-family residential property whether or not it is the borrower’s primary residence
(securing greater than 50 percent of the principal amount of the loan at origination); ■ Loans fully secured by shares in the credit union making the extension of credit or deposits in other
financial institutions; ■ Loans secured by a vehicle manufactured for household use; and ■ Loans that would otherwise meet the definition of commercial loan and which, when the aggregate
outstanding balances plus unfunded commitments less any portion secured by shares in the credit union to a borrower or an associated borrower, are equal to less than $50,000.
1 See NCUA Rules and Regulations 723.2 for a complete definition.
vi
In Call Reports prior to the Sept. 30, 2017 version, member business loans (acct_400T) included member (acct_400A) and non-member (acct_400B) business loans plus unfunded commitments. The Call Report continues to collect selected MBL-related accounts, which are necessary to comply with the Federal Credit Union Act. Account 400A was specifically carried over to capture total MBLs for measuring against the statutory cap. Beginning with the Sept. 30, 2017 Call Report, account 400A is labeled “Total member business loans—Net member business loan balance (NMBLB).”2 (Refer to NCUA 5300 Call Report instructions for information on other MBL-related accounts.)
Section 105 of the Economic Growth, Regulatory Relief, and Consumer Protection Act (S.2155) amended the statutory member business loan limit to exempt all loans secured by a 1- to 4-family dwelling (residential property) from the definition of a member business loan. Previously, only loans secured by a 1- to 4-family dwelling that is the member’s primary residence were excluded. This change was reflected in the NCUA’s Rules and Regulations through a NCUA Board notation vote on May 30, 2018 and took effect with the 2018Q2 Call Report. Beginning in 2018Q2, the revised definition of a member business loan in account 400A should not include any loans secured by a 1- to 4-family residential property. For additional information on this change and other changes in S.2155 applicable to credit unions see: https://www.ncua.gov/newsroom/Pages/ncua-report/2019/third-quarter/frequently-asked-questions-impact-s2155-credit-unions.aspx
While there are conceptual similarities between MBLs and commercial loans, because they are defined differently, it is inappropriate to directly compare previous MBL accounts with new commercial loan accounts. In 2017Q3 and 2017Q4, the Quarterly Credit Union Data Summary reflected this by showing MBL and commercial loan data separately. Beginning in 2018Q1, the Quarterly Credit Union Data Summary displays only commercial loans.
The changes described above primarily affect the loan section of the balance sheet tables in the Quarterly Credit Union Data Summary, beginning with the release of the 2017Q3 data:
■ Commercial loans, year-to-date, at an annual rate and the commercial loan delinquency rate appear in the Summary Credit Union Data table on page one. Commercial loans, excluding unfunded commitments, are included in the loan section of the Balance Sheet on pages four and five. Each of these data series begins in 2017Q3; data before 2017Q3 are not available.
■ Historical data on member business loans and the member business loan delinquency rate are also included in these tables. For all MBL variables, the final quarter of data is 2017Q2. Starting in 2018Q1, MBLs are no longer included in the loan section of the balance sheet, though the MBL account required for statutory purposes does appear in a separate Addenda item on the balance sheet tables to allow for historical comparisons.
■ Due to changes to the Call Report resulting from the new MBL rule, a new variable, long-term assets, percent of assets, has replaced net long-term assets, percent of assets. Long-term assets represents the sum of real estate fixed-rate first mortgages and investments greater than three years.
With the release of the 2018Q1 Call Report, three new real estate loan variables were added to the loan section of the balance sheet tables in the Quarterly Credit Union Data Summary.
■ These new variables are loans secured by 1- to 4-family residential properties, loans secured by 1- to 4-family residential properties secured by first lien, and loans secured by 1- to 4-family residential properties secured by junior lien.
■ Two new commercial loan variables were added to the loan section of the balance sheet: commercial loans secured by real estate and commercial loans not secured by real estate.
■ Real estate loans and real estate fixed-rate, first-mortgage loans were replaced by the three new real estate loan variables described above. These two accounts are still shown as separate Addenda items at the bottom of the balance sheet tables to allow for historical comparisons.
■ Net member business loan balance for regulatory reporting, Part 723 (account 400A), is also reported as a separate Addenda item. This series extends back to 2004Q1.
2 See NCUA Rules and Regulations, 723.8 for a more complete discussion of what constitutes a member business loan for account 400A.
vii
For additional information on these new loan categories, see NCUA 5300 Call Report Instructions, effective Sept. 30, 2017, at https://www.ncua.gov/regulation-supervision/Pages/documents/call-report-instructions-9302018.pdf.
For more information on the new MBL rule, see National Credit Union Administration, 12 CFR Parts 701, 723, and 741 Member Business Loans; Commercial Lending; Final Rule in Federal Register, Vol. 81, No. 49, Monday, March 14, 2016, Rules and Regulations, page 13530.
https://www.ncua.gov/newsroom/Pages/ncua-report/2019/third-quarter/frequently-asked-questions-impact-s2155-credit-unions.aspx
Data Source and Additional Resources
The financial information that appears in this publication is obtained from the NCUA 5300 Call Report submitted by all federally insured credit unions.
Additional resources are available at www.ncua.gov:
■ Detailed credit union system performance data available on NCUA’s Credit Union and Call Report Data webpage, including Call Report data files, Call Report quarterly summaries and financial performance reports.
■ NCUA’s Credit Union and Call Report Data page also includes a report on Financial Trends in Federally Insured Credit Unions illustrating industry trends.
1
Summary of Federally Insured Credit Union Call Report Data: 2019 Q4Same quarter as current, previous years Most recent four quarters Most Recent
Date Units 2009.4 2010.4 2011.4 2012.4 2013.4 2014.4 2015.4 2016.4 2017.4 2018.4 2019.1 2019.2 2019.3 2019.4 4 Quarter % change
4 Quarter change
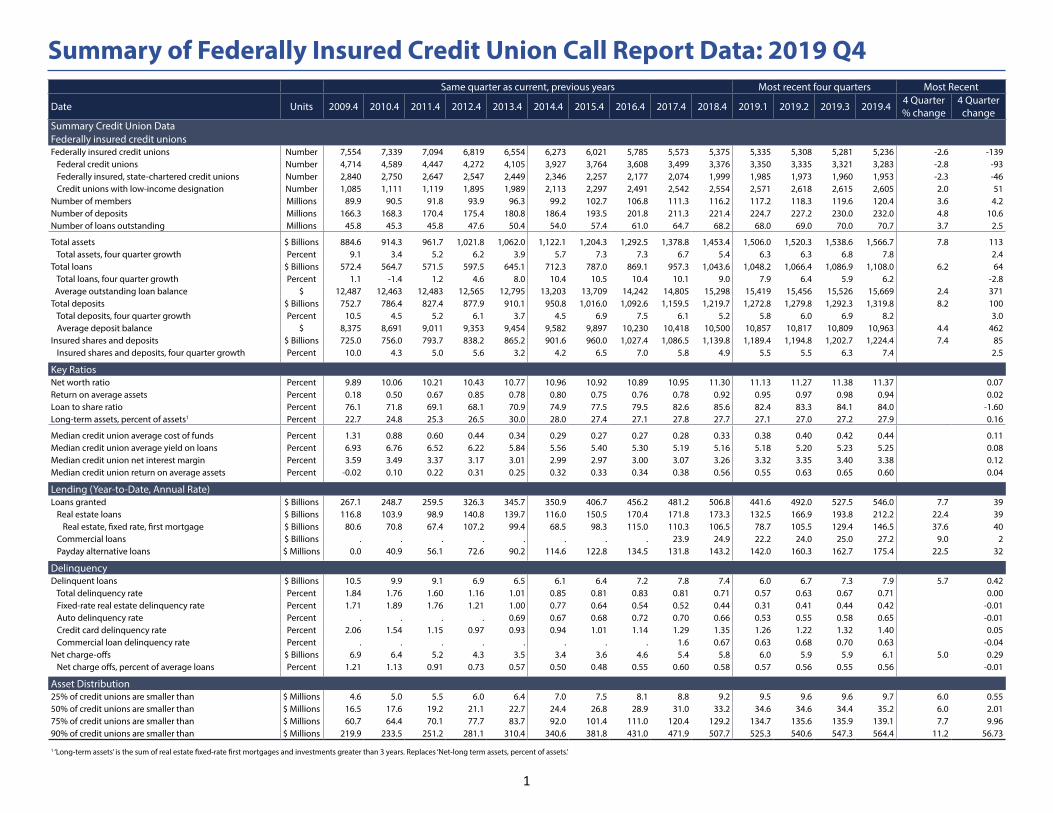
Summary Credit Union DataFederally insured credit unionsFederally insured credit unions Number 7,554 7,339 7,094 6,819 6,554 6,273 6,021 5,785 5,573 5,375 5,335 5,308 5,281 5,236 -2.6 -139 Federal credit unions Number 4,714 4,589 4,447 4,272 4,105 3,927 3,764 3,608 3,499 3,376 3,350 3,335 3,321 3,283 -2.8 -93 Federally insured, state-chartered credit unions Number 2,840 2,750 2,647 2,547 2,449 2,346 2,257 2,177 2,074 1,999 1,985 1,973 1,960 1,953 -2.3 -46 Credit unions with low-income designation Number 1,085 1,111 1,119 1,895 1,989 2,113 2,297 2,491 2,542 2,554 2,571 2,618 2,615 2,605 2.0 51Number of members Millions 89.9 90.5 91.8 93.9 96.3 99.2 102.7 106.8 111.3 116.2 117.2 118.3 119.6 120.4 3.6 4.2Number of deposits Millions 166.3 168.3 170.4 175.4 180.8 186.4 193.5 201.8 211.3 221.4 224.7 227.2 230.0 232.0 4.8 10.6Number of loans outstanding Millions 45.8 45.3 45.8 47.6 50.4 54.0 57.4 61.0 64.7 68.2 68.0 69.0 70.0 70.7 3.7 2.5
Total assets $ Billions 884.6 914.3 961.7 1,021.8 1,062.0 1,122.1 1,204.3 1,292.5 1,378.8 1,453.4 1,506.0 1,520.3 1,538.6 1,566.7 7.8 113 Total assets, four quarter growth Percent 9.1 3.4 5.2 6.2 3.9 5.7 7.3 7.3 6.7 5.4 6.3 6.3 6.8 7.8 2.4Total loans $ Billions 572.4 564.7 571.5 597.5 645.1 712.3 787.0 869.1 957.3 1,043.6 1,048.2 1,066.4 1,086.9 1,108.0 6.2 64 Total loans, four quarter growth Percent 1.1 -1.4 1.2 4.6 8.0 10.4 10.5 10.4 10.1 9.0 7.9 6.4 5.9 6.2 -2.8 Average outstanding loan balance $ 12,487 12,463 12,483 12,565 12,795 13,203 13,709 14,242 14,805 15,298 15,419 15,456 15,526 15,669 2.4 371Total deposits $ Billions 752.7 786.4 827.4 877.9 910.1 950.8 1,016.0 1,092.6 1,159.5 1,219.7 1,272.8 1,279.8 1,292.3 1,319.8 8.2 100 Total deposits, four quarter growth Percent 10.5 4.5 5.2 6.1 3.7 4.5 6.9 7.5 6.1 5.2 5.8 6.0 6.9 8.2 3.0 Average deposit balance $ 8,375 8,691 9,011 9,353 9,454 9,582 9,897 10,230 10,418 10,500 10,857 10,817 10,809 10,963 4.4 462Insured shares and deposits $ Billions 725.0 756.0 793.7 838.2 865.2 901.6 960.0 1,027.4 1,086.5 1,139.8 1,189.4 1,194.8 1,202.7 1,224.4 7.4 85 Insured shares and deposits, four quarter growth Percent 10.0 4.3 5.0 5.6 3.2 4.2 6.5 7.0 5.8 4.9 5.5 5.5 6.3 7.4 2.5
Key Ratios Net worth ratio Percent 9.89 10.06 10.21 10.43 10.77 10.96 10.92 10.89 10.95 11.30 11.13 11.27 11.38 11.37 0.07Return on average assets Percent 0.18 0.50 0.67 0.85 0.78 0.80 0.75 0.76 0.78 0.92 0.95 0.97 0.98 0.94 0.02Loan to share ratio Percent 76.1 71.8 69.1 68.1 70.9 74.9 77.5 79.5 82.6 85.6 82.4 83.3 84.1 84.0 -1.60Long-term assets, percent of assets1 Percent 22.7 24.8 25.3 26.5 30.0 28.0 27.4 27.1 27.8 27.7 27.1 27.0 27.2 27.9 0.16
Median credit union average cost of funds Percent 1.31 0.88 0.60 0.44 0.34 0.29 0.27 0.27 0.28 0.33 0.38 0.40 0.42 0.44 0.11Median credit union average yield on loans Percent 6.93 6.76 6.52 6.22 5.84 5.56 5.40 5.30 5.19 5.16 5.18 5.20 5.23 5.25 0.08Median credit union net interest margin Percent 3.59 3.49 3.37 3.17 3.01 2.99 2.97 3.00 3.07 3.26 3.32 3.35 3.40 3.38 0.12Median credit union return on average assets Percent -0.02 0.10 0.22 0.31 0.25 0.32 0.33 0.34 0.38 0.56 0.55 0.63 0.65 0.60 0.04
Lending (Year-to-Date, Annual Rate) Loans granted $ Billions 267.1 248.7 259.5 326.3 345.7 350.9 406.7 456.2 481.2 506.8 441.6 492.0 527.5 546.0 7.7 39 Real estate loans $ Billions 116.8 103.9 98.9 140.8 139.7 116.0 150.5 170.4 171.8 173.3 132.5 166.9 193.8 212.2 22.4 39 Real estate, fixed rate, first mortgage $ Billions 80.6 70.8 67.4 107.2 99.4 68.5 98.3 115.0 110.3 106.5 78.7 105.5 129.4 146.5 37.6 40 Commercial loans $ Billions . . . . . . . . 23.9 24.9 22.2 24.0 25.0 27.2 9.0 2 Payday alternative loans $ Millions 0.0 40.9 56.1 72.6 90.2 114.6 122.8 134.5 131.8 143.2 142.0 160.3 162.7 175.4 22.5 32
Delinquency Delinquent loans $ Billions 10.5 9.9 9.1 6.9 6.5 6.1 6.4 7.2 7.8 7.4 6.0 6.7 7.3 7.9 5.7 0.42 Total delinquency rate Percent 1.84 1.76 1.60 1.16 1.01 0.85 0.81 0.83 0.81 0.71 0.57 0.63 0.67 0.71 0.00 Fixed-rate real estate delinquency rate Percent 1.71 1.89 1.76 1.21 1.00 0.77 0.64 0.54 0.52 0.44 0.31 0.41 0.44 0.42 -0.01 Auto delinquency rate Percent . . . . 0.69 0.67 0.68 0.72 0.70 0.66 0.53 0.55 0.58 0.65 -0.01 Credit card delinquency rate Percent 2.06 1.54 1.15 0.97 0.93 0.94 1.01 1.14 1.29 1.35 1.26 1.22 1.32 1.40 0.05 Commercial loan delinquency rate Percent . . . . . . . . 1.6 0.67 0.63 0.68 0.70 0.63 -0.04Net charge-offs $ Billions 6.9 6.4 5.2 4.3 3.5 3.4 3.6 4.6 5.4 5.8 6.0 5.9 5.9 6.1 5.0 0.29 Net charge offs, percent of average loans Percent 1.21 1.13 0.91 0.73 0.57 0.50 0.48 0.55 0.60 0.58 0.57 0.56 0.55 0.56 -0.01
Asset Distribution25% of credit unions are smaller than $ Millions 4.6 5.0 5.5 6.0 6.4 7.0 7.5 8.1 8.8 9.2 9.5 9.6 9.6 9.7 6.0 0.5550% of credit unions are smaller than $ Millions 16.5 17.6 19.2 21.1 22.7 24.4 26.8 28.9 31.0 33.2 34.6 34.6 34.4 35.2 6.0 2.0175% of credit unions are smaller than $ Millions 60.7 64.4 70.1 77.7 83.7 92.0 101.4 111.0 120.4 129.2 134.7 135.6 135.9 139.1 7.7 9.9690% of credit unions are smaller than $ Millions 219.9 233.5 251.2 281.1 310.4 340.6 381.8 431.0 471.9 507.7 525.3 540.6 547.3 564.4 11.2 56.73
1 ‘Long-term assets’ is the sum of real estate fixed-rate first mortgages and investments greater than 3 years. Replaces ‘Net-long term assets, percent of assets.’

2
Summary of Federally Insured Credit Union Call Report Data: 2019 Q4Same quarter as current, previous years Most recent four quarters Most Recent
Date Units 2009.4 2010.4 2011.4 2012.4 2013.4 2014.4 2015.4 2016.4 2017.4 2018.4 2019.1 2019.2 2019.3 2019.4 4 Quarter % change
4 Quarter change
Income and Expenses (Year-to-date, Annual Rate)Federally insured credit unionsGross income $ Billions 55.9 52.1 50.2 50.8 50.0 51.7 55.0 60.0 65.6 73.8 78.7 80.5 81.9 82.5 11.8 8.70Total interest income $ Billions 42.0 40.1 37.9 36.2 35.3 36.9 39.2 42.6 47.5 54.0 59.1 60.0 60.8 61.3 13.4 7.25 Gross interest income $ Billions 35.8 34.5 32.8 31.7 31.2 32.6 34.9 37.8 41.7 47.1 50.8 51.5 52.4 53.0 12.4 5.83 Less interest refunds $ Billions 0.0 0.0 0.0 0.0 0.0 0.1 0.1 0.1 0.1 0.1 0.0 0.0 0.0 0.1 -19.2 -0.01 Investment income $ Billions 6.2 5.6 5.2 4.5 4.2 4.4 4.4 4.8 5.8 7.0 8.1 8.4 8.4 8.3 17.7 1.24 Trading income $ Billions 0.0 0.0 0.0 0.0 0.0 0.0 0.0 0.0 0.0 0.0 . . . . -- -- Interest income on securities held in a trading account $ Billions . . . . . . . . . . 0.3 0.1 0.1 0.1 -- --Total non-interest income $ Billions 13.9 12.0 12.3 14.6 14.7 14.7 15.8 17.4 18.1 19.8 19.6 20.6 21.0 21.2 7.3 1.45 Fee income $ Billions 7.0 7.0 6.9 7.4 7.4 7.2 7.5 8.0 8.3 8.8 8.3 8.7 9.0 9.1 3.4 0.30 Other operating income $ Billions 4.5 4.9 5.2 6.8 7.0 7.1 8.0 8.9 9.4 10.7 10.3 10.9 11.2 11.4 6.6 0.71 Other (including gains/losses) $ Billions 2.4 0.0 0.1 0.4 0.3 0.5 0.4 0.5 0.4 0.3 1.0 1.0 0.8 0.7 146.8 0.44
Total expenses (with provision for loan and lease losses or credit loss expense) $ Billions 54.4 47.5 43.9 42.4 41.9 43.0 46.3 50.4 55.2 60.8 64.7 66.2 67.2 68.4 12.4 7.55
Non-interest expenses $ Billions 30.1 29.6 30.6 31.6 32.9 34.0 36.3 38.8 41.2 44.5 46.1 47.1 47.7 48.4 8.7 3.85 Labor expense $ Billions 13.7 14.0 14.5 15.5 16.3 17.1 18.4 19.7 21.1 22.6 23.9 24.3 24.5 24.9 10.0 2.26 Office expenses $ Billions 7.4 7.5 7.6 8.0 8.3 8.8 9.3 9.8 10.3 11.2 11.6 11.7 11.9 12.0 7.3 0.82 Loan servicing expenses $ Billions 1.7 1.8 2.0 2.2 2.4 2.5 2.6 2.7 2.8 3.1 3.0 3.1 3.2 3.2 4.1 0.13 Other non-interest expenses $ Billions 7.3 6.3 6.5 5.9 5.9 5.7 6.0 6.5 7.0 7.6 7.6 7.9 8.1 8.3 8.6 0.65Total interest expense $ Billions 14.8 10.9 8.7 7.2 6.2 5.9 6.0 6.6 7.5 9.8 12.2 12.7 13.1 13.5 38.4 3.75 Interest on borrowed money $ Billions 1.3 1.0 0.9 0.8 0.7 0.8 0.8 0.9 1.2 1.5 1.6 1.5 1.5 1.5 3.4 0.05 Share dividends $ Billions 12 8.6 6.8 5.6 4.8 4.6 4.7 5.1 5.7 7.4 9.4 9.9 10.3 10.7 43.5 3.24 Interest on deposits $ Billions 1.8 1.2 0.9 0.8 0.6 0.6 0.6 0.6 0.7 0.9 1.1 1.2 1.3 1.3 52.5 0.46Provision for loan and lease losses or credit loss expense $ Billions 9.6 7.0 4.7 3.6 2.7 3.1 4.1 5.1 6.4 6.5 6.4 6.4 6.4 6.5 -0.8 -0.05
Net income $ Billions 1.5 4.5 6.3 8.5 8.1 8.7 8.7 9.5 10.4 13.0 14.1 14.4 14.7 14.1 8.8 1.14 Net income, percent of average assets Percent 0.18 0.50 0.67 0.85 0.78 0.80 0.75 0.76 0.78 0.92 0.95 0.97 0.98 0.94 0.02Net interest margin $ Billions 27.2 29.2 29.2 29.0 29.1 31.0 33.2 36.0 39.9 44.3 46.9 47.3 47.7 47.8 7.9 3.50 Net interest margin, percent of average assets Percent 3.21 3.25 3.12 2.92 2.80 2.84 2.85 2.88 2.99 3.13 3.17 3.18 3.19 3.16 0.04
Average assets $ Billions 847.8 899.5 938.0 991.7 1,041.9 1,092.0 1,163.2 1,248.4 1,335.6 1,416.1 1,479.7 1,486.8 1,496.0 1,510.1 6.6 93.95

3
Summary of Federally Insured Credit Union Call Report Data: 2019 Q4Same quarter as current, previous years Most recent four quarters Most Recent
Date Units 2009.4 2010.4 2011.4 2012.4 2013.4 2014.4 2015.4 2016.4 2017.4 2018.4 2019.1 2019.2 2019.3 2019.4 4 Quarter % change
4 Quarter change
Income and Expenses (Year-to-date, Annual Rate, Percent of Average Assets)Federally insured credit unionsGross income Percent 6.59 5.79 5.35 5.13 4.80 4.73 4.73 4.80 4.91 5.21 5.32 5.42 5.47 5.46 0.25Total interest income Percent 4.95 4.46 4.04 3.65 3.39 3.38 3.37 3.41 3.55 3.82 4.00 4.03 4.07 4.06 0.24 Gross interest income Percent 4.22 3.84 3.49 3.20 2.99 2.98 3.00 3.03 3.12 3.33 3.43 3.46 3.50 3.51 0.18 Less interest refunds Percent 0.01 0.00 0.00 0.00 0.00 0.01 0.00 0.00 0.00 0.01 0.00 0.00 0.00 0.00 0.00 Investment income Percent 0.74 0.62 0.56 0.46 0.40 0.41 0.38 0.38 0.44 0.50 0.55 0.56 0.56 0.55 0.05 Trading income Percent 0.00 0.00 0.00 0.00 0.00 0.00 0.00 0.00 0.00 0.00 . . . . -- Interest income on securities held in a trading account Percent . . . . . . . . . . 0.02 0.01 0.01 0.01 --Total non-interest income Percent 1.64 1.33 1.31 1.48 1.41 1.35 1.36 1.39 1.36 1.40 1.33 1.38 1.41 1.41 0.01 Fee income Percent 0.83 0.78 0.74 0.74 0.71 0.66 0.65 0.64 0.62 0.62 0.56 0.58 0.60 0.60 -0.02 Other operating income Percent 0.53 0.55 0.56 0.69 0.67 0.65 0.68 0.71 0.71 0.76 0.69 0.74 0.75 0.76 0.00 Other (including gains/losses) Percent 0.28 0.00 0.01 0.04 0.03 0.04 0.03 0.04 0.03 0.02 0.07 0.06 0.06 0.05 0.03
Total expenses (with provision for loan and lease losses or credit loss expense) Percent 6.42 5.28 4.68 4.27 4.02 3.93 3.98 4.04 4.14 4.30 4.37 4.45 4.49 4.53 0.23
Non-interest expenses Percent 3.55 3.29 3.26 3.18 3.16 3.11 3.12 3.10 3.09 3.14 3.12 3.16 3.19 3.20 0.06 Labor expense Percent 1.61 1.56 1.54 1.56 1.56 1.56 1.58 1.58 1.58 1.60 1.62 1.63 1.64 1.65 0.05 Office expenses Percent 0.87 0.83 0.81 0.81 0.80 0.81 0.80 0.79 0.77 0.79 0.78 0.79 0.79 0.79 0.00 Loan servicing expenses Percent 0.20 0.20 0.21 0.22 0.23 0.23 0.22 0.22 0.21 0.22 0.21 0.21 0.21 0.21 -0.01 Other non-interest expenses Percent 0.86 0.70 0.69 0.59 0.57 0.52 0.52 0.52 0.52 0.54 0.51 0.53 0.54 0.55 0.01Total interest expense Percent 1.74 1.21 0.93 0.73 0.59 0.54 0.52 0.53 0.57 0.69 0.82 0.85 0.88 0.90 0.21 Interest on borrowed money Percent 0.15 0.11 0.10 0.08 0.07 0.07 0.07 0.07 0.09 0.10 0.11 0.10 0.10 0.10 0.00 Share dividends Percent 1.38 0.96 0.73 0.57 0.46 0.42 0.40 0.40 0.43 0.52 0.64 0.67 0.69 0.71 0.18 Interest on deposits Percent 0.21 0.14 0.10 0.08 0.06 0.05 0.05 0.05 0.05 0.06 0.08 0.08 0.09 0.09 0.03Provision for loan and lease losses or credit loss expense Percent 1.13 0.78 0.50 0.36 0.26 0.28 0.35 0.41 0.48 0.46 0.43 0.43 0.43 0.43 -0.03
Net income Percent 0.18 0.50 0.67 0.85 0.78 0.80 0.75 0.76 0.78 0.92 0.95 0.97 0.98 0.94 0.02Net interest margin Percent 3.21 3.25 3.12 2.92 2.80 2.84 2.85 2.88 2.99 3.13 3.17 3.18 3.19 3.16 0.04

4
Summary of Federally Insured Credit Union Call Report Data: 2019 Q4Same quarter as current, previous years Most recent four quarters Most Recent
Date Units 2009.4 2010.4 2011.4 2012.4 2013.4 2014.4 2015.4 2016.4 2017.4 2018.4 2019.1 2019.2 2019.3 2019.4 4 Quarter % change
4 Quarter change
Balance SheetFederally insured credit unionsTotal assets $ Billions 884.6 914.3 961.7 1,021.8 1,062.0 1,122.1 1,204.3 1,292.5 1,378.8 1,453.4 1,506.0 1,520.3 1,538.6 1,566.7 7.8 113.31
Cash and equivalents (less than 3 months) $ Billions 67.6 74.4 95.2 100.9 87.4 85.8 94.5 97.7 98.7 92.6 131.3 120.2 115.8 121.3 30.9 28.65 Cash on hand $ Billions 7.6 7.7 7.9 8.3 9.0 9.7 9.9 10.1 10.5 10.9 10.6 10.7 10.9 12.0 10.0 1.09
InvestmentsTotal investments (more than 3 months) $ Billions 210.8 238.9 256.9 280.4 285.7 275.8 272.8 269.1 261.9 253.2 258.6 261.3 261.0 263.2 3.9 9.93 Investments less than 1 year $ Billions 81.1 72.8 71.2 77.8 70.5 67.3 67.6 75.5 72.7 72.3 75.1 78.3 78.6 79.7 10.1 7.33 Investments 1-3 years $ Billions 79.1 94.0 106.0 106.9 89.2 99.5 101.7 94.9 86.4 86.2 86.3 91.6 93.4 91.8 6.5 5.60 Investments 3-10 years $ Billions 46.2 66.9 73.8 89.3 118.9 103.3 99.0 94.8 98.8 90.8 92.8 87.2 83.5 86.0 -5.3 -4.78 Investments 3-5 years $ Billions 33.2 46.8 54.4 64.6 79.4 75.6 71.2 64.2 67.3 59.3 58.4 57.3 53.7 54.7 -7.8 -4.59 Investments 5-10 years $ Billions 13.0 20.2 19.4 24.7 39.6 27.7 27.7 30.7 31.5 31.5 34.4 30.0 29.9 31.4 -0.6 -0.19 Investments more than 10 years $ Billions 4.4 5.2 6.0 6.4 7.2 5.6 4.5 3.9 4.0 3.9 4.3 4.2 5.5 5.7 45.7 1.79
Total loans $ Billions 572.4 564.7 571.5 597.5 645.1 712.3 787.0 869.1 957.3 1,043.6 1,048.2 1,066.4 1,086.9 1,108.0 6.2 64.44Loans secured by 1-4 family residential properties $ Billions . . . . . . . . 405.9 446.9 449.4 456.9 466.8 480.3 7.5 33.44 Secured by first lien $ Billions . . . . . . . . 339.2 367.4 369.2 375.2 384.4 397.8 8.3 30.34 Secured by junior lien $ Billions . . . . . . . . 66.7 79.4 80.2 81.7 82.5 82.5 3.9 3.10All other real estate loans $ Billions . . . . . . . . 11.7 3.8 3.6 3.6 3.6 3.1 -16.4 -0.62Credit cards $ Billions 34.9 35.9 37.4 39.5 42.6 46.0 48.8 52.7 57.5 61.8 61.1 62.4 63.8 66.0 6.8 4.18Auto loans $ Billions 173.4 164.4 165.1 178.5 198.7 230.0 261.8 298.4 332.5 365.9 366.4 370.5 374.2 375.1 2.5 9.19 New autos $ Billions 75.2 62.9 58.3 63.3 71.3 86.4 99.9 116.6 132.1 147.2 146.0 146.5 147.3 147.6 0.3 0.37 Used autos $ Billions 98.2 101.5 106.8 115.2 127.4 143.7 162.0 181.8 200.4 218.7 220.5 224.0 226.9 227.5 4.0 8.82Non-federally guaranteed student loans $ Billions 0.0 0.0 1.5 2.0 2.6 3.1 3.5 3.8 4.4 5.1 5.3 5.3 5.5 5.5 7.4 0.38Commercial loans (excludes unfunded commitments) $ Billions . . . . . . . . 63.2 71.0 73.0 75.3 78.0 81.8 15.3 10.86 Secured by real estate $ Billions . . . . . . . . 55.3 63.9 66.0 68.1 70.6 74.5 16.7 10.65 Not secured by real estate $ Billions . . . . . . . . 8.0 7.1 7.0 7.3 7.4 7.4 2.9 0.21Other loans $ Billions . . . . . . . . 82.0 89.1 89.4 92.3 95.0 96.1 7.9 7.01
Unfunded commitments for commercial loans $ Billions . . . . . . . . 4.8 5.7 6.0 6.2 6.6 6.9 20.3 1.16
Other assets $ Billions 33.8 36.3 38.1 42.9 43.7 48.2 49.9 56.5 61.0 64.0 67.8 72.5 74.9 74.3 16.1 10.30
Total liabilities and net worth $ Billions 884.6 914.3 961.7 1,021.8 1,062.0 1,122.1 1,204.3 1,292.5 1,378.8 1,453.4 1,506.0 1,520.3 1,538.6 1,566.7 7.8 113.31
Total deposits $ Billions 752.7 786.4 827.4 877.9 910.1 950.8 1,016.0 1,092.6 1,159.5 1,219.7 1,272.8 1,279.8 1,292.3 1,319.8 8.2 100.02Share drafts $ Billions 85.3 89.9 100.6 111.4 119.0 131.4 150.4 154.3 168.5 190.0 189.2 187.8 200.3 207.9 9.4 17.83Regular shares $ Billions 199.9 220.5 245.0 275.1 297.6 320.9 352.0 393.1 421.6 429.6 462.7 459.7 443.1 444.6 3.5 15.01Other deposits $ Billions 467.5 476.0 481.8 491.4 493.5 498.5 513.6 545.2 569.4 600.1 621.0 632.3 648.9 667.2 11.2 67.18 Money market accounts $ Billions 158.3 175.8 189.1 203.4 212.3 219.5 231.8 249.2 259.6 261.9 264.2 264.0 266.6 274.8 4.9 12.90 Share certificate accounts $ Billions 225.6 213.4 204.1 197.9 191.5 188.9 190.1 199.5 212.2 238.2 254.7 264.9 277.7 287.1 20.5 48.93 IRA/Keogh accounts $ Billions 73.4 76.4 77.6 79.1 78.4 76.9 76.6 78.1 77.7 77.6 78.5 79.5 80.5 81.0 4.5 3.48 Non-member deposits $ Billions 2.5 2.4 2.2 2.3 3.0 5.1 6.7 8.7 10.2 11.9 12.3 12.2 12.2 12.8 8.2 0.97 All other shares $ Billions 7.7 8.0 8.7 8.7 8.2 8.2 8.5 9.7 9.8 10.6 11.3 11.6 11.9 11.5 8.5 0.89
Other liabilities $ Billions 44.4 36.0 36.1 37.3 37.4 48.3 56.7 59.1 68.3 69.4 65.4 69.1 71.1 68.7 -1.1 -0.74
Net worth $ Billions 87.5 92.0 98.2 106.6 114.5 123.0 131.5 140.8 151.1 164.3 167.8 171.4 175.2 178.3 8.5 14.03 Net worth, percent of assets Percent 9.89 10.06 10.21 10.43 10.77 10.96 10.92 10.89 10.95 11.30 11.13 11.27 11.38 11.37 0.07
AddendaReal estate loans $ Billions 309.6 309.6 313.0 320.2 338.8 364.2 396.8 431.1 473.0 514.5 519.0 528.5 541.0 558.0 8.4 43.47 Real estate fixed rate, first mortgage $ Billions 149.8 154.6 163.1 174.6 192.3 205.0 226.5 251.2 281.0 308.0 311.4 318.6 329.1 344.8 12.0 36.88
Business loans Net member business loan balance for regulatory reporting, Part 7231 $ Billions 28.3 30.4 32.6 35.5 39.8 45.4 51.3 58.9 67.5 67.7 69.2 71.7 74.1 78.4 15.8 10.71
1 Account 400A
5
Summary of Federally Insured Credit Union Call Report Data: 2019 Q4Same quarter as current, previous years Most recent four quarters Most Recent
Date Units 2009.4 2010.4 2011.4 2012.4 2013.4 2014.4 2015.4 2016.4 2017.4 2018.4 2019.1 2019.2 2019.3 2019.4 4 Quarter % change
4 Quarter change
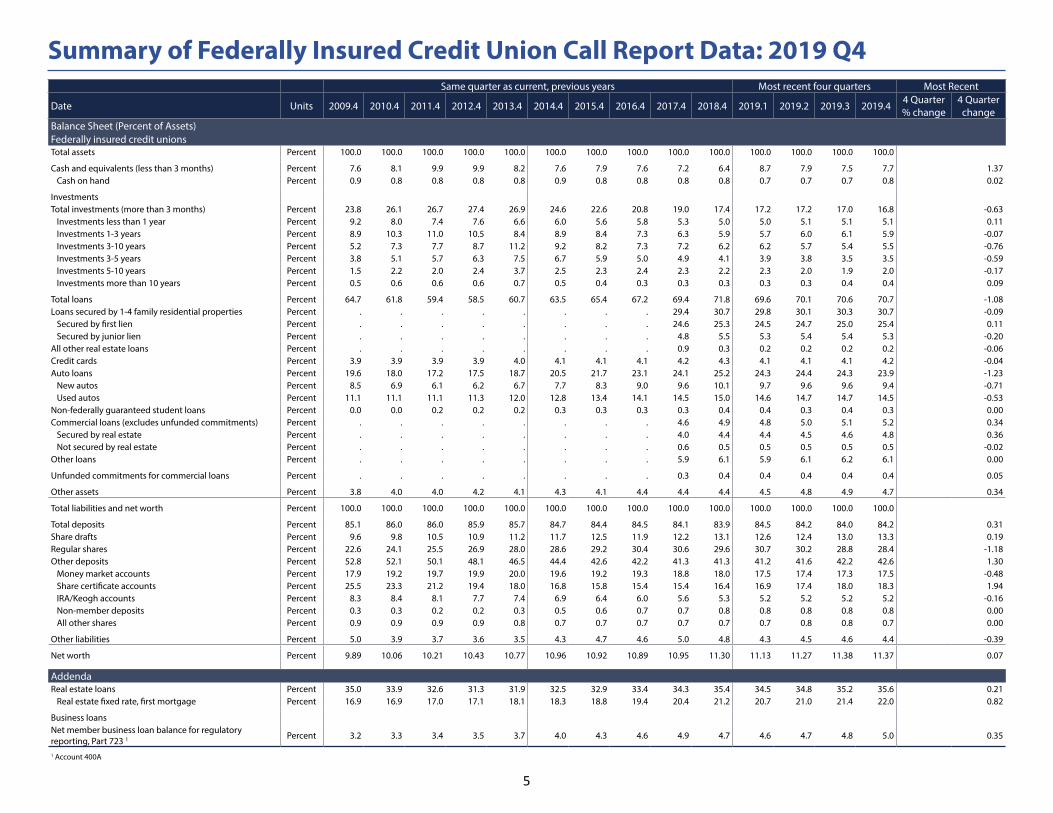
Balance Sheet (Percent of Assets)Federally insured credit unionsTotal assets Percent 100.0 100.0 100.0 100.0 100.0 100.0 100.0 100.0 100.0 100.0 100.0 100.0 100.0 100.0
Cash and equivalents (less than 3 months) Percent 7.6 8.1 9.9 9.9 8.2 7.6 7.9 7.6 7.2 6.4 8.7 7.9 7.5 7.7 1.37 Cash on hand Percent 0.9 0.8 0.8 0.8 0.8 0.9 0.8 0.8 0.8 0.8 0.7 0.7 0.7 0.8 0.02
InvestmentsTotal investments (more than 3 months) Percent 23.8 26.1 26.7 27.4 26.9 24.6 22.6 20.8 19.0 17.4 17.2 17.2 17.0 16.8 -0.63 Investments less than 1 year Percent 9.2 8.0 7.4 7.6 6.6 6.0 5.6 5.8 5.3 5.0 5.0 5.1 5.1 5.1 0.11 Investments 1-3 years Percent 8.9 10.3 11.0 10.5 8.4 8.9 8.4 7.3 6.3 5.9 5.7 6.0 6.1 5.9 -0.07 Investments 3-10 years Percent 5.2 7.3 7.7 8.7 11.2 9.2 8.2 7.3 7.2 6.2 6.2 5.7 5.4 5.5 -0.76 Investments 3-5 years Percent 3.8 5.1 5.7 6.3 7.5 6.7 5.9 5.0 4.9 4.1 3.9 3.8 3.5 3.5 -0.59 Investments 5-10 years Percent 1.5 2.2 2.0 2.4 3.7 2.5 2.3 2.4 2.3 2.2 2.3 2.0 1.9 2.0 -0.17 Investments more than 10 years Percent 0.5 0.6 0.6 0.6 0.7 0.5 0.4 0.3 0.3 0.3 0.3 0.3 0.4 0.4 0.09
Total loans Percent 64.7 61.8 59.4 58.5 60.7 63.5 65.4 67.2 69.4 71.8 69.6 70.1 70.6 70.7 -1.08Loans secured by 1-4 family residential properties Percent . . . . . . . . 29.4 30.7 29.8 30.1 30.3 30.7 -0.09 Secured by first lien Percent . . . . . . . . 24.6 25.3 24.5 24.7 25.0 25.4 0.11 Secured by junior lien Percent . . . . . . . . 4.8 5.5 5.3 5.4 5.4 5.3 -0.20All other real estate loans Percent . . . . . . . . 0.9 0.3 0.2 0.2 0.2 0.2 -0.06Credit cards Percent 3.9 3.9 3.9 3.9 4.0 4.1 4.1 4.1 4.2 4.3 4.1 4.1 4.1 4.2 -0.04Auto loans Percent 19.6 18.0 17.2 17.5 18.7 20.5 21.7 23.1 24.1 25.2 24.3 24.4 24.3 23.9 -1.23 New autos Percent 8.5 6.9 6.1 6.2 6.7 7.7 8.3 9.0 9.6 10.1 9.7 9.6 9.6 9.4 -0.71 Used autos Percent 11.1 11.1 11.1 11.3 12.0 12.8 13.4 14.1 14.5 15.0 14.6 14.7 14.7 14.5 -0.53Non-federally guaranteed student loans Percent 0.0 0.0 0.2 0.2 0.2 0.3 0.3 0.3 0.3 0.4 0.4 0.3 0.4 0.3 0.00Commercial loans (excludes unfunded commitments) Percent . . . . . . . . 4.6 4.9 4.8 5.0 5.1 5.2 0.34 Secured by real estate Percent . . . . . . . . 4.0 4.4 4.4 4.5 4.6 4.8 0.36 Not secured by real estate Percent . . . . . . . . 0.6 0.5 0.5 0.5 0.5 0.5 -0.02Other loans Percent . . . . . . . . 5.9 6.1 5.9 6.1 6.2 6.1 0.00
Unfunded commitments for commercial loans Percent . . . . . . . . 0.3 0.4 0.4 0.4 0.4 0.4 0.05
Other assets Percent 3.8 4.0 4.0 4.2 4.1 4.3 4.1 4.4 4.4 4.4 4.5 4.8 4.9 4.7 0.34
Total liabilities and net worth Percent 100.0 100.0 100.0 100.0 100.0 100.0 100.0 100.0 100.0 100.0 100.0 100.0 100.0 100.0
Total deposits Percent 85.1 86.0 86.0 85.9 85.7 84.7 84.4 84.5 84.1 83.9 84.5 84.2 84.0 84.2 0.31Share drafts Percent 9.6 9.8 10.5 10.9 11.2 11.7 12.5 11.9 12.2 13.1 12.6 12.4 13.0 13.3 0.19Regular shares Percent 22.6 24.1 25.5 26.9 28.0 28.6 29.2 30.4 30.6 29.6 30.7 30.2 28.8 28.4 -1.18Other deposits Percent 52.8 52.1 50.1 48.1 46.5 44.4 42.6 42.2 41.3 41.3 41.2 41.6 42.2 42.6 1.30 Money market accounts Percent 17.9 19.2 19.7 19.9 20.0 19.6 19.2 19.3 18.8 18.0 17.5 17.4 17.3 17.5 -0.48 Share certificate accounts Percent 25.5 23.3 21.2 19.4 18.0 16.8 15.8 15.4 15.4 16.4 16.9 17.4 18.0 18.3 1.94 IRA/Keogh accounts Percent 8.3 8.4 8.1 7.7 7.4 6.9 6.4 6.0 5.6 5.3 5.2 5.2 5.2 5.2 -0.16 Non-member deposits Percent 0.3 0.3 0.2 0.2 0.3 0.5 0.6 0.7 0.7 0.8 0.8 0.8 0.8 0.8 0.00 All other shares Percent 0.9 0.9 0.9 0.9 0.8 0.7 0.7 0.7 0.7 0.7 0.7 0.8 0.8 0.7 0.00
Other liabilities Percent 5.0 3.9 3.7 3.6 3.5 4.3 4.7 4.6 5.0 4.8 4.3 4.5 4.6 4.4 -0.39
Net worth Percent 9.89 10.06 10.21 10.43 10.77 10.96 10.92 10.89 10.95 11.30 11.13 11.27 11.38 11.37 0.07
AddendaReal estate loans Percent 35.0 33.9 32.6 31.3 31.9 32.5 32.9 33.4 34.3 35.4 34.5 34.8 35.2 35.6 0.21 Real estate fixed rate, first mortgage Percent 16.9 16.9 17.0 17.1 18.1 18.3 18.8 19.4 20.4 21.2 20.7 21.0 21.4 22.0 0.82
Business loans Net member business loan balance for regulatory reporting, Part 723 1 Percent 3.2 3.3 3.4 3.5 3.7 4.0 4.3 4.6 4.9 4.7 4.6 4.7 4.8 5.0 0.35
1 Account 400A

6
Summary of Credit Union Indicators by Type of Credit Union: 2019 Q4Asset Categories
Less than $10 million
$10 to $50 million
$50 to $100 million
$100 to $500 million
$500 million to $1 billion
Greater than $1 billion
Federal Credit Unions
Federally Insured State-
Chartered Credit Unions
Credit Unions with Low-
Income Designation in
2019Q4
Small Credit Unions (Assets less than $100
million)
Current Quarter: 2019Q4Number of credit unions 1,329 1,635 677 1,018 247 330 3,283 1,953 2,605 3,641Number of members (millions) 1.0 4.9 5.0 20.8 13.9 74.7 63.1 57.3 56.3 11.0Total assets ($ billions) 5.5 41.3 48.5 227.8 172.7 1,070.9 803.0 763.7 661.6 95.3Total loans ($ billions) 2.9 22.2 28.5 154.0 123.7 776.7 561.2 546.8 485.7 53.6Total deposits ($ billions) 4.6 35.6 42.1 197.1 146.8 893.6 670.9 648.8 562.2 82.2Key ratios (percent) Return on average assets 0.30 0.56 0.63 0.72 0.79 1.04 0.95 0.92 0.95 0.58 Net worth ratio 16.50 13.21 12.30 11.57 11.27 11.21 11.50 11.24 11.28 12.94 Loan to share ratio 62.7 62.6 67.6 78.2 84.2 86.9 83.6 84.3 86.4 65.2 Net interest margin (median) 3.63 3.41 3.37 3.35 3.29 3.06 3.37 3.38 3.52 3.44 Long-term assets, percent of assets 5.3 13.6 18.1 22.4 27.7 30.2 28.4 27.3 25.2 15.4 Cost of funds / average assets (median) 0.30 0.34 0.44 0.56 0.72 0.87 0.40 0.51 0.43 0.35 Delinquency rate 1.89 1.06 0.84 0.75 0.69 0.69 0.81 0.61 0.69 0.99 Net charge-offs to average loans 0.59 0.46 0.46 0.47 0.49 0.60 0.67 0.45 0.50 0.47Growth from a year earlier (percent) Shares (total deposits) -7.8 -3.6 -1.8 -1.4 4.2 12.5 7.3 9.2 9.0 -3.0 Total loans -7.0 -3.0 -2.4 -3.0 1.9 9.7 5.4 7.0 7.3 -2.9 Total assets -7.4 -3.3 -1.5 -1.3 3.6 11.8 6.6 9.1 8.5 -2.7 Members -9.1 -5.8 -4.3 -4.6 0.3 8.4 3.0 4.4 3.8 -5.4 Net worth -4.6 -1.0 1.1 0.6 3.3 12.4 7.5 9.7 9.4 -0.3Historical Data (same quarter)Return on average assets (percent)
2019 0.30 0.56 0.63 0.72 0.79 1.04 0.95 0.92 0.95 0.582018 0.24 0.49 0.59 0.67 0.76 1.05 0.93 0.90 0.91 0.522017 0.06 0.30 0.44 0.46 0.71 0.93 0.80 0.75 0.78 0.352016 0.04 0.25 0.38 0.51 0.59 0.94 0.77 0.75 0.74 0.302015 0.03 0.28 0.39 0.54 0.66 0.91 0.74 0.75 0.77 0.31
Net worth ratio (percent)2019 16.50 13.21 12.30 11.57 11.27 11.21 11.50 11.24 11.28 12.942018 16.02 12.90 11.98 11.34 11.30 11.15 11.40 11.18 11.19 12.622017 15.42 12.40 11.62 11.01 10.92 10.80 11.04 10.86 10.92 12.202016 15.14 12.32 11.50 10.92 10.96 10.71 10.97 10.80 10.86 12.102015 15.05 12.32 11.45 10.92 11.08 10.70 10.94 10.89 10.95 12.09
Loan to Share Ratio (percent)2019 62.74 62.57 67.62 78.16 84.23 86.92 83.65 84.27 86.39 65.162018 62.21 62.15 67.99 79.44 86.14 89.17 85.17 85.96 87.80 65.112017 59.04 59.36 65.14 76.10 84.30 86.45 82.42 82.71 84.52 62.252016 58.04 57.77 63.95 73.69 81.18 83.58 79.40 79.70 81.18 60.862015 57.53 57.35 63.03 72.41 77.82 81.90 77.52 77.40 78.59 60.11
Related Documents