Airtel launches “Airtel Secure” – a comprehensive suite of advanced cyber security solutions. Airtel & Amazon Web Services (AWS) partner to deliver innovative cloud solutions to large and SME customers in India. Airtel announces the deployment of India's largest open cloud-based VoLTE network powered by Nokia software products. Quarterly report on the results for the second quarter and half year ended September 30, 2020 Oct 27, 2020 The financial statements included in this quarterly report fairly present in all material respects the financial position, results of operations, cash flow of the company as of and for the periods presented in this report. Bharti Airtel Limited (Incorporated as a public limited company on July 7, 1995 under the Companies Act, 1956) Bharti Crescent, 1, Nelson Mandela Road, Vasant Kunj, Phase II, New Delhi – 110 070, India

Welcome message from author
This document is posted to help you gain knowledge. Please leave a comment to let me know what you think about it! Share it to your friends and learn new things together.
Transcript

Airtel launches “Airtel Secure” – a comprehensive suite of advanced cyber security solutions.
Airtel & Amazon Web Services (AWS) partner to deliver innovative cloud solutions to large and SME customers in India.
Airtel announces the deployment of India's largest open cloud-based VoLTE network powered by Nokia software products.
Quarterly report on the results for thesecond quarter and half year ended September 30, 2020
Oct 27, 2020The financial statements included in this quarterly report fairly present in all material respects the financial position, results of operations, cash flow of the company as of and for the periods presented in this report.
Bharti Airtel Limited(Incorporated as a public limited company on July 7, 1995 under the Companies Act, 1956)Bharti Crescent, 1, Nelson Mandela Road, Vasant Kunj, Phase II, New Delhi – 110 070, India
Page 1 of 58
Supplemental Disclosures
Safe Harbor: - Some information in this report may contain forward-looking
statements. We have based these forward-looking statements on our current beliefs, expectations and intentions as to facts, actions and events that will or may occur in the future. Such statements generally are identified by forward-looking words such as “believe,” “plan,” “anticipate,” “continue,” “estimate,” “expect,” “may,” “will” or other similar words. A forward-looking statement may include a statement of the assumptions or basis underlying the forward-looking statement. We have chosen these assumptions or basis in good faith, and we believe that they are reasonable in all material respects. However, we caution you that forward-looking statements and assumed facts or basis almost always vary from actual results, and the differences between the results implied by the forward-looking statements and assumed facts or basis and actual results can be material, depending on the circumstances. You should also keep in mind that any forward-looking statement made by us in this report or elsewhere speaks only as of the date on which we made it. New risks and uncertainties come up from time to time, and it is impossible for us to predict these events or how they may affect us. We have no duty to, and do not intend to, update or revise the forward-looking statements in this report after the date hereof. In light of these risks and uncertainties, any forward-looking statement made in this report or elsewhere may or may not occur and has to be understood
and read along with this supplemental disclosure. General Risk: - Investment in equity and equity related securities involve a degree of risk and investors should not invest any funds in this Company without necessary diligence and relying on their own examination of Bharti Airtel, along with the equity investment risk which doesn't guarantee capital protection. Convenience translation: - We publish our financial statements in Indian Rupees. All references herein to “Indian Rupees” and “Rs” are to Indian
Rupees and all references herein to “US dollars” and “US$” are to United States dollars. Translation of income statement items have been made from Indian Rupees to United States dollars (unless otherwise indicated) using the respective quarter average rate. Translation of Statement of financial position items have been made from Indian Rupees to United States dollars (unless otherwise indicated) using the closing rate. The rates announced by the Reserve Bank of India are being used as the Reference rate for respective translations. All amounts translated into United States dollars as described above are provided solely for the convenience of the reader, and no representation is made that the Indian Rupees or United States dollar amounts referred to herein could have been or could be converted into
United States dollars or Indian Rupees respectively, as the case may be, at any particular rate, the above rates or at all. Any discrepancies in any table between totals and sums of the amounts listed are due to rounding off. Functional Translation: - Africa financials reported in the quarterly report
are in its functional currency i.e. US$ (Refer “Section 10 Key Accounting Policies as per Ind-AS”). South Asia financials reported in the quarterly report are in its presentation currency i.e. Rs. Use of Certain Non-GAAP measures: - This result announcement contains
certain information on the Company’s results of operations and cash flows that have been derived from amounts calculated in accordance with Indian Accounting Standards (Ind-AS), but are not in themselves Ind-AS measures. They should not be viewed in isolation as alternatives to the equivalent Ind-AS measures and should be read in conjunction with the equivalent Ind-AS measures. Further, disclosures are also provided under “7.3 Use of Non - GAAP Financial Information” on page 33
Others: In this report, the terms “we”, “us”, “our”, “Bharti”, or “the Company”,
unless otherwise specified or the context otherwise implies, refer to Bharti Airtel Limited (“Bharti Airtel”) and its subsidiaries, Bharti Airtel Services Limited, Bharti Hexacom Limited, Bharti Infratel Limited, Bharti Telemedia Limited, Telesonic Networks Limited, Nxtra Data Limited, Airtel Digital Limited (formerly known as Wynk Limited), Indo Teleports Limited (formerly known as Bharti Teleports Limited), Nettle Infrastructure Investments Limited (formerly known as Nettle Developers Limited), SmarTx Services Limited, Bharti Airtel (France) SAS, Bharti Airtel (Hong Kong) Limited, Bharti Airtel (Japan) Private Limited, Bharti Airtel (UK) Limited , Bharti Airtel (USA) Limited, Bharti Airtel International (Mauritius) Limited , Bharti Airtel International (Netherlands) B.V., Bharti Airtel Lanka (Private) Limited, Bharti International (Singapore) Pte Ltd , Network i2i Limited, Africa Towers N.V., Airtel (Seychelles) Limited, Airtel Congo S.A, Airtel Gabon S.A., Airtel Madagascar S.A., Airtel Malawi plc, Airtel Mobile Commerce B.V., Airtel Mobile Commerce Holdings B.V., Airtel Mobile Commerce (Kenya) Limited, Airtel Mobile Commerce Limited, Airtel Mobile Commerce Madagascar S.A., Airtel Mobile Commerce (Rwanda) Limited, Airtel Mobile Commerce (Seychelles) Limited, Airtel Mobile Commerce Tanzania Limited, Airtel Mobile Commerce Tchad S.a.r.l., Airtel Mobile Commerce Uganda Limited, Airtel Mobile Commerce Zambia Limited , Airtel Money (RDC) S.A., Airtel Money Niger S.A., Airtel Money S.A. , Airtel Networks Kenya Limited, Airtel
Networks Limited, Airtel Networks Zambia plc, Airtel Rwanda Limited, Airtel Tanzania plc, Airtel Tchad S.A., Airtel Uganda Limited, Bharti Airtel Africa B.V., Bharti Airtel Chad Holdings B.V. , Bharti Airtel Congo Holdings B.V., Bharti Airtel Developers Forum Limited, Bharti Airtel Gabon Holdings B.V. , Bharti Airtel Kenya B.V., Bharti Airtel Kenya Holdings B.V., Bharti Airtel Madagascar Holdings B.V. , Bharti Airtel Malawi Holdings B.V. , Bharti Airtel Mali Holdings B.V., Bharti Airtel Niger Holdings B.V. , Bharti Airtel Nigeria B.V. , Bharti Airtel Nigeria Holdings II B.V. , Bharti Airtel RDC Holdings B.V. , Bharti Airtel Services B.V. , Bharti Airtel Tanzania B.V., Bharti Airtel Uganda Holdings B.V., Bharti Airtel Zambia Holdings B.V., Celtel (Mauritius) Holdings
Limited, Airtel Congo (RDC) S.A., Celtel Niger S.A., Channel Sea Management Company (Mauritius) Limited, Congo RDC Towers S.A., Indian Ocean Telecom Limited, Madagascar Towers S.A., Malawi Towers Limited, Mobile Commerce Congo S.A., Montana International, Partnership Investments S.a.r.l, Société Malgache de Téléphone Cellulaire S.A., Tanzania Towers Limited, Bharti Airtel Rwanda Holdings Limited , Airtel Money Transfer Limited, Airtel Money Tanzania Limited , Airtel Mobile Commerce (Nigeria) Limited , Bharti Airtel International (Mauritius) Investments Limited , Airtel Africa Mauritius Limited, Bharti Airtel Holding (Mauritius) Limited, Bharti Airtel Overseas (Mauritius) Limited, Airtel Africa Plc, Airtel Mobile Commerce Nigeria B.V., Bharti Airtel Employees Welfare
Trust, Airtel Mobile Commerce (Seychelles) B.V. , Airtel Mobile Commerce Congo B.V., Airtel Mobile Commerce Kenya B.V., Airtel Mobile Commerce Madagascar B.V., Airtel Mobile Commerce Malawi B.V. , Airtel Mobile Commerce Rwanda B.V. , Airtel Mobile Commerce Tchad B.V., Airtel Mobile Commerce Uganda B.V. , Airtel Mobile Commerce Zambia B.V., Airtel International LLP , Network I2I (Kenya) Limited ((incorporated w.e.f. July 3, 2019), Bharti Infratel Employees ’s Welfare Trust, Airtel Money Trust, Airtel Mobile Commerce DRC B.V. Airtel Mobile Commerce Gabon B.V., Airtel Mobile Commerce Niger B.V., Airtel Money Kenya Limited, Network I2I (UK) Limited (incorporated w.e.f. May 19, 2020), The Airtel Africa Employee Benefit Trust (May 14, 2020), Airtel Money Trust. Disclaimer: - This communication does not constitute an offer of securities
for sale in the United States. Securities may not be sold in the United States absent registration or an exemption from registration under the U.S. Securities Act of 1933, as amended. Any public offering of securities to be made in the United States will be made by means of a prospectus and will contain detailed information about the Company and its management, as well as financial statements.
Page 2 of 58
TABLE OF CONTENTS
Section 1 Bharti Airtel – Performance at a glance 3
Section 2 Bharti Airtel - An Introduction 4
Section 3 Financial Highlights as per Ind-AS
3.1 Consolidated - Summary of Consolidated Financial Statements 5
3.2 Region wise - Summary of Statement of Operations 7
3.3 Segment wise - Summary of Statement of Operations 9
3.4 Region wise & Segment wise - Investment & Contribution 12
Section 4 Operating Highlights 14
Section 5 Management Discussion & Analysis
5.1 India & SA 18
5.2 Africa 20
5.3 Share of Associates / Joint Ventures 21
5.4 Result of Operation 22
5.5 Three Line Graph 25
Section 6 Stock Market Highlights 26
Section 7 Detailed Financial and Related Information 28
Section 8 Region wise Cost Schedules 34
Section 9
Section 10
Section 11
Trends and Ratio Analysis
Key Accounting Policies as per Ind-AS
Glossary
37
50
54
Page 3 of 58
SECTION 1
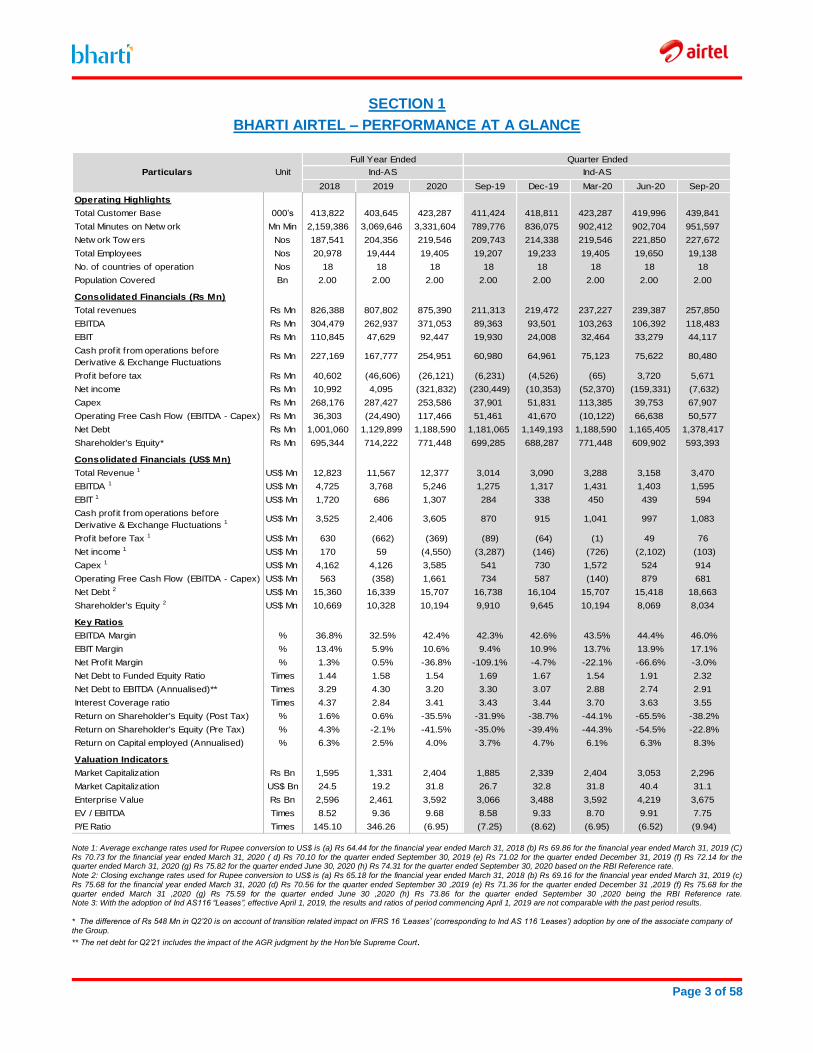
BHARTI AIRTEL – PERFORMANCE AT A GLANCE
Full Year Ended Quarter Ended
2018 2019 2020 Sep-19 Dec-19 Mar-20 Jun-20 Sep-20
Operating Highlights
Total Customer Base 000’s 413,822 403,645 423,287 411,424 418,811 423,287 419,996 439,841
Total Minutes on Netw ork Mn Min 2,159,386 3,069,646 3,331,604 789,776 836,075 902,412 902,704 951,597
Netw ork Tow ers Nos 187,541 204,356 219,546 209,743 214,338 219,546 221,850 227,672
Total Employees Nos 20,978 19,444 19,405 19,207 19,233 19,405 19,650 19,138
No. of countries of operation Nos 18 18 18 18 18 18 18 18
Population Covered Bn 2.00 2.00 2.00 2.00 2.00 2.00 2.00 2.00
Consolidated Financials (Rs Mn)
Total revenues Rs Mn 826,388 807,802 875,390 211,313 219,472 237,227 239,387 257,850
EBITDA Rs Mn 304,479 262,937 371,053 89,363 93,501 103,263 106,392 118,483
EBIT Rs Mn 110,845 47,629 92,447 19,930 24,008 32,464 33,279 44,117
Cash profit from operations before
Derivative & Exchange FluctuationsRs Mn 227,169 167,777 254,951 60,980 64,961 75,123 75,622 80,480
Profit before tax Rs Mn 40,602 (46,606) (26,121) (6,231) (4,526) (65) 3,720 5,671
Net income Rs Mn 10,992 4,095 (321,832) (230,449) (10,353) (52,370) (159,331) (7,632)
Capex Rs Mn 268,176 287,427 253,586 37,901 51,831 113,385 39,753 67,907
Operating Free Cash Flow (EBITDA - Capex) Rs Mn 36,303 (24,490) 117,466 51,461 41,670 (10,122) 66,638 50,577
Net Debt Rs Mn 1,001,060 1,129,899 1,188,590 1,181,065 1,149,193 1,188,590 1,165,405 1,378,417
Shareholder's Equity* Rs Mn 695,344 714,222 771,448 699,285 688,287 771,448 609,902 593,393
Consolidated Financials (US$ Mn)
Total Revenue 1 US$ Mn 12,823 11,567 12,377 3,014 3,090 3,288 3,158 3,470
EBITDA 1 US$ Mn 4,725 3,768 5,246 1,275 1,317 1,431 1,403 1,595
EBIT 1 US$ Mn 1,720 686 1,307 284 338 450 439 594
Cash profit from operations before
Derivative & Exchange Fluctuations 1US$ Mn 3,525 2,406 3,605 870 915 1,041 997 1,083
Profit before Tax 1 US$ Mn 630 (662) (369) (89) (64) (1) 49 76
Net income 1 US$ Mn 170 59 (4,550) (3,287) (146) (726) (2,102) (103)
Capex 1 US$ Mn 4,162 4,126 3,585 541 730 1,572 524 914
Operating Free Cash Flow (EBITDA - Capex) US$ Mn 563 (358) 1,661 734 587 (140) 879 681
Net Debt 2 US$ Mn 15,360 16,339 15,707 16,738 16,104 15,707 15,418 18,663
Shareholder's Equity 2 US$ Mn 10,669 10,328 10,194 9,910 9,645 10,194 8,069 8,034
Key Ratios
EBITDA Margin % 36.8% 32.5% 42.4% 42.3% 42.6% 43.5% 44.4% 46.0%
EBIT Margin % 13.4% 5.9% 10.6% 9.4% 10.9% 13.7% 13.9% 17.1%
Net Profit Margin % 1.3% 0.5% -36.8% -109.1% -4.7% -22.1% -66.6% -3.0%
Net Debt to Funded Equity Ratio Times 1.44 1.58 1.54 1.69 1.67 1.54 1.91 2.32
Net Debt to EBITDA (Annualised)** Times 3.29 4.30 3.20 3.30 3.07 2.88 2.74 2.91
Interest Coverage ratio Times 4.37 2.84 3.41 3.43 3.44 3.70 3.63 3.55
Return on Shareholder's Equity (Post Tax) % 1.6% 0.6% -35.5% -31.9% -38.7% -44.1% -65.5% -38.2%
Return on Shareholder's Equity (Pre Tax) % 4.3% -2.1% -41.5% -35.0% -39.4% -44.3% -54.5% -22.8%
Return on Capital employed (Annualised) % 6.3% 2.5% 4.0% 3.7% 4.7% 6.1% 6.3% 8.3%
Valuation Indicators
Market Capitalization Rs Bn 1,595 1,331 2,404 1,885 2,339 2,404 3,053 2,296
Market Capitalization US$ Bn 24.5 19.2 31.8 26.7 32.8 31.8 40.4 31.1
Enterprise Value Rs Bn 2,596 2,461 3,592 3,066 3,488 3,592 4,219 3,675
EV / EBITDA Times 8.52 9.36 9.68 8.58 9.33 8.70 9.91 7.75
P/E Ratio Times 145.10 346.26 (6.95) (7.25) (8.62) (6.95) (6.52) (9.94)
Ind-ASParticulars Unit Ind-AS
Note 1: Average exchange rates used for Rupee conversion to US$ is (a) Rs 64.44 for the financial year ended March 31, 2018 (b) Rs 69.86 for the financial year ended March 31, 2019 (C) Rs 70.73 for the financial year ended March 31, 2020 ( d) Rs 70.10 for the quarter ended September 30, 2019 (e) Rs 71.02 for the quarter ended December 31, 2019 (f) Rs 72.14 for the quarter ended March 31, 2020 (g) Rs 75.82 for the quarter ended June 30, 2020 (h) Rs 74.31 for the quarter ended September 30, 2020 based on the RBI Reference rate. Note 2: Closing exchange rates used for Rupee conversion to US$ is (a) Rs 65.18 for the financial year ended March 31, 2018 (b) Rs 69.16 for the financial year ended March 31, 2019 (c) Rs 75.68 for the financial year ended March 31, 2020 (d) Rs 70.56 for the quarter ended September 30 ,2019 (e) Rs 71.36 for the quarter ended December 31 ,2019 (f) Rs 75.68 for the quarter ended March 31 ,2020 (g) Rs 75.59 for the quarter ended June 30 ,2020 (h) Rs 73.86 for the quarter ended September 30 ,2020 being the RBI Reference rate. Note 3: With the adoption of Ind AS116 “Leases”, effective April 1, 2019, the results and ratios of period commencing April 1, 2019 are not comparable with the past period results. * The difference of Rs 548 Mn in Q2’20 is on account of transition related impact on IFRS 16 ‘Leases’ (corresponding to Ind AS 116 ‘Leases’) adoption by one of the associate company of the Group. ** The net debt for Q2’21 includes the impact of the AGR judgment by the Hon’ble Supreme Court.
Page 4 of 58
SECTION 2
BHARTI AIRTEL - AN INTRODUCTION 2.1 Introduction
We are one of the world’s leading providers of telecommunication services with presence in 18 countries representing India, Sri Lanka, 14 countries in Africa and Joint Ventures in 2 more
countries. As per United Nations data published on January 01, 2013, the population of these 18 countries represents around 24% of the world’s population.
We provide telecom services under wireless and fixed line technology, national and international long distance connectivity and Digital TV; and complete integrated telecom solutions to our
enterprise customers. All these services are rendered under a unified brand “airtel”. ‘Airtel Money’ (known as ‘Airtel Payments Bank’ in India) extends our product portfolio to further our financial
inclusion agenda and offers convenience of payments and money transfers on mobile phones over secure and stable platforms in India, and across all 14 countries in Africa. The Company also
owns Tower Infrastructure pertaining to telecom operations through its subsidiary and joint venture entity.
The shares of Bharti Airtel Ltd are listed on the Indian Stock
Exchanges, NSE & BSE.
2.2 Business Divisions
2.2.1 India & South Asia – We follow a segmented approach for our operations in India with clear focus on retail and corporate
customers. B2C Services:
Mobile Services (India) –We offer postpaid, pre-paid, roaming, internet and other value added services. Our distribution channel is spread across 1.06 Mn outlets with network presence in 7,907
census and 790,450 non-census towns and villages in India covering approximately 95.4% of the country’s population.
Our 3G and 4G services are spread across the country offering high-speed internet access and a host of innovative services like Mobile TV, video calls, live-streaming videos, gaming, buffer-less
HD video streaming and multi-tasking capabilities to our customers.
Our national long distance infrastructure provides a pan-India reach with 310,289 RKms of optical fiber.
Homes Services – The Company provides fixed-line telephone and broadband services for homes in 145 cities (including LCOs) pan-India. The product offerings include high-speed broadband
on copper and fiber and voice connectivity, up to the speeds of 1 Gbps for the home segment.
Digital TV Services – Our Direct-To-Home (DTH) platform offers both standard and high definition (HD) digital TV services with 3D capabilities and Dolby surround sound. We currently offer a total
of 655 channels including 87 HD channels (including 3 HD SVOD services), 62 SVOD services, 7 international channels and 3 interactive services.
B2B Services:
Airtel Business – We are India’s leading and most trusted provider of ICT services with a diverse portfolio of services to
enterprises, governments, carriers and small and medium business. For small and medium business, Airtel is a trusted solution provider for fixed-line voice (PRIs), data and other
connectivity solutions like MPLS, VoIP, SIP trucking. Additionally, the Company offers solutions to businesses Audio, Video and
Web Conferencing. Cloud portfolio is also an integral part of its office solutions suite, which offers Storage, compute, Microsoft office 365, ecommerce package through shopify and CRM
packages on a pay as you go model. Along with voice, data and video, our services also include
network integration, data centers, managed services, enterprise mobility applications and digital media. Airtel Business provides ‘One solution, bill, support, face’ experience to our customers.
We offer global services in both voice and data including VAS services like International Toll Free Services and SMS hubbing.
Our strategically located submarine cables and satellite network enable our customers to connect across the world including hard-to-reach areas. Our global network runs across 250,000 Rkms,
covering 50 countries and 5 continents. Tower Infrastructure Services – Our subsidiary, Bharti Infratel
Ltd (Infratel), is India’s leading provider of tower and related infrastructure and it deploys, owns & manages telecom towers and communication structures, for various mobile operators. It
holds 42% equity interest in Indus towers, a joint venture with Vodafone group, Vodafone-idea and providence who hold 42%, 11.15% and 4.85% respectively. The Company’s consolidated
portfolio of 97,283 telecom towers, which includes 43,110 of its own towers and the balance from its 42% equity interest in Indus Towers, makes it one of the largest tower infrastructure providers
in the country with presence in all 22 telecom circles. The Company has been the industry pioneer in adopting green energy initiatives for its operations.
Infratel is listed on Indian Stock exchanges, NSE and BSE.
South Asia – South Asia represents our operations in Sri Lanka. In Sri Lanka, we operate across 25 administrative districts with distribution network of over 53 K retailers across the country. Our
3.5G services are present across major towns in Sri Lanka. 2.2.2 Africa
Our subsidiary, Airtel Africa plc is present in 14 countries across Africa, namely: Nigeria, Chad, Congo B, Democratic Republic of Congo, Gabon, Madagascar, Niger, Kenya, Malawi, Seychelles,
Tanzania, Uganda, Zambia and Rwanda. We offer post-paid, pre-paid, roaming, internet services, content, media & entertainment, and corporate solutions. 3G, 4G data and m-Commerce (Mobile
Money) are the next growth engines for the Company in Africa. We offer 3G services, Mobile Money across all 14 countries and 4G services in 14 countries of Africa.
Airtel Africa plc is listed on London Stock Exchange (LSE) and Nigeria Stock Exchange (NSE).
2.3 Partners SingTel, our strategic equity partner, has made one of their
largest investments outside Singapore with us. This partnership has enabled us to expand and further enhance the quality of services to our customers. We also pioneered the outsourcing
business model with long term strategic partnership in all areas including network equipment, information technology and call center. We partnered with global leaders who share our drive for
co-creating innovative and tailor made solutions. To name a few, our strategic partners include ZTE, Ericsson, Nokia Siemens Networks (NSN), Huawei, Cisco, IBM, Avaya, etc.
Page 5 of 58
SECTION 3
FINANCIAL HIGHLIGHTS The financial results presented in this section are compiled based on the audited consolidated financial statements prepared in accordance
with Indian Accounting Standards (Ind-AS) and the underlying information.
Detailed financial statements, analysis & other related information is attached to this report (page 28 - 31). Also, kindly refer to Section 7.3 - use of Non - GAAP
financial information (page 33) and Glossary (page 54) for detailed definitions.
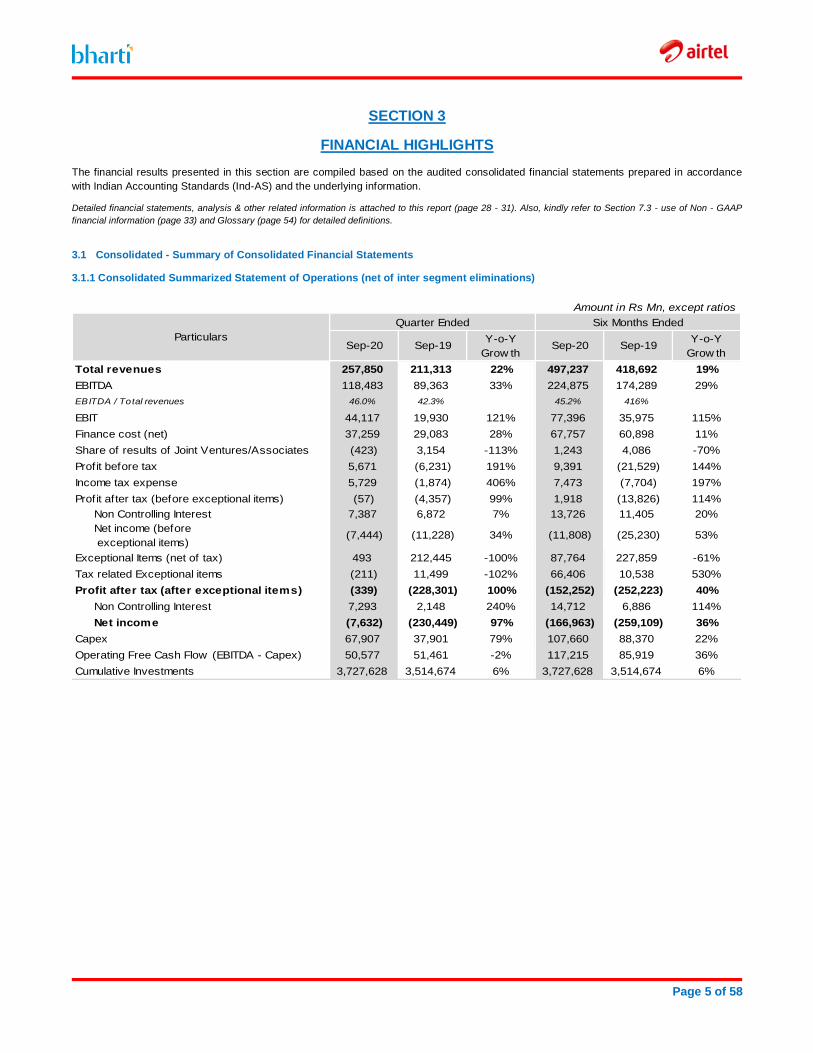
3.1 Consolidated - Summary of Consolidated Financial Statements
3.1.1 Consolidated Summarized Statement of Operations (net of inter segment eliminations)
Amount in Rs Mn, except ratios
Quarter Ended Six Months Ended
Sep-20 Sep-19Y-o-Y
Grow thSep-20 Sep-19
Y-o-Y
Grow th
Total revenues 257,850 211,313 22% 497,237 418,692 19%
EBITDA 118,483 89,363 33% 224,875 174,289 29%
EBITDA / Total revenues 46.0% 42.3% 45.2% 41.6%
EBIT 44,117 19,930 121% 77,396 35,975 115%
Finance cost (net) 37,259 29,083 28% 67,757 60,898 11%
Share of results of Joint Ventures/Associates (423) 3,154 -113% 1,243 4,086 -70%
Profit before tax 5,671 (6,231) 191% 9,391 (21,529) 144%
Income tax expense 5,729 (1,874) 406% 7,473 (7,704) 197%
Profit after tax (before exceptional items) (57) (4,357) 99% 1,918 (13,826) 114%
Non Controlling Interest 7,387 6,872 7% 13,726 11,405 20%
Net income (before
exceptional items)(7,444) (11,228) 34% (11,808) (25,230) 53%
Exceptional Items (net of tax) 493 212,445 -100% 87,764 227,859 -61%
Tax related Exceptional items (211) 11,499 -102% 66,406 10,538 530%
Profit after tax (after exceptional items) (339) (228,301) 100% (152,252) (252,223) 40%
Non Controlling Interest 7,293 2,148 240% 14,712 6,886 114%
Net income (7,632) (230,449) 97% (166,963) (259,109) 36%
Capex 67,907 37,901 79% 107,660 88,370 22%
Operating Free Cash Flow (EBITDA - Capex) 50,577 51,461 -2% 117,215 85,919 36%
Cumulative Investments 3,727,628 3,514,674 6% 3,727,628 3,514,674 6%
Particulars
Page 6 of 58
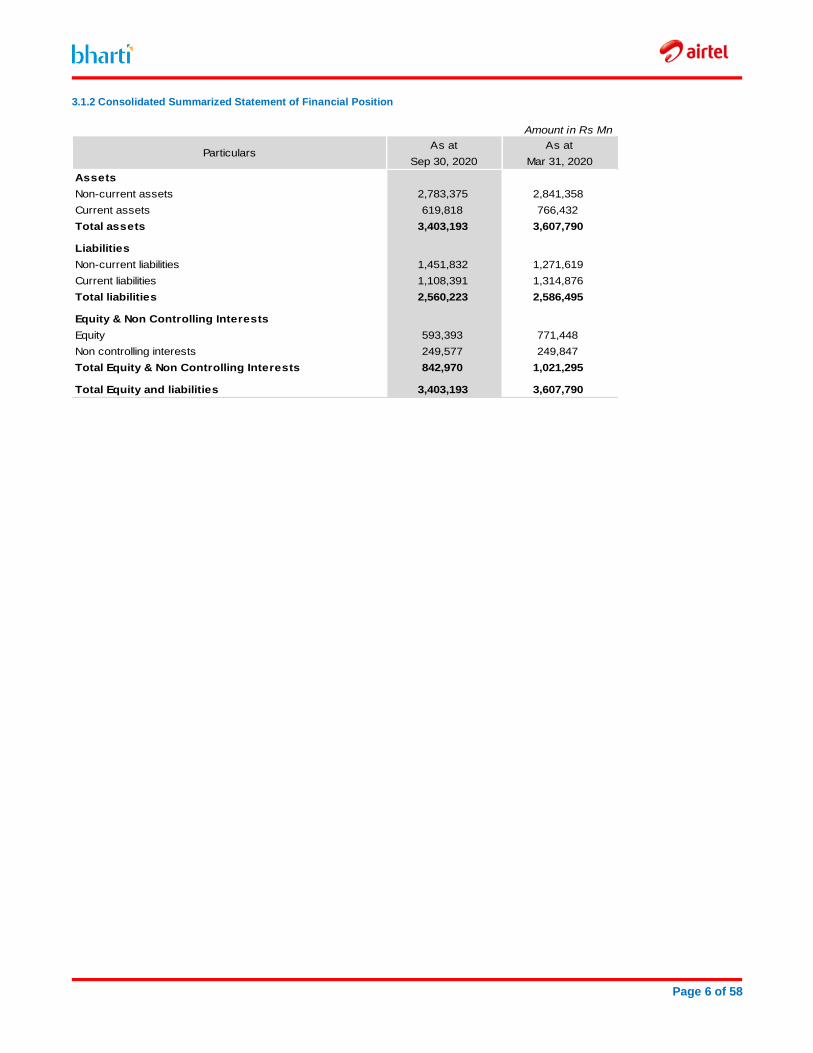
3.1.2 Consolidated Summarized Statement of Financial Position
As at As at
Sep 30, 2020 Mar 31, 2020
Assets
Non-current assets 2,783,375 2,841,358
Current assets 619,818 766,432
Total assets 3,403,193 3,607,790
Liabilities
Non-current liabilities 1,451,832 1,271,619
Current liabilities 1,108,391 1,314,876
Total liabilities 2,560,223 2,586,495
Equity & Non Controlling Interests
Equity 593,393 771,448
Non controlling interests 249,577 249,847
Total Equity & Non Controlling Interests 842,970 1,021,295
Total Equity and liabilities 3,403,193 3,607,790
Particulars
Amount in Rs Mn
Page 7 of 58
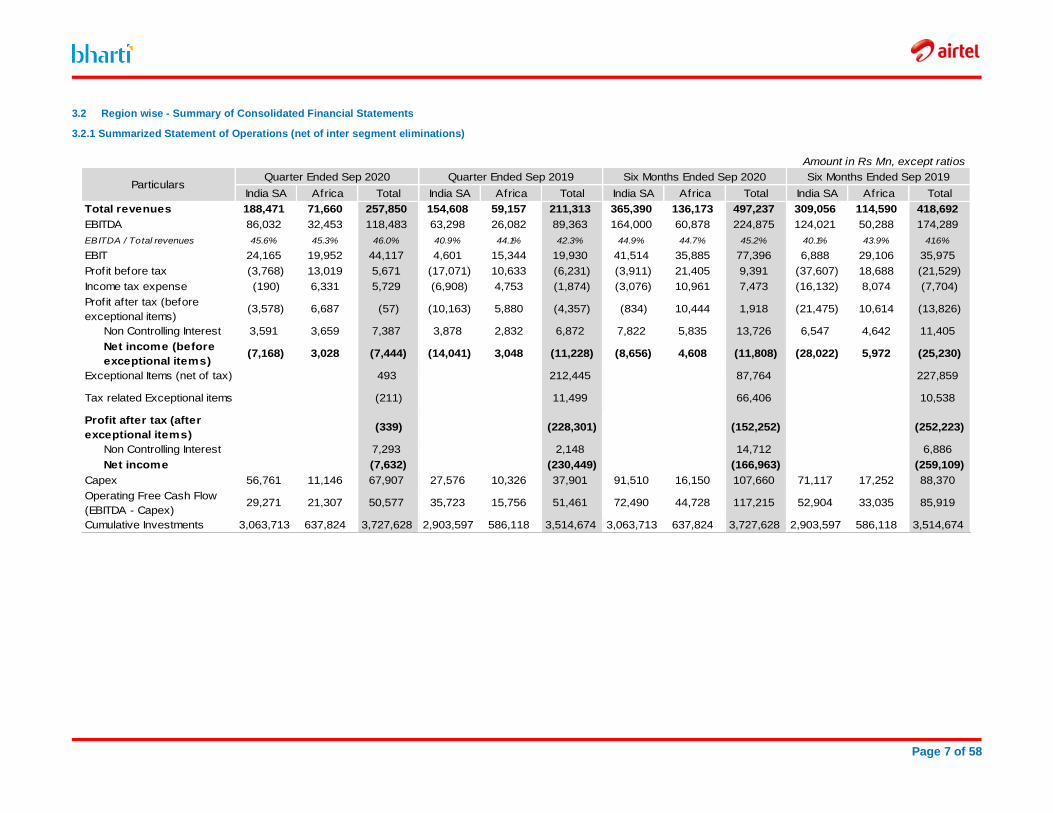
3.2 Region wise - Summary of Consolidated Financial Statements
3.2.1 Summarized Statement of Operations (net of inter segment eliminations)
Amount in Rs Mn, except ratios
Quarter Ended Sep 2020 Quarter Ended Sep 2019 Six Months Ended Sep 2020 Six Months Ended Sep 2019
India SA Africa Total India SA Africa Total India SA Africa Total India SA Africa Total
Total revenues 188,471 71,660 257,850 154,608 59,157 211,313 365,390 136,173 497,237 309,056 114,590 418,692
EBITDA 86,032 32,453 118,483 63,298 26,082 89,363 164,000 60,878 224,875 124,021 50,288 174,289
EBITDA / Total revenues 45.6% 45.3% 46.0% 40.9% 44.1% 42.3% 44.9% 44.7% 45.2% 40.1% 43.9% 41.6%
EBIT 24,165 19,952 44,117 4,601 15,344 19,930 41,514 35,885 77,396 6,888 29,106 35,975
Profit before tax (3,768) 13,019 5,671 (17,071) 10,633 (6,231) (3,911) 21,405 9,391 (37,607) 18,688 (21,529)
Income tax expense (190) 6,331 5,729 (6,908) 4,753 (1,874) (3,076) 10,961 7,473 (16,132) 8,074 (7,704)
Profit after tax (before
exceptional items)(3,578) 6,687 (57) (10,163) 5,880 (4,357) (834) 10,444 1,918 (21,475) 10,614 (13,826)
Non Controlling Interest 3,591 3,659 7,387 3,878 2,832 6,872 7,822 5,835 13,726 6,547 4,642 11,405
Net income (before
exceptional items)(7,168) 3,028 (7,444) (14,041) 3,048 (11,228) (8,656) 4,608 (11,808) (28,022) 5,972 (25,230)
Exceptional Items (net of tax) 493 212,445 87,764 227,859
Tax related Exceptional items (211) 11,499 66,406 10,538
Profit after tax (after
exceptional items)(339) (228,301) (152,252) (252,223)
Non Controlling Interest 7,293 2,148 14,712 6,886
Net income (7,632) (230,449) (166,963) (259,109)
Capex 56,761 11,146 67,907 27,576 10,326 37,901 91,510 16,150 107,660 71,117 17,252 88,370
Operating Free Cash Flow
(EBITDA - Capex)29,271 21,307 50,577 35,723 15,756 51,461 72,490 44,728 117,215 52,904 33,035 85,919
Cumulative Investments 3,063,713 637,824 3,727,628 2,903,597 586,118 3,514,674 3,063,713 637,824 3,727,628 2,903,597 586,118 3,514,674
Particulars
Page 8 of 58
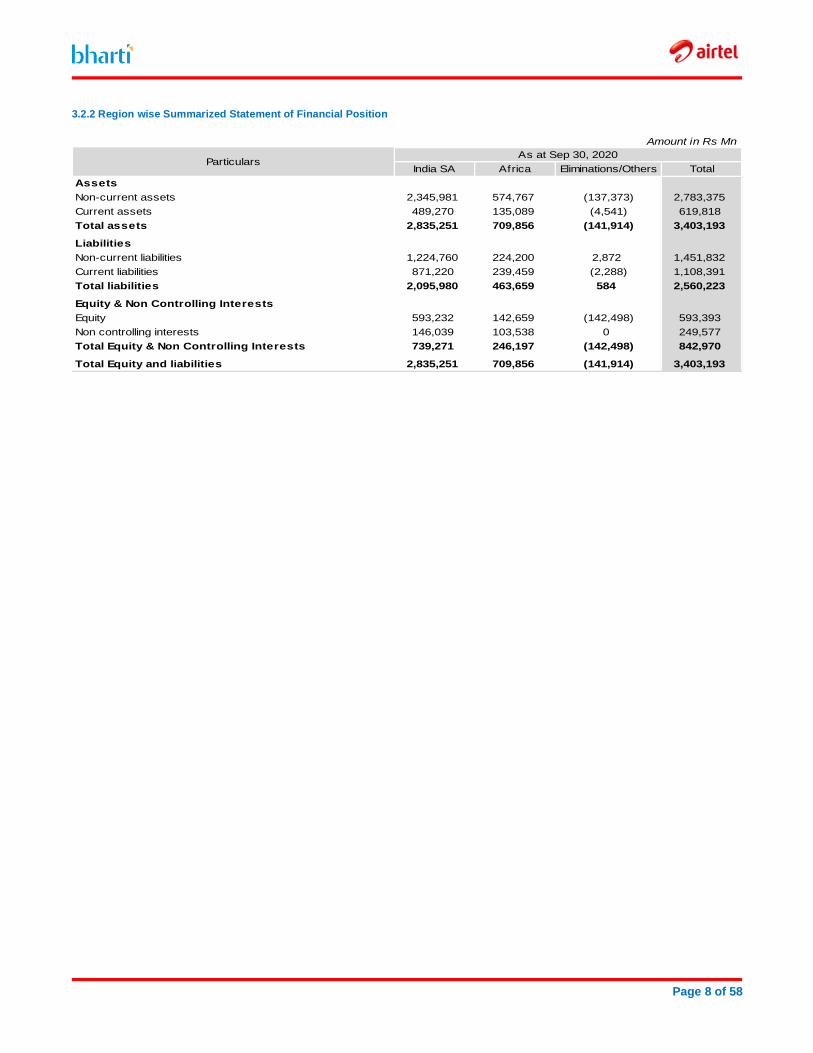
3.2.2 Region wise Summarized Statement of Financial Position
Amount in Rs Mn
India SA Africa Eliminations/Others Total
Assets
Non-current assets 2,345,981 574,767 (137,373) 2,783,375
Current assets 489,270 135,089 (4,541) 619,818
Total assets 2,835,251 709,856 (141,914) 3,403,193
Liabilities
Non-current liabilities 1,224,760 224,200 2,872 1,451,832
Current liabilities 871,220 239,459 (2,288) 1,108,391
Total liabilities 2,095,980 463,659 584 2,560,223
Equity & Non Controlling Interests
Equity 593,232 142,659 (142,498) 593,393
Non controlling interests 146,039 103,538 0 249,577
Total Equity & Non Controlling Interests 739,271 246,197 (142,498) 842,970
Total Equity and liabilities 2,835,251 709,856 (141,914) 3,403,193
ParticularsAs at Sep 30, 2020
Page 9 of 58
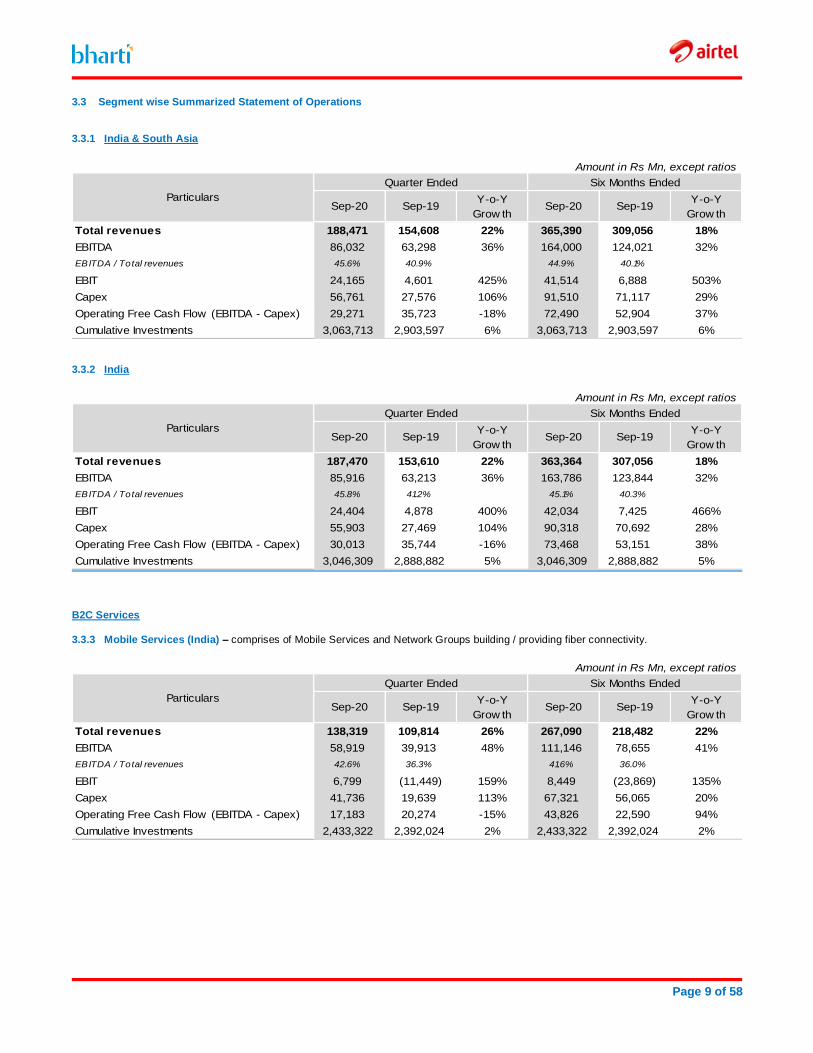
3.3 Segment wise Summarized Statement of Operations
3.3.1 India & South Asia
Amount in Rs Mn, except ratios
Quarter Ended Six Months Ended
Sep-20 Sep-19Y-o-Y
Grow thSep-20 Sep-19
Y-o-Y
Grow th
Total revenues 188,471 154,608 22% 365,390 309,056 18%
EBITDA 86,032 63,298 36% 164,000 124,021 32%
EBITDA / Total revenues 45.6% 40.9% 44.9% 40.1%
EBIT 24,165 4,601 425% 41,514 6,888 503%
Capex 56,761 27,576 106% 91,510 71,117 29%
Operating Free Cash Flow (EBITDA - Capex) 29,271 35,723 -18% 72,490 52,904 37%
Cumulative Investments 3,063,713 2,903,597 6% 3,063,713 2,903,597 6%
Particulars
3.3.2 India
Amount in Rs Mn, except ratios
Quarter Ended Six Months Ended
Sep-20 Sep-19Y-o-Y
Grow thSep-20 Sep-19
Y-o-Y
Grow th
Total revenues 187,470 153,610 22% 363,364 307,056 18%
EBITDA 85,916 63,213 36% 163,786 123,844 32%
EBITDA / Total revenues 45.8% 41.2% 45.1% 40.3%
EBIT 24,404 4,878 400% 42,034 7,425 466%
Capex 55,903 27,469 104% 90,318 70,692 28%
Operating Free Cash Flow (EBITDA - Capex) 30,013 35,744 -16% 73,468 53,151 38%
Cumulative Investments 3,046,309 2,888,882 5% 3,046,309 2,888,882 5%
Particulars
B2C Services
3.3.3 Mobile Services (India) – comprises of Mobile Services and Network Groups building / providing fiber connectivity.
Amount in Rs Mn, except ratios
Quarter Ended Six Months Ended
Sep-20 Sep-19Y-o-Y
Grow thSep-20 Sep-19
Y-o-Y
Grow th
Total revenues 138,319 109,814 26% 267,090 218,482 22%
EBITDA 58,919 39,913 48% 111,146 78,655 41%
EBITDA / Total revenues 42.6% 36.3% 41.6% 36.0%
EBIT 6,799 (11,449) 159% 8,449 (23,869) 135%
Capex 41,736 19,639 113% 67,321 56,065 20%
Operating Free Cash Flow (EBITDA - Capex) 17,183 20,274 -15% 43,826 22,590 94%
Cumulative Investments 2,433,322 2,392,024 2% 2,433,322 2,392,024 2%
Particulars
Page 10 of 58
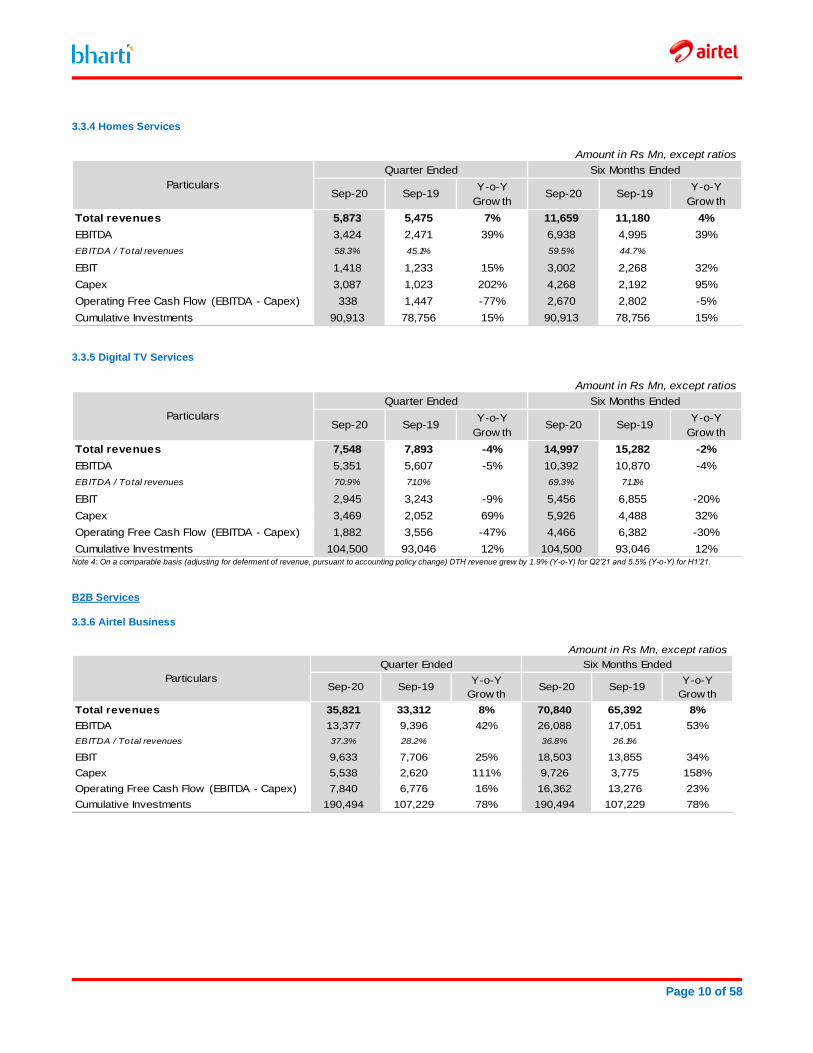
3.3.4 Homes Services
Amount in Rs Mn, except ratios
Quarter Ended Six Months Ended
Sep-20 Sep-19Y-o-Y
Grow thSep-20 Sep-19
Y-o-Y
Grow th
Total revenues 5,873 5,475 7% 11,659 11,180 4%
EBITDA 3,424 2,471 39% 6,938 4,995 39%
EBITDA / Total revenues 58.3% 45.1% 59.5% 44.7%
EBIT 1,418 1,233 15% 3,002 2,268 32%
Capex 3,087 1,023 202% 4,268 2,192 95%
Operating Free Cash Flow (EBITDA - Capex) 338 1,447 -77% 2,670 2,802 -5%
Cumulative Investments 90,913 78,756 15% 90,913 78,756 15%
Particulars
3.3.5 Digital TV Services
Amount in Rs Mn, except ratios
Quarter Ended Six Months Ended
Sep-20 Sep-19Y-o-Y
Grow thSep-20 Sep-19
Y-o-Y
Grow th
Total revenues 7,548 7,893 -4% 14,997 15,282 -2%
EBITDA 5,351 5,607 -5% 10,392 10,870 -4%
EBITDA / Total revenues 70.9% 71.0% 69.3% 71.1%
EBIT 2,945 3,243 -9% 5,456 6,855 -20%
Capex 3,469 2,052 69% 5,926 4,488 32%
Operating Free Cash Flow (EBITDA - Capex) 1,882 3,556 -47% 4,466 6,382 -30%
Cumulative Investments 104,500 93,046 12% 104,500 93,046 12%
Particulars
Note 4: On a comparable basis (adjusting for deferment of revenue, pursuant to accounting policy change) DTH revenue grew by 1.9% (Y-o-Y) for Q2’21 and 5.5% (Y-o-Y) for H1’21.
B2B Services
3.3.6 Airtel Business
Amount in Rs Mn, except ratios
Quarter Ended Six Months Ended
Sep-20 Sep-19Y-o-Y
Grow thSep-20 Sep-19
Y-o-Y
Grow th
Total revenues 35,821 33,312 8% 70,840 65,392 8%
EBITDA 13,377 9,396 42% 26,088 17,051 53%
EBITDA / Total revenues 37.3% 28.2% 36.8% 26.1%
EBIT 9,633 7,706 25% 18,503 13,855 34%
Capex 5,538 2,620 111% 9,726 3,775 158%
Operating Free Cash Flow (EBITDA - Capex) 7,840 6,776 16% 16,362 13,276 23%
Cumulative Investments 190,494 107,229 78% 190,494 107,229 78%
Particulars
Page 11 of 58
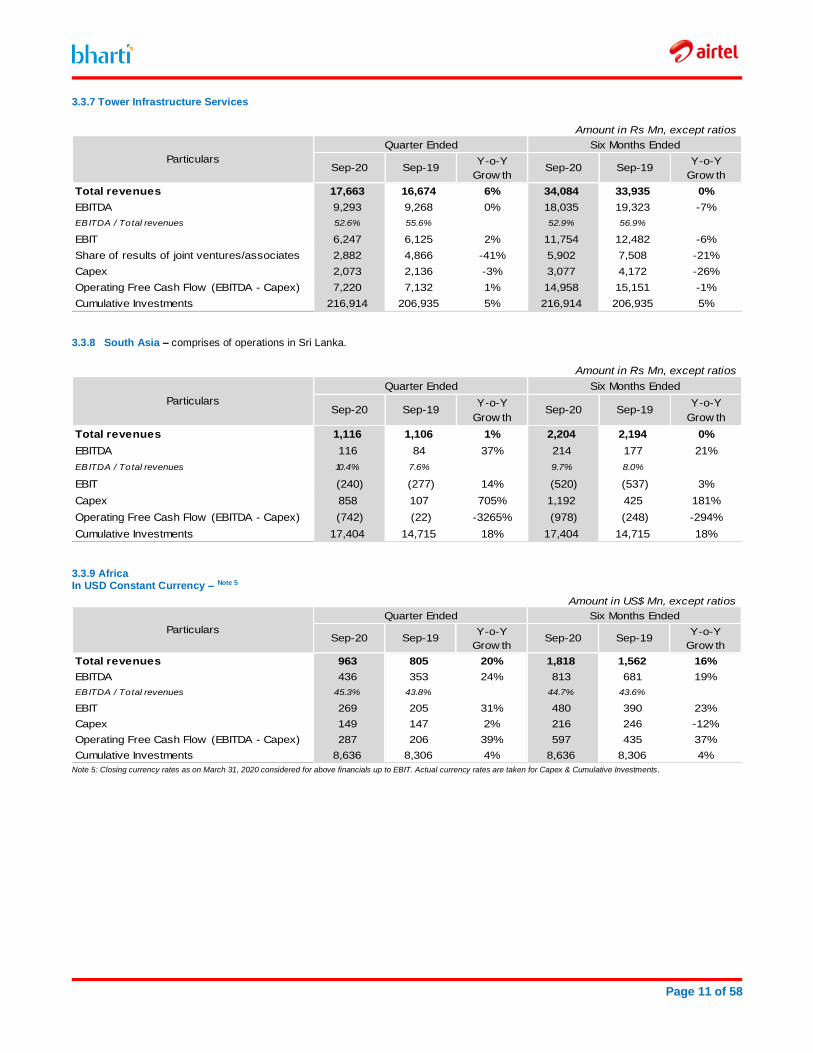
3.3.7 Tower Infrastructure Services
Amount in Rs Mn, except ratios
Quarter Ended Six Months Ended
Sep-20 Sep-19Y-o-Y
Grow thSep-20 Sep-19
Y-o-Y
Grow th
Total revenues 17,663 16,674 6% 34,084 33,935 0%
EBITDA 9,293 9,268 0% 18,035 19,323 -7%
EBITDA / Total revenues 52.6% 55.6% 52.9% 56.9%
EBIT 6,247 6,125 2% 11,754 12,482 -6%
Share of results of joint ventures/associates 2,882 4,866 -41% 5,902 7,508 -21%
Capex 2,073 2,136 -3% 3,077 4,172 -26%
Operating Free Cash Flow (EBITDA - Capex) 7,220 7,132 1% 14,958 15,151 -1%
Cumulative Investments 216,914 206,935 5% 216,914 206,935 5%
Particulars
3.3.8 South Asia – comprises of operations in Sri Lanka.
Amount in Rs Mn, except ratios
Quarter Ended Six Months Ended
Sep-20 Sep-19Y-o-Y
Grow thSep-20 Sep-19
Y-o-Y
Grow th
Total revenues 1,116 1,106 1% 2,204 2,194 0%
EBITDA 116 84 37% 214 177 21%
EBITDA / Total revenues 10.4% 7.6% 9.7% 8.0%
EBIT (240) (277) 14% (520) (537) 3%
Capex 858 107 705% 1,192 425 181%
Operating Free Cash Flow (EBITDA - Capex) (742) (22) -3265% (978) (248) -294%
Cumulative Investments 17,404 14,715 18% 17,404 14,715 18%
Particulars
3.3.9 Africa In USD Constant Currency – Note 5
Amount in US$ Mn, except ratios
Quarter Ended Six Months Ended
Sep-20 Sep-19Y-o-Y
Grow thSep-20 Sep-19
Y-o-Y
Grow th
Total revenues 963 805 20% 1,818 1,562 16%
EBITDA 436 353 24% 813 681 19%
EBITDA / Total revenues 45.3% 43.8% 44.7% 43.6%
EBIT 269 205 31% 480 390 23%
Capex 149 147 2% 216 246 -12%
Operating Free Cash Flow (EBITDA - Capex) 287 206 39% 597 435 37%
Cumulative Investments 8,636 8,306 4% 8,636 8,306 4%
Particulars
Note 5: Closing currency rates as on March 31, 2020 considered for above financials up to EBIT. Actual currency rates are taken for Capex & Cumulative Investments.
Page 12 of 58
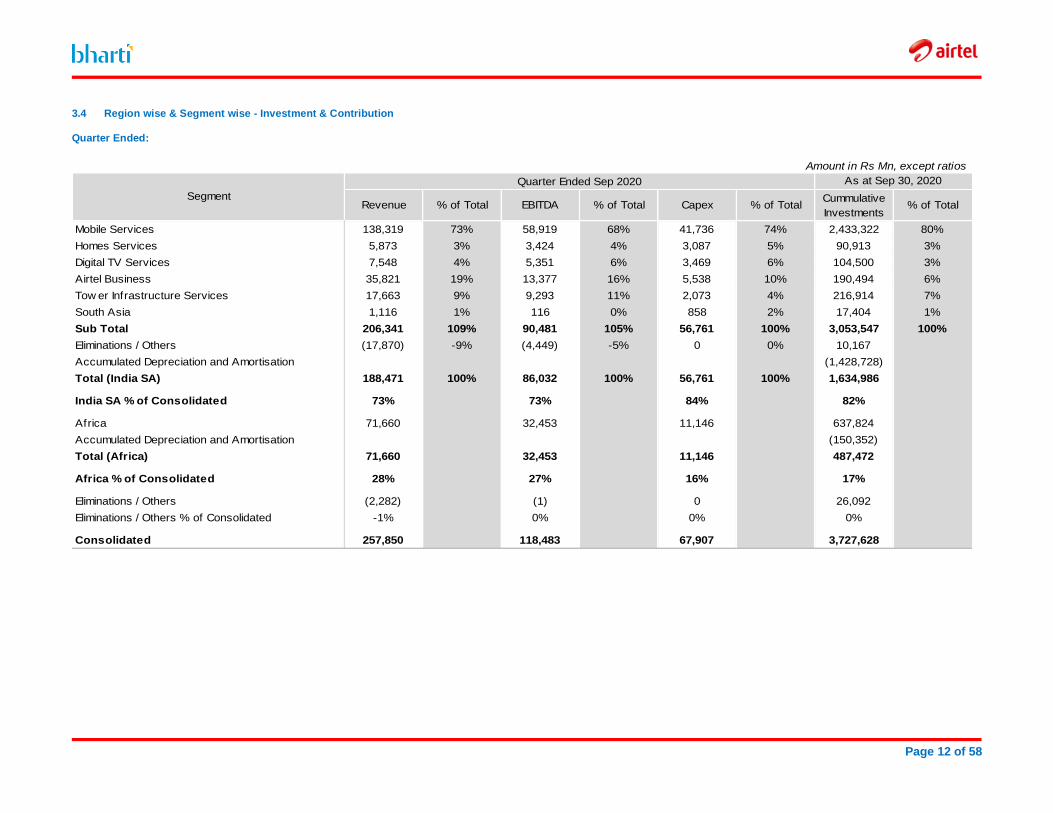
3.4 Region wise & Segment wise - Investment & Contribution
Quarter Ended:
Amount in Rs Mn, except ratios
Quarter Ended Sep 2020
Revenue % of Total EBITDA % of Total Capex % of TotalCummulative
Investments% of Total
Mobile Services 138,319 73% 58,919 68% 41,736 74% 2,433,322 80%
Homes Services 5,873 3% 3,424 4% 3,087 5% 90,913 3%
Digital TV Services 7,548 4% 5,351 6% 3,469 6% 104,500 3%
Airtel Business 35,821 19% 13,377 16% 5,538 10% 190,494 6%
Tow er Infrastructure Services 17,663 9% 9,293 11% 2,073 4% 216,914 7%
South Asia 1,116 1% 116 0% 858 2% 17,404 1%
Sub Total 206,341 109% 90,481 105% 56,761 100% 3,053,547 100%
Eliminations / Others (17,870) -9% (4,449) -5% 0 0% 10,167
Accumulated Depreciation and Amortisation (1,428,728)
Total (India SA) 188,471 100% 86,032 100% 56,761 100% 1,634,986
India SA % of Consolidated 73% 73% 84% 82%
Africa 71,660 32,453 11,146 637,824
Accumulated Depreciation and Amortisation (150,352)
Total (Africa) 71,660 32,453 11,146 487,472
Africa % of Consolidated 28% 27% 16% 17%
Eliminations / Others (2,282) (1) 0 26,092
Eliminations / Others % of Consolidated -1% 0% 0% 0%
Consolidated 257,850 118,483 67,907 3,727,628
Segment
As at Sep 30, 2020
Page 13 of 58
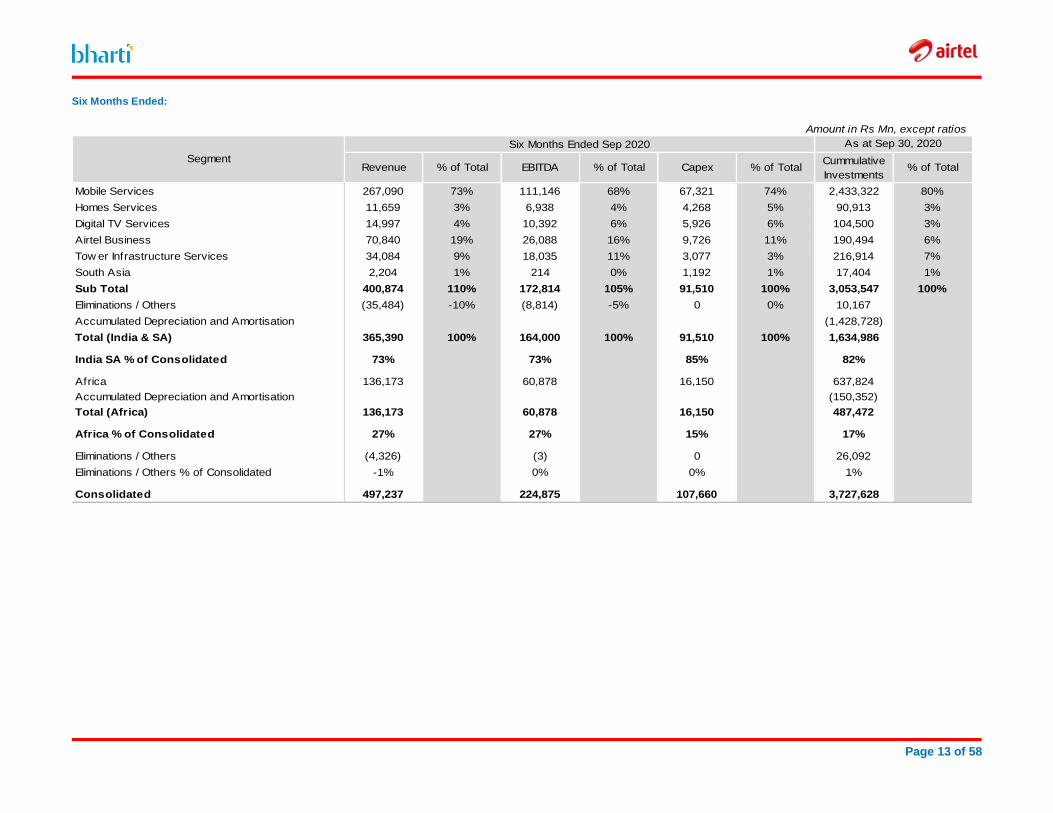
Six Months Ended:
Amount in Rs Mn, except ratios
Six Months Ended Sep 2020
Revenue % of Total EBITDA % of Total Capex % of TotalCummulative
Investments% of Total
Mobile Services 267,090 73% 111,146 68% 67,321 74% 2,433,322 80%
Homes Services 11,659 3% 6,938 4% 4,268 5% 90,913 3%
Digital TV Services 14,997 4% 10,392 6% 5,926 6% 104,500 3%
Airtel Business 70,840 19% 26,088 16% 9,726 11% 190,494 6%
Tow er Infrastructure Services 34,084 9% 18,035 11% 3,077 3% 216,914 7%
South Asia 2,204 1% 214 0% 1,192 1% 17,404 1%
Sub Total 400,874 110% 172,814 105% 91,510 100% 3,053,547 100%
Eliminations / Others (35,484) -10% (8,814) -5% 0 0% 10,167
Accumulated Depreciation and Amortisation (1,428,728)
Total (India & SA) 365,390 100% 164,000 100% 91,510 100% 1,634,986
India SA % of Consolidated 73% 73% 85% 82%
Africa 136,173 60,878 16,150 637,824
Accumulated Depreciation and Amortisation (150,352)
Total (Africa) 136,173 60,878 16,150 487,472
Africa % of Consolidated 27% 27% 15% 17%
Eliminations / Others (4,326) (3) 0 26,092
Eliminations / Others % of Consolidated -1% 0% 0% 1%
Consolidated 497,237 224,875 107,660 3,727,628
Segment
As at Sep 30, 2020
Page 14 of 58
SECTION 4
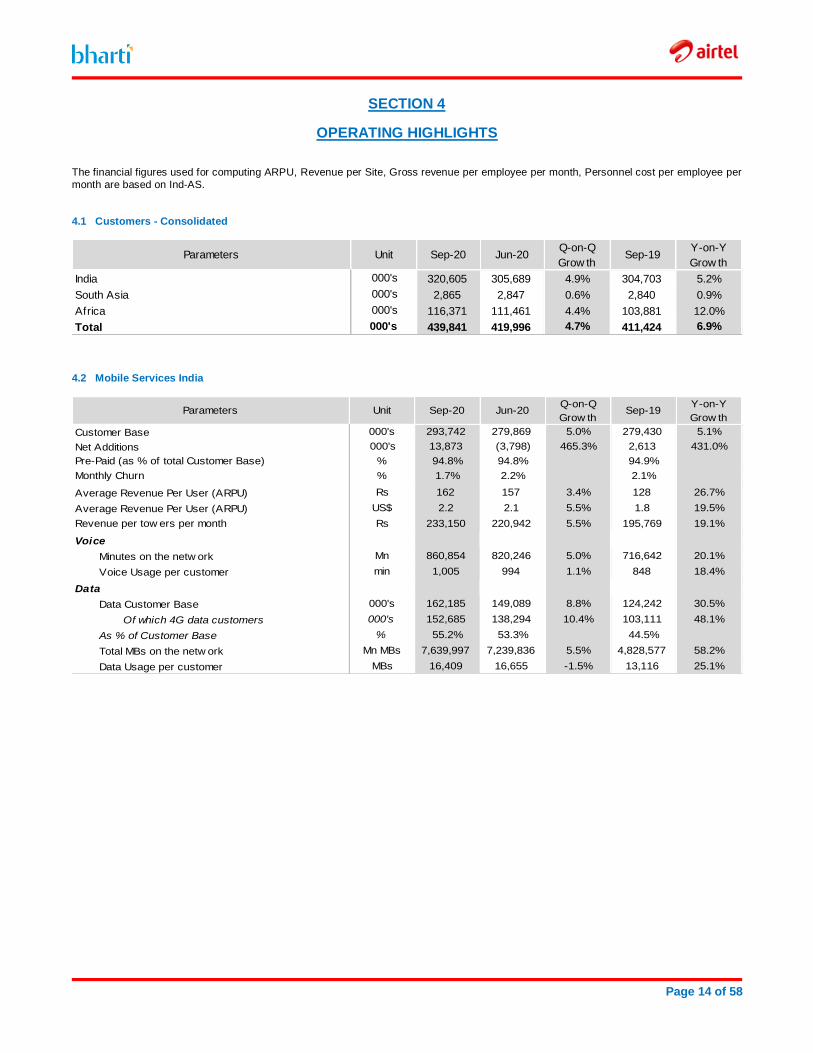
OPERATING HIGHLIGHTS
The financial figures used for computing ARPU, Revenue per Site, Gross revenue per employee per month, Personnel cost per employee per
month are based on Ind-AS.
4.1 Customers - Consolidated
Parameters Unit Sep-20 Jun-20Q-on-Q
Grow thSep-19
Y-on-Y
Grow th
India 000's 320,605 305,689 4.9% 304,703 5.2%
South Asia 000's 2,865 2,847 0.6% 2,840 0.9%
Africa 000's 116,371 111,461 4.4% 103,881 12.0%
Total 000's 439,841 419,996 4.7% 411,424 6.9%
4.2 Mobile Services India
Parameters Unit Sep-20 Jun-20Q-on-Q
Grow thSep-19
Y-on-Y
Grow th
Customer Base 000's 293,742 279,869 5.0% 279,430 5.1%
Net Additions 000's 13,873 (3,798) 465.3% 2,613 431.0%
Pre-Paid (as % of total Customer Base) % 94.8% 94.8% 94.9%
Monthly Churn % 1.7% 2.2% 2.1%
Average Revenue Per User (ARPU) Rs 162 157 3.4% 128 26.7%
Average Revenue Per User (ARPU) US$ 2.2 2.1 5.5% 1.8 19.5%
Revenue per tow ers per month Rs 233,150 220,942 5.5% 195,769 19.1%
Voice
Minutes on the netw ork Mn 860,854 820,246 5.0% 716,642 20.1%
Voice Usage per customer min 1,005 994 1.1% 848 18.4%
Data
Data Customer Base 000's 162,185 149,089 8.8% 124,242 30.5%
Of which 4G data customers 000's 152,685 138,294 10.4% 103,111 48.1%
As % of Customer Base % 55.2% 53.3% 44.5%
Total MBs on the netw ork Mn MBs 7,639,997 7,239,836 5.5% 4,828,577 58.2%
Data Usage per customer MBs 16,409 16,655 -1.5% 13,116 25.1%
Page 15 of 58
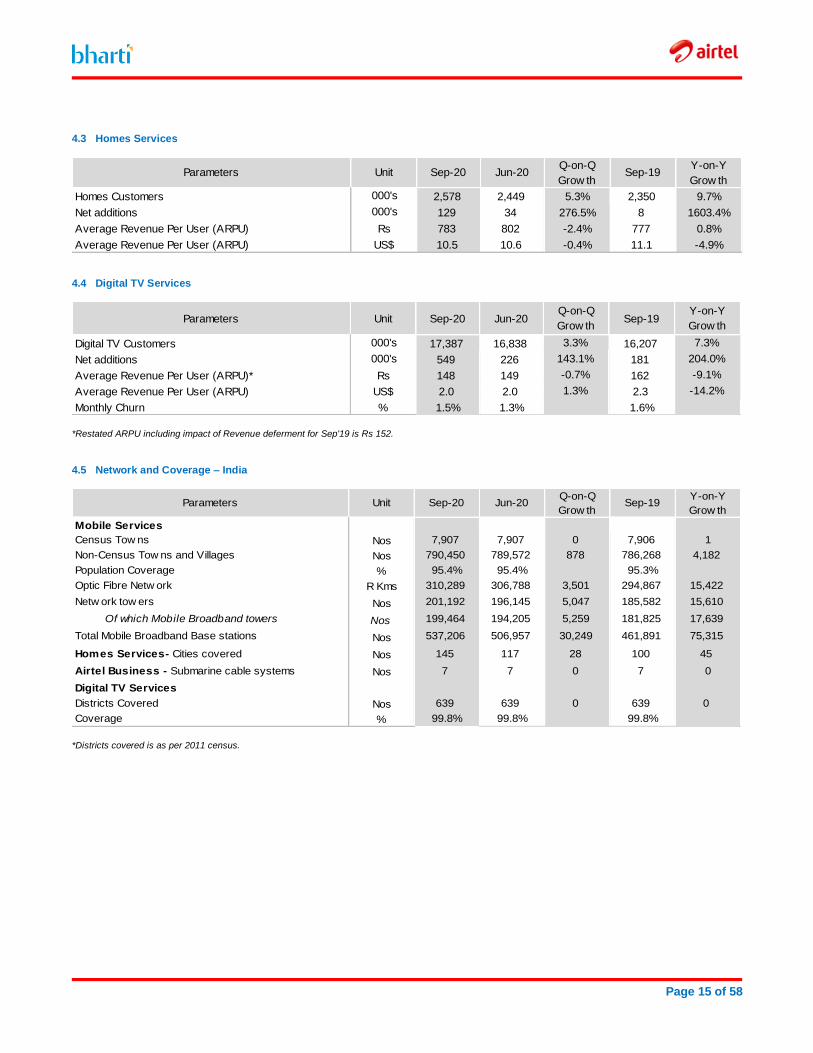
4.3 Homes Services
Parameters Unit Sep-20 Jun-20Q-on-Q
Grow thSep-19
Y-on-Y
Grow th
Homes Customers 000's 2,578 2,449 5.3% 2,350 9.7%
Net additions 000's 129 34 276.5% 8 1603.4%
Average Revenue Per User (ARPU) Rs 783 802 -2.4% 777 0.8%
Average Revenue Per User (ARPU) US$ 10.5 10.6 -0.4% 11.1 -4.9% 4.4 Digital TV Services
Parameters Unit Sep-20 Jun-20Q-on-Q
Grow thSep-19
Y-on-Y
Grow th
Digital TV Customers 000's 17,387 16,838 3.3% 16,207 7.3%
Net additions 000's 549 226 143.1% 181 204.0%
Average Revenue Per User (ARPU)* Rs 148 149 -0.7% 162 -9.1%
Average Revenue Per User (ARPU) US$ 2.0 2.0 1.3% 2.3 -14.2%
Monthly Churn % 1.5% 1.3% 1.6%
*Restated ARPU including impact of Revenue deferment for Sep'19 is Rs 152.
4.5 Network and Coverage – India
Parameters Unit Sep-20 Jun-20Q-on-Q
Grow thSep-19
Y-on-Y
Grow th
Mobile Services
Census Tow ns Nos 7,907 7,907 0 7,906 1
Non-Census Tow ns and Villages Nos 790,450 789,572 878 786,268 4,182
Population Coverage % 95.4% 95.4% 95.3%
Optic Fibre Netw ork R Kms 310,289 306,788 3,501 294,867 15,422
Netw ork tow ers Nos 201,192 196,145 5,047 185,582 15,610
Of which Mobile Broadband towers Nos 199,464 194,205 5,259 181,825 17,639
Total Mobile Broadband Base stations Nos 537,206 506,957 30,249 461,891 75,315
Homes Services- Cities covered Nos 145 117 28 100 45
Airtel Business - Submarine cable systems Nos 7 7 0 7 0
Digital TV Services
Districts Covered Nos 639 639 0 639 0
Coverage % 99.8% 99.8% 99.8%
*Districts covered is as per 2011 census.
Page 16 of 58
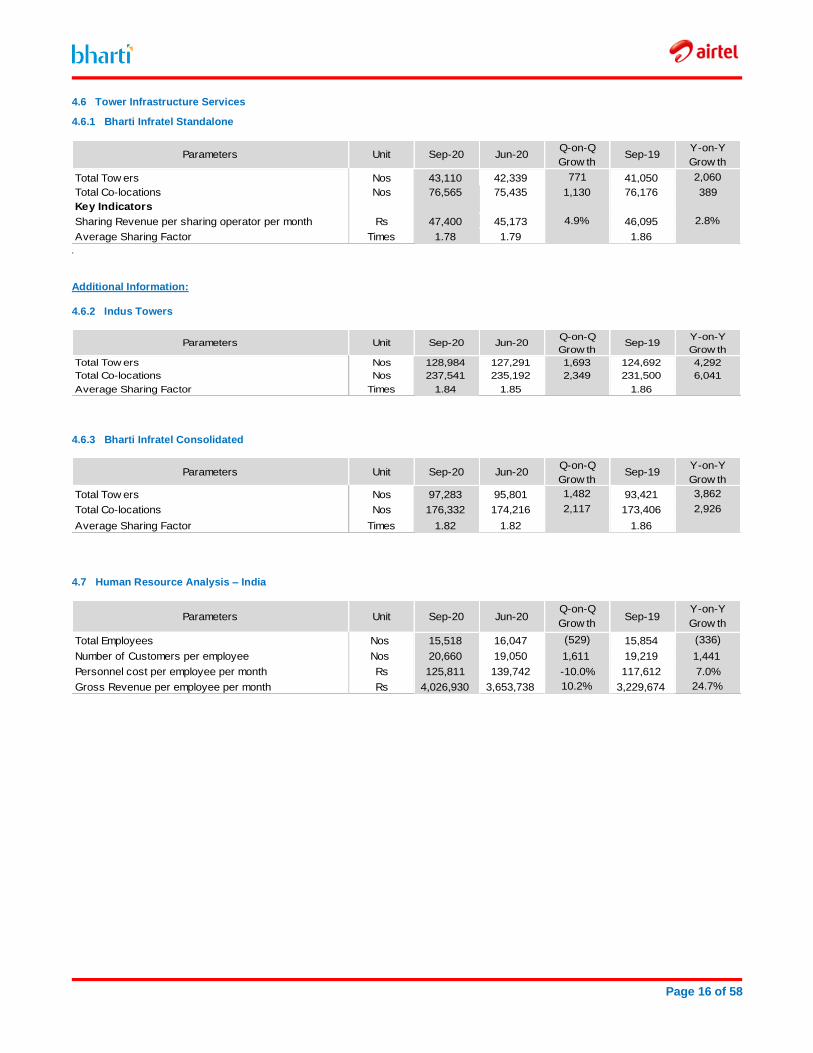
4.6 Tower Infrastructure Services
4.6.1 Bharti Infratel Standalone
Parameters Unit Sep-20 Jun-20Q-on-Q
Grow thSep-19
Y-on-Y
Grow th
Total Tow ers Nos 43,110 42,339 771 41,050 2,060
Total Co-locations Nos 76,565 75,435 1,130 76,176 389
Key Indicators
Sharing Revenue per sharing operator per month Rs 47,400 45,173 4.9% 46,095 2.8%
Average Sharing Factor Times 1.78 1.79 1.86
.
Additional Information:
4.6.2 Indus Towers
Parameters Unit Sep-20 Jun-20Q-on-Q
Grow thSep-19
Y-on-Y
Grow th
Total Tow ers Nos 128,984 127,291 1,693 124,692 4,292
Total Co-locations Nos 237,541 235,192 2,349 231,500 6,041
Average Sharing Factor Times 1.84 1.85 1.86
4.6.3 Bharti Infratel Consolidated
Parameters Unit Sep-20 Jun-20Q-on-Q
Grow thSep-19
Y-on-Y
Grow th
Total Tow ers Nos 97,283 95,801 1,482 93,421 3,862
Total Co-locations Nos 176,332 174,216 2,117 173,406 2,926
Average Sharing Factor Times 1.82 1.82 1.86
4.7 Human Resource Analysis – India
Parameters Unit Sep-20 Jun-20Q-on-Q
Grow thSep-19
Y-on-Y
Grow th
Total Employees Nos 15,518 16,047 (529) 15,854 (336)
Number of Customers per employee Nos 20,660 19,050 1,611 19,219 1,441
Personnel cost per employee per month Rs 125,811 139,742 -10.0% 117,612 7.0%
Gross Revenue per employee per month Rs 4,026,930 3,653,738 10.2% 3,229,674 24.7%
Page 17 of 58
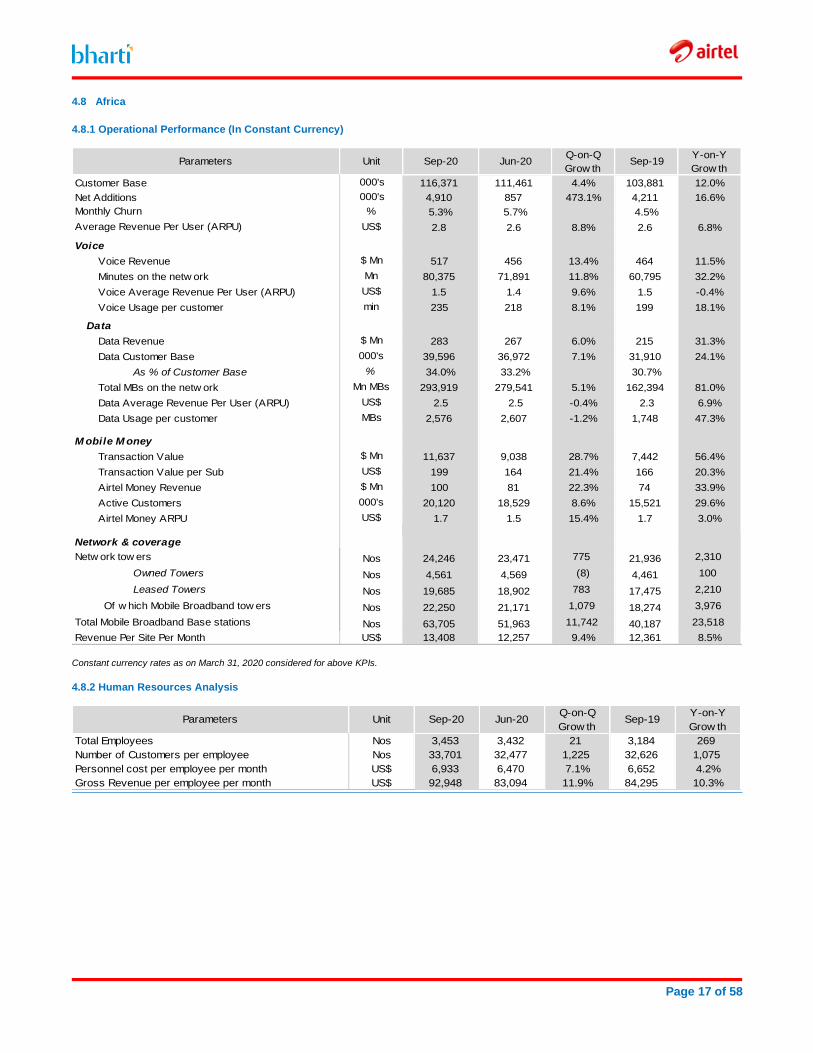
4.8 Africa
4.8.1 Operational Performance (In Constant Currency)
Parameters Unit Sep-20 Jun-20Q-on-Q
Grow thSep-19
Y-on-Y
Grow th
Customer Base 000's 116,371 111,461 4.4% 103,881 12.0%
Net Additions 000's 4,910 857 473.1% 4,211 16.6%
Monthly Churn % 5.3% 5.7% 4.5%
Average Revenue Per User (ARPU) US$ 2.8 2.6 8.8% 2.6 6.8%
Voice
Voice Revenue $ Mn 517 456 13.4% 464 11.5%
Minutes on the netw ork Mn 80,375 71,891 11.8% 60,795 32.2%
Voice Average Revenue Per User (ARPU) US$ 1.5 1.4 9.6% 1.5 -0.4%
Voice Usage per customer min 235 218 8.1% 199 18.1%
Data
Data Revenue $ Mn 283 267 6.0% 215 31.3%
Data Customer Base 000's 39,596 36,972 7.1% 31,910 24.1%
As % of Customer Base % 34.0% 33.2% 30.7%
Total MBs on the netw ork Mn MBs 293,919 279,541 5.1% 162,394 81.0%
Data Average Revenue Per User (ARPU) US$ 2.5 2.5 -0.4% 2.3 6.9%
Data Usage per customer MBs 2,576 2,607 -1.2% 1,748 47.3%
M obile M oney
Transaction Value $ Mn 11,637 9,038 28.7% 7,442 56.4%
Transaction Value per Sub US$ 199 164 21.4% 166 20.3%
Airtel Money Revenue $ Mn 100 81 22.3% 74 33.9%
Active Customers 000's 20,120 18,529 8.6% 15,521 29.6%
Airtel Money ARPU US$ 1.7 1.5 15.4% 1.7 3.0%
Network & coverage
Netw ork tow ers Nos 24,246 23,471 775 21,936 2,310
Owned Towers Nos 4,561 4,569 (8) 4,461 100
Leased Towers Nos 19,685 18,902 783 17,475 2,210
Of w hich Mobile Broadband tow ers Nos 22,250 21,171 1,079 18,274 3,976
Total Mobile Broadband Base stations Nos 63,705 51,963 11,742 40,187 23,518
Revenue Per Site Per Month US$ 13,408 12,257 9.4% 12,361 8.5%
Constant currency rates as on March 31, 2020 considered for above KPIs.
4.8.2 Human Resources Analysis
Parameters Unit Sep-20 Jun-20Q-on-Q
Grow thSep-19
Y-on-Y
Grow th
Total Employees Nos 3,453 3,432 21 3,184 269
Number of Customers per employee Nos 33,701 32,477 1,225 32,626 1,075
Personnel cost per employee per month US$ 6,933 6,470 7.1% 6,652 4.2%
Gross Revenue per employee per month US$ 92,948 83,094 11.9% 84,295 10.3%
Page 18 of 58
SECTION 5
MANAGEMENT DISCUSSION AND ANALYSIS
5.1 India SA 1. Key Industry Developments
A. Pursuant to the Judgement of the Hon’ble Supreme Court of
India on October 24, 2019 (‘Court Judgement’) including
subsequent supplementary judgments, and in the absence of any potential reliefs, the Group provided for Rs. 368,322 Mn for the periods up to March 31, 2020 on the basis of
demands received and the period for which demands have not been received having regard to assessments carried out in earlier years and the guidelines / clarifications in respect
of License Fees and Spectrum Usage Charges (‘AGR Provision’).
On July 20, 2020 the Hon’ble Supreme Court, after hearing all parties, observed that the amounts of AGR dues given by DoT in their modification application is to be treated as final
(‘DoT Demand’) and there can be no scope of re-assessment or recalculation. Consequently, without prejudice and on prudence, during the quarter ended June
30, 2020 the Group had further recorded an incremental provision of Rs. 107,444 Mn (including net interest on total provision created considering interest rate as per the
affidavit filed by DoT on March 16, 2020 with effect from the date of Court Judgement) to give effect of the differential amount between the AGR provision and the DoT demand
along with provision for subsequent periods for which demands have not been received computed on the basis of the License Agreement read with the guidelines /
clarifications and the Court Judgment, which had been presented as exceptional item. During the quarter ended September 30, 2020, the Company has continued to
recognize its AGR obligations based on Court Judgement and guidelines/clarifications received from DoT in respect of License Fees and Spectrum Usage Charges.
Further, in its judgment dated, September 1, 2020 the Hon’ble Supreme Court reaffirmed that the demand raised
by the DoT stated in its modification application as final and no dispute or re-assessment shall be undertaken. In addition, Hon’ble Supreme Court directed that the Telecom
Operators shall make a payment of 10% of the total dues as demanded by DoT, by March 31, 2021 and remaining dues in yearly instalments commencing April 1, 2021 till March 31,
2031, payable by March 31 of every succeeding financial year. The Group has represented to DoT that it has already paid more than 10% of the total dues as demanded by DoT
and will ensure ongoing compliance with the Hon’ble Supreme Court’s orders.
B. On September 30, 2020, TRAI has issued "Telecom
Consumers Protection (Eleventh Amendment) Regulations, 2020". The salient points include:-
The international mobile roaming service is inactive by
default for all consumers and shall be activated only on the request of a consumer and once activated, it may be
deactivated at any time on the request of the consumer.
In case of existing consumers, the specific choice of every consumer to continue with or to discontinue the activated
international mobile roaming service, if applicable, may be obtained through SMS, email or mobile application, if available within thirty days
C. On September 22, 2020, TRAI has issued recommendations
on "Traffic Management Practices (TMPs) and Multi-
Stakeholder Body for Net Neutrality". The salient points include:-
The DoT may establish a multi-stakeholder body (MSB) to
ensure that Internet Access Providers adhere to the provisions of net neutrality in their license.
The DoT may define the process for the creation and maintenance of a repository of reasonable TMPs.
The Internet Access Providers shall submit, to both the DoT and the MSB, the TMPs that it employs for managing
their networks.
D. On September 18, 2020, TRAI has issued direction on "Tariff
Publication" mandating each tariff offer in the nature of Postpaid plans, Plan Vouchers, STV/Combo vouchers/ Add on Packs shall be made available to the subscribers at customer care centers, the point of sale, retail outlets and on
the website & App.
E. On September 18, 2020, TRAI has issued directions for
"Tariff Advertisements" mandating the TSPs to promptly highlight additional terms & conditions (T&Cs) in all tariff advertisements with specific link of such T&Cs on the TSP
website and mobile application.
F. On September 14, 2020, TRAI has issued recommendations
on "Regulatory Framework for Over-The-Top (OTT) Communication Services. The salient points include:-
Market forces may be allowed to respond to the situation
without prescribing any regulatory intervention.
No regulatory interventions are required in respect of
issues related with Privacy and security of OTT services at the moment.
It is not an opportune moment to recommend a comprehensive regulatory framework for various aspects
of services referred to as OTT services, beyond the extant laws and regulations prescribed presently
G. On August 27, 2020, TRAI issued direction granting the
clearance for generating Unique Porting Code (UPC) if the outstanding payment due from postpaid subscriber in the previous bill is Rs. 10 or less and nonpayment disconnection
request should not be raised if the amount is Rs. 10 or less.
H. On August 17, 2020, TRAI issued recommendations on
"Methodology of applying Spectrum Usage Charges (SUC) under the weighted average method of SUC assessment, in cases of Spectrum Sharing" clarifying that an increment of
0.5% on SUC rate should apply on the spectrum holding in specific band in which sharing is taking place, and not on the entire spectrum holding.
I. TRAI Recommendations dated July 28, 2020 on "Provision
of Cellular Backhaul Connectivity via Satellite through VSAT
under Commercial VSAT CUG Service Authorization". The salient points include:-
The Commercial VSAT CUG Service provider should be
permitted to provide backhaul connectivity for cellular mobile services through satellite using VSAT to the
Access Service providers.
Page 19 of 58
Sharing of active & passive infrastructure owned by a
licensee under any of the service authorizations be permitted.
Reduction in SUC payout from current 4% of AGR to 1%
of AGR in the commercial VSAT License i.e. a reduction in SUC payout by approximately Rs.3.5 Crs (basis AGR for FY 2019-20)
Reduction in SUC payout for VSAT links used in NLD License from current formula based payout which are
exorbitantly high to 1% of AGR from Satellite services
J. On July 10, 2020, TRAI has issued "The Telecommunication
Interconnection (Second Amendment) Regulations, 2020". The salient points of the regulation include:-
The regulation does away with the requirement to have
Interconnection at Short Distance Charging Center (SDCC) and mandates it at the Long Distance Charging
Area (LDCA) Level.
Now the SDCC call from Fixed Network can be handed
over at LDCC POI itself which would lead to Capex/ Opex reduction & faster rollout of Fixed Network Services.
2. Key Company Developments A. COVID-19
With the series of unlocks throughout the country, we see a gradual return to normalcy. However, while the economy
opens up, the COVID pandemic continues. Delivering uninterrupted services and great end user experience while ensuring safety of our employees and partners continues to
remain our key priority. We continue to drive awareness about digital channels for online recharges and payments, as well as redressal of customer complaints.
Network: Connectivity has become even more essential
across all realms of life – work, education or entertainment. We accelerated the pace of our infrastructure deployment to support growing customer needs. Our network teams
continue to ensure urgent response for service restoration where impacted, while simultaneously improving the overall network experience of customers through digital tools and
analytics.
Governance: We continue to closely track all developments
through a 24*7 war room with rigorous cadence of leadership meetings chaired by the CEO to monitor safety of
our employees and partners, review network and customer experience along with business performance.
Safety & Society: Our utmost priority remains safety of our employees and partnerships. We have provided all sanitation essentials to our workforce on the field and
stepped up hygiene measures across all our offices. All our retail stores are maintaining social distancing norms, restricting number of customers inside the store at any time.
We reopened our offices across the country with voluntary attendance ensuring strict adherence to local regulations. We have also ensured comprehensive insurance coverage
for our employees, and extended financial support to our partners wherever critical for medical expenses. We tied up with various hospitals across India, appointed a national
health advisor, and empanelled a network of doctors to ensure immediate medical consultation, not only for our employees but for their families as well.
B. Digital Innovations & Customer Delight
Airtel is consistently working on strengthening its innovative core to anticipate and lead change in the global digital
landscape.
Wynk Music from Airtel launched an innovative campaign
#ExpresswithHellotune, to enable customers to share their current moods and feeling with friends and loved ones
through music, with a song of their choice. The campaign was aimed at giving a platform to millions of Airtel customers to use music to express how they feel to their friends and
family by playing them a song when they call.
Wynk, our music streaming app launched Navratri Nights, a
first-of-its kind online concert series to ring in the festive spirit with LIVE performances from some of the biggest artists in the industry. The concert series aimed at digitally
recreating the experience of a live concert through advanced digital technologies. Accessible on a host of mediums, it enabled music listeners to post messages, song requests
and interact with the artists in real time. Wynk Stage is also a boon for artists as they can overcome physical barriers to reach out to a much larger fan base with the help of Airtel’s
digital footprint.
Our B2B customers have been asking us how we can help
them in delivering brilliant experiences to consumers through digital channels. And towards this, we have launched Airtel
IQ – a cloud based omni-channel communications platform that enables voice, SMS, IVR and more through a unified channel. Be it a consumer ordering food online and tracking
her order by calling the delivery agent or someone arranging for a home sample collection by a pathology lab. The entire communication between the consumer and the brand gets
orchestrated over Airtel IQ in a timely, seamless and privacy safe fashion. Already, some of India’s biggest brands are running their consumer communication on Airtel IQ and
giving us very positive feedback.
We believe that with Airtel IQ, we are well positioned to
become a major player in the fast growing India cloud communications market that is already close to a billion dollars. Airtel IQ will be amongst the many digital services
we will bring to market as part of our strategy of building new revenues streams by leveraging the strength of our networks and digital assets.
To change entertainment forever, Airtel announced the launch of its new Airtel Xstream Bundle. The Airtel
Xstream Bundle combines the power of Airtel Xstream Fiber with speeds upto 1 Gbps, Unlimited Data, the first of its kind Airtel Xstream Android 4K TV Box and access to all OTT
content. The plan further includes Airtel Xstream Box worth Rs 3999 and offers complimentary access to premier video streaming apps. All Airtel Xstream Fiber plans will now offer
unlimited data to enable customers to binge on their favourite content.
Airtel announced the launch of Airtel Secure - a comprehensive suite of advanced cyber security solutions to
help businesses tide over potential cyber threats. As part of Airtel Secure, Airtel unveiled its state-of-the-art Security Intelligence Centre. Located in the National Capital Region,
the Airtel Security Intelligence Centre rates amongst the best in India with access to advanced technology and AI / ML tools to mitigate potential threats. Airtel also announced
strategic partnerships with Cisco and Radware to bring world leading security solutions to the businesses.
With the commissioning of the undersea optic fiber link
between Chennai and Andaman and Nicobar by the Hon'ble
Page 20 of 58
Prime Minister of India Sh. Narendra Modi, Airtel became the first mobile operator to launch 'Ultra-Fast 4G' services in
Andaman and Nicobar. Airtel has been serving customers in Andaman and Nicobar since 2005.
C. Strategic Alliances & Partnerships
Airtel announced a multi-year, Strategic Collaboration
Agreement (SCA) with Amazon Web Services (AWS) to deliver a comprehensive set of innovative cloud solutions to
large enterprise and small and medium enterprise (SME) customers in India. Under the agreement, Airtel Cloud, a multi-cloud product and solutions business, will build an
AWS Cloud Practice supported by AWS Professional Services, as well as develop differentiated Airtel Cloud products and capabilities leveraging AWS services, Airtel's
data center capabilities, and Airtel's network and telecoms offerings.
As part of its strategy to offer best-in-class entertainment to customers in India, Airtel announced a partnership with VOOT to bring more premium digital content on to its Airtel
Xstream platform. Under the partnership, Airtel Xstream users got access to premium VOOT content across multiple screens - on TV over the Airtel Xstream Box as part of the
Airtel Xstream Bundle, on smartphone with the Airtel Xstream app, and on PC at www.airtelxstream.in
Airtel partnered with the Government of Tamil Nadu to bring quality online learning classes to students in the state
through Airtel's digital platforms. Content from Kalvi TV - the State Government operated education channel - was made available for FREE on Airtel Digital TV as well as Airtel
Xstream app for smartphones and tablets.
Airtel renewed its agreement with Ericsson to provide pan-
India managed network operations through Ericsson Operations Engine. The three-year deal will see Airtel
launching Ericsson Operation Engine during 2020. Ericsson will deploy the latest automation, machine learning and artificial intelligence (AI) technologies to enhance Airtel’s
mobile network performance and customer experience. Ericsson will also manage Airtel’s network operations center and field maintenance activities across India.
D. Mergers, Acquisitions and Divestments
As part of its strategy to scale up its cloud offerings, Airtel
announced a strategic stake in tech startup Waybeo under the Airtel Startup Accelerator Program. Under this program,
Waybeo's solutions will get larger distribution reach while giving Airtel access to Waybeo's proven as well as emerging technologies.
On April 25, 2018, Bharti Infratel Limited (‘Infratel’), a
subsidiary of the Company, and Indus Towers Limited (‘Indus’), a joint venture of the Infratel and their respective shareholders and creditors entered into a proposed scheme
of amalgamation and arrangement (under Sections 230 to 232 and other applicable provisions of the Companies Act, 2013) (‘Scheme’) to create a pan-India tower company
operating across all 22 telecom service areas. The combined company, which will fully own the respective businesses of Infratel and Indus (being presented as part of the Group’s
‘Tower Infrastructure Services’ operating segment), will change its name to Indus Towers Limited and will continue to be listed on the Indian Stock Exchanges. The Scheme
has received approval from Competition Commission of India and No Objection from the Securities Exchange Board
of India through BSE Limited and National Stock Exchange of India Limited. The Scheme has also received the second
motion approval from the Hon'ble Chandigarh Bench of the National Company Law Tribunal (NCLT) earlier. Further, approval of Department of Telecommunications for FDI has
also been received on February 21, 2020. On August 31, 2020, Infratel’s Board of Directors provided its
authorization to proceed with the Scheme and to comply with the procedural requirements for completion of merger including approaching NCLT to make the Scheme effective
subject to completion of certain procedural condition precedents. The certified copy of the NCLT order approving the Scheme has been allowed for filing with the Registrar of
Companies (‘ROC’) on October 22, 2020 and the Scheme shall become effective from the date when the same is filed with the ROC.
E. Rewards & Recognitions
AirtelThanks App was recognized as a most innovative mobile applications which is driven by technological and
advanced business model bringing unmatched benefits to consumers or enterprises in the mobile industry in the prestigious ET Telecom Awards 2020.
Airtel Business was recognized as Best Enterprise Service Provider for enabling enterprises to remain productive and
meet their business objectives effectively with a host of innovative products and services in the prestigious ET Telecom Awards 2020.
Airtel Xstream Fiber won the Best Broadband Service
Provider for its super reliability and advanced network coverage that delivered a great experience to customers in the prestigious ET Telecom Awards 2020.
Airtel has won four awards in each category of Video
Experience, Games Experience, Voice App Experience and Download Speed Experience in the Open Signal Report in September 2020, for the second time in a row.
F. Other Developments
On September 22, 2020, DoT accepted Airtel’s request for Spectrum harmonization in Jammu & Kashmir and has allotted contiguous spectrum of 10 MHz in 2100 MHz band.
Universal Service Obligation Fund (USOF) Projects:
On September 4, 2020, Airtel has signed a formal
agreement with DoT for the execution of the project for
the installation of 889 4G based mobile towers in identified 879 uncovered villages & 11 towers along National Highways in Meghalaya.
DoT has selected Airtel for the installation of 244 mobile
towers which would provide coverage to 275 uncovered
villages in the aspirational Districts of Bihar & Rajasthan.
5.2 Africa A. KEY COMPANY DEVELOPMENTS
In August 2020, Airtel Africa plc announced that its
subsidiary Airtel Networks Kenya Limited ("Airtel Kenya") and Telkom Kenya Limited ("Telkom") have decided to no longer pursue completion of the M&A transaction. The
Page 21 of 58
transaction was announced in February 2019 and was subject to the satisfaction of various conditions precedent,
including regulatory approvals. Despite Airtel Africa plc and Telkom’s respective endeavors to reach a successful closure, the transaction has gone through a very lengthy
process that has led the parties to reconsider their stance.
In August 2020, Airtel Africa announced a strategic
partnership with Standard Chartered Bank, a leading international banking group, to drive financial inclusion
across key markets in Africa by providing customers with increased access to mobile financial services. Standard Chartered and Airtel Africa work together to co-create new,
innovative products aimed at enhancing the accessibility of financial services and ultimately, better serve people across Africa. In line with this, Airtel Money's customers will be able
to make real-time online deposits and withdrawals from Standard Chartered bank accounts, receive international money transfers directly to their wallets, and access savings
products amongst other services.
In September 2020, Airtel Africa announced an expansion of
its partnership with Mastercard by launching a Pay-on-Demand payments platform and drive the digital economy across Africa. This Pay-on-Demand platform enables safe,
secure, and convenient consumer financing via Samsung devices with an embedded Knox security platform, through Airtel Africa’s network. The partnership facilitates usage-
based payments and builds creditworthiness.
These partnerships align with the Group’s strategy of
expanding the range and depth of Airtel Money offerings to drive customer growth and penetration.
5.3 Share of Associates/Joint Ventures A. Robi Axiata Limited
Robi Axiata Limited is a joint venture between Axiata Group Berhad, of Malaysia and Bharti Airtel Limited, of India wherein
Bharti Airtel holds 31.3% share. Bharti Airtel’s stake has increased to 31.3% from 25% earlier, w.e.f. June 9, 2020.
Key operational and financial performance:
*As per Axiata published financials
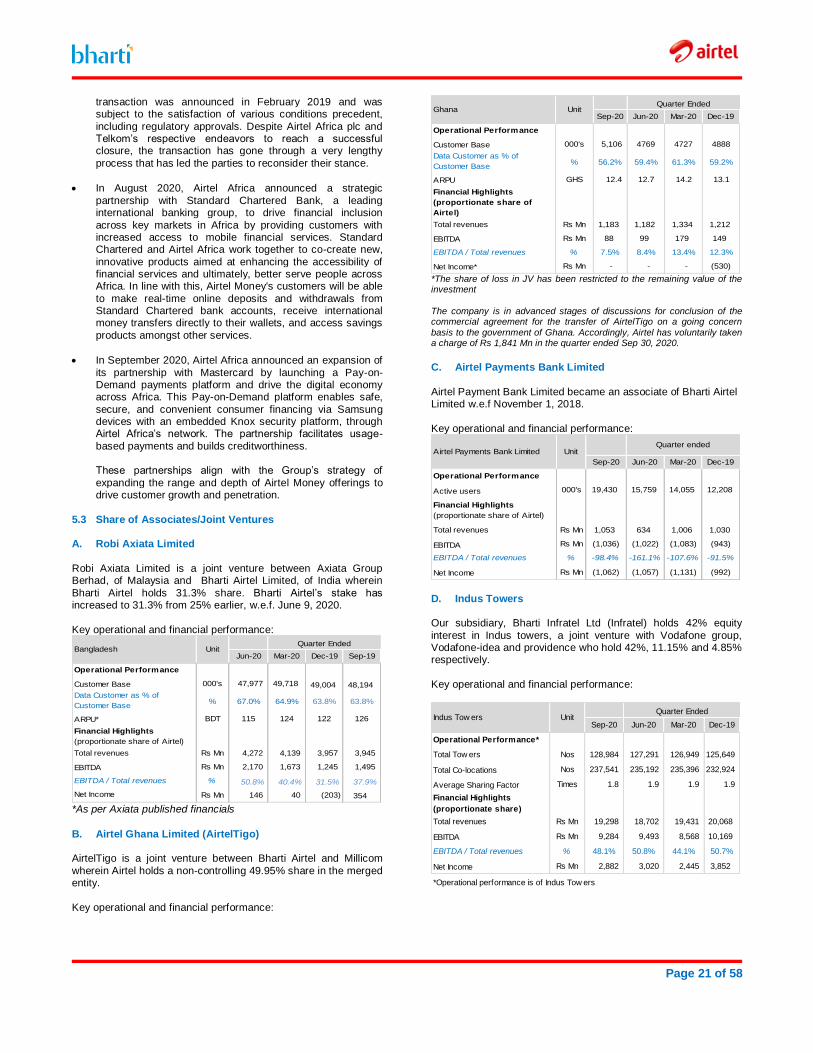
B. Airtel Ghana Limited (AirtelTigo) AirtelTigo is a joint venture between Bharti Airtel and Millicom
wherein Airtel holds a non-controlling 49.95% share in the merged entity.
Key operational and financial performance:
*The share of loss in JV has been restricted to the remaining value of the investment
The company is in advanced stages of discussions for conclusion of the commercial agreement for the transfer of AirtelTigo on a going concern
basis to the government of Ghana. Accordingly, Airtel has voluntarily taken a charge of Rs 1,841 Mn in the quarter ended Sep 30, 2020.
C. Airtel Payments Bank Limited
Airtel Payment Bank Limited became an associate of Bharti Airtel Limited w.e.f November 1, 2018.
Key operational and financial performance:
D. Indus Towers Our subsidiary, Bharti Infratel Ltd (Infratel) holds 42% equity
interest in Indus towers, a joint venture with Vodafone group, Vodafone-idea and providence who hold 42%, 11.15% and 4.85% respectively.
Key operational and financial performance:
Jun-20 Mar-20 Dec-19 Sep-19
Operational Performance
Customer Base 000's 47,977 49,718 49,004 48,194
Data Customer as % of
Customer Base% 67.0% 64.9% 63.8% 63.8%
ARPU* BDT 115 124 122 126
Financial Highlights
(proportionate share of Airtel)
Total revenues Rs Mn 4,272 4,139 3,957 3,945
EBITDA Rs Mn 2,170 1,673 1,245 1,495
EBITDA / Total revenues % 50.8% 40.4% 31.5% 37.9%
Net Income Rs Mn 146 40 (203) 354
Quarter EndedBangladesh Unit
Sep-20 Jun-20 Mar-20 Dec-19
Operational Performance
Customer Base 000's 5,106 4769 4727 4888
Data Customer as % of
Customer Base% 56.2% 59.4% 61.3% 59.2%
ARPU GHS 12.4 12.7 14.2 13.1
Financial Highlights
(proportionate share of
Airtel)
Total revenues Rs Mn 1,183 1,182 1,334 1,212
EBITDA Rs Mn 88 99 179 149
EBITDA / Total revenues % 7.5% 8.4% 13.4% 12.3%
Net Income* Rs Mn - - - (530)
Ghana UnitQuarter Ended
Sep-20 Jun-20 Mar-20 Dec-19
Operational Performance
Active users 000's 19,430 15,759 14,055 12,208
Financial Highlights
(proportionate share of Airtel)
Total revenues Rs Mn 1,053 634 1,006 1,030
EBITDA Rs Mn (1,036) (1,022) (1,083) (943)
EBITDA / Total revenues % -98.4% -161.1% -107.6% -91.5%
Net Income Rs Mn (1,062) (1,057) (1,131) (992)
Airtel Payments Bank Limited UnitQuarter ended
Sep-20 Jun-20 Mar-20 Dec-19
Operational Performance*
Total Tow ers Nos 128,984 127,291 126,949 125,649
Total Co-locations Nos 237,541 235,192 235,396 232,924
Average Sharing Factor Times 1.8 1.9 1.9 1.9
Financial Highlights
(proportionate share)
Total revenues Rs Mn 19,298 18,702 19,431 20,068
EBITDA Rs Mn 9,284 9,493 8,568 10,169
EBITDA / Total revenues % 48.1% 50.8% 44.1% 50.7%
Net Income Rs Mn 2,882 3,020 2,445 3,852
*Operational performance is of Indus Tow ers
Indus Tow ers UnitQuarter Ended
Page 22 of 58
5.4 Results of Operations
The financial results presented in this section are compiled based on the audited consolidated financial statements prepared in accordance with Indian Accounting Standards (Ind-AS) and the underlying information.
Key Highlights – For the quarter ended September 30, 2020
Overall customer base at ~440 Mn across 16 countries (up 6.9% YoY)
Consolidated mobile data traffic at 7,949 Bn MBs (up 58.8% YoY)
Total revenues of Rs 257.8 Bn; up 22.0% YoY, highest ever
EBITDA at Rs 118.5 Bn; up 32.6% YoY; EBITDA margin up 3.7% YoY
EBIT at Rs 44.1 Bn; up 121.4% YoY; EBIT margin up 7.7% YoY
Consolidated net loss (before EI) of Rs 7.4 Bn vis-à-vis loss of Rs 11.2 Bn in the corresponding quarter last year
Consolidated net loss (after EI) of Rs 7.6 Bn (Net loss of Rs 159.3 Bn in Q1’21) vis-à-vis a loss of Rs 230.4 Bn in the corresponding quarter last year
Results for the quarter ended September 30, 2020
5.4.1 Bharti Airtel Consolidated
The outbreak of COVID-19 towards the end of FY 2019-20 caused widespread economic hardship for consumers, businesses and communities across the globe. As a connectivity provider, the
company has been playing a vital role in keeping the nations and the customers connected as the need for communication increases with continued travel restrictions.
As on September 30, 2020, the Company had ~440 Mn customers, an increase of 6.9% as compared to 411 Mn in the corresponding
quarter last year. Total minutes of usage on the network during the quarter were 952 Bn, representing a growth of 20.5% as compared to 790 Bn in the corresponding quarter last year. Mobile Data traffic
grew 58.8% to 7,949 Bn MBs during the quarter as compared to 5,005 Bn MBs in the corresponding quarter last year.
Consolidated revenues for the quarter stood at Rs 257,850 Mn, up 22.0% (up 22.3% on a comparable basis) compared to Rs 211,313 Mn in the corresponding quarter last year.
India revenues for the quarter stood at Rs 187,470 Mn, up 22.0% (up 22.4% on a comparable basis) compared to Rs 153,610 Mn in
the corresponding quarter last year. Consolidated net revenues, after netting off access costs, license
fees and cost of goods sold, stood at Rs 202,490 Mn, up 22.9% (up 23.3% on comparable basis) as compared to Rs 164,741 Mn in the corresponding quarter last year.
Consolidated opex (excluding access costs, costs of goods sold and license fees) increased by 12.0% YoY (up 4.0% QoQ) to Rs
85,150 Mn for the quarter ending September 30, 2020 primarily due to continued investment in network.
Consolidated EBITDA was at Rs 118,483 Mn during the quarter,
compared to Rs 89,363 Mn in the corresponding quarter last year (up 32.6% YoY) and Rs 106,392 Mn in the previous quarter (up 11.4% QoQ). EBITDA margin for the quarter was at 46.0% as
compared to 42.3% in the corresponding quarter last year and 44.4% in the previous quarter. India EBITDA margin for the quarter was at 45.8% as compared to 41.2% in the corresponding quarter
last year and 44.3% in the previous quarter. Depreciation and amortization expenses were at Rs 74,210 Mn vis-
à-vis Rs 69,350 Mn in the corresponding quarter last year (up 7.0% YoY) and Rs 72,269 Mn in the previous quarter (up 2.7% QoQ).
EBIT for the quarter was at Rs 44,117 Mn as compared to Rs 19,930 Mn in the corresponding quarter last year and the resultant EBIT margin was at 17.1% as compared to 9.4% in the
corresponding quarter last year.
Cash profits from operations (before derivative and exchange
fluctuations) for the quarter were at Rs 80,480 Mn as compared to Rs 60,980 Mn in the corresponding quarter last year and Rs 75,622 Mn in the previous quarter.
Net finance costs for the quarter were at Rs 37,259 Mn as
compared to Rs 29,083 Mn (up 28.1% YoY) in the corresponding
quarter last year and Rs 30,498 Mn in the previous quarter (up
22.2% QoQ) largely led by increase in finance charges (mainly on
account of recognition of additional regulatory liabilities) and
decrease in investment income.
The resultant profit before tax and exceptional items for the quarter ended September 30, 2020 was Rs 5,671 Mn as compared to loss of Rs 6,231 Mn in the corresponding quarter last year and a profit of
Rs 3,720 Mn in the previous quarter.
The consolidated income tax expense for the period of six months ended September 30, 2020 was Rs 7,473 Mn as compared to
(negative) Rs 7,704 Mn in the corresponding period of last year.
Net loss before exceptional items for the quarter ended September 30, 2020 was Rs 7,444 Mn as compared to loss of Rs 11,228 Mn in
the corresponding quarter last year and loss of Rs 4,363 in the previous quarter. After accounting for charge of Rs 188 Mn towards exceptional items (net of tax and non-controlling interests) (details
provided below in 5.4.2), the resultant net loss for the quarter ended September 30, 2020 came in at Rs 7,632 Mn, compared to a loss of Rs 230,449 Mn in the corresponding quarter last year and net loss
of Rs 159,331 Mn in the previous quarter.
The capital expenditure for the quarter was Rs 67,907 Mn as compared to Rs 37,901 Mn in the corresponding quarter last year
and Rs 39,753 Mn in the previous quarter.
Consolidated net debt excluding lease obligations for the company stands at Rs 1,074,034 Mn as on September 30, 2020 compared to
Rs 881,258 Mn as on September 30, 2019. This included an AGR related liability recognized on the balance sheet of Rs 234,427 Mn. Consolidated net debt for the company including the impact of
leases stands at Rs 1,378,417 Mn as on September 30, 2020. The Net Debt-EBITDA ratio (annualized) and including the impact of leases for the quarter September 30, 2020 was at 2.91 times as
compared to 3.30 times in the corresponding quarter last year and 2.74 times in the previous quarter. Excluding pending AGR dues, the Net Debt-EBITDA ratio (annualized) is at 2.41 times as on
September 30, 2020.
5.4.2 Exceptional Items
The exceptional charge of Rs 493 Mn during the quarter ended
September 30, 2020 comprises of cost relating to employee restructuring in one of the group’s subsidiaries. Tax benefit due to
Results and ratios of periods commencing April 1, 2019 are basis Ind AS 116.
The term ‘Comparable’ refers to impact of accounting policy change deferring activation, installation & rental revenue over the life of the customer under DTH business in FY’20.
Page 23 of 58
the deferred tax asset pertaining to one of the subsidiary recognized in this quarter of Rs 212 Mn is included under tax
expense/ (credit). As a result, the overall net exceptional charge (after tax) is Rs 281 Mn. The net share allocated to non-controlling interests on the above exceptional items is Rs 93 Mn.
5.4.3 B2C Services – India
5.4.3.1 Mobile Services
The company had 293.7 Mn customers as on September 30 2020, compared to 279.4 Mn in the corresponding quarter last year, an
increase of 5.1% YoY. The company added 13.9 Mn customers during the quarter. With a decreased customer churn of 1.7% compared to 2.1% in corresponding quarter last year, the Company
had Voice traffic on the network grew 20.1% YoY to 861 Bn Minutes during the quarter as compared to 717 Bn Minutes in the corresponding quarter last year.
4G data customer base stood at 152.7 Mn, increasing by 50 Mn YoY. The quarter continue to witness data traffic growth of 58.2%
YoY. Total data traffic on the network stood at 7,640 Bn MBs as compared to 4,829 Bn MBs in the corresponding quarter last year. Average mobile data usage per customer increased by 25.1% YoY
to 16.0 GBs as compared to 12.8 GBs in the corresponding quarter last year.
By the end of the quarter, the company had 201,192 network towers as compared to 185,582 network towers in the corresponding quarter last year. Out of the total number of towers,
199,464 are mobile broadband towers. The Company had total 537,206 mobile broadband base stations as compared to 461,891 mobile broadband base stations at the end of the corresponding
quarter last year and 506,957 at the end of the previous quarter. Revenue from mobile services increased by 26.0% to Rs 138,319
Mn as compared to Rs 109,814 Mn in the corresponding quarter last year. Overall ARPU for the quarter was Rs 162 as compared to Rs 128 in the corresponding quarter last year.
EBITDA for the quarter was Rs 58,919 Mn as compared to Rs 39,913 Mn in the corresponding quarter last year and Rs 52,227 Mn in the previous quarter. EBITDA margin was 42.6% during the
quarter as compared to 36.3% in the corresponding quarter last year and 40.6% in the previous quarter.
EBIT during the quarter was at Rs 6,799 Mn as compared to (negative) Rs 11,449 Mn in the corresponding quarter last year and Rs 1,650 Mn in the previous quarter. The resultant EBIT margin
was at 4.9% as compared to negative 10.4% in corresponding quarter last year and 1.3% in the previous quarter.
During the quarter, the Company has incurred a capex of Rs 41,736 Mn. After slowdown in site deployment due to COVID in Q1, we accelerated roll-outs in Q2 and added 5K+ sites to cross the
200,000 site count mark. We continue to remain focused on optimally augmenting our coverage and capacities to offer a differentiated network experience.
5.4.3.2 Homes Services
As on September 30, 2020, the Company had Homes operations in 145 cities (including LCOs). The segment witnessed a revenue
growth of 7.3% YoY, highest in the last 15 quarters. We added a strong customer base of ~129K during the quarter from 2.45 Mn in Q1’21 to 2.58 Mn in Q2’21, highest in the last 22 quarters. On a
YoY basis, the customer base increased by 9.7%. For the quarter ended September 30, 2020, revenues from Homes
operations were Rs 5,873 Mn as compared to Rs 5,475 Mn in the corresponding quarter last year and Rs 5,786 in the previous
quarter. The company accelerated LCO partnerships in non-wired cities, taking up the LCO partnership model live in 48 cities.
EBITDA for the quarter stood at Rs 3,424 Mn as compared to Rs 2,471 Mn in the corresponding quarter last year and Rs 3,514 Mn in the previous quarter. EBITDA margin stood at 58.3% during the
quarter as against 45.1% in the corresponding quarter last year and 60.7% in the previous quarter. EBIT for the quarter ended September 30, 2020 was Rs 1,418 Mn as compared to Rs 1,233
Mn in the corresponding quarter last year and Rs 1,584 Mn in the previous quarter. The resultant EBIT margin was at 24.1% as compared to 22.5% in corresponding quarter last year and 27.4% in
the previous quarter. During the quarter ended September 30, 2020, the company
incurred capital expenditure of Rs 3,087 Mn. The company focused on fast-track the network expansion by rolling out Fiber Home Passes and upgrading existing copper network.
5.4.3.3 Digital TV Services
As on September 30, 2020, the Company had its Digital TV operations in 639 districts. The company added a strong customer base of 549K during the quarter from 16.8 Mn in Q1’21 to 17.4 Mn
in Q2’21, a growth of 7.3% YoY from 16.2 Mn in the corresponding quarter last year. ARPU for the quarter was at Rs 148 as compared to Rs 152 (comparable) in the corresponding quarter last year.
Revenue from Digital TV services on a comparable basis was at Rs 7,548 Mn vis-à-vis Rs 7,407 Mn (comparable) in the corresponding
quarter last year. Reported EBITDA for this segment was at Rs 5,351 Mn as compared to Rs 5,607 Mn in the corresponding quarter last year and Rs 5,041 Mn in the previous quarter. The reported
EBITDA margin was at 70.9% in the current quarter as compared to 71.0% in the corresponding quarter last year and 67.7% in the previous quarter. Reported EBIT for the quarter was Rs 2,945 Mn
as compared to Rs 3,243 Mn in the corresponding quarter last year and Rs 2,512 Mn in the previous quarter. The resultant EBIT margin was at 39.0% as compared to 41.1% in the corresponding quarter
last year and 33.7% in the previous quarter. During the current quarter, the company incurred a capital
expenditure of Rs 3,469 Mn. 5.4.4 B2B Services – India: Airtel Business
Airtel Business segment revenues for the quarter was at Rs 35,821 Mn as compared to Rs 33,312 Mn in the corresponding quarter last
year, an increase of 7.5% YoY. EBITDA stood at Rs 13,377 Mn during the quarter as compared to Rs 9,396 Mn in the corresponding quarter last year, growth of
42.4% YoY. The EBITDA margin stood at 37.3% in the current quarter, as compared to 28.2% in the corresponding quarter last year and 36.3% in the previous quarter. EBIT for the current quarter
has increased by 25.0% to Rs 9,633 Mn as compared to Rs 7,706 Mn during the corresponding quarter last year and the resultant EBIT margin was at 26.9% during the quarter as compared to
23.1% in the corresponding quarter last year. The Company incurred a capital expenditure of Rs 5,538 Mn in
Airtel Business during the quarter. 5.4.5 Tower Infrastructure Services
The financials of this segment reflect standalone operations of Bharti Infratel Limited (Infratel), a subsidiary of the company, with
Results and ratios of periods commencing April 1, 2019 are basis Ind AS 116.
The term ‘Comparable’ refers to impact of accounting policy change deferring activation, installation & rental revenue over the life of the customer under DTH business in FY’20.
Page 24 of 58
the interest in Indus Tower Ltd (Indus) disclosed under share of profits from Joint Ventures/ Associates.
Revenues of Infratel for the quarter ended September 30, 2020 has increased by 5.9% to Rs 17,663 Mn as compared to Rs 16,674 Mn
in the corresponding quarter last year. EBITDA during the quarter was at Rs 9,293 Mn compared to Rs 9,268 Mn in the corresponding quarter last year, up 0.3% YoY, and Rs 8,742 Mn in the previous
quarter, up 6.3% QoQ. EBIT for the quarter was at Rs 6,247 Mn as compared to Rs 6,125 Mn in the corresponding quarter last year, up 2.0% YoY, and Rs 5,507 Mn in the previous quarter, up 13.4%
QoQ. As at the end of the quarter, Infratel had 43,110 towers with
average sharing factor of 1.78 times compared to 1.86 times in the corresponding quarter last year. Including proportionate share of Indus in which Infratel holds 42% of stake, on a consolidated basis,
Infratel had 97,283 towers with an average sharing factor of 1.82 times as compared to 1.86 times in the corresponding quarter last year.
Bharti Infratel incurred a capital expenditure of Rs 2,073 Mn during the quarter on a standalone basis. The share of profits of Indus
during the quarter came in at Rs 2,882 Mn as compared to Rs 4,866 Mn in the corresponding quarter last year and Rs 3,020 Mn in the previous quarter.
5.4.6 Africa
As on September 30, 2020, the Company had an aggregate
customer base of 116.4 Mn as compared to 103.9 Mn in the
corresponding quarter last year, an increase of 12.0% YoY.
Customer churn for the quarter has decreased to 5.3% as
compared to 5.7% in the previous quarter. Total minutes on network
during the quarter registered a growth of 32.2% to 80.4 Bn as
compared to 60.8 Bn in the corresponding quarter last year.
Data customers during the quarter increased by 8 Mn to 39.6 Mn as
compared to 32 Mn in the corresponding quarter last year. Data customers now represent 34.0% of the total customer base, as compared to 30.7% in the corresponding quarter last year. The total
MBs on the network grew at a healthy growth rate of 81.0% to 293.9 Bn MBs compared to 162.4 Bn MBs in the corresponding
quarter last year. Data usage per customer during the quarter was at 2,576 MBs as compared to 1,748 MBs in the corresponding
quarter last year, an increase of 47.3% YoY. The total customer base using the Airtel Money platform increased
by 29.6% to 20.1 Mn as compared to 15.5 Mn in the corresponding quarter last year. Total value of transactions on the Airtel money platform has witnessed a growth of 56.4% to $11,637 Mn in the
current quarter as compared to $7,442 Mn in the corresponding quarter last year. Airtel Money revenue is at $99.5 Mn as compared to $74.3 Mn in the corresponding quarter last year reflecting a
growth of 33.9%. The company had 24,246 network towers at end of the quarter as
compared to 21,936 network towers in the corresponding quarter last year. Out of the total number of towers, 22,250 are mobile broadband towers. The Company has total 63,705 mobile
broadband base stations as compared to 40,187 mobile broadband base stations at the end of the corresponding quarter last year.
Africa revenues at $963 Mn in constant currency grew by 19.6% as compared to $805 Mn in the corresponding quarter last year as a result of continued strong performance in Nigeria and East Africa
and Francophone. Opex for the quarter is at $343 Mn in constant currency as
compared to $290 Mn in the corresponding quarter last year and $312 Mn in the previous quarter. EBITDA in constant currency was at $436 Mn as compared to $353 Mn in the corresponding quarter
last year and $377 Mn in the previous quarter. EBITDA margin was at 45.3% for the quarter (up 2% YoY, up 1% QoQ). Depreciation and amortization charges in constant currency were at $166 Mn as
compared to $146 Mn in the corresponding quarter last year and $162 Mn in the previous quarter. EBIT in constant currency for the quarter was at $269 Mn as compared to $205 Mn in the
corresponding quarter last year and $211 Mn in the previous quarter.
The resultant profit before tax and exceptional items for the quarter was at $191 Mn as compared to $128 Mn in the corresponding quarter last year and $134 Mn in the previous quarter. Capital
expenditure during the quarter was $149 Mn for Africa operations.
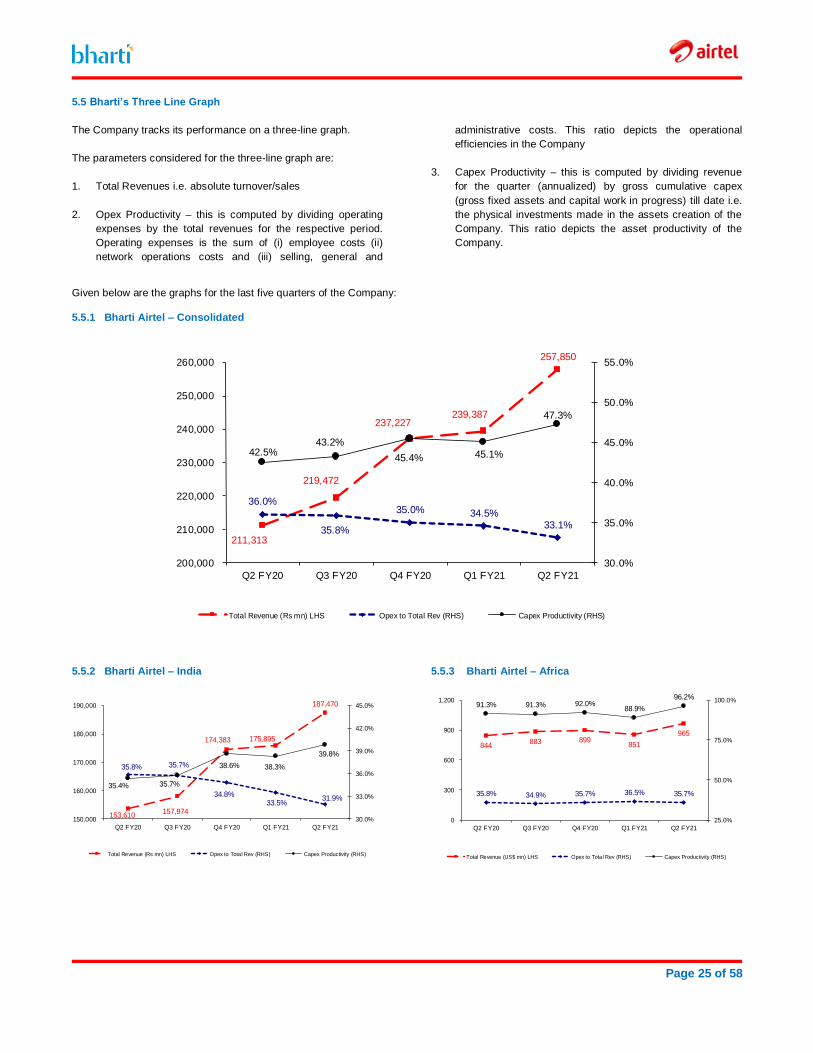
Page 25 of 58
5.5 Bharti’s Three Line Graph
The Company tracks its performance on a three-line graph.
The parameters considered for the three-line graph are:
1. Total Revenues i.e. absolute turnover/sales
2. Opex Productivity – this is computed by dividing operating
expenses by the total revenues for the respective period.
Operating expenses is the sum of (i) employee costs (ii)
network operations costs and (iii) selling, general and
administrative costs. This ratio depicts the operational
efficiencies in the Company
3. Capex Productivity – this is computed by dividing revenue
for the quarter (annualized) by gross cumulative capex
(gross fixed assets and capital work in progress) till date i.e.
the physical investments made in the assets creation of the
Company. This ratio depicts the asset productivity of the
Company.
Given below are the graphs for the last five quarters of the Company:
5.5.1 Bharti Airtel – Consolidated
211,313
219,472
237,227 239,387
257,850
36.0%
35.8%
35.0% 34.5%33.1%
42.5%43.2%
45.4% 45.1%
47.3%
30.0%
35.0%
40.0%
45.0%
50.0%
55.0%
200,000
210,000
220,000
230,000
240,000
250,000
260,000
Q2 FY20 Q3 FY20 Q4 FY20 Q1 FY21 Q2 FY21
Total Revenue (Rs mn) LHS Opex to Total Rev (RHS) Capex Productivity (RHS)
5.5.2 Bharti Airtel – India
153,610 157,974
174,383 175,895
187,470
35.8% 35.7%
34.8%33.5%
31.9%
35.4% 35.7%
38.6% 38.3%
39.8%
30.0%
33.0%
36.0%
39.0%
42.0%
45.0%
150,000
160,000
170,000
180,000
190,000
Q2 FY20 Q3 FY20 Q4 FY20 Q1 FY21 Q2 FY21
Total Revenue (Rs mn) LHS Opex to Total Rev (RHS) Capex Productivity (RHS)
5.5.3 Bharti Airtel – Africa
844 883 899
851
965
35.8% 34.9% 35.7% 36.5% 35.7%
91.3% 91.3% 92.0%88.9%
96.2%
25.0%
50.0%
75.0%
100.0%
0
300
600
900
1,200
Q2 FY20 Q3 FY20 Q4 FY20 Q1 FY21 Q2 FY21
Total Revenue (US$ mn) LHS Opex to Total Rev (RHS) Capex Productivity (RHS)
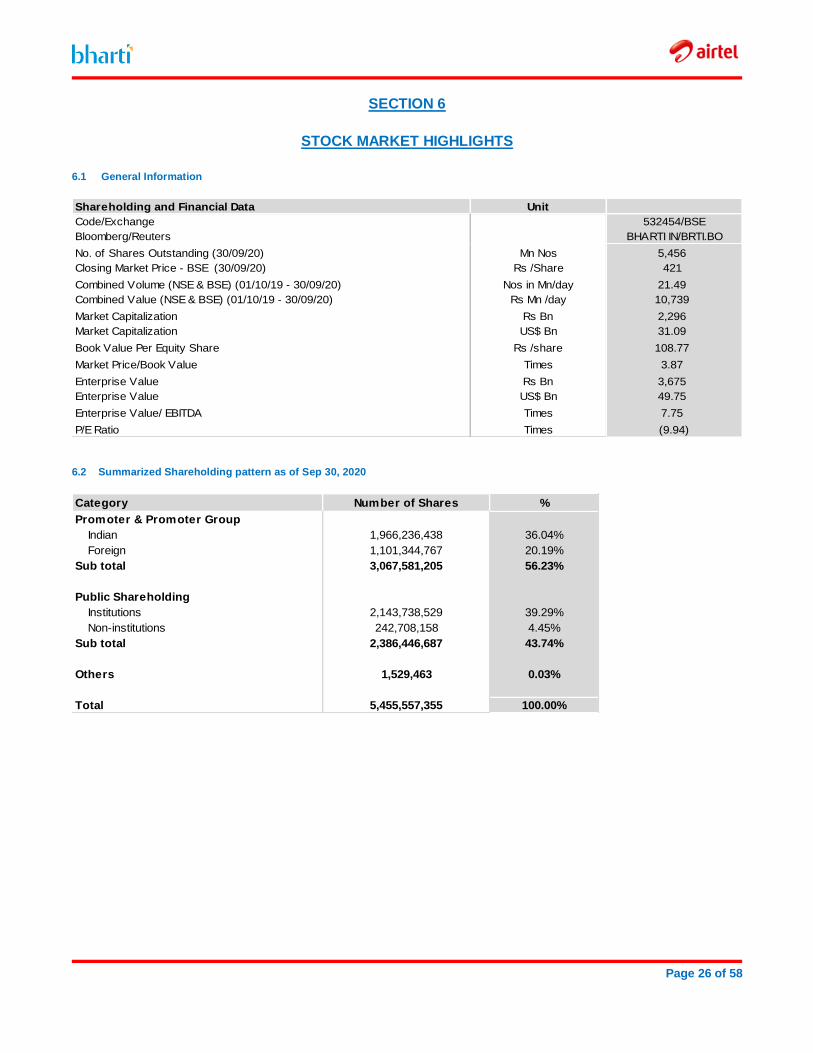
Page 26 of 58
SECTION 6
STOCK MARKET HIGHLIGHTS
6.1 General Information
Shareholding and Financial Data Unit
Code/Exchange 532454/BSE
Bloomberg/Reuters BHARTI IN/BRTI.BO
No. of Shares Outstanding (30/09/20) Mn Nos 5,456
Closing Market Price - BSE (30/09/20) Rs /Share 421
Combined Volume (NSE & BSE) (01/10/19 - 30/09/20) Nos in Mn/day 21.49
Combined Value (NSE & BSE) (01/10/19 - 30/09/20) Rs Mn /day 10,739
Market Capitalization Rs Bn 2,296
Market Capitalization US$ Bn 31.09
Book Value Per Equity Share Rs /share 108.77
Market Price/Book Value Times 3.87
Enterprise Value Rs Bn 3,675
Enterprise Value US$ Bn 49.75
Enterprise Value/ EBITDA Times 7.75
P/E Ratio Times (9.94)
6.2 Summarized Shareholding pattern as of Sep 30, 2020
Category Number of Shares %
Promoter & Promoter Group
Indian 1,966,236,438 36.04%
Foreign 1,101,344,767 20.19%
Sub total 3,067,581,205 56.23%
Public Shareholding
Institutions 2,143,738,529 39.29%
Non-institutions 242,708,158 4.45%
Sub total 2,386,446,687 43.74%
Others 1,529,463 0.03%
Total 5,455,557,355 100.00%
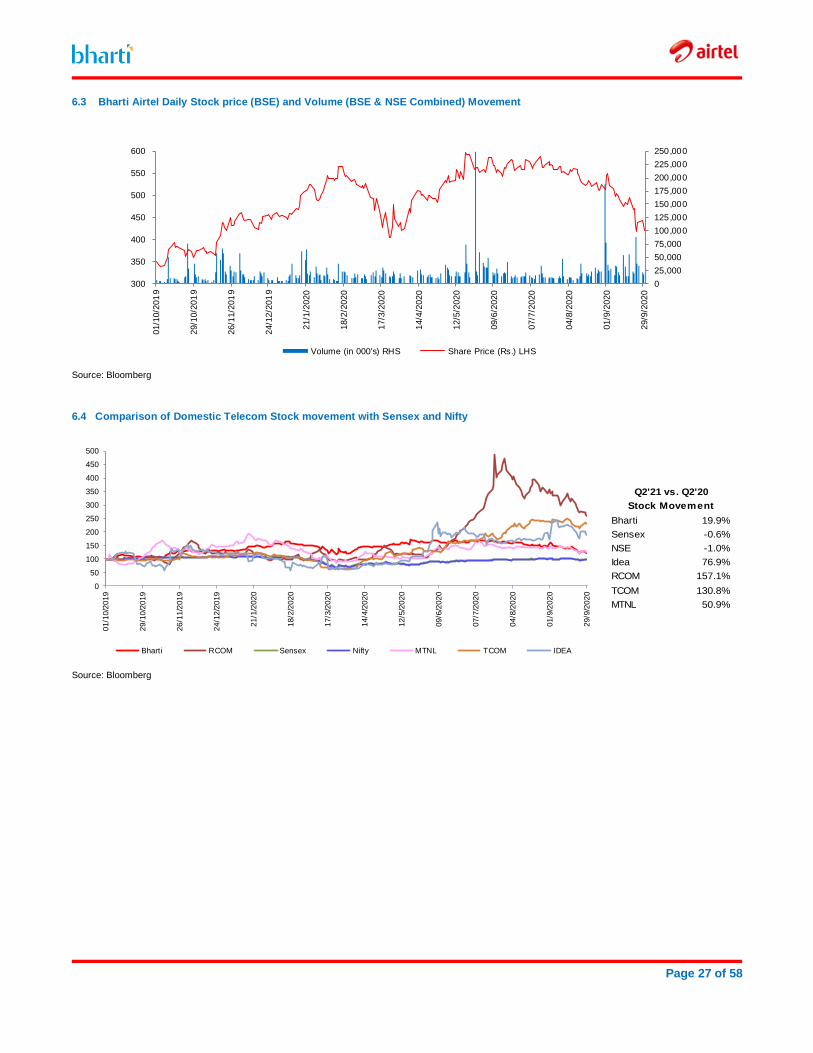
Page 27 of 58
6.3 Bharti Airtel Daily Stock price (BSE) and Volume (BSE & NSE Combined) Movement
0
25,000
50,000
75,000
100,000
125,000
150,000
175,000
200,000
225,000
250,000
300
350
400
450
500
550
6000
1/1
0/2
01
9
29/1
0/2
01
9
26/1
1/2
01
9
24/1
2/2
01
9
21
/1/2
02
0
18
/2/2
02
0
17
/3/2
02
0
14
/4/2
02
0
12
/5/2
02
0
09
/6/2
02
0
07
/7/2
02
0
04
/8/2
02
0
01
/9/2
02
0
29
/9/2
02
0
Volume (in 000's) RHS Share Price (Rs.) LHS
Source: Bloomberg
6.4 Comparison of Domestic Telecom Stock movement with Sensex and Nifty
0
50
100
150
200
250
300
350
400
450
500
01/1
0/2
019
29/1
0/2
019
26/1
1/2
019
24/1
2/2
019
21/1
/202
0
18/2
/202
0
17
/3/2
02
0
14/4
/202
0
12/5
/202
0
09
/6/2
02
0
07/7
/202
0
04/8
/202
0
01
/9/2
02
0
29/9
/202
0
Bharti RCOM Sensex Nifty MTNL TCOM IDEA
Bharti 19.9%
Sensex -0.6%
NSE -1.0%
Idea 76.9%
RCOM 157.1%
TCOM 130.8%
MTNL 50.9%
Q2'21 vs. Q2'20
Stock Movement
Source: Bloomberg
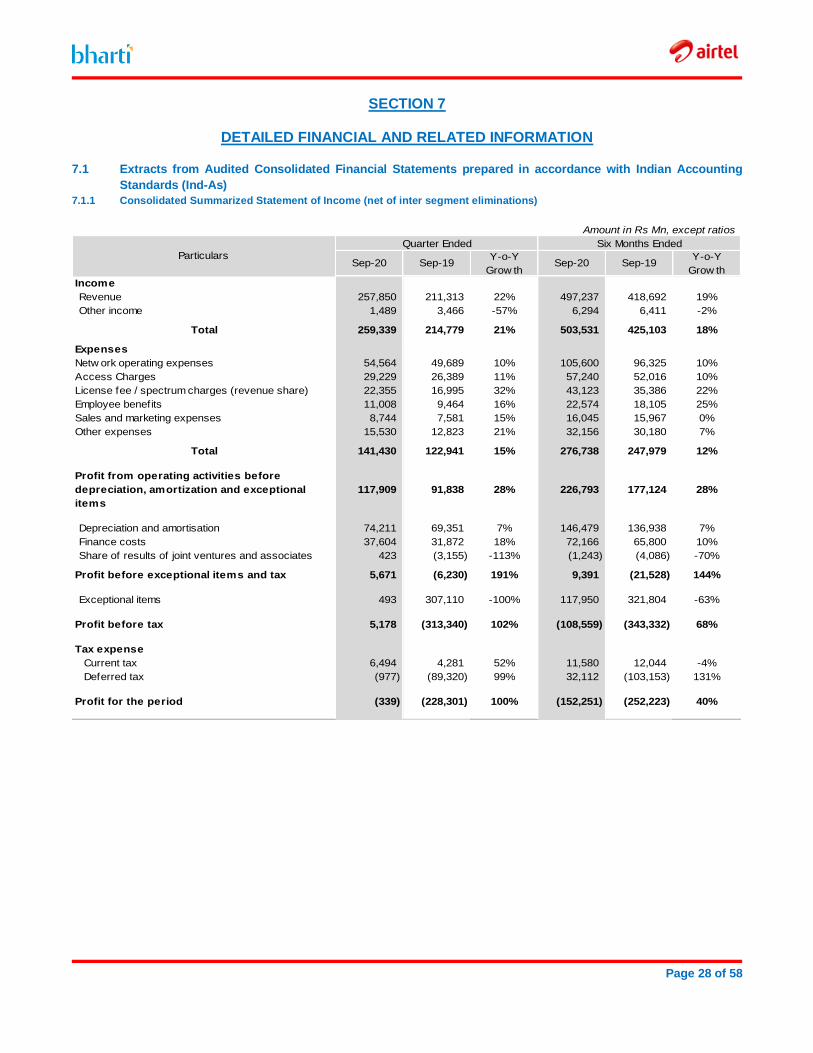
Page 28 of 58
SECTION 7
DETAILED FINANCIAL AND RELATED INFORMATION
7.1 Extracts from Audited Consolidated Financial Statements prepared in accordance with Indian Accounting
Standards (Ind-As)
7.1.1 Consolidated Summarized Statement of Income (net of inter segment eliminations)
Amount in Rs Mn, except ratios
Quarter Ended Six Months Ended
Sep-20 Sep-19Y-o-Y
Grow thSep-20 Sep-19
Y-o-Y
Grow th
Income
Revenue 257,850 211,313 22% 497,237 418,692 19%
Other income 1,489 3,466 -57% 6,294 6,411 -2%
Total 259,339 214,779 21% 503,531 425,103 18%
Expenses
Netw ork operating expenses 54,564 49,689 10% 105,600 96,325 10%
Access Charges 29,229 26,389 11% 57,240 52,016 10%
License fee / spectrum charges (revenue share) 22,355 16,995 32% 43,123 35,386 22%
Employee benefits 11,008 9,464 16% 22,574 18,105 25%
Sales and marketing expenses 8,744 7,581 15% 16,045 15,967 0%
Other expenses 15,530 12,823 21% 32,156 30,180 7%
Total 141,430 122,941 15% 276,738 247,979 12%
Profit from operating activities before
depreciation, amortization and exceptional
items
117,909 91,838 28% 226,793 177,124 28%
Depreciation and amortisation 74,211 69,351 7% 146,479 136,938 7%
Finance costs 37,604 31,872 18% 72,166 65,800 10%
Share of results of joint ventures and associates 423 (3,155) -113% (1,243) (4,086) -70%
Profit before exceptional items and tax 5,671 (6,230) 191% 9,391 (21,528) 144%
Exceptional items 493 307,110 -100% 117,950 321,804 -63%
Profit before tax 5,178 (313,340) 102% (108,559) (343,332) 68%
Tax expense
Current tax 6,494 4,281 52% 11,580 12,044 -4%
Deferred tax (977) (89,320) 99% 32,112 (103,153) 131%
Profit for the period (339) (228,301) 100% (152,251) (252,223) 40%
Particulars
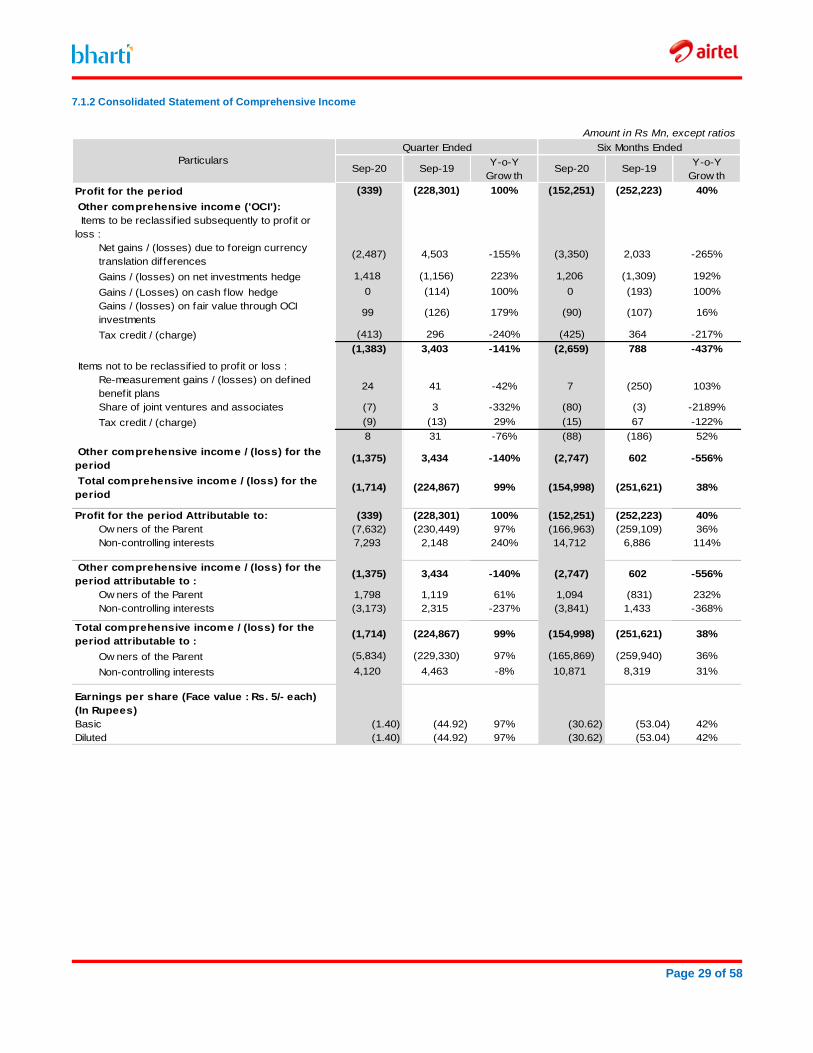
Page 29 of 58
7.1.2 Consolidated Statement of Comprehensive Income
Amount in Rs Mn, except ratios
Quarter Ended Six Months Ended
Sep-20 Sep-19Y-o-Y
Grow thSep-20 Sep-19
Y-o-Y
Grow th
Profit for the period (339) (228,301) 100% (152,251) (252,223) 40%
Other comprehensive income ('OCI'):
Items to be reclassif ied subsequently to profit or
loss :
Net gains / (losses) due to foreign currency
translation differences (2,487) 4,503 -155% (3,350) 2,033 -265%
Gains / (losses) on net investments hedge 1,418 (1,156) 223% 1,206 (1,309) 192%
Gains / (Losses) on cash flow hedge 0 (114) 100% 0 (193) 100%
Gains / (losses) on fair value through OCI
investments 99 (126) 179% (90) (107) 16%
Tax credit / (charge) (413) 296 -240% (425) 364 -217%
(1,383) 3,403 -141% (2,659) 788 -437%
Items not to be reclassif ied to profit or loss :
Re-measurement gains / (losses) on defined
benefit plans 24 41 -42% 7 (250) 103%
Share of joint ventures and associates (7) 3 -332% (80) (3) -2189%
Tax credit / (charge) (9) (13) 29% (15) 67 -122%
8 31 -76% (88) (186) 52%
Other comprehensive income / (loss) for the
period (1,375) 3,434 -140% (2,747) 602 -556%
Total comprehensive income / (loss) for the
period (1,714) (224,867) 99% (154,998) (251,621) 38%
Profit for the period Attributable to: (339) (228,301) 100% (152,251) (252,223) 40%
Ow ners of the Parent (7,632) (230,449) 97% (166,963) (259,109) 36%
Non-controlling interests 7,293 2,148 240% 14,712 6,886 114%
Other comprehensive income / (loss) for the
period attributable to :(1,375) 3,434 -140% (2,747) 602 -556%
Ow ners of the Parent 1,798 1,119 61% 1,094 (831) 232%
Non-controlling interests (3,173) 2,315 -237% (3,841) 1,433 -368%
Total comprehensive income / (loss) for the
period attributable to :(1,714) (224,867) 99% (154,998) (251,621) 38%
Ow ners of the Parent (5,834) (229,330) 97% (165,869) (259,940) 36%
Non-controlling interests 4,120 4,463 -8% 10,871 8,319 31%
Earnings per share (Face value : Rs. 5/- each)
(In Rupees)
Basic (1.40) (44.92) 97% (30.62) (53.04) 42%
Diluted (1.40) (44.92) 97% (30.62) (53.04) 42%
Particulars
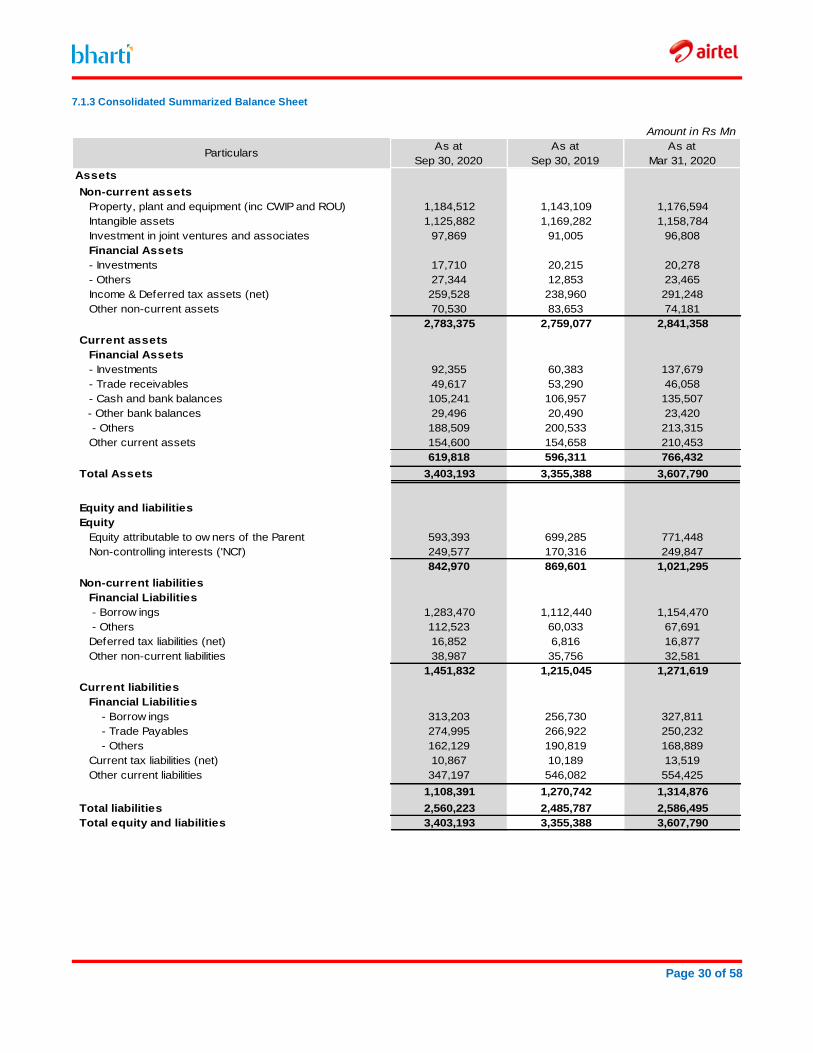
Page 30 of 58
7.1.3 Consolidated Summarized Balance Sheet
Amount in Rs Mn
As at As at As at
Sep 30, 2020 Sep 30, 2019 Mar 31, 2020
Assets
Non-current assets
Property, plant and equipment (inc CWIP and ROU) 1,184,512 1,143,109 1,176,594
Intangible assets 1,125,882 1,169,282 1,158,784
Investment in joint ventures and associates 97,869 91,005 96,808
Financial Assets
- Investments 17,710 20,215 20,278
- Others 27,344 12,853 23,465
Income & Deferred tax assets (net) 259,528 238,960 291,248
Other non-current assets 70,530 83,653 74,181
2,783,375 2,759,077 2,841,358
Current assets
Financial Assets
- Investments 92,355 60,383 137,679
- Trade receivables 49,617 53,290 46,058
- Cash and bank balances 105,241 106,957 135,507
- Other bank balances 29,496 20,490 23,420
- Others 188,509 200,533 213,315
Other current assets 154,600 154,658 210,453
619,818 596,311 766,432
Total Assets 3,403,193 3,355,388 3,607,790
Equity and liabilities
Equity
Equity attributable to ow ners of the Parent 593,393 699,285 771,448
Non-controlling interests ('NCI') 249,577 170,316 249,847
842,970 869,601 1,021,295
Non-current liabilities
Financial Liabilities
- Borrow ings 1,283,470 1,112,440 1,154,470
- Others 112,523 60,033 67,691
Deferred tax liabilities (net) 16,852 6,816 16,877
Other non-current liabilities 38,987 35,756 32,581
1,451,832 1,215,045 1,271,619
Current liabilities
Financial Liabilities
- Borrow ings 313,203 256,730 327,811
- Trade Payables 274,995 266,922 250,232
- Others 162,129 190,819 168,889
Current tax liabilities (net) 10,867 10,189 13,519
Other current liabilities 347,197 546,082 554,425
1,108,391 1,270,742 1,314,876
Total liabilities 2,560,223 2,485,787 2,586,495
Total equity and liabilities 3,403,193 3,355,388 3,607,790
Particulars
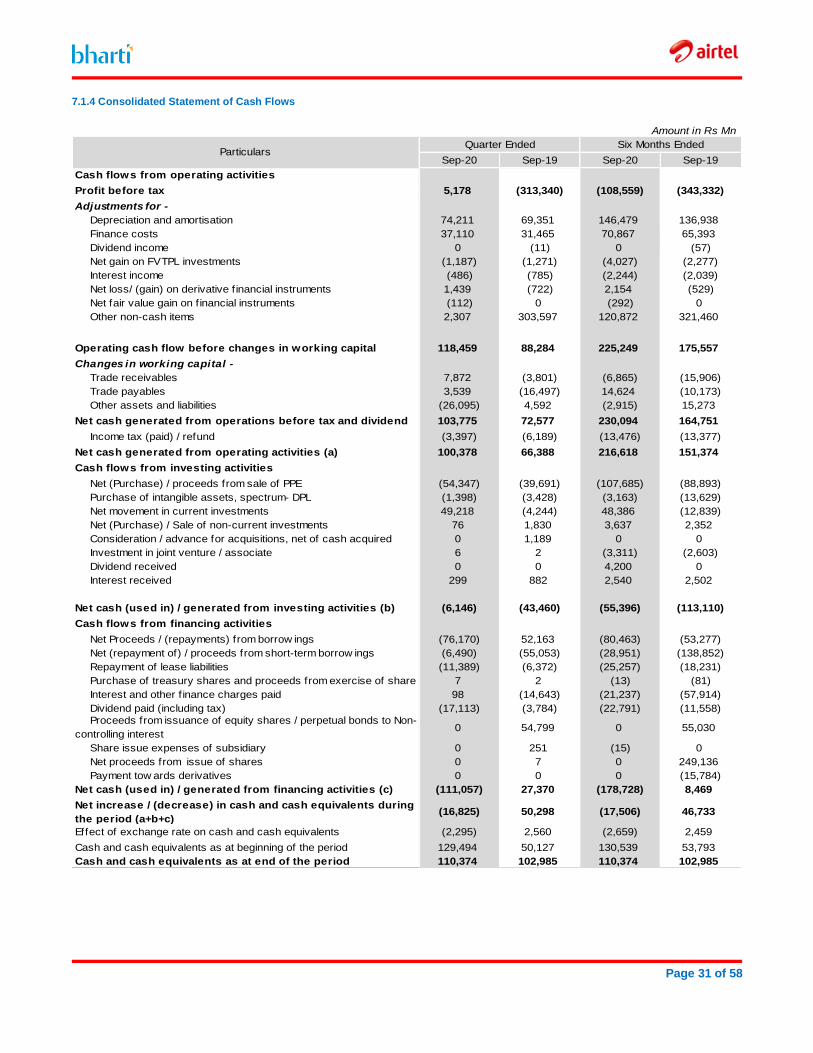
Page 31 of 58
7.1.4 Consolidated Statement of Cash Flows
Amount in Rs Mn
Quarter Ended Six Months Ended
Sep-20 Sep-19 Sep-20 Sep-19
Cash flows from operating activities
Profit before tax 5,178 (313,340) (108,559) (343,332)
Adjustments for -
Depreciation and amortisation 74,211 69,351 146,479 136,938
Finance costs 37,110 31,465 70,867 65,393
Dividend income 0 (11) 0 (57)
Net gain on FVTPL investments (1,187) (1,271) (4,027) (2,277)
Interest income (486) (785) (2,244) (2,039)
Net loss/ (gain) on derivative f inancial instruments 1,439 (722) 2,154 (529)
Net fair value gain on f inancial instruments (112) 0 (292) 0
Other non-cash items 2,307 303,597 120,872 321,460
Operating cash flow before changes in working capital 118,459 88,284 225,249 175,557
Changes in working capital -
Trade receivables 7,872 (3,801) (6,865) (15,906)
Trade payables 3,539 (16,497) 14,624 (10,173)
Other assets and liabilities (26,095) 4,592 (2,915) 15,273
Net cash generated from operations before tax and dividend 103,775 72,577 230,094 164,751
Income tax (paid) / refund (3,397) (6,189) (13,476) (13,377)
Net cash generated from operating activities (a) 100,378 66,388 216,618 151,374
Cash flows from investing activities
Net (Purchase) / proceeds from sale of PPE (54,347) (39,691) (107,685) (88,893)
Purchase of intangible assets, spectrum- DPL (1,398) (3,428) (3,163) (13,629)
Net movement in current investments 49,218 (4,244) 48,386 (12,839)
Net (Purchase) / Sale of non-current investments 76 1,830 3,637 2,352
Consideration / advance for acquisitions, net of cash acquired 0 1,189 0 0
Investment in joint venture / associate 6 2 (3,311) (2,603)
Dividend received 0 0 4,200 0
Interest received 299 882 2,540 2,502
Net cash (used in) / generated from investing activities (b) (6,146) (43,460) (55,396) (113,110)
Cash flows from financing activities
Net Proceeds / (repayments) from borrow ings (76,170) 52,163 (80,463) (53,277)
Net (repayment of) / proceeds from short-term borrow ings (6,490) (55,053) (28,951) (138,852)
Repayment of lease liabilities (11,389) (6,372) (25,257) (18,231)
Purchase of treasury shares and proceeds from exercise of share options7 2 (13) (81)
Interest and other f inance charges paid 98 (14,643) (21,237) (57,914)
Dividend paid (including tax) (17,113) (3,784) (22,791) (11,558)
Proceeds from issuance of equity shares / perpetual bonds to Non-
controlling interest0 54,799 0 55,030
Share issue expenses of subsidiary 0 251 (15) 0
Net proceeds from issue of shares 0 7 0 249,136
Payment tow ards derivatives 0 0 0 (15,784)
Net cash (used in) / generated from financing activities (c) (111,057) 27,370 (178,728) 8,469
Net increase / (decrease) in cash and cash equivalents during
the period (a+b+c)(16,825) 50,298 (17,506) 46,733
Effect of exchange rate on cash and cash equivalents (2,295) 2,560 (2,659) 2,459
Cash and cash equivalents as at beginning of the period 129,494 50,127 130,539 53,793
Cash and cash equivalents as at end of the period 110,374 102,985 110,374 102,985
Particulars
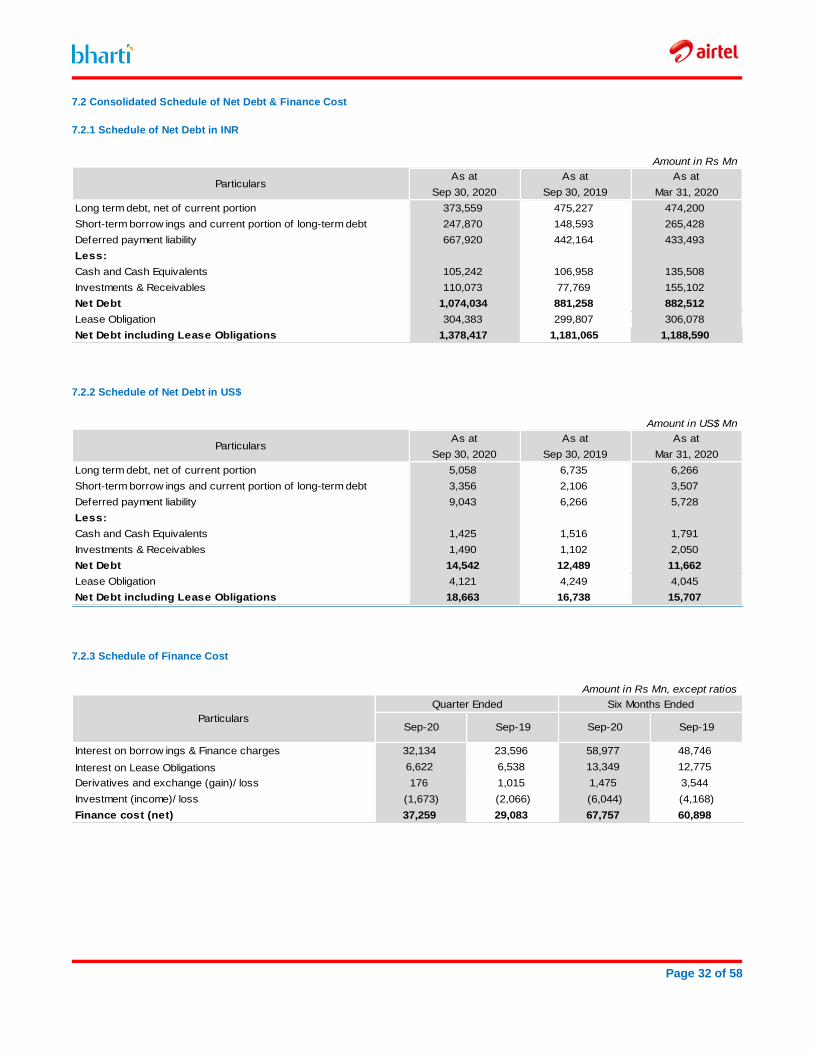
Page 32 of 58
7.2 Consolidated Schedule of Net Debt & Finance Cost
7.2.1 Schedule of Net Debt in INR
Amount in Rs Mn
As at As at As at
Sep 30, 2020 Sep 30, 2019 Mar 31, 2020
Long term debt, net of current portion 373,559 475,227 474,200
Short-term borrow ings and current portion of long-term debt 247,870 148,593 265,428
Deferred payment liability 667,920 442,164 433,493
Less:
Cash and Cash Equivalents 105,242 106,958 135,508
Investments & Receivables 110,073 77,769 155,102
Net Debt 1,074,034 881,258 882,512
Lease Obligation 304,383 299,807 306,078
Net Debt including Lease Obligations 1,378,417 1,181,065 1,188,590
Particulars
7.2.2 Schedule of Net Debt in US$
Amount in US$ Mn
As at As at As at
Sep 30, 2020 Sep 30, 2019 Mar 31, 2020
Long term debt, net of current portion 5,058 6,735 6,266
Short-term borrow ings and current portion of long-term debt 3,356 2,106 3,507
Deferred payment liability 9,043 6,266 5,728
Less:
Cash and Cash Equivalents 1,425 1,516 1,791
Investments & Receivables 1,490 1,102 2,050
Net Debt 14,542 12,489 11,662
Lease Obligation 4,121 4,249 4,045
Net Debt including Lease Obligations 18,663 16,738 15,707
Particulars
7.2.3 Schedule of Finance Cost
Amount in Rs Mn, except ratios
Quarter Ended Six Months Ended
Sep-20 Sep-19 Sep-20 Sep-19
Interest on borrow ings & Finance charges 32,134 23,596 58,977 48,746
Interest on Lease Obligations 6,622 6,538 13,349 12,775
Derivatives and exchange (gain)/ loss 176 1,015 1,475 3,544
Investment (income)/ loss (1,673) (2,066) (6,044) (4,168)
Finance cost (net) 37,259 29,083 67,757 60,898
Particulars
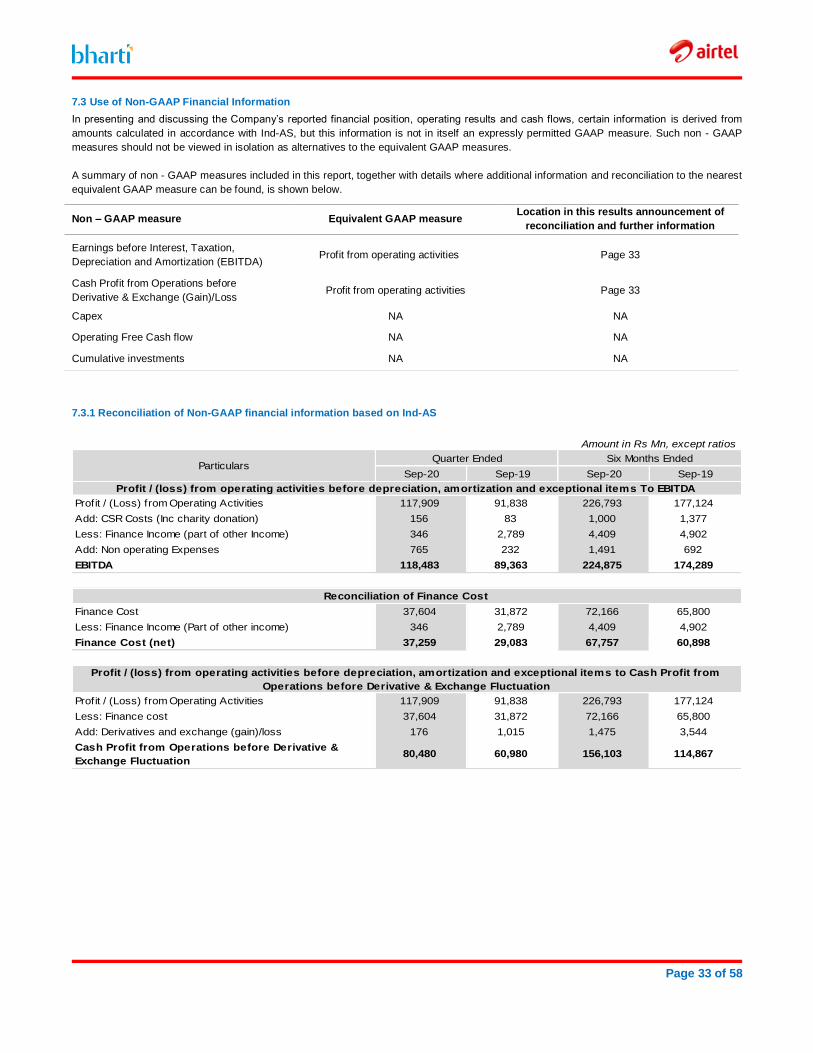
Page 33 of 58
7.3 Use of Non-GAAP Financial Information
In presenting and discussing the Company’s reported financial position, operating results and cash flows, certain information is derived from
amounts calculated in accordance with Ind-AS, but this information is not in itself an expressly permitted GAAP measure. Such non - GAAP
measures should not be viewed in isolation as alternatives to the equivalent GAAP measures.
A summary of non - GAAP measures included in this report, together with details where additional information and reconciliation to the nearest
equivalent GAAP measure can be found, is shown below.
Non – GAAP measure Equivalent GAAP measure Location in this results announcement of
reconciliation and further information
Earnings before Interest, Taxation,
Depreciation and Amortization (EBITDA) Profit from operating activities Page 33
Cash Profit from Operations before
Derivative & Exchange (Gain)/Loss Profit from operating activities Page 33
Capex NA NA
Operating Free Cash flow NA NA
Cumulative investments NA NA
7.3.1 Reconciliation of Non-GAAP financial information based on Ind-AS
Amount in Rs Mn, except ratios
Quarter Ended Six Months Ended
Sep-20 Sep-19 Sep-20 Sep-19
Profit / (loss) from operating activities before depreciation, amortization and exceptional items To EBITDA
Profit / (Loss) from Operating Activities 117,909 91,838 226,793 177,124
Add: CSR Costs (Inc charity donation) 156 83 1,000 1,377
Less: Finance Income (part of other Income) 346 2,789 4,409 4,902
Add: Non operating Expenses 765 232 1,491 692
EBITDA 118,483 89,363 224,875 174,289
Reconciliation of Finance Cost
Finance Cost 37,604 31,872 72,166 65,800
Less: Finance Income (Part of other income) 346 2,789 4,409 4,902
Finance Cost (net) 37,259 29,083 67,757 60,898
Profit / (loss) from operating activities before depreciation, amortization and exceptional items to Cash Profit from
Operations before Derivative & Exchange Fluctuation
Profit / (Loss) from Operating Activities 117,909 91,838 226,793 177,124
Less: Finance cost 37,604 31,872 72,166 65,800
Add: Derivatives and exchange (gain)/loss 176 1,015 1,475 3,544
Cash Profit from Operations before Derivative &
Exchange Fluctuation80,480 60,980 156,103 114,867
Particulars
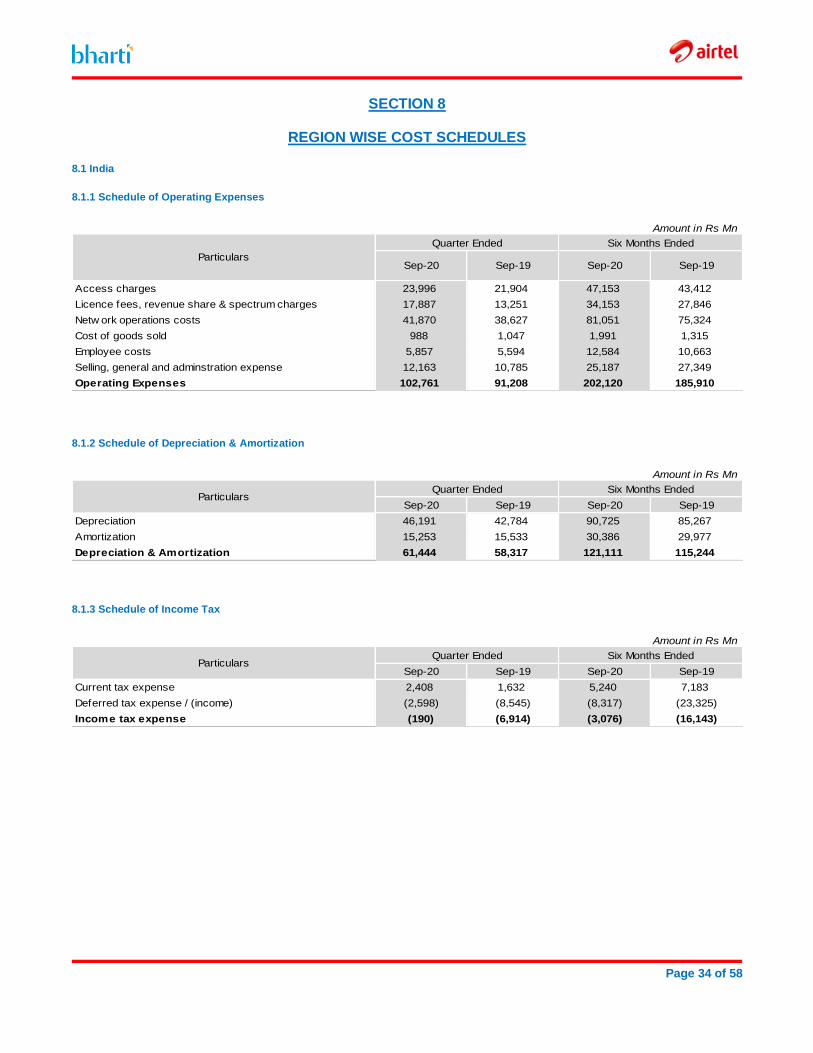
Page 34 of 58
SECTION 8
REGION WISE COST SCHEDULES
8.1 India
8.1.1 Schedule of Operating Expenses
Amount in Rs Mn
Quarter Ended Six Months Ended
Sep-20 Sep-19 Sep-20 Sep-19
Access charges 23,996 21,904 47,153 43,412
Licence fees, revenue share & spectrum charges 17,887 13,251 34,153 27,846
Netw ork operations costs 41,870 38,627 81,051 75,324
Cost of goods sold 988 1,047 1,991 1,315
Employee costs 5,857 5,594 12,584 10,663
Selling, general and adminstration expense 12,163 10,785 25,187 27,349
Operating Expenses 102,761 91,208 202,120 185,910
Particulars
8.1.2 Schedule of Depreciation & Amortization
Amount in Rs Mn
Quarter Ended Six Months Ended
Sep-20 Sep-19 Sep-20 Sep-19
Depreciation 46,191 42,784 90,725 85,267
Amortization 15,253 15,533 30,386 29,977
Depreciation & Amortization 61,444 58,317 121,111 115,244
Particulars
8.1.3 Schedule of Income Tax
Amount in Rs Mn
Quarter Ended Six Months Ended
Sep-20 Sep-19 Sep-20 Sep-19
Current tax expense 2,408 1,632 5,240 7,183
Deferred tax expense / (income) (2,598) (8,545) (8,317) (23,325)
Income tax expense (190) (6,914) (3,076) (16,143)
Particulars
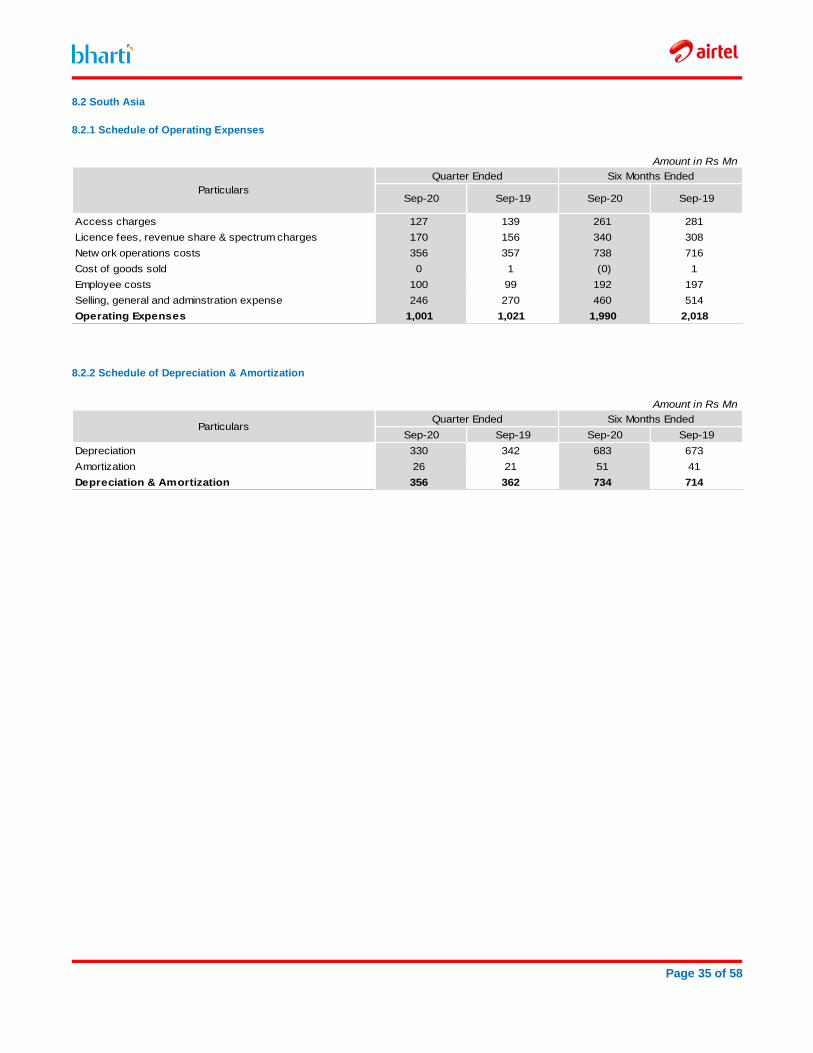
Page 35 of 58
8.2 South Asia
8.2.1 Schedule of Operating Expenses
Amount in Rs Mn
Quarter Ended Six Months Ended
Sep-20 Sep-19 Sep-20 Sep-19
Access charges 127 139 261 281
Licence fees, revenue share & spectrum charges 170 156 340 308
Netw ork operations costs 356 357 738 716
Cost of goods sold 0 1 (0) 1
Employee costs 100 99 192 197
Selling, general and adminstration expense 246 270 460 514
Operating Expenses 1,001 1,021 1,990 2,018
Particulars
8.2.2 Schedule of Depreciation & Amortization
Amount in Rs Mn
Quarter Ended Six Months Ended
Sep-20 Sep-19 Sep-20 Sep-19
Depreciation 330 342 683 673
Amortization 26 21 51 41
Depreciation & Amortization 356 362 734 714
Particulars
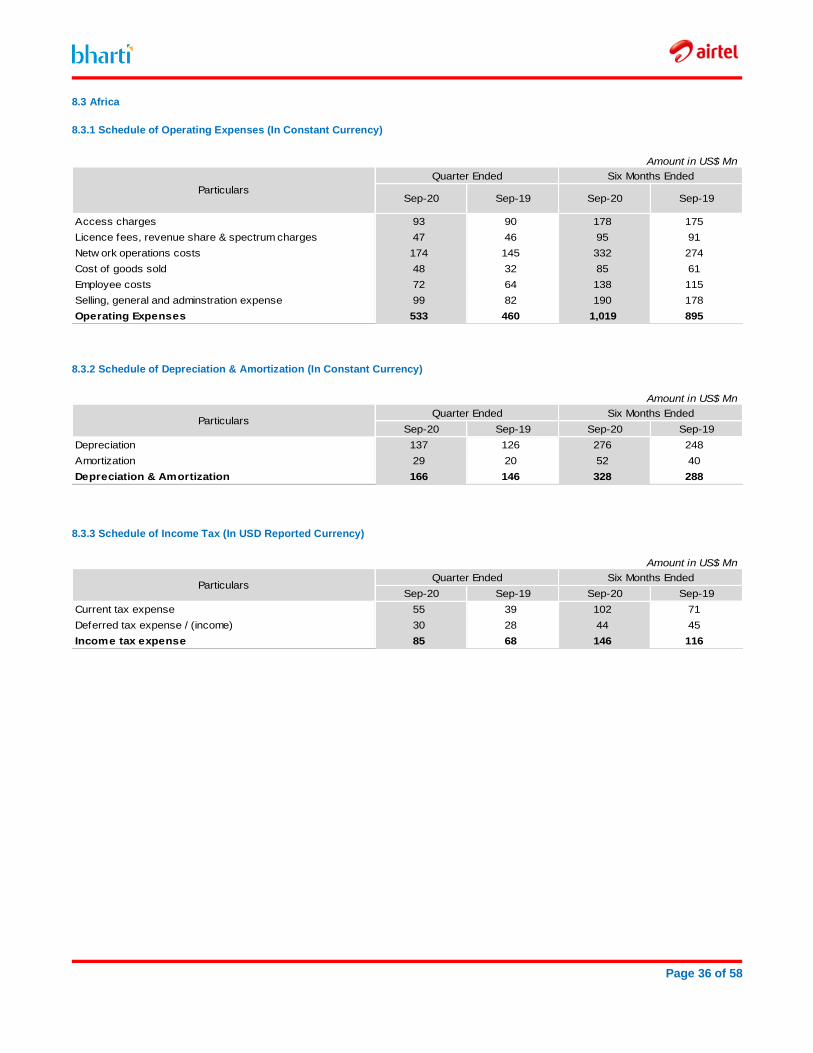
Page 36 of 58
8.3 Africa
8.3.1 Schedule of Operating Expenses (In Constant Currency)
Amount in US$ Mn
Quarter Ended Six Months Ended
Sep-20 Sep-19 Sep-20 Sep-19
Access charges 93 90 178 175
Licence fees, revenue share & spectrum charges 47 46 95 91
Netw ork operations costs 174 145 332 274
Cost of goods sold 48 32 85 61
Employee costs 72 64 138 115
Selling, general and adminstration expense 99 82 190 178
Operating Expenses 533 460 1,019 895
Particulars
8.3.2 Schedule of Depreciation & Amortization (In Constant Currency)
Amount in US$ Mn
Quarter Ended Six Months Ended
Sep-20 Sep-19 Sep-20 Sep-19
Depreciation 137 126 276 248
Amortization 29 20 52 40
Depreciation & Amortization 166 146 328 288
Particulars
8.3.3 Schedule of Income Tax (In USD Reported Currency)
Amount in US$ Mn
Quarter Ended Six Months Ended
Sep-20 Sep-19 Sep-20 Sep-19
Current tax expense 55 39 102 71
Deferred tax expense / (income) 30 28 44 45
Income tax expense 85 68 146 116
Particulars
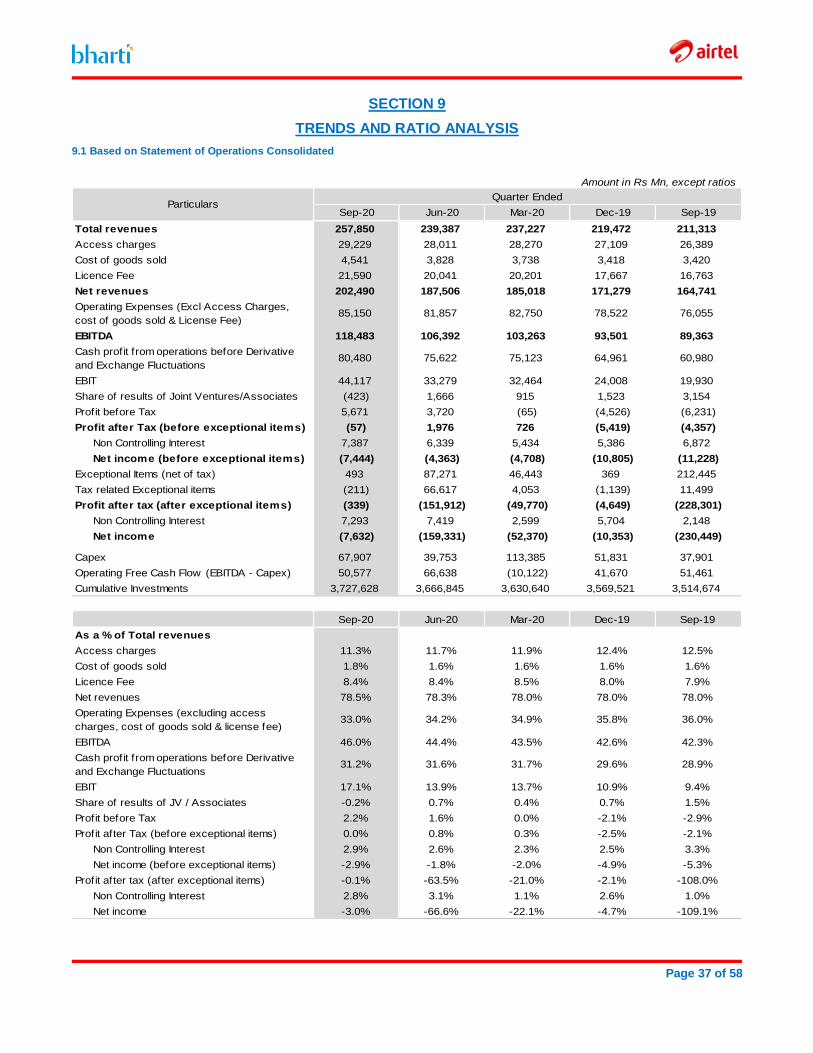
Page 37 of 58
SECTION 9
TRENDS AND RATIO ANALYSIS
9.1 Based on Statement of Operations Consolidated
Amount in Rs Mn, except ratios
Quarter Ended
Sep-20 Jun-20 Mar-20 Dec-19 Sep-19
Total revenues 257,850 239,387 237,227 219,472 211,313
Access charges 29,229 28,011 28,270 27,109 26,389
Cost of goods sold 4,541 3,828 3,738 3,418 3,420
Licence Fee 21,590 20,041 20,201 17,667 16,763
Net revenues 202,490 187,506 185,018 171,279 164,741
Operating Expenses (Excl Access Charges,
cost of goods sold & License Fee)85,150 81,857 82,750 78,522 76,055
EBITDA 118,483 106,392 103,263 93,501 89,363
Cash profit from operations before Derivative
and Exchange Fluctuations80,480 75,622 75,123 64,961 60,980
EBIT 44,117 33,279 32,464 24,008 19,930
Share of results of Joint Ventures/Associates (423) 1,666 915 1,523 3,154
Profit before Tax 5,671 3,720 (65) (4,526) (6,231)
Profit after Tax (before exceptional items) (57) 1,976 726 (5,419) (4,357)
Non Controlling Interest 7,387 6,339 5,434 5,386 6,872
Net income (before exceptional items) (7,444) (4,363) (4,708) (10,805) (11,228)
Exceptional Items (net of tax) 493 87,271 46,443 369 212,445
Tax related Exceptional items (211) 66,617 4,053 (1,139) 11,499
Profit after tax (after exceptional items) (339) (151,912) (49,770) (4,649) (228,301)
Non Controlling Interest 7,293 7,419 2,599 5,704 2,148
Net income (7,632) (159,331) (52,370) (10,353) (230,449)
Capex 67,907 39,753 113,385 51,831 37,901
Operating Free Cash Flow (EBITDA - Capex) 50,577 66,638 (10,122) 41,670 51,461
Cumulative Investments 3,727,628 3,666,845 3,630,640 3,569,521 3,514,674
Sep-20 Jun-20 Mar-20 Dec-19 Sep-19
As a % of Total revenues
Access charges 11.3% 11.7% 11.9% 12.4% 12.5%
Cost of goods sold 1.8% 1.6% 1.6% 1.6% 1.6%
Licence Fee 8.4% 8.4% 8.5% 8.0% 7.9%
Net revenues 78.5% 78.3% 78.0% 78.0% 78.0%
Operating Expenses (excluding access
charges, cost of goods sold & license fee)33.0% 34.2% 34.9% 35.8% 36.0%
EBITDA 46.0% 44.4% 43.5% 42.6% 42.3%
Cash profit from operations before Derivative
and Exchange Fluctuations31.2% 31.6% 31.7% 29.6% 28.9%
EBIT 17.1% 13.9% 13.7% 10.9% 9.4%
Share of results of JV / Associates -0.2% 0.7% 0.4% 0.7% 1.5%
Profit before Tax 2.2% 1.6% 0.0% -2.1% -2.9%
Profit after Tax (before exceptional items) 0.0% 0.8% 0.3% -2.5% -2.1%
Non Controlling Interest 2.9% 2.6% 2.3% 2.5% 3.3%
Net income (before exceptional items) -2.9% -1.8% -2.0% -4.9% -5.3%
Profit after tax (after exceptional items) -0.1% -63.5% -21.0% -2.1% -108.0%
Non Controlling Interest 2.8% 3.1% 1.1% 2.6% 1.0%
Net income -3.0% -66.6% -22.1% -4.7% -109.1%
Particulars
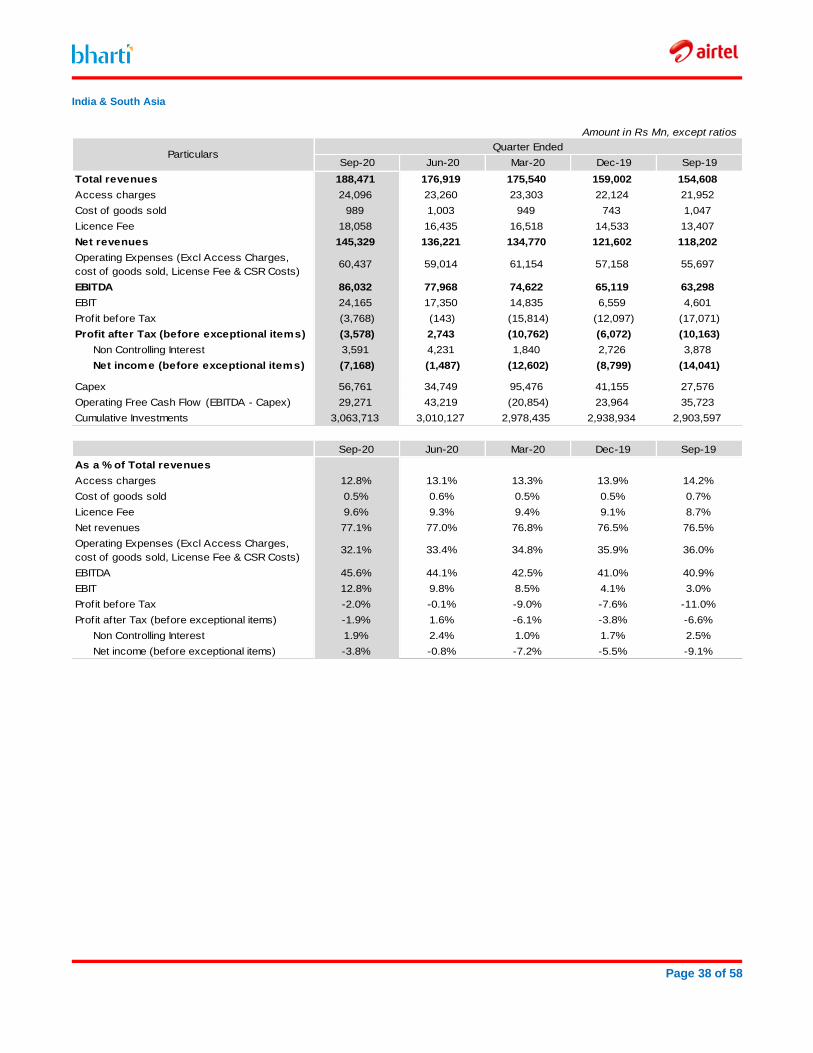
Page 38 of 58
India & South Asia
Amount in Rs Mn, except ratios
Quarter Ended
Sep-20 Jun-20 Mar-20 Dec-19 Sep-19
Total revenues 188,471 176,919 175,540 159,002 154,608
Access charges 24,096 23,260 23,303 22,124 21,952
Cost of goods sold 989 1,003 949 743 1,047
Licence Fee 18,058 16,435 16,518 14,533 13,407
Net revenues 145,329 136,221 134,770 121,602 118,202
Operating Expenses (Excl Access Charges,
cost of goods sold, License Fee & CSR Costs)60,437 59,014 61,154 57,158 55,697
EBITDA 86,032 77,968 74,622 65,119 63,298
EBIT 24,165 17,350 14,835 6,559 4,601
Profit before Tax (3,768) (143) (15,814) (12,097) (17,071)
Profit after Tax (before exceptional items) (3,578) 2,743 (10,762) (6,072) (10,163)
Non Controlling Interest 3,591 4,231 1,840 2,726 3,878
Net income (before exceptional items) (7,168) (1,487) (12,602) (8,799) (14,041)
Capex 56,761 34,749 95,476 41,155 27,576
Operating Free Cash Flow (EBITDA - Capex) 29,271 43,219 (20,854) 23,964 35,723
Cumulative Investments 3,063,713 3,010,127 2,978,435 2,938,934 2,903,597
Sep-20 Jun-20 Mar-20 Dec-19 Sep-19
As a % of Total revenues
Access charges 12.8% 13.1% 13.3% 13.9% 14.2%
Cost of goods sold 0.5% 0.6% 0.5% 0.5% 0.7%
Licence Fee 9.6% 9.3% 9.4% 9.1% 8.7%
Net revenues 77.1% 77.0% 76.8% 76.5% 76.5%
Operating Expenses (Excl Access Charges,
cost of goods sold, License Fee & CSR Costs)32.1% 33.4% 34.8% 35.9% 36.0%
EBITDA 45.6% 44.1% 42.5% 41.0% 40.9%
EBIT 12.8% 9.8% 8.5% 4.1% 3.0%
Profit before Tax -2.0% -0.1% -9.0% -7.6% -11.0%
Profit after Tax (before exceptional items) -1.9% 1.6% -6.1% -3.8% -6.6%
Non Controlling Interest 1.9% 2.4% 1.0% 1.7% 2.5%
Net income (before exceptional items) -3.8% -0.8% -7.2% -5.5% -9.1%
Particulars
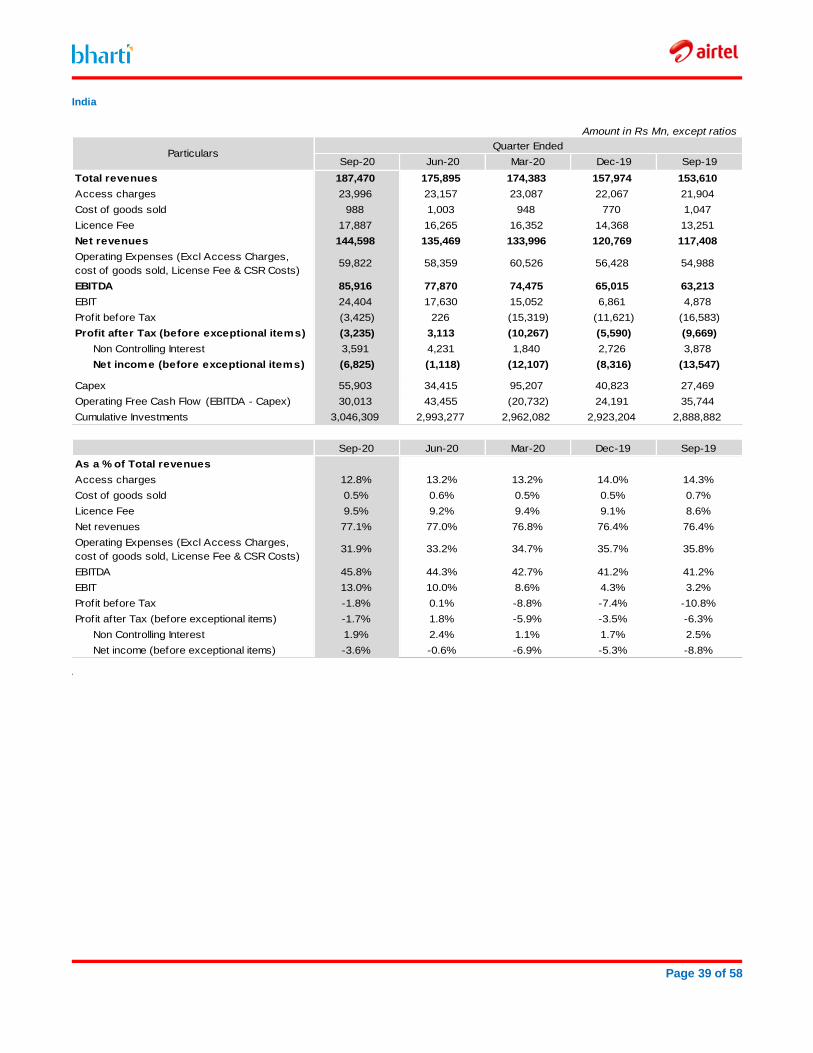
Page 39 of 58
India
Amount in Rs Mn, except ratios
Quarter Ended
Sep-20 Jun-20 Mar-20 Dec-19 Sep-19
Total revenues 187,470 175,895 174,383 157,974 153,610
Access charges 23,996 23,157 23,087 22,067 21,904
Cost of goods sold 988 1,003 948 770 1,047
Licence Fee 17,887 16,265 16,352 14,368 13,251
Net revenues 144,598 135,469 133,996 120,769 117,408
Operating Expenses (Excl Access Charges,
cost of goods sold, License Fee & CSR Costs)59,822 58,359 60,526 56,428 54,988
EBITDA 85,916 77,870 74,475 65,015 63,213
EBIT 24,404 17,630 15,052 6,861 4,878
Profit before Tax (3,425) 226 (15,319) (11,621) (16,583)
Profit after Tax (before exceptional items) (3,235) 3,113 (10,267) (5,590) (9,669)
Non Controlling Interest 3,591 4,231 1,840 2,726 3,878
Net income (before exceptional items) (6,825) (1,118) (12,107) (8,316) (13,547)
Capex 55,903 34,415 95,207 40,823 27,469
Operating Free Cash Flow (EBITDA - Capex) 30,013 43,455 (20,732) 24,191 35,744
Cumulative Investments 3,046,309 2,993,277 2,962,082 2,923,204 2,888,882
Sep-20 Jun-20 Mar-20 Dec-19 Sep-19
As a % of Total revenues
Access charges 12.8% 13.2% 13.2% 14.0% 14.3%
Cost of goods sold 0.5% 0.6% 0.5% 0.5% 0.7%
Licence Fee 9.5% 9.2% 9.4% 9.1% 8.6%
Net revenues 77.1% 77.0% 76.8% 76.4% 76.4%
Operating Expenses (Excl Access Charges,
cost of goods sold, License Fee & CSR Costs)31.9% 33.2% 34.7% 35.7% 35.8%
EBITDA 45.8% 44.3% 42.7% 41.2% 41.2%
EBIT 13.0% 10.0% 8.6% 4.3% 3.2%
Profit before Tax -1.8% 0.1% -8.8% -7.4% -10.8%
Profit after Tax (before exceptional items) -1.7% 1.8% -5.9% -3.5% -6.3%
Non Controlling Interest 1.9% 2.4% 1.1% 1.7% 2.5%
Net income (before exceptional items) -3.6% -0.6% -6.9% -5.3% -8.8%
Particulars
.
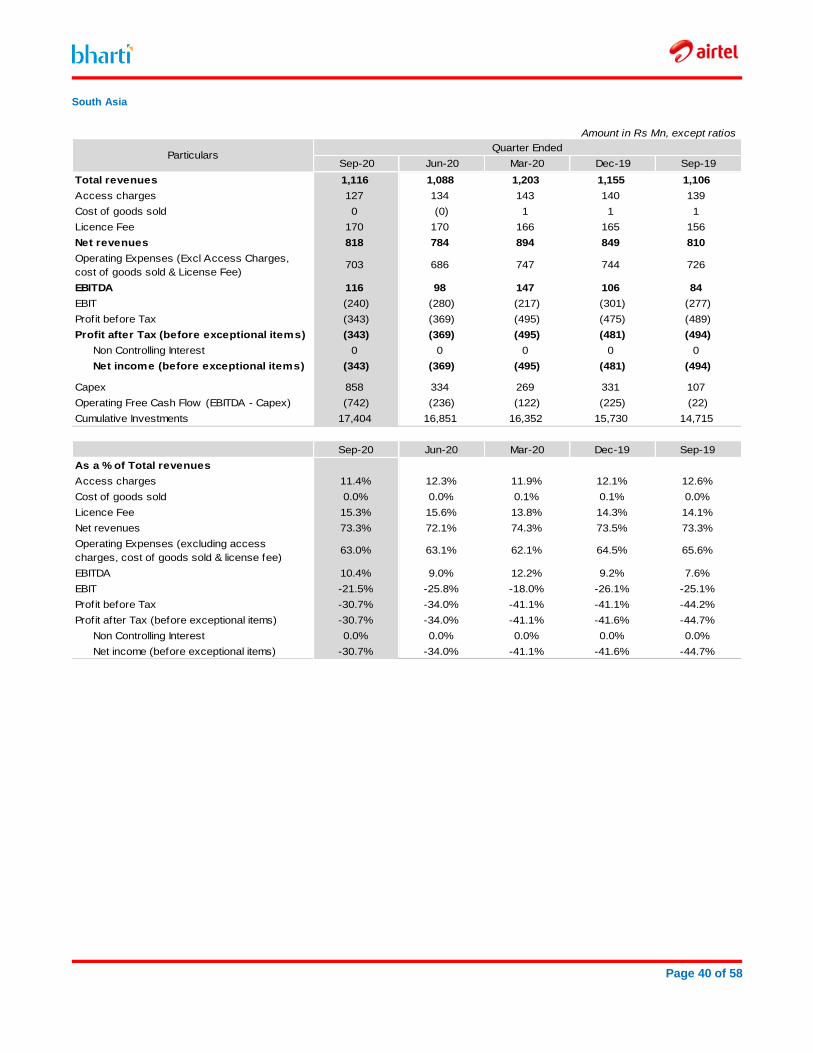
Page 40 of 58
South Asia
Amount in Rs Mn, except ratios
Quarter Ended
Sep-20 Jun-20 Mar-20 Dec-19 Sep-19
Total revenues 1,116 1,088 1,203 1,155 1,106
Access charges 127 134 143 140 139
Cost of goods sold 0 (0) 1 1 1
Licence Fee 170 170 166 165 156
Net revenues 818 784 894 849 810
Operating Expenses (Excl Access Charges,
cost of goods sold & License Fee)703 686 747 744 726
EBITDA 116 98 147 106 84
EBIT (240) (280) (217) (301) (277)
Profit before Tax (343) (369) (495) (475) (489)
Profit after Tax (before exceptional items) (343) (369) (495) (481) (494)
Non Controlling Interest 0 0 0 0 0
Net income (before exceptional items) (343) (369) (495) (481) (494)
Capex 858 334 269 331 107
Operating Free Cash Flow (EBITDA - Capex) (742) (236) (122) (225) (22)
Cumulative Investments 17,404 16,851 16,352 15,730 14,715
Sep-20 Jun-20 Mar-20 Dec-19 Sep-19
As a % of Total revenues
Access charges 11.4% 12.3% 11.9% 12.1% 12.6%
Cost of goods sold 0.0% 0.0% 0.1% 0.1% 0.0%
Licence Fee 15.3% 15.6% 13.8% 14.3% 14.1%
Net revenues 73.3% 72.1% 74.3% 73.5% 73.3%
Operating Expenses (excluding access
charges, cost of goods sold & license fee)63.0% 63.1% 62.1% 64.5% 65.6%
EBITDA 10.4% 9.0% 12.2% 9.2% 7.6%
EBIT -21.5% -25.8% -18.0% -26.1% -25.1%
Profit before Tax -30.7% -34.0% -41.1% -41.1% -44.2%
Profit after Tax (before exceptional items) -30.7% -34.0% -41.1% -41.6% -44.7%
Non Controlling Interest 0.0% 0.0% 0.0% 0.0% 0.0%
Net income (before exceptional items) -30.7% -34.0% -41.1% -41.6% -44.7%
Particulars
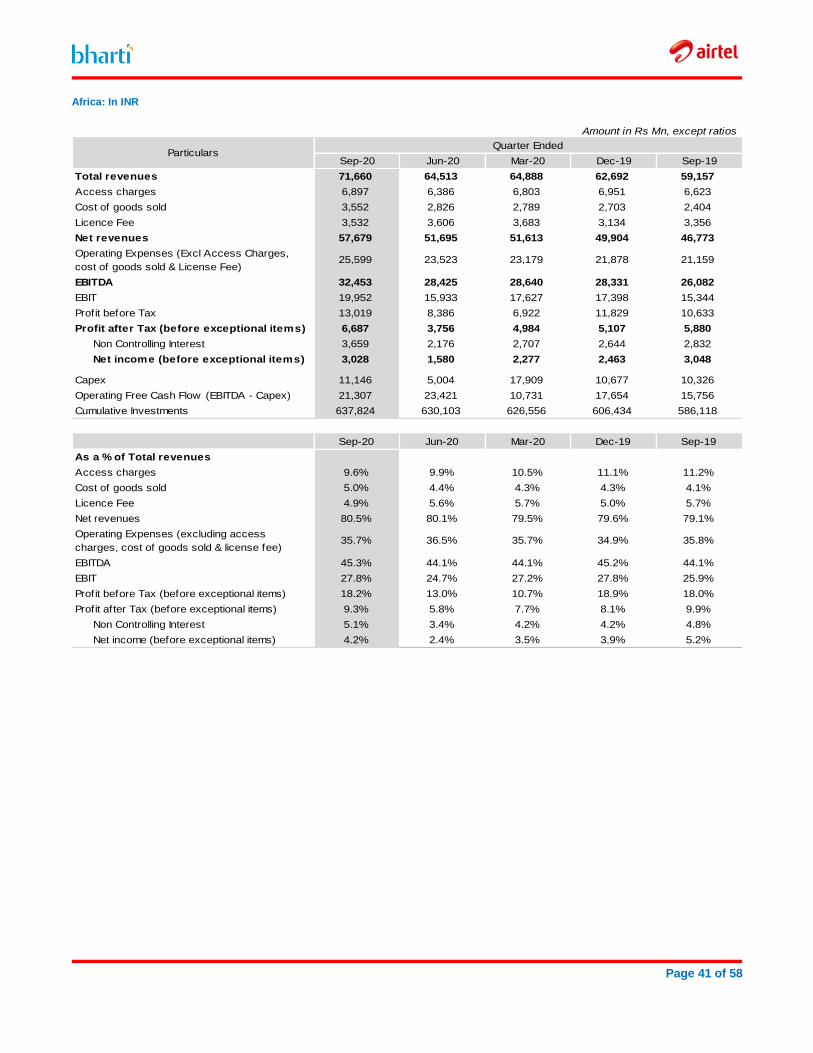
Page 41 of 58
Africa: In INR
Amount in Rs Mn, except ratios
Quarter Ended
Sep-20 Jun-20 Mar-20 Dec-19 Sep-19
Total revenues 71,660 64,513 64,888 62,692 59,157
Access charges 6,897 6,386 6,803 6,951 6,623
Cost of goods sold 3,552 2,826 2,789 2,703 2,404
Licence Fee 3,532 3,606 3,683 3,134 3,356
Net revenues 57,679 51,695 51,613 49,904 46,773
Operating Expenses (Excl Access Charges,
cost of goods sold & License Fee)25,599 23,523 23,179 21,878 21,159
EBITDA 32,453 28,425 28,640 28,331 26,082
EBIT 19,952 15,933 17,627 17,398 15,344
Profit before Tax 13,019 8,386 6,922 11,829 10,633
Profit after Tax (before exceptional items) 6,687 3,756 4,984 5,107 5,880
Non Controlling Interest 3,659 2,176 2,707 2,644 2,832
Net income (before exceptional items) 3,028 1,580 2,277 2,463 3,048
Capex 11,146 5,004 17,909 10,677 10,326
Operating Free Cash Flow (EBITDA - Capex) 21,307 23,421 10,731 17,654 15,756
Cumulative Investments 637,824 630,103 626,556 606,434 586,118
Sep-20 Jun-20 Mar-20 Dec-19 Sep-19
As a % of Total revenues
Access charges 9.6% 9.9% 10.5% 11.1% 11.2%
Cost of goods sold 5.0% 4.4% 4.3% 4.3% 4.1%
Licence Fee 4.9% 5.6% 5.7% 5.0% 5.7%
Net revenues 80.5% 80.1% 79.5% 79.6% 79.1%
Operating Expenses (excluding access
charges, cost of goods sold & license fee)35.7% 36.5% 35.7% 34.9% 35.8%
EBITDA 45.3% 44.1% 44.1% 45.2% 44.1%
EBIT 27.8% 24.7% 27.2% 27.8% 25.9%
Profit before Tax (before exceptional items) 18.2% 13.0% 10.7% 18.9% 18.0%
Profit after Tax (before exceptional items) 9.3% 5.8% 7.7% 8.1% 9.9%
Non Controlling Interest 5.1% 3.4% 4.2% 4.2% 4.8%
Net income (before exceptional items) 4.2% 2.4% 3.5% 3.9% 5.2%
Particulars
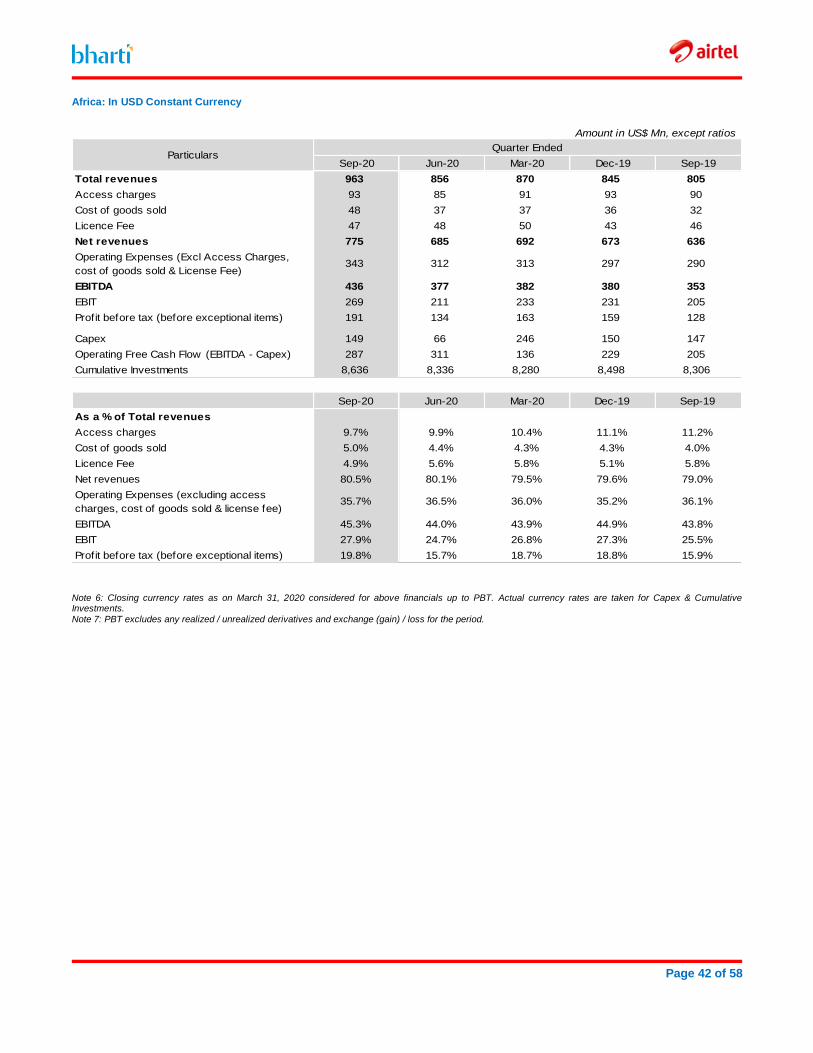
Page 42 of 58
Africa: In USD Constant Currency
Amount in US$ Mn, except ratios
Quarter Ended
Sep-20 Jun-20 Mar-20 Dec-19 Sep-19
Total revenues 963 856 870 845 805
Access charges 93 85 91 93 90
Cost of goods sold 48 37 37 36 32
Licence Fee 47 48 50 43 46
Net revenues 775 685 692 673 636
Operating Expenses (Excl Access Charges,
cost of goods sold & License Fee)343 312 313 297 290
EBITDA 436 377 382 380 353
EBIT 269 211 233 231 205
Profit before tax (before exceptional items) 191 134 163 159 128
Capex 149 66 246 150 147
Operating Free Cash Flow (EBITDA - Capex) 287 311 136 229 205
Cumulative Investments 8,636 8,336 8,280 8,498 8,306
Sep-20 Jun-20 Mar-20 Dec-19 Sep-19
As a % of Total revenues
Access charges 9.7% 9.9% 10.4% 11.1% 11.2%
Cost of goods sold 5.0% 4.4% 4.3% 4.3% 4.0%
Licence Fee 4.9% 5.6% 5.8% 5.1% 5.8%
Net revenues 80.5% 80.1% 79.5% 79.6% 79.0%
Operating Expenses (excluding access
charges, cost of goods sold & license fee)35.7% 36.5% 36.0% 35.2% 36.1%
EBITDA 45.3% 44.0% 43.9% 44.9% 43.8%
EBIT 27.9% 24.7% 26.8% 27.3% 25.5%
Profit before tax (before exceptional items) 19.8% 15.7% 18.7% 18.8% 15.9%
Particulars
Note 6: Closing currency rates as on March 31, 2020 considered for above financials up to PBT. Actual currency rates are taken for Capex & Cumulative Investments.
Note 7: PBT excludes any realized / unrealized derivatives and exchange (gain) / loss for the period.
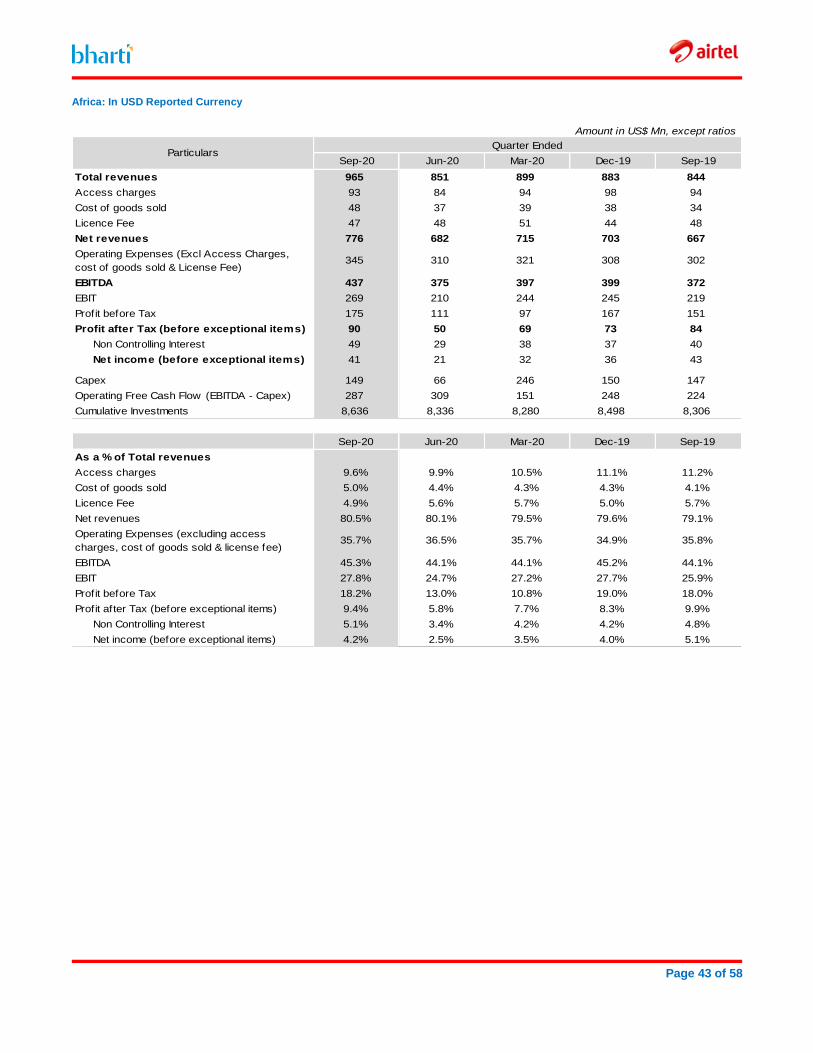
Page 43 of 58
Africa: In USD Reported Currency
Amount in US$ Mn, except ratios
Quarter Ended
Sep-20 Jun-20 Mar-20 Dec-19 Sep-19
Total revenues 965 851 899 883 844
Access charges 93 84 94 98 94
Cost of goods sold 48 37 39 38 34
Licence Fee 47 48 51 44 48
Net revenues 776 682 715 703 667
Operating Expenses (Excl Access Charges,
cost of goods sold & License Fee)345 310 321 308 302
EBITDA 437 375 397 399 372
EBIT 269 210 244 245 219
Profit before Tax 175 111 97 167 151
Profit after Tax (before exceptional items) 90 50 69 73 84
Non Controlling Interest 49 29 38 37 40
Net income (before exceptional items) 41 21 32 36 43
Capex 149 66 246 150 147
Operating Free Cash Flow (EBITDA - Capex) 287 309 151 248 224
Cumulative Investments 8,636 8,336 8,280 8,498 8,306
Sep-20 Jun-20 Mar-20 Dec-19 Sep-19
As a % of Total revenues
Access charges 9.6% 9.9% 10.5% 11.1% 11.2%
Cost of goods sold 5.0% 4.4% 4.3% 4.3% 4.1%
Licence Fee 4.9% 5.6% 5.7% 5.0% 5.7%
Net revenues 80.5% 80.1% 79.5% 79.6% 79.1%
Operating Expenses (excluding access
charges, cost of goods sold & license fee)35.7% 36.5% 35.7% 34.9% 35.8%
EBITDA 45.3% 44.1% 44.1% 45.2% 44.1%
EBIT 27.8% 24.7% 27.2% 27.7% 25.9%
Profit before Tax 18.2% 13.0% 10.8% 19.0% 18.0%
Profit after Tax (before exceptional items) 9.4% 5.8% 7.7% 8.3% 9.9%
Non Controlling Interest 5.1% 3.4% 4.2% 4.2% 4.8%
Net income (before exceptional items) 4.2% 2.5% 3.5% 4.0% 5.1%
Particulars
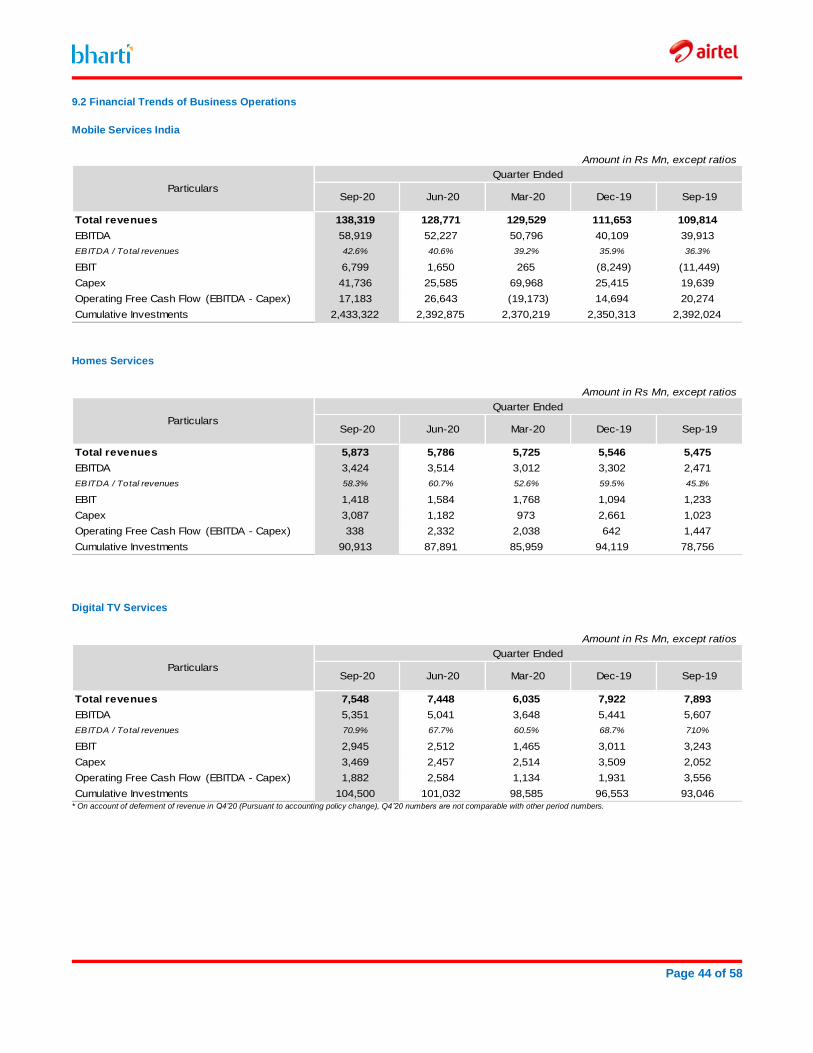
Page 44 of 58
9.2 Financial Trends of Business Operations
Mobile Services India
Amount in Rs Mn, except ratios
Quarter Ended
Sep-20 Jun-20 Mar-20 Dec-19 Sep-19
Total revenues 138,319 128,771 129,529 111,653 109,814
EBITDA 58,919 52,227 50,796 40,109 39,913
EBITDA / Total revenues 42.6% 40.6% 39.2% 35.9% 36.3%
EBIT 6,799 1,650 265 (8,249) (11,449)
Capex 41,736 25,585 69,968 25,415 19,639
Operating Free Cash Flow (EBITDA - Capex) 17,183 26,643 (19,173) 14,694 20,274
Cumulative Investments 2,433,322 2,392,875 2,370,219 2,350,313 2,392,024
Particulars
Homes Services
Amount in Rs Mn, except ratios
Quarter Ended
Sep-20 Jun-20 Mar-20 Dec-19 Sep-19
Total revenues 5,873 5,786 5,725 5,546 5,475
EBITDA 3,424 3,514 3,012 3,302 2,471
EBITDA / Total revenues 58.3% 60.7% 52.6% 59.5% 45.1%
EBIT 1,418 1,584 1,768 1,094 1,233
Capex 3,087 1,182 973 2,661 1,023
Operating Free Cash Flow (EBITDA - Capex) 338 2,332 2,038 642 1,447
Cumulative Investments 90,913 87,891 85,959 94,119 78,756
Particulars
Digital TV Services
Amount in Rs Mn, except ratios
Quarter Ended
Sep-20 Jun-20 Mar-20 Dec-19 Sep-19
Total revenues 7,548 7,448 6,035 7,922 7,893
EBITDA 5,351 5,041 3,648 5,441 5,607
EBITDA / Total revenues 70.9% 67.7% 60.5% 68.7% 71.0%
EBIT 2,945 2,512 1,465 3,011 3,243
Capex 3,469 2,457 2,514 3,509 2,052
Operating Free Cash Flow (EBITDA - Capex) 1,882 2,584 1,134 1,931 3,556
Cumulative Investments 104,500 101,032 98,585 96,553 93,046
Particulars
* On account of deferment of revenue in Q4’20 (Pursuant to accounting policy change), Q4’20 numbers are not comparable with other period numbers.
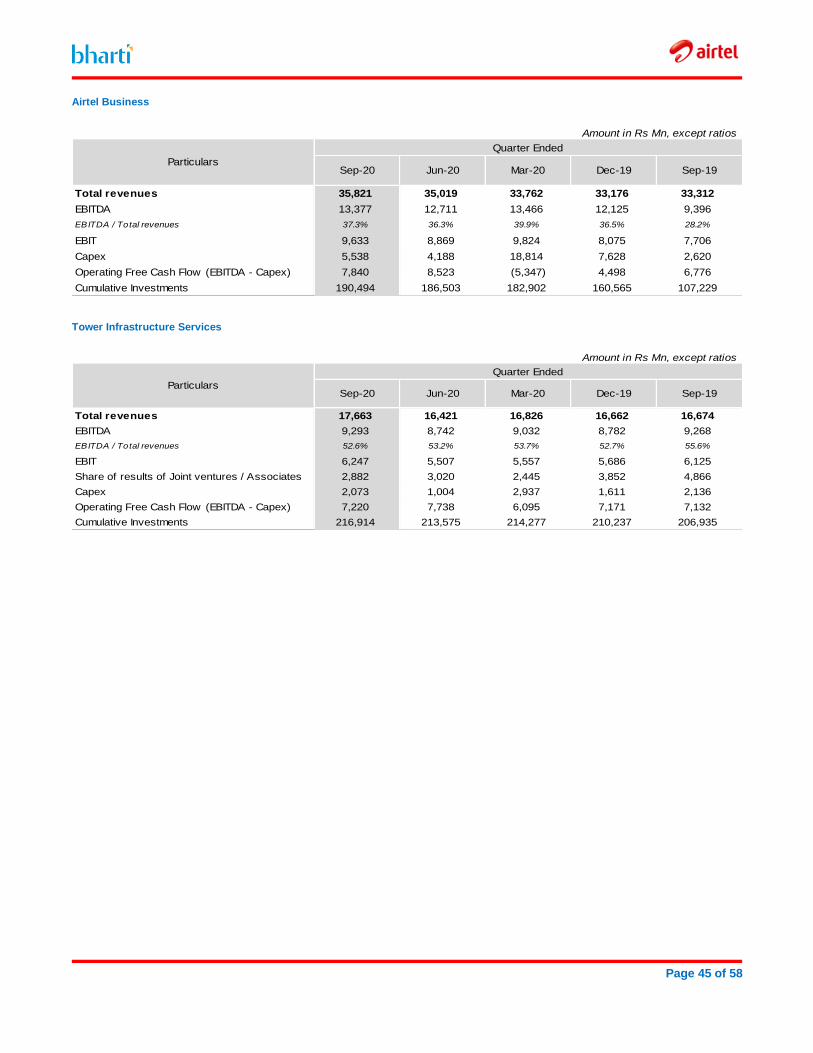
Page 45 of 58
Airtel Business
Amount in Rs Mn, except ratios
Quarter Ended
Sep-20 Jun-20 Mar-20 Dec-19 Sep-19
Total revenues 35,821 35,019 33,762 33,176 33,312
EBITDA 13,377 12,711 13,466 12,125 9,396
EBITDA / Total revenues 37.3% 36.3% 39.9% 36.5% 28.2%
EBIT 9,633 8,869 9,824 8,075 7,706
Capex 5,538 4,188 18,814 7,628 2,620
Operating Free Cash Flow (EBITDA - Capex) 7,840 8,523 (5,347) 4,498 6,776
Cumulative Investments 190,494 186,503 182,902 160,565 107,229
Particulars
Tower Infrastructure Services
Amount in Rs Mn, except ratios
Quarter Ended
Sep-20 Jun-20 Mar-20 Dec-19 Sep-19
Total revenues 17,663 16,421 16,826 16,662 16,674
EBITDA 9,293 8,742 9,032 8,782 9,268
EBITDA / Total revenues 52.6% 53.2% 53.7% 52.7% 55.6%
EBIT 6,247 5,507 5,557 5,686 6,125
Share of results of Joint ventures / Associates 2,882 3,020 2,445 3,852 4,866
Capex 2,073 1,004 2,937 1,611 2,136
Operating Free Cash Flow (EBITDA - Capex) 7,220 7,738 6,095 7,171 7,132
Cumulative Investments 216,914 213,575 214,277 210,237 206,935
Particulars
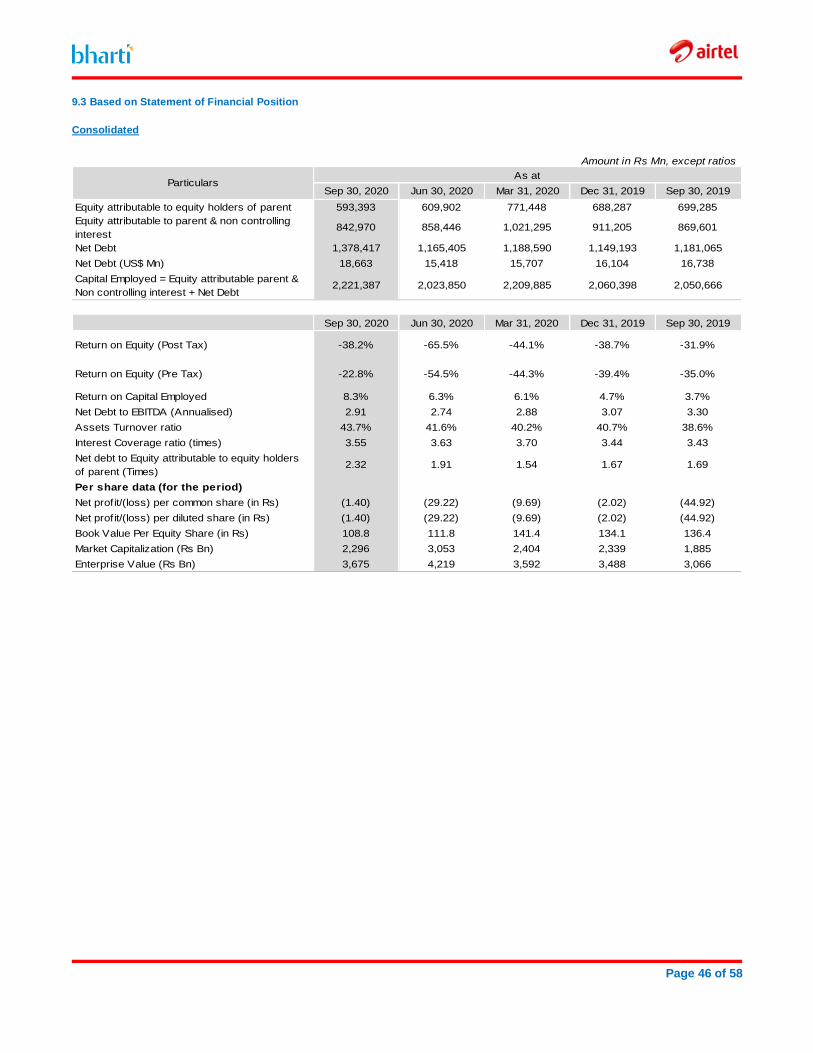
Page 46 of 58
9.3 Based on Statement of Financial Position
Consolidated
Amount in Rs Mn, except ratios
As at
Sep 30, 2020 Jun 30, 2020 Mar 31, 2020 Dec 31, 2019 Sep 30, 2019
Equity attributable to equity holders of parent 593,393 609,902 771,448 688,287 699,285
Equity attributable to parent & non controlling
interest842,970 858,446 1,021,295 911,205 869,601
Net Debt 1,378,417 1,165,405 1,188,590 1,149,193 1,181,065
Net Debt (US$ Mn) 18,663 15,418 15,707 16,104 16,738
Capital Employed = Equity attributable parent &
Non controlling interest + Net Debt2,221,387 2,023,850 2,209,885 2,060,398 2,050,666
Sep 30, 2020 Jun 30, 2020 Mar 31, 2020 Dec 31, 2019 Sep 30, 2019
Return on Equity (Post Tax) -38.2% -65.5% -44.1% -38.7% -31.9%
Return on Equity (Pre Tax) -22.8% -54.5% -44.3% -39.4% -35.0%
Return on Capital Employed 8.3% 6.3% 6.1% 4.7% 3.7%
Net Debt to EBITDA (Annualised) 2.91 2.74 2.88 3.07 3.30
Assets Turnover ratio 43.7% 41.6% 40.2% 40.7% 38.6%
Interest Coverage ratio (times) 3.55 3.63 3.70 3.44 3.43
Net debt to Equity attributable to equity holders
of parent (Times) 2.32 1.91 1.54 1.67 1.69
Per share data (for the period)
Net profit/(loss) per common share (in Rs) (1.40) (29.22) (9.69) (2.02) (44.92)
Net profit/(loss) per diluted share (in Rs) (1.40) (29.22) (9.69) (2.02) (44.92)
Book Value Per Equity Share (in Rs) 108.8 111.8 141.4 134.1 136.4
Market Capitalization (Rs Bn) 2,296 3,053 2,404 2,339 1,885
Enterprise Value (Rs Bn) 3,675 4,219 3,592 3,488 3,066
Particulars
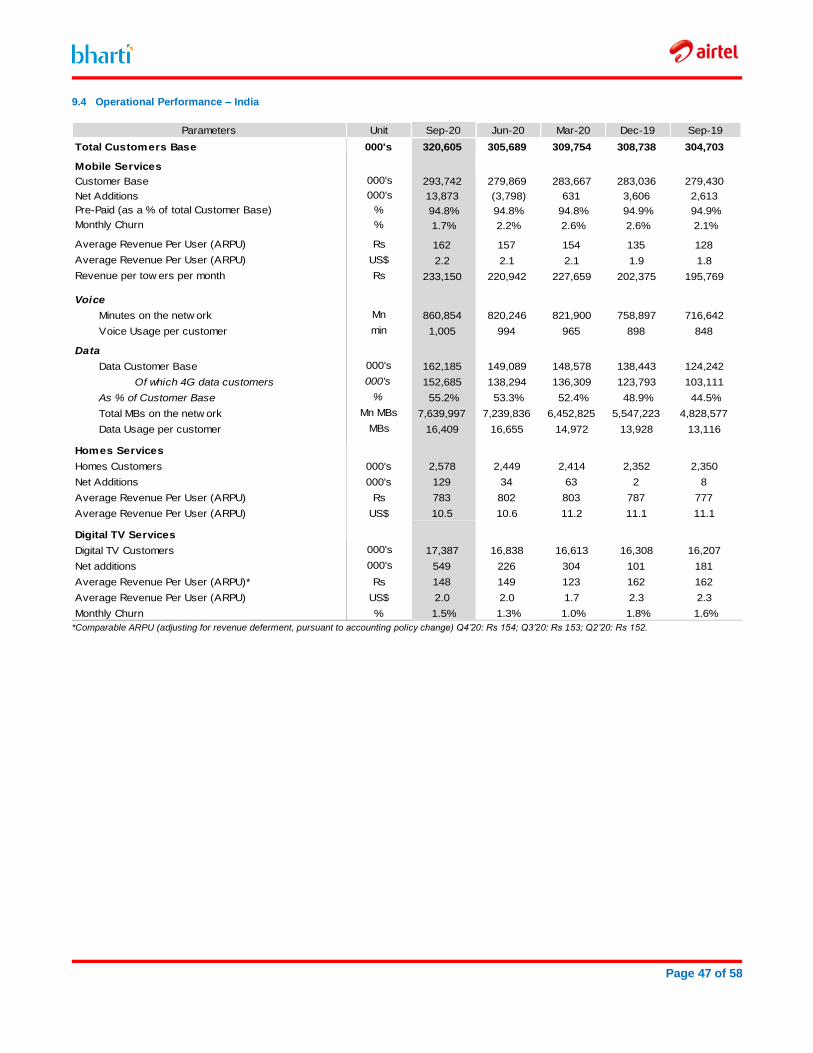
Page 47 of 58
9.4 Operational Performance – India
Parameters Unit Sep-20 Jun-20 Mar-20 Dec-19 Sep-19
Total Customers Base 000's 320,605 305,689 309,754 308,738 304,703
Mobile Services
Customer Base 000's 293,742 279,869 283,667 283,036 279,430
Net Additions 000's 13,873 (3,798) 631 3,606 2,613
Pre-Paid (as a % of total Customer Base) % 94.8% 94.8% 94.8% 94.9% 94.9%
Monthly Churn % 1.7% 2.2% 2.6% 2.6% 2.1%
Average Revenue Per User (ARPU) Rs 162 157 154 135 128
Average Revenue Per User (ARPU) US$ 2.2 2.1 2.1 1.9 1.8
Revenue per tow ers per month Rs 233,150 220,942 227,659 202,375 195,769
Voice
Minutes on the netw ork Mn 860,854 820,246 821,900 758,897 716,642
Voice Usage per customer min 1,005 994 965 898 848
Data
Data Customer Base 000's 162,185 149,089 148,578 138,443 124,242
Of which 4G data customers 000's 152,685 138,294 136,309 123,793 103,111
As % of Customer Base % 55.2% 53.3% 52.4% 48.9% 44.5%
Total MBs on the netw ork Mn MBs 7,639,997 7,239,836 6,452,825 5,547,223 4,828,577
Data Usage per customer MBs 16,409 16,655 14,972 13,928 13,116
Homes Services
Homes Customers 000's 2,578 2,449 2,414 2,352 2,350
Net Additions 000's 129 34 63 2 8
Average Revenue Per User (ARPU) Rs 783 802 803 787 777
Average Revenue Per User (ARPU) US$ 10.5 10.6 11.2 11.1 11.1
Digital TV Services
Digital TV Customers 000's 17,387 16,838 16,613 16,308 16,207
Net additions 000's 549 226 304 101 181
Average Revenue Per User (ARPU)* Rs 148 149 123 162 162
Average Revenue Per User (ARPU) US$ 2.0 2.0 1.7 2.3 2.3
Monthly Churn % 1.5% 1.3% 1.0% 1.8% 1.6%
*Comparable ARPU (adjusting for revenue deferment, pursuant to accounting policy change) Q4’20: Rs 154; Q3’20: Rs 153; Q2’20: Rs 152.
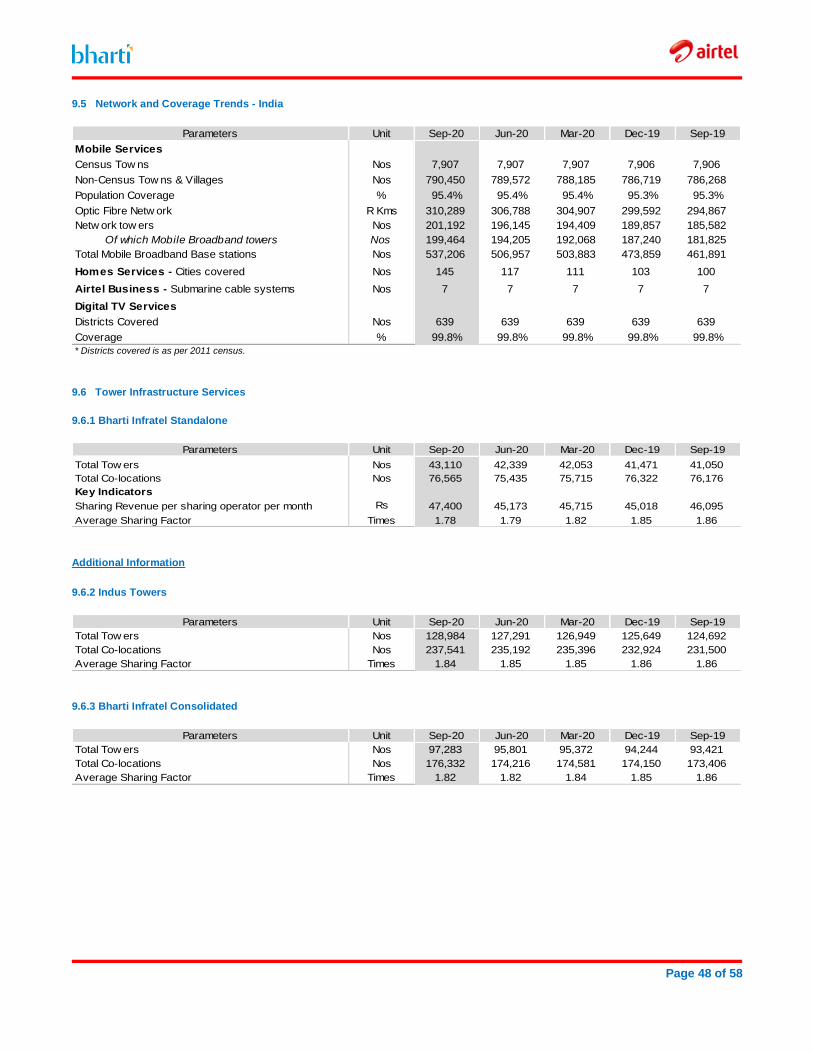
Page 48 of 58
9.5 Network and Coverage Trends - India
Parameters Unit Sep-20 Jun-20 Mar-20 Dec-19 Sep-19
Mobile Services
Census Tow ns Nos 7,907 7,907 7,907 7,906 7,906
Non-Census Tow ns & Villages Nos 790,450 789,572 788,185 786,719 786,268
Population Coverage % 95.4% 95.4% 95.4% 95.3% 95.3%
Optic Fibre Netw ork R Kms 310,289 306,788 304,907 299,592 294,867
Netw ork tow ers Nos 201,192 196,145 194,409 189,857 185,582
Of which Mobile Broadband towers Nos 199,464 194,205 192,068 187,240 181,825
Total Mobile Broadband Base stations Nos 537,206 506,957 503,883 473,859 461,891
Homes Services - Cities covered Nos 145 117 111 103 100
Airtel Business - Submarine cable systems Nos 7 7 7 7 7
Digital TV Services
Districts Covered Nos 639 639 639 639 639
Coverage % 99.8% 99.8% 99.8% 99.8% 99.8%
* Districts covered is as per 2011 census.
9.6 Tower Infrastructure Services
9.6.1 Bharti Infratel Standalone
Parameters Unit Sep-20 Jun-20 Mar-20 Dec-19 Sep-19
Total Tow ers Nos 43,110 42,339 42,053 41,471 41,050
Total Co-locations Nos 76,565 75,435 75,715 76,322 76,176
Key Indicators
Sharing Revenue per sharing operator per month Rs 47,400 45,173 45,715 45,018 46,095
Average Sharing Factor Times 1.78 1.79 1.82 1.85 1.86
Additional Information
9.6.2 Indus Towers
Parameters Unit Sep-20 Jun-20 Mar-20 Dec-19 Sep-19
Total Tow ers Nos 128,984 127,291 126,949 125,649 124,692
Total Co-locations Nos 237,541 235,192 235,396 232,924 231,500
Average Sharing Factor Times 1.84 1.85 1.85 1.86 1.86
9.6.3 Bharti Infratel Consolidated
Parameters Unit Sep-20 Jun-20 Mar-20 Dec-19 Sep-19
Total Tow ers Nos 97,283 95,801 95,372 94,244 93,421
Total Co-locations Nos 176,332 174,216 174,581 174,150 173,406
Average Sharing Factor Times 1.82 1.82 1.84 1.85 1.86
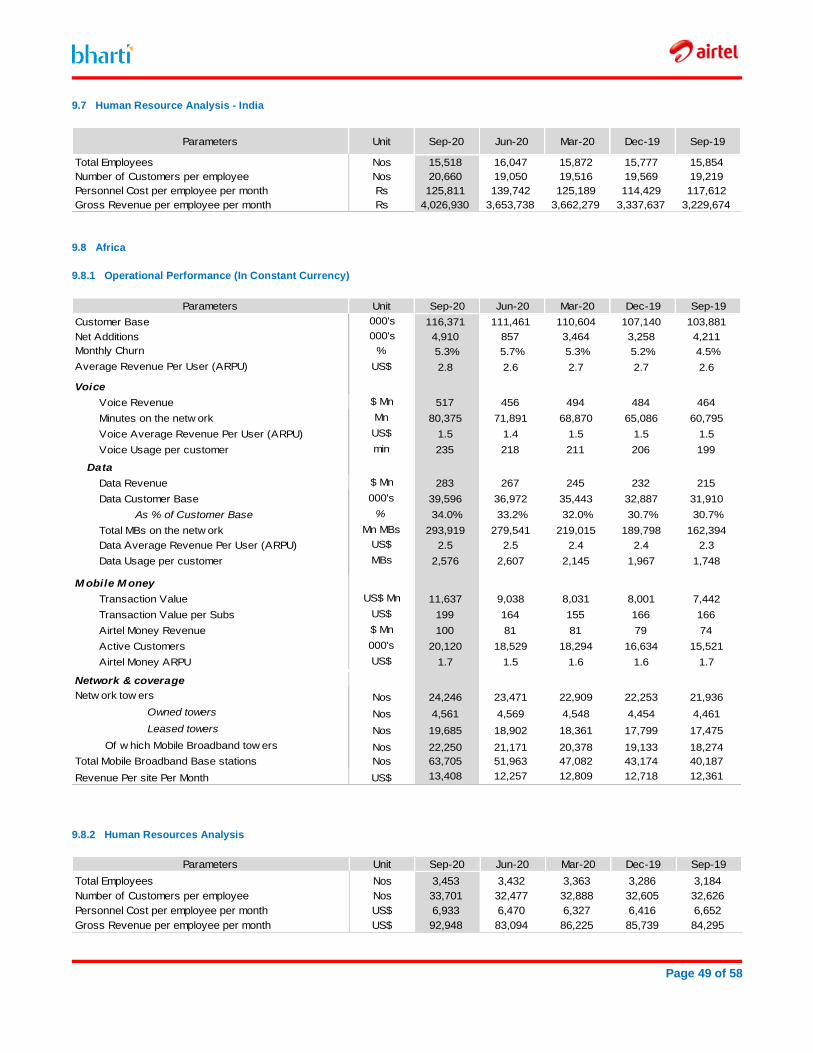
Page 49 of 58
9.7 Human Resource Analysis - India
Parameters Unit Sep-20 Jun-20 Mar-20 Dec-19 Sep-19
Total Employees Nos 15,518 16,047 15,872 15,777 15,854
Number of Customers per employee Nos 20,660 19,050 19,516 19,569 19,219
Personnel Cost per employee per month Rs 125,811 139,742 125,189 114,429 117,612
Gross Revenue per employee per month Rs 4,026,930 3,653,738 3,662,279 3,337,637 3,229,674
9.8 Africa
9.8.1 Operational Performance (In Constant Currency)
Parameters Unit Sep-20 Jun-20 Mar-20 Dec-19 Sep-19
Customer Base 000's 116,371 111,461 110,604 107,140 103,881
Net Additions 000's 4,910 857 3,464 3,258 4,211
Monthly Churn % 5.3% 5.7% 5.3% 5.2% 4.5%
Average Revenue Per User (ARPU) US$ 2.8 2.6 2.7 2.7 2.6
Voice
Voice Revenue $ Mn 517 456 494 484 464
Minutes on the netw ork Mn 80,375 71,891 68,870 65,086 60,795
Voice Average Revenue Per User (ARPU) US$ 1.5 1.4 1.5 1.5 1.5
Voice Usage per customer min 235 218 211 206 199
Data
Data Revenue $ Mn 283 267 245 232 215
Data Customer Base 000's 39,596 36,972 35,443 32,887 31,910
As % of Customer Base % 34.0% 33.2% 32.0% 30.7% 30.7%
Total MBs on the netw ork Mn MBs 293,919 279,541 219,015 189,798 162,394
Data Average Revenue Per User (ARPU) US$ 2.5 2.5 2.4 2.4 2.3
Data Usage per customer MBs 2,576 2,607 2,145 1,967 1,748
M obile M oney
Transaction Value US$ Mn 11,637 9,038 8,031 8,001 7,442
Transaction Value per Subs US$ 199 164 155 166 166
Airtel Money Revenue $ Mn 100 81 81 79 74
Active Customers 000's 20,120 18,529 18,294 16,634 15,521
Airtel Money ARPU US$ 1.7 1.5 1.6 1.6 1.7
Network & coverage
Netw ork tow ers Nos 24,246 23,471 22,909 22,253 21,936
Owned towers Nos 4,561 4,569 4,548 4,454 4,461
Leased towers Nos 19,685 18,902 18,361 17,799 17,475
Of w hich Mobile Broadband tow ers Nos 22,250 21,171 20,378 19,133 18,274
Total Mobile Broadband Base stations Nos 63,705 51,963 47,082 43,174 40,187
Revenue Per site Per Month US$ 13,408 12,257 12,809 12,718 12,361
9.8.2 Human Resources Analysis
Parameters Unit Sep-20 Jun-20 Mar-20 Dec-19 Sep-19
Total Employees Nos 3,453 3,432 3,363 3,286 3,184
Number of Customers per employee Nos 33,701 32,477 32,888 32,605 32,626
Personnel Cost per employee per month US$ 6,933 6,470 6,327 6,416 6,652
Gross Revenue per employee per month US$ 92,948 83,094 86,225 85,739 84,295
Page 50 of 58
SECTION 10
KEY ACCOUNTING POLICIES AS PER Ind-AS
Property, plant and equipment
Property, plant and equipment are stated at cost, net of accumulated depreciation and impairment loss. All direct costs relating to the acquisition and installation of property and
equipment are capitalized. Depreciation is recorded on a straight-line basis over the
estimated useful lives of the assets.
Assets Years
Building 20
Building on leased land 20 or lease term whichever is
lower
Network equipment 3-25
Customer premises equipment 3-7
Computer equipment 3
Furniture & Fixture and office equipment
1 – 5
Vehicles 3 – 5
Leasehold improvements
Period of the lease or upto
20 years, as applicable, whichever is less
Freehold land is not depreciated. The useful lives, residual values and depreciation method of PPE are reviewed, and adjusted appropriately, at-least as at each reporting date so as to ensure
that the method and period of depreciation are consistent with the expected pattern of economic benefits from these assets.
Costs of additions and substantial improvements to property and equipment are capitalized. The costs of maintenance and repairs of property and equipment are charged to operating expenses.
Goodwill
Goodwill arising on the acquisition of an entity represents the excess of the cost of acquisition over the Group’s interest in the
net fair value of the identifiable assets, liabilities and contingent liabilities of the entity recognized at the date of acquisition.
Goodwill is not subject to amortization but is tested for impairment annually and when circumstances indicate, the carrying value may be impaired. Impairment is determined for goodwill by
assessing the recoverable amount of each cash-generating unit (or group of cash-generating units) to which the goodwill relates. Where the recoverable amount of the cash- generating unit is less
than their carrying amount an impairment loss is recognized. Impairment losses relating to goodwill are not reversed in future periods.
On disposal of a subsidiary, the attributable amount of goodwill is included in the determination of the profit or loss recognized in the statement of profit and loss on disposal.
Other Intangible assets
Identifiable intangible assets are recognized when the Group controls the asset, it is probable that future economic benefits
attributed to the asset will flow to the Group and the cost of the asset can be measured reliably.
The intangible assets that are acquired in a business combination are recognized at its fair value there at. Other intangible assets
are recognized at cost. These assets having finite useful life are carried at cost less accumulated amortization and any impairment losses. Amortization is computed using the straight-line method
over the expected useful life of intangible assets. The Group has established the estimated useful lives of different
categories of intangible assets as follows: a. Licenses (including spectrum)
Acquired licenses and spectrum are amortized commencing from the date when the related network is available for intended use in the relevant jurisdiction. The useful lives range from two years to
twenty five years. The revenue-share based fee on licenses / spectrum is charged
to the statement of profit and loss in the period such cost is incurred.
b. Software: Software are amortized over the period of license, generally not exceeding five years.
c. Other acquired intangible assets: Other acquired intangible assets include the following:
Rights acquired for unlimited license access: Over the period of the agreement which ranges up to five years.
Distribution network: One year to two years Customer base: Over the estimated life of such relationships.
Non-compete fee: Over the period of the agreement which ranges up to five years.
The useful lives and amortization method are reviewed, and adjusted appropriately, at least at each financial year end so as to
ensure that the method and period of amortization are consistent with the expected pattern of economic benefits from these assets. The effect of any change in the estimated useful lives and / or
amortization method is accounted prospectively, and accordingly the amortization is calculated over the remaining revised useful life.
Further, the cost of intangible assets under development includes the borrowing costs that are directly attributable to the acquisition or construction of qualifying assets and are presented separately
in the balance sheet.
Investment in Joint Ventures and Associates
A joint venture is a type of joint arrangement whereby the parties that have joint control of the arrangement have rights to the net assets of the joint venture. Joint control is the contractually
agreed sharing of control of an arrangement, which exists only when decisions about the relevant activities require unanimous consent of the parties sharing control.
Page 51 of 58
An associate is an entity over which the Group has significant influence. Significant influence is the power to participate in the
financial and operating policy decisions of the investee but is not control or joint control over those policies.
Joint ventures and associates are accounted for using equity method from the date on which Group obtains joint control over the joint venture / starts exercising significant influence over the
associate. Accounting policies of the respective joint venture and associate
are aligned wherever necessary, so as to ensure consistency with the accounting policies that are adopted by the Group under Ind-AS. The Group’s investments in its joint ventures and associates
are accounted for using the equity method. Accordingly, the investments are carried at cost less any impairment loss as adjusted for post-acquisition changes in the Group’s share of the
net assets of investees. Losses of a joint venture or an associate in excess of the Group’s interest in that joint venture or associate are not recognized. However, additional losses are provided for,
and a liability is recognized, only to the extent that the Group has incurred legal or constructive obligations or made payments on behalf of the joint venture or associate.
At each reporting date, the Group determines whether there is objective evidence that the investment is impaired. If there is such
evidence, the Group calculates the amount of impairment as the difference between the recoverable amount of investment and its carrying value.
Leases
The Group, at the inception of a contract, assesses the contract
as, or containing, a lease if the contract conveys the right to
control the use of an identified asset for a period of time in
exchange for consideration. To assess whether a contract
conveys the right to control the use of an identified asset, the
Group assesses whether the contract involves the use of an
identified asset, the Group has the right to obtain substantially all
of the economic benefits from use of the asset throughout the
period of use; and the Group has the right to direct the use of the
asset.
Group as a lessee
On initial application of Ind AS 116, the Group recognized a lease
liability measured at the present value of all the remaining lease payments, discounted using the Group’s incremental borrowing rate at April 1, 2019 whereas the Group has elected to measure
right-of-use asset at its carrying amount as if Ind AS 116 had been applied since the lease commencement date, but discounted using the lessee’s incremental borrowing rate at April
1, 2019. The Group has elected not to recognize a lease liability and a right-of-use asset for leases for which the lease term ends within twelve months of April 1, 2019 and has accounted for these
leases as short-term leases. The lease payments associated with these leases are recognized as an expense on a straight line basis over the lease term.
For new lease contracts, the Group recognizes a right-of-use
asset and a corresponding lease liability with respect to all lease
agreements in which it is the lessee in the balance sheet. The
lease liability is initially measured at the present value of the
lease payments that are not paid at the commencement date,
discounted by using incremental borrowing rate. Lease liabilities
include the net present value of fixed payments (including any in-
substance fixed payments), any variable lease payments that are
based on consumer price index (‘CPI’), the exercise price of a
purchase option if the lessee is reasonably certain to exercise
that option, and payments of penalties for terminating the lease, if
the lease term reflects the lessee exercising that option.
Subsequently, the lease liability is measured at amortized cost
using the effective interest method. It is re-measured when there
is a change in future lease payments including due to changes in
CPI or if the Group changes its assessment of whether it will
exercise a purchase, extension or termination option or when the
lease contract is modified and the lease modification is not accounted for as a separate lease. The corresponding
adjustment is made to the carrying amount of the right-of-use
asset, or is recorded in profit or loss if the carrying amount of the
related right-of-use asset has been reduced to zero.
Right-of-use assets are measured at cost comprising the amount
of the initial measurement of lease liability, any lease payments
made at or before the commencement date, any initial direct
costs less any lease incentives received.
Subsequent to initial recognition, right-of-use asset are stated at
cost less accumulated depreciation and any impairment losses
and adjusted for certain re-measurements of the lease liability.
Depreciation is computed using the straight-line method from the
commencement date to the end of the useful life of the
underlying asset or the end of the lease term, whichever is
shorter. The estimated useful lives of right-of-use assets are
determined on the same basis as those of the underlying
property and equipment.
In the balance sheet, the right-of-use assets and lease liabilities
are presented separately.
When a contract includes lease and non-lease components, the
Group allocates the consideration in the contract on the basis of
the relative stand-alone prices of each lease component and the
aggregate stand-alone price of the non-lease components.
Short-term leases and leases of low-value assets
The Group has elected not to recognise right-of-use assets and
lease liabilities for short term leases that have a lease term of 12
months or less and leases of low value assets. The Group
recognises the lease payments associated with these leases as
an expense on a straight-line basis over the lease term.
Group as a lessor
Whenever the terms of the lease transfer substantially all the
risks and rewards of ownership to the lessee, the contract is
classified as a finance lease. All other leases are classified as
operating leases.
Amounts due from lessees under a finance lease are recognized
as receivables at an amount equal to the net investment in the
leased assets. Finance lease income is allocated to the periods
so as to reflect a constant periodic rate of return on the net
investment outstanding in respect of the finance lease.
Page 52 of 58
Rental income from operating leases is recognized on a straight-
line basis over the term of the relevant lease. Initial direct costs
incurred in negotiating and arranging an operating lease are
added to the carrying amount of the leased asset and recognized
on a straight line basis over the lease term.
When a contract includes lease and non-lease components, the
Group applies Ind AS 115 to allocate the consideration under the
contract to each component.
The Group enters into ‘Indefeasible right to use’ (‘IRU’)
arrangements wherein the right to use the assets is given over
the substantial part of the asset life. However, as the title to the
assets and the significant risks associated with the operation and
maintenance of these assets remains with the Group, such
arrangements are recognized as operating lease. The contracted
price is recognized as revenue during the tenure of the
agreement. Unearned IRU revenue received in advance is
presented as deferred revenue within liabilities in the balance
sheet.
Derivative financial instruments
Derivative financial instruments, including separated embedded
derivatives, that are not designated as hedging instruments in a hedging relationship are classified as financial instruments at fair value through profit or loss - Held for trading. Such derivative
financial instruments are initially recognized at fair value. They are subsequently re-measured at their fair value, with changes in fair value being recognized in the statement of profit and loss within
finance income / finance costs.
Hedging activities
i. Fair value hedge
Some of the group entities use certain type of derivative financial instruments (viz. interest rate / currency swaps) to manage /
mitigate their exposure to the risk of change in fair value of the borrowings. The Group designates certain interest rate swaps to hedge the risk of changes in fair value of recognized borrowings
attributable to the hedged interest rate risk. The effective portion of changes in the fair value of derivatives that are designated and qualify as fair value hedges are recorded in the statement of profit
and loss within finance income / finance costs, together with any changes in the fair value of the hedged liability that are attributable to the hedged risk. If the hedge no longer meets the
criteria for hedge accounting, the adjustment to the carrying amount of the hedged item is amortized to profit or loss over the period to remaining maturity of the hedged item.
ii. Cash flow hedge
The Group designates certain derivative financial instruments (or its components) as hedging instruments for hedging the exchange rate fluctuation risk attributable either to a recognized item or a highly probable forecast transaction. The effective portion of
changes in the fair value of derivative financial instruments (or its components), that are designated and qualify as Cash flow hedges, are recognized in the other comprehensive income and
held in Cash flow hedge reserve. Any gains / (losses) relating to the ineffective portion, are recognized immediately in the statement of profit and loss. The amounts accumulated in Equity
are re-classified to the statement of profit and loss in the periods when the hedged item affects profit / (loss).
When a hedging instrument expires or is sold, or when a hedge no longer meets the criteria for hedge accounting, any cumulative
gains / (losses) existing in equity at that time remains in equity and is recognized when the forecast transaction is ultimately recognized in the statement of profit and loss. However, at any
point of time, when a forecast transaction is no longer expected to occur, the cumulative gains / (losses) that were reported in equity is immediately transferred to the statement of profit and loss.
iii. Net investment hedge
The Group hedges its certain net investment in foreign subsidiaries which are accounted for similar to cash flow hedges. Accordingly, any foreign exchange differences on the hedging
instrument (viz. borrowings) relating to the effective portion of the hedge is recognized in other comprehensive income and held in foreign currency translation reserve, so as to offset the change in
the value of the net investment being hedged. The ineffective portion of the gain or loss on these hedges is immediately recognized in the statement of profit and loss. The amounts
accumulated in equity are included in the statement of profit and loss when the foreign operation is disposed or partially disposed.
Revenue recognition
Revenue is recognized upon transfer of control of promised
products or services to customer at the consideration which the Group has received or expects to receive in exchange of those products or services, net of any taxes / duties, discounts and
process waivers. In order to determine if it is acting as a principal or as an agent, the Group assesses whether it is primarily responsible for fulfilling the performance obligation and whether it
controls the promised service before transfer to customers.
(i) Service revenues
Service revenues mainly pertain to usage, subscription and activation charges for voice, data, messaging and value added
services and Direct to Home (DTH). It also includes revenue from interconnection / roaming charges for usage of the Group’s network by other operators for voice, data, messaging and
signaling services.
Usage charges are recognized based on actual usage.
Subscription charges are recognized over the estimated customer relationship period or subscription pack validity period, whichever is lower. Customer onboarding revenue and associated cost is
recognized upon successful onboarding of customer i.e. upfront. Revenues in excess of invoicing are classified as unbilled revenue while invoicing / collection in excess of revenue are
classified as deferred revenue / advance from customer.
The billing / collection in excess of revenue recognized is
presented as deferred revenue in the Balance Sheet whereas unbilled revenue is recognized under other current financial assets.
Certain business services revenue include revenue from registration and installation, which are amortized over the period
of agreement since the date of activation of service.
Revenues from long distance operations comprise of voice
services and bandwidth services (including installation), which are
Page 53 of 58
recognized on provision of services and over the period of respective arrangements.
As part of the mobile money services, the Group earns commission from merchants for facilitating recharges, bill
payments and other merchant payments. It also earns commission on transfer of monies from one customer wallet to another. Such commissions are recognized as revenue at a point
in time on fulfilment of those services by the Group. (ii) Multiple element arrangements
The Group has entered into certain multiple-element revenue arrangements which involve the delivery or performance of
multiple products, services or rights to use assets. At the inception of the arrangement, all the deliverables therein are evaluated to determine whether they represent distinct
performance obligations.
Total consideration related to the multiple element arrangements
is allocated to each performance obligation based on their standalone selling prices.
(iii) Equipment sales
Equipment sales mainly pertain to sale of telecommunication
equipment and related accessories, for which revenue is recognized when the control of such equipment is transferred to the customer. However, in case of equipment sale forming part of
multiple-element revenue arrangements which is not distinct performance obligation, revenue is recognized over the customer relationship period.
Interest income
The interest income is recognized using the effective interest rate method.
Cost to obtain or fulfill a contract with a customer
The Group incurs certain cost or fulfill contract with the customer viz. intermediary commission, etc. where based on Group’s estimate of historic average customer life derived from customer
churn rate is longer than 12 months, such costs are deferred and are recognized over the average expected customer life.
Dividend income
Dividend income is recognized when the Company’s right to receive the payment is established.
Exceptional items
Exceptional items refer to items of income or expense within the
statement of profit and loss from ordinary activities which are non-recurring and are of such size, nature or incidence that their separate disclosure is considered necessary to explain the
performance of the Group.
Foreign currency transactions
Monetary assets and liabilities denominated in foreign currencies are translated into the functional currency at the closing exchange
rate prevailing as at the reporting date with the resulting foreign exchange differences, on subsequent re-statement / settlement, recognized in the statement of profit and loss. Non-monetary
assets and liabilities denominated in foreign currencies are translated into the functional currency using the exchange rate prevalent, at the date of initial recognition (in case they are
measured at historical cost) or at the date when the fair value is determined (in case they are measured at fair value).
The assets and liabilities of foreign operations (including the goodwill and fair value adjustments arising on the acquisition of foreign entities) are translated into Rupees (functional currency of
parent) at the exchange rates prevailing at the reporting date whereas their statements of profit and loss are translated into Rupees at monthly average exchange rates and the equity is
recorded at the historical rate. The resulting exchange differences arising on the translation are recognized in other comprehensive income and held in foreign currency translation reserve. On
disposal of a foreign operation (that is, disposal involving loss of control), the component of other comprehensive income relating to that particular foreign operation is reclassified to profit or loss.
Income-taxes
Income tax is calculated on the basis of the tax rates, laws and regulations, which have been enacted or substantively enacted as at the reporting date in the respective countries where the Group
entities operate and generate taxable income. Deferred tax is recognized on temporary differences arising
between the tax bases of assets and liabilities and their carrying values in the financial statements. However, deferred tax are not recognized if it arises from initial recognition of an asset or liability
in a transaction other than a business combination that at the time of the transaction affects neither accounting nor taxable profit or loss. Further, deferred tax liabilities are not recognized if they
arise from the initial recognition of goodwill. Deferred tax assets are recognized only to the extent that it is
probable that future taxable profit will be available against which the temporary differences can be utilized. Moreover, deferred tax is recognized on temporary differences arising on investments in
subsidiaries, joint ventures and associates - unless the timing of the reversal of the temporary difference can be controlled and it is probable that the temporary difference will not reverse in the
foreseeable future. The unrecognized deferred tax assets / carrying amount of
deferred tax assets are reviewed at each reporting date for recoverability and adjusted appropriately.
Transactions with non-controlling interests
Transactions with non-controlling interests that do not result in loss of control are accounted for as equity transactions – that is, as transactions with the owners in their capacity as owners. The
differences between fair value of any consideration paid and the relevant share acquired of the carrying value of net assets of the subsidiary is recorded in equity.
Page 54 of 58
SECTION 11
GLOSSARY
Technical and Industry Terms
Company Related
Asset Turnover
Asset Turnover is defined as total revenues, for the preceding (last) 12 months from the end of the relevant
period, divided by average assets. Asset is defined as the sum of non-current assets and net current assets.
Net current assets are computed by subtracting current liabilities from current assets. Average assets is
calculated by considering average of Opening and closing assets for the relevant period.
Average Customers
Average Co-locations
Average Sharing Factor
Average customers are derived by computing the average of the monthly average customers for the relevant period.
Average co-locations are derived by computing the average of the Opening and Closing co-locations for the relevant period.
It is calculated as the average of the opening and closing number of co-locations divided by the average of the opening and closing number of towers for the relevant period.
Average Towers
Average towers are derived by computing the average of the Opening and Closing towers for the relevant period.
Book Value Per Equity Share
Total stockholder’s equity as at the end of the relevant period divided by outstanding equity shares as at the end of the relevant period.
Capex It includes investment in gross fixed assets and capital work in progress for the period.
Capital Employed Capital Employed is defined as sum of equity attributable to parent & non-controlling interest and net debt.
Cumulative Investments
Cumulative Investments comprises of gross value of property, plant & equipment (including CWIP & capital
advances) and intangibles including investment in associates.
Cash Profit From
Operations before
Derivative & Exchange
Fluctuation
It is not an Ind-AS measure and is defined as profit from operating activities before depreciation, amortization
and exceptional items adjusted for interest expense before adjusting for derivative & exchange (gain)/ loss.
Churn
Co-locations
Churn is calculated by dividing the total number of disconnections during the relevant period by the average
customers; and dividing the result by the number of months in the relevant period.
Co-location is the total number of sharing operators at a tower, and where there is a single operator at a
tower, ‘co-location’ refers to that single operator. Co-locations as referred to are revenue generating Co-
locations.
Customer Base Customers generating revenue through recharge, billing or any outgoing activity.
Customers Per Employee Number of customers on networks of a business unit as at end of the relevant period divided by number of
employees in the respective business unit as at end of the relevant period.
Data Customer Base A customer who used at least 1 MB on GPRS / 3G / 4G network in the last 30 days.
Data Usage per
Customer
It is calculated by dividing the total MBs consumed on the network during the relevant period by the average
data customer base; and dividing the result by the number of months in the relevant period.
DTH / Digital TV Services
Direct to Home broadcast service
Earnings Per Basic Share It is computed by dividing net income attributable to ordinary shareholders by the weighted average number
of ordinary shares outstanding during the period.
Page 55 of 58
Earnings Per Diluted
Share
The calculation of Net Profit/ (loss) per diluted share adjusts net profit or loss and the weighted average number of ordinary shares outstanding, to give effect to all dilutive potential ordinary shares that were
outstanding during the year. Net profit or loss attributable to ordinary shareholders is adjusted for the after-tax effect of the following: (1)
dividends on potential ordinary shares (for example, dilutive convertible preferred shares); (2) interest
recognized on potential ordinary shares (for example, dilutive convertible
debt); and (3) any other changes in income or expense resulting from the conversion of dilutive potential
ordinary shares (e.g., an entity’s contribution to its non-discretionary employee profit-sharing plan may be
revised based on changes in net profit due to the effects of items discussed above).
EBITDA Earnings/ (loss) before interest, taxation, depreciation and amortization. It is not an Ind-AS measure and is
defined as profit from operating activities before depreciation, amortization and exceptional items adjusted
for CSR costs, finance income (part of other income) and license fees on finance income.
EBITDA Margin It is computed by dividing EBITDA for the relevant period by total revenues for the relevant period.
EBIT EBITDA adjusted for depreciation and amortization.
Enterprise Valuation (EV) Calculated as sum of Market Capitalization, Net Debt and finance lease obligations as at the end of the
relevant period.
EV / EBITDA (times) For full year ended March 31 2018, 2019 and 2020, It is computed by dividing Enterprise Valuation as at the
end of the relevant period (EV) by EBITDA for the relevant period (LTM). For quarterly computation,
Computed by dividing Enterprise Valuation as at the end of the relevant period (EV) by annualized EBITDA
for the relevant period.
Finance Lease Obligation
(FLO)
Finance Lease Obligation represents present value of future obligation for assets taken on finance lease.
Gross Revenue per
Employee per month
It is computed by dividing the Gross Revenue (net of inter-segment eliminations) by the closing number of
employees in a given business unit and number of months in the relevant period.
Interest Coverage Ratio EBITDA for the relevant period divided by interest on borrowing for the relevant period.
Market Capitalization
Number of issued and outstanding shares as at end of the period multiplied by closing market price (BSE) as
at end of the period.
Mobile Broadband Base
stations
4G Data Customer
It includes all the 3G and 4G Base stations deployed across all technologies i.e. 900/1800/2100/2300 Mhz
bands.
A customer who used at least 1 MB on 4G network in the last 30 days.
Mobile Broadband
Towers
Minutes on the network
It means the total number of network towers (defined below) in which unique number of either 3G or 4G
Base stations are deployed, irrespective of their technologies. Total numbers of Mobile Broadband Towers
are subset of Total Network Towers.
Duration in minutes for which a customer uses the network. It is typically expressed over a period of one
month. It includes incoming, outgoing and in-roaming minutes.
Network Towers
Comprises of Base Transmission System (BTS) which holds the radio trans receivers (TRXs) that define a
cell and coordinates the radio links protocols with the mobile device. It includes all the Ground based, Roof
top and In Building Solutions as at the end of the period.
Net Debt It is not an Ind-AS measure and is defined as the long-term debt, net of current portion plus short-term
borrowings, current portion of long-term debt and lease liabilities minus cash and cash equivalents. The debt
origination cost and Bond fair value hedge are not included in the borrowings
Page 56 of 58
Net Debt to EBITDA
(Annualized)
For the full year ended March 31 2018,2019 and 2020, it is Computed by dividing net debt at the end of the
relevant period by EBITDA for the relevant period (LTM).For Quarterly computation, It is computed by
dividing net debt as at the end of the relevant period by EBITDA for the relevant period (annualized).
Net Debt to Funded
Equity Ratio
It is computed by dividing net debt as at the end of the relevant period by Equity attributable to equity holders
of parent as at the end of the relevant period.
Net Revenues It is not an Ind-AS measure and is defined as total revenues adjusted for access charges, cost of goods sold and license fees for the relevant period.
Operating Free Cash flow
It is computed by subtracting capex from EBITDA.
Personnel Cost per Employee per month
It is computed by dividing the Personnel Cost by the closing number of employees in a given business unit and number of months in the relevant period.
Price-Earnings Ratio – P/E Ratio
It is computed by dividing the closing market price (BSE) as at end of the relevant period by the earnings per basic share for the relevant period (LTM).
Profit / (Loss) after current tax expense
It is not an Ind-AS measure and is defined as Profit / (Loss) before taxation adjusted for current tax expense.
Return On Capital
Employed (ROCE)
For the full year ended March 31, 2018, 2019 and 2020, ROCE is computed by dividing the EBIT for the
period by the average (of opening & Closing) Capital employed. For the quarterly computation, it is computed
by dividing the EBIT(annualized for the relevant period) by average capital employed. Average capital
employed is calculated by considering average of opening and closing capital employed for the relevant
period).
Return On Equity (Post
Tax)
For the full year ended March 31, 2018, 2019 and 2020, it is computed by dividing net profit for the period by
the average (of opening and closing) Equity attributable to equity holders of parent. For the quarterly
computations, it is computed by dividing net profit for the preceding (last) 12 months from the end of the
relevant period by the average equity attributable to equity holders of parent (Average parent equity is
calculated by considering average of opening and closing parent equity for the relevant period).
Return On Equity (Pre
Tax)
For the full year ended March 31, 2018, 2019 and 2020, it is computed by dividing profit before tax & MI
(after exceptional items) for the period by the average (of opening and closing) total Equity. For the quarterly
computations, it is computed by dividing profit before tax & MI (after exceptional items) for the preceding
(last) 12 months from the end of the relevant period by the average total equity (Average total equity is
calculated by considering average of opening and closing total equity for the relevant period).
Revenue per Site per
month
Revenue per Site per month is computed by: dividing the total mobile revenues, excluding sale of goods (if
any) during the relevant period by the average sites; and dividing the result by the number of months in the
relevant period.
Sharing revenue per Sharing Operator per month
It is calculated on the basis of the total revenues less energy and other pass through accrued during the relevant period divided by the average number of co-locations for the period, determined on the basis of the opening and closing number of co-locations for the relevant period.
Submarine Cable Submarine cable system refers to owned cables and excludes cable capacity purchased on IRU.
Total Employees Total on-roll employees as at the end of respective period and excludes 42% of Indus Towers employees in India.
Total Equity Includes equity attributable to shareholders (both parent and non-controlling interest). Total MBs on Network Includes total MBs consumed on the network (uploaded & downloaded) on our network during the relevant
period.
Towers Infrastructure located at a site which is permitted by applicable law to be shared, including, but not limited to,
Page 57 of 58
the tower, shelter, diesel generator sets and other alternate energy sources, battery banks, air conditioners and electrical works. Towers as referred to are revenue generating Towers.
Total Operating Expenses
It is defined as sum of employee costs, network operations costs and selling, general and administrative cost
for the relevant period.
Voice Minutes of Usage per Customer per month
It is calculated by dividing the voice minutes of usage on our network during the relevant period by the average customers; and dividing the result by the number of months in the relevant period.
Regulatory & Others
3G
4G
Third - Generation Technology
Fourth - Generation Technology
BSE The Stock Exchange, Mumbai
RBI
GSM
Reserve Bank of India
Global System for Mobile Communications.
ICT Information and Communication Technology
GAAP Generally Accepted Accounting Principles
KYC Know Your Customer
IAS
International Accounting Standards
IFRS
International Financial Reporting Standards
Ind-AS
Indian Accounting Standards
NSE
The National Stock Exchange of India Limited.
Sensex Sensex is a stock index introduced by The Stock Exchange, Mumbai in 1986.
PPE Property, plant and equipment
VoIP Voice over Internet Protocol
SA South Asia
KPI Key Performance Indicator
LTM Last twelve month
FTTH Fiber-to-the home
VAS Value added service
MPLS Multi-Protocol Label Switching

Page 58 of 58
Written correspondence to be sent to:
Bharti Airtel Limited
Investor Relations [email protected]
http://www.airtel.in
Related Documents