
Welcome message from author
This document is posted to help you gain knowledge. Please leave a comment to let me know what you think about it! Share it to your friends and learn new things together.
Transcript


August 2015
INDEX
CONTENTS PAGE NO.
03
05
11
16
19
22
25
27
30
33
33
08
QUANTUM DYNAMIC BOND FUND - QDBF 14

Equity OutlookAtul Kumar- Head - Equity Funds
he S&P BSE Sensex during the month of August 2015 declined by 6.48% on total return basis as compared to July 2015 level. The Tbroader indices such as S&P BSE 200 and S&P BSE 500 performed
along similar lines with drop of 6.06% and 6.12% respectively. S&P BSE Mid Cap performed better on relative basis with a loss of 4.66%, whereas S&P BSE Small Cap index dropped 7.14% during the month. Decline in the market was largely due to international events, also supported by lack of reforms in India. The monsoon session was a nonstarter and policy making came to a halt in Parliament. Among the sectors, Healthcare and IT were the only indices which ended positive during the month. Metal, Telecom and Power were the sectors which underperformed the highest. Metals was a loser especially given the slowdown fears of China, and imports to India getting cheaper due to currency depreciation in some countries.
August has been the worst month in the current calendar year with outflows of USD 2.6 Bn. So far in the current year, FIIs have pumped in 4.47 Bn USD. DIIs were net buyers to the tune of USD 2.5 Bn during the month. MFs were buyers of USD 1.5 Bn whereas Insurance cos reversed position from being sellers earlier month. DIIs have bought USD 6.8 Bn worth stocks YTD. Indian rupee depreciated by 3.66% against US dollar during July month. The depreciation, while substantial, is on account of downward adjustment made by China for its currency yuan.
International markets remained focused on China problems during the month. China’s export growth had slowed considerably and so it reacted by resorting to a mild devaluation of its currency. Stock markets also are on a fall in China, which authorities are trying to control using money power as well as trying to fix blame on market participant individuals/firms. This is further exacerbating the issue. In other parts of the world, Greece is going through fresh elections to get a mandate for high level of fiscal prudence demanded of it. Last month, it accepted more bailout money and came out of the brink of exiting Eurozone.
On the other hand, US and UK are likely to increase interest rates in the near term in a departure from near zero interest rates since 2008. However many expect the US Central Bank to postpone rate hike in its meeting in September, given the fragile financial markets around the world. In all, the world equity markets are likely to remain volatile in the near term. Indian equity has also seen a big rise in volatility. A big equity market correction could be around the corner if US increases interest rate, or global scenario deteriorates, especially related to China and Greece.
GDP growth of India for the first quarter came in at 7%. Corporate profitability, however, doesn’t reflect high GDP growth. Sensex companies’ earnings grew in low single digit for the first quarter of fiscal 2016. An area of worry has been the monsoon deficit to the extent of approximate 10% this season compared to the long term average. This could impact the GDP growth as well as lead to lower rural consumption.
We remain optimistic about Indian equities in the long run. Recent market correction has made valuation of many stocks attractive. S&P BSE Sensex return has turned negative on a one year basis. Many foreign investors who bought on hopes of big bang reforms post elections are selling on being disappointed. Similarly, greater volatility in markets is throwing new stock opportunities. India is unlikely to be impacted economically much from the unfavorable situation in other parts of globe. In fact, it has been a beneficiary of fall in commodity and energy prices. Investors can look to add significantly to their weight in equity given above reasons.
Data Source: Bloomberg
Debt OutlookMr. Murthy Nagarajan - Head - Fixed Income
ebt markets were volatile in the month of August, due to RBI monetary policy, CPI inflation for July being lower than market Dexpectations, Chinese currency devaluation, and global equity
meltdown and currency depreciation.
RBI maintained status quo in its monetary policy on August 4, which was on expected lines. However, it changed its base line CPI inflation forecast to 6.2% vs 6.4% levels for the month of March 2016 in its forward guidance. The CPI inflation for the month of July was 3.78% levels versus market expectation of 4.40%. Food inflation which constitutes 48.2% of the CPI index was at 2.39%. All sub category of inflation showed a fall with core CPI inflation at 4.39 % levels. July CPI inflation reading which was released after RBI monetary policy should further lower the baseline CPI
thinflation expectations in the next monetary policy update on 29 September.
Commodity prices were volatile due to Chinese currency devaluation and PMI (Purchasing Managers’ Index, an indicator of the economic health of the manufacturing sector) data of China reading below 49.7. Any reading below 50 signals contraction. China cut its lending rates by 25 basis points, lending rates now stand at 4.6 vs 4.85, it also cut its reserve requirement from 18.5% to 18% levels. The ongoing correction in China is expected to keep commodity prices low. Oil prices are expected to remain soft as supply is expected to increase due to sanctions restriction being removed against Iran. All these developments are positive for India, as India is a net importer of commodity.
The Indian rupee depreciated due to Chinese devaluing its currency by 3.5% during the month of August 2015. The fall in currency was also attributed to the fall in Indian equity market which led to an outflow of 2.6 billion USD from the Indian equity markets. Rupee has dropped from to a low of 66.25 against the USD from 63.75 USD prevailing in the month of July. However, the fall in currency is lower than other emerging market currencies which depreciated sharply after Yuan devaluation. The rupee is expected to trade in the band of 65 to 67 against the dollar. This is due to expectation of lower capital inflows due to expected interest rate hike in US and the comparatively rich valuation of Indian equities compared with global markets. The factors positive for the rupee are: fall in Gold prices for the last one year which has reduced speculative demand for this metal; current account deficit which is expected to be around 20 billion USD for the current financial year. This can easily be funded by Foreign Direct Investments (FDI) even if portfolio flows are stagnant. FDI flows were 34 billion USD last year; more stable flows are expected to continue in the current year also. Current account deficit would be funded without recourse to Foreign Portfolio flows which are more volatile.
The call money market is trading in surplus mode due to government spending; government spending has led to fiscal deficit touching ̀ 3,85,103 crores, which is 69.6% of the full year target. RBI has transferred ` 65,896 crores to the government, which has also created additional liquidity in the system. Government has spent ` 6,00,103 crores, which is about 34% of the total expenditure budgeted of ` 17,77,477 crores*. The government spending going forward is expected to slow down as the government would like to achieve its fiscal deficit target of 3.9% of GDP. Credit growth is also expected to pick up from the 8.4% levels year-on-year growth due to busy season and lowering of lending rates by the commercial banks. This would allow the call rates to come back to repo mode in the second half of the year.
For the current month, we expect the bond market to trade on a bullish note. Advanced GDP estimates are at 7% levels against the expectation of 7.5% levels. The government and RBI have projected GDP
QUANTUM VIEW FOR AUGUST 2015
QUANTUM VIEWAugust 2015 3
growth to be around 7.5 to 8% levels for the current financial year. The August CPI reading is expected to be around 3.5% levels. The progress of monsoon is in deficit of 10% versus the long term average of 10 years, which is a cause of concern. The other negative is expectation of the US Federal Reserve raising rates in its September 17 policy. Data in the U.S. has been positive with employment addition of 2 lakh on a monthly basis, U.S. GDP growth for the March–June quarter is at 3.7% levels.
RBI is expected to give more weightage to the domestic factors. The effect of poor monsoon has not translated into price increase yet as the government has proactively imposed stock holding limits and resorted to import of 10,000 tons of onion. The government is also importing tur dal and moog dal of 5,000 tons each to reduce pulse inflation. The WPI inflation was at 4.05% levels continuing its negative trend for the last 9 months due to the ongoing global slowdown.
thWe expect RBI to cut rates by 25 basis points in the 29 September monetary policy and another 25 basis points in the current financial year. We expect the ten year Government security yields to trade in the range of 7.50-7.75% during the month of September.
Data Source: Bloomberg, RBI * Controller General of Accounts, Ministry of Finance
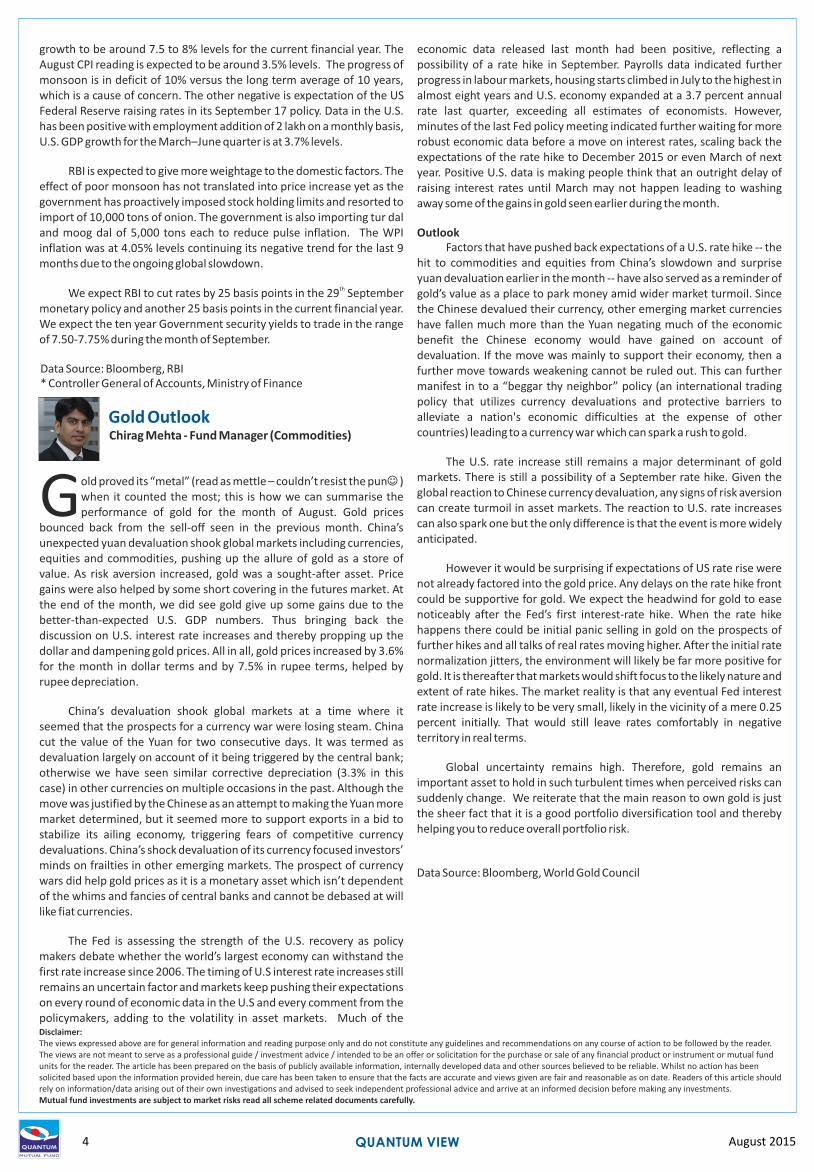
Chirag Mehta - Fund Manager (Commodities)
old proved its “metal” (read as mettle – couldn’t resist the pun ) when it counted the most; this is how we can summarise the Gperformance of gold for the month of August. Gold prices
bounced back from the sell-off seen in the previous month. China’s unexpected yuan devaluation shook global markets including currencies, equities and commodities, pushing up the allure of gold as a store of value. As risk aversion increased, gold was a sought-after asset. Price gains were also helped by some short covering in the futures market. At the end of the month, we did see gold give up some gains due to the better-than-expected U.S. GDP numbers. Thus bringing back the discussion on U.S. interest rate increases and thereby propping up the dollar and dampening gold prices. All in all, gold prices increased by 3.6% for the month in dollar terms and by 7.5% in rupee terms, helped by rupee depreciation.
China’s devaluation shook global markets at a time where it seemed that the prospects for a currency war were losing steam. China cut the value of the Yuan for two consecutive days. It was termed as devaluation largely on account of it being triggered by the central bank; otherwise we have seen similar corrective depreciation (3.3% in this case) in other currencies on multiple occasions in the past. Although the move was justified by the Chinese as an attempt to making the Yuan more market determined, but it seemed more to support exports in a bid to stabilize its ailing economy, triggering fears of competitive currency devaluations. China’s shock devaluation of its currency focused investors’ minds on frailties in other emerging markets. The prospect of currency wars did help gold prices as it is a monetary asset which isn’t dependent of the whims and fancies of central banks and cannot be debased at will like fiat currencies.
The Fed is assessing the strength of the U.S. recovery as policy makers debate whether the world’s largest economy can withstand the first rate increase since 2006. The timing of U.S interest rate increases still remains an uncertain factor and markets keep pushing their expectations on every round of economic data in the U.S and every comment from the policymakers, adding to the volatility in asset markets. Much of the
Gold Outlook
J
economic data released last month had been positive, reflecting a possibility of a rate hike in September. Payrolls data indicated further progress in labour markets, housing starts climbed in July to the highest in almost eight years and U.S. economy expanded at a 3.7 percent annual rate last quarter, exceeding all estimates of economists. However, minutes of the last Fed policy meeting indicated further waiting for more robust economic data before a move on interest rates, scaling back the expectations of the rate hike to December 2015 or even March of next year. Positive U.S. data is making people think that an outright delay of raising interest rates until March may not happen leading to washing away some of the gains in gold seen earlier during the month.
OutlookFactors that have pushed back expectations of a U.S. rate hike -- the
hit to commodities and equities from China’s slowdown and surprise yuan devaluation earlier in the month -- have also served as a reminder of gold’s value as a place to park money amid wider market turmoil. Since the Chinese devalued their currency, other emerging market currencies have fallen much more than the Yuan negating much of the economic benefit the Chinese economy would have gained on account of devaluation. If the move was mainly to support their economy, then a further move towards weakening cannot be ruled out. This can further manifest in to a “beggar thy neighbor” policy (an international trading policy that utilizes currency devaluations and protective barriers to alleviate a nation's economic difficulties at the expense of other countries) leading to a currency war which can spark a rush to gold.
The U.S. rate increase still remains a major determinant of gold markets. There is still a possibility of a September rate hike. Given the global reaction to Chinese currency devaluation, any signs of risk aversion can create turmoil in asset markets. The reaction to U.S. rate increases can also spark one but the only difference is that the event is more widely anticipated.
However it would be surprising if expectations of US rate rise were not already factored into the gold price. Any delays on the rate hike front could be supportive for gold. We expect the headwind for gold to ease noticeably after the Fed’s first interest-rate hike. When the rate hike happens there could be initial panic selling in gold on the prospects of further hikes and all talks of real rates moving higher. After the initial rate normalization jitters, the environment will likely be far more positive for gold. It is thereafter that markets would shift focus to the likely nature and extent of rate hikes. The market reality is that any eventual Fed interest rate increase is likely to be very small, likely in the vicinity of a mere 0.25 percent initially. That would still leave rates comfortably in negative territory in real terms.
Global uncertainty remains high. Therefore, gold remains an important asset to hold in such turbulent times when perceived risks can suddenly change. We reiterate that the main reason to own gold is just the sheer fact that it is a good portfolio diversification tool and thereby helping you to reduce overall portfolio risk.
Data Source: Bloomberg, World Gold Council
QUANTUM VIEW August 2015
Disclaimer: The views expressed above are for general information and reading purpose only and do not constitute any guidelines and recommendations on any course of action to be followed by the reader. The views are not meant to serve as a professional guide / investment advice / intended to be an offer or solicitation for the purchase or sale of any financial product or instrument or mutual fund units for the reader. The article has been prepared on the basis of publicly available information, internally developed data and other sources believed to be reliable. Whilst no action has been solicited based upon the information provided herein, due care has been taken to ensure that the facts are accurate and views given are fair and reasonable as on date. Readers of this article should rely on information/data arising out of their own investigations and advised to seek independent professional advice and arrive at an informed decision before making any investments. Mutual fund investments are subject to market risks read all scheme related documents carefully.
4

Scheme FeaturesNature of Scheme Open-ended Equity Scheme
Investment Objective
Benchmark Index S&P BSE 30 Total Return IndexFund Manager Mr. Atul Kumar ~ ( Since November 15, 2006)Fund Manager’s Total Experience 14 yrs.Associate Fund Manager Mr. Nilesh Shetty (Since March 28, 2011)
Total Experience 10 yrs.
Inception Date (Date of Allotment) 13-Mar-06
Current Expense Ratio 1.25%
Investment Options
Minimum Application Amount ( Under each Option)
Declaration of Net Asset Value (NAV) Every Business Day
Redemption Proceeds
An Open ended Equity Scheme
Rs.
QUANTUM LONG TERM EQUITY FUND
The investment objective of the Scheme is to achieve long-term capital appreciation by investing primarily in shares of companies that will typically be included in the S&P BSE 200 Index and are in a position to benefit from the anticipated growth and development of the Indian economy and its markets.
Ÿ Long term capital appreciation.
Ÿ Investments in equity and equity related securities of companies in
S&P BSE 200 index.
Ÿ High Risk (BROWN)
Growth & Dividend (Dividend Option will in turn have two Facilities, Dividend Payout Facility and Dividend Re-investment Facility)
Purchase : ` 500/- and in multiples of ` 1/- thereafter.
Additional Purchase : ` 500/- and in multiples of ` 1/- thereafter/ 50 units.
Entry/ Sales Load
Exit Load
*Investors should consult their financial advisers if in doubt about whether the product is suitable for them.
Not ApplicableUpfront commission to distributors will be paid by the investor directly to the distributor, based on his assessment of various factors including the service rendered by the distributor.
Repurchase/ Redemption/Switch Out -On or before 180 days from the date of allotment 4.00%,after 180 days but on or before 365 days from the date of allotment 3.00%,after 365 days but on or before 545 days from the date of allotment 2.00%,after 545 days but on or before 730 days from the date of allotment 1.00%,after 730 days from the date of allotment Nil
NAV per
Unit (`)
Growth Option 36.38
Dividend Option 36.69
*Cumulative Daily AuM /No of days in the month #AuM as on 31, 2015August
Fund Size as on August 2015 *Average AUM
(` in crores)
#Absolute AUM
(` in crores)(as of August 31, 2015)
NAV
#Taxation Tax on Long Term Capital Gains - Nil
Tax on Short Term Capital Gains - 15%
QUANTUM LONG TERM EQUITY FUND
Normally despatched within 3-4 Business Days.
TRANSACTION CHARGES: In accordance with the SEBI Circular No.Cir / IMD / DF/13/2011 dated August 22, 2011, the AMC is allowed to deduct transaction charges of 100 for existing investors and 150 for a first time investor per subscription of ` 10,000 /- and above for the transaction / application received through distributors. The transaction charges shall be deducted by the AMC from the subscription amount received from the investor and paid to the distributor and the balance will be invested in the Scheme. Investors are requested to note that Quantum Mutual Fund is a direct to investor’s Mutual Fund and no transaction charges shall be deducted from the investment amount for transactions / applications received from the distributor and full subscription amount will be invested in the Scheme.
` `
An Open-ended Equity Scheme
The investment objective of the Scheme is to achieve long-term capital appreciation by investing primarily in shares of companies that will typically be included in the S&P BSE 200 Index and are in a position to benefit from the anticipated growth and development of the Indian economy and its markets.
S&P BSE 30 Total Return Index
Mr. Atul Kumar ~ ( Since November 15, 2006)
16 yrs.
Mr. Nilesh Shetty (Since March 28, 2011)
12 yrs.
13-Mar-06
1.25%
Every Business Day
Rs.
Growth & Dividend (Dividend Option will in turn have two Facilities, Dividend Payout Facility and Dividend Re-investment Facility)
Purchase : ` 500/- and in multiples of ` 1/- thereafter.
Additional Purchase : ` 500/- and in multiples of ` 1/- thereafter/ 50 units.
#The mentioned Tax Rates shall be increased by applicable surcharge, if any Education Cess @ 2% and Secondary higher education cess @ 1% where ever as applicable. Equity oriented schemes will also attract Securities Transaction Tax (STT) @ 0.001% at the time of redemption and switch to other schemes.
August 2015 5
Growth Option 399.05 384.20
Dividend Option 34.69 33.13
Total 433.74 417.33
Name of the Scheme This product is suitable for investors who are seeking*
Quantum Long Term Equity Fund(An Open-ended Equity Scheme)
• Long term capital appreciation and current income• Investments in equity and equity related securities of
companies in S&P BSE 200 index.
Product Labeling
LOW HIGH
Hig
hLo
w
derao teM Moderately
High
Investors understand that their principal will be at Moderately High Risk
Riskometer

NAV per Unit
( )̀
Scheme
Returns (%) ^
Benchmark
Returns (%) #
Additional
Benchmark
Returns (%) ##
Value of Investment of ` 10,000@
Scheme (`) Benchmark
(`) #
Additional
Benchmark
(`) ##
PeriodDate
30-Jun-14 Last 1 Year 35.1000 9.74 10.96 9.31 10,974 11,096 10,931
28-Jun-13 Last 2 Years 24.2900 25.85 21.36 19.62 15,858 14,744 14,323
29-Jun-12 Last 3 Years 22.1300 20.27 18.58 16.79 17,406 16,682 15,939
Quantum Long Term Equity Fund Performance as on June 30, 2015
B. Discrete 12 month performance %
^ Past performance may or may not be sustained in the future. Load is not taken into consideration and Returns are for Growth Option.
Returns up to 1 year period are Absolute Returns. Returns greater than 1 year period are compounded annualized (CAGR).
# S&P BSE 30 TRI ## S&P BSE Sensex @ shows the current value of ` 10,000/- invested at the beginning of a given period
** Inception Date: March 13, 2006. Since inception returns are calculated on NAV of 10 invested at inception.`
^^Standard Deviation: 19.12% Beta: 0.70 Sharpe Ratio: 0.88
Past performance may or may not be sustained in the future. # S&P BSE 30 TRI ## S&P BSE Sensex.
Load is not taken into consideration and Returns are for Growth Option using applicable NAV on the SIP day (5th of every month). Return on
SIP and Benchmark are annualized and compounded investment return for cash flows resulting out of uniform and regular monthly
subscriptions as on 5th day of every month (in case 5th is a non-Business Day, then the next Business Day) and have been worked out using
the Excel spreadsheet function known as XIRR. XIRR calculates the internal rate of return for series of cash flow. Assuming .̀ 1,000 invested
every month on 5th day of every month (in case 5th is a non-Business Day, then the next Business Day), the 1 year, 3 years, 5 years and since
inception returns from SIP are annualized and compounded investment return computed on the assumption that SIP installments were
received across the time periods from the start date of SIP from the end of the relevant period viz. 1 year, 3 years, 5 years and since Inception.
*XIRR - XIRR calculates the internal rate of return to measure and compare the profitability of series of investments.
The Scheme is co-managed by Atul Kumar and Nilesh Shetty. ~ Other schemes managed by Mr. Atul Kumar refer page no. 30 SCHEME PERFORMANCE (FUND MANAGER-WISE)
Brokerage & Commissions Paid
Brokerages Paid for investments for August 2015 ` 2,38,169.08
Distributor Commissions Paid till date NIL
QUANTUM LONG TERM EQUITY FUND
A. Cumulative performance
Scheme ^(%) Benchmark (%) # Additional
Benchmark (%) ##
Scheme (`) Benchmark
#(`)
Additional
Benchmark
##(`)
Period V a l u e o f I n v e s t m e n t o f ` 1 0 , 0 0 0 @
June 30, 2014 to June 30, 2015 9.74 10.96 9.31 10,974 11,096 10,931
June 28, 2013 to June 30, 2014 44.50 32.87 31.03 14,450 13,287 13,103
June 29, 2012 to June 28, 2013 9.76 13.15 11.28 10,976 11,315 11,128
Since Inception ** 15.59 12.31 10.68 38,520 29,456 25,714
SIP Performance of Quantum Long Term Equity Fund as on June 30, 2015
Since Inception SIP 5 Year SIP 3 Year SIP 1 Year SIP
Total Amount Invested (Rs.‘000) 111 60 36 12
Mkt Value as on June 30, 15 (Rs.‘000) 246.041 91.284 48.660 12.304
Returns (XIRR*) (%) 16.57 16.90 20.79 4.87
Benchmark Returns (XIRR*) (%) # 12.47 14.76 18.25 3.41
Additional Benchmark Returns (XIRR*) (%) ## 10.86 13.06 16.59 1.79
August 2015 6
^ Past performance may or may not be sustained in the future. Load is not taken into consideration and Returns are for Growth Option.
Returns up to 1 year period are Absolute Returns. Returns greater than 1 year period are compounded annualized (CAGR).
# S&P BSE 30 TRI ## S&P BSE Sensex @ shows the current value of ` 10,000/- invested at the beginning of a given period

Portfolio as on 31 August, 2015Name of Instrument Quantity Market
Value In Lakhs
% to Net Asset
EQUITY & EQUITY RELATED
A) Listed /Awaiting listing on the Stock Exchange
Industry / Rating
* Cash & Cash Equivalents
^^Portfolio Turnover Ratio (Last one year): 5.68%
Industry Allocation (% of Net Assets) as on August 31, 2015
1. Bajaj Auto Ltd Auto 1,37,102 3,061.08 7.332. Infosys Ltd Software 2,74,022 2,998.90 7.193. Hero MotoCorp Ltd Auto 1,13,355 2,717.35 6.514. Housing Development Finance Corporation Ltd Finance 2,07,342 2,459.39 5.895. Tata Consultancy Services Ltd Software 87,624 2,246.72 5.386. Tata Chemicals Ltd Chemicals 4,31,646 1,725.72 4.147. Indian Oil Corporation Ltd Petroleum Products 4,07,489 1,688.84 4.058. NTPC Ltd Power 12,96,265 1,574.31 3.779. Kotak Mahindra Bank Ltd Banks 2,37,408 1,547.19 3.7110. Oil & Natural Gas Corporation Ltd Oil 5,78,095 1,383.38 3.3111. Petronet LNG Ltd Gas 7,56,155 1,341.80 3.2212. State Bank of India Banks 5,40,364 1,336.59 3.2013. Tata Motors Ltd Auto 3,71,963 1,265.23 3.0314. ACC Ltd Cement 92,292 1,231.96 2.9515. Power Grid Corporation of India Ltd Power 9,13,744 1,193.81 2.8616. Exide Industries Ltd Auto Ancillaries 7,71,443 1,184.94 2.8417. The Indian Hotels Company Ltd Hotels, Resorts And Other Recreational Activities 13,46,807 1,171.72 2.8118. Gail (India) Ltd Gas 3,61,860 1,071.47 2.5719. Bharti Airtel Ltd Telecom - Services 3,01,919 1,069.70 2.5620. Maruti Suzuki India Ltd Auto 23,687 987.08 2.3721. Tata Steel Ltd Ferrous Metals 4,02,185 906.52 2.1722. PTC India Ltd Power 13,77,351 825.72 1.9823. Voltas Ltd Construction Project 2,73,298 745.97 1.7924. The Indian Hotels Company Ltd - CCD - 05/03/2016 Hotels, Resorts And Other Recreational Activities 2,82,165 223.19 0.5325. Wipro Ltd Software 38,730 221.46 0.53B) Unlisted NIL NIL NILTotal of all Equity 36,180.04 86.69MONEY MARKET INSTRUMENTS A) Treasury Bills (T-Bill)1. 182 Days Tbill (MD 03/12/2015) Sovereign 50,000 49.07 0.12Total of T-Bills 49.07 0.12B) Collateralised Borrowing & Lending Obligation (CBLO) * 5,907.60 14.16Total of Money Market Instruments 5,956.67 14.28Net Receivable/(payable) -403.46 -0.97Grand Total 41,733.25 100.00
^^ DefinitionsStandard deviation measures historical volatility. A high standard deviation suggests high volatility, while lower standard deviation would refer to more stability.Beta is the tendency of a fund's returns to respond to market swings. A beta of 1 indicates that the fund price will move with the market. A beta of less than 1 means that thesecurity willbe less volatile than the market. A beta of greater than 1 indicates that the security's price will be more volatile than the market.Sharpe Ratio is used to characterise how well the return of an asset compensates the investor for the risk taken. The greater a portfolio's Sharpe ratio, the better its risk-adjustedperformance has been.Portfolio Turnover Ratio is the percentage of a funds assets that have changed over the course of a year.
QUANTUM LONG TERM EQUITY FUND 7August 2015
1.79%
2.17%
2.56%
2.84%
2.95%
3.31%
3.34%
4.05%
4.14%
5.79%
5.89%
6.91%
8.61%
13.10%
19.24%
0% 5% 10% 15% 20% 25%
Construction Project
Ferrous Metals
Telecom - Services
Auto Ancillaries
Cement
Oil
Hotels, Resorts And Other Recreational Activities
Petroleum Products
Chemicals
Gas
Finance
Banks
Power
Software
Auto

QUANTUM TAX SAVING FUND
Scheme FeaturesNature of Scheme An
3 years
Open-ended Equity Linked Savings Scheme with a lock-in period of
Investment Objective
Benchmark Index S&P BSE 30 Total Return Index
Fund Manager Mr. Atul Kumar ~ ( Since December 10, 2008)
Fund Manager’s Total Experience 16 yrs.
Inception Date (Date of Allotment) December 23, 2008
Current Expense Ratio 1.25%
Investment Options
Minimum Application Amount ( Under each Option)
Declaration of Net Asset Value (NAV) Every Business Day
Redemption Proceeds Normally despatched within 3-4 Business Days.
QUANTUM TAX SAVING FUND
Purchase: ` 500/- and in multiples of ` 500/- thereafter. Additional Purchase: ` 500/- and in multiples of ` 500/- thereafter.
Entry/ Sales Load
Exit Load
* Investors should consult their financial advisers if in doubt about whether the product is suitable for them.
Nil
The investment objective of the Scheme is to achieve long-term capital appreciation by investing primarily in shares of companies that will typically be included in the S&P BSE 200 Index and are in a position to benefit from the anticipated growth and development of the Indian economy and its markets.
Growth & Dividend
Not Applicable
Upfront commission to distributors will be paid by the investor directly to the distributor, based on his assessment of various factors including the service rendered by the distributor.
Taxation# Tax on Long Term Capital Gains - Nil
Tax on Short Term Capital Gains - 15%
NAV per
Unit (`)
Growth Option 35.88
Dividend Option 35.88
Fund Size as on August 2015 *Average AUM
(` in crores)
#Absolute AUM
(` in crores)(as of August 31, 2015)
NAV
An open ended Equity Linked Saving Scheme with a lock-in period of three years
*Cumulative Daily AuM /No of days in the month #AuM as on August 31, 2015
TRANSACTION CHARGES: In accordance with the SEBI Circular No.Cir / IMD / DF/13/2011 dated August 22, 2011, the AMC is allowed to deduct transaction charges of 100 for existing investors and 150 for a first time investor per subscription of ` 10,000 /- and above for the transaction / application received through distributors. The transaction charges shall be deducted by the AMC from the subscription amount received from the investor and paid to the distributor and the balance will be invested in the Scheme. Investors are requested to note that Quantum Mutual Fund is a direct to investor’s Mutual Fund and no transaction charges shall be deducted from the investment amount for transactions / applications received from the distributor and full subscription amount will be invested in the Scheme.
` `
Lock-in Period 3 years from the date of allotment of the respective Units
8
Growth Option 29.64 28.62
Dividend Option 5.19 4.97
Total 34.83 33.59
Quantum Tax Saving Fund(An Open-ended Equity Linked Savings Scheme)
• Long term capital appreciation• Investments in equity and equity related securities of
companies in S&P BSE 200 index and to save tax u/s 80 C of the Income Tax Act. Investments in this product are subject to lock in period of 3 years.
Product Labeling
Riskometer
#The mentioned Tax Rates shall be increased by applicable surcharge, if any Education Cess @ 2% and Secondary higher education cess @ 1% where ever as applicable. Equity oriented schemes will also attract Securities Transaction Tax (STT) @ 0.001% at the time of redemption and switch to other schemes.
LOW HIGH
Hig
hLo
w
derao teM Moderately
High
Investors understand that their principal will be at Moderately High Risk
Name of the Scheme This product is suitable for investors who are seeking*
August 2015

SIP Performance of Quantum Tax Saving Fund as on June 30, 2015
Since Inception SIP 5 Year SIP 3 Year SIP 1 Year SIP
Total Amount Invested (Rs.‘000) 78 60 36 12
Mkt Value as on June 30, 15 (Rs.‘000) 138.808 90.939 48.532 12.237
Returns (XIRR*) (%) 17.58 16.75 20.60 3.79
Benchmark Returns (XIRR*) (%) # 14.68 14.76 18.25 3.41
Additional Benchmark Returns (XIRR*) (%) ## 12.94 13.06 16.59 1.79
Scheme ^(%) Benchmark (%) # Additional
Benchmark (%) ##
Scheme (`) Benchmark
#(`)
Additional
Benchmark
##(`)
Period V a l u e o f I n v e s t m e n t o f ` 1 0 , 0 0 0 @
June 30, 2014 to June 30, 2015 9.69 10.96 9.31 10,969 11,096 10,931
June 28, 2013 to June 30, 2014 44.34 32.87 31.03 14,434 13,287 13,103
June 29, 2012 to June 28, 2013 9.64 13.15 11.28 10,964 11,315 11,128
Since Inception ** 22.73 19.29 17.53 38,040 31,599 28,679
NAV per Unit
( )̀
Scheme
Returns (%) ^
Benchmark
Returns (%) #
Additional
Benchmark
Returns (%) ##
Value of Investment of ` 10,000@
Scheme (`) Benchmark
(`) #
Additional
Benchmark
(`) ##
PeriodDate
30-Jun-14 Last 1 Year 34.6800 9.69 10.96 9.31 10,969 11,096 10,931
28-Jun-13 Last 2 Years 24.0270 25.75 21.36 19.62 15,832 14,744 14,323
29-Jun-12 Last 3 Years 21.9140 20.16 18.58 16.79 17,359 16,682 15,939
Quantum Tax Saving Fund Performance as on June 30, 2015
^^Standard Deviation: 15.12% Beta: 0.66 Sharpe Ratio: 1.64
Past performance may or may not be sustained in the future. # S&P BSE 30 TRI ## S&P BSE Sensex.
Load is not taken into consideration and Returns are for Growth Option using applicable NAV on the SIP day (5th of every month). Return on
SIP and Benchmark are annualized and compounded investment return for cash flows resulting out of uniform and regular monthly
subscriptions as on 5th day of every month (in case 5th is a non-Business Day, then the next Business Day) and have been worked out using
the Excel spreadsheet function known as XIRR. XIRR calculates the internal rate of return for series of cash flow. Assuming .̀ 1,000 invested
every month on 5th day of every month (in case 5th is a non-Business Day, then the next Business Day), the 1 year, 3 years, 5 years and since
inception returns from SIP are annualized and compounded investment return computed on the assumption that SIP installments were
received across the time periods from the start date of SIP from the end of the relevant period viz. 1 year, 3 years, 5 years and since Inception.
*XIRR - XIRR calculates the internal rate of return to measure and compare the profitability of series of investments.
QUANTUM TAX SAVING FUND
Brokerage & Commissions Paid
Brokerages Paid for investments for August 2015 14,101.89
Distributor Commissions Paid till date NIL
`
A. Cumulative performance
B. Discrete 12 month performance %
^ Past performance may or may not be sustained in the future. Load is not taken into consideration and Returns are for Growth Option.
Returns up to 1 year period are Absolute Returns. Returns greater than 1 year period are compounded annualized (CAGR).
# S&P BSE 30 TRI ## S&P BSE Sensex @ shows the current value of ` 10,000/- invested at the beginning of a given period
** Inception Date: Dec 23, 2008. Since inception returns are calculated on NAV of 10 invested at inception.`
~ Other schemes managed by Mr. Atul Kumar refer page no. 30 SCHEME PERFORMANCE (FUND MANAGER-WISE)
9
^ Past performance may or may not be sustained in the future. Load is not taken into consideration and Returns are for Growth Option.
Returns up to 1 year period are Absolute Returns. Returns greater than 1 year period are compounded annualized (CAGR).
# S&P BSE 30 TRI ## S&P BSE Sensex @ shows the current value of ` 10,000/- invested at the beginning of a given period
August 2015

Portfolio as on , 2015August 31Name of Instrument Quantity Market
Value In Lakhs
% to Net Asset
Industry
^^Portfolio Turnover Ratio (Last one year): 5.58%
Industry Allocation (% of Net Assets) as on August 31, 2015
^^ DefinitionsStandard deviation measures historical volatility. A high standard deviation suggests high volatility, while lower standard deviation would refer to more stability.Beta is the tendency of a fund's returns to respond to market swings. A beta of 1 indicates that the fund price will move with the market. A beta of less than 1 means that thesecurity willbe less volatile than the market. A beta of greater than 1 indicates that the security's price will be more volatile than the market.Sharpe Ratio is used to characterise how well the return of an asset compensates the investor for the risk taken. The greater a portfolio's Sharpe ratio, the better its risk-adjustedperformance has been.Portfolio Turnover Ratio is the percentage of a funds assets that have changed over the course of a year.
EQUITY & EQUITY RELATED
A) Listed /Awaiting listing on the Stock Exchange
1. Infosys Ltd Software 21,946 240.18 7.15
2. Bajaj Auto Ltd Auto 10,580 236.22 7.03
3. Hero MotoCorp Ltd Auto 8,635 207.00 6.16
4. Housing Development Finance Corporation Ltd Finance 16,683 197.89 5.89
5. Tata Consultancy Services Ltd Software 6,959 178.43 5.31
6. Tata Chemicals Ltd Chemicals 34,995 139.91 4.16
7. Indian Oil Corporation Ltd Petroleum Products 32,232 133.59 3.98
8. Kotak Mahindra Bank Ltd Banks 18,522 120.71 3.59
9. NTPC Ltd Power 93,757 113.87 3.39
10. ACC Ltd Cement 8,519 113.72 3.39
11. Power Grid Corporation of India Ltd Power 86,297 112.75 3.36
12. Petronet LNG Ltd Gas 60,977 108.20 3.22
13. State Bank of India Banks 43,354 107.24 3.19
14. Oil & Natural Gas Corporation Ltd Oil 43,690 104.55 3.11
15. Tata Motors Ltd Auto 29,779 101.29 3.02
16. The Indian Hotels Company Ltd Hotels, Resorts And Other Recreational Activities 1,05,286 91.60 2.73
17. Exide Industries Ltd Auto Ancillaries 57,875 88.90 2.65
18. Bharti Airtel Ltd Telecom - Services 24,106 85.41 2.54
19. Gail (India) Ltd Gas 27,670 81.93 2.44
20. Tata Steel Ltd Ferrous Metals 31,681 71.41 2.13
21. Maruti Suzuki India Ltd Auto 1,704 71.01 2.11
22. PTC India Ltd Power 1,08,325 64.94 1.93
23. Voltas Ltd Construction Project 21,901 59.78 1.78
24. Wipro Ltd Software 6,025 34.45 1.03
25. The Indian Hotels Company Ltd - CCD - 05/03/2016 Hotels, Resorts And Other Recreational Activities 23,689 18.74 0.56
B) Unlisted NIL NIL NIL
Total of all Equity 2,883.72 85.85
Collateralised Borrowing & Lending Obligation (CBLO) * 493.18 14.68
Net Receivable/(Payable) -17.55 -0.53
Grand Total 3,359.35 100.00
* Cash & Cash Equivalents
QUANTUM TAX SAVING FUND10 August 2015
1.78%
2.13%
2.54%
2.65%
3.11%
3.29%
3.39%
3.98%
4.16%
5.66%
5.89%
6.78%
8.68%
13.49%
18.32%
0% 2% 4% 6% 8% 10% 12% 14% 16% 18% 20%
Construction Project
Ferrous Metals
Telecom - Services
Auto Ancillaries
Oil
Hotels, Resorts And Other Recreational ActivitiesCement
Petroleum Products
Chemicals
Gas
Finance
Banks
Power
Software
Auto

Scheme FeaturesNature of Scheme An Open-ended Equity Fund of Funds Scheme
Investment Objective
Benchmark Index S&P BSE 200 Index
Fund Manager Mr. Chirag Mehta ~ (Since November 1, 2013)
Fund Manager’s Total Experience 11 yrs.
Inception Date (Date of Allotment) July 20, 2009
Current Expense Ratio 0.50%
Investment Options
Minimum Application Amount ( Under each Option)
Declaration of Net Asset Value (NAV) Every Business Day
Redemption Proceeds Normally despatched within 3-4 Business Days.
QUANTUM EQUITY FUND OF FUNDS
Purchase: ` 500/- and in multiples of ` 1/- thereafter. Additional Purchase: ` 500/- and in multiples of ` 1/- thereafter/ 50 units
Entry/ Sales Load
Exit Load
* Investors should consult their financial advisers if in doubt about whether the product is suitable for them.
Repurchase/ Redemption/ Switch Out - On or before 365 days from the date of allotment 1.5 %.
The investment objective of the scheme is to generate long-term capital appreciation by investing in a portfolio of open-ended diversified equity schemes of mutual funds registered with SEBI. There can be no assurance of positive returns from following the stated investment strategy.
Growth & Dividend (Dividend Option will in turn have two Facilities,Dividend Payout Facility and Dividend Re-investment Facility)
Not Applicable
Upfront commission to distributors will be paid by the investor directly to the distributor, based on his assessment of various factors including the service rendered by the distributor.
QUANTUM EQUITY FUND OF FUNDS
FII’s / Overseas Financial Organisations
Partnership Firm Non Resident IndiansIndian
CompaniesForeign Companies
Long Term 20% with Indexation 10% without Indexation20% with
Indexation
10% without Indexation (on transfer
of long term capital assets being
unlisted securities)
20% with
Indexation
10% without Indexation (on
transfer of long term capital
assets being unlisted securities)
Short Term Maximum 30% 30% 30% Maximum 30% 30% 40%
An Open ended Equity Fund of Funds Scheme
Resident Individuals & HUFTax on Capital Gains *
TRANSACTION CHARGES: In accordance with the SEBI Circular No.Cir / IMD / DF/13/2011 dated August 22, 2011, the AMC is allowed to deduct transaction charges of 100 for existing investors and 150 for a first time investor per subscription of ` 10,000 /- and above for the transaction / application received through distributors. The transaction charges shall be deducted by the AMC from the subscription amount received from the investor and paid to the distributor and the balance will be invested in the Scheme. Investors are requested to note that Quantum Mutual Fund is a direct to investor’s Mutual Fund and no transaction charges shall be deducted from the investment amount for transactions / applications received from the distributor and full subscription amount will be invested in the Scheme.
` `
* The mentioned Tax Rates shall be increased by applicable surcharge, if any Education Cess @ 2% and Secondary higher education cess @ 1% where ever as applicable.
11
NAV per
Unit (`)
Growth Option 24.530
Dividend Option 24.530
(as of August 31, 2015)
NAV Fund Size as on August 2015 *Average AUM
(` in crores)
#Absolute AUM
(` in crores)
*Cumulative Daily AuM /No of days in the month #AuM as on August 31, 2015
Growth Option 4.93 4.90
Dividend Option 0.75 0.74
Total 5.68 5.64
Name of the Scheme This product is suitable for investors who are seeking*
Quantum Equity Fund of Funds(An Open-ended Equity Fund of Funds Scheme)
• Long term capital appreciation• Investments in portfolio of open-ended diversified equity schemes of mutual funds registered with SEBI whose underlying investments are in equity and equity related securities of diversified companies
Product Labeling
Riskometer
LOW HIGH
Hig
hLo
w
derao teM Moderately
High
Investors understand that their principal will be at Moderately High Risk
August 2015

SIP Performance of Quantum Equity Fund of Funds as on June 30, 2015
Since Inception SIP 5 Year SIP 3 Year SIP 1 Year SIP
Total Amount Invested (Rs.‘000) 71 60 36 12
Mkt Value as on June 30, 15 (Rs.‘000) 119.631 96.968 52.915 12.670
Returns (XIRR*) (%) 17.60 19.39 26.95 10.81
Benchmark Returns (XIRR*) (%) # 12.74 14.11 18.97 4.98
Additional Benchmark Returns (XIRR*) (%) ## 11.98 13.06 16.59 1.79
NAV per Unit
( )̀
Scheme
Returns (%) ^
Benchmark
Returns (%) #
Additional
Benchmark
Returns (%) ##
Value of Investment of ` 10,000@
Scheme (`) Benchmark
(`) #
Additional
Benchmark
(`) ##
PeriodDate
30-Jun-14 Last 1 Year 21.1380 17.57 12.01 9.31 11,757 11,201 10,931
28-Jun-13 Last 2 Years 14.1270 32.53 22.65 19.62 17,592 15,059 14,323
29-Jun-12 Last 3 Years 13.2210 23.39 17.83 16.79 18,797 16,367 15,939
Quantum Equity Fund of Funds Performance as on June 30, 2015
^^Standard Deviation: 14.96% Beta: 0.88 Sharpe Ratio: 1.12
Past performance may or may not be sustained in the future. ## S&P BSE Sensex.
Load is not taken into consideration and Returns are for Growth Option using applicable NAV on the SIP day (5th of every month). Return on
SIP and Benchmark are annualized and compounded investment return for cash flows resulting out of uniform and regular monthly
subscriptions as on 5th day of every month (in case 5th is a non-Business Day, then the next Business Day) and have been worked out using
the Excel spreadsheet function known as XIRR. XIRR calculates the internal rate of return for series of cash flow. Assuming .̀ 1,000 invested
every month on 5th day of every month (in case 5th is a non-Business Day, then the next Business Day), the 1 year, 3 years, 5 years and since
inception returns from SIP are annualized and compounded investment return computed on the assumption that SIP installments were
received across the time periods from the start date of SIP from the end of the relevant period viz. 1 year, 3 years, 5 years and since Inception.
*XIRR - XIRR calculates the internal rate of return to measure and compare the profitability of series of investments.
# S&P BSE 200 INDEX
Brokerage & Commissions Paid
Brokerages Paid for investments in
Distributor Commissions Paid till date NIL
August 2015 NIL
A. Cumulative performance
B. Discrete 12 month performance %
^ Past performance may or may not be sustained in the future. Load is not taken into consideration and Returns are for Growth Option.
Returns up to 1 year period are Absolute Returns. Returns greater than 1 year period are compounded annualized (CAGR).
# S&P BSE 200 INDEX ## S&P BSE Sensex @ shows the current value of ` 10,000/- invested at the beginning of a given period
** Inception Date: July 20, 2009. Since inception returns are calculated on NAV of 10 invested at inception.`
QUANTUM EQUITY FUND OF FUNDS
~ Other schemes managed by Mr. Chirag Mehta refer page no. 31 SCHEME PERFORMANCE (FUND MANAGER-WISE)
Scheme ^(%) Benchmark (%) # Additional
Benchmark (%) ##
Scheme (`) Benchmark
#(`)
Additional
Benchmark
##(`)
Period V a l u e o f I n v e s t m e n t o f ` 1 0 , 0 0 0 @
June 30, 2014 to June 30, 2015 17.57 12.01 9.31 11,757 11,201 10,931
June 28, 2013 to June 30, 2014 49.63 34.45 31.03 14,963 13,445 13,103
June 29, 2012 to June 28, 2013 6.85 8.69 11.28 10,685 10,869 11,128
Since Inception ** 16.53 11.32 10.68 24,852 18,931 18,288
12
^ Past performance may or may not be sustained in the future. Load is not taken into consideration and Returns are for Growth Option.
Returns up to 1 year period are Absolute Returns. Returns greater than 1 year period are compounded annualized (CAGR).
# S&P BSE 200 INDEX ## S&P BSE Sensex @ shows the current value of ` 10,000/- invested at the beginning of a given period
August 2015

Portfolio as on August 31, 2015Name of Instrument Quantity Market
Value In Lakhs
% to Net Asset
^^Portfolio Turnover Ratio (Last one year): 79.23%^^ DefinitionsStandard deviation measures historical volatility. A high standard deviation suggests high volatility, while lower standard deviation would refer to more stability.Beta is the tendency of a fund's returns to respond to market swings. A beta of 1 indicates that the fund price will move with the market. A beta of less than 1 means that thesecurity willbe less volatile than the market. A beta of greater than 1 indicates that the security's price will be more volatile than the market.Sharpe Ratio is used to characterise how well the return of an asset compensates the investor for the risk taken. The greater a portfolio's Sharpe ratio, the better its risk-adjustedperformance has been.Portfolio Turnover Ratio is the percentage of a funds assets that have changed over the course of a year.
MUTUAL FUND UNITS
1. SBI Magnum Multiplier Fund - Direct Plan - Growth 51,707 80.26 14.23
2. HDFC Mid-Cap Opportunities Fund Direct Plan Growth 2,05,573 78.68 13.95
3. Mirae Asset India Opportunities Fund-Direct Plan-Growth Option 2,37,181 77.87 13.81
4. Franklin India High Growth Companies Fund -Direct-Growth 2,62,958 77.64 13.77
5. Birla Sun Life Frontline Equity Fund - Growth - Direct Plan 47,490 76.91 13.64
6. HDFC Capital Builder Fund - Direct Plan - Growth Option 38,060 75.70 13.42
7. ICICI Prudential Focused Bluechip Equity Fund- Direct Plan-Growth 2,59,644 75.43 13.38
Total 542.49 96.20
Collateralised Borrowing & Lending Obligation (CBLO) * 20.79 3.69
Net Receivable/(payable) 0.67 0.11
Grand Total 563.95 100.00
* Cash & Cash Equivalents
QUANTUM EQUITY FUND OF FUNDS 13August 2015

Scheme FeaturesNature of Scheme
Investment Objective
Benchmark Index
Fund Manager
Fund Manager’s Total Experience
Inception Date (Date of Allotment)
Current Expense RatioInvestment Options
Minimum Application Amount ( Under each Option)
Declaration of Net Asset Value (NAV)
Redemption Proceeds
QUANTUM DYNAMIC BOND FUND
Entry/ Sales Load
Exit Load
* Investors should consult their financial advisers if in doubt about whether the product is suitable for them.
NAV per
Unit (`)
Growth Option 10.3152
Monthly Dividend Option 10.0824
(as of August 31, 2015)
NAV
An Open-ended Debt Scheme with Defined Credit Exposure and Dynamic Maturity Profile
Fund Size as on August 2015 *Average AUM
(` in crores)
#Absolute AUM
(` in crores)
*Cumulative Daily AuM /No of days in the month #AuM as on August 31, 2015
Growth Option 31.06 30.82
Monthly Dividend Option 1.03 1.29
Total 32.09 32.11
Name of the Scheme This product is suitable for investors who are seeking*
Quantum Dynamic Bond Fund(An Open-ended Debt Scheme with Defined Credit Exposure and Dynamic Maturity Profile)
• Regular income over short to medium term and capital appreciation
• Investment in Debt / Money Market Instruments / Government Securities.
Riskometer
Product Labeling
Ferrous Metals
Telecom - Services
Auto Ancillaries
Petroleum Products
Cement
Oil
Construction Project
Chemicals
Hotels, Resorts And Other…
Banks
Gas
Finance
Software
Power
Auto
Ferrous Metals
Telecom - Services
Auto Ancillaries
Petroleum Products
Cement
Oil
Construction Project
Chemicals
Hotels, Resorts And Other…
Banks
Gas
Finance
Software
Power
Auto
Ferrous MetalsTelecom - Services
Auto AncillariesPetroleum Products
CementOil
Construction ProjectChemicals
Hotels, Resorts And Other…Banks
GasFinance
SoftwarePower
Auto
CRISIL Composite Bond Fund Index
Mr. Murthy Nagarajan (Since May 19, 2015)
21 yrs.
May 19, 2015
0.65%
Every Business Day
Normally despatched within 1-2 Business Days.
Purchase: ` 500/- and in multiples of ` 1/- thereafter. Additional Purchase: ` 500/- and in multiples of ` 1/- thereafter/ 50 units
Nil
Growth Option, Monthly Dividend Payout Option and Monthly Dividend Reinvestment Option
Not Applicable
Upfront commission to distributors will be paid by the investor directly to the distributor, based on his assessment of various factors including the service rendered by the distributor.
To generate income and capital appreciation through active management of portfolio consisting of short term, long term debt and money market instruments.
An Open-ended Debt Scheme with Defined Credit Exposure and Dynamic Maturity Profile
Tax on Capital Gains * Resident Individuals & HUFFII’s / Overseas Financial
OrganisationsPartnership Firm Non Resident Indians
Indian
CompaniesForeign Companies
Long Term 20% with Indexation 10% without Indexation20% with
Indexation
10% without Indexation (on transfer
of long term capital assets being
unlisted securities)
20% with
Indexation
10% without Indexation (on
transfer of long term capital
assets being unlisted securities)
Short Term Maximum 30% 30% 30% Maximum 30% 30% 40%
TRANSACTION CHARGES: In accordance with the SEBI Circular No.Cir / IMD / DF/13/2011 dated August 22, 2011, the AMC is allowed to deduct transaction charges of 100 for existing investors and 150 for a first time investor per subscription of ` 10,000 /- and above for the transaction / application received through distributors. The transaction charges shall be deducted by the AMC from the subscription amount received from the investor and paid to the distributor and the balance will be invested in the Scheme. Investors are requested to note that Quantum Mutual Fund is a direct to investor’s Mutual Fund and no transaction charges shall be deducted from the investment amount for transactions / applications received from the distributor and full subscription amount will be invested in the Scheme.
` `
* The mentioned Tax Rates shall be increased by applicable surcharge, if any Education Cess @ 2% and Secondary higher education cess @ 1% where ever as applicable.
QUANTUM DYNAMIC BOND FUND14
LOW HIGH
Hig
hLo
w
derao teM Moderately
High
Investors understand that their principal will be at Moderate Risk
August 2015

CBLO & Net Receivable / (Payable)
4.22%
Govt. Securities95.78%
CBLO & Net Receivable / (Payable)
Govt. Securities Ferrous Metals
Telecom - Services
Auto Ancillaries
Petroleum Products
Cement
Oil
Construction Project
Chemicals
Hotels, Resorts And Other…
Banks
Gas
Finance
Software
Power
Auto
Ferrous Metals
Telecom - Services
Auto Ancillaries
Petroleum Products
Cement
Oil
Construction Project
Chemicals
Hotels, Resorts And Other…
Banks
Gas
Finance
Software
Power
Auto
Ferrous MetalsTelecom - Services
Auto AncillariesPetroleum Products
CementOil
Construction ProjectChemicals
Hotels, Resorts And Other…Banks
GasFinance
SoftwarePower
Auto
Brokerage & Commissions Paid
Brokerages Paid for investments in
Distributor Commissions Paid till date NIL
August 2015 NIL
Dividend History - Monthly Dividend payout option
Record Date Net Dividend per unit(Post Dividend Distribution Tax)
(`)
Non IndividualIndividual
Weighted Average Maturity as on August 31, 2015 (In Yrs.)
At the end of the month 20.96
Modified Duration 9.14
15QUANTUM DYNAMIC BOND FUND
Portfolio as on August 31, 2015Name of Instrument Residual
Maturity (in days)
Market Value In Lakhs
% to Net Asset
Rating
DEBT INSTRUEMENTS
A) Listed/awaiting listing on Stock Exchanges NIL NIL
I) Government Securities
1. 8.13% GOI (MD 22/06/2045) Sovereign 10888 1,522.80 47.42
2. 7.88% GOI (MD 19/03/2030) Sovereign 5314 1,494.56 46.54
3. 8.24% GOI (MD 10/11/2033) Sovereign 6646 9.09 0.28
B) Privately Placed/Unlisted NIL NIL
C) Securitized Debt Instruments NIL NIL
Total of Debt instruments 3,026.45 94.24
MONEY MARKET INSTRUMENTS
A) Treasury Bills (T-bill)
1. 91 Days Tbill (MD 15/10/2015)** Sovereign 45 49.56 1.54
Total of T-Bills 49.56 1.54
B) Collateralised Borrowing & Lending Obligation (CBLO) * 239.59 7.46
Total of Money Market Instruments 289.15 9.00
Net Receivable / (Payable) -104.39 -3.24
Grand Total 3,211.21 100.00
Asset Allocation (% of Net Assets) as on August 31, 2015
25-Jun-15 0.01950939 0.01792803
27-Jul-15 0.05703163 0.05240884
25-Aug-15 0.08772913 0.08061810
August 2015
* Cash & Cash Equivalents

Scheme FeaturesNature of Scheme An Open-ended Liquid Scheme
Investment Objective
Benchmark Index Crisil Liquid Fund Index
Fund Manager Mr. Murthy Nagarajan (Since November 1, 2013)
Fund Manager’s Total Experience 21 yrs.
Inception Date (Date of Allotment) April 7, 2006
Current Expense Ratio 0.35%
Investment Options
Minimum Application Amount ( Under each Option)
Declaration of Net Asset Value (NAV) Every Business Day
Redemption Proceeds Normally despatched within 1-2 Business Days.
QUANTUM LIQUID FUND
Entry/ Sales Load
Exit Load Nil
The primary investment objective of the Scheme is to provide optimal returns with low to moderate levels of risk and high liquidity through judicious investments in money market and debt instruments.
Growth, Daily Dividend Reinvestment & Monthly Dividend Payout.
Not Applicable
Upfront commission to distributors will be paid by the investor directly to the distributor, based on his assessment of various factors including the service rendered by the distributor.
NAV per
Unit (`)
Growth Option 20.2780
Monthly Dividend Payout Option 10.0153
Daily Dividend Reinvestment Option 10.0041
(as of August 31, 2015)
NAV
Tax on Capital Gains * Resident Individuals & HUFFII’s / Overseas Financial
OrganisationsPartnership Firm Non Resident Indians
Indian
CompaniesForeign Companies
Long Term 20% with Indexation 10% without Indexation20% with
Indexation
10% without Indexation (on transfer
of long term capital assets being
unlisted securities)
20% with
Indexation
10% without Indexation (on
transfer of long term capital
assets being unlisted securities)
Short Term Maximum 30% 30% 30% Maximum 30% 30% 40%
An Open ended Liquid Scheme
Fund Size as on August 2015 *Average AUM
(` in crores)
#Absolute AUM
(` in crores)
Growth Option: 5,000/-and in multiples of 1/- thereafter.Monthly Dividend Payout Option: 10,000/- and in multiples of 1/-thereafter.Daily Dividend Reinvestment Option: 1,00,000/- and in multiples of 1/- thereafter.Additional Investment: ̀ 500/- and in multiples of ̀ 1/- thereafter /50
units (For all options)
` ` ` `
``
*Cumulative Daily AuM /No of days in the month #AuM as on August 31, 2015
TRANSACTION CHARGES: In accordance with the SEBI Circular No.Cir / IMD / DF/13/2011 dated August 22, 2011, the AMC is allowed to deduct transaction charges of 100 for existing investors and 150 for a first time investor per subscription of ` 10,000 /- and above for the transaction / application received through distributors. The transaction charges shall be deducted by the AMC from the subscription amount received from the investor and paid to the distributor and the balance will be invested in the Scheme. Investors are requested to note that Quantum Mutual Fund is a direct to investor’s Mutual Fund and no transaction charges shall be deducted from the investment amount for transactions / applications received from the distributor and full subscription amount will be invested in the Scheme.
` `
* Investors should consult their financial advisers if in doubt about whether the product is suitable for them.
* The mentioned Tax Rates shall be increased by applicable surcharge, if any Education Cess @ 2% and Secondary higher education cess @ 1% where ever as applicable.
Growth Option 40.88 39.14Daily Dividend Reinvestment Option 13.37 13.50Monthly Dividend Payout Option 2.39 2.24Total 56.64 54.88
Name of the Scheme This product is suitable for investors who are seeking*
Quantum Liquid Fund(An Open- ended Liquid Scheme)
• Income over the short term• Investments in debt / money market instruments
Product Labeling
Riskometer
Investors understand that their principal will be at Low risk
QUANTUM LIQUID FUND16
LOW HIGH
Hig
hLo
w
derao teM Moderately
High
August 2015

Scheme ^(%) Benchmark (%) # Additional
Benchmark (%) ##
Scheme (`) Benchmark
#(`)
Additional
Benchmark
##(`)
Period V a l u e o f I n v e s t m e n t o f ` 1 0 , 0 0 0 @
June 30, 2014 to June 30, 2015 8.4626 8.7694 8.5446 10,846 10,877 10,854
June 28, 2013 to June 30, 2014 9.1791 9.6820 5.9280 10,918 10,968 10,593
June 29, 2012 to June 28, 2013 8.4401 8.1194 8.1665 10,844 10,812 10,817
Since Inception ** 7.8082 7.5065 6.1281 20,029 19,517 17,323
Quantum LiquidFund Performance as on June 30, 2015A. Cumulative performance
^ Past performance may or may not be sustained in the future. Load is not taken into consideration and Returns are for Growth Option.
Returns up to 1 year period are Absolute Returns. Returns greater than 1 year period are compounded annualized (CAGR).
# Crisil Liquid Fund Index ## Crisil 1 year T- Bill Index * Simple Annulised Yield ** CAGR
@ shows the current value of ` 10,000/- invested at the beginning of a given period
B. Discrete 12 month performance %
^ Past performance may or may not be sustained in the future. Load is not taken into consideration and Returns are for Growth Option.
Returns up to 1 year period are Absolute Returns. Returns greater than 1 year period are compounded annualized (CAGR).
# Crisil Liquid Fund Index ## Crisil 1 year T- Bill Index @ shows the current value of 10,000/- invested at the beginning of a given period`
** Inception Date: April 7, 2006. Since inception returns are calculated on NAV of 10 invested at inception.`
NAV per Unit
( )̀
Scheme
Returns(%) ^
Benchmark
Returns (%) #
Additional
Benchmark
Returns (%) ##
Value of Investment of ` 10,000@
Scheme (`) Benchmark
(`) #
Additional
Benchmark
(`) ##
PeriodDate
23-Jun-15 7 days * 19.9991 7.69 8.01 7.63 10,015 10,015 10,015
15-Jun-15 15 days * 19.9670 7.51 7.96 8.05 10,031 10,033 10,033
31-May-15 30 days * 19.9015 7.77 8.05 7.58 10,064 10,066 10,062
30-Jun-14 Last 1 Year * 18.4659 8.46 8.77 8.54 10,846 10,877 10,854
28-Jun-13 Last 2 Years ** 16.9134 8.80 9.20 7.21 11,842 11,930 11,498
29-Jun-12 Last 3 Years ** 15.5970 8.69 8.85 7.53 12,841 12,899 12,437
Brokerage & Commissions Paid
Brokerages Paid for investments in August 2015 `
Distributor Commissions Paid till date NIL
2,000
Dividend History - Monthly Dividend payout option
Record Date Net Dividend per unit(Post Dividend Distribution Tax)
(`)
Non IndividualIndividual
Weighted Average Maturity as on August 31, 2015 (Days)
At the end of the month 52
Average during the month 44
Modified Duration 48
17QUANTUM LIQUID FUND
25-Jun-15 0.04754462 0.04369082
27-Jul-15 0.04721976 0.04339228
25-Aug-15 0.04067924 0.03738191
August 2015

Portfolio as on August 31, 2015Name of Instrument Residual
Maturity (in days)
Market Value In Lakhs
% to Net Asset
Rating
DEBT INSTRUMENTS
A) Listed/awaiting listing on Stock Exchanges
I) Non-Convertible debentures / Bonds NIL NIL
B) Privately Placed/Unlisted NIL NIL
C) Securitized Debt Instruments NIL NIL
Total of Debt instruments - 0.00%
MONEY MARKET INSTRUMENTS
A) Certificate of Deposits (CD)
1. Bank of India CD (MD 15/09/2015) CRISIL A1+ 15 997.23 18.17
2. IDBI Bank Ltd CD (MD 09/11/2015) CRISIL A1+ 70 493.02 8.98
Total of CDs 1,490.25 27.15
B) Commerical Paper (CP)
1. L & T Finance Ltd CP (MD 08/09/2015) CARE A1+ 8 499.28 9.10
2. HDFC Ltd CP (MD 26/10/2015) CRISIL A1+ 56 494.16 9.01
3. Bajaj Finance Ltd CP (MD 29/10/2015) CRISIL A1+ 59 493.91 9.00
Total of CPs 1,487.35 27.11
C) Treasury Bills (T-bill)
1. 91 Days Tbill (MD 05/11/2015) Sovereign 66 1,336.44 24.35
2. 91 Days Tbill (MD 19/11/2015) Sovereign 80 492.14 8.97
3. 91 Days Tbill (MD 26/11/2015) Sovereign 87 491.45 8.96
4. 91 Days Tbill (MD 15/10/2015) Sovereign 45 49.56 0.90
Total of T-Bills 2,369.59 43.18
D) Collateralised Borrowing & Lending Obligation (CBLO) * 141.87 2.59
Total of Money Market Instruments 5,489.06 100.03
Net Receivable / (Payable) -1.64 -0.03
Grand Total 5,487.42 100.00
* Cash & Cash Equivalents
Asset Allocation (% of Net Assets) as on August 31, 2015
QUANTUM LIQUID FUND18
Banks27.15%
Govt. Securities43.18%
NBFC27.11%
CBLO & Net Receivable / (Payable)2.56%
August 2015
CBLO & Net Receivable / (Payable)
Banks
NBFC
Govt. Securities

Scheme FeaturesNature of Scheme An Open ended Fund of Fund Scheme
Investment Objective
Benchmark Index Domestic Price of Gold
Fund Manager Mr. Chirag Mehta ~ (Since May 19, 2011)
Fund Manager’s Total Experience 11 yrs.
Inception Date (Date of Allotment) May 19, 2011
Current Expense Ratio 0.25%
Investment Options
Minimum Application Amount ( Under each Option)
Declaration of Net Asset Value (NAV) Every Business Day
Redemption Proceeds Normally despatched within 3-4 Business Days.
QUANTUM GOLD SAVINGS FUND
Purchase : ` 500/- and in multiples of ` 1/- thereafter.
Additional Purchase: ` 500/- and in multiples of ` 1/- thereafter / 50 units
Entry/ Sales Load
Exit Load Repurchase/ Redemption/ Switch Out - On or before 365 days from the date of allotment 1.5 %.
The investment objective of the Scheme is to provide capital appreciation by predominantly investing in units of Quantum Gold Fund - Exchange Traded Fund (QGF). The performance of the Scheme may differ from that of Quantum Gold Fund and the domestic prices of gold due to expenses and certain other factors. There can be no assurance or guarantee that the investment objective of the Scheme will be achieved.
Growth
Not Applicable
Upfront commission to distributors will be paid by the investor directly to the distributor, based on his assessment of various factors including the service rendered by the distributor.
NAV per
Unit (`)(as of August 31, 2015)
NAV Fund Size as on August 2015 *Average AUM
(` in crores)
#Absolute AUM
(` in crores)Growth Option 10.15 10.50
Tax on Capital Gains * Resident Individuals & HUFFII’s / Overseas Financial
OrganisationsPartnership Firm Non Resident Indians
Indian
CompaniesForeign Companies
Long Term 20% with Indexation 10% without Indexation20% with
Indexation
10% without Indexation (on transfer
of long term capital assets being
unlisted securities)
20% with
Indexation
10% without Indexation (on
transfer of long term capital
assets being unlisted securities)
Short Term Maximum 30% 30% 30% Maximum 30% 30% 40%
An Open ended Fund of Fund Scheme
Growth Option 11.4171
*Cumulative Daily AuM /No of days in the month #AuM as on August 31, 2015
TRANSACTION CHARGES: In accordance with the SEBI Circular No.Cir / IMD / DF/13/2011 dated August 22, 2011, the AMC is allowed to deduct transaction charges of 100 for existing investors and 150 for a first time investor per subscription of ` 10,000 /- and above for the transaction / application received through distributors. The transaction charges shall be deducted by the AMC from the subscription amount received from the investor and paid to the distributor and the balance will be invested in the Scheme. Investors are requested to note that Quantum Mutual Fund is a direct to investor’s Mutual Fund and no transaction charges shall be deducted from the investment amount for transactions / applications received from the distributor and full subscription amount will be invested in the Scheme.
` `
* The mentioned Tax Rates shall be increased by applicable surcharge, if any Education Cess @ 2% and Secondary higher education cess @ 1% where ever as applicable.
Name of the Scheme This product is suitable for investors who are seeking*
Quantum Gold Savings Fund(An Open-ended Fund of Funds Scheme)
• Long term returns• Investments in units of Quantum Gold Fund – Exchange
Traded Fund whose underlying investments are in physical gold.
Product Labeling
Riskometer
* Investors should consult their financial advisers if in doubt about whether the product is suitable for them.
19QUANTUM GOLD SAVINGS FUND
LOW HIGH
Hig
hLo
w
derao teM Moderately
High
Investors understand that their principal will be at Moderately High Risk
August 2015

Quantum Gold Savings Fund Performance as on June 30, 2015
Past performance may or may not be sustained in the future.
Load is not taken into consideration and Returns are for Growth Option using applicable NAV on the SIP day (5th of every month). Return on
SIP and Benchmark are annualized and compounded investment return for cash flows resulting out of uniform and regular monthly
subscriptions as on 5th day of every month (in case 5th is a non-Business Day, then the next Business Day) and have been worked out using
the Excel spreadsheet function known as XIRR. XIRR calculates the internal rate of return for series of cash flow. Assuming .̀ 1,000 invested
every month on 5th day of every month (in case 5th is a non-Business Day, then the next Business Day), the 1 year, 3 years and since inception
returns from SIP are annualized and compounded investment return computed on the assumption that SIP installments were received across
the time periods from the start date of SIP from the end of the relevant period viz. 1 year, 3 years and since Inception.
*XIRR - XIRR calculates the internal rate of return to measure and compare the profitability of series of investments.
# Domestic Price of Gold
Brokerage & Commissions Paid
Brokerages Paid for investments in August 2015 3,653.41
Distributor Commissions Paid till date NIL
`
A. Cumulative performance
NAV per Unit
( )̀
Scheme
Returns (%) ^
Benchmark
Returns (%) #
Value of Investment of ` 10,000@
Scheme (`) Benchmark
(`) #
PeriodDate
B. Discrete 12 month performance %
^ Past performance may or may not be sustained in the future. Load is not taken into consideration and Returns are for Growth Option.
Returns up to 1 year period are Absolute Returns. Returns greater than 1 year period are compounded annualized (CAGR).
# Domestic Price of Gold @ shows the current value of ` 10,000/- invested at the beginning of a given period
** Inception Date: May 19, 2011. Since inception returns are calculated on NAV of 10 invested at inception.`
SIP Performance of Quantum Gold Savings Fund as on June 30, 2015
Since Inception SIP 3 Year SIP 1 Year SIP
Total Amount Invested (Rs.‘000) 49 36 12
Mkt Value as on June 30, 15 (Rs.‘000) 45.192 32.812 11.764
Returns (XIRR*) (%) -3.89 -5.99 -3.72
Domestic Price of Gold Returns (XIRR*) (%) # -1.94 -3.61 -1.50
Scheme ^(%) Benchmark (%) #
Scheme (`) Benchmark
#(`)
Period
June 30, 2014 to June 30, 2015 -7.01 -4.58 9,299 9,542
June 28, 2013 to June 30, 2014 10.29 10.80 11,029 11,080
June 29, 2012 to June 28, 2013 -15.29 -14.78 8,471 8,522
Since Inception ** 3.38 4.96 11,468 12,207
Value of Investment of ` 10,000@
~ Other schemes managed by Mr. Chirag Mehta refer page no. 31 SCHEME PERFORMANCE (FUND MANAGER-WISE)
30-Jun-14 Last 1 Year 12.3330 -7.01 -4.58 9,299 9,542
28-Jun-13 Last 2 Years 11.1821 1.27 2.81 10,256 10,572
29-Jun-12 Last 3 Years 13.1997 -4.58 -3.41 8,688 9,009
^ Past performance may or may not be sustained in the future. Load is not taken into consideration and Returns are for Growth Option.
Returns up to 1 year period are Absolute Returns. Returns greater than 1 year period are compounded annualized (CAGR).
# Domestic Price of Gold @ shows the current value of ` 10,000/- invested at the beginning of a given period
20 QUANTUM GOLD SAVINGS FUND August 2015

Portfolio as on August 31, 2015Name of Instrument Units Market
Value In Lakhs
% to Net Asset
^^Portfolio Turnover Ratio (Last one year): 9.07%
Asset Allocation (% of Net Assets) as on August 31, 2015
^^ DefinitionsPortfolio Turnover Ratio is the percentage of a funds assets that have changed over the course of a year.
EXCHANGE TRADED FUND - UNITS
A) Quantum Gold Fund 85,926 1,048.00 99.84
Total 1,048.00 99.84
Collateralised Borrowing & Lending Obligation (CBLO) * 2.42 0.23
Net Receivable/(payable) -0.79 -0.07
Grand Total 1,049.63 100.00
* Cash & Cash Equivalents
Units of Quantum Gold Fund
CBLO & Net Receivable / (Payable)
21QUANTUM GOLD SAVINGS FUND
Units of Quantum Gold Fund
99.84%
CBLO & Net Receivable / (Payable)
0.16%
August 2015

Scheme FeaturesNature of Scheme An Open-ended Fund of Funds Scheme
Investment Objective
Benchmark Index Crisil Composite Bond Fund Index (40%)+S&P BSE Sensex Totalreturn Index (40%)+Domestic price of gold (20%)
Fund Manager Mr. Chirag Mehta ~ (Since July 11, 2012)
Fund Manager’s Total Experience 11 yrs
Inception Date (Date of Allotment) July 11, 2012
Current Expense Ratio 0.25%
Investment Options
Minimum Application Amount ( Under each Option)
Declaration of Net Asset Value (NAV) Every Business Day
Redemption Proceeds Normally despatched within 3-4 Business Days.
QUANTUM MULTI ASSET FUND
Purchase: ̀ 500/- and in multiples of ̀ 1/- thereafter. Additional Purchase: ̀ 500/- and in multiples of ̀ 1/- thereafter/ 50 units
Entry/ Sales Load
Exit Load Repurchase/ Redemption/ Switch Out - a) On or before 90 days from the date of allotment 1.00%.b) After 90 days from the date of allotment Nil
The investment objective of the Scheme is to generate modest capital appreciation while trying to reduce risk (by diversifying risks across asset classes) from a combined portfolio of equity, debt / money markets and Gold schemes of Quantum Mutual Fund. The Scheme may invest in the units of debt / money market schemes of other mutual funds to gain exposure to debt as an asset class to manage any investment and regulatory constraints that arise/ that prevent the Scheme from increasing investments in the schemes of Quantum Mutual Fund. There can be no assurance that the investment objective of the Scheme will be realized.
Growth
Not Applicable
Upfront commission to distributors will be paid by the investor directly to the distributor, based on his assessment of various factors including the service rendered by the distributor.
Fund Size as on August 2015 *Average AUM
(` in crores)
#Absolute AUM
(` in crores)
Tax on Capital Gains * Resident Individuals & HUFFII’s / Overseas Financial
OrganisationsPartnership Firm Non Resident Indians
Indian
CompaniesForeign Companies
Long Term 20% with Indexation 10% without Indexation20% with
Indexation
10% without Indexation (on transfer
of long term capital assets being
unlisted securities)
20% with
Indexation
10% without Indexation (on
transfer of long term capital
assets being unlisted securities)
Short Term Maximum 30% 30% 30% Maximum 30% 30% 40%
NAV per
Unit (`)
Growth Option 13.5329
(as of August 31, 2015)
NAV
An Open-ended Fund of Funds Scheme
Associate Fund Manager Mr. Nilesh Shetty (Since July 11, 2012)
Total Experience 12 yrs
G rowth Option 6.96 6.89
*Cumulative Daily AuM /No of days in the month #AuM as on August 31, 2015
TRANSACTION CHARGES: In accordance with the SEBI Circular No.Cir / IMD / DF/13/2011 dated August 22, 2011, the AMC is allowed to deduct transaction charges of 100 for existing investors and 150 for a first time investor per subscription of ` 10,000 /- and above for the transaction / application received through distributors. The transaction charges shall be deducted by the AMC from the subscription amount received from the investor and paid to the distributor and the balance will be invested in the Scheme. Investors are requested to note that Quantum Mutual Fund is a direct to investor’s Mutual Fund and no transaction charges shall be deducted from the investment amount for transactions / applications received from the distributor and full subscription amount will be invested in the Scheme.
` `
* Investors should consult their financial advisers if in doubt about whether the product is suitable for them.
* The mentioned Tax Rates shall be increased by applicable surcharge, if any Education Cess @ 2% and Secondary higher education cess @ 1% where ever as applicable.
Name of the Scheme This product is suitable for investors who are seeking*
Quantum Multi Asset Fund(An Open-ended Fund of Funds Scheme)
• Long term capital appreciation and current income• Investments in portfolio of schemes of Quantum
Mutual Fund whose underlying investments are in quity and equity related securities of companies, debt and money market instruments and physical gold.
Product Labeling
Riskometer
QUANTUM MULTI ASSET FUND22
LOW HIGH
Hig
hLo
w
derao teM Moderately
High
Investors understand that their principal will be at Moderately High Risk
August 2015
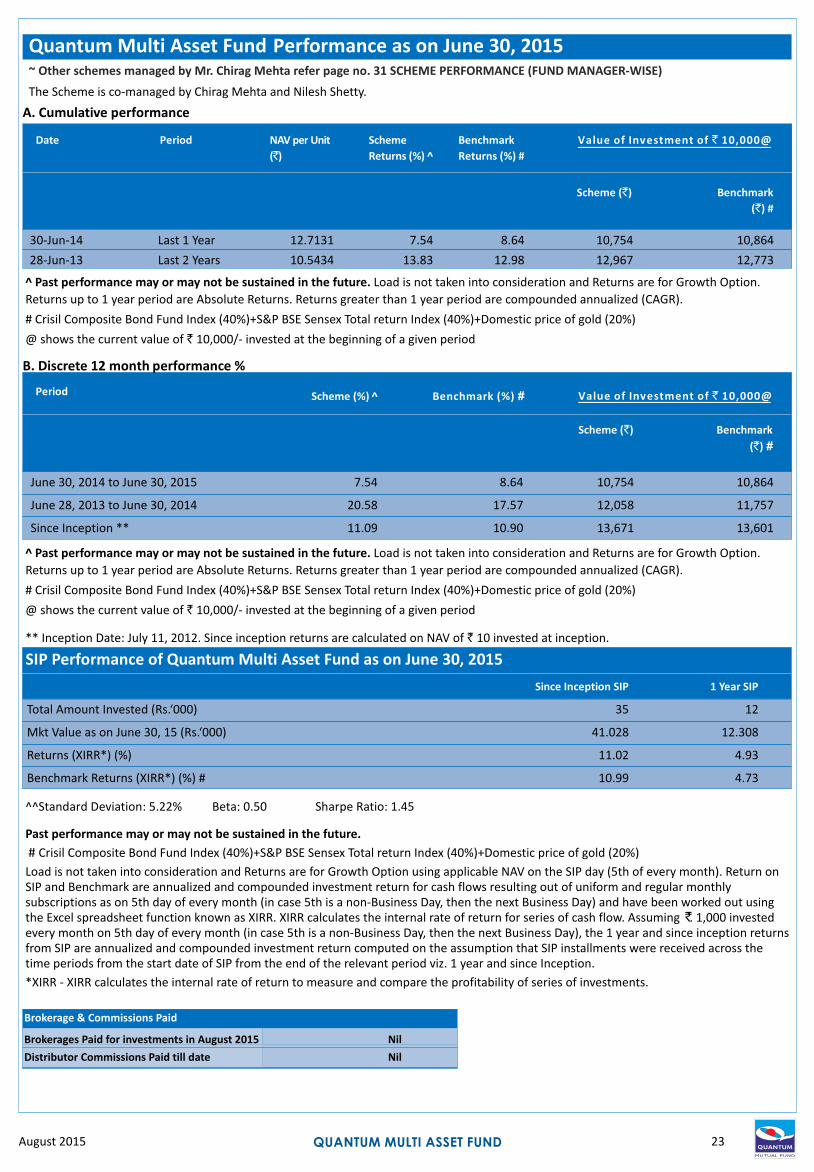
SIP Performance of Quantum Multi Asset Fund as on June 30, 2015
Since Inception SIP 1 Year SIP
Total Amount Invested (Rs.‘000) 35 12
Mkt Value as on June 30, 15 (Rs.‘000) 41.028 12.308
Returns (XIRR*) (%) 11.02 4.93
Benchmark Returns (XIRR*) (%) # 10.99 4.73
Scheme ^(%) Benchmark (%) #
Scheme (`) Benchmark
#(`)
Period
June 30, 2014 to June 30, 2015 7.54 8.64 10,754 10,864
June 28, 2013 to June 30, 2014 20.58 17.57 12,058 11,757
Since Inception ** 11.09 10.90 13,671 13,601
Value of Investment of ` 10,000@
NAV per Unit
( )̀
Scheme
Returns (%) ^
Benchmark
Returns (%) #
Value of Investment of ` 10,000@
Scheme (`) Benchmark
(`) #
PeriodDate
30-Jun-14 Last 1 Year 12.7131 7.54 8.64 10,754 10,864
28-Jun-13 Last 2 Years 10.5434 13.83 12.98 12,967 12,773
Quantum Multi Asset Fund Performance as on June 30, 2015
^^Standard Deviation: 5.22% Beta: 0.50 Sharpe Ratio: 1.45
Past performance may or may not be sustained in the future.
# Crisil Composite Bond Fund Index (40%)+S&P BSE Sensex Total return Index (40%)+Domestic price of gold (20%)
Load is not taken into consideration and Returns are for Growth Option using applicable NAV on the SIP day (5th of every month). Return on SIP and Benchmark are annualized and compounded investment return for cash flows resulting out of uniform and regular monthly subscriptions as on 5th day of every month (in case 5th is a non-Business Day, then the next Business Day) and have been worked out using the Excel spreadsheet function known as XIRR. XIRR calculates the internal rate of return for series of cash flow. Assuming .̀ 1,000 invested every month on 5th day of every month (in case 5th is a non-Business Day, then the next Business Day), the 1 year and since inception returns from SIP are annualized and compounded investment return computed on the assumption that SIP installments were received across the time periods from the start date of SIP from the end of the relevant period viz. 1 year and since Inception.
*XIRR - XIRR calculates the internal rate of return to measure and compare the profitability of series of investments.
Brokerage & Commissions Paid
Brokerages Paid for investments in August 2015
Distributor Commissions Paid till date Nil
Nil
^ Past performance may or may not be sustained in the future. Load is not taken into consideration and Returns are for Growth Option.
Returns up to 1 year period are Absolute Returns. Returns greater than 1 year period are compounded annualized (CAGR).
# Crisil Composite Bond Fund Index (40%)+S&P BSE Sensex Total return Index (40%)+Domestic price of gold (20%)
@ shows the current value of ` 10,000/- invested at the beginning of a given period
** Inception Date: July 11, 2012. Since inception returns are calculated on NAV of 10 invested at inception.`
A. Cumulative performance
B. Discrete 12 month performance %
The Scheme is co-managed by Chirag Mehta and Nilesh Shetty.
~ Other schemes managed by Mr. Chirag Mehta refer page no. 31 SCHEME PERFORMANCE (FUND MANAGER-WISE)
^ Past performance may or may not be sustained in the future. Load is not taken into consideration and Returns are for Growth Option.
Returns up to 1 year period are Absolute Returns. Returns greater than 1 year period are compounded annualized (CAGR).
# Crisil Composite Bond Fund Index (40%)+S&P BSE Sensex Total return Index (40%)+Domestic price of gold (20%)
@ shows the current value of ` 10,000/- invested at the beginning of a given period
23QUANTUM MULTI ASSET FUNDAugust 2015

Portfolio as on August 31, 2015Name of Instrument Quantity Market
Value In Lakhs
% to Net Asset
^^Portfolio Turnover Ratio (Last one year): 20.36%^^ DefinitionsStandard deviation measures historical volatility. A high standard deviation suggests high volatility, while lower standard deviation would refer to more stability.Beta is the tendency of a fund's returns to respond to market swings. A beta of 1 indicates that the fund price will move with the market. A beta of less than 1 means that thesecurity willbe less volatile than the market. A beta of greater than 1 indicates that the security's price will be more volatile than the market.Sharpe Ratio is used to characterise how well the return of an asset compensates the investor for the risk taken. The greater a portfolio's Sharpe ratio, the better its risk-adjustedperformance has been.Portfolio Turnover Ratio is the percentage of a funds assets that have changed over the course of a year.
1. Quantum Liquid Fund - Growth Option 10,65,498 216.06 31.34
2. Quantum Long Term Equity Fund - Growth Option 4,65,580 169.38 24.57
3. Quantum Dynamic Bond Fund- Growth Option 10,00,000 103.15 14.96
Total of Mutual Fund Units 488.59 70.87
B) EXCHANGE TRADED FUND UNITS
1. Quantum Index Fund 12,162 102.56 14.87
2. Quantum Gold Fund 7,931 96.73 14.03
Total of Exchange Traded Fund Units 199.29 28.90
Total (A+B) 687.88 99.77
Collateralised Borrowing & Lending Obligation (CBLO) * 1.52 0.22
Net Receivable/(payable) 0.08 0.01
Grand Total 689.48 100.00
* Cash & Cash Equivalents
A) MUTUAL FUND UNITS
24 QUANTUM MULTI ASSET FUND August 2015

Scheme FeaturesNature of Scheme An Open ended Exchange Traded Fund - Gold
Investment Objective
Benchmark Index Domestic Price of Physical Gold
Fund Manager Mr. Chirag Mehta ~ (Since May 01, 2009)
Fund Manager’s Total Experience 11 yrs
Inception Date (Date of Allotment) February 22, 2008
Current Expense Ratio 1.00%
Investment Options
Minimum Application Amount ( Under each Option)
Declaration of Net Asset Value (NAV) Every Business Day
Redemption Proceeds Normally despatched within 3-4 Business Days.
QUANTUM GOLD FUND
Directly with Fund: The investors can create / redeem in exchange of Portfolio Deposit and Cash Component in creation unit size at NAV based Price. On the Exchange: Approx equal to price of 1/2 gram of Gold quoted on the NSE. On NSE, the units can be purchased / sold in minimum lot of 1 units and in multiples therefore.
Entry/ Sales Load
Exit Load NIL(retail investor can exit the scheme only through secondary market)
The Investment Objective of the Scheme is to generate returns that are in line with the performance of gold and gold related instruments subject to tracking errors. However, investment in gold related instruments will be made if and when SEBI permits mutual funds to invest, in gold related instruments. The Scheme is designed to provide returns that before expenses, closely correspond to the returns provided by gold.
Growth
Not Applicable
Upfront commission to distributors will be paid by the investor directly to the distributor, based on his assessment of various factors including the service rendered by the distributor.
Fund Size as on August 2015 *Average AUM
(` in crores)
#Absolute AUM
(` in crores)
NAV per
Unit (`)
Growth Option 1231.6779
(as of August 31, 2015)
NAV
An Open ended Exchange Traded Fund - Gold
Tax on Capital Gains * Resident Individuals & HUFFII’s / Overseas Financial
OrganisationsPartnership Firm Non Resident Indians
Indian
CompaniesForeign Companies
Long Term 20% with Indexation 10% without Indexation20% with
Indexation
20% with Indexation (on transfer
of long term capital assets being listed
securities)
20% with
Indexation
20% with Indexation (on
transfer of long term capital
assets being listed securities)
Short Term Maximum 30% 30% 30% Maximum 30% 30% 40%
*Cumulative Daily AuM /No of days in the month #AuM as on August 31, 2015
* Investors should consult their financial advisers if in doubt about whether the product is suitable for them.
TRANSACTION CHARGES: In accordance with the SEBI Circular No.Cir / IMD / DF/13/2011 dated August 22, 2011, the AMC is allowed to deduct transaction charges of 100 for existing investors and 150 for a first time investor per subscription of ` 10,000 /- and above for the transaction / application received through distributors. The transaction charges shall be deducted by the AMC from the subscription amount received from the investor and paid to the distributor and the balance will be invested in the Scheme. Investors are requested to note that Quantum Mutual Fund is a direct to investor’s Mutual Fund and no transaction charges shall be deducted from the investment amount for transactions / applications received from the distributor and full subscription amount will be invested in the Scheme.
` `
* The mentioned Tax Rates shall be increased by applicable surcharge, if any Education Cess @ 2% and Secondary higher education cess @ 1% where ever as applicable.
Growth Option 56.69 58.43
Name of the Scheme This product is suitable for investors who are seeking*
Quantum Gold Fund(An Open-ended Exchange Traded Fund- Gold)
• Long term returns• Investments in physical gold.
Product Labeling
Riskometer
25QUANTUM GOLD FUND
LOW HIGH
Hig
hLo
w
derao teM Moderately
High
Investors understand that their principal will be at Moderately High Risk
August 2015

Scheme ^(%) Benchmark (%) #
Scheme (`) Benchmark
#(`)
Period
June 30, 2014 to June 30, 2015 -5.54 -4.58 9,446 9,542
June 28, 2013 to June 30, 2014 9.73 10.80 10,973 11,080
June 29, 2012 to June 28, 2013 -15.62 -14.78 8,438 8,522
Since Inception ** 10.49 11.13 20,830 21,745
Value of Investment of ` 10,000@
Quantum Gold Fund Performance as on June 30, 2015
Brokerage & Commissions Paid
Brokerages Paid for investments in August 2015 NIL
Distributor Commissions Paid till date NIL
^ Past performance may or may not be sustained in the future. Load is not taken into consideration and Returns are for Growth Option. Returns up to 1 year period are Absolute Returns. Returns greater than 1 year period are compounded annualized (CAGR). # Domestic Price of Physical Gold @ shows the current value of ` 10,000/- invested at the beginning of a given period
** Inception Date: 22, 2008. Since inception returns are calculated on NAV of 10 invested at inception.February `
A. Cumulative performance
B. Discrete 12 month performance %
* Cash & Cash Equivalents
^^Portfolio Turnover Ratio (Last one year): 2.81%Asset Allocation (% of Net Assets) as on August 31, 2015
^^ Definitions
Portfolio Turnover Ratio is the percentage of a funds assets that have changed over the course of a year.
Tracking Error is a measure of how closely a fund follows the index to which it is benchmarked. The more passively the fund is managed, the smaller the tracking error. In the case of Exchange Traded Funds, the lower the Tracking Error, the better.
Portfolio as on August 31, 2015Name of Instrument Market
Value In Lakhs
% to Net Asset
GOLD
A) 1 KG Bar (0.995 fineness) 216 5,799.45 99.26
B) 100 Gram Bar (0.999 fineness) 16 43.12 0.74
C) 100 Gram Bar (0.995 fineness) 1 2.69 0.05
Total 5,845.26 100.05
Collateralised Borrowing & Lending Obligation (CBLO) * 2.64 0.05
Net Receivable/(payable) -5.28 -0.10
Grand Total 5,842.62 100.00
Quantity
^ 0.005% ^Tracking Error as on 30 June, 2015 Absolute Since Inception: Annualised Since Inception: 0.080%
~ Other schemes managed by Mr. Chirag Mehta refer page no. 31 SCHEME PERFORMANCE (FUND MANAGER-WISE)
NAV per Unit
( )̀
Scheme
Returns (%) ^
Benchmark
Returns (%) #
Value of Investment of ` 10,000@
Scheme (`) Benchmark
(`) #
PeriodDate
30-Jun-14 Last 1 Year 1,307.3237 -5.54 -4.58 9,446 9,542
28-Jun-13 Last 2 Years 1,191.3682 1.81 2.81 10,366 10,572
29-Jun-12 Last 3 Years 1,411.9845 -4.36 -3.41 8,746 9,009
^ Past performance may or may not be sustained in the future. Load is not taken into consideration and Returns are for Growth Option. Returns up to 1 year period are Absolute Returns. Returns greater than 1 year period are compounded annualized (CAGR). # Domestic Price of Physical Gold @ shows the current value of ` 10,000/- invested at the beginning of a given period
100.05%
CBLO0.05%
Receivables-0.10%
GOLD
CBLO
Receivables
26 QUANTUM GOLD FUND
GOLD
August 2015
Scheme FeaturesNature of Scheme An Open-ended Exchange Traded Fund
Investment Objective
Benchmark Index CNX Nifty TRI Index
Fund Manager Mr. Hitendra Parekh (Since June 09,2008)
Fund Manager’s Total Experience 22 yrs.
Inception Date (Date of Allotment) July 10, 2008
Current Expense Ratio 0.50%
Investment Options
Minimum Application Amount ( Under each Option)
Declaration of Net Asset Value (NAV) Every Business Day
Redemption Proceeds Normally despatched within 3-4 Business Days.
QUANTUM INDEX FUND
Directly with Fund: The investors can create / redeem in exchange of
Portfolio Deposit and Cash Component in creation unit size at NAV based
Price. On the Exchange: At prices which may be close to the NAV of QIF Units.
On NSE, the units can be purchased / sold in minimum lot of 1 unit and in
multiples thereof. The units of QIF issued under the scheme will be
approximately equal to the price of 1/10 (one-tenth) of the CNX Nifty Index.
Entry/ Sales Load
Exit Load NIL(retail Investor can exit the scheme only through secondary market)
The investment objective of the scheme is to invest in stocks of companies comprising CNX Nifty Index and endeavour to achieve return equivalent to Nifty by “Passive” investment. The Scheme will be managed by replicating the index in the same weightage as inthe CNX Nifty Index with the intention of minimizing the performance differences between the scheme and the CNX NiftyIndex in capital terms, subject to market liquidity, costs of trading,managing expenses and other factors which may cause tracking error.
Growth
Not Applicable
Upfront commission to distributors will be paid by the investor directly to the distributor, based on hisassessment of various factors including the service rendered by the distributor.
Taxation# Tax on Long Term Capital Gains - Nil
Tax on Short Term Capital Gains - 15%
Fund Size as on August 2015 *Average AUM
(` in crores)
#Absolute AUM
(` in crores)
NAV per
Unit (`)(as of August 31, 2015)
NAV
Growth Option 843.6809
An Open ended Exchange Traded Fund
* Investors should consult their financial advisers if in doubt about whether the product is suitable for them.
TRANSACTION CHARGES: In accordance with the SEBI Circular No.Cir / IMD / DF/13/2011 dated August 22, 2011, the AMC is allowed to deduct transaction charges of 100 for existing investors and 150 for a first time investor per subscription of ` 10,000 /- and above for the transaction / application received through distributors. The transaction charges shall be deducted by the AMC from the subscription amount received from the investor and paid to the distributor and the balance will be invested in the Scheme. Investors are requested to note that Quantum Mutual Fund is a direct to investor’s Mutual Fund and no transaction charges shall be deducted from the investment amount for transactions / applications received from the distributor and full subscription amount will be invested in the Scheme.
` `
*Cumulative Daily AuM /No of days in the month #AuM as on August 31, 2015
# The mentioned Tax Rates shall be increased by applicable surcharge, if any Education Cess @ 2% and Secondary higher education cess @ 1% where ever as applicable. Equity oriented schemes will also attract Securities Transaction Tax (STT) @ 0.001% at the time of redemption and switch to other schemes.
Growth Option 3.53 3.47
Name of the Scheme This product is suitable for investors who are seeking*
Quantum Index Fund(An Open- ended Exchange Traded Fund)
• Long term capital appreciation• Investments in equity and equity related securities of
companies in CNX Nifty Index.
Product Labeling
Riskometer
27QUANTUM INDEX FUND
LOW HIGH
Hig
hLo
w
derao teM Moderately
High
Investors understand that their principal will be at Moderately High Risk
August 2015

Scheme ^(%) Benchmark (%) # Additional
Benchmark (%) ##
Scheme (`) Benchmark
#(`)
Additional
Benchmark
##(`)
Period V a l u e o f I n v e s t m e n t o f ` 1 0 , 0 0 0 @
June 30, 2014 to June 30, 2015 11.09 11.24 9.31 11,109 11,124 10,931
June 28, 2013 to June 30, 2014 31.39 31.77 31.03 13,139 13,177 13,103
June 29, 2012 to June 28, 2013 11.79 12.00 11.28 11,179 11,200 11,128
Since Inception ** 11.96 11.83 10.40 21,994 21,817 19,949
Quantum Index Fund Performance as on June, 2015
A. Cumulative performance
B. Discrete 12 month performance %
^ Past performance may or may not be sustained in the future. Load is not taken into consideration and Returns are for Growth Option. Returns up to 1 year period are Absolute Returns. Returns greater than 1 year period are compounded annualized (CAGR).
# CNX Nifty TRI ## S&P BSE Sensex @ shows the current value of ` 10,000/- invested at the beginning of a given period
** Inception Date: July 10, 2008. Since inception returns are calculated on NAV of 10 invested at inception.`
Portfolio as on August 31, 2015Name of Instrument Quantity Market
Value In Lakhs
% to Net Asset
Industry
EQUITY & EQUITY RELATEDA) Listed /Awaiting listing on the Stock Exchange
1. Infosys Ltd Software 2,452 26.83 7.732. HDFC Bank Ltd Banks 2,424 24.91 7.183. Housing Development Finance Corporation Ltd Finance 1,939 23.00 6.634. ITC Ltd Consumer Non Durables 6,896 22.42 6.465. ICICI Bank Ltd Banks 7,148 19.86 5.726. Reliance Industries Ltd Petroleum Products 2,033 17.40 5.017. Tata Consultancy Services Ltd Software 629 16.13 4.658. Larsen & Toubro Ltd Construction Project 1,005 16.11 4.649. Sun Pharmaceuticals Industries Ltd Pharmaceuticals 1,340 12.05 3.4710. Axis Bank Ltd Banks 2,071 10.52 3.0311. State Bank of India Banks 3,841 9.50 2.7412. Kotak Mahindra Bank Ltd Banks 1,262 8.22 2.3713. Tata Motors Ltd Auto 2,335 7.94 2.2914. Hindustan Unilever Ltd Consumer Non Durables 873 7.52 2.1715. Mahindra & Mahindra Ltd Auto 571 6.97 2.0116. Maruti Suzuki India Ltd Auto 162 6.75 1.9417.Dr. Reddy's Laboratories Ltd Pharmaceuticals 156 6.71 1.9318.HCL Technologies Ltd Software 683 6.63 1.9119.Bharti Airtel Ltd Telecom - Services 1,693 6.00 1.7320. Coal India Ltd Minerals/Mining 1,577 5.78 1.6721. Lupin Ltd Pharmaceuticals 293 5.67 1.6322. Oil & Natural Gas Corporation Ltd Oil 2,194 5.25 1.5123. Indusind Bank Ltd Banks 598 5.13 1.4824. Asian Paints Ltd Consumer Non Durables 554 4.70 1.35
^ 0.013% ^Tracking Error as on 30 June, 2015 Absolute Since Inception: Annualised Since Inception: 0.207%
NAV per Unit
( )̀
Scheme
Returns (%) ^
Benchmark
Returns (%) #
Additional
Benchmark
Returns (%) ##
Value of Investment of ` 10,000@
Scheme (`) Benchmark
(`) #
Additional
Benchmark
(`) ##
PeriodDate
30-Jun-14 Last 1 Year 795.1015 11.09 11.24 9.31 11,109 11,124 10,931
28-Jun-13 Last 2 Years 605.1312 20.75 21.00 19.62 14,596 14,657 14,323
29-Jun-12 Last 3 Years 541.2984 17.71 17.95 16.79 16,317 16,417 15,939
^ Past performance may or may not be sustained in the future. Load is not taken into consideration and Returns are for Growth Option. Returns up to 1 year period are Absolute Returns. Returns greater than 1 year period are compounded annualized (CAGR).
# CNX Nifty TRI ## S&P BSE Sensex @ shows the current value of ` 10,000/- invested at the beginning of a given period
28 QUANTUM INDEX FUND August 2015
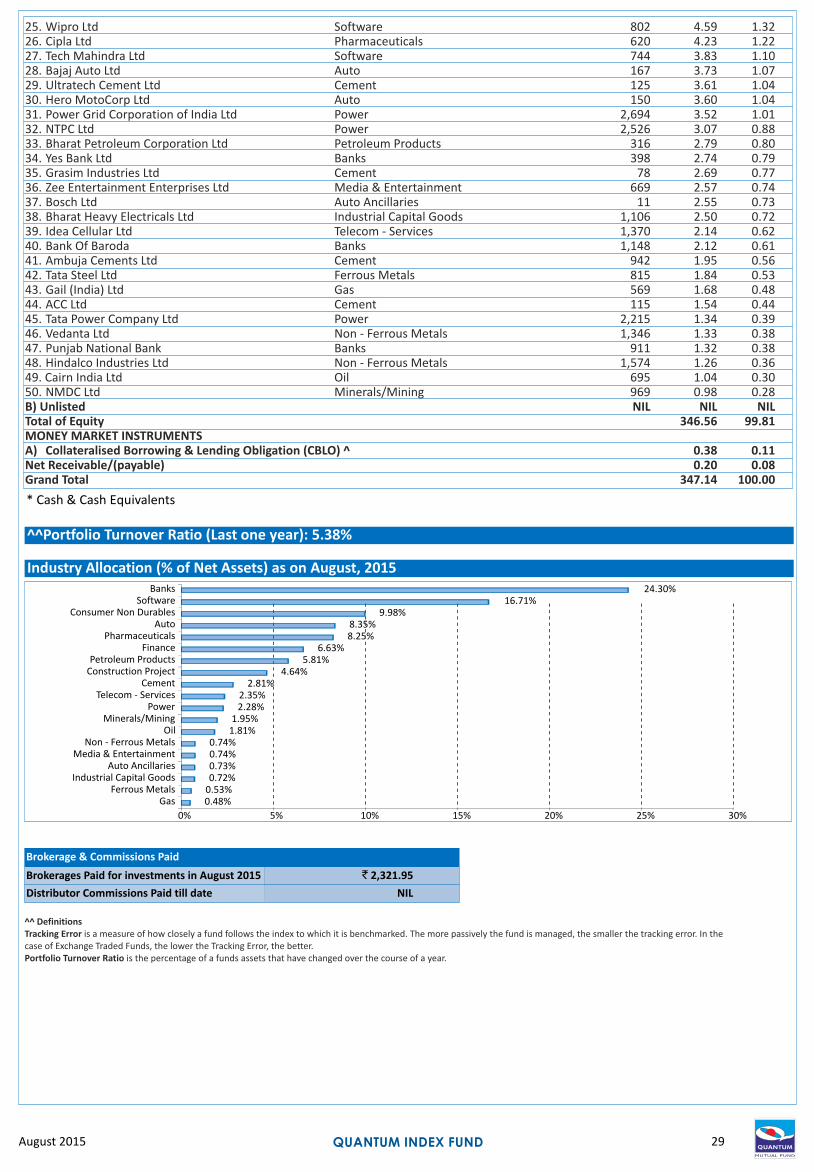
^^Portfolio Turnover Ratio (Last one year): 5.38%
Industry Allocation (% of Net Assets) as on August, 2015
^^ DefinitionsTracking Error is a measure of how closely a fund follows the index to which it is benchmarked. The more passively the fund is managed, the smaller the tracking error. In thecase of Exchange Traded Funds, the lower the Tracking Error, the better.Portfolio Turnover Ratio is the percentage of a funds assets that have changed over the course of a year.
Brokerage & Commissions Paid
Brokerages Paid for investments in August 2015 `
Distributor Commissions Paid till date NIL
2,321.95
29QUANTUM INDEX FUND
* Cash & Cash Equivalents
August 2015
25. Wipro Ltd Software 802 4.59 1.3226. Cipla Ltd Pharmaceuticals 620 4.23 1.2227. Tech Mahindra Ltd Software 744 3.83 1.1028. Bajaj Auto Ltd Auto 167 3.73 1.0729. Ultratech Cement Ltd Cement 125 3.61 1.0430. Hero MotoCorp Ltd Auto 150 3.60 1.0431. Power Grid Corporation of India Ltd Power 2,694 3.52 1.0132. NTPC Ltd Power 2,526 3.07 0.8833. Bharat Petroleum Corporation Ltd Petroleum Products 316 2.79 0.8034. Yes Bank Ltd Banks 398 2.74 0.7935. Grasim Industries Ltd Cement 78 2.69 0.7736. Zee Entertainment Enterprises Ltd Media & Entertainment 669 2.57 0.7437. Bosch Ltd Auto Ancillaries 11 2.55 0.7338. Bharat Heavy Electricals Ltd Industrial Capital Goods 1,106 2.50 0.7239. Idea Cellular Ltd Telecom - Services 1,370 2.14 0.6240. Bank Of Baroda Banks 1,148 2.12 0.6141. Ambuja Cements Ltd Cement 942 1.95 0.5642. Tata Steel Ltd Ferrous Metals 815 1.84 0.5343. Gail (India) Ltd Gas 569 1.68 0.4844. ACC Ltd Cement 115 1.54 0.4445. Tata Power Company Ltd Power 2,215 1.34 0.3946. Vedanta Ltd Non - Ferrous Metals 1,346 1.33 0.3847. Punjab National Bank Banks 911 1.32 0.3848. Hindalco Industries Ltd Non - Ferrous Metals 1,574 1.26 0.3649. Cairn India Ltd Oil 695 1.04 0.3050. NMDC Ltd Minerals/Mining 969 0.98 0.28B) Unlisted NIL NIL NIL Total of Equity 346.56 99.81MONEY MARKET INSTRUMENTS A) Collateralised Borrowing & Lending Obligation (CBLO) ^ 0.38 0.11Net Receivable/(payable) 0.20 0.08Grand Total 347.14 100.00
0.48%0.53%0.72%0.73%0.74%0.74%
1.81%1.95%
2.28%2.35%
2.81%4.64%
5.81%6.63%
8.25%8.35%
9.98%16.71%
24.30%
0% 5% 10% 15% 20% 25% 30%
GasFerrous Metals
Industrial Capital GoodsAuto Ancillaries
Media & EntertainmentNon - Ferrous Metals
OilMinerals/Mining
PowerTelecom - Services
CementConstruction ProjectPetroleum Products
FinancePharmaceuticals
AutoConsumer Non Durables
SoftwareBanks

SCHEME PERFORMANCE - FUND MANAGER-WISEATUL KUMAR
QUANTUM LONG TERM EQUITY FUND
Past performance may or may not be sustained in the future. # S&P BSE 30 TRI ## S&P BSE Sensex.
Load is not taken into consideration and Returns are for Growth Option using applicable NAV on the SIP day (5th of every month). Return on SIP and Benchmark are annualized and compounded
investment return for cash flows resulting out of uniform and regular monthly subscriptions as on 5th day of every month (in case 5th is a non-Business Day, then the next Business Day) and have been
worked out using the Excel spreadsheet function known as XIRR. XIRR calculates the internal rate of return for series of cash flow. Assuming .̀ 1,000 invested every month on 5th day of every month (in
case 5th is a non-Business Day, then the next Business Day), the 1 year, 3 years, 5 years and since inception returns from SIP are annualized and compounded investment return computed on the
assumption that SIP installments were received across the time periods from the start date of SIP from the end of the relevant period viz. 1 year, 3 years, 5 years and since Inception.
*XIRR - XIRR calculates the internal rate of return to measure and compare the profitability of series of investments.
The Scheme is co-managed by Atul Kumar and Nilesh Shetty.
Past performance may or may not be sustained in the future. # S&P BSE 30 TRI ## S&P BSE Sensex.
Load is not taken into consideration and Returns are for Growth Option using applicable NAV on the SIP day (5th of every month). Return on SIP and Benchmark are annualized and compounded
investment return for cash flows resulting out of uniform and regular monthly subscriptions as on 5th day of every month (in case 5th is a non-Business Day, then the next Business Day) and have been
worked out using the Excel spreadsheet function known as XIRR. XIRR calculates the internal rate of return for series of cash flow. Assuming .̀ 1,000 invested every month on 5th day of every month (in
case 5th is a non-Business Day, then the next Business Day), the 1 year, 3 years, 5 years and since inception returns from SIP are annualized and compounded investment return computed on the
assumption that SIP installments were received across the time periods from the start date of SIP from the end of the relevant period viz. 1 year, 3 years, 5 years and since Inception.
*XIRR - XIRR calculates the internal rate of return to measure and compare the profitability of series of investments.
June 30, 14 to June 30, 15 9.74 10.96 9.31 10,974 11,096 10,931
June 28, 13 to June 30, 14 44.50 32.87 31.03 14,450 13,287 13,103
June 29, 12 to June 28, 13 9.76 13.15 11.28 10,976 11,315 11,128
Since Inception ** 15.59 12.31 10.68 38,520 29,456 25,714
NAV
per Unit
( )̀
Scheme
Returns
(%) ^
Benchmark
Returns
(%) #
Additional
Benchmark
Returns (%)
##
Value o f I nvestment o f ̀ 10,000@
Scheme
(`)
Benchmark
(`) #
Additional
Benchmark
(`) ##
PeriodDate
30-Jun-14 Last 1 Year 35.1000 9.74 10.96 9.31 10,974 11,096 10,931
28-Jun-13 Last 2 Years 24.2900 25.85 21.36 19.62 15,858 14,744 14,323
29-Jun-12 Last 3 Years 22.1300 20.27 18.58 16.79 17,406 16,682 15,939
^Past performance may or may not be sustained in the future. Returns greater than 1 year period are compounded annualized (CAGR). # S&P BSE 30 TRI ## S&P BSE Sensex @ shows the current value of 10,000/- invested at the beginning of a given period
Load is not taken into consideration and Returns are for Growth Option. Returns up to 1 year period are Absolute Returns. `
** Inception Date: Mar 13, 2006. Since inception returns are calculated on NAV of ` 10 invested at inception.
Scheme (%) ^
Benchmark
(%) #
AdditionalBenchmark
(%) ##
Period Value of Investment of ` 10,000@
Scheme (̀ ) Benchmark
(̀ ) #
Additional Benchmark
(̀ ) ##
QUANTUM TAX SAVING FUND
^Past performance may or may not be sustained in the future. Returns greater than 1 year period are compounded annualized (CAGR). # S&P BSE 30 TRI ## S&P BSE Sensex @ shows the current value of 10,000/- invested at the beginning of a given period** Inception Date: Dec 23, 2008. Since inception returns are calculated on NAV of 10 invested at inception.
Load is not taken into consideration and Returns are for Growth Option. Returns up to 1 year period are Absolute Returns. `
`
A. Cumulative performance B. Discrete 12 month (%)performance
A. Cumulative performance B. Discrete 12 month (%)performance
^^Standard Deviation: 15.12% Beta: 0.66 Sharpe Ratio: 1.64
^^Standard Deviation: 19.12% Beta: 0.70 Sharpe Ratio: 0.88
June 30, 14 to June 30, 15 9.69 10.96 9.31 10,969 11,096 10,931
June 28, 13 to June 30, 14 44.34 32.87 31.03 14,434 13,287 13,103
June 29, 12 to June 28, 13 9.64 13.15 11.28 10,964 11,315 11,128
Since Inception ** 22.73 19.29 17.53 38,040 31,599 28,679
NAV
per Unit
( )̀
Scheme
Returns
(%) ^
Benchmark
Returns
(%) #
Additional
Benchmark
Returns (%)
##
Value o f I nvestment o f ̀ 10,000@
Scheme
(`)
Benchmark
(`) #
Additional
Benchmark
(`) ##
PeriodDate
30-Jun-14 Last 1 Year 34.6800 9.69 10.96 9.31 10,969 11,096 10,931
28-Jun-13 Last 2 Years 24.0270 25.75 21.36 19.62 15,832 14,744 14,323
29-Jun-12 Last 3 Years 21.9140 20.16 18.58 16.79 17,359 16,682 15,939
Scheme (%) ^
Benchmark
(%) #
AdditionalBenchmark
(%) ##
Period Value of Investment of ` 10,000@
Scheme (̀ ) Benchmark
(̀ ) #
Additional Benchmark
(̀ ) ##
SIP Performance of Quantum Tax Saving Fund as on June 30, 2015
Since Inception SIP 5 Year SIP 3 Year SIP 1 Year SIP
Total Amount Invested (Rs.‘000) 78 60 36 12
Mkt Value as on June 30, 15 (Rs.‘000) 138.808 90.939 48.532 12.237
Returns (XIRR*) (%) 17.58 16.75 20.60 3.79
Benchmark Returns (XIRR*) (%) # 14.68 14.76 18.25 3.41
Additional Benchmark Returns (XIRR*) (%) ## 12.94 13.06 16.59 1.79
SCHEME PERFORMANCE - FUND MANAGER - WISE30
Since Inception SIP 5 Year SIP 3 Year SIP 1 Year SIP
Total Amount Invested (Rs.‘000) 111 60 36 12
Mkt Value as on June 30, 15 (Rs.‘000) 246.041 91.284 48.660 12.304
Returns (XIRR*) (%) 16.57 16.90 20.79 4.87
Benchmark Returns (XIRR*) (%) # 12.47 14.76 18.25 3.41
Additional Benchmark Returns (XIRR*) (%) ## 10.86 13.06 16.59 1.79
SIP Performance of Quantum Long Term Equity Fund as on June 30, 2015
August 2015

June 30, 14 to June 30, 15 -7.01 -4.58 9,299 9,542
June 28, 13 to June 30, 14 10.29 10.80 11,029 11,080
June 29, 12 to June 28, 13 -15.29 -14.78 8,471 8,522
Since Inception ** 3.38 4.96 11,468 12,207
NAV
per Unit
( )̀
Scheme
Returns
(%) ^
Benchmark
Returns
(%) #
Value o f I nvestment o f ̀ 10,000@
Scheme
(`)
Benchmark
(`) #
PeriodDate
30-Jun-14 Last 1 Year 12.3330 -7.01 -4.58 9,299 9,542
28-Jun-13 Last 2 Years 11.1821 1.27 2.81 10,256 10,572
29-Jun-12 Last 3 Years 13.1997 -4.58 -3.41 8,688 9,009
Scheme (%) ^
Benchmark
(%) #
Period Value of Investment of ` 10,000@
Scheme (̀ ) Benchmark
(̀ ) #
SIP Performance of Quantum Equity Fund of Funds as on June 30, 2015
Since Inception SIP 5 Year SIP 3 Year SIP 1 Year SIP
Total Amount Invested (Rs.‘000) 71 60 36 12
Mkt Value as on June 30, 15 (Rs.‘000) 119.631 96.968 52.915 12.670
Returns (XIRR*) (%) 17.60 19.39 26.95 10.81
Benchmark Returns (XIRR*) (%) # 12.74 14.11 18.97 4.98
Additional Benchmark Returns (XIRR*) (%) ## 11.98 13.06 16.59 1.79
CHIRAG MEHTA
QUANTUM EQUITY FUND OF FUNDS
Past performance may or may not be sustained in the future. # S&P BSE 200 INDEX ## S&P BSE Sensex.
Load is not taken into consideration and Returns are for Growth Option using applicable NAV on the SIP day (5th of every month). Return on SIP and Benchmark are annualized and compounded
investment return for cash flows resulting out of uniform and regular monthly subscriptions as on 5th day of every month (in case 5th is a non-Business Day, then the next Business Day) and have been
worked out using the Excel spreadsheet function known as XIRR. XIRR calculates the internal rate of return for series of cash flow. Assuming ` 1,000 invested every month on 5th day of every month (in
case 5th is a non-Business Day, then the next Business Day), the 1 year, 3 years, 5 years and since inception returns from SIP are annualized and compounded investment return computed on the
assumption that SIP installments were received across the time periods from the start date of SIP from the end of the relevant period viz. 1 year, 3 years, 5 years and since Inception.
*XIRR - XIRR calculates the internal rate of return to measure and compare the profitability of series of investments.
QUANTUM GOLD SAVINGS FUND
^ Past performance may or may not be sustained in the future. Load is not taken into consideration and Returns are for Growth Option. Returns up to 1 year period are Absolute Returns. Returns greater than 1 year period are compounded annualized (CAGR). # Domestic Price of Gold @ shows the current value of 10,000/- invested at the beginning of a given period** Inception Date: May 19, 2011. Since inception returns are calculated on NAV of 10 invested at inception.
``
Past performance may or may not be sustained in the future. # Domestic Price of Gold
Load is not taken into consideration and Returns are for Growth Option using applicable NAV on the SIP day (5th of every month). Return on SIP and Benchmark are annualized and compounded
investment return for cash flows resulting out of uniform and regular monthly subscriptions as on 5th day of every month (in case 5th is a non-Business Day, then the next Business Day) and have been
worked out using the Excel spreadsheet function known as XIRR. XIRR calculates the internal rate of return for series of cash flow. Assuming ` 1,000 invested every month on 5th day of every month (in
case 5th is a non-Business Day, then the next Business Day), the 1 year, 3 years and since inception returns from SIP are annualized and compounded investment return computed on the assumption that
SIP installments were received across the time periods from the start date of SIP from the end of the relevant period viz. 1 year, 3 years and since Inception.
*XIRR - XIRR calculates the internal rate of return to measure and compare the profitability of series of investments.
^ Past performance may or may not be sustained in the future. Load is not taken into consideration and Returns are for Growth Option. Returns up to 1 year period are Absolute Returns. Returns greater
than 1 year period are compounded annualized (CAGR).
# S&P BSE 200 INDEX ## S&P BSE Sensex @ shows the current value of ` 10,000/- invested at the beginning of a given period
** Inception Date: July 20, 2009. Since inception returns are calculated on NAV of ` 10 invested at inception.
B. Discrete 12 month (%)performanceA. Cumulative performance
A. Cumulative performance B. Discrete 12 month (%)performance
^^Standard Deviation: 14.96% Beta: 0.88 Sharpe Ratio: 1.12
June 30, 14 to June 30, 15 17.57 12.01 9.31 11,757 11,201 10,931
June 28, 13 to June 30, 14 49.63 34.45 31.03 14,963 13,445 13,103
June 29, 12 to June 28, 13 6.85 8.69 11.28 10,685 10,869 11,128
Since Inception ** 16.53 11.32 10.68 24,852 18,931 18,288
NAV
per Unit
( )̀
Scheme
Returns
(%) ^
Benchmark
Returns
(%) #
Additional
Benchmark
Returns (%)
##
Value o f I nvestment o f ̀ 10,000@
Scheme
(`)
Benchmark
(`) #
Additional
Benchmark
(`) ##
PeriodDate
30-Jun-14 Last 1 Year 21.1380 17.57 12.01 9.31 11,757 11,201 10,931
28-Jun-13 Last 2 Years 14.1270 32.53 22.65 19.62 17,592 15,059 14,323
29-Jun-12 Last 3 Years 13.2210 23.39 17.83 16.79 18,797 16,367 15,939
Scheme (%) ^
Benchmark
(%) #
AdditionalBenchmark
(%) ##
Period Value of Investment of ` 10,000@
Scheme (̀ ) Benchmark
(̀ ) #
Additional Benchmark
(̀ ) ##
SIP Performance of Quantum Gold Savings Fund as on June 30, 2015
Since Inception SIP 3 Year SIP 1 Year SIP
Total Amount Invested (Rs.‘000) 49 36 12
Mkt Value as on June 30, 15 (Rs.‘000) 45.192 32.812 11.764
Returns (XIRR*) (%) -3.89 -5.99 -3.72
Domestic Price of Gold Returns (XIRR*) (%) # -1.94 -3.61 -1.50
31SCHEME PERFORMANCE - FUND MANAGER - WISEAugust 2015

SCHEME PERFORMANCE - FUND MANAGER-WISE
QUANTUM MULTI ASSET FUND
^ Past performance may or may not be sustained in the future.
Load is not taken into consideration and Returns are for Growth Option. Returns up to 1 year period are Absolute Returns. Returns greater than 1 year period are compounded annualized (CAGR).
# Crisil Composite Bond Fund Index (40%)+S&P BSE Sensex Total return Index (40%)+Domestic price of gold (20%)
@ shows the current value of ` 10,000/- invested at the beginning of a given period
** Inception Date: July 11, 2012. Since inception returns are calculated on NAV of ` 10 invested at inception.
Past performance may or may not be sustained in the future. # Crisil Composite Bond Fund Index (40%)+S&P BSE Sensex Total return Index (40%)+Domestic price of gold (20%)
Load is not taken into consideration and Returns are for Growth Option using applicable NAV on the SIP day (5th of every month). Return on SIP and Benchmark are annualized and compounded
investment return for cash flows resulting out of uniform and regular monthly subscriptions as on 5th day of every month (in case 5th is a non-Business Day, then the next Business Day) and have been
worked out using the Excel spreadsheet function known as XIRR. XIRR calculates the internal rate of return for series of cash flow. Assuming ` 1,000 invested every month on 5th day of every month (in
case 5th is a non-Business Day, then the next Business Day), the 1 year and since inception returns from SIP are annualized and compounded investment return computed on the assumption that SIP
installments were received across the time periods from the start date of SIP from the end of the relevant period viz. 1 year and since Inception.
*XIRR - XIRR calculates the internal rate of return to measure and compare the profitability of series of investments.
The Scheme is co-managed by Chirag Mehta and Nilesh Shetty.
^ Past performance may or may not be sustained in the future. Load is not taken into consideration and Returns are for Growth Option. Returns up to 1 year period are Absolute Returns. Returns greater than 1 year period are compounded annualized (CAGR). # Domestic Price of Physical Gold @ shows the current value of 10,000/- invested at the beginning of a given period** Inception Date: February 22, 2008. Since inception returns are calculated on NAV of 10 invested at inception.
``
A. Cumulative performance
NAV
per Unit
( )̀
Scheme
Returns
(%) ^
Benchmark
Returns
(%) #
Value o f I nvestment o f ̀ 10,000@
Scheme
(`)
Benchmark
(`) #
PeriodDate
30-Jun-14 Last 1 Year 12.7131 7.54 8.64 10,754 10,86428-Jun-13 Last 2 Years 10.5434 13.83 12.98 12,967 12,773
Scheme (%)
^
June 30, 14 to June 30, 15 7.54 8.64 10,754 10,864
June 28, 13 to June 30, 14 20.58 17.57 12,058 11,757
Since Inception ** 11.09 10.90 13,671 13,601
B. Discrete 12 month (%)performance
Benchmark
(%) #
Period Value of Investment of ` 10,000@
Scheme (̀ ) Benchmark
(̀ ) #
Scheme (%) ^
^ 0.005% ^Tracking Error as on 31 March, 2015 Absolute Since Inception: Annualised Since Inception: 0.080%
^^ Definitions
Standard deviation measures historical volatility. A high standard deviation suggests high volatility, while lower standard deviation would refer to more stability.
Beta is the tendency of a fund's returns to respond to market swings. A beta of 1 indicates that the fund price will move with the market. A beta of less than 1 means that thesecurity will
be less volatile than the market. A beta of greater than 1 indicates that the security's price will be more volatile than the market.
Sharpe Ratio is used to characterise how well the return of an asset compensates the investor for the risk taken. The greater a portfolio's Sharpe ratio, the better its risk-adjusted
performance has been.
Portfolio Turnover Ratio is the percentage of a funds assets that have changed over the course of a year.
Tracking Error is a measure of how closely a fund follows the index to which it is benchmarked. The more passively the fund is managed, the smaller the tracking error. In the
case of Exchange Traded Funds, the lower the Tracking Error, the better.
^^Standard Deviation: 5.22% Beta: 0.50 Sharpe Ratio: 1.45
SIP Performance of Quantum Multi Asset Fund as on June 30, 2015Since Inception SIP 1 Year SIP
Total Amount Invested (Rs.‘000) 35 12
Mkt Value as on June 30, 15 (Rs.‘000) 41.028 12.308
Returns (XIRR*) (%) 11.02 4.93
10.99 4.73Benchmark Returns (XIRR*) (%) #
QUANTUM GOLD FUND
June 30, 14 to June 30, 15 -5.54 -4.58 9,446 9,542
June 28, 13 to June 30, 14 9.73 10.80 10,973 11,080
June 29, 12 to June 28, 13 -15.62 -14.78 8,438 8,522
Since Inception ** 10.49 11.13 20,830 21,745
NAV
per Unit
( )̀
Scheme
Returns
(%) ^
Benchmark
Returns
(%) #
Value o f I nvestment o f ̀ 10,000@
Scheme
(`)
Benchmark
(`) #
PeriodDate
30-Jun-14 Last 1 Year 1,307.3237 -5.54 -4.58 9,446 9,542
28-Jun-13 Last 2 Years 1,191.3682 1.81 2.81 10,366 10,572
29-Jun-12 Last 3 Years 1,411.9845 -4.36 -3.41 8,746 9,009
Scheme (%) ^
Benchmark
(%) #
Period Value of Investment of ` 10,000@
Scheme (̀ ) Benchmark
(̀ ) #
B. Discrete 12 month (%)performanceA. Cumulative performance
32 SCHEME PERFORMANCE - FUND MANAGER - WISE August 2015

Disclaimer, Statutory Details & Risk Factors:
Mutual fund investments are subject to market risks read all scheme related documents carefully.
Please visit – www.Quantummf.com to read scheme specific risk factors. Investors in the Scheme(s) are not being offered a guaranteed or assured rate of return and there can be no assurance that the schemes objective will be achieved and the NAV of the scheme(s) may go up and down depending upon the factors and forces affecting securities market. Investment in mutual fund units involves investment risk such as trading volumes, settlement risk, liquidity risk, default risk including possible loss of capital. Past performance of the sponsor / AMC / Mutual Fund does not indicate the future performance of the Scheme(s). Statutory Details:Quantum Mutual Fund (the Fund) has been constituted as a Trust under the Indian Trusts Act, 1882. Sponsor : Quantum Advisors Private Limited. (liability of Sponsor limited to Rs. 1,00,000/-) Trustee : Quantum Trustee Company Private Limited Investment Manager : Quantum Asset Management Company Private Limited. The Sponsor, Trustee and Investment Manager are incorporated under the Companies Act, 1956.
Scheme Specific Risk Factors : The investors of Quantum Equity Fund of Funds, Quantum Gold Savings Fund and Quantum Multi Asset Fund will bear the recurring expenses, transaction charges and loads if any of the Schemes in addition to the expenses, transaction charges and loads of the underlying Schemes.
Disclaimer of IISL: Quantum Index Fund (QIF) is benchmarked to CNX Nifty Index are not sponsored, endorsed, sold or promoted by India Index Services & Products Limited (IISL). IISL is not responsible for any errors or omissions or the results obtained from the use of such index and in no event shall IISL have any liability to any party for any damages of whatsoever nature (including lost profits) resulted to such party due to purchase or sale or otherwise of such product benchmarked to such index. Please refer SID of the QIF for full Disclaimer clause in relation to the "CNX Nifty Index".
Disclaimer of NSE: It is to be distinctly understood that the permission given by National Stock Exchange of India Limited (NSE) should not in any way be deemed or construed that the Scheme Information Document (SID) of Quantum Gold Fund (QGF) and Quantum Index Fund (QIF) has been cleared or approved by NSE nor does it certify the correctness or completeness of any of the contents of the SIDs. The investors are advised to refer to the SID of QIF for the full text of the Disclaimer clause of NSE.
Want To Have The Latest Information About Us?
Registered Office: Quantum Asset Management Company Pvt Ltd.505, Regent Chambers, 5th floor, Nariman Point, Mumbai - 400 021Corporate Identity Number (CIN): U65990MH2005PTC156152
Statutory Details & Risk FactorsSTATUTORY DETAILS & RISK FACTORS
33STATUTORY DETAILS & RISK FACTORSAugust 2015
Related Documents


![EDELWEISS DYNAMIC GROWTH EQUITY [EDGE] FUND –AUGUST’21](https://static.cupdf.com/doc/110x72/620511382824c731af332745/edelweiss-dynamic-growth-equity-edge-fund-august21.jpg)


