Block Engineering - FACSS 2011 ANALYTICAL SCIENCE AND INNOVATION OCTOBER 2-7, Reno, NV Block Engineering - Quantum Cascade Laser Spectroscopy to Detect Trace Contamination Adam Erlich, Frederick G. Haibach, Ph.D ., and Jeffrey W. Sherman, Ph.D October 2, 2011

Welcome message from author
This document is posted to help you gain knowledge. Please leave a comment to let me know what you think about it! Share it to your friends and learn new things together.
Transcript

Block Engineering -
FACSS 2011ANALYTICAL SCIENCE AND INNOVATIONOCTOBER 2-7, Reno, NV
Block Engineering -Quantum Cascade Laser Spectroscopy to Detect
Trace ContaminationAdam Erlich, Frederick G. Haibach, Ph.D.,
and Jeffrey W. Sherman, Ph.D
October 2, 2011

� QCL Spectroscopy to Detect Trace Contamination
� History and background of QCLs
� Implementation of a broadly tunable device
� QCL Spectrometer integration
Outline
� QCL Spectrometer integration
� Spectral Data from various cases of trace contamination applications
� Technology Improvements
� Summary and Q&A

� QCLs are semiconductor lasers that emit in the mid- to far-infrared
� First demonstrated by Jerome Faist, Federico Capasso, et al. at Bell Laboratories in the early 90’s
� QCL are fabricated using III-V semiconductors such as InP & InGaAs
� Fabrication by depositing very thin layers of III-V materials generally
QCL History and Background
� Fabrication by depositing very thin layers of III-V materials generally using molecular beam epitaxy (MBE) machines
� Quantum Cascade gain media produces incoherent light in a superluminescent configuration
� If a wavelength-selective element is included in an external cavity configuration, it is possible to reduce the emission to a single wavelength (single-mode or multi-mode), and tune the radiation
� Coatings on both sides create a Fabry-Perot laser cavity
� Distributed feedback (DFB) QCLs enable single mode operation
� Thermal control can tune a fixed cavity over a narrow range
� Diffraction gratings have tuned a QCL over several hundred cm-1
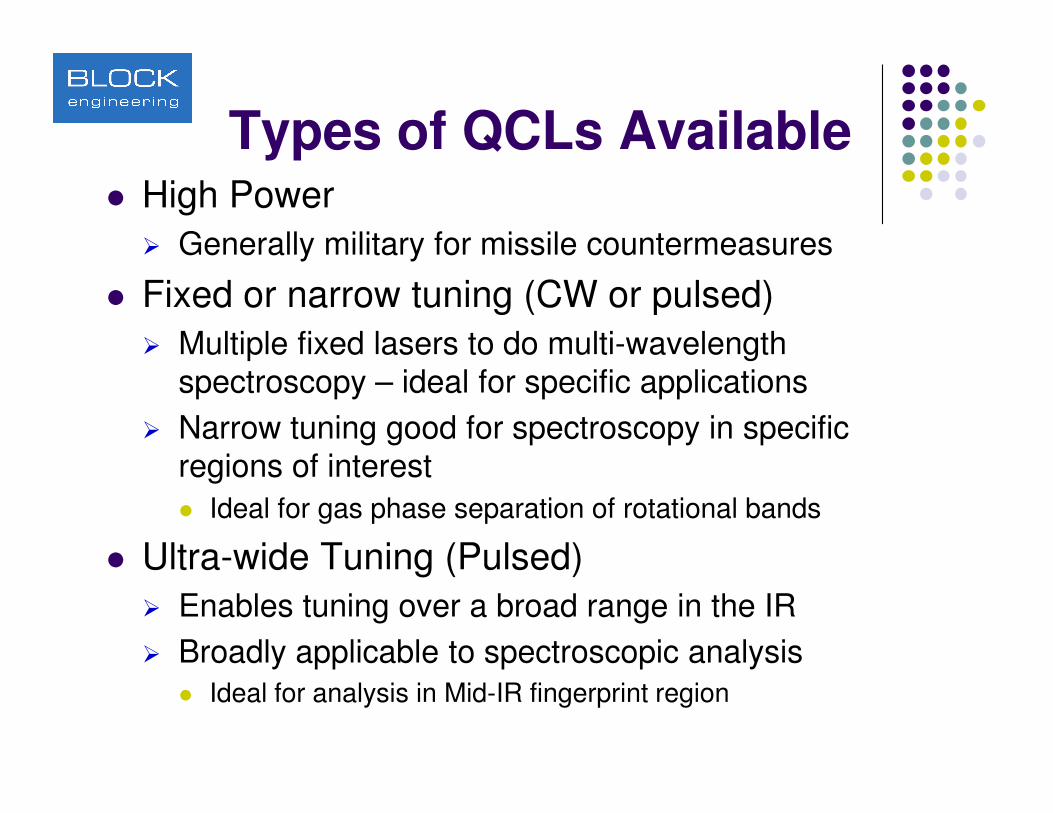
� High Power
� Generally military for missile countermeasures
� Fixed or narrow tuning (CW or pulsed)
� Multiple fixed lasers to do multi-wavelength spectroscopy – ideal for specific applications
Types of QCLs Available
� Narrow tuning good for spectroscopy in specific regions of interest
� Ideal for gas phase separation of rotational bands
� Ultra-wide Tuning (Pulsed)
� Enables tuning over a broad range in the IR
� Broadly applicable to spectroscopic analysis
� Ideal for analysis in Mid-IR fingerprint region

Quantum Cascade Laser
Electrons emit a cascade of photons as they undergo sub-band transitions while passing through a stack of quantum wells. The slant represents the electric field applied across the QCL
*Images from Laser Focus World

External Cavity Configuration
QuantumCascade
Chip
Laser Cavity LensOutput Lens
Diffraction Grating
Laseroutput
Angle of the grating selects the wavelength of the diffracted light which couples back into the QCL chip
and creates a Laser at a single wavelength
Laser Cavity
RotationCenter point

System Architecture

Pre-dispersive Spectroscopy
QCL
Detector
Reflecta
nce
Wavelength

High Sensitivity Mid-Infrared Absorption Spectroscopy
• Quantum Cascade Laser Source
• 6-12 µm
• 1667-833 cm-1
• 0.5 cm-1 spectral resolution
LaserScan™ Analyzer
• 0.5 cm-1 spectral resolution
• Short standoff (6 inches to 3 feet)
• Detects sub-micron to 50 micron films
• Detects concentrations ~1 µg/cm2
• Off-the-shelf accessories for point detection
• Gases/Liquids/Solids
Lasers are eye safe

� Stand-off remote spectral analysis where a portable QCL based system is capable of analyzing samples that are inches to feet away from the instrument using a collimated source
� IR microscopy opportunities for measuring small
Example IR Applications that Benefit from a QCL Light source
� IR microscopy opportunities for measuring small samples or where a sample can be examined effectively with only a few discrete wavelengths
� High speed spectral acquisition applications that benefit from rapid scan operation; time resolved and time dependent measurements

Spectral Radiance Comparison QCL vs FTIR
� Spectral radiance is radiance per wavelength –QCL is a high brightness, very small dimension source
� A lot of power can be focused to a small areaQCL
A lot of power can be focused to a small areaQCL
FTIR

Completely self-contained spectrometer system
� Chemometrics algorithms can be built-in
� A broadly tunable mid-IR laser
Currently 6-10 and 7-12 µm configurations, “fingerprint region”
Performance
� Currently 6-10 and 7-12 µm configurations, “fingerprint region”
� 200 kHz repetition rate ~200 nsec pulse width
� Minimizes noise and stray light
� Can be modified for specific applications
� Analysis of each pulse on MCT detector
� High speed electronics & full embedded spectral analysis
� High spectral intensity IR source
� Measurements of highly absorbing samples
� Open path and stand-off surface measurements
� Eye-safe (2-12 mW average power & 2X5 mm beam)
� Compatible with standard FTIR accessories
� Resolution and scan speed are independent
Performance
� Resolution and scan speed are independent
� No slit or apertures required
� Collimated, small aperture source
� <20 micron diffraction-limited images for microscopy
� Efficient fiber-optic coupling and microATR interfacing
� Inherently polarized source
� Simplifies experiments (such as VCD) where power and polarization are necessary
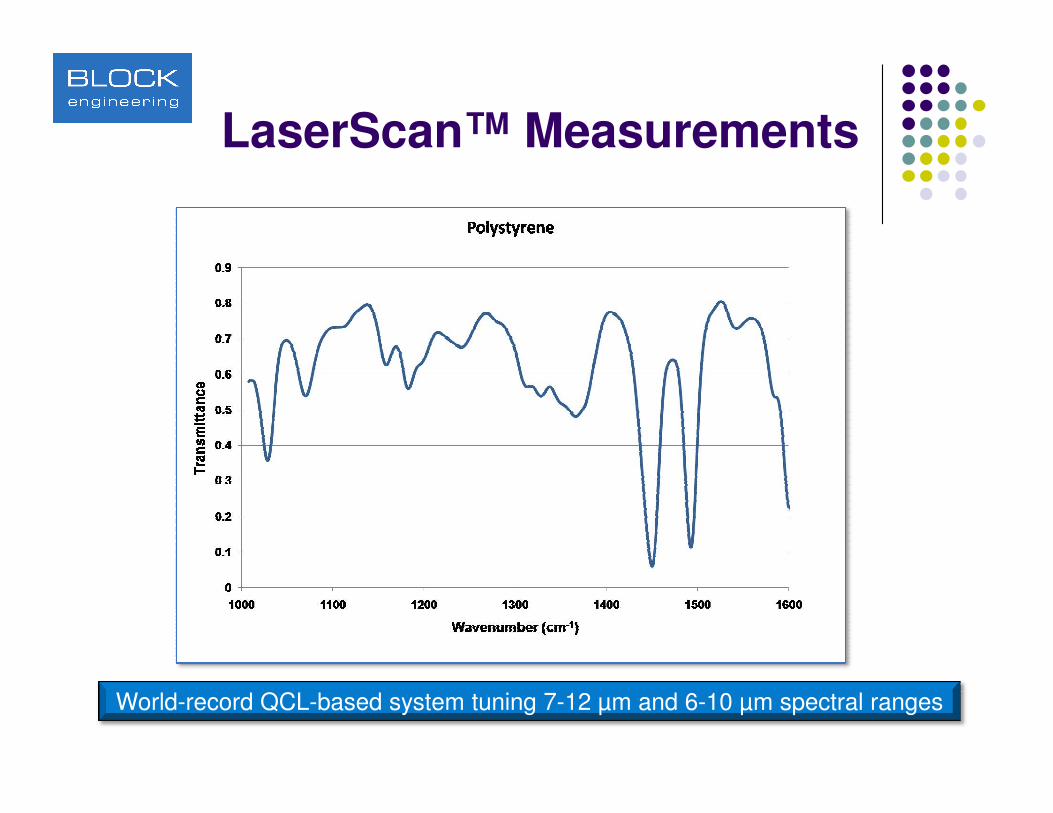
LaserScan™ Measurements
World-record QCL-based system tuning 7-12 µm and 6-10 µm spectral ranges
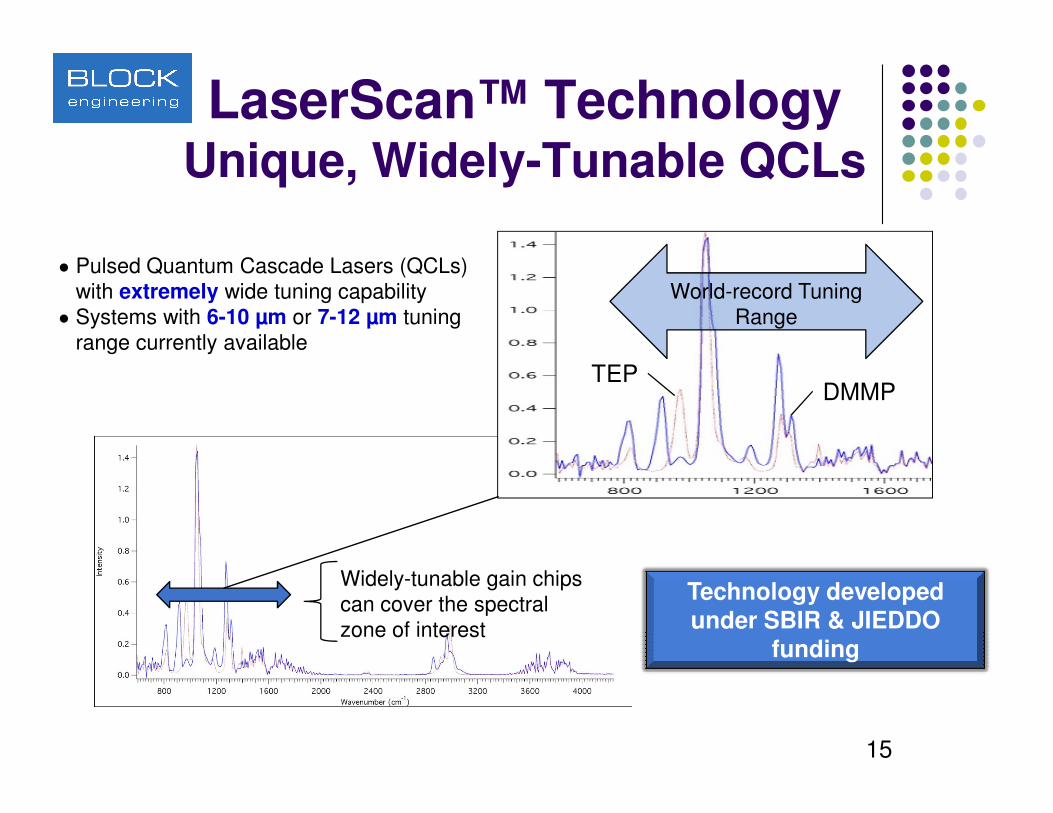
LaserScan™ TechnologyUnique, Widely-Tunable QCLs
● Pulsed Quantum Cascade Lasers (QCLs)
with extremely wide tuning capability
● Systems with 6-10 µm or 7-12 µm tuning
range currently available
World-record Tuning
Range
DMMPTEP
15
Widely-tunable gain chips
can cover the spectral
zone of interest
Technology developed under SBIR & JIEDDO
funding

Example Configurations
� Lab bench-top version� Used for interfacing to
accessories such as a microscope
� Can be directly interfaced to optical fibers
� Portable, handheld version for remote/ stand-off detection of materials
� Measurements can be made several meters from the target
� Can be used for dangerous substance detection
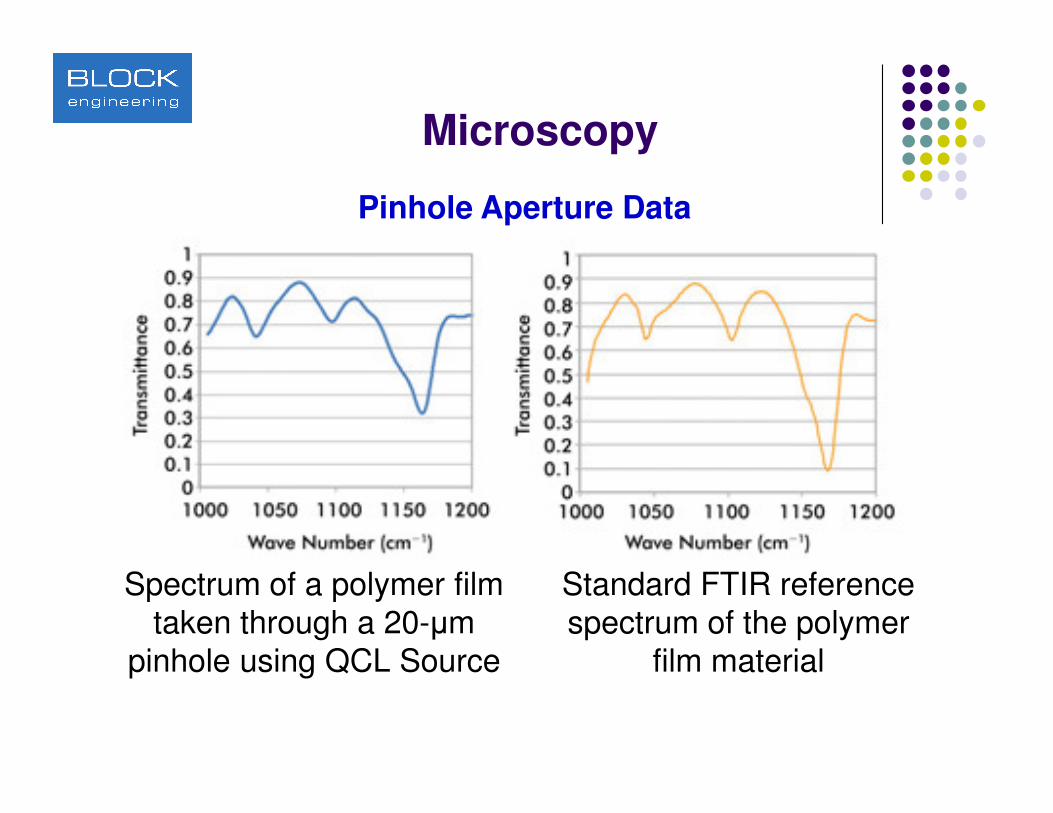
Microscopy
Pinhole Aperture Data
Spectrum of a polymer film taken through a 20-µm
pinhole using QCL Source
Standard FTIR reference spectrum of the polymer
film material

Vapor Phase Detection
1
2
Ab
so
rba
nc
e (
no
rma
lize
d, s
mo
oth
ed
)
QCL
1
2
Ab
so
rba
nc
e (
no
rma
lize
d, s
mo
oth
ed
)
WaterAcetone
� Analysis in off-the-shelf FTIR gas cell
� FTIR spectra from PNL library
0
110012001300140015001600
Ab
so
rba
nc
e (
no
rma
lize
d, s
mo
oth
ed
)
Wavenumber (cm-1)
QCL
FTIR
0
110012001300140015001600A
bs
orb
an
ce
(n
orm
alize
d, s
mo
oth
ed
)
Wavenumber (cm-1)
QCL
FTIR

Standoff Contaminant Detection
2
3
Ab
so
rba
nc
e (
no
rma
lize
d, o
ffs
et)
acetaminophen
polyvinyl alcohol
Trace contamination measured on rough aluminum coupons at 6-inches compare to transmission spectra
0
1
83088093098010301080113011801230
Ab
so
rba
nc
e (
no
rma
lize
d, o
ffs
et)
Wavenumber (cm-1)
polyvinyl acetate

Applications
• Analyze gases for process control• Detect explosives or chemical agents• Control drug manufacturing quality
Selected Value Propositions
• Evaluate cancer or stem cells
Security Research Industry
20
Explosives
Chemical Agents
Non-Traditional Agents
Drug Discovery
Stem Cells Analysis
Cancer Detection
Gas Detection
Pharma Cleaning Validation
Material Identification

Stand-Off Analysis of Surfaces
Applications•Contamination Detection•Coatings Analysis• Polymer Degradation
Value Proposition•No Liquid N2 or Purge •High Sensitivity•Analyze Rough Surfaces• Standoff Measurement• Faster Than FTIR
• Polymer Degradation• On-line moving web• QC/QA
Contaminated Surface or Material of Interest

First Responder Chemical Threat Detection
Application• Detect Various Agents… Chemical Warfare, Non-Traditional Agents , Biological & Explosives
Value Proposition• Standoff surface detector• Gases, liquid, & solid single device• Gases, liquid, & solid single device
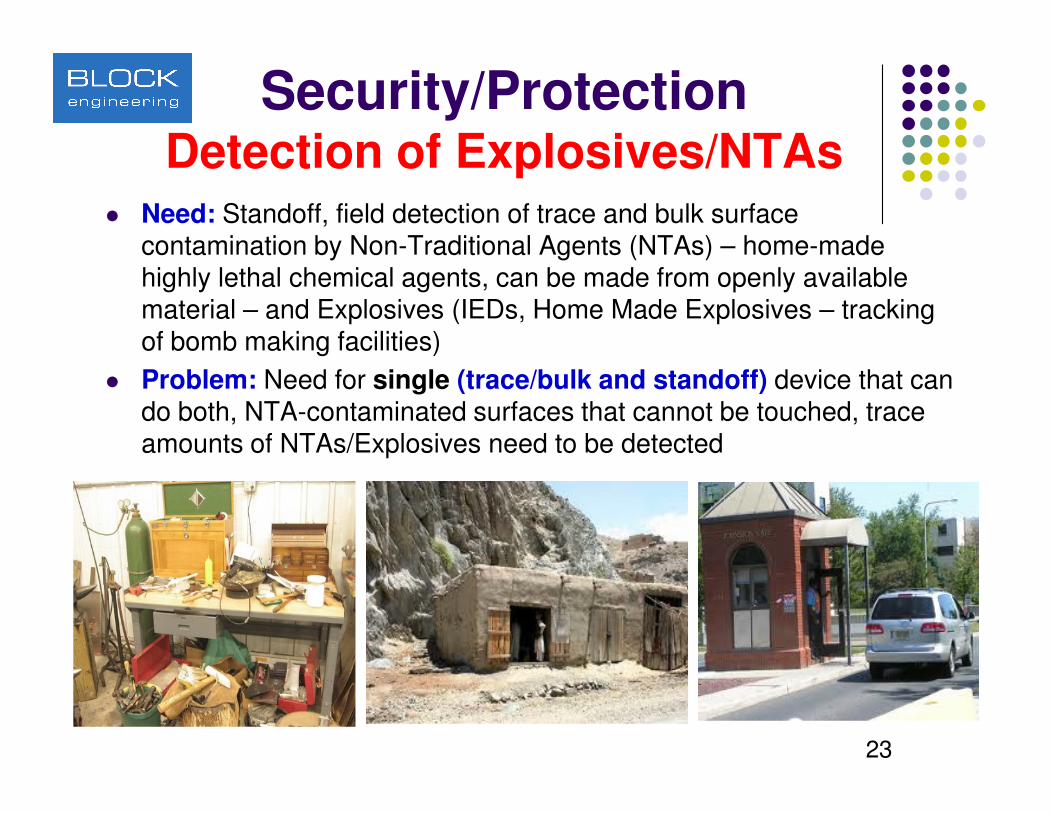
Security/ProtectionDetection of Explosives/NTAs
� Need: Standoff, field detection of trace and bulk surface contamination by Non-Traditional Agents (NTAs) – home-made highly lethal chemical agents, can be made from openly available material – and Explosives (IEDs, Home Made Explosives – tracking of bomb making facilities)
� Problem: Need for single (trace/bulk and standoff) device that can do both, NTA-contaminated surfaces that cannot be touched, trace
23
do both, NTA-contaminated surfaces that cannot be touched, trace amounts of NTAs/Explosives need to be detected

Standoff Detection of Ammonium Nitrate
Trace levels successfully detected in seconds at 1 m standoff distance

TSA Provided SamplesExample: RDX Detection
Arb
itra
ry U
nits
Characteristic RDX Peaks Detected – match with the library spectrum
25
Arb
itra
ry U
nits
Wavenumber (cm-1)
� Samples were placed ~2 ft away from instrument
� Measurements in a few seconds per sample
� Various vehicle-simulating substrates: Gray & black painted metallic, white painted plastic

Trace Detection of RDX Demonstrated
155 µg/cm²
77
15
1.5
1220-1340 cm-1 range detail
Expanded view of 1.5 µg/cm² of RDX
Wavenumber (cm-1)
0
0.1
0.2
0.3
0.4
0.5
0.6
0.7
0.8
0.9
1
840 940 1040 1140 1240 1340
Full QCL RDX
Spectrum
1.5 µg/cm² - characteristic spectral features
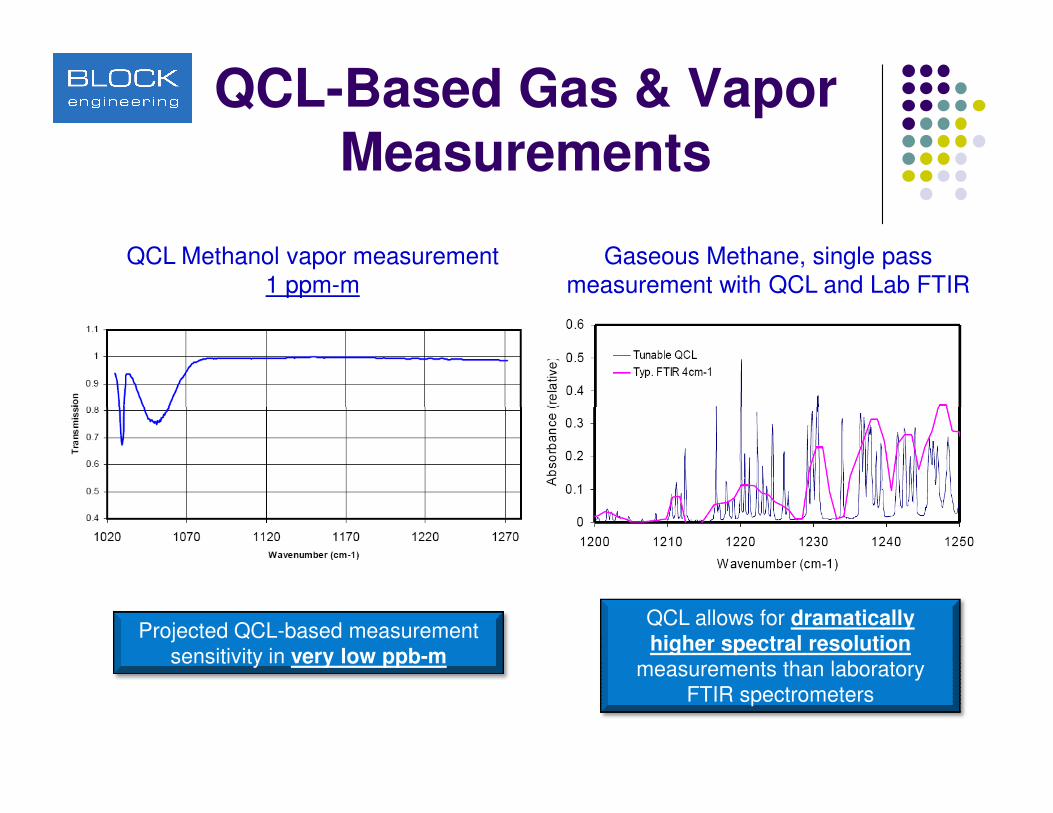
QCL-Based Gas & Vapor Measurements
QCL Methanol vapor measurement 1 ppm-m
Gaseous Methane, single pass measurement with QCL and Lab FTIR
QCL allows for dramatically higher spectral resolution
measurements than laboratory
FTIR spectrometers
Projected QCL-based measurement
sensitivity in very low ppb-m

Cleaning Verification

Cleaning Verification
Application• Detect & Quantify Contaminants• Current Technique is Swab Test• Test pre-defined area for concentration (2-4 inches sq.)
Value Proposition for Hand Held, Non-Contact Spectrometer
• Fast cleaning validation• Reduced downtime• More consistent• Improved efficiency• Significant money savings

“Homogeneous” Coupons “Interesting” Challenges
� 45x45 mm 2B mill finish substrate.
� Image produced using grazing-angle illumination.
� Airbrushed acetaminophen.
� 2.4 µg/cm2 by TOC
� Samples can be thin films, amorphous, crystalline, etc.
2.4 µg/cm2 Acetaminophen measurements imply 0.1 µg/cm2 LOD

Cleaning Verification –Example Challenge
31
80085090095010001050110011501200
0
0.1
0.2
0.3
0.4
0.5
0.6
0.7
0.8
0.9
Wavenumbers [1/cm]
Inte
nsity
Spectrum on Spots
Spectrum between Spots
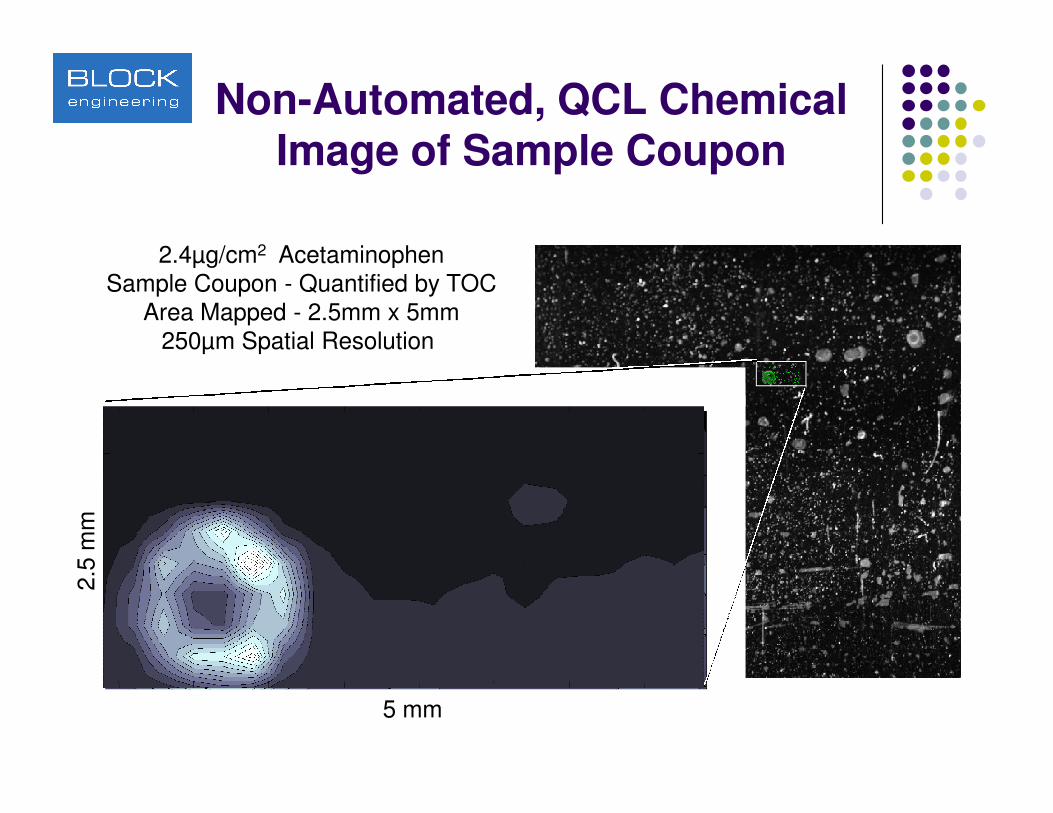
Non-Automated, QCL Chemical Image of Sample Coupon
5 mm
2.4µg/cm2 AcetaminophenSample Coupon - Quantified by TOC
Area Mapped - 2.5mm x 5mm250µm Spatial Resolution
5 mm
2.5
mm
2.5
mm

Performance
Achieved <0.1% noise on the 100% line with 1-2 second integration time

LaserScopeTM
Mid-IR Laser Microscopy

Advantage over FTIR
QCL
Synchrotron
Up to 103 Higher SNR for Small Targets
Rela
tive S
can
Tim
e
(QC
L/F
TIR
)
Rela
tive S
NR
(Q
CL
/FT
IR)
Up to 103 Faster Measurements for Small Targets (fixed SNR)
0.001
0.0001
0.00001 Relevant Target Size
(5-20µm), e.g. cells
FTIR
Target Size (µm)
QCL technology offers dramatic SNR and/or Speed improvements for small targets enabling rapid micro-analysis
Target Size (µm)
Rela
tive S
can
Tim
e
(QC
L/F
TIR
)
Rela
tive S
NR
(Q
CL
/FT
IR)
1
0.1
0.01
0.001

Polymer @ 20 microns

� Life Sciences
� Semiconductor
� Forensics
� Homeland Security
� Quality Control
Key Applications
Cancer Detection
OpticalImage
Contaminant Analysis
� Quality Control
� Art Conservation
� Mineralogy
� Material ID
� Packaging & Laminates
� Coatings
� Pharma
� Contamination ID
SpectralSignature
Cancer Cells
Unexpected Substance in Fingerprint
Forensics
ChemicalImaging

� High Spectral Radiance
� High SNR for Small Samples
� Measure Optically Thick or Highly Diffusive
Samples
Advantages
Samples
� Faster Measurements
� Improved Spectral Quality
� Single Detector or FPA Possible
� No Liquid Nitrogen Required for the Detector
� More Rugged and Compact Than FTIR or
Synchrotron

� Broader wavelength range
� Extend to 5 – 14 µm (2000 – 700 cm-1)
� Faster scanning speed
� Process control and handheld applications
Future Technology Improvements
� Lower power consumption
� Enabling for handheld devices
� Smaller form factor & ruggedized
� Handheld and embedded sensing
� Lower cost
� Enable new sensing applications

� Leveraged advances in QCL
� Wide tuning range
� High Spectral Radiance
Summary
High Spectral Radiance
� Standoff FTIR-type measurement
� Fiber coupled applications
� Microscopy applications
� Standard IR Accessories
� Higher SNR/More Power
� Quicker measurement
� More sensitive

Block Engineering, Inc.Block Engineering, Inc.377 Simarano Drive
Marlborough, MA 01752
www.blockeng.com
Main Number: 508-251-3100
Related Documents