1 Quantitative trait loci for Fusarium head blight resistance in Huangcandou x ‘Jagger’ wheat population Jin Cai and Guihua Bai Dep. of Agronomy, Kansas State University and Hard Winter Wheat Genetics Research Unit, USDA-ARS, Manhattan KS 66508 *Corresponding author ([email protected] or [email protected]). Abbreviations: FHB, Fusarium head blight; HCD, Huangcandou; QTL, quantitative trait locus; RIL, recombinant inbred line; PSS, percentage of symptomatic spikelet; DON, deoxynivalenol; SSR, simple-sequence repeat; 3BSd, the distal end of short arm of chromosome 3B; 3BSc, near centromere of short arm of chromosome 3B; type II resistance, resistance to FHB spread within a spike; R 2 , determination of coefficient; PCR, polymerase chain reaction; LOD, logarithm of the odds. Page 1 of 26 Crop Science Accepted paper, posted 05/07/2014. doi:10.2135/cropsci2013.12.0835

Welcome message from author
This document is posted to help you gain knowledge. Please leave a comment to let me know what you think about it! Share it to your friends and learn new things together.
Transcript

1
Quantitative trait loci for Fusarium head blight resistance in Huangcandou x ‘Jagger’ wheat
population
Jin Cai and Guihua Bai
Dep. of Agronomy, Kansas State University and Hard Winter Wheat Genetics Research Unit, USDA-ARS, Manhattan KS 66508
*Corresponding author ([email protected] or [email protected]).
Abbreviations: FHB, Fusarium head blight; HCD, Huangcandou; QTL, quantitative trait locus; RIL, recombinant inbred line; PSS, percentage of symptomatic spikelet; DON, deoxynivalenol; SSR, simple-sequence repeat; 3BSd, the distal end of short arm of chromosome 3B; 3BSc, near centromere of short arm of chromosome 3B; type II resistance, resistance to FHB spread within a spike; R2, determination of coefficient; PCR, polymerase chain reaction; LOD, logarithm of the odds.
Page 1 of 26Crop Science Accepted paper, posted 05/07/2014. doi:10.2135/cropsci2013.12.0835

2
Abstract 1
Fusarium head blight (FHB) is a devastating disease in wheat (Triticum aestivum), and 2
growing resistant cultivars is one of the most effective strategies to minimize its damage. 3
Huangcandou (HCD) is a Chinese wheat landrace that shows a high level of resistance to 4
FHB spread within a spike (type II). To identify quantitative trait loci (QTLs) for FHB 5
resistance in HCD, 190 recombinant inbred lines (RILs) were developed from HCD x 6
‘Jagger’. ‘Jagger’ is a susceptible hard winter wheat from Kansas. The population was 7
evaluated for percentage of symptomatic spikelets (PSSs) per spike after single-floret 8
inoculation in three greenhouse experiments. Initial marker screening identified 261 9
polymorphic simple-sequence repeats (SSRs) between the parents. Analysis of these markers 10
in the RIL population identified five QTLs, three from HCD and two from ‘Jagger’ 11
chromosomes. Two of the three QTLs from HCD were mapped on the short arms of 12
chromosomes 3B, one in the distal end (3BSd) and another near centromere (3BSc); the third 13
was on the short arm of 3A (3AS). The QTL on 3BSd coincides with the previously reported 14
Fhb1 and explained 26.1% of phenotypic variation. The QTL on 3AS explained up to 10.0% 15
of phenotypic variation. The two QTLs from ‘Jagger’ on chromosomes 2D and 6D explained 16
9.5% and 6.7% of phenotypic variations, respectively. A combination of QTLs from HCD 17
and ‘Jagger’ can enhance FHB type II resistance in wheat. 18
19
20
21
Page 2 of 26Crop Science Accepted paper, posted 05/07/2014. doi:10.2135/cropsci2013.12.0835

3
Introduction 1
Fusarium head blight (FHB), caused by Fusarium graminearum, is a devastating disease 2
in wheat (Triticum aestivum), especially in humid and semi-humid wheat growing regions 3
worldwide (Bai and Shaner 2004). FHB epidemics have been reported in geographical regions 4
including Asia, Europe, North America, and South America (Bai and Shaner 1994; Goswami 5
and Kisler 2004). When high humidity coincides with anthesis and the early grain filling stage, 6
susceptible wheat plants can easily become infected, and a severe epidemic may occur. FHB 7
infection causes pre-matured and blighted spikes and shriveled kernels due to blockage of 8
water and nutrient supplies and results in a significant reduction in grain yield and quality (Bai 9
and Shaner 2004). FHB-infected grain also is contaminated with mycotoxins, especially 10
deoxynivalenol (DON), which make the grains unsuitable for human and animal consumption 11
(Windels, 2000). Although fungicide application can be used to reduce crops losses from FHB 12
infection, they are not completely effective (Windels, 2000) therefore, growing FHB-resistant 13
cultivars is a more environmentally friendly, effective, and economic approach to minimizing 14
FHB damage. 15
FHB resistance is a complex trait with multiple components. Five types of resistance to 16
FHB have been proposed: resistance to initial penetration of the pathogen (type I); resistance to 17
disease spread within a spike (type II) (Schroeder and Christensen 1963); resistance to 18
accumulation of DON in infected kernels (type III) (Miller et al. 1985); resistance to 19
Fusarium-damaged kernels (type IV); and tolerance to FHB (type V) (Mesterházy et al. 1999). 20
Although resistance types I, II and III are commonly accepted, type II resistance is 21
characterized extensively and used in cultivar improvement due to its stability and robustness. 22
FHB resistance is a quantitative trait that is usually controlled by a few major and several 23
minor genes (Bai and Shaner 1994; Buerstmayr et al. 1999). Mapping of quantitative trait loci 24
(QTLs) is widely used to determine the effect of QTLs underlining FHB resistance. To date, 25
FHB associated QTLs have been reported from more than 50 wheat cultivars covering all 21 26
chromosomes (Buerstmayr et al., 2009; Liu et al. 2009). Among them, QTL on 3BS, designated 27
Page 3 of 26Crop Science Accepted paper, posted 05/07/2014. doi:10.2135/cropsci2013.12.0835

4
as Fhb1 (Cuthbert et al. 2006; Liu et al., 2006), has the largest effect on type II and type III 1
resistance (Bai et al. 1999; Anderson et al. 2001; Cuthbert et al. 2006). ‘Sumai 3’ and its 2
derivatives such as ‘Ning7840’ carry Fhb1 and are the most-used source of FHB resistance in 3
breeding programs worldwide (Bai and Shaner 1996; Bai et al. 1999; Somers et al. 2003; 4
Cuthbert et al. 2006; Buerstmayr et al. 2009). Several other QTLs were repeatedly mapped on 5
chromosomes 5AS, 6BS, 3A, 4B, 2D, 1B, 7A, and 5B in more than two populations and are 6
also considered stable QTLs (Liu et al. 2009). Five of these QTLs were formally named as 7
Fhb2 on chromosome 6B (Anderson et al. 2001; Cuthbert et al. 2007), Fhb3 on 7AS from 8
wheat-Leymus introgression (Qi et al. 2008), Fhb4 on 4B (Lin et al. 2006; Xue et al. 2010), and 9
Fhb5 on 5A from Wangshuibai (Lin et al. 2004; Xue et al. 2011). To date, only ‘Sumai 10
3’-derived Fhb1 has been used extensively in breeding programs due to its stable major effect 11
on type II resistance across different genetic backgrounds (Bai et al. 1999; Anderson et al. 12
2001); however, single-resistance QTL may not provide sufficient protection from severe 13
epidemics, so exploring new sources of resistance will facilitate pyramiding of QTLs to 14
enhance the level of resistance and diversity of resistance sources. 15
A Chinese landrace, ‘Huangcandou’ (HCD), showed a high level of type II resistance to 16
FHB (Yu et al., 2008a), but the QTLs underlying the FHB resistance in HCD have not been 17
characterized. In this study, F5-derived recombinant inbred lines (RILs) developed from HCD x 18
‘Jagger’ were used to characterize QTLs associated with type II FHB resistance and to identify 19
markers tightly linked to the QTLs for marker-assisted selection. 20
21
Materials and Methods 22
Plant materials and FHB evaluation 23
A population of 190 RILs was derived from HCD x ‘Jagger’ by single-seed descent. HCD 24
is a resistant wheat landrace from China, and ‘Jagger’ (PI 593688) is an FHB-susceptible U.S. 25
hard winter wheat from Kansas. F5:6 and F5:7 RILs were evaluated for FHB resistance at Kansas 26
State University in Manhattan, KS. The experiments were conducted in the greenhouses of 27
Page 4 of 26Crop Science Accepted paper, posted 05/07/2014. doi:10.2135/cropsci2013.12.0835

5
spring and fall 2010 and spring 2011 with two replications in each experiment. Seeds of the 1
RILs and the parents were planted in plastic trays filled with Metro-mix 360 soil mix 2
(Hummert International, Earth City, MO). After vernalization at 6oC in a cold room for 7 weeks, 3
5 seedlings per line were transplanted into each 13-cm2 Dura pot containing Metro-mix 360 4
soil mix. The pots with plants were arranged on greenhouse benches in a randomized complete 5
block design. The greenhouse was maintained at 15–20oC with 12 h supplemental daylight. 6
A Kansas strain of F. graminearum (GZ3639) was used as inocula, and conidia were 7
prepared following Bai et al. (1999). The concentration of conidia was calculated using a 8
hemocytometer under a light microscope. The final concentration of inocula was adjusted to 9
100,000 conidia per ml. At early anthesis, 10-µl conidial suspension (~1000 conidia/spike) was 10
injected into a central spikelet of a spike using a syringe (Hamilton, Reno, NV). Five spikes per 11
pot were inoculated and enclosed in a moist chamber at 100% relative humidity and 20–22oC 12
to initiate fungal infection. After 48 h of incubation, the plants were moved to greenhouse 13
benches at 17–25oC with 12 h supplemental daylight. Type II resistance (FHB symptoms 14
spread within a spike) was evaluated by recording percentage of symptomatic spikelets (PSSs) 15
in an inoculated spike 15 days after inoculation. Mean PSSs of the RILs for each experiment 16
and across all three experiments were calculated for QTL analysis. 17
18
DNA extraction and genotyping 19
Leaf tissues were collected from F5:6 RILs at the 3-leaf stage in 96-deepwell plates. 20
Harvested tissues were dried in a freeze dryer (Thermo Savant, Holbrook, NY) for 48 h and 21
ground in a Mixer Mill (MM 400, Retsch, Germany). Genomic DNA was isolated using a 22
modified cetyltrimethyl ammonium bromide protocol (Saghai-Maroof et al. 1984). A core set 23
of 384 pairs of SSR primers (http://wheat.pw.usda.gov) were used to screen the parents. This 24
primer set was originally selected from 2,000 primer pairs according to previous studies 25
conducted at the USDA Central Small Grain Genotyping Laboratory in Manhattan, KS. These 26
markers are evenly distributed on all 21 chromosomes (Somers et al. 2004). Primer pairs that 27
Page 5 of 26Crop Science Accepted paper, posted 05/07/2014. doi:10.2135/cropsci2013.12.0835
6
detected polymorphism between parents were used to genotype a randomly selected subset of 1
96 RILs. Determination of coefficient (R2) was calculated for each marker to determine 2
significant markers associated with FHB type II resistance. A SSR linkage map constructed 3
using these markers was used to map QTLs. After QTL regions had been identified, the SSR 4
markers that linked to the QTLs in the linkage map were analyzed on the remainder of the RIL 5
population. To increase the marker coverage in possible QTL regions, an additional 70 markers 6
linked to known QTLs reported in previous studies were screened for polymorphism between 7
the parents (Liu et al. 2009; Buerstmayr et al. 2009; http://wheat.pw.usda.gov), and segregating 8
markers in the population were added to the linkage map for further QTL analysis. 9
Polymerase chain reaction (PCR) amplification was done in a DNA engine Tetrad Peltier 10
thermal cycler (MJ Research, Waltham, MA). A 10-µl PCR master mix contained 1X ASB 11
buffer, 2.5 mM of MgCl2, 200 µM of dNTP, 100 nM each of a fluorescent-dye-labeled M13 12
primer (5’- ACGACGTTGTAAAACGAC) and a forward primer with M13-tail added to 5’-end, 13
and 200 nM of a reverse primer, 0.6 U of Tag polymerase, and 40 ng template genomic DNA. 14
PCR amplification was done using a touchdown program. The PCR reaction mixture was 15
incubated initially at 95oC for 5 min, followed by five cycles of 96oC for 1 min, annealing at 16
68oC for 3 min with a decrease of 2oC in each subsequent cycle, and extension at 72oC for 1 17
min. For another five cycles, annealing temperature started from 58oC for 2 min with a 18
decrease of 2oC in each subsequent cycle, then PCR went through an additional 25 cycles of 19
96oC for 1 min, 50oC for 1 min, and 72oC for 1 min, ending with a final extension at 72oC for 5 20
min. Amplified PCR products from four PCRs labeled with different florescent dyes (FAM, 21
VIC, NED, and PET) were pooled and analyzed in an ABI PRISM 3730 DNA Analyzer 22
(Applied Biosystems, Foster City, CA). Data were scored using GeneMarker v1.75 23
(SoftGenetics LLC, State College, PA) 24
25
Data analysis 26
Broad sense heritability (H) of PSSs was calculated using H=σ2G/[σ2
G+(σ2GE/e)+(σ2
ε/re)], 27
Page 6 of 26Crop Science Accepted paper, posted 05/07/2014. doi:10.2135/cropsci2013.12.0835

7
where σ2G is an estimate of genetic variance, σ2
GE is an estimate of genotype by environment 1
variance, σ2ε is an estimate of residual error variance, r = number of replicates, and e = number 2
of experiments. All variances were estimated by analysis of variance (ANOVA) using the 3
PROC GLM function in SAS v. 9.1.2 (SAS Institute Inc., Cary, NC). 4
A linkage map was constructed by IciMapping v3.1 (Wang et al. 2011) using the Kosambi 5
mapping function (Kosambi 1944) and a logarithm of odds (LOD) threshold of 3.0. QTLs for 6
PSSs were analyzed by performing composite interval mapping (CIM) using WINQTL 7
Cartographer version 2.5 with Model 6 (Wang et al. 2006). The permutation test was performed 8
1,000 times to determine the LOD threshold for claiming significant QTLs at P < 0.05 (Doerge 9
and Churchill, 1996). 10
QTLs that explained larger than 5% of phenotypic variation of mean PSSs were selected 11
to test the allele substitution effect. To compare the effect of these QTL combinations on FHB 12
resistance, alleles for each QTL were represented by the alleles of the closest marker to the 13
QTL. All RILs were separated into 2n genotypic groups based on allele constitution of these 14
QTLs (n) identified in the population. Multiple comparisons among the genotypic groups were 15
conducted by the Tukey-Kramer method (Miller 1981). 16
17
Results 18
FHB in HCD / ‘Jagger’ population 19
The resistant parent HCD had a mean PSS of 16.7%, ranging from 9.6% to 27.2% across 20
the three experiments, whereas ‘Jagger’, the susceptible parent, had a mean PSS of 84.4%, 21
ranging from 69.9% to 98.3% (Fig. 1). The mean PSSs of RILs in each of the three experiments 22
ranged from 4.7% to 100%. Different patterns of PSS frequency distributions were observed 23
among the three experiments. In general, results showed continuous variation with two peaks, 24
but with a major peak skewed toward HCD in spring and fall 2010 experiments and toward 25
‘Jagger’ in the spring 2011 experiment (Fig. 1). Mean PSSs over all RILs was 44.8%, ranging 26
from 29.8% (fall 2010) to 55.0% (spring 2011); thus, disease pressure was highest in spring 27
Page 7 of 26Crop Science Accepted paper, posted 05/07/2014. doi:10.2135/cropsci2013.12.0835

8
2011 and lowest in fall 2010. Significant transgressive segregation was observed in all three 1
experiments, suggesting that the susceptible parent might contribute resistance QTL in the 2
population. The positive correlations of PSSs were highly significant among the three 3
greenhouse experiments, ranging from 0.48 to 0.69 (P < 0.001). Analysis of variance indicated 4
significant variations in genotypes, environments, and genotype by environment interactions 5
(Table 1). Broad sense heritability for PSSs across three greenhouse experiments was high (H = 6
0.80). 7
8
Linkage map and QTLs for FHB resistance 9
After screening 454 selected SSR primers between parents, 261 primers were found to be 10
polymorphic, indicating a high level of polymorphism (57.5%) for the set of primers. All 11
polymorphic primers were used to screen a subset of 96 RILs. Among them, 242 markers were 12
mapped to 43 linkage groups that covered 953.7 cM in genetic distance. Inclusive Composite 13
Interval Mapping (ICIM) using the resulting map identified seven chromosome regions in 3A, 14
3B (2 QTLs), 4B, 5A, 2D, and 6D that were significantly associated with PSSs. All 15
polymorphic markers from the six chromosomes were used to screen the rest of 94 RILs in the 16
HCD x ‘Jagger’ population. The final linkage map was constructed using 190 RILs for final 17
QTL detection; however, QTLs on 4B and 5A were not significant, so they were not analyzed 18
further. 19
Five significant QTLs were identified by CIM in HCD x ‘Jagger’, with two from HCD 20
mapped on the short arm of chromosome 3B (3BS) and one on 3AS. For two 3BS QTLs, one 21
was mapped in the distal end (3BSd) of chromosome 3BS, and another was near the 22
centromere (3BSc). The QTL on 3BSd showed a significant major effect on Type II resistance 23
in all three experiments (Fig. 2), coinciding with previously reported Fhb1 according to the 24
haplotype of tightly linked markers Xumn10 and Xbarc133 (Liu et al., 2006). This QTL 25
explained 11.0 to 26.1% of phenotypic variations across the three experiments (Table 2). The 26
QTL on 3BSc, flanked by Xwmc777 and Xbarc139, was significant only in the spring 2010 27
Page 8 of 26Crop Science Accepted paper, posted 05/07/2014. doi:10.2135/cropsci2013.12.0835

9
experiment and explained 6.6% of phenotypic variation (Table 2). The QTL on 3AS was 1
flanked by Xcfa2134 and Xgwm2 and was significant in the fall 2010 experiment and mean 2
PSSs over the three experiments. This QTL explained 7.5% to 10.0% of phenotypic variation 3
(Table 2). The fourth QTL on 2D was tightly linked to the marker Xgwm261 and was 4
significant in spring 2010 and 2011 experiments and mean PSSs over the three experiments. 5
This QTL explained 4.5 to 9.5% of phenotypic variations (Table 2). The fifth QTL was on the 6
long arm of chromosome 6D (6DL) and was flanked by Xcfd76 and Xbarc175, which was 7
significant in the spring 2011 experiment and average PSSs of the three experiments and 8
explained 3.8 to 6.7% of variation in PSSs. The QTLs on 3BS (Fhb1 and 3BSc) and 3AS were 9
from HCD, and QTLs on 2D and 6D were from ‘Jagger’. 10
11
Effects of QTL on FHB resistance 12
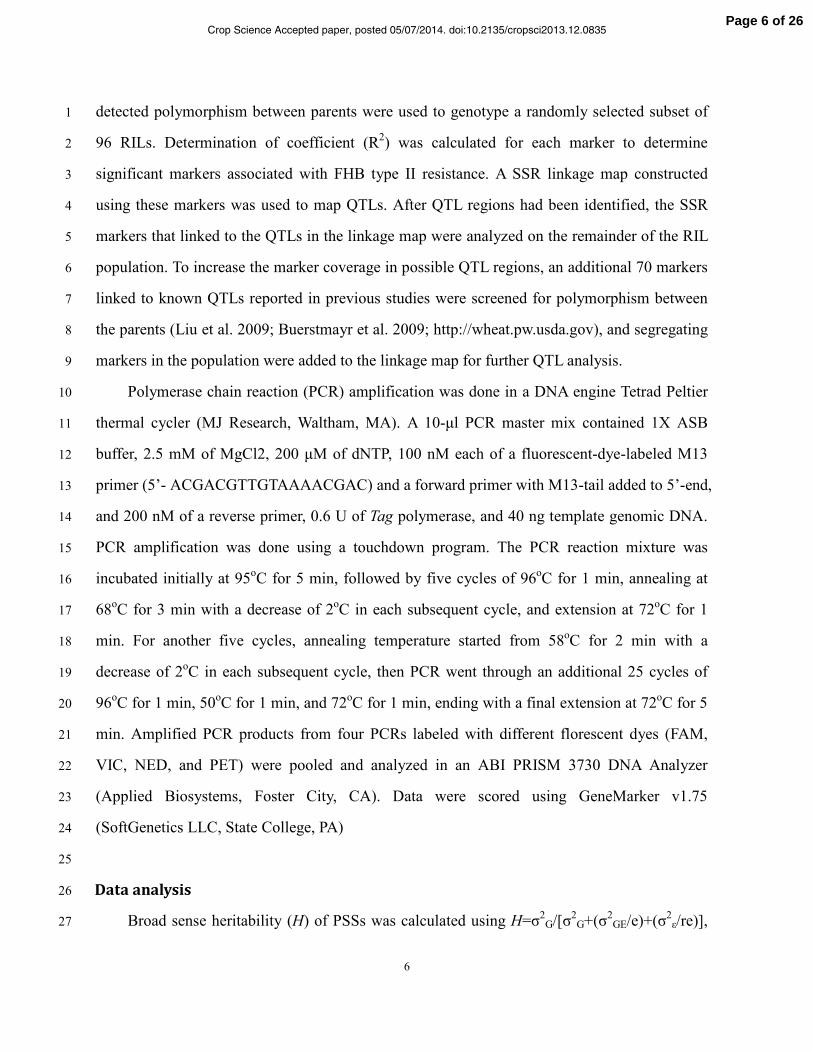
To investigate the effect of individual QTL on type II resistance, RILs that carry different 13
allele combinations at three (Fhb1, 3AS, and 2D) of the five QTLs were grouped and compared 14
for their allele substitution effects. These three QTLs were selected because they were 15
significant for mean PSSs over three greenhouse experiments. The QTLs on 3BSc and 6D were 16
excluded from the analysis because they either were insignificant or showed minor effects 17
(R2-value < 5%) on mean PSSs over the three greenhouse experiments. Eight genotypes were 18
derived from the eight possible allelic combinations of three QTLs: AABBCC, AABBcc, 19
AAbbCC, AAbbcc, aaBBCC, aaBBcc, aabbCC, and aabbcc, where AA, BB, and CC represent 20
resistance alleles at QTLs on 3BSd, 3AS, and 2D, respectively, whereas aa, bb, and cc 21
represent corresponding opposite alleles, respectively. The closest markers to each of the three 22
QTLs (Xumn10 on 3BSd, Xgwm674 on 3AS, and Xgwm261 on 2D) were selected to represent 23
these QTLs. Two contrasting alleles at each of the three SSR loci exhibited a 1:1 segregation 24
ratio in the RIL population. Mean PSSs for the eight genotypic groups of 190 RILs ranged from 25
22.4% to 69.3%. The mean PSSs for the genotypic groups that had only one of the three 26
resistance QTLs were 44.3% for Fhb1, 53.8% for QTL on 3AS, and 58.4% for QTL on 2D; in 27
Page 9 of 26Crop Science Accepted paper, posted 05/07/2014. doi:10.2135/cropsci2013.12.0835

10
contrast, the averaged PSS for the RIL group carrying none of the three alleles was 69.3% 1
(null). The mean PSS for the groups with Fhb1 or 3AS resistance allele alone were 2
significantly lower than that of ‘null’ group. Meanwhile, the mean PSS of the RIL groups with 3
resistance alleles at Fhb1 plus an additional QTL (QTL on 3AS or 2D) were consistently lower 4
than those with susceptible alleles at two or three QTLs. Thus, Fhb1 had the largest effect on 5
FHB resistance, and substitution of the susceptible allele at Fhb1 by the resistant allele 6
significantly increased PSSs. 7
8
Discussion 9
Although many Chinese wheat cultivars or landraces show a high level of FHB resistance 10
(Yu et al. 2008ab; Li et al. 2011; Li et al. 2012; Yang et al. 2005ab), only a few, mainly Sumai 3 11
and its derivative Ning7840, have been well characterized as carrying QTLs for type II 12
resistance (Bai and Shaner 2004; Rudd et al. 2001; Somer et al. 2003). QTLs in many other 13
Chinese sources, especially landraces including HCD, are not well characterized. 14
Characterization and utilization of QTLs in different sources of resistance will enhance genetic 15
diversity of FHB resistance QTLs. In HCD x ‘Jagger’, the frequency distributions of mean 16
PSSs from the three experiments showed two peaks of unequal sizes (Fig. 1), suggesting at 17
least two QTLs segregating for FHB resistance in the population. Transgressive segregation in 18
all three experiments suggested that ‘Jagger’ might also contribute QTL(s) to FHB resistance. 19
QTL mapping using HCD x ‘Jagger’ RILs indicated that three QTLs on 3BS and 3AS mainly 20
conditions FHB resistance in HCD and that ‘Jagger’ also contributes two minor QTLs for 21
resistance. This result supports the observation from PSSs frequency distributions of the 22
mapping population. 23
FHB resistance is a quantitative trait that is controlled by several genes/QTLs, and the 24
environments in which plants are evaluated severely influence the resistance expression of 25
these genes (Bai et al. 2000; Parry et al. 1995). Difference in FHB inoculation techniques and 26
environmental conditions may contribute significantly to the differences in QTL detection. 27
Page 10 of 26Crop Science Accepted paper, posted 05/07/2014. doi:10.2135/cropsci2013.12.0835

11
Thus, it is essential to evaluate FHB resistance repeatedly in different seasons and 1
environments to improve the repeatability of QTL detection (Kolb et al. 2001). In this study, 2
the RIL population was evaluated repeatedly in three greenhouse experiments. The correlation 3
coefficients of PSSs for RILs were significant among experiments (r = 0.48 - 0.69, P < 0.001), 4
with a high broad-sense heritability (0.80), suggesting that the phenotypic data were reliable for 5
QTL analysis in this study. Variations in the patterns of frequency distributions and number of 6
QTLs were observed for different experiments (Fig. 1), even though the study was conducted 7
in greenhouses under environments with controlled temperature and moisture; thus, mean FHB 8
data from three experiments may be more reliable for QTL determination. Initial QTL mapping 9
starting with a small population of 96 RILs detected two additional QTLs, but they were not 10
significant when 190 RILs were used for QTL analysis. Thus, increased size of population may 11
reduce the number of false positive QTLs. The 190 RILs used in the current study is relatively 12
large compared with previous mapping studies (Lemmens et al. 2005; Ma et al. 2006). 13
The QTL on 3BSd explained 11.0% to 26.1% of total phenotypic variation in the HCD x 14
‘Jagger’ population. Xgwm493 and Xgwm533 flanked this QTL with the peak at marker 15
Xumn10, which coincides with a previously mapped Fhb1 from ‘Sumai 3’ (Cuthbert et al. 2006; 16
Waldron et al. 1999). This QTL has been reported in more than 30 studies in which ‘Sumai 3’ 17
and its relatives were the major sources of the resistance. This QTL showed a stable major 18
effect on FHB type II resistance across different genetic backgrounds (Buestmayr et al. 2009; 19
Bai et al. 1999; Zhou et al. 2002, 2003; Buerstmayr et al. 2003; Shen et al. 2003a; Bourdoncle 20
and Ohm 2003; Yang et al. 2005a; Chen et al. 2006; Jiang et al. 2007ab). It was also reported in 21
Chinese and Japanese landraces that are not related to ‘Sumai 3’, such as ‘Wangshuibai’ (Lin et 22
al. 2004; Zhou et al. 2004) and ‘Nyu Bai’ (Somers et al. 2003; Cuthbert et al. 2006), but with 23
different levels of effects on type II resistance. Thus, the QTL on 3BS of HCD is more likely 24
Fhb1. 25
The effect of Fhb1 on type II resistance varied among studies, ranging from 6% in DH181 26
(Yang et al. 2005a) to 60% in ‘Ning7840’ (Bai et al. 1999). A wide range of R2 values have 27
Page 11 of 26Crop Science Accepted paper, posted 05/07/2014. doi:10.2135/cropsci2013.12.0835

12
even been reported for the same source of resistance used in different studies (Waldron et al. 1
1999; Anderson et al. 2001; Zhou et al. 2002; Buerstmayr et al. 2002, 2003; Shen et al. 2003a; 2
Bourdoncle and Ohm 2003; Somers et al. 2003; Chen et al. 2006; Jiang et al. 2007ab; Lin et al. 3
2004; Zhang et al. 2004; Ma et al. 2006; Yu et al. 2008b; Yang et al. 2005b). In the current 4
study, the effect of Fhb1 on type II resistance in HCD was highly significant in all three 5
greenhouse experiments, with R2 values up to 0.24 for mean PSSs across the three experiments; 6
however, when individual experiments were examined, the phenotypic variations explained by 7
Fhb1 varied from 11.0% to 26.1%, indicating that QTL effects may vary significantly with 8
environments even when the same population is used. This result may be due to differences in 9
the seasons of inoculation in different experiments; inoculation during winter is usually under 10
lower temperature conditions than in early summer, so higher levels of spread within a spike 11
can be expected for early summer inoculation, especially for moderately resistant and 12
susceptible genotypes. In field conditions, the situation is worse than in a greenhouse because 13
the amount of inoculum available, flowering times, and temperature and moisture conditions 14
during the infection period can differ dramatically among locations and years, which will lead 15
to significant variations in QTL contributions from different studies. Discrepancies in the 16
effects of Fhb1 reported from different studies could therefore be due to differences in FHB 17
evaluation environments, genetic backgrounds of different populations, population sizes, and 18
inoculation methods. Different sources of resistance also may harbor different alleles of Fhb1. 19
Fhb1 in HCD is likely to be the same locus as in ‘Sumai3’. 20
The second QTL on chromosome 3AS was significant in one greenhouse experiment and 21
in means over three experiments. This QTL, closest to Xgwm674, was flanked by Xgwm2 and 22
Xcfa2134 and explained 7.5 to 10.0% of the phenotypic variation. A QTL in a similar location 23
was first reported on ‘Huapei 57-2’ centered at Xgwm5, which explained 8.1% of variation for 24
type II resistance (Bourdoncle and Ohm 2003). In F201R, this QTL was flanked by Xbarc76 25
and Xgwm674 and explained 13.4% of type II resistance (Shen et al. 2003b). Meanwhile, a 26
QTL from Triticum dicoccoides was mapped near Xgwm2 and explained 37% of phenotypic 27
Page 12 of 26Crop Science Accepted paper, posted 05/07/2014. doi:10.2135/cropsci2013.12.0835

13
variation (Chen et al. 2007). Because Xgwm2 and Xgwm5 are 2.8 cM apart (Somers et al. 2004), 1
the QTL mapped in this study is most likely the same QTL reported from those studies. In this 2
study, the effect of the QTL on 3AS was smaller than Fhb1; however, this QTL contributes the 3
second-largest effect on type II resistance compared with other QTLs and was able to reduce 4
FHB PSSs from 69.3% (Null) to 53.8% (Fig. 3). Thus, it can be a good candidate for 5
pyramiding of different QTLs with major and stable effects to improve FHB type II resistance. 6
The third QTL detected in this study was also located on chromosome 3BS, but the QTL 7
was near Xgwm32 and was flanked by Xwmc777 and Xbarc139. It explained 6.6% of 8
phenotypic variation only in the spring 2010 greenhouse experiment. This QTL was first 9
reported on ‘Nyu Bai’ centered by Xgwm566, which explained 4% of FHB severity variation 10
(Somers et al. 2003), and then on ‘Wangshuibai’ (Zhou et al. 2004; Yu et al. 2008b) and ‘Ernie’ 11
(Liu et al. 2007). One QTL reported on ‘Wangshuibai’ was close to Xgwm376 and explained 12
8.1% variation for Type II resistance (Yu et al. 2008b). In U.S. wheat ‘Ernie’, this QTL was 13
close to Xgwm285 and explained 12.9% phenotypic variation (Liu et al. 2007). These reported 14
QTLs from different studies seem to be the same QTL detected in this study, because the SSR 15
markers linked to the QTL are all on the same chromosome region (Somers et al. 2004). In this 16
study, the QTL on 3BSc was not as stable as Fhb1 and was significant only in one of the three 17
experiments; therefore, in wheat breeding programs, this QTL can be used in combination with 18
other major, stable QTLs to improve FHB type II resistance. 19
The fourth QTL was identified on 2DS of ‘Jagger’. This QTL was located in the same 20
position as the QTL previously reported in a Japanese cultivar (Handa et al. 2008). 21
Comparative analysis with the rice genome identified a candidate gene for FHB resistance, a 22
gene for multidrug resistance-associated protein (MPR) in rice (Handa et al. 2008). In the 23
current study, this QTL was close to Xgwm261 in chromosome 2D and was flanked by 24
Xwmc112 and Xwmc25. It was significant in both spring 2010 and 2011 experiments and 25
explained 4.5 to 9.5% of phenotypic variation. Previous studies revealed that SSR marker 26
Xgwm261 was linked to a reduced height locus, Rht8 (Korzun et al. 1998). However, 27
Page 13 of 26Crop Science Accepted paper, posted 05/07/2014. doi:10.2135/cropsci2013.12.0835

14
association was not found between FHB resistance and plant height variation caused by Rht8 in 1
this study. The resistance QTL was also reported in a double haploid population from the cross 2
Sumai3/Gamenya that explained 14% to 25% of phenotypic variations, with the resistance 3
allele contributed by “susceptible parent” Gamenya (Xu et al. 2001). Other studies also 4
detected the QTL from a moderate susceptible parent ‘Alondra’s’, which explained 12.1% 5
phenotypic variation (Shen et al. 2003a). In this study, the QTL on 2DS of ‘Jagger’ showed a 6
minor effect on type II resistance, but it is more likely a real QTL because it is consistently 7
detected in the same chromosome region of different genetic backgrounds. This QTL is often 8
identified in susceptible parents, which suggests that some susceptible cultivars may carry 9
resistance QTLs. When transferring a major QTL to U.S. wheat, using these adapted 10
susceptible parents with minor resistance alleles can improve the level of resistance of selected 11
new cultivars. These cultivars without any minor resistance allele should be avoided as parents 12
for breeding crosses. In addition, this QTL was also found in several other studies where 13
resistant parents contributed the resistance allele (Yang et al. 2005a; Jia et al. 2005). 14
QTL on the long arm of chromosome 6D of ‘Jagger’ also had a minor effect on type II 15
resistance and was significant in only one greenhouse experiment (spring 2010) and the 16
combined average over the three greenhouse experiments. This QTL explained 3.8 to 6.7% of 17
the phenotypic variation, with a peak close to Xbarc175. Only one previous report indicated 18
that the QTL on 6DL was associated with FHB severity and was detected in field experiments 19
(Paillard et al. 2004). Paillard et al. (2004) also found that the FHB resistance QTL on 6D 20
flanked by Xcfd19a and Xpsr915 in ‘Arina’ overlapped with the QTLs for heading date and 21
plant height on the same chromosome region. Although no overlapping marker was found 22
between 6D QTL in ‘Arina’ and this study, they seem to be the same QTL because the markers 23
linked to these QTLs from the two studies are mapped in the same chromosome region 24
(Somers et al., 2004). 25
26
Acknowledgements 27
This is contribution number 14-009-J from the Kansas Agricultural Experiment Station. This 28
Page 14 of 26Crop Science Accepted paper, posted 05/07/2014. doi:10.2135/cropsci2013.12.0835

15
project is partly funded by the U.S. Wheat and Barley Scab Initiative and the National Research 1
Initiative Competitive Grants CAP project 2011-68002-30029 from the USDA National 2
Institute of Food and Agriculture. USDA is an equal opportunity provider and employer. 3
Mention of trade names or commercial products in this article is solely for the purpose of 4
providing specific information and does not imply recommendation or endorsement by the U.S. 5
Department of Agriculture. 6
Page 15 of 26Crop Science Accepted paper, posted 05/07/2014. doi:10.2135/cropsci2013.12.0835

16
References
Anderson, J.A., R.W. Stack, S. Liu, B.L. Waldron, A.D. Fjeld, C. Coyne, B. Moreno-Sevilla, J.M. Fetch, Q.J. Song,
P.B. Cregan, and R.C. Frohberg. 2001. DNA markers for Fusarium head blight resistance QTLs in two wheat
populations. Theor. Appl. Genet. 102:1164-1168.
Bai, G.H., and G. Shaner. 1994. Scab of wheat: Prospects for control. Plant Dis. 78:760-766.
Bai, G.H., and G. Shaner. 1996. Variation in Fusarium graminearum and cultivar resistance to Wheat scab. Plant Dis.
80:975-979.
Bai, G.H., F.L. Kolb, G. Shaner, and L.L. Domier. 1999. Amplified Fragment Length Polymorphism Markers Linked
to a Major Quantitative Trait Locus Controlling Scab Resistance in Wheat. Phytopathology 89:343-348.
Bai, G.H., G. Shaner, and H. Ohm. 2000. Inheritance of resistance to Fusarium graminearum in wheat. Theor. Appl.
Genet. 100:1-8.
Bai, G.H., and G. Shaner. 2004. Management and resistance in wheat and barley to Fusarium head Blight. Ann. Rev.
Phytopathol. 42:135-161.
Bourdoncle, W., and H. Ohm. 2003. Quantitative trait loci for resistance to Fusarium head blight in recombinant
inbred wheat lines from the cross Huapei 57-2 / Patterson. Euphytica 131:131-136.
Buerstmayr, H., M. Lemmens, G. Fedak, and P. Ruckenbauer. 1999. Backcross monosomic analysis of Fusarium head
blight resistance in wheat (Triticum aestivum L.). Theor. Appl. Genet. 98:76-85.
Buerstmayr, H., M. Lemmens, L. Hartl, L. Doldi, B. Steiner, M. Stierschneider, and P. Ruckenbauer. 2002. Molecular
mapping of QTLs for Fusarium head blight resistance in spring wheat. I. Resistance to fungal spread (type II
resistance). Theor. Appl. Genet. 104: 84-91.
Buerstmayr, H., B. Steiner, L. Hartl, M. Griesser, N. Angerer, D. Lengauer, T. Miedaner, B. Schneider, and M.
Lemmens. 2003. Molecular mapping of QTLs for Fusarium head blight resistance in spring wheat. II. Resistance
to fungal penetration and spread. Theor. Appl. Genet. 107:503-508.
Buerstmayr, H., T. Ban, and J.A. Anderson. 2009. QTL mapping and marker-assisted selection for Fusarium head
blight resistance in wheat: a review. Plant Breed. 128:1-26.
Cuthbert, P.A., D.J. Somers, J. Thomas, S. Cloutier, and A. Brulé-Babel. 2006. Fine mapping Fhb1, a major gene
controlling fusarium head blight resistance in bread wheat (Triticum aestivum L.). Theor. Appl. Genet.
112:1465-1472.
Cuthbert, P.A., D.J. Somers, J. Thomas, and A. Brulé-Babel. 2007. Mapping of Fhb2 on chromosome 6BS: a gene
controlling Fusarium head blight field resistance in bread wheat (Triticum aestivum L.). Theor. Appl. Genet.
114:429-437.
Chen, J., C.A. Griffey, M.A.S. Maroof, E.L. Stromberg, R.M. Biyashev, W. Zhao, M.R. Chappell, T.H. Pridgen, Y.
Dong, and Z. Zeng. 2006. Validation of two major quantitative trait loci for Fusarium head blight resistance in
Chinese wheat line W14. Plant Breed. 125:99-101.
Chen, X.F., J.D. Faris, J.G. Hu, R.W. Stack, T. Auhikari, E.M. Elias, S.F. Kianian, and X.W. Cai. 2007. Saturation and
comparative mapping of a major Fusarium head blight resistance QTL in tetraploid wheat. Mol. Breed.
19:113-124.
Doerge, R.W., and G.A. Churchill. 1996. Permutation tests for multiple loci affecting a quantitative character.
Genetics 142:285-294.
Goswami, R.S., and H.C. Kistler. 2004. Heading for disaster: Fusarium graminearum on cereal crops. Mol. Plant
Pathol. 5:515-525.
Page 16 of 26Crop Science Accepted paper, posted 05/07/2014. doi:10.2135/cropsci2013.12.0835

17
Handa, H., N. Namiki, D. Xu, and T. Ban. 2008. Dissecting of the FHB resistance QTL on the short arm of wheat
chromosome 2D using a comparative genomic approach: from QTL to candidate gene. Mol. Breed. 27:71-84.
Jia, G., P.D. Chen, G.J. Qin, G.H. Bai, X. Wang, S.L. Wang, B. Zhou, S.H. Zhang, and D.J. Liu. 2005. QTLs for
Fusarium head blight response in a wheat DH population of Wangshuibai/ Alondra”s”. Euphytica 146:183-191.
Jiang, G.L., J.R. Shi, and R.W. Ward. 2007a. QTL analysis of resistance to Fusarium head blight in the novel wheat
germplasm CJ 9306. I. Resistance to fungal spread. Theor. Appl. Genet. 116:3-13.
Jiang, G.L., Y. Dong, J. Shi and R.W. Ward. 2007b. QTL analysis of resistance to Fusarium head blight in the novel
wheat germplasm CJ9306. II. Resistance to deoxynivalenol accumulation and grain yield loss. Theor. Appl.
Genet. 115:1043-1052.
Kosambi, D.D. 1944. The estimation of map distance from recombination values. Ann. Eugen. 12:172-175.
Kolb, F.L., G.H. Bai, G.J. Muehlbauer, J.A. Anderson, K.P. Smith, and G. Fedak. 2001. Host plant resistance genes for
Fusarium head blight: Mapping and manipulation with molecular markers. Crop Sci. 41:611-619.
Korzum, V., M.S. Ro¨der, M.W. Ganal, A.J. Worland, and C.N. Law. 1998. Genetic analysis of the dwarfing gene
(Rht8) in wheat. Part I. Molecular mapping of Rht8 on the short arm of chromosome 2D of bread wheat (Triticum
aestivum L.). Theor. Appl. Genet. 96:1104–1109.
Li, T., G.H. Bai, S.Y. Wu, and S.L. Gu. 2011. Quantitative trait loci for resistance to Fusarium head blight in a Chinese
wheat landrace Haiyanzhong. Theor. Appl. Genet. 122:1497-1502.
Li, T., G.H. Bai, S.Y. Wu, and S.L. Gu. 2012. Quantitative trait loci for resistance to Fusarium head blight in the
Chinese wheat landrace Huangfangzhu. Euphytica 185:1-10.
Lin, F., Z.X. Kong, H.L. Zhu, S.L. Xue, J.Z. Wu, D.G. Tian, J.B. Wei, C.Q. Zhang, and Z.Q. Ma. 2004. Mapping QTL
associated with resistance to Fusarium head blight in the Nanda2419 X Wangshuibai population. I. Type II
resistance. Theor. Appl. Genet. 109:1504-1511.
Lin, F, S.L. Xue, Z.Z. Zhang, C.Q. Zhang, Z.X. Kong, G.Q. Yao, D.G. Tian, H.L. Zhu, C.J. Li, Y. Cao, J.B. Wei, Q.Y.
Luo, and Z.Q. Ma. 2006. Mapping QTL associated with resistance to Fusarium head blight in the Nanda2419 ×
Wangshuibai population. II: Type I resistance. Theor. Appl. Genet. 112:528-535.
Lemmens, M., U. Scholz, F. Berthiller, C. Dall-Asta, A. Koutnik, R. Schuhmacher, G. Adam, H. Buerstmayr, A.
Mesterhazy, R. Krska, and P. Ruckenbauer. 2005. The ability to detoxify the mycotoxin deoxynivalenol
colocalizes with a major quantitative trait locus for Fusarium head blight resistance in wheat. Mol. Plant Microbe
Interact. 18:1318-1324.
Liu, S., M.O. Pumphrey, B.S. Gill, H.N. Trick, J.X. Zhang, J. Dolezel, B. Chalhoub, and J.A. Anderson. 2008. Toward
positional cloning of Fhb1, a major QTL for Fusarium head blight resistance in wheat. Cereal Res. Commun. 36
Suppl. 6:195-201.
Liu, S., X. Zhang, M.O. Pumphrey, R.W. Stack, B.S. Gill, and J.A. Anderson. 2006. Complex microcolinearity among
wheat, rice and barley revealed by fine mapping of the genomic region harboring a major QTL for resistance to
Fusarium head blight in wheat. Functional and Integrative Genomics, 6:83 -89.
Liu, S., Z.A. Abate, H. Lu, T. Musket, G.L. Davis, and A.L. McKendry. 2007. QTL associated with Fusarium head
blight resistance in the soft red winter wheat Ernie. Theor. Appl. Genet. 115:417-427.
Liu, S., M.D. Hall, C.A. Griffey, and A.L. McKendry. 2009. Meta-Analysis of QTL Associated with Fusarium head
Blight Resistance in Wheat. Crop Sci. 49:1955-1968.
Ma, H.X., K.M. Zhang, L. Gao, G.H. Bai, H.G. Chen, Z.X. Cai, and W.Z. Lu. 2006. Quantitative trait loci for
Page 17 of 26Crop Science Accepted paper, posted 05/07/2014. doi:10.2135/cropsci2013.12.0835

18
resistance to fusarium head blight and deoxynivalenol accumulation in Wangshuibai wheat under field conditions.
Plant Pathol. 55:739-745.
Miller, R.G. 1981. Simultaneous Statistical Inference 2nd Ed. Springer Verlag New York ISBN 0-387-90548-0
Miller, J.D., J. Young, and D.R. Sampson. 1985. Deoxynivalenol and Fusarium head blight resistance in spring cereals.
Phytopathology 113:359-367.
Mesterházy, Á., T. Bartók, C.G. Mirocha, and R. Komoróczy. 1999. Nature of wheat resistance to Fusarium head
blight and the role of deoxynivalenol for breeding. Plant Breed 118:97-110.
Parry, D.W., P. Jenkinson, and L. McLeod. 1995. Fusarium ear blight (scab) in small grain cereals - a review. Plant
Pathol. 44:207-238.
Paillard, S., T. Schnurbusch, R. Tiwari, M. Messmer, M. Winzeler, B. Keller, and G. Schachermayr. 2004. QTL
analysis of resistance to Fusarium head blight in Swiss winter wheat (Triticum aestivum L.). Theor. Appl. Genet.
109:323–332.
Qi, L., M. Pumphrey, B. Friebe, P. Chen, and B. Gill. 2008. Molecular cytogenetic characterization of alien
introgressions with gene Fhb3 for resistance to Fusarium head blight disease of wheat. Theor. Appl. Genet.
117:1155-1166.
Rudd, J.C., R.D. Horsley, A.L. McKendry, and E.M. Elias. 2001. Host plant resistance genes for Fusarium head blight:
sources, mechanisms, and utility in conventional breeding systems. Crop Sci. 41:620-627.
Schroeder, H.W., and J.J. Christensen. 1963. Factors affecting resistance of wheat to scab caused by Gibberella zeae.
Phytopathology 53:831-838.
Saghai-Maroof, M.A., K.M. Soliman, R.A. Jorgensen, and R.W. Allard. 1984. Ribosomal DNA spacer-length
polymorphisms in barley: Mendelian inheritance, chromosomal location, and population dynamics. Proc. Natl.
Acad. Sci. USA 81:8014-8018.
Shen, X.R., M. Zhou, W. Lu, and H.W. Ohm. 2003a. Detection of Fusarium head blight resistance QTL in a wheat
population using bulked segregant analysis. Theor. Appl. Genet. 106:1041-1047.
Shen, X.R., M. Ittu and, H.W. Ohm. 2003b. Quantitative trait loci conditioning resistance to Fusarium head blight in
wheat line F201R. Crop Sci. 43: 850-857.
Somers, D.J., G. Fedak, and M. Savard. 2003. Molecular mapping of novel genes controlling Fusarium head blight
resistance and deoxynivalenol accumulation in spring wheat. Genome 46:555-564.
Somers, D.J., P. Isaac, and K. Edwards. 2004. A high-density microsatellite consensus map for bread wheat (Triticum
aestivum L.). Theor. Appl. Genet. 109:1105-1114.
Waldron, B.L., B. Moreno-Sevilla, J.A. Anderson, R.W. Stack, and R.C. Frohberg. 1999. RFLP mapping of QTL for
Fusarium head blight resistance in wheat. Crop Sci. 39:805-811.
Wang, J., H. Li, L. Zhang, C. Li, and L. Meng. 2011. QTL IciMapping v3.1. Institute of Crop Science Chinese
Academy of Agricultural Sciences (CAAS), Beijing, China and Crop Research Informatics Lab, International
maize and wheat improvement center (CIMMYT) Apdo, D.F., Mexico.
Wang, S., C.J. Basten, and Z.B. Zeng. 2006. Windows QTL Cartographer 2.5. Available at
statgen.ncsu.edu/qtlcart/WQTLCart.htm. Dept. of Statistics, North Carolina State Univ., Raleigh, NC.
Windels, C.E. 2000. Economic and social impacts of Fusarium head blight: changing farm and rural communities in
the northern Great Plains. Phytopathology 90:17-21.
Xu, D.H., H.F. Juan, M. Nohda, and T. Ban. 2001. QTLs Mapping of Type I and Type II Resistance to FHB in Wheat.
Page 18 of 26Crop Science Accepted paper, posted 05/07/2014. doi:10.2135/cropsci2013.12.0835

19
2001 National Fusarium Head Blight Forum, December 8-10, Erlanger, KY.
Xue, S., G. Li, H. Jia, F. Xu, F. Lin, M. Tang, Y. Wang, X. An, H. Xu, L. Zhang, Z. Kong, and Z. Ma. 2010. Fine
mapping Fhb4, a major QTL conditioning resistance to Fusarium infection in bread wheat (Triticum aestivum L.).
Theor. Appl. Genet. 121:147-156.
Xue, S., F. Xu, M. Tang, Y. Zhou, G. Li, X. An, F. Lin, H. Xu, H. Jia, L. Zhang, Z. Kong, and Z. Ma. 2011. Precise
mapping Fhb5, a major QTL conditioning resistance to Fusarium infection in bread wheat (Triticum aestivum L.).
Theor. Appl. Genet. 123:1055-1063.
Yu, J.B., G.H. Bai, S.B. Cai, Y.H. Dong, and T. Ban. 2008a. New Fusarium head blight resistant sources from Asian
wheat germplasm. Crop Sci. 48:1090-1097.
Yu, J.B., G.H. Bai, W.C. Zhou, Y.H. Dong, and F.L. Kolb. 2008b. Quantitative trait loci for Fusarium head blight
resistance in a recombinant inbred population of Wangshuibai/Wheaton. Phytopathology 98: 87-94.
Yang, Z.P., J. Gilbert, G. Fedak, and D.J. Somers. 2005a. Genetic characterization of QTL associated with resistance
to Fusarium head blight in a doubled-haploid spring wheat population. Genome 48:187-196.
Yang, J., G.H. Bai, and G.E. Shaner. 2005b. Novel quantitative trait loci (QTL) for Fusarium head blight resistance in
wheat cultivar Chokwang. Theor. Appl. Genet. 111:1571-1579.
Zhang, X., M.P. Zhou, L.J. Ren, G.H. Bai, H.X. Ma, O.E. Scholten, P.G. Guo, and W.Z. Lu. 2004. Molecular
characterization of Fusarium head blight resistance from wheat variety Wangshuibai. Euphytica 139:59-64.
Zhou, W.C., F.L. Kolb, G.H. Bai, G.E. Shaner, and L.L. Domier. 2002. Genetic analysis of scab resistance QTL in
wheat with microsatellite and AFLP markers. Genome 45:719-727.
Zhou, W.C., F.L. Kolb, G.H. Bai, L.L. Domier, L.K. Boze, and N.J. Smith. 2003. Validation of a major QTL for scab
resistance with SSR markers and use of marker-assisted selection in wheat. Plant Breed 122:40-46.
Zhou, W.C., F.L. Kolb, J.B. Yu, G.H. Bai, L.K. Boze, and L.L. Domier. 2004. Molecular characterization of Fusarium
head blight resistance in Wangshuibai with simple sequence repeat and amplified fragment length polymorphism
markers. Genome 47:1137-1143.
Page 19 of 26Crop Science Accepted paper, posted 05/07/2014. doi:10.2135/cropsci2013.12.0835

20
Figure Legends
Fig. 1 Frequency distribution of mean percentage of symptomatic spikelets (PSSs) in a spike for the RIL
population derived from cross HCD × ‘Jagger’ in three greenhouse experiments
Fig. 2 Maps of quantitative trait loci (QTL) for FHB type II resistance constructed from a recombinant inbred
line (RIL) population derived from the cross HCD × ‘Jagger’ based on three greenhouse experiments.
Fig. 3 Effects of different combinations of QTLs for percentage of symptomatic spikelets (PSSs) of a spike
in a RIL population derived from HCD × ‘Jagger’ based on FHB disease data collected from three
greenhouse experiments. Group 1 carry resistance alleles from QTLs on 3BS, 3AS and 2D; Group 2 carry
resistance alleles from QTLs on 3BS and 3AS; Group 3 carry resistance alleles from QTLs on 3BS, and 2D;
Group 4 carry resistance allele from QTL on 3BS only; Group 5 carry resistance alleles from QTLs on 3AS
and 2D; Group 6 carry resistance alleles from QTL on 3A only; Group7 carry resistance alleles from QTL on
2D only; Group 8 carry susceptible alleles from all three QTLs. The solid triabgles on the vertical lines are
the mean PSS of each group, and lengths of the lines are 95% confidence intervals. If the confidence
intervals are not overlapped to each other, then the two groups are significantly different at LSD 0.05.
Page 20 of 26Crop Science Accepted paper, posted 05/07/2014. doi:10.2135/cropsci2013.12.0835

21
Table 1 Analysis of variance (ANOVA) of percentage of symptomatic spikelets (PSSs) data for the RIL based on three greenhouse experiments
Source DF Type III SS Mean
square
F value Pr > F
Experiment 2 127782.50 63891.25 218.94 <.0001 Replication 3 1198.96 399.65 1.37 0.2512 Genotype 189 587702.09 3109.53 10.66 <.0001 Experiment*genotype 376 230449.33 612.89 2.10 <.0001 Error 548 159920.26 291.82 Corrected total 1118 1119363.67
Page 21 of 26Crop Science Accepted paper, posted 05/07/2014. doi:10.2135/cropsci2013.12.0835

22
Table 2 Flanking markers, logarithm of the odds (LOD), coefficients of determination (R2) of the significant QTL regions detected by composite interval mapping based on spring 2010, fall 2010, and spring 2011 greenhouse FHB data.
Locus Resistance
allele from Flanking markers Spring 2010 Fall 2010 Spring 2011 Combined mean
LOD R2 LOD R2 LOD R2 LOD R2
Fhb1 HCD Xgwm493~Xgwm533 8.85 16.50% 6.34 11.00% 14.4 26.14% 14.93 23.80%
3BSc HCD Xwmc777~ Xbarc139 4.07 6.60% - - - - - -
3AS HCD Xcfa2134~Xgwm2
4.44 10.00% - - 5.11 7.50%
2D Jagger Xwmc112~Xwmc25 2.69 4.50% - - 5.06 9.50% 4.45 6.80%
6D Jagger Xcfd76~Xbarc175 3.73 6.74% - - - - 2.77 3.80%
Page 22 of 26Crop Science Accepted paper, posted 05/07/2014. doi:10.2135/cropsci2013.12.0835

Fig. 1
0
0.05
0.1
0.15
0.2
0.25
0.3
Proportion of RIL
s
Symptomatic spikelets (%)
Spring 2010
Fall 2010
Spring 2011
HC Jagger
Page 23 of 26Crop Science Accepted paper, posted 05/07/2014. doi:10.2135/cropsci2013.12.0835

Fig. 2
A. 3BS (Left: Fhb1; right: 3BSc)
B. 3AS
Page 24 of 26Crop Science Accepted paper, posted 05/07/2014. doi:10.2135/cropsci2013.12.0835

C. 2D
D. 6DL
Page 25 of 26Crop Science Accepted paper, posted 05/07/2014. doi:10.2135/cropsci2013.12.0835
Fig. 3
0
10
20
30
40
50
60
70
80
Sy
mp
tom
ati
c sp
ike
lets
(%
)
Allele combinations
Page 26 of 26Crop Science Accepted paper, posted 05/07/2014. doi:10.2135/cropsci2013.12.0835
Related Documents