Reference data for quantitative sensory testing (QST): Refined stratification for age and a novel method for statistical comparison of group data Walter Magerl a,⇑,1 , Elena K. Krumova b,1 , Ralf Baron c , Thomas Tölle d , Rolf-Detlef Treede a , Christoph Maier b a Department of Neurophysiology, Center for Biomedicine and Medical Technology Mannheim (CBTM), Medical Faculty Mannheim, Ruprecht Karls University Heidelberg, Ludolf-Krehl-Strasse 13-17, 68167 Mannheim, Germany b Department of Pain Management, BG Kliniken Bergmannsheil, Ruhr-University of Bochum, Bürkle-de-la-Camp-Platz 1, 44789 Bochum, Germany c Division of Neurological Pain Research and Therapy, Department of Neurology, University of Kiel, Germany d Department of Neurology, Technische Universität München, Germany article info Article history: Received 6 October 2009 Received in revised form 5 July 2010 Accepted 22 July 2010 Keywords: Quantitative sensory testing Reference data Stratification Statistics Gender Age abstract Clinical use of quantitative sensory testing (QST) requires standardization. The German research network on neuropathic pain (DFNS) solves this problem by defining reference data stratified for test site, gender and age for a standardized QST protocol. In this report we have targeted two further problems: how to adjust for age-related sensory changes, and how to compare groups of patients with the reference data- base. We applied a moving average across ages to define reference values per decade. This analysis revealed that women were more sensitive to heat pain independent of age. In contrast, functions were converging at older age for blunt pressure pain, but diverging for punctate mechanical pain (pin prick). The probability that an individual patient dataset is within the range of normal variability is calculated by z-transform using site-, gender- and age-specific reference data. To compare groups of patients with reference data, we evaluated two techniques: A: paired t-test versus fixed mean; i.e. the reference mean value is considered as the known population mean, B: non-paired t-test versus the reference dataset and number of cases restrained to the same number of cases as the patient data set. Simulations for various sample sizes and variances showed that method B was more conservative than method A. We present a simple way of calculating method B for data that have been z-normalized. This technique makes the DFNS reference data bank applicable for researchers beyond the DFNS community without a need for subsam- pling of subjects from the database. Ó 2010 Published by Elsevier B.V. on behalf of International Association for the Study of Pain. 1. Introduction The German Research Network on Neuropathic Pain (DFNS) has previously introduced a standardized protocol for quantitative sen- sory testing (QST) in humans [27]. The DFNS approach to obtain a comprehensive profile of somatosensory functions within a rea- sonably short period of time was also considered useful by researchers outside the DFNS [5,23]. Reference data in a multi-cen- ter cohort of healthy subjects of both genders were based on this QST protocol [28]. Consistent with prior studies (e.g. [3,9,14,26,32], these reference values were dependent on test site, gender and age. The DFNS proposed to normalize individual patient data to group-specific means and standard deviations by z-transform and to consider z-values below 1.96 or above +1.96 as abnormal for diagnostic purposes (95% confidence interval [33]). In the DFNS reference data, age-related differences in cutaneous sensitivity were estimated by dividing the cohort into young (<40 years) and old subjects (P40 years). Whereas this approach was appropriate to demonstrate the presence of age-related differences for most QST-parameters (with the exception of pin prick-evoked measures MPT: mechanical pain threshold, MPS: mechanical pain sensitivity, and WUR: wind-up ratio to pin prick), the dichotomy created a discontinuity for the z-transform when crossing the age of 40 years. This discontinuity will be misleading in longitudinal studies, since a mildly abnormal QST value for age 39 falls into the normal range for age 41. In this paper we report decade-specific reference values generated by a moving- average technique that minimizes discontinuities. We then use these values to re-assess gender differences as a function of age. 0304-3959/$36.00 Ó 2010 Published by Elsevier B.V. on behalf of International Association for the Study of Pain. doi:10.1016/j.pain.2010.07.026 Abbreviations: CDT, cold detection threshold; CPT, cold pain threshold; DFNS, Deutscher Forschungsverbund Neuropathischer Schmerz (= German Research Network on Neuropathic Pain); DMA, dynamic mechanical allodynia; HPT, heat pain threshold; MDT, mechanical detection threshold; MPS, mechanical pain sensitivity; MPT, mechanical pain threshold; PHS, paradoxical heat sensation; PPT, pressure pain threshold; QST, quantitative sensory testing; TSL, thermal sensory limen; VDT, vibration detection threshold; WDT, warm detection thresh- old; WUR, wind-up ratio. ⇑ Corresponding author. E-mail address: [email protected] (W. Magerl). 1 Both authors contributed equally to this study. www.elsevier.com/locate/pain PAIN Ò 151 (2010) 598–605

Welcome message from author
This document is posted to help you gain knowledge. Please leave a comment to let me know what you think about it! Share it to your friends and learn new things together.
Transcript
w w w . e l s e v i e r . c o m / l o c a t e / p a i n
PAIN�
151 (2010) 598–605
Reference data for quantitative sensory testing (QST): Refined stratificationfor age and a novel method for statistical comparison of group data
Walter Magerl a,⇑,1, Elena K. Krumova b,1, Ralf Baron c, Thomas Tölle d, Rolf-Detlef Treede a, Christoph Maier b
a Department of Neurophysiology, Center for Biomedicine and Medical Technology Mannheim (CBTM), Medical Faculty Mannheim, Ruprecht Karls University Heidelberg,Ludolf-Krehl-Strasse 13-17, 68167 Mannheim, Germanyb Department of Pain Management, BG Kliniken Bergmannsheil, Ruhr-University of Bochum, Bürkle-de-la-Camp-Platz 1, 44789 Bochum, Germanyc Division of Neurological Pain Research and Therapy, Department of Neurology, University of Kiel, Germanyd Department of Neurology, Technische Universität München, Germany
a r t i c l e i n f o a b s t r a c t
Article history:Received 6 October 2009Received in revised form 5 July 2010Accepted 22 July 2010
Keywords:Quantitative sensory testingReference dataStratificationStatisticsGenderAge
0304-3959/$36.00 � 2010 Published by Elsevier B.V.doi:10.1016/j.pain.2010.07.026
Abbreviations: CDT, cold detection threshold; CPTDeutscher Forschungsverbund Neuropathischer SchNetwork on Neuropathic Pain); DMA, dynamic mecpain threshold; MDT, mechanical detection threshsensitivity; MPT, mechanical pain threshold; PHS,PPT, pressure pain threshold; QST, quantitative sesensory limen; VDT, vibration detection threshold; Wold; WUR, wind-up ratio.⇑ Corresponding author.
E-mail address: [email protected] Both authors contributed equally to this study.
Clinical use of quantitative sensory testing (QST) requires standardization. The German research networkon neuropathic pain (DFNS) solves this problem by defining reference data stratified for test site, genderand age for a standardized QST protocol. In this report we have targeted two further problems: how toadjust for age-related sensory changes, and how to compare groups of patients with the reference data-base. We applied a moving average across ages to define reference values per decade. This analysisrevealed that women were more sensitive to heat pain independent of age. In contrast, functions wereconverging at older age for blunt pressure pain, but diverging for punctate mechanical pain (pin prick).The probability that an individual patient dataset is within the range of normal variability is calculatedby z-transform using site-, gender- and age-specific reference data. To compare groups of patients withreference data, we evaluated two techniques: A: paired t-test versus fixed mean; i.e. the reference meanvalue is considered as the known population mean, B: non-paired t-test versus the reference dataset andnumber of cases restrained to the same number of cases as the patient data set. Simulations for varioussample sizes and variances showed that method B was more conservative than method A. We present asimple way of calculating method B for data that have been z-normalized. This technique makes the DFNSreference data bank applicable for researchers beyond the DFNS community without a need for subsam-pling of subjects from the database.
� 2010 Published by Elsevier B.V. on behalf of International Association for the Study of Pain.
1. Introduction QST protocol [28]. Consistent with prior studies (e.g.
The German Research Network on Neuropathic Pain (DFNS) haspreviously introduced a standardized protocol for quantitative sen-sory testing (QST) in humans [27]. The DFNS approach to obtain acomprehensive profile of somatosensory functions within a rea-sonably short period of time was also considered useful byresearchers outside the DFNS [5,23]. Reference data in a multi-cen-ter cohort of healthy subjects of both genders were based on this
on behalf of International Associa
, cold pain threshold; DFNS,merz (= German Research
hanical allodynia; HPT, heatold; MPS, mechanical painparadoxical heat sensation;nsory testing; TSL, thermalDT, warm detection thresh-
berg.de (W. Magerl).
[3,9,14,26,32], these reference values were dependent on test site,gender and age. The DFNS proposed to normalize individualpatient data to group-specific means and standard deviations byz-transform and to consider z-values below �1.96 or above +1.96as abnormal for diagnostic purposes (95% confidence interval [33]).
In the DFNS reference data, age-related differences in cutaneoussensitivity were estimated by dividing the cohort into young(<40 years) and old subjects (P40 years). Whereas this approachwas appropriate to demonstrate the presence of age-relateddifferences for most QST-parameters (with the exception of pinprick-evoked measures MPT: mechanical pain threshold, MPS:mechanical pain sensitivity, and WUR: wind-up ratio to pin prick),the dichotomy created a discontinuity for the z-transform whencrossing the age of 40 years. This discontinuity will be misleadingin longitudinal studies, since a mildly abnormal QST value forage 39 falls into the normal range for age 41. In this paper wereport decade-specific reference values generated by a moving-average technique that minimizes discontinuities. We then usethese values to re-assess gender differences as a function of age.
tion for the Study of Pain.

W. Magerl et al. / PAIN�
151 (2010) 598–605 599
The site-, gender- and age-specific reference data in this papermay be used by any laboratory to compare their data with a refer-ence dataset of 1080 values. The validity of such a comparison de-pends on using the same QST testing protocol, for which formaltraining and certification have been established [12]. Whereasindividual patient data are easily evaluated via the z-transformand the 95% confidence interval, no procedure has been identifiedyet for the statistical comparison of group data with this referencedata set. Such a procedure is urgently needed since already 117investigators from 38 groups in 15 different countries have beentrained by certified DFNS centers and are using the DFNS’ QST sys-tem for basic and clinical science, in academia as well as in thepharmaceutical industry. This paper provides a simple algorithmfor group comparisons that does not require access to the referencedataset itself and establishes rules for statistical comparison.Moreover, it suggests quality criteria for centers for comparisonof their own data to the DFNS reference data.
2. Methods
To obtain an age-adjusted reference data base, the recently pub-lished reference data [28] were re-analyzed and separated for bothgenders and the three body regions that were available in the DFNSdata bank: face (mid cheek, blunt pressure pain threshold PPT onthe masseter muscle with upper and lower teeth in occlusion posi-tion), hands (dorsum, blunt pressure pain threshold PPT at the the-nar) and feet (dorsum, blunt pressure pain threshold PPT at theinstep). Currently we do not have multi-center reference data forother body regions yet. We tentatively use hand data as represen-tative for the upper body and foot data for the lower body. Unpub-lished single-center data indicate that in spite of mean valuedifferences the 95% confidence intervals overlap vastly for mostQST parameters for measurements on the dorsal hand comparedto measurements on the palmar hand, in the thoracic areas or inthe areas over the trapezius muscle (except for higher mechanicaland thermal detection thresholds on the palmar side and for highervibration detection thresholds on the trunk). Since left–right differ-ences were independent of test region [28], it is prudent to relymore on those differences than on absolute reference values whenevaluating non-standard test regions.
The data were obtained from 180 healthy subjects in a compre-hensive standardized QST protocol consisting of 7 tests measuring13 parameters. All subjects who were entered in this data set wereof European/Caucasian descent. Data from both body sideswere pooled because all correlations across the two body sideswere highly significant (all p < 0.001), regression functions wereclose to unity and there was no significant difference. For detailsof the protocol, see parent data set [28]. Briefly, the protocol con-tained both thermal and mechanical test stimuli, namely: thermaldetection thresholds for the perception of cold (CDT: cold detec-tion threshold), warmth (WDT: warm detection threshold) andparadoxical heat sensations (PHS: paradoxical heat sensation),thermal pain thresholds for cold (CPT) and hot stimuli (HPT),mechanical detection thresholds for touch (MDT) and vibration(VDT), mechanical pain sensitivity including thresholds for pin-prick (MPT) and blunt pressure (PPT), a stimulus–response-func-tion for pinprick sensitivity (MPS) and dynamic mechanicalallodynia (DMA: dynamical mechanical allodynia) as well as painsummation to repetitive pinprick stimuli (WUR� wind-up ratio)[27].
The data base was divided according to age into five segmentsrepresenting decade groups. To avoid discontinuities, a moving-average procedure was used by including the neighboring half-decades for calculation of mean and standard deviation of eachage group:
� decade 20–30 years: calculated from subjects between > 15 and35 years of age� decade 30–40 years: calculated from subjects between > 25 and
45 years of age� decade 40–50 years: calculated from subjects between > 35 and
55 years of age� decade 50–60 years: calculated from subjects between > 45 and
65 years of age� decade 60–70 years: calculated from subjects between > 55 and
75 years of age
All data except for PHS, CPT, HPT and VDT were normally dis-tributed in logarithmic space (log-normal distribution) as alreadyshown for this data set in previous analysis [28]. Thus, logarithmi-cal transformation was performed for all other parameters prior tostatistical analysis to achieve secondary normal distribution (fortheoretical background, see also [27]. Correlation analysis betweenthe subjects’ age and QST parameters was performed using bivar-iate parametric correlation/regression analysis (Pearson). Differ-ences between age decade, gender (between-subjects factors)and tested body region (within-subject factor) were comparedusing three-way mixed model ANOVA for all QST parameters.
Differences between the ten DFNS centers contributing subjectsto QST reference data were analyzed to delineate the magnitude ofbetween-centers variation, and to derive measures of distribution(standard deviation, confidence intervals) within and across cen-ters. Furthermore, effect sizes for every center were calculated tojudge the magnitude of deviation from the grand mean. These dis-tribution parameters are used to delineate guidelines for compar-ative self-checking of centers outside of DFNS.
A novel method of statistical comparison was developed, whichallows a bias-free and balanced comparison of data sets of anymixture of QST data based on the DFNS battery of sensory assess-ment. Two different approaches were compared using calculationof t-tests on standard normal data (z-values) for patient groupswith a wide variety of means, standard deviations and numbersof subjects to illustrate the feasibility and statistical merits of themethods.
� In the first approach, the patient groups were compared to thereference data by treating the reference data mean (z = 0) as theknown population mean value. This is a standard procedure,which is implemented in many statistical software packagesand is equivalent to paired t-tests versus an equal number ofzeros.� In the second approach, the patient groups were compared to
the reference data by non-paired t-tests. Such an approachmay lead to false positive findings due to the large number ofdegrees of freedom from the reference data (1080 values).Therefore, we introduced a virtual subsampling of the referencedata base, by setting its ‘‘n” number equal to the number ofobservations in the patient data set.� Data in figures are presented as mean ± SD. Reference data are
shown as means and 95% confidence intervals (mean ± 1.96 *SD). Data of log-transformed QST parameters (CDT, WDT, TSL,MDT, MPT, MPS, ALL, WUR and PPT) were retransformed to valuesrepresenting the original units of the parameters.
3. Results
3.1. New age-related QST reference data
The reference data published in [28] have been re-analyzedwith a higher resolution for age (Table S1). Analysis of varianceconfirmed that non-nociceptive thermal (CDT, WDT, TSL) andtactile thresholds (MDT) varied by region always in the same rank

ofva
rian
ceof
QST
refe
renc
eda
ta.
Age
(2)
Reg
ion
(3)
1x
21
x3
2x
31
x2
x3
F 4,3
50
=9.
00***
F 2,7
00
=34
1.40
***
F 4,3
50
=0.
72n
.s.
F 2,7
00
=13
.35*
**
F 8,7
00
=2.
78**
F 8,7
00
=1.
58n
.s
F 4,3
50
=8.
86***
F 2,7
00
=52
9.47
***
F 4,3
50
=1.
44n
.s.
F 2,7
00
=9.
42***
F 8,7
00
=3.
55***
F 8,7
00
=1.
00n
.s.
F 4,3
50
=7.
81***
F 2,7
00
=66
8.59
***
F 4,3
50
=1.
05n
.s.
F 2,7
00
=10
.94*
**
F 8,7
00
=3.
55***
F 8,7
00
=2.
62**
F 4,3
50
=8.
50***
F 2,7
00
=15
.43*
**
F 4,3
50
=2.
49*
F 2,7
00
=0.
99n
.s.
F 8,7
00
=1.
14n
.s.
F 8,7
00
=0.
88n
.s.
F 4,3
50
=7.
83***
F 2,7
00
=53
.38*
**
F 4,3
50
=1.
93n
.s.
F 2,7
00
=0.
22n
.s.
F 8,7
00
=2.
52*
F 8,7
00
=1.
05n
.s.
F 4,3
48
=8.
71***
F 2,6
96
=78
6.23
***
F 4,3
48
=2.
69*
F 2,6
96
=0.
83n
.s.
F 8,6
96
=4.
07***
F 8,6
96
=1.
12n
.s.
F 4,3
50
=2.
19(*
)F 2
,70
0=
141.
81***
F 4,3
50
=2.
30(*
)F 2
,70
0=
5.68
**
F 8,7
00
=3.
68***
F 8,7
00
=2.
42*
F 4,3
50
=1.
07n
.s.
F 2,7
00
=25
.16*
**
F 4,3
50
=0.
98n
.s.
F 2,7
00
=0.
77n
.s.
F 8,7
00
=1.
37n
.s.
F 8,7
00
=1.
38n
.s.
F 4,3
40
=1.
20n
.s.
F 2,6
80
=16
.97*
**
F 4,3
40
=2.
17(*
)F 2
,68
0=
4.47
*F 8
,68
0=
1.93
(*)
F 8,6
80
=2.
11*
F 4,3
50
=8.
07***
F 2,7
00
=59
9.17
***
F 4,3
50
=1.
23n
.s.
F 2,7
00
=12
.51*
**
F 8,7
00
=6.
36***
F 8,7
00
=1.
54n
.s
F 4,3
48
=11
.47*
**
F 2,6
96
=86
.54*
**
F 4,3
48
=0.
56n
.s.
F 2,6
96
=3.
45*
F 8,6
96
=8.
41***
F 8,6
96
=2.
46*
600 W. Magerl et al. / PAIN�
151 (2010) 598–605
order (feet > hand > face), but did essentially not differ betweengenders (Table 1). We now found that these non-nociceptivethresholds varied significantly linearly with age albeit correlationcoefficients were very small (correlations between r = 0.207 andr = 0.257, all p < 0.01), and the percentage of variance explainedby the covariate age (approximately 4–6%) was negligible (seeTable S2). Generally, thresholds increased by approximately 50%across the age range tested (age dependency was somewhat lesserin the face).
As previously shown, nociceptive thresholds exhibited signifi-cant gender differences, females being more sensitive than males(Table S1). The refined stratification for age enabled a more de-tailed analysis of the interaction of age and gender. Little complex-ity was found in the analysis of thermal pain thresholds. Heat painthresholds increased monotonically with age in all test regions,being approximately 2.1 �C higher in the oldest cohort (60–70 years) than in young adults (20–30 years). This threshold in-crease was independent of gender, and heat pain thresholds were1.6 �C higher in male than in female subjects throughout all ageranges (Fig. 1). Cold pain thresholds of male subjects were on aver-age met at approximately 1.7 �C lower temperatures than in femalesubjects (Fig. 2A). In females, cold pain thresholds dropped mono-tonically with increasing age by approximately 9 �C, while age var-iation was lesser and also less consistent in male subjects, which issubstantiated as a significant age � gender interaction (ANOVA,p < 0.01, Table 1).
Gender differences across age ranges followed a more complexpattern for mechanical pain thresholds (Fig. 2B and C). Differencesbetween genders systematically shrank for blunt pressure (PPT),and diverged for pin pricks (MPT) with increasing age. Pain thresh-olds to blunt pressure stimuli (PPT) differed between male and fe-male subjects in young and middle-aged adults (20–50 years, allp < 0.005), but PPT did not differ any more between male and fe-male subjects in the older cohorts (50–70 years, p > 0.60, each).Conspicuously, MPTs were the only thresholds with no overalldependency on age (overall correlation with age: r = �0.067, n.s.).Nevertheless, thresholds in male and female varied with age, butthey did so in opposite ways in all body regions (depicted forMPT at the hand in Fig. 2C). While MPTs were not different at allbetween genders at young age (post hoc significances for the lowertwo decades: p = 0.47 and p = 0.77), thresholds of male and femalesubjects progressively diverged symmetrically with increasing age.Accordingly, MPT in older males was approximately twice as highas in females (post hoc significances for the upper three decades:p < 0.005, p < 0.02, and p < 0.01).
Tabl
e1
Corr
elat
ion
wit
hag
e(p
erce
ntof
vari
ance
expl
aine
dby
age)
and
anal
ysis
QST
Cor
rela
tion
wit
hag
ea
(var
ian
ceex
plai
ned
,%)
Gen
der
(1)
CD
T0.
210*
*(4
.41%
)F 1
,35
0=
1.72
n.s
WD
T0.
211*
*(4
.45%
)F 1
,35
0=
4.66
*
TSL
0.24
0**
(5.7
6%)
F 1,3
50
=0.
66n
.s.
CPT
-0.2
09**
(4.3
7%)
F 1,3
50
=3.
29(*
)
HPT
0.25
7***
(6.6
0%)
F 1,3
50
=23
.32*
**
PPT
0.20
7**
(4.2
8%)
F 1,3
48
=17
.63*
**
MPT
-0.0
67n
.s(0
.45%
)F 1
,35
0=
17.5
3***
MPS
0.00
1n.s
(0.0
0%)
F 1,3
50
=3.
48(*
)
WU
R0.
056n
.s.(0
.31%
)F 1
,34
0=
0.77
n.s
.
MD
T0.
207*
*(4
.28%
)F 1
,35
0=
4.09
*
VD
T-0
.248
***
(6.1
5%)
F 1,3
48
=1.
01n
.s.
n.s
.n
otsi
gnifi
can
t(*
)p
<0.
10*
p<
0.05
**
p<
0.01
***
p<
0.00
1a
aver
age
corr
elat
ion
coef
fici
ents
acro
ssge
nde
rsan
dbo
dyre
gion
s.
3.2. Comparing patient group data to the QST reference dataset
Patient groups are typically inhomogeneous with respect togender and age, and test sites may also differ (e.g. peripheral nerveinjury of upper and lower limb). Such data may nonetheless beaveraged, provided each value is first normalized to the appropri-ate subgroup in the stratified reference dataset (Appendix 1) byfirst subtracting the subgroup-specific mean and then dividing bythe respective standard deviation (z-transform). If sensory functionin the patient group is unaffected, their data distribution can beexpected to have zero mean and standard deviation of one. Anintuitive approach to test this null hypothesis would be by anon-paired t-test, according to the following equation:
t ¼ ðmeanpat �meanrefÞ=square rootðSD2pat=npat þ SD2
ref=nrefÞ and
df ¼ npat þ nref � 2 ð1Þ
Since the patient groups are typically at least one order of magni-tude smaller than the reference population (npat << nref), this

Fig. 2. Age dependence of pain thresholds in the hand for cold pain (CPT), blunt pressure pain (PPT) and pain to pin prick stimuli (MPT). (A) CPT shifted linearly to lowertemperatures with age by approximately 7 �C from the youngest to the oldest cohort, and CPT in male subjects was met on average at 1.7 �C lower temperatures than infemales with a nearly parallel shift between genders, but less regular in male (solid circles) than in female subjects (open circles). (B) PPT differed between male and female inyoung adults. PPT increased with age to level off at mid-age levels, which occurred earlier in males than in females resulting in convergence of PPT in the older cohorts (50–70 years). (C) MPT did not differ between genders at young age, but thresholds of male and female subjects progressively diverged with increasing age.
Fig. 1. Age dependence of heat pain threshold (HPT) in the face (A), hand (B) and foot (C). HPT increased monotonically with age in all regions, and was approximately 2.1 �Chigher in the oldest cohort (50–60 years) than in young adults (20–30 years) independent of gender and test region. In all test areas, HPT in female subjects (open circles) wasabout 1.6 �C lower than in male subjects (solid circles) independent of age and test region. HPT was lowest in the face, intermediate on the hand and highest on the foot.
W. Magerl et al. / PAIN�
151 (2010) 598–605 601
approach causes two problems: the denominator is dominated bythe standard deviation of the patient group, which is estimatedrather imprecisely with a small number of observations. Moreover,the degrees of freedom are dominated by the large reference group.These effects may lead to false positive results, in particular forsmall homogenous patient groups (small n and small SD; see alsobelow).
As a first solution to this problem, we considered the standardstatistical procedure to compare group data with the theoreticalor known population mean by a paired t-test (method A). Thissolution is reasonable, since the population mean will be estimatedwell if the reference group is sufficiently large. Inflated degrees offreedom are avoided, since for paired t-tests only the number ofobservations in the patient group counts. However, the problemof inaccuracies in estimating the denominator remains, as illus-trated in the following equation:
t ¼ ðmeanpat � 0Þ=square rootðSD2pat=npatÞ and df ¼ npat � 1 ð2Þ
As an alternative solution to the problems with Eq. (1), we consid-ered a virtual subsampling of the reference dataset (method B) suchthat mean and standard deviation are maintained, but its number ofobservations equals that in the patient group (npat = nref). Since the
reference data have zero mean and unit standard deviation, thisleads to a rather simple equation:
t ¼ ðmeanpat � 0Þ=square rootðSD2pat=npat þ 1=npatÞ and
df ¼ 2 � npat � 2 ð3Þ
The relevance of reducing the number of subjects in the virtual con-trol group is illustrated by the following example: Given an esti-mate of 0.3 ± 0.5 (n = 32) for the patient group and standardnormal distribution for the control group (0 ± 1), this leads to a teststatistic of t = 3.21 (p = 0.003), when tested against the full-size con-trol group. However, when tested against a control group of thesame size (n = 32), the test statistic becomes t = 1.52 (p = 0.13).
When comparing Eqs. (2) and (3), it is not intuitively evident aswhich one and under what circumstances will be more conserva-tive: due to the additional term in its denominator the t-value inEq. (3) is smaller than in formula 2, but it is associated with a largernumber of degrees of freedom. We therefore performed simula-tions for a range of numbers of patients (10–100), standard devia-tions in the patient data smaller or larger than in the referencegroup (0.25–4.0), and mean values of the patient group between0.25 and 1.0 (corresponding to effect sizes of 0.25–1.0).

Fig. 3. Simulated comparisons of patient groups with QST reference dataset by two methods using z-transformed data. Dashed lines: Method A (paired t-test versus knownpopulation mean). Solid lines: Method B (non-paired t-test versus virtual subsample of the reference dataset yielding the same sample size as the patient dataset). (A)Estimation of p-values was more conservative for method B than for method A independent of effect size (indicated by z-value of the patient dataset), especially at lowerstandard deviations of the patient data set (for n = 10). (B) Estimation of p-values was also more conservative for method B than for method A independent of sample size,especially at lower standard deviations of the patient data set (for effect size = 1.0). (C) When plotted against effect size, the probability curves for method B were shifted tothe right of method A, indicating that this more conservative method requires either a larger effect size or a larger sample size to be significant (curves calculated for standarddeviation in patient group = 1.0).
602 W. Magerl et al. / PAIN�
151 (2010) 598–605
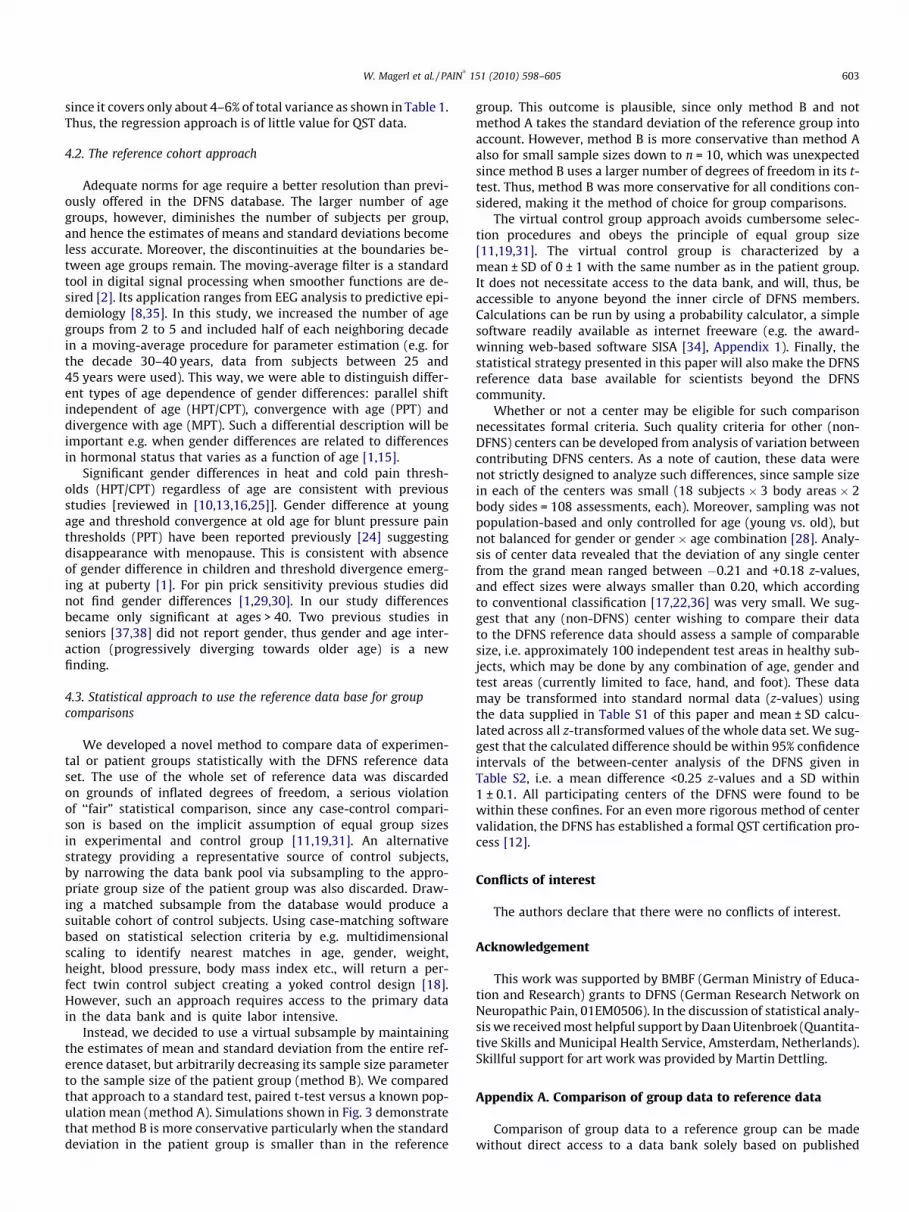
Fig. 3A displays probability values for both scenarios for varyingstandard deviation of a small group of 10 patients. Probabilitycurves converge for larger standard deviations, but for small stan-dard deviations, method A (Eq. (2)) over-estimates the t-valueleading to higher levels of significance, independent of effect sizes(equal to the mean z-value of the patient group). Fig. 3B displaysprobability values for varying standard deviations at a fixed effectsize of 1.0. Also for larger group sizes, method A (Eq. (2)) led to lessconservative estimates than method B (Eq. (3)). In Fig. 3C, p-valuesare plotted versus effect size. Method B (solid lines) usually re-quires about 30% larger effect size than method A (dashed lines) toreach the same level of significance. Thus, for any combination ofsample size, effect size and standard deviation in the patient group,more conservative estimates were obtained by method B that takesthe standard deviation of the reference dataset into account. Proba-bility curves obtained by methods A and B converged only at verylarge standard deviations of the patient group (i.e. SDpat >> SDref –Fig. 3A and B) or at (unrealistically) high effect sizes (Fig. 3C).
Finally, we have analyzed differences between the ten DFNScenters contributing subjects to QST reference data. Although be-tween-center data were not strictly designed to analyze such dif-ferences, this analysis may provide some guideline for other(non-DFNS) centers, who may want to compare their data to theDFNS data. To circumvent sampling asymmetries between centersthis analysis used z-transformed values, which cancel the effects ofarea, age and gender. The results of all centers are listed inTable S2. As expected, the mean z-value ± SD was almost 0 ± 1 (asmall deviation to 0.01 ± 0.99 was caused by few missing singledata). The mean of z-values of the single centers ranged from�0.21 to +0.18 with a grand mean and 95% confidence interval of0.01 ± 0.25. Likewise, standard deviations of the centers varied be-tween 0.93 and 1.09 with a grand mean and 95% confidence inter-val of 0.99 ± 0.10. We suggest that any laboratory wishing to usethe DFNS reference data should have mean and SD of their localz-transformed data from healthy subjects within these 95% confi-dence intervals.
4. Discussion
The German Research Network on Neuropathic Pain (DFNS) hasimplemented a multi-center database of QST reference values forboth genders and currently three body regions, namely face, handand foot [28]. Transformation into standard normal distribution,
i.e. z-transformation, allows an easy judgment, whether a valuein a given patient is outside the normal range defined as 95% con-fidence interval (±1.96 * SD; note that several parameters need tobe logarithmically transformed for this purpose [27]).
Whereas gender and test site can be regarded as discrete vari-ables reasonably taken into account by a stratified reference data-set [3,16,20] (but see [15] for masculinity/femininity as a potentialcontinuous variable), age clearly is a continuous variable. Stratifi-cation into two age groups as in the DFNS data base and in otherpublications [4,6,7,9] may lead to age-related bias if used diagnos-tically. For example, average heat pain thresholds in the foot were45.1 versus 47.0 �C in subjects of the young vs. old age cohort [28].Thus, the same QST result in two patients of similar age (e.g. 38 and42 years) would be interpreted differently, e.g. a heat pain thresh-old of 42 �C in the foot may be diagnosed as normal in the 38 yearold (nominally ‘‘young”) subject, but as abnormal (hyperalgesic) inthe 42 year old (nominally ‘‘old”) subject. Conversely, younger andolder patients (e.g. 42 and 67 years) of the same age cohort may bemisdiagnosed in the opposite direction.
4.1. The regression approach
Although there were highly significant correlations with agethroughout the majority of QST parameters, continuous adjustmentfor age of the subject/patient is problematic due to the low value ofcorrelation coefficients. Similarly low correlation with age has alsobeen reported for nociceptive and non-nociceptive QST thresholdsin other large scale studies (e.g. [21,32]) and for amplitudes ofsomatosensory-evoked potentials, an objective measure of somato-sensory function [39]. When the correlation coefficient is low, theslope of the regression line is low too. A correction of age-depen-dence by regression would return a tilted regression function muchshallower than real (e.g. as estimated by eye-fit) resulting in an age-related evaluation bias and the function would predict unrealisticvalues in young (higher) and old subjects (lower) and a relativeinsensitivity to detect sensory loss in young subjects, but overesti-mate the loss in old subjects. In contrast, the opposite would be truefor sensory gain, thus overestimating hyperalgesia symptoms inyoung, but underestimating them in old subjects. Moreover, age-dependence was not linear for all parameters (e.g. for PPT), and itvaried between genders for the same parameter (e.g. for MPT).Moreover the explanatory power of this regression (e.g. when en-tered as a covariate to single out age-related variance) is very low,
W. Magerl et al. / PAIN�
151 (2010) 598–605 603
since it covers only about 4–6% of total variance as shown in Table 1.Thus, the regression approach is of little value for QST data.
4.2. The reference cohort approach
Adequate norms for age require a better resolution than previ-ously offered in the DFNS database. The larger number of agegroups, however, diminishes the number of subjects per group,and hence the estimates of means and standard deviations becomeless accurate. Moreover, the discontinuities at the boundaries be-tween age groups remain. The moving-average filter is a standardtool in digital signal processing when smoother functions are de-sired [2]. Its application ranges from EEG analysis to predictive epi-demiology [8,35]. In this study, we increased the number of agegroups from 2 to 5 and included half of each neighboring decadein a moving-average procedure for parameter estimation (e.g. forthe decade 30–40 years, data from subjects between 25 and45 years were used). This way, we were able to distinguish differ-ent types of age dependence of gender differences: parallel shiftindependent of age (HPT/CPT), convergence with age (PPT) anddivergence with age (MPT). Such a differential description will beimportant e.g. when gender differences are related to differencesin hormonal status that varies as a function of age [1,15].
Significant gender differences in heat and cold pain thresh-olds (HPT/CPT) regardless of age are consistent with previousstudies [reviewed in [10,13,16,25]]. Gender difference at youngage and threshold convergence at old age for blunt pressure painthresholds (PPT) have been reported previously [24] suggestingdisappearance with menopause. This is consistent with absenceof gender difference in children and threshold divergence emerg-ing at puberty [1]. For pin prick sensitivity previous studies didnot find gender differences [1,29,30]. In our study differencesbecame only significant at ages > 40. Two previous studies inseniors [37,38] did not report gender, thus gender and age inter-action (progressively diverging towards older age) is a newfinding.
4.3. Statistical approach to use the reference data base for groupcomparisons
We developed a novel method to compare data of experimen-tal or patient groups statistically with the DFNS reference dataset. The use of the whole set of reference data was discardedon grounds of inflated degrees of freedom, a serious violationof ‘‘fair” statistical comparison, since any case-control compari-son is based on the implicit assumption of equal group sizesin experimental and control group [11,19,31]. An alternativestrategy providing a representative source of control subjects,by narrowing the data bank pool via subsampling to the appro-priate group size of the patient group was also discarded. Draw-ing a matched subsample from the database would produce asuitable cohort of control subjects. Using case-matching softwarebased on statistical selection criteria by e.g. multidimensionalscaling to identify nearest matches in age, gender, weight,height, blood pressure, body mass index etc., will return a per-fect twin control subject creating a yoked control design [18].However, such an approach requires access to the primary datain the data bank and is quite labor intensive.
Instead, we decided to use a virtual subsample by maintainingthe estimates of mean and standard deviation from the entire ref-erence dataset, but arbitrarily decreasing its sample size parameterto the sample size of the patient group (method B). We comparedthat approach to a standard test, paired t-test versus a known pop-ulation mean (method A). Simulations shown in Fig. 3 demonstratethat method B is more conservative particularly when the standarddeviation in the patient group is smaller than in the reference
group. This outcome is plausible, since only method B and notmethod A takes the standard deviation of the reference group intoaccount. However, method B is more conservative than method Aalso for small sample sizes down to n = 10, which was unexpectedsince method B uses a larger number of degrees of freedom in its t-test. Thus, method B was more conservative for all conditions con-sidered, making it the method of choice for group comparisons.
The virtual control group approach avoids cumbersome selec-tion procedures and obeys the principle of equal group size[11,19,31]. The virtual control group is characterized by amean ± SD of 0 ± 1 with the same number as in the patient group.It does not necessitate access to the data bank, and will, thus, beaccessible to anyone beyond the inner circle of DFNS members.Calculations can be run by using a probability calculator, a simplesoftware readily available as internet freeware (e.g. the award-winning web-based software SISA [34], Appendix 1). Finally, thestatistical strategy presented in this paper will also make the DFNSreference data base available for scientists beyond the DFNScommunity.
Whether or not a center may be eligible for such comparisonnecessitates formal criteria. Such quality criteria for other (non-DFNS) centers can be developed from analysis of variation betweencontributing DFNS centers. As a note of caution, these data werenot strictly designed to analyze such differences, since sample sizein each of the centers was small (18 subjects � 3 body areas � 2body sides = 108 assessments, each). Moreover, sampling was notpopulation-based and only controlled for age (young vs. old), butnot balanced for gender or gender � age combination [28]. Analy-sis of center data revealed that the deviation of any single centerfrom the grand mean ranged between �0.21 and +0.18 z-values,and effect sizes were always smaller than 0.20, which accordingto conventional classification [17,22,36] was very small. We sug-gest that any (non-DFNS) center wishing to compare their datato the DFNS reference data should assess a sample of comparablesize, i.e. approximately 100 independent test areas in healthy sub-jects, which may be done by any combination of age, gender andtest areas (currently limited to face, hand, and foot). These datamay be transformed into standard normal data (z-values) usingthe data supplied in Table S1 of this paper and mean ± SD calcu-lated across all z-transformed values of the whole data set. We sug-gest that the calculated difference should be within 95% confidenceintervals of the between-center analysis of the DFNS given inTable S2, i.e. a mean difference <0.25 z-values and a SD within1 ± 0.1. All participating centers of the DFNS were found to bewithin these confines. For an even more rigorous method of centervalidation, the DFNS has established a formal QST certification pro-cess [12].
Conflicts of interest
The authors declare that there were no conflicts of interest.
Acknowledgement
This work was supported by BMBF (German Ministry of Educa-tion and Research) grants to DFNS (German Research Network onNeuropathic Pain, 01EM0506). In the discussion of statistical analy-sis we received most helpful support by Daan Uitenbroek (Quantita-tive Skills and Municipal Health Service, Amsterdam, Netherlands).Skillful support for art work was provided by Martin Dettling.
Appendix A. Comparison of group data to reference data
Comparison of group data to a reference group can be madewithout direct access to a data bank solely based on published

604 W. Magerl et al. / PAIN�
151 (2010) 598–605
means and standard deviations of the reference data (e.g. Table 1 ofthis paper). All calculations are based on standard normal distribu-tion data (z-values), which can be easily computed by subtractingthe mean of the reference data and then dividing by the standarddeviation of the reference data. Z-transformed reference data thenhave zero mean and unit standard deviation.
Comparison between records of test group data (= exp.) and amatched control group created as a fictitious subpopulation ofreference group data of equal number (= con) is performed by t-test statistic (formula below). The distribution of Z-values of thecontrol group is always given as mean = 0 and standard deviation(SD) = 1. (please note: equal group sizes are standard in case-con-trol studies; see e.g. Gail 1998).
T-statistic for comparison:
t ¼ ðmeanexp �meanconÞ=squarerootðSD2exp=ncxp þ SD2
con=nconÞ and :
meancon ¼ 0 and SDcon ¼ 1 and nExp ¼ nCon
Appendix B. ‘‘Recipe’’ for practical conduct of statisticalcomparison
1. Calculation of tests is performed using simple probability calcu-lators for t-tests (using e.g. STATISTICA Basic Statistics–Proba-bility Calculator). Only mean, SD and number of data in thetest group is needed. If respective statistical software is notavailable internet-based statistical freeware can be used (e.g.Quantitative Skills - SISA, see below)
2. All single data of the test group have to be transformed into astandard value (z-value) using mean and standard deviation(SD) from the appropriate age and gender cohort of the healthysubjects data base of the DFNS according to the followingequation:
z¼ðsingle subjectexp: group�meancontrol from reference dataÞ=SDcontrol from reference data
3. Input of mean and SD of test group data (exp.) and number ofcases (e.g. n = 32)
4. Input of mean and SD of reference group data (con) and numberof cases (e.g. n = 32) (always mean = 0 and SD = 1) and an equalnumber of cases (i.e. in this case, also n = 32)
5. Calculation of t-test (two sided and independent samples!!)a. you get a t-statistic with 2 � (n – 1) degrees of freedom
Calculation by simple internet-based statistical softwareSimple Interactive Statistical Analysis (SISA)URL: http://www.quantitativeskills.com/sisa/ (as accessed
2009, July 16)(general URL, there are many other statistical applications)special application unpaired (whole sample) t-testURL: http://www.quantitativeskills.com/sisa/statistics/t-test.
htm
Appendix C. Supplementary data
Supplementary data associated with this article can be found, inthe online version, at doi:10.1016/j.pain.2010.07.026.

W. Magerl et al. / PAIN�
151 (2010) 598–605 605
References
[1] Blankenburg M, Boekens H, Hechler T, Maier C, Krumova E, Scherens A, MagerlW, Aksu F, Zernikow B. Reference values for quantitative sensory testing inchildren and adolescents: developmental and gender differences of somato-sensory perception. Pain 2010;149:76–88.
[2] Box GEP, Jenkins GM. Time series analysis: forecasting and control. Reviseded. San Francisco: Holden-Day; 1997.
[3] Chesterton LS, Barlas P, Foster NE, Baxter GD, Wright CC. Gender differences inpressure pain threshold in healthy humans. Pain 2003;101:259–66.
[4] Cole LJ, Farrell MJ, Gibson SJ, Egan GF. Age-related differences in painsensitivity and regional brain activity evoked by noxious pressure. NeurobiolAging 2010;31:494–503.
[5] Cruccu G, Truini A. Tools for assessing neuropathic pain. PLoS Med2009;6:e1000045.
[6] Edwards RR, Fillingim RB. Age-associated differences in responses to noxiousstimuli. J Gerontol A Biol Sci Med Sci 2001;56:M180–5.
[7] Farrell M, Gibson S. Age interacts with stimulus frequency in the temporalsummation of pain. Pain Med 2007;8:514–20.
[8] Farwell LA, Martinerie JM, Bashore TR, Rapp PE. Goddard PH optimal digitalfilters for long-latency components of the event-related brain potential.Psychophysiology 1993;30:306–15.
[9] Feine JS, Bushnell MC, Miron D, Duncan GH. Sex differences in the perceptionof noxious heat stimuli. Pain 1991;44:255–62.
[10] Fillingim RB, King CD, Ribeiro-DaSilva MC, Rahim-Williams B, Riley JL. Sex,gender, and pain: a review of recent clinical and experimental findings. J Pain2009;10:447–85.
[11] Gail MH. Controls. In: Armitage P, Colton T, editors. Encyclopedia ofbiostatistics, vol. 1. Chichester: Wiley; 1998. p. 932.
[12] Geber C, Scherens A, Pfau D, Nestler N, Zenz M, Tölle T, Baron R, Treede RD,Maier C. Procedure for certification of QST laboratories. Schmerz 2009;23:65–9 [Article in German].
[13] Gibson SJ, Farrell M. A review of age differences in the neurophysiology ofnociception and the perceptual experience of pain. Clin J Pain 2004;20:227–39.
[14] Gibson SJ, Helme RD. Age-related differences in pain perception and report.Clin Geriatr Med 2001;17:433–56.
[15] Greenspan JD, Craft RM, LeResche L, Arendt-Nielsen L, Berkley KJ, Fillingim RB,Gold MS, Holdcroft A, Lautenbacher S, Mayer EA, Mogil JS, Murphy AZ, TraubRJ. Consensus working group of the sex, gender, and pain SIG of the IASP.Studying sex and gender differences in pain and analgesia: a consensus report.Pain 2007;132:S26–45.
[16] Hurley RW, Adams MC. Sex, gender, and pain: an overview of a complex field.Anesth Analg 2008;107:309–17.
[17] Cohen J. Statistical power analysis for the behavioral sciences. 2nded. Hillsdale: Lawrence Erlbaum; 1988.
[18] Krauth J. Experimental design. A handbook and dictionary for medical andbehavioural research. Amsterdam: Elsevier; 2000.
[19] Lachin JM. Sample size determination. In: Armitage P, Colton T, editors.Encyclopedia of biostatistics, vol. 5. Chichester: Wiley; 1998. p. 3893–902.
[20] Lautenbacher S, Rollman GB. Sex differences in responsiveness to painful andnon-painful stimuli are dependent upon the stimulation method. Pain1993;53:255–64.
[21] Lin YH, Hsieh SC, Chao CC, Chang YC, Hsieh ST. Influence of aging on thermaland vibratory thresholds of quantitative sensory testing. J Peripher Nerv Syst2005;10:269–81.
[22] Nakagawa S, Cuthill IC. Effect size, confidence interval and statistical significance.A practical guide for biologists. Biol Rev Camb Phil Soc 2007;82:591–605.
[23] Petersen KL, Rowbotham MC. Quantitative sensory testing scaled up formulticenter clinical research networks: a promising start. Pain2006;123:219–20.
[24] Pickering G, Jourdan D, Eschalier A, Dubray C. Impact of age, gender andcognitive functioning on pain perception. Gerontology 2002;48:112–8.
[25] Riley JL, Robinson ME, Wise EA, Myers CD, Fillingim RB. Sex differences in theperception of noxious experimental stimuli: a meta-analysis. Pain 1998;74:181–7.
[26] Rollman GB, Lautenbacher S. Sex differences in musculoskeletal pain. Clin JPain 2001;17:20–4.
[27] Rolke R, Magerl W, Campbell KA, Schalber C, Caspari S, Birklein F, Treede RD.Quantitative sensory testing: a comprehensive protocol for clinical trials. Eur JPain 2006;10:77–88.
[28] Rolke R, Baron R, Maier C, Tölle TR, Treede RD, Beyer A, Binder A, Birbaumer N,Birklein F, Bötefür IC, Braune S, Flor H, Huge V, Klug R, Landwehrmeyer GB,Magerl W, Maihöfner C, Rolko C, Schaub C, Scherens A, Sprenger T, Valet M,Wasserka B. Quantitative sensory testing in the German Research Network onNeuropathic Pain (DFNS): standardized protocol and reference values. Pain2006;123:231–43.
[29] Sarlani E, Greenspan JD. Gender differences in temporal summation ofmechanically evoked pain. Pain 2002;97:163–9.
[30] Sarlani E, Grace EG, Reynolds MA, Greenspan JD. Sex differences in temporalsummation of pain and after sensations following repetitive noxiousmechanical stimulation. Pain 2004;109:115–23.
[31] Shoukri MM, Asyali MH, Donner A. Sample size requirements for the design ofreliability study-review and new results. Stat Methods Med Res2004;13:251–71.
[32] Torgén M, Swerup C. Individual factors and physical work load in relation tosensory thresholds in a middle-aged general population sample. Eur J ApplPhysiol 2002;86:418–27.
[33] Treede RD, Baron R. How to detect a sensory abnormality. Eur J Pain2008;12:395–6.
[34] Uitenbroek, DG. ‘‘SISA – Simple Interactive Statistical Analysis”, 1997.Available: http://www.quantitativeskills.com/sisa/ [accessed 06.10.09].Specific test available at: http://www.quantitativeskills.com/sisa/statistics/t-test.htm.
[35] Wang X, Zeng D, Seale H, Li S, Cheng H, Luan R, He X, Pang X, Dou X, Wang Q.Comparing early outbreak detection algorithms based on their optimizedparameter values. J Biomed Inform 2010;43:97–103.
[36] Wilkinson L. APA task force on statistical inference. Statistical methods inpsychology journals: guidelines and explanations. Am Psychol 1999;54:594–604.
[37] Zheng Z, Gibson SJ, Khalil Z, Helme RD, McMeeken JM. Age-relateddifferences in the time course of capsaicin-induced hyperalgesia. Pain2000;85:51–8.
[38] Zheng Z, Gibson SJ, Helme RD, McMeeken JM. The effect of local anaesthetic onage-related capsaicin-induced mechanical hyperalgesia – a randomised,controlled study. Pain 2009;144:101–9.
[39] Zumsteg D, Wieser HG. Effects of aging and sex on middle-latencysomatosensory evoked potentials: normative data. Clin Neurophysiol2002;113:681–5.
Related Documents