CSC Excellence In Risk Management April 2005 Quantitative Risk Analysis for Mining Life Cycle Management. CIM Conference – Risk Workshop Toronto April 24, 2005 C. Coulthard, B.A. D. S. Evans Ph.D., P. Geol. I. Henderson M.Sc., P. Eng. CSC Project Management Services 20 Fourth Street NE, Calgary. T2E 3R5 (403) 233-7994 [email protected]

Welcome message from author
This document is posted to help you gain knowledge. Please leave a comment to let me know what you think about it! Share it to your friends and learn new things together.
Transcript
CSCExcellence In Risk Management April 2005
Quantitative Risk Analysis for Mining Life
Cycle Management.
CIM Conference – Risk WorkshopToronto
April 24, 2005
C. Coulthard, B.A.
D. S. Evans Ph.D., P. Geol.
I. Henderson M.Sc., P. Eng.
CSC Project Management Services
20 Fourth Street NE, Calgary. T2E 3R5
(403) 233-7994 [email protected]

CSCExcellence In Risk Management April 2005
Presentation Agenda
(2) Introduction to Risk Management
• Risk Management
• Risk Identification and Quantification
(1) Mining Issues and Problems
• Mining Activities – Life Cycle
• Key Uncertainties
(3) Risk Analysis and the Risk Management Process
• Quantitative Risk Management Tools
(4) Specific Application Examples
• Portfolio Management
• Mine Development
(5) Summary

CSCExcellence In Risk Management April 2005
Life Cycle Activity: Business Focus
Strategic Planning Stakeholder Value / GovernanceSelection of Business / Areas
Portfolio Management Balance of PortfolioRationalization of Assets
Prospect Definition Rationalization of Assets
Start Up / Ramp Up Production On Stream
Development Project Execution
Expansion Project Optimization and Planning
Production Volumes, Rates, OPEX, Product Slate and Quality
Abandonment Long Term Liabilities, Closure
Mining Issues and Problems - Mining Life Cycle Activities
CSCExcellence In Risk Management April 2005
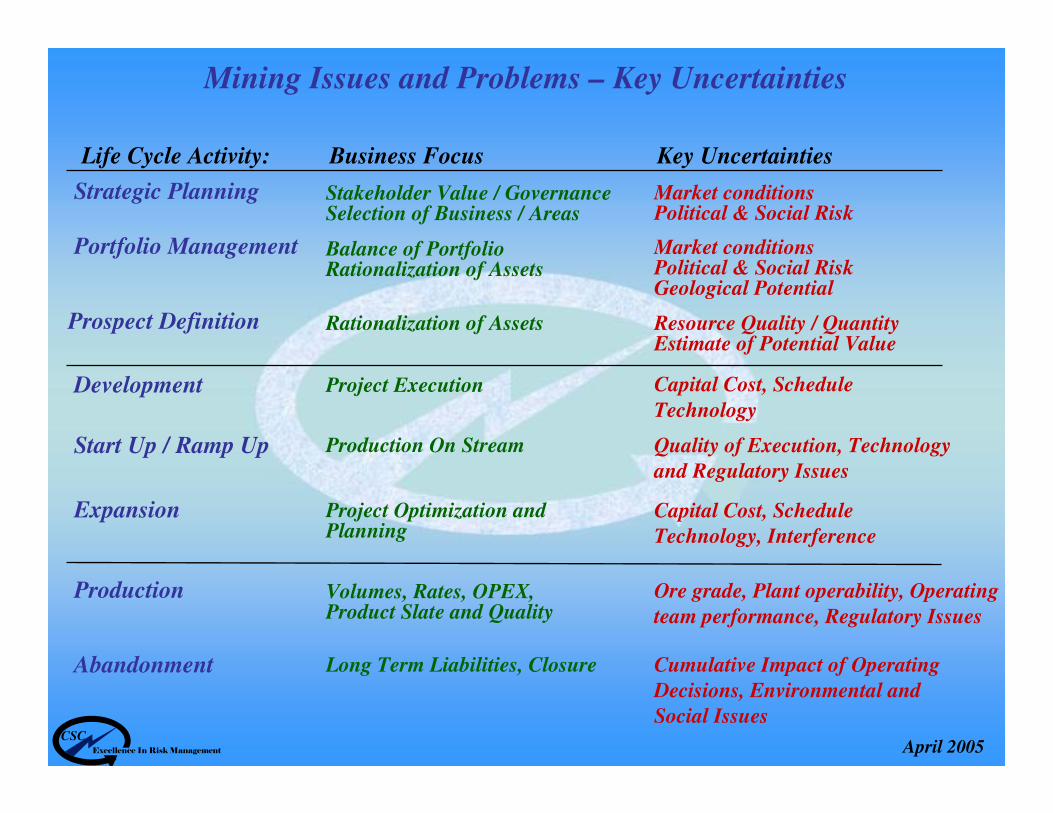
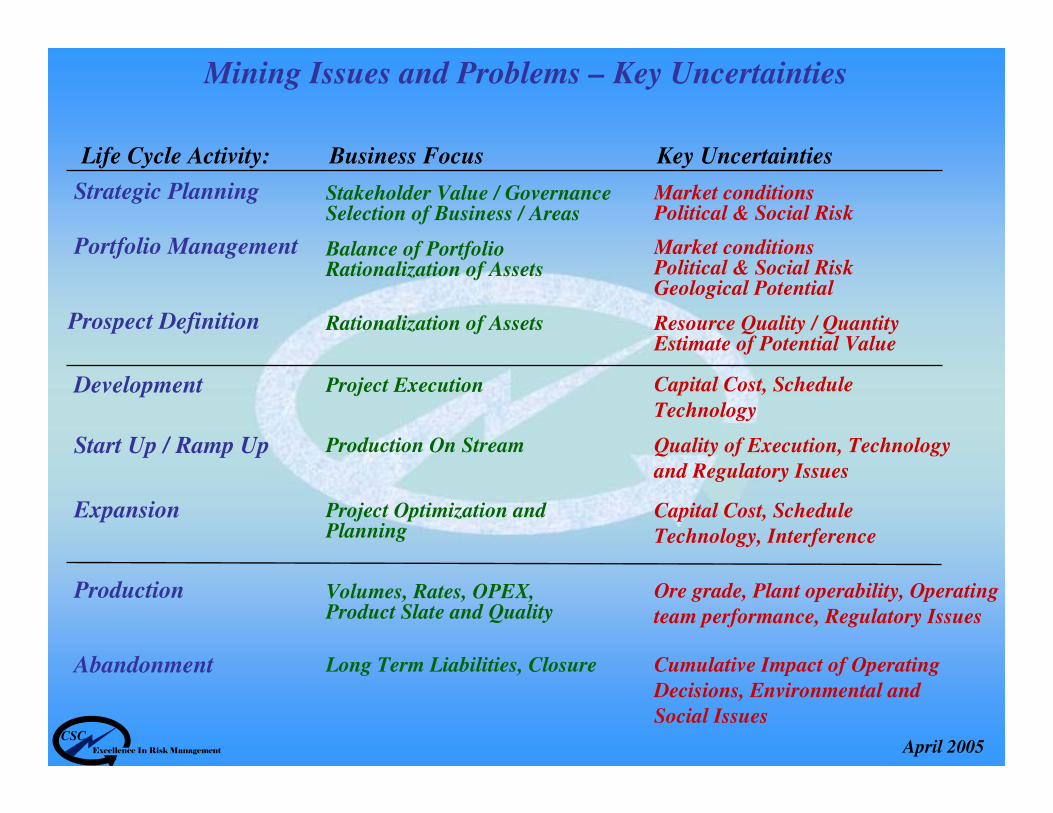
Mining Issues and Problems – Key Uncertainties
Life Cycle Activity: Business Focus Key Uncertainties
Strategic Planning Market conditionsPolitical & Social Risk
Stakeholder Value / GovernanceSelection of Business / Areas
Portfolio Management Balance of PortfolioRationalization of Assets
Market conditionsPolitical & Social RiskGeological Potential
Prospect Definition Rationalization of Assets Resource Quality / QuantityEstimate of Potential Value
Start Up / Ramp Up Production On Stream Quality of Execution, Technology
and Regulatory Issues
Development Project Execution Capital Cost, Schedule
Technology
Expansion Project Optimization and Planning
Capital Cost, Schedule
Technology, Interference
Production Volumes, Rates, OPEX, Product Slate and Quality
Ore grade, Plant operability, Operating
team performance, Regulatory Issues
Abandonment Long Term Liabilities, Closure Cumulative Impact of Operating
Decisions, Environmental and
Social Issues
CSCExcellence In Risk Management April 2005
Presentation Agenda
(2) Introduction to Risk Management
• Risk Management
• Risk Identification and Quantification
(1) Mining Issues and Problems
• Mining Activities – Life Cycle
• Key Uncertainties
(3) Risk Analysis and the Risk Management Process
• Quantitative Risk Management Tools
(4) Specific Application Examples
• Portfolio Management
• Mine Development
(5) Summary
CSCExcellence In Risk Management April 2005
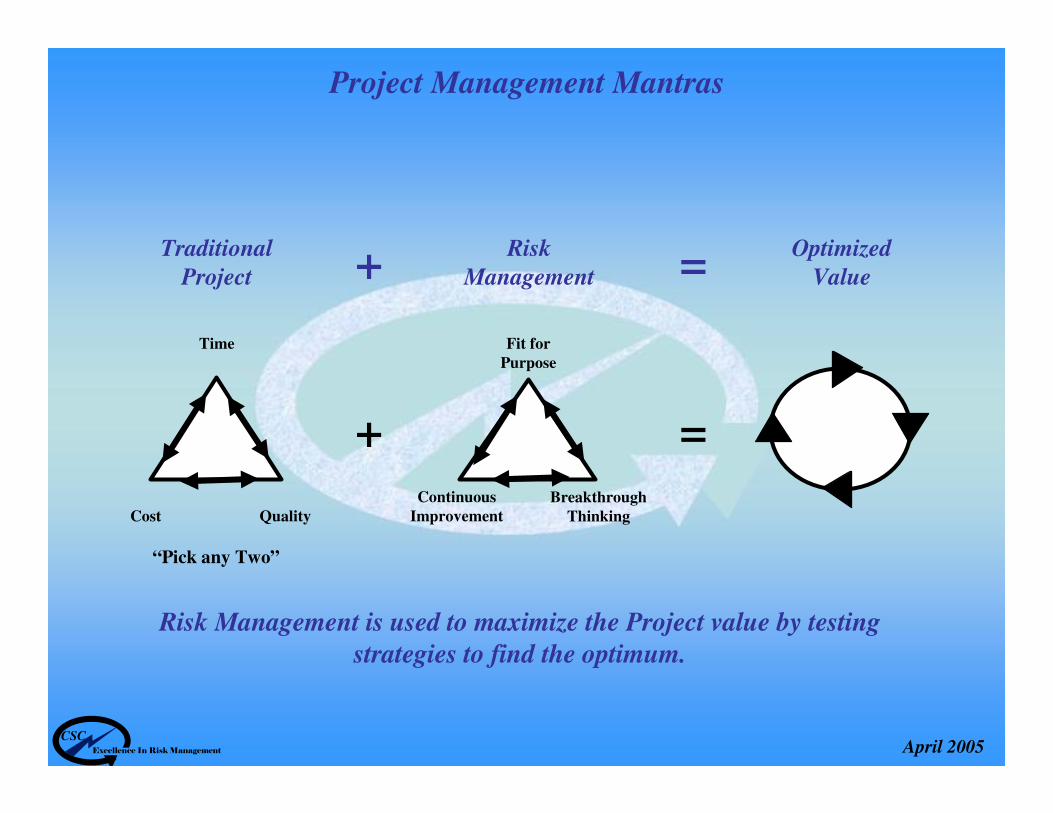
Traditional
Project
Risk
Management
Time
Cost Quality
+ =
Optimized
Value
Fit for
Purpose
Continuous
ImprovementBreakthrough
Thinking
“Pick any Two”
Project Management Mantras
=+
Risk Management is used to maximize the Project value by testing
strategies to find the optimum.

CSCExcellence In Risk Management April 2005
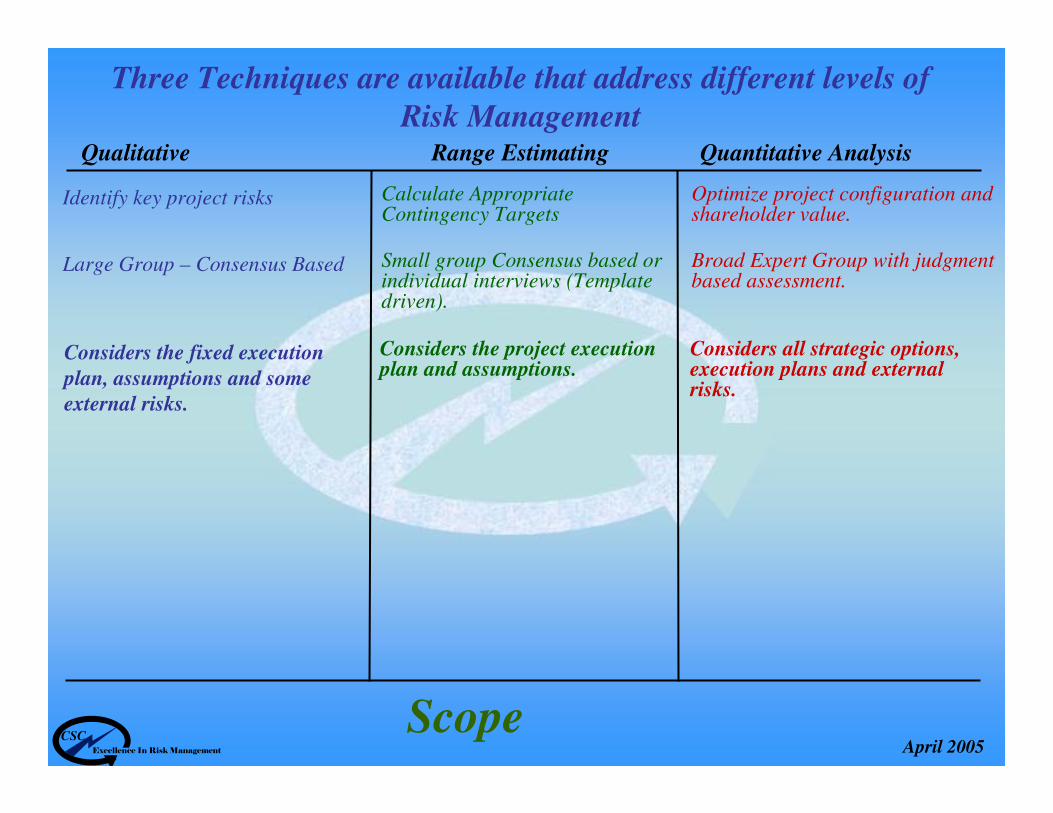
Three Techniques are available that address different levels of
Risk ManagementQualitative Range Estimating Quantitative Analysis
Identify key project risks Optimize project configuration and shareholder value.
Calculate Appropriate Contingency Targets
Objective

CSCExcellence In Risk Management April 2005
Three Techniques are available that address different levels of
Risk ManagementQualitative Range Estimating Quantitative Analysis
Identify key project risks Optimize project configuration and shareholder value.
Calculate Appropriate Contingency Targets
Large Group – Consensus Based Broad Expert Group with judgment based assessment.
Small group Consensus based or individual interviews (Template driven).
Assessment
CSCExcellence In Risk Management April 2005
Three Techniques are available that address different levels of
Risk ManagementQualitative Range Estimating Quantitative Analysis
Identify key project risks Optimize project configuration and shareholder value.
Calculate Appropriate Contingency Targets
Large Group – Consensus Based Broad Expert Group with judgment based assessment.
Small group Consensus based or individual interviews (Template driven).
Considers all strategic options, execution plans and external risks.
Considers the project execution plan and assumptions.
Considers the fixed execution
plan, assumptions and some
external risks.
Scope

CSCExcellence In Risk Management April 2005
Three Techniques are available that address different levels of
Risk ManagementQualitative Range Estimating Quantitative Analysis
Identify key project risks Optimize project configuration and shareholder value.
Calculate Appropriate Contingency Targets
Large Group – Consensus Based Broad Expert Group with judgment based assessment.
Small group Consensus based or individual interviews (Template driven).
Considers all strategic options, execution plans and external risks.
Considers the project execution plan and assumptions.
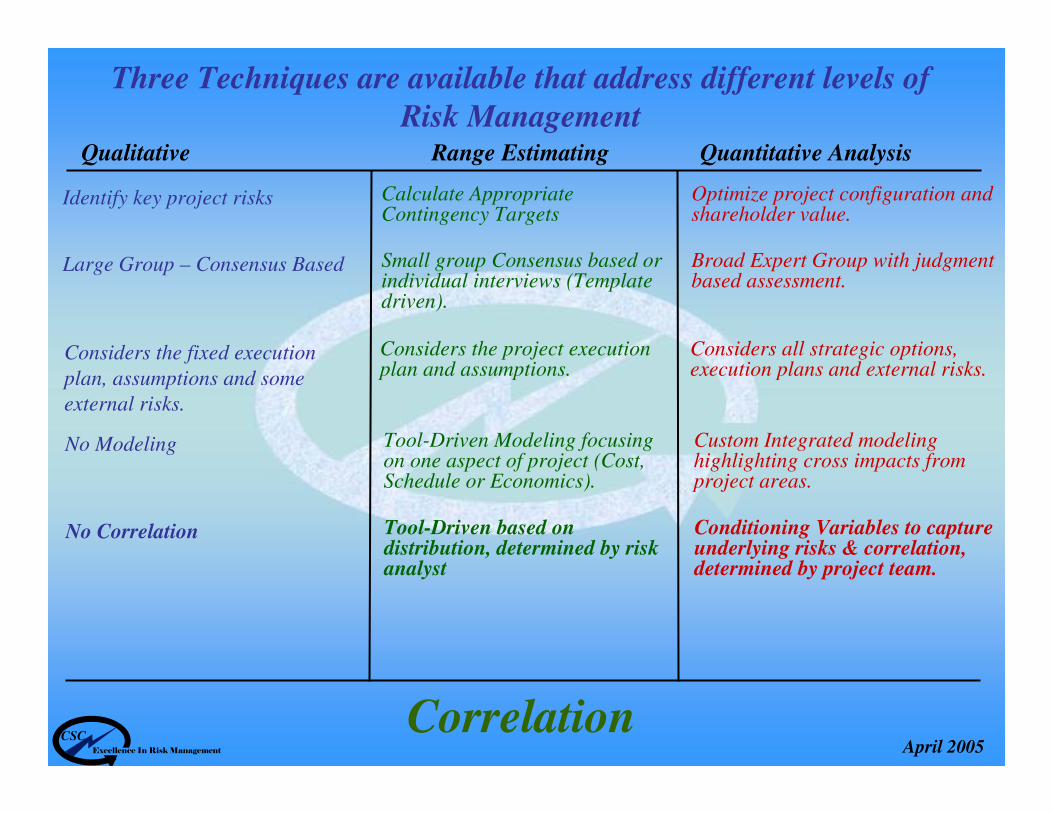
No Modeling Custom Integrated modeling highlighting cross impacts from project areas.
Tool-Driven Modeling focusing on one aspect of project (Cost, Schedule or Economics).
Considers the fixed execution
plan, assumptions and some
external risks.
Modeling
CSCExcellence In Risk Management April 2005
Three Techniques are available that address different levels of
Risk ManagementQualitative Range Estimating Quantitative Analysis
Identify key project risks Optimize project configuration and shareholder value.
Calculate Appropriate Contingency Targets
Large Group – Consensus Based Broad Expert Group with judgment based assessment.
Small group Consensus based or individual interviews (Template driven).
Considers all strategic options, execution plans and external risks.
Considers the project execution plan and assumptions.
No Modeling Custom Integrated modeling highlighting cross impacts from project areas.
Tool-Driven Modeling focusing on one aspect of project (Cost, Schedule or Economics).
Considers the fixed execution
plan, assumptions and some
external risks.
No Correlation Conditioning Variables to capture underlying risks & correlation, determined by project team.
Tool-Driven based on distribution, determined by risk analyst
Correlation
CSCExcellence In Risk Management April 2005
Three Techniques are available that address different levels of
Risk ManagementQualitative Range Estimating Quantitative Analysis
Identify key project risks Optimize project configuration and shareholder value.
Calculate Appropriate Contingency Targets
Large Group – Consensus Based Broad Expert Group with judgment based assessment.
Small group Consensus based or individual interviews (Template driven).
Considers all strategic options, execution plans and external risks.
Considers the project execution plan and assumptions.
No Modeling Custom Integrated modeling highlighting cross impacts from project areas.
Tool-Driven Modeling focusing on one aspect of project (Cost, Schedule or Economics).
Considers the fixed execution
plan, assumptions and some
external risks.
No Correlation Conditioning Variables to capture underlying risks & correlation, determined by project team.
Tool-Driven based on distribution, determined by risk analyst
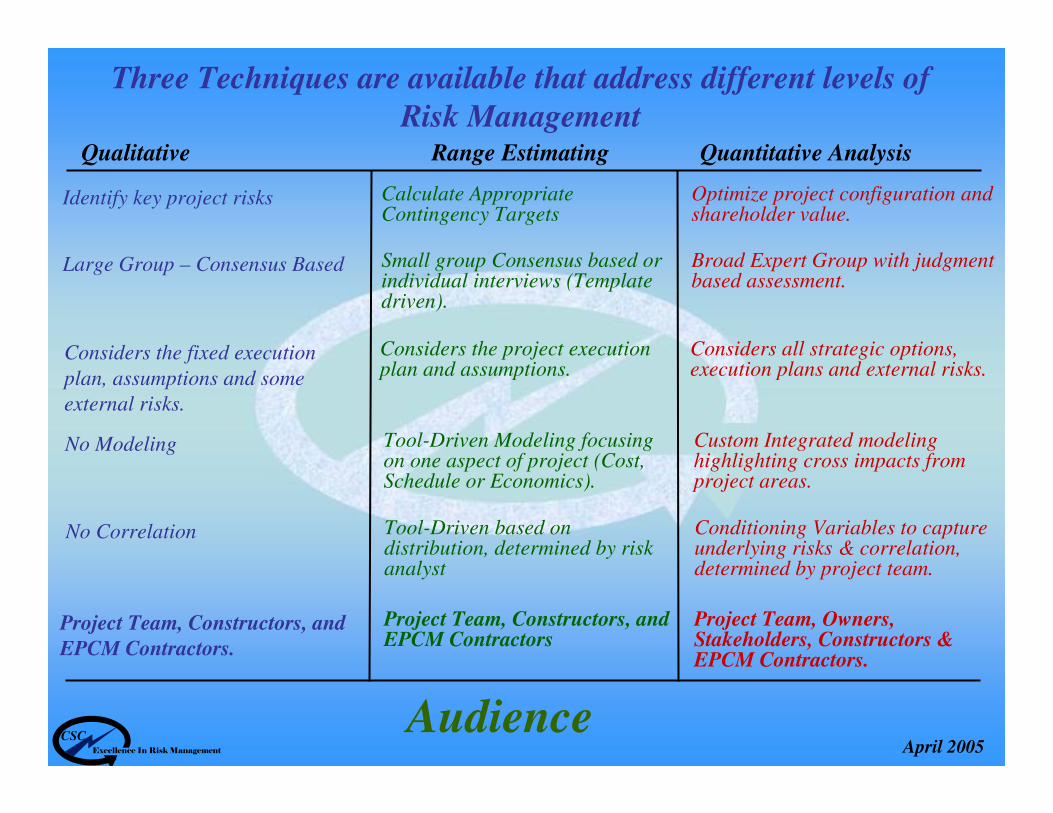
Project Team, Constructors, and
EPCM Contractors.
Project Team, Owners, Stakeholders, Constructors & EPCM Contractors.
Project Team, Constructors, and EPCM Contractors
Audience
CSCExcellence In Risk Management April 2005
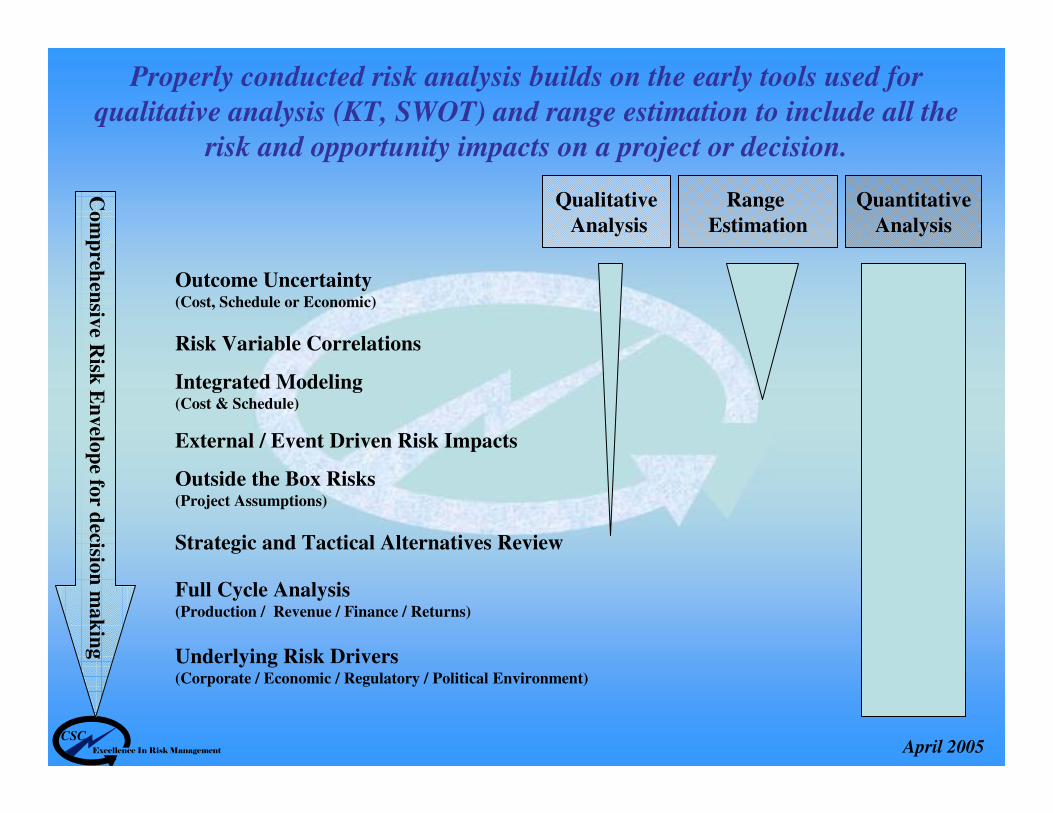
Outcome Uncertainty (Cost, Schedule or Economic)
Risk Variable Correlations
Integrated Modeling (Cost & Schedule)
Full Cycle Analysis (Production / Revenue / Finance / Returns)
Underlying Risk Drivers(Corporate / Economic / Regulatory / Political Environment)
Strategic and Tactical Alternatives Review
External / Event Driven Risk Impacts
Outside the Box Risks (Project Assumptions)
Properly conducted risk analysis builds on the early tools used for
qualitative analysis (KT, SWOT) and range estimation to include all the
risk and opportunity impacts on a project or decision.
Qualitative
Analysis
Range
Estimation
Quantitative
Analysis
Co
mp
rehen
sive R
isk E
nv
elop
e for d
ecision
ma
kin
g
CSCExcellence In Risk Management April 2005
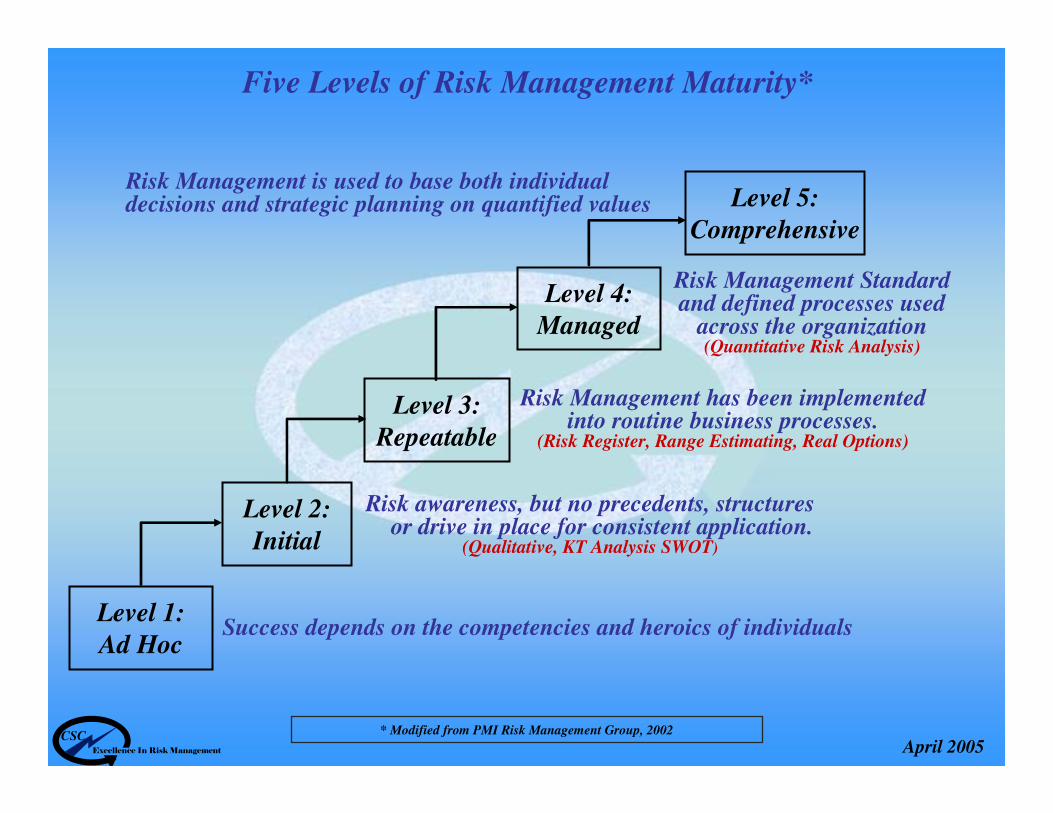
Five Levels of Risk Management Maturity*
Level 1:
Ad Hoc
Level 2:
Initial
Level 3:
Repeatable
Level 4:
Managed
Level 5:
Comprehensive
* Modified from PMI Risk Management Group, 2002
Success depends on the competencies and heroics of individuals
Risk awareness, but no precedents, structures or drive in place for consistent application.
(Qualitative, KT Analysis SWOT)
Risk Management has been implemented into routine business processes.
(Risk Register, Range Estimating, Real Options)
Risk Management Standard and defined processes used
across the organization(Quantitative Risk Analysis)
Risk Management is used to base both individual decisions and strategic planning on quantified values
CSCExcellence In Risk Management April 2005
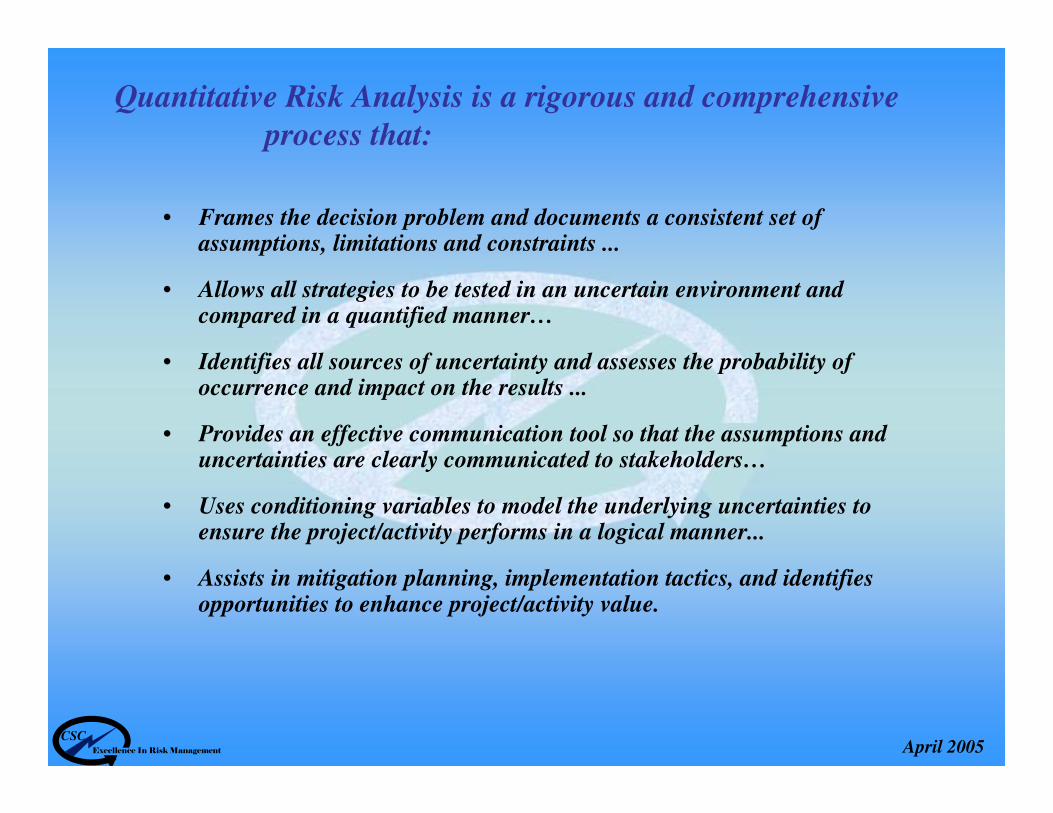
• Frames the decision problem and documents a consistent set of assumptions, limitations and constraints ...
• Allows all strategies to be tested in an uncertain environment and compared in a quantified manner…
• Identifies all sources of uncertainty and assesses the probability of occurrence and impact on the results ...
• Provides an effective communication tool so that the assumptions and uncertainties are clearly communicated to stakeholders…
• Uses conditioning variables to model the underlying uncertainties to ensure the project/activity performs in a logical manner...
• Assists in mitigation planning, implementation tactics, and identifies opportunities to enhance project/activity value.
Quantitative Risk Analysis is a rigorous and comprehensive
process that:
CSCExcellence In Risk Management April 2005
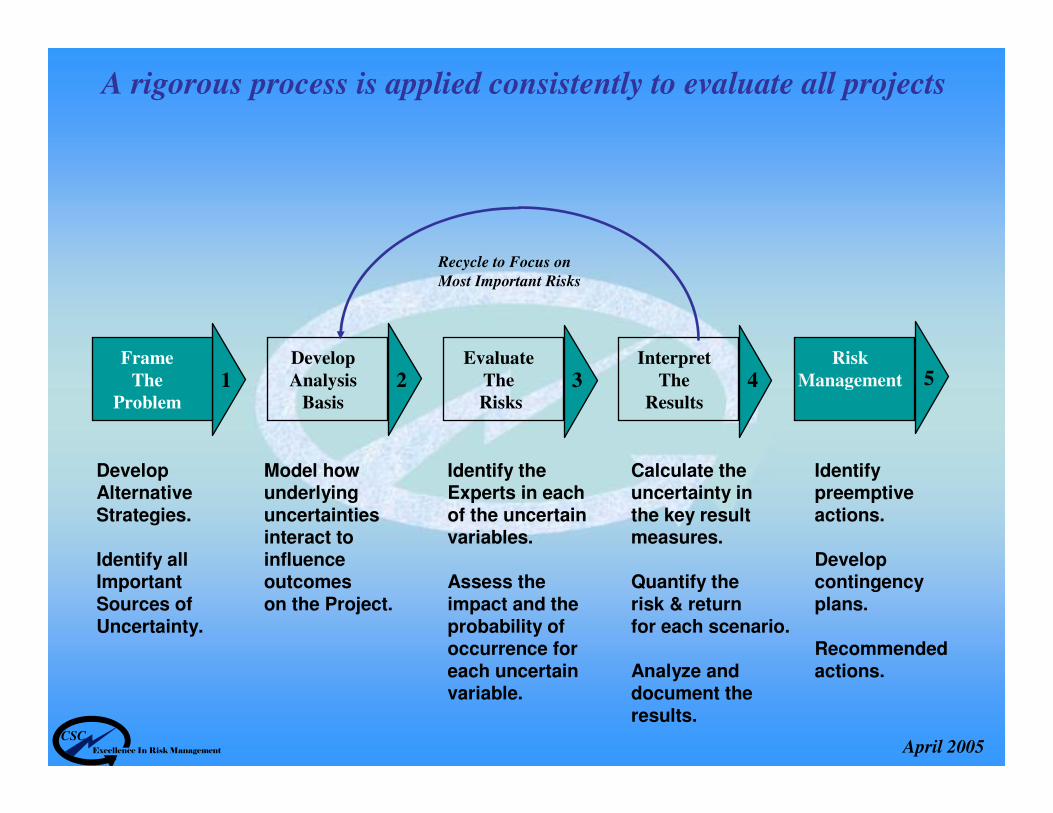
A rigorous process is applied consistently to evaluate all projects
1Frame
TheProblem
2Develop
AnalysisBasis
3Evaluate
TheRisks
4Interpret
TheResults
Risk
Management
Recycle to Focus on
Most Important Risks
DevelopAlternativeStrategies.
Identify allImportant Sources ofUncertainty.
Model how underlyinguncertaintiesinteract to influence outcomeson the Project.
Identify the Experts in eachof the uncertainvariables.
Assess the impact and theprobability ofoccurrence foreach uncertainvariable.
Calculate the uncertainty inthe key resultmeasures.
Quantify therisk & return for each scenario.
Analyze anddocument theresults.
Identifypreemptiveactions.
Developcontingencyplans.
Recommendedactions.
5
CSCExcellence In Risk Management April 2005
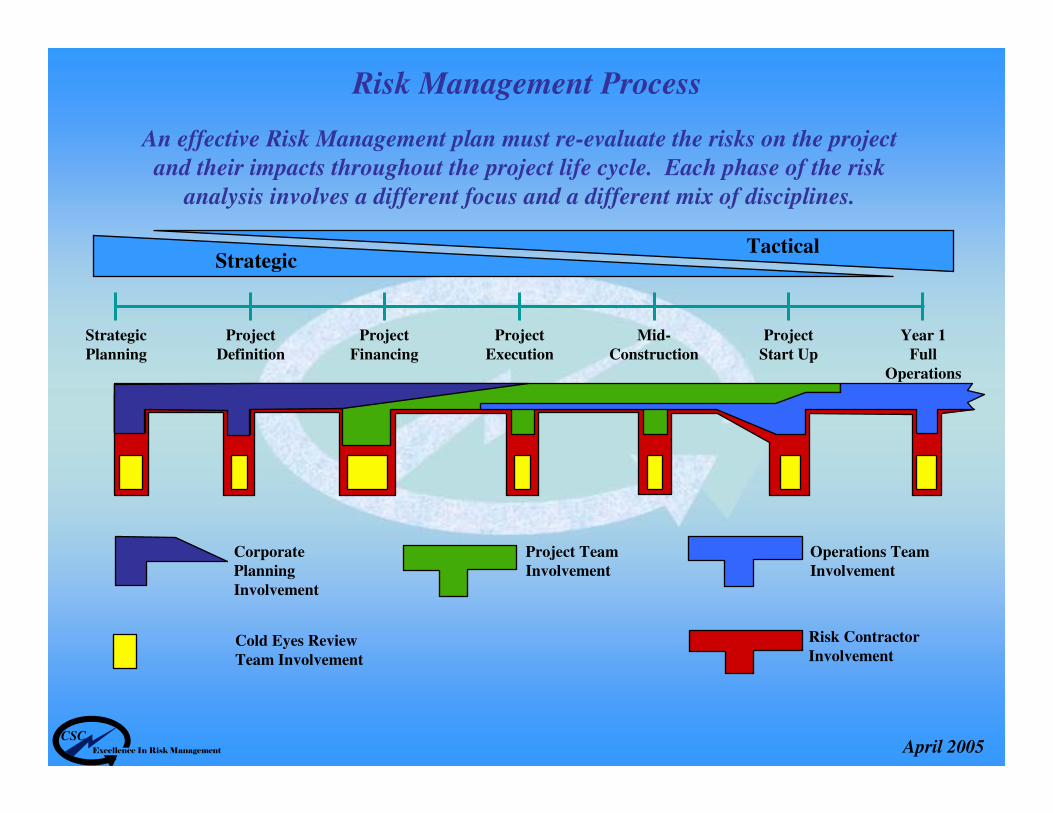
Cold Eyes Review
Team Involvement
Project Team Involvement
Operations Team Involvement
Risk Contractor
Involvement
Risk Management Process
An effective Risk Management plan must re-evaluate the risks on the project
and their impacts throughout the project life cycle. Each phase of the risk
analysis involves a different focus and a different mix of disciplines.
Strategic
Planning
Project
Definition
Project
Financing
Mid-
Construction
Project
Start Up
Year 1
Full
Operations
Project
Execution
Corporate Planning
Involvement
StrategicTactical

CSCExcellence In Risk Management April 2005
Presentation Agenda
(2) Introduction to Risk Management
• Risk Management
• Risk Identification and Quantification
(1) Mining Issues and Problems
• Mining Activities – Life Cycle
• Key Uncertainties
(3) Risk Analysis and the Risk Management Process
• Quantitative Risk Management Tools
(4) Specific Application Examples
• Portfolio Management
• Mine Development
(5) Summary

CSCExcellence In Risk Management April 2005
ProbabilityDistributions
Tornado DiagramsStep Diagrams
Interview Issues Model and Test Options
Scheduled, Formal ReviewsUpdated Model Results
(Probabilities, Tornados, Steps)
Management Risk Reporting
Base Design
& Operating Plans
Contingency Plans
Risk
Monitoring System
Project Targets Immediate Risk
Control Measures
Risk Analysis
Risk Analysis is the centerpiece of a Risk Management Process
There are four key outputs from a comprehensive Risk Analysis

CSCExcellence In Risk Management April 2005
The probability distribution illustrates the full
range of project uncertainty and is used to set the
project targets at appropriate confidence levels.
*Expected
Value
10/90 Range
CAPEX, Schedule, OPEX, etc.
90%
50%
10%
Note:1. Each point on the curve is a result from
a single Monte Carlo trial. The expected
value represents the average value of all
the trials.
2. The slope of the 10/90 range represents
the uncertainty, the flatter the curve, the
more uncertainty.
3. The curve below the expected value
indicates upside opportunity, the
portion above shows the downside risk.
Pro
ba
bil
ity
Project Targets
P80 (?) Confidence Level
Upside
Opportunity
Downside
Risk
CSCExcellence In Risk Management April 2005
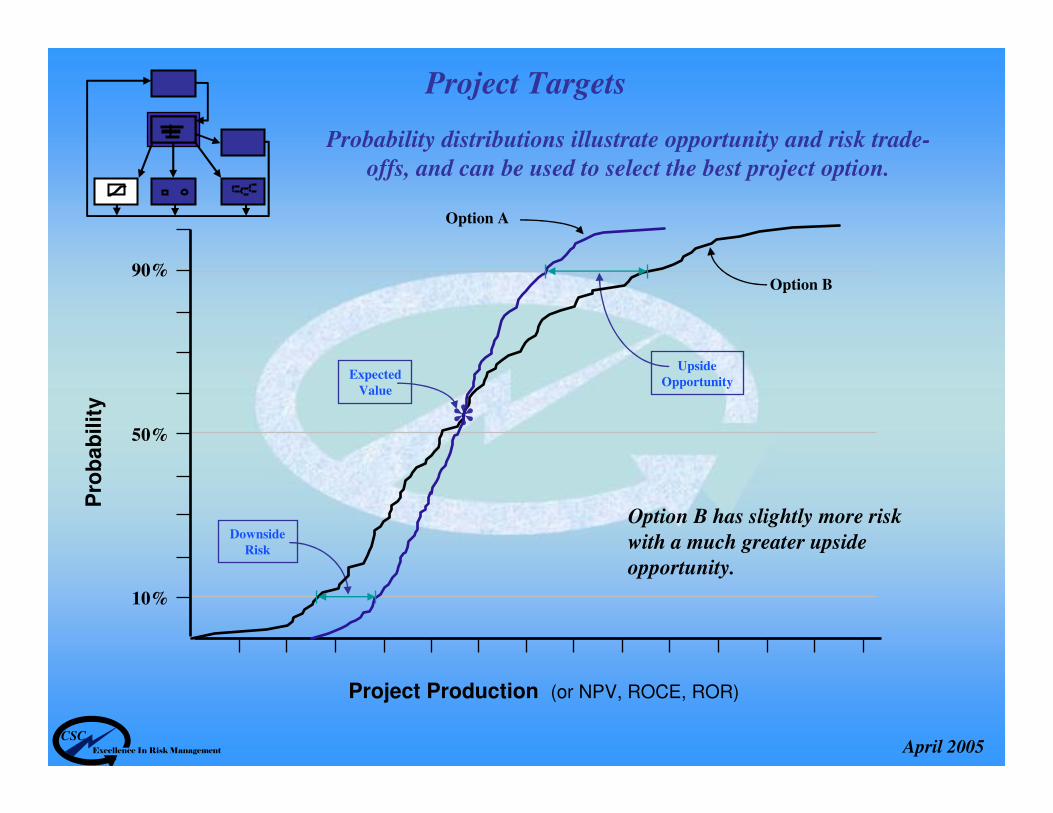
*
Project Production (or NPV, ROCE, ROR)
90%
50%
10%
Pro
ba
bil
ity
Upside
Opportunity
Downside
Risk
Probability distributions illustrate opportunity and risk trade-
offs, and can be used to select the best project option.
Option B
Expected
Value
Option A
Project Targets
Option B has slightly more risk
with a much greater upside
opportunity.
CSCExcellence In Risk Management April 2005
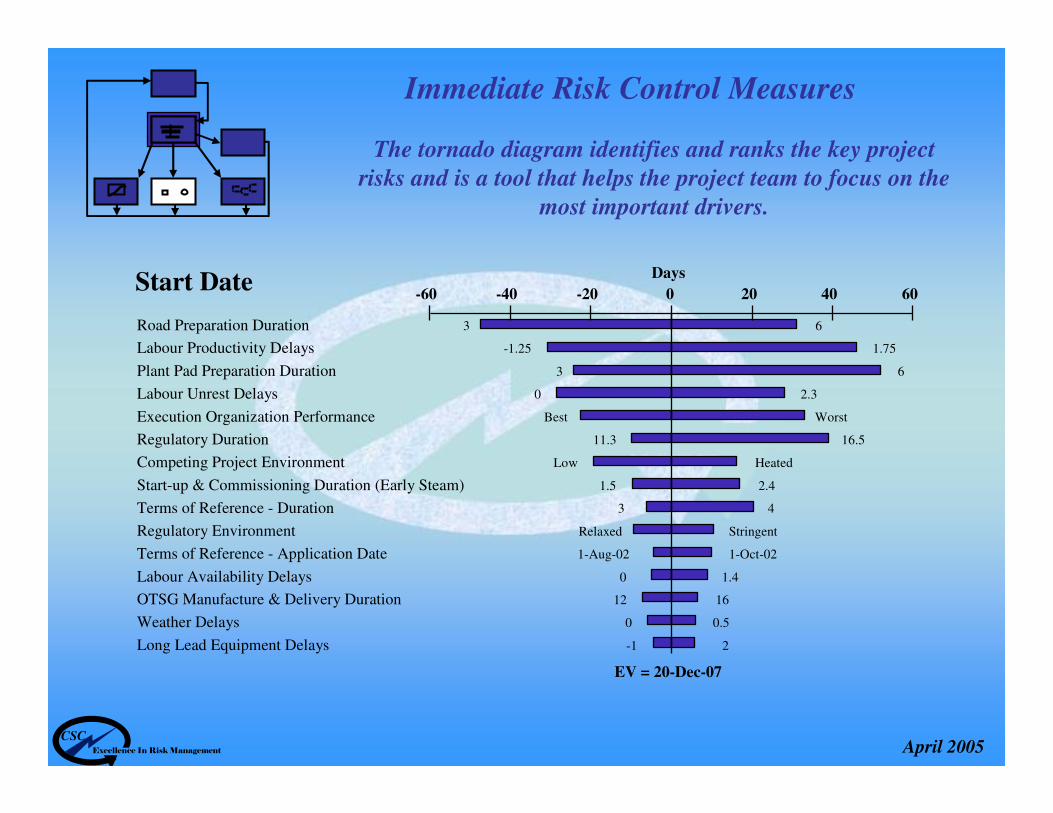
-60 -40 -20 0 20 40 60Start Date
EV = 20-Dec-07
Days
The tornado diagram identifies and ranks the key project
risks and is a tool that helps the project team to focus on the
most important drivers.
Road Preparation Duration 3 6
Labour Productivity Delays -1.25 1.75
Plant Pad Preparation Duration 3 6
Labour Unrest Delays 0 2.3
Execution Organization Performance Best Worst
Regulatory Duration 11.3 16.5
Competing Project Environment Low Heated
Start-up & Commissioning Duration (Early Steam) 1.5 2.4
Terms of Reference - Duration 3 4
Regulatory Environment Relaxed Stringent
Terms of Reference - Application Date 1-Aug-02 1-Oct-02
Labour Availability Delays 0 1.4
OTSG Manufacture & Delivery Duration 12 16
Weather Delays 0 0.5
Long Lead Equipment Delays -1 2
Immediate Risk Control Measures

CS
CExcellence In Risk Management
Ap
ril 2005
15-A
ug
-07
1-S
ep-0
7
15-S
ep-0
7
1-O
ct-07
15-O
ct-07
1-N
ov-0
7
15-N
ov
-07
01-D
ec-07
15-D
ec-07
01-J
an
-08
AFE Approval
+6
Engineering to 60%
+1
3
Preliminary Vendor Data
+7
Module Steel Fabrication
0
Module Pipe
Fabrication Duration
0
Rack/ Process
Module Assembly
-3
Last Process Area Module
On-site to Construction
Complete
0
Evaporator Units
0Vapour Compressors 0
Site Prep Duration
+1
Piling
-8
Commissioning Duration
+1
4
Start-up Duration
-3
Construction Duration
+3
1
Materials Delivery
+5
Weather Delay
+5
Labour Issues
+1
2
Long Leads
Complete to MC
+1
4
Design definition Changes
+5
Labour Productivity
+1
0
Reworks
+3
Sta
rt Date
Base=
03-S
ep-0
7
EV
= 2
0-D
ec-07
Th
e Step
Dia
gra
m d
emon
strates w
here th
e gro
wth
from
the
base estim
ate to
the E
xpected
Valu
e occu
rs, an
d id
entifies k
ey
facto
rs impactin
g th
e cost.
Imm
edia
te Risk
Con
trol M
easu
res

CSCExcellence In Risk Management April 2005
A complete risk register considers all sources of information
available for the project uncertainties.
Immediate Risk Control Measures
Project
Documentation
Qualitative
Analysis
Quantitative
Analysis
Risk Register
CSCExcellence In Risk Management April 2005
0%
10%
20%
30%
40%
50%
60%
70%
80%
90%
100%
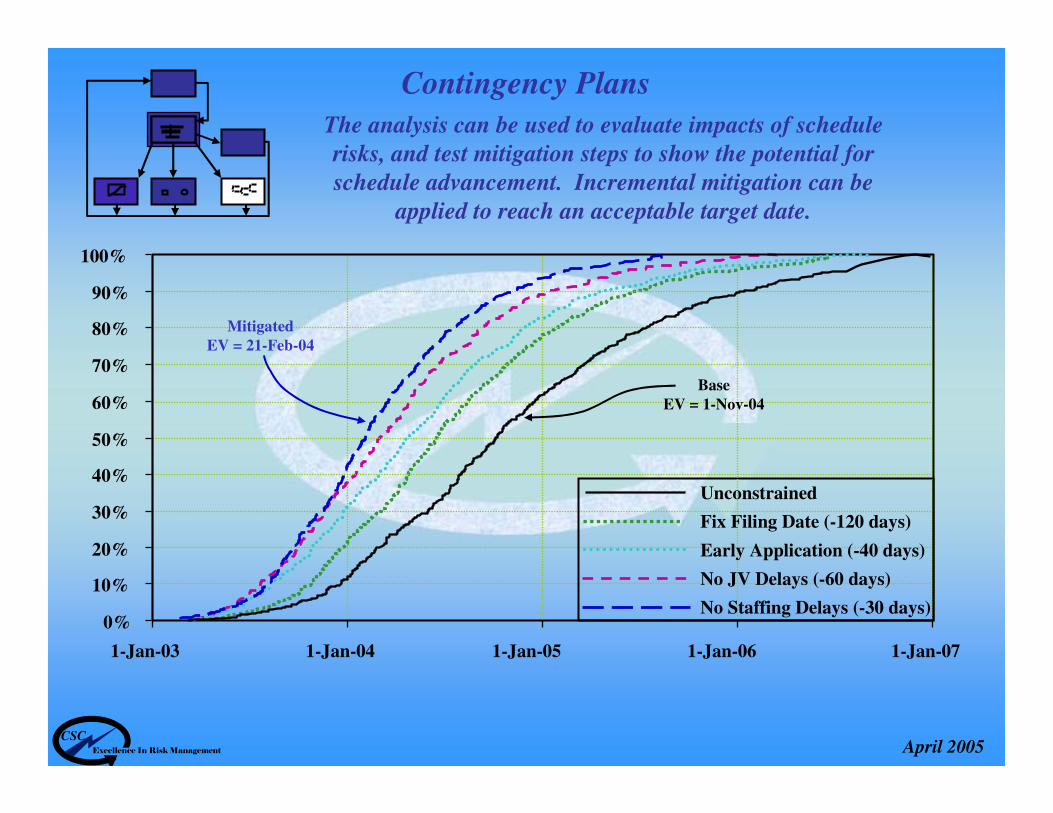
1-Jan-03 1-Jan-04 1-Jan-05 1-Jan-06 1-Jan-07
Unconstrained
Fix Filing Date (-120 days)
Early Application (-40 days)
No JV Delays (-60 days)
No Staffing Delays (-30 days)
The analysis can be used to evaluate impacts of schedule
risks, and test mitigation steps to show the potential for
schedule advancement. Incremental mitigation can be
applied to reach an acceptable target date.
Base
EV = 1-Nov-04
Mitigated
EV = 21-Feb-04
Contingency Plans
CSCExcellence In Risk Management April 2005
Pro
ba
bil
ity
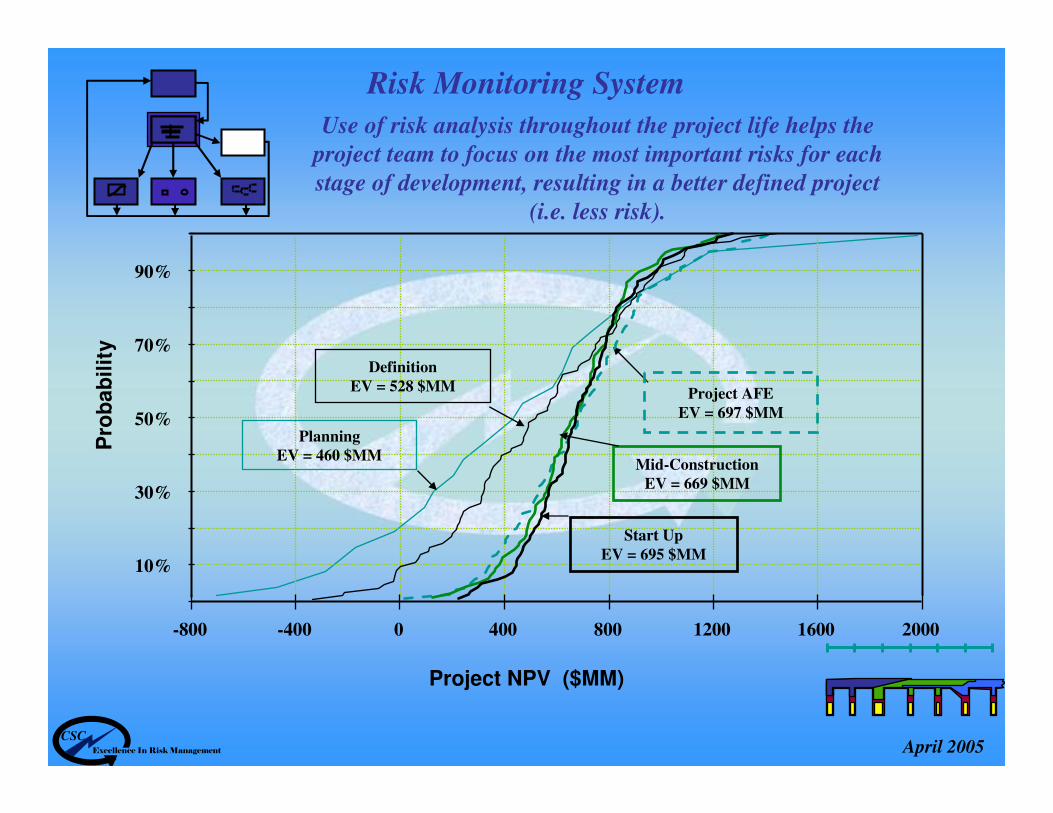
Project NPV ($MM)
10%
30%
50%
70%
90%
2000-800 -400 0 400 800 1200 1600
Definition
EV = 528 $MM Project AFE
EV = 697 $MM
Mid-ConstructionEV = 669 $MM
Start Up
EV = 695 $MM
PlanningEV = 460 $MM
Use of risk analysis throughout the project life helps the
project team to focus on the most important risks for each
stage of development, resulting in a better defined project
(i.e. less risk).
Risk Monitoring System

CSCExcellence In Risk Management April 2005
Presentation Agenda
(2) Introduction to Risk Management
• Risk Management
• Risk Identification and Quantification
(1) Mining Issues and Problems
• Mining Activities – Life Cycle
• Key Uncertainties
(3) Risk Analysis and the Risk Management Process
• Quantitative Risk Management Tools
(4) Specific Application Examples
• Portfolio Management
• Mine Development
(5) Summary
CSCExcellence In Risk Management April 2005
Mining Issues and Problems – Key Uncertainties
Life Cycle Activity: Business Focus Key Uncertainties
Strategic Planning Market conditionsPolitical & Social Risk
Stakeholder Value / GovernanceSelection of Business / Areas
Portfolio Management Balance of PortfolioRationalization of Assets
Market conditionsPolitical & Social RiskGeological Potential
Prospect Definition Rationalization of Assets Resource Quality / QuantityEstimate of Potential Value
Start Up / Ramp Up Production On Stream Quality of Execution, Technology
and Regulatory Issues
Development Project Execution Capital Cost, Schedule
Technology
Expansion Project Optimization and Planning
Capital Cost, Schedule
Technology, Interference
Production Volumes, Rates, OPEX, Product Slate and Quality
Ore grade, Plant operability, Operating
team performance, Regulatory Issues
Abandonment Long Term Liabilities, Closure Cumulative Impact of Operating
Decisions, Environmental and
Social Issues

CSCExcellence In Risk Management April 2005
Mining Issues and Problems
Activity: Business Focus Key Uncertainties
Strategic Planning Market conditionsPolitical & Social Risk
Stakeholder Value / GovernanceSelection of Business / Areas
Portfolio Management Balance of PortfolioRationalization of Assets
Market conditionsPolitical & Social RiskGeological Potential
Prospect Definition Rationalization of Assets Resource Quality / QuantityEstimate of Potential Value
Early in the Project life cycle the analysis should be focused at a high level to level to
ensure that the right strategic decision is taken.
CSCExcellence In Risk Management April 2005
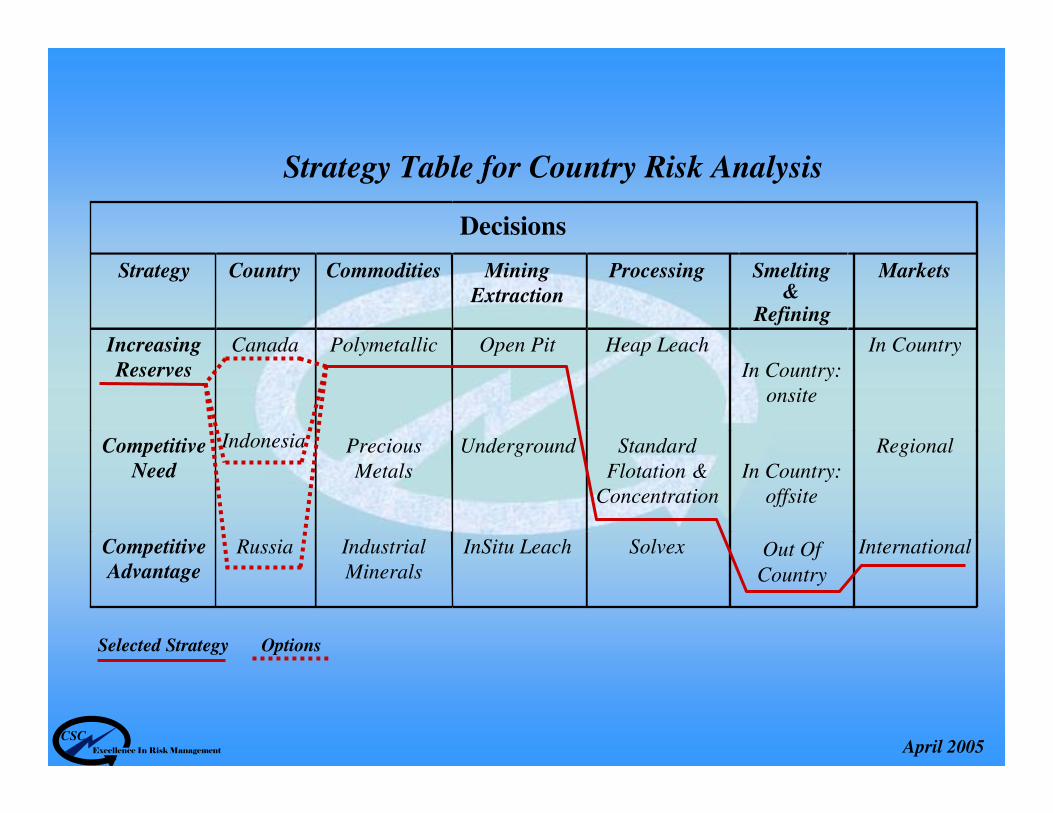
Strategy Table for Country Risk Analysis
Decisions
Strategy Country Commodities MiningExtraction
Processing Markets
Increasing
Reserves
Canada Polymetallic Open Pit Heap Leach In Country
CompetitiveNeed
Indonesia Precious
Metals
Underground Standard
Flotation &
Concentration
Regional
CompetitiveAdvantage
Russia Industrial
Minerals
InSitu Leach Solvex
Smelting&
Refining
In Country:
onsite
In Country:
offsite
Out Of
Country
International
Selected Strategy Options

CSCExcellence In Risk Management April 2005
Portfolio Management to select best mining project
Pre-
AcquisitionAcquisition
Project
Execution
CAPEX
OPEX
Revenue
ProjectNPV
Discount
Rate
Acquisition
Duration
Exploration/
AFE DurationMech.
Duration
Extraordinary
Costs
Acquisition/
Exploration
Costs
Local
BenefitsLabour
Productivity
Labour
Costs
Energy &
Utility Costs
Chemical
Costs
Fixed
Costs
Variable
Costs
BulksMaterial
& Equipment
Costs
Commodity
PriceFiscal
Terms
Taxes &
Royalties
Expropriate
First
Production
Smelting &
Refining Costs
Closure
Environmental
Performance
Infrastructure
Costs
Political
Climate
Socio-Cultural
Environment
Environmental
Performance
Closure
Cost

CSCExcellence In Risk Management April 2005
0%
10%
20%
30%
40%
50%
60%
70%
80%
90%
100%
-1500 -1000 -500 0 500 1000 1500
Pro
ba
bil
ity
$MM NPV @ 12%
NPV Country Case Comparison
CanadaEV = $147 MM
IndonesiaEV = $48 MM
Portfolio Management
RussiaEV = -$415 MM
CSCExcellence In Risk Management April 2005
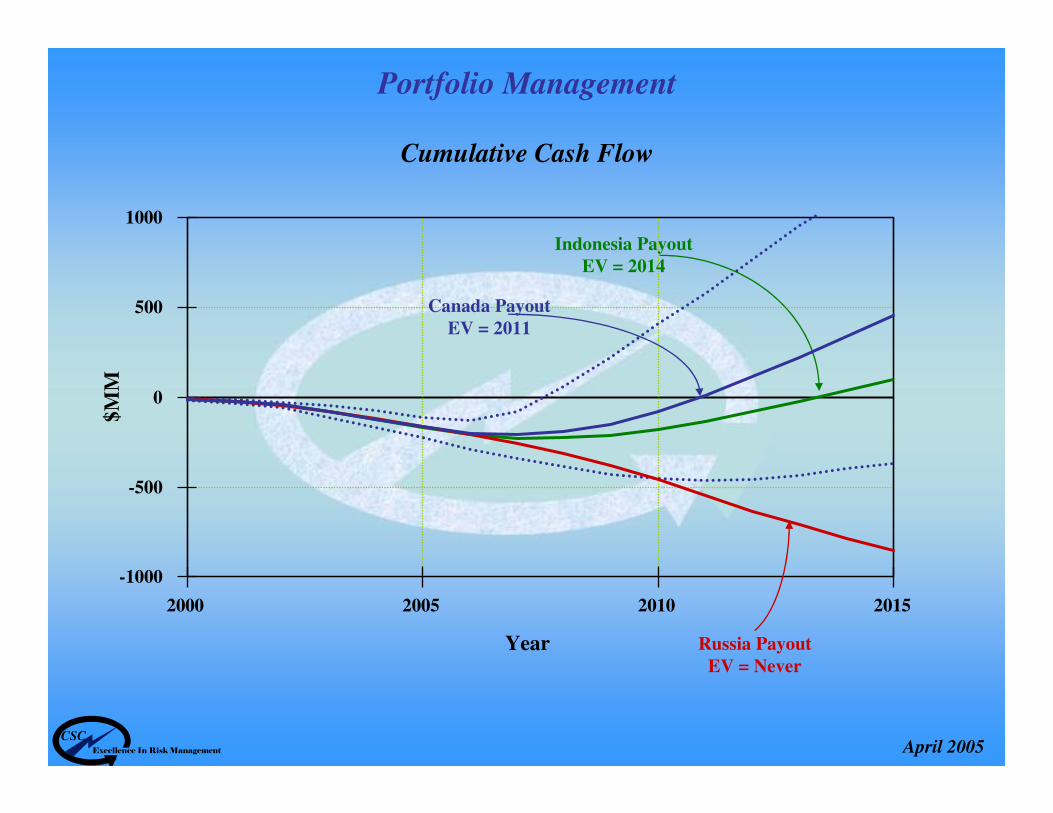
-1000
-500
0
500
1000
2000 2005 2010 2015
Canada Payout
EV = 2011
Indonesia PayoutEV = 2014
Russia Payout
EV = Never
$M
M
Cumulative Cash Flow
Year
Portfolio Management
CSCExcellence In Risk Management April 2005
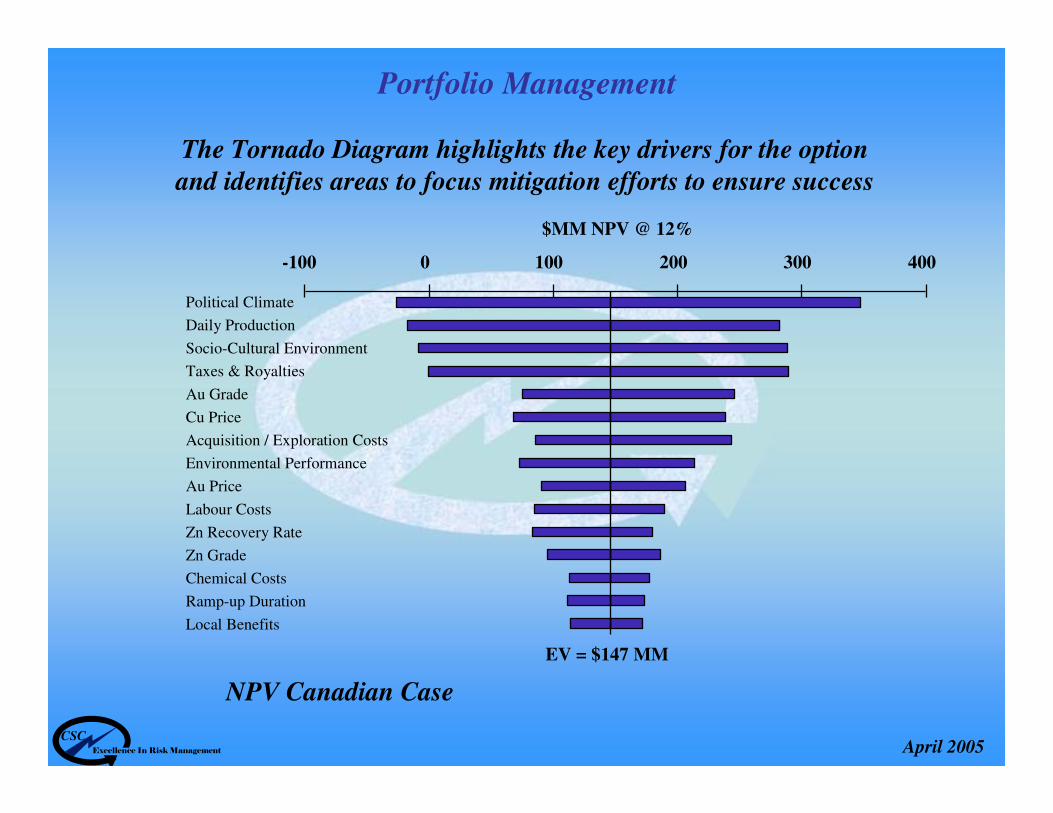
-100 0 100 200 300 400
EV = $147 MM
$MM NPV @ 12%
The Tornado Diagram highlights the key drivers for the option
and identifies areas to focus mitigation efforts to ensure success
NPV Canadian Case
Political Climate
Daily Production
Socio-Cultural Environment
Taxes & Royalties
Au Grade
Cu Price
Environmental Performance
Au Price
Labour Costs
Zn Recovery Rate
Zn Grade
Chemical Costs
Ramp-up Duration
Local Benefits
Acquisition / Exploration Costs
Portfolio Management

CSCExcellence In Risk Management April 2005
Mining Issues and Problems
Activity: Business Focus Key Uncertainties
Start Up / Ramp Up Production On Stream Quality of Execution, Technology
and Regulatory Issues
Development Project Execution Capital Cost, Schedule
Technology
Expansion Project Optimization and Planning
Capital Cost, Schedule
Technology, Interference
During the Project Development phase the analysis should have more focus on the
tactical level to ensure that the project is executed well.
CSCExcellence In Risk Management April 2005
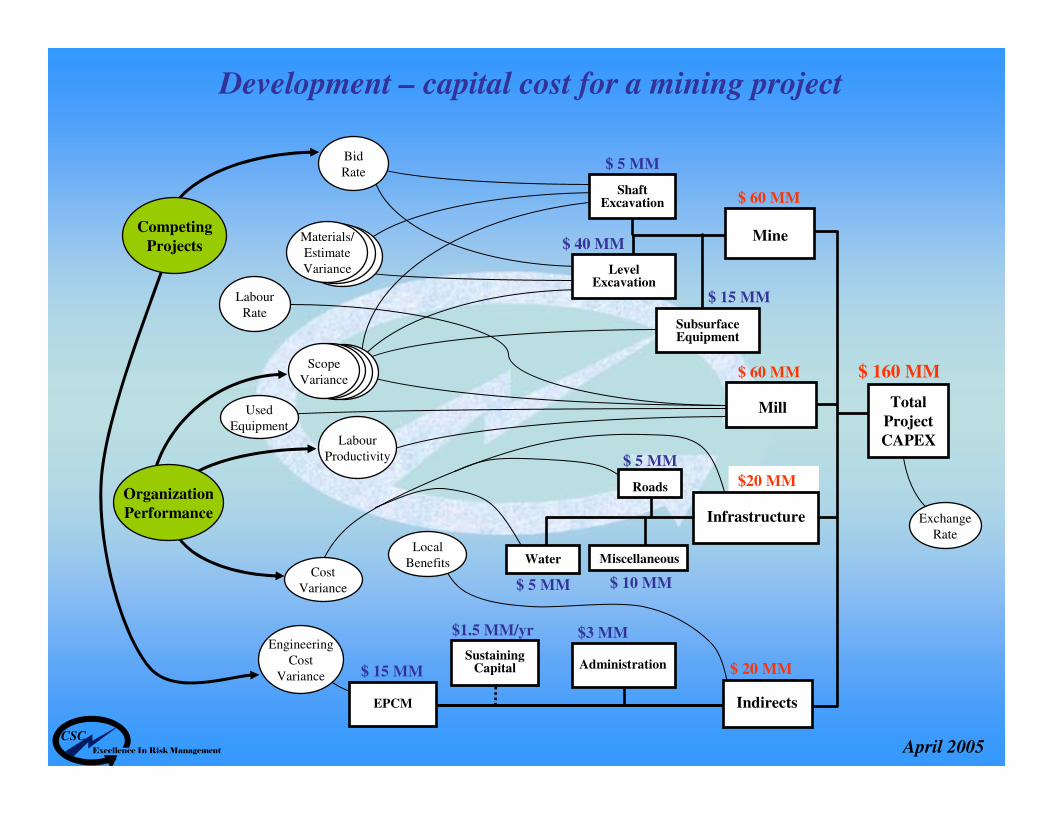
Materials/
Estimate
Variance
Total
Project
CAPEX
$ 160 MM
Indirects
$ 20 MM
Mill
$ 60 MM
Mine
$ 60 MM
$ 40 MM
LevelExcavation
$ 5 MM
ShaftExcavation
$ 5 MM
Water
$ 5 MM
Roads
$ 10 MM
Miscellaneous
Bid
Rate
Engineering
Cost
Variance
Organization
Performance
Competing
Projects
Labour
Productivity
$3 MM
Administration$ 15 MM
EPCM
Exchange
Rate
$1.5 MM/yr
SustainingCapital
Local
BenefitsCost
Variance
SubsurfaceEquipment
$ 15 MM
$20 MM
Infrastructure
Used
Equipment
Labour
Rate
Scope
Variance
Development – capital cost for a mining project

CSCExcellence In Risk Management April 2005
0%
10%
20%
30%
40%
50%
60%
70%
80%
90%
100%
50 100 150 200 250 300
Pro
ba
bil
ity
CAPEX ($MM)
The Cumulative Probability Distribution shows that $35 MM (16%)
contingency is required for a 70% confidence limit. The slope
(uncertainty) in the curve approximates a Class V Estimate.
Expected Value
CAPEX = $175 MM
Development - CAPEX
Base Estimate
$160 MM
P90 = $220 MM
P90 = $130 MM
Class V Estimate
+25%/-25%
$35 MM
CSCExcellence In Risk Management April 2005
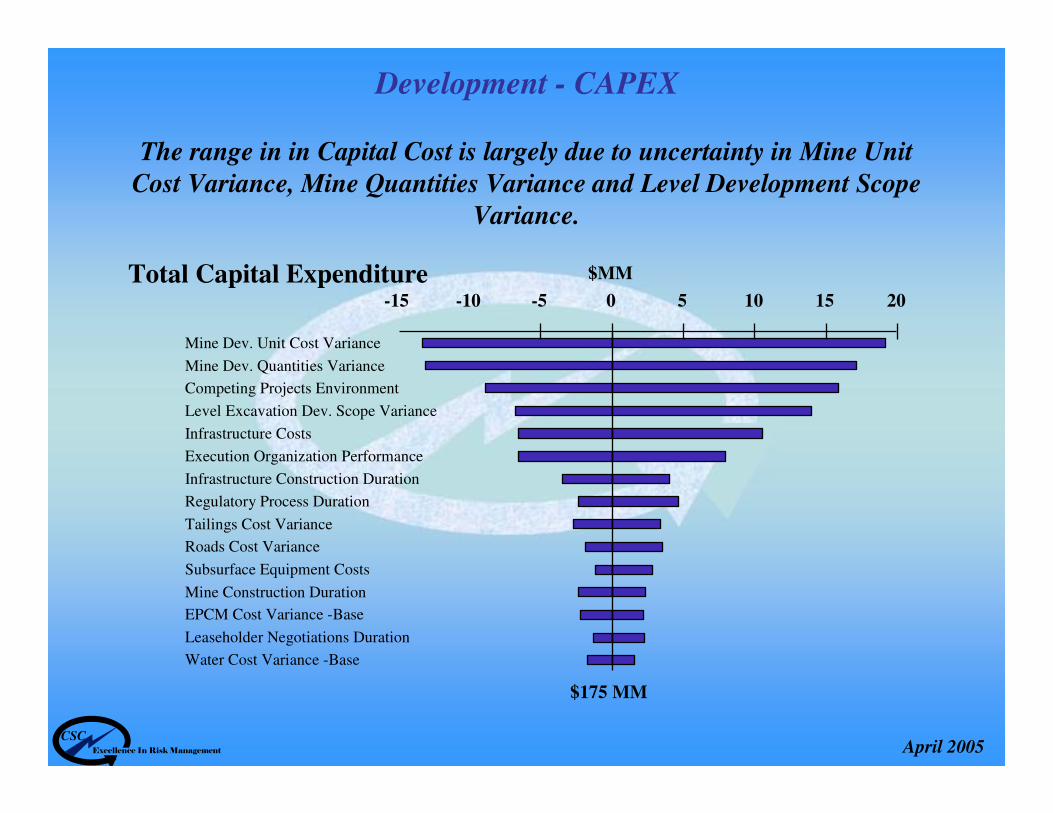
-15 -10 -5 0 5 10 15 20
Mine Dev. Unit Cost Variance
Mine Dev. Quantities Variance
Competing Projects Environment
Level Excavation Dev. Scope Variance
Infrastructure Costs
Execution Organization Performance
Infrastructure Construction Duration
Regulatory Process Duration
Tailings Cost Variance
Roads Cost Variance
Subsurface Equipment Costs
Mine Construction Duration
EPCM Cost Variance -Base
Leaseholder Negotiations Duration
Water Cost Variance -Base
Total Capital Expenditure $MM
$175 MM
The range in in Capital Cost is largely due to uncertainty in Mine Unit
Cost Variance, Mine Quantities Variance and Level Development Scope
Variance.
Development - CAPEX
CSCExcellence In Risk Management April 2005
Presentation Agenda
(2) Introduction to Risk Management
• Risk Management
• Risk Identification and Quantification
(1) Mining Issues and Problems
• Mining Activities – Life Cycle
• Key Uncertainties
(3) Risk Analysis and the Risk Management Process
• Quantitative Risk Management Tools
(4) Specific Application Examples
• Portfolio Management
• Mine Development
(5) Summary
CSCExcellence In Risk Management April 2005
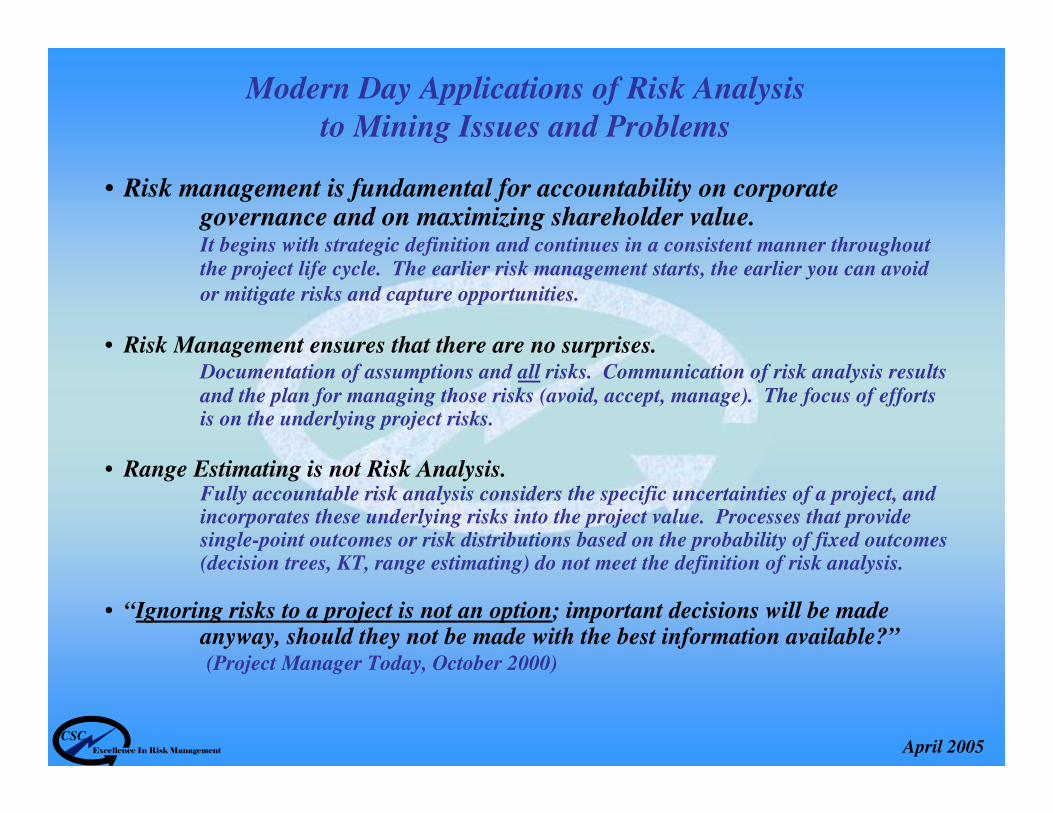
• Risk management is fundamental for accountability on corporate governance and on maximizing shareholder value.It begins with strategic definition and continues in a consistent manner throughout the project life cycle. The earlier risk management starts, the earlier you can avoid
or mitigate risks and capture opportunities.
• Risk Management ensures that there are no surprises.Documentation of assumptions and all risks. Communication of risk analysis results and the plan for managing those risks (avoid, accept, manage). The focus of efforts is on the underlying project risks.
• Range Estimating is not Risk Analysis.Fully accountable risk analysis considers the specific uncertainties of a project, and incorporates these underlying risks into the project value. Processes that provide single-point outcomes or risk distributions based on the probability of fixed outcomes (decision trees, KT, range estimating) do not meet the definition of risk analysis.
• “Ignoring risks to a project is not an option; important decisions will be made anyway, should they not be made with the best information available?”(Project Manager Today, October 2000)
Modern Day Applications of Risk Analysis
to Mining Issues and Problems
Related Documents