Quantitative Precipitation Forecasting at the Hydrometeorological Prediction Center (HPC) www.hpc.ncep.noaa.gov Dan Petersen HPC Forecast Operations Branch [email protected] (301)763-8201

Quantitative Precipitation Forecasting at the Hydrometeorological Prediction Center (HPC) Dan Petersen HPC Forecast Operations Branch.
Jan 01, 2016
Welcome message from author
This document is posted to help you gain knowledge. Please leave a comment to let me know what you think about it! Share it to your friends and learn new things together.
Transcript

Quantitative Precipitation Forecasting at the Hydrometeorological Prediction Center (HPC)
www.hpc.ncep.noaa.gov
Dan Petersen
HPC Forecast Operations Branch
[email protected] (301)763-8201

Quantitative Precipitation Forecasting at the Hydrometeorological Prediction Center (HPC)
Goals of Presentation
• Short Range QPF Methods
• Short Range QPF Case Study
• Verification

Composing a QPF • Short range ( <12 hours )
• Forecast composed by blending the latest radar and satellite data with an analysis of Moisture/Lift/Instability and model output
• Long range ( >12 hours )
• Forecast increasingly relies on model output of QPF, Moisture/Lift/Instability
• Adjustments are made for known model biases and latest model trends/verification/comparisons (including ensembles)

Composing a QPF ( <12 hours)• Radar
• Looping can show areas of training and propagation
• Review radar-estimated amounts-Be wary of beam blocking, bright bands, overshooting tops & attenuation
• Compare observations to estimates (Z – R relationship impact)
Satellite• Rainfall estimates from NESDIS/Satellite Analysis Branch• Looping images can show areas of training/development• Derived Precipitable Water, Lifted Indices, soundings, etc.

OH Valley Case Study-Using Models/Radar/Satellite to Compose QPF
GFS 18z-00z QPF June 14 2005 from 12z Run
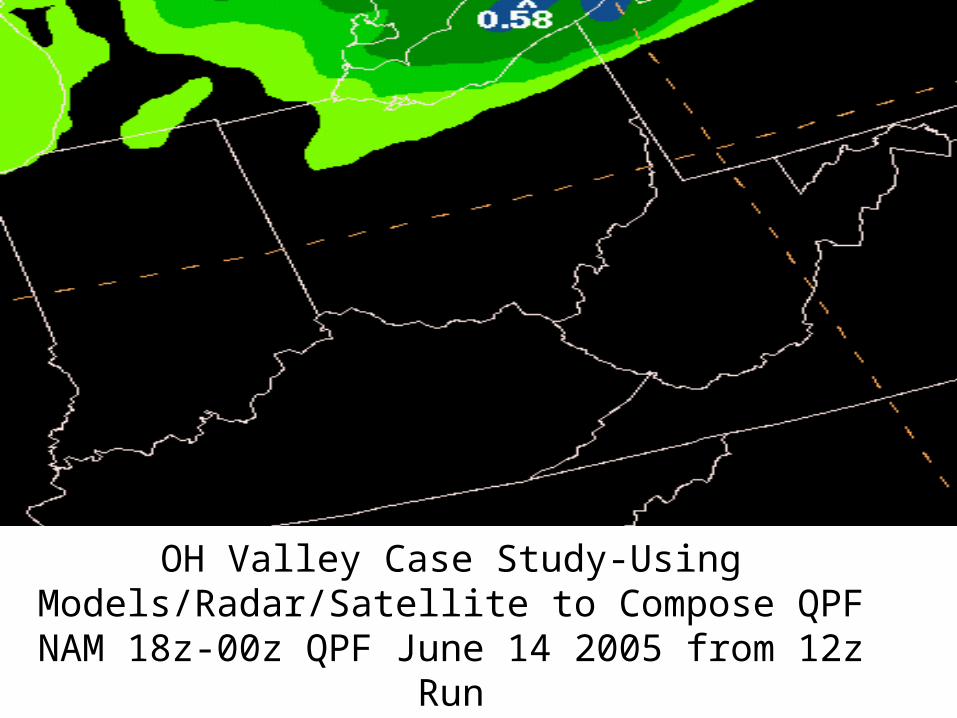
OH Valley Case Study-Using Models/Radar/Satellite to Compose QPF
NAM 18z-00z QPF June 14 2005 from 12z Run
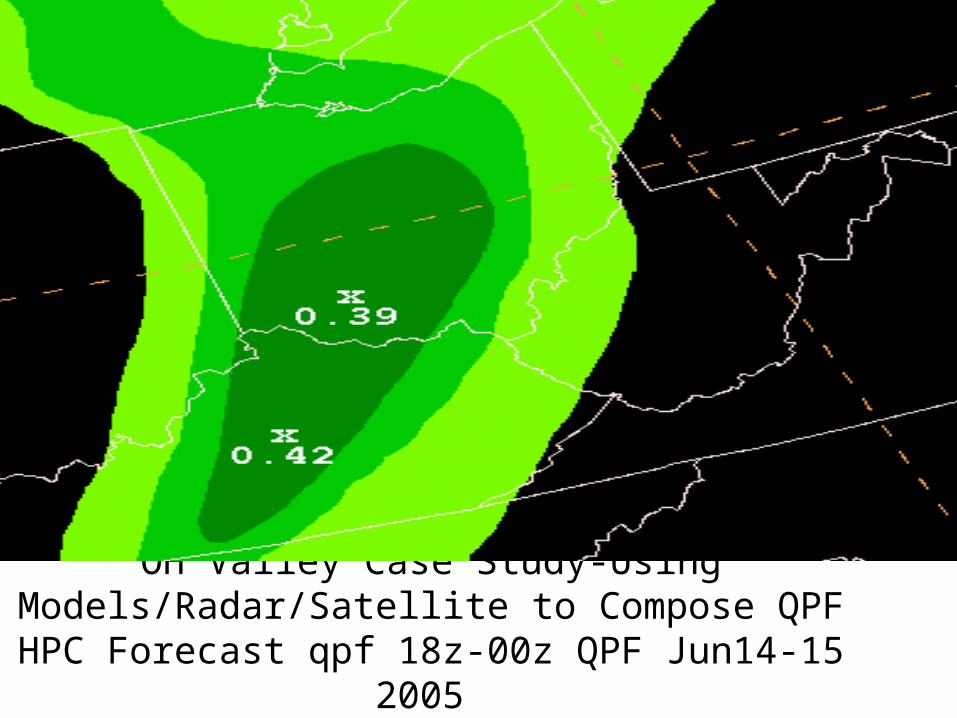
OH Valley Case Study-Using Models/Radar/Satellite to Compose QPF
HPC Forecast qpf 18z-00z QPF Jun14-15 2005
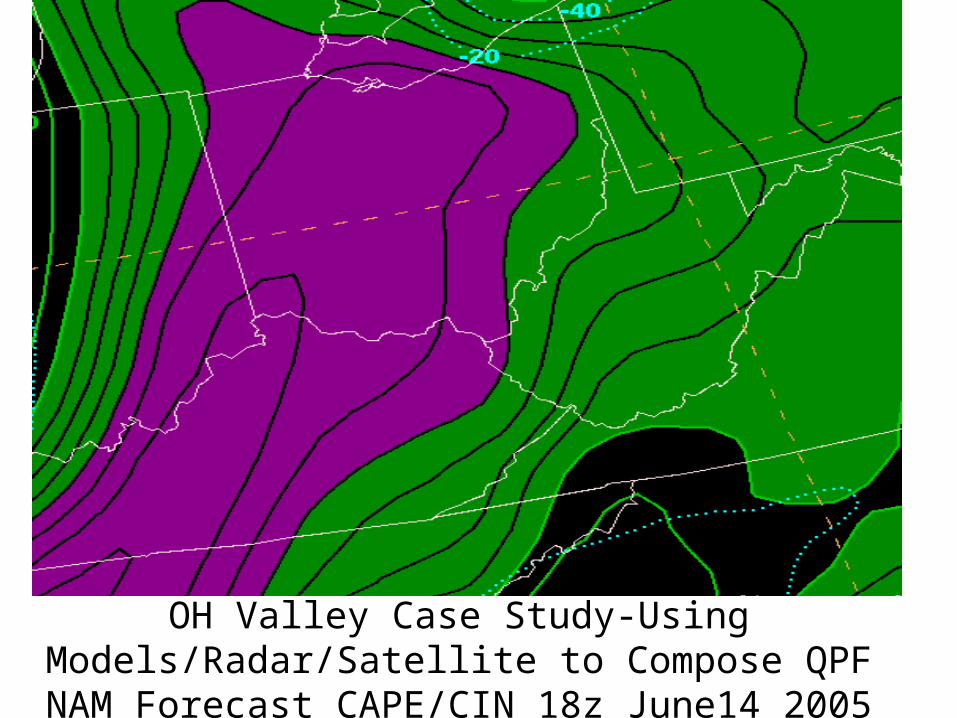
OH Valley Case Study-Using Models/Radar/Satellite to Compose QPF
NAM Forecast CAPE/CIN 18z June14 2005
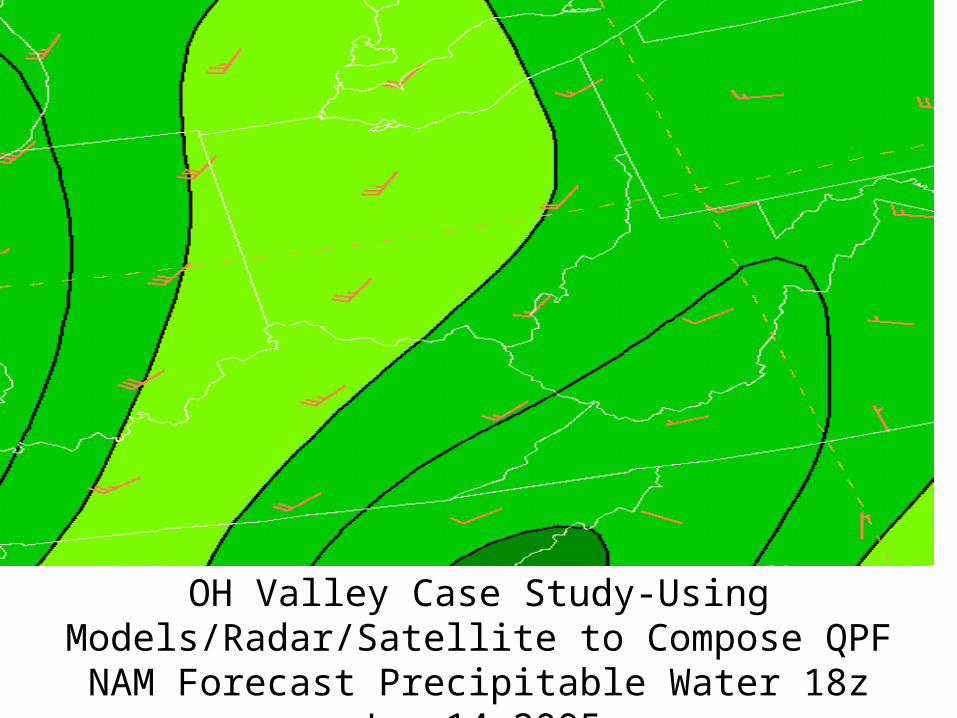
OH Valley Case Study-Using Models/Radar/Satellite to Compose QPF
NAM Forecast Precipitable Water 18z June14 2005

OH Valley Case Study-Using Models/Radar/Satellite to Compose QPF
NAM Forecast Best Lifted Indices 18z June14 2005
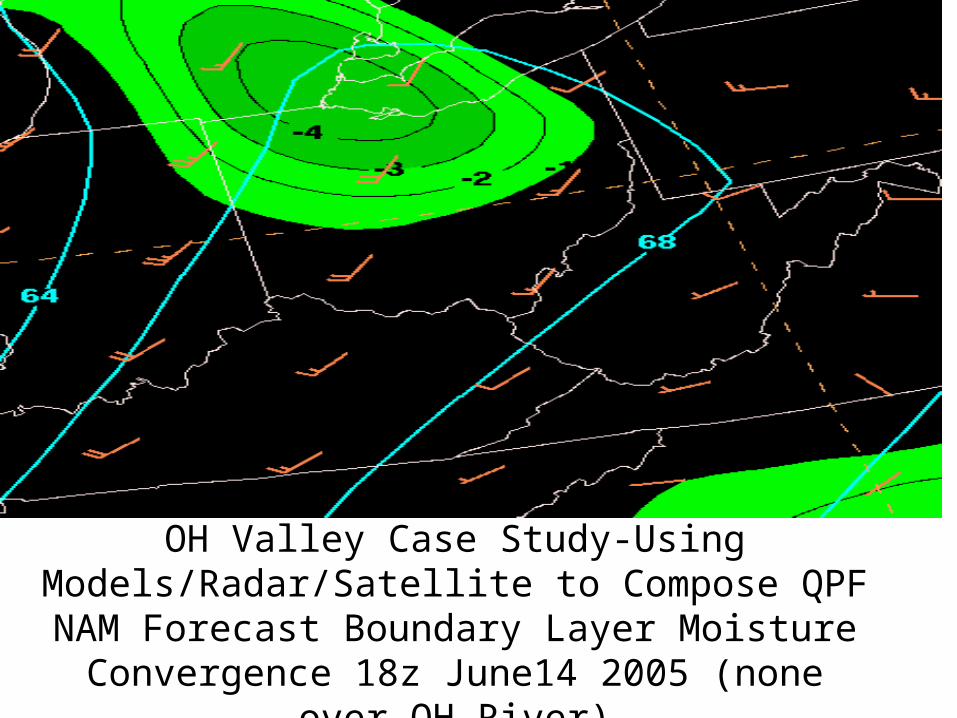
OH Valley Case Study-Using Models/Radar/Satellite to Compose QPF
NAM Forecast Boundary Layer Moisture Convergence 18z June14 2005 (none over OH River)
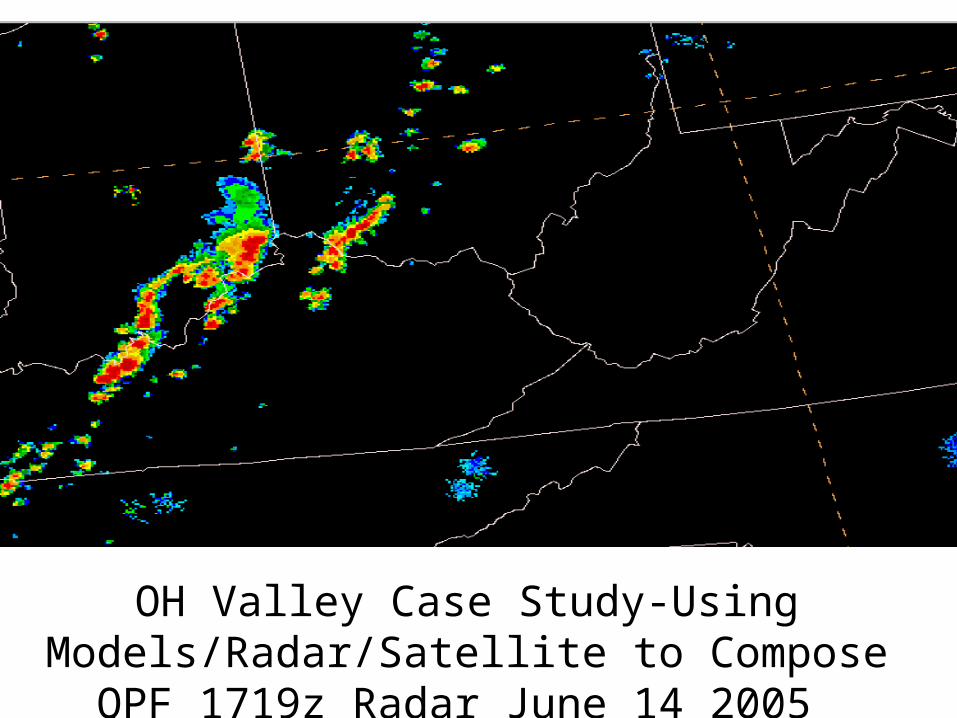
OH Valley Case Study-Using Models/Radar/Satellite to Compose QPF 1719z
Radar June 14 2005
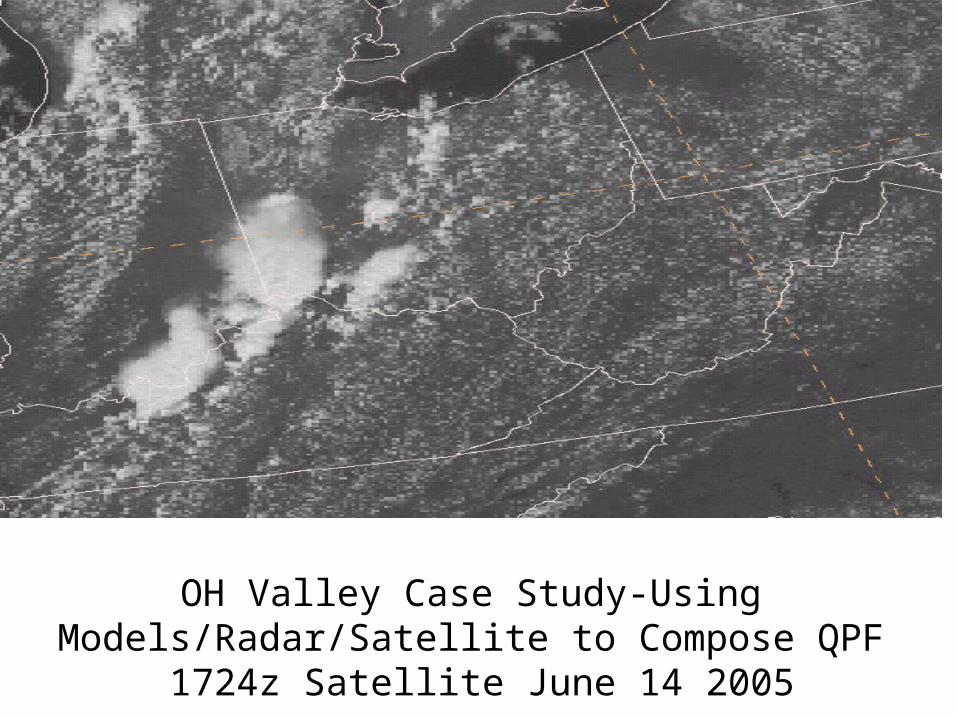
OH Valley Case Study-Using Models/Radar/Satellite to Compose QPF 1724z Satellite June 14 2005
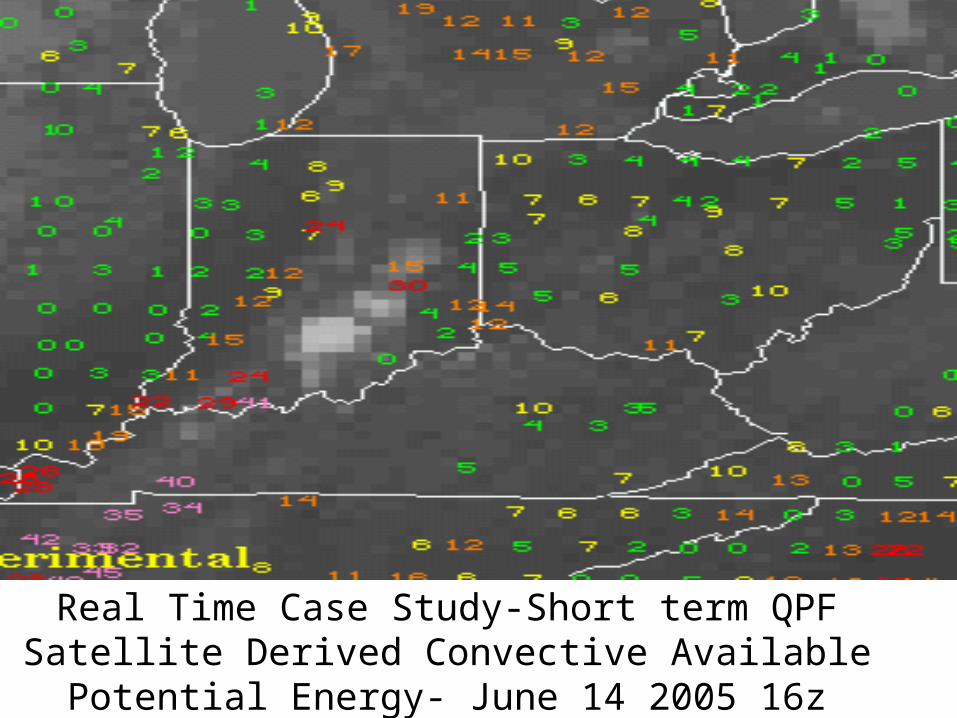
Real Time Case Study-Short term QPFSatellite Derived Convective Available Potential Energy-
June 14 2005 16z

Real Time Case Study-Short term QPFSatellite Derived Lifted Index June 14 2005 16z
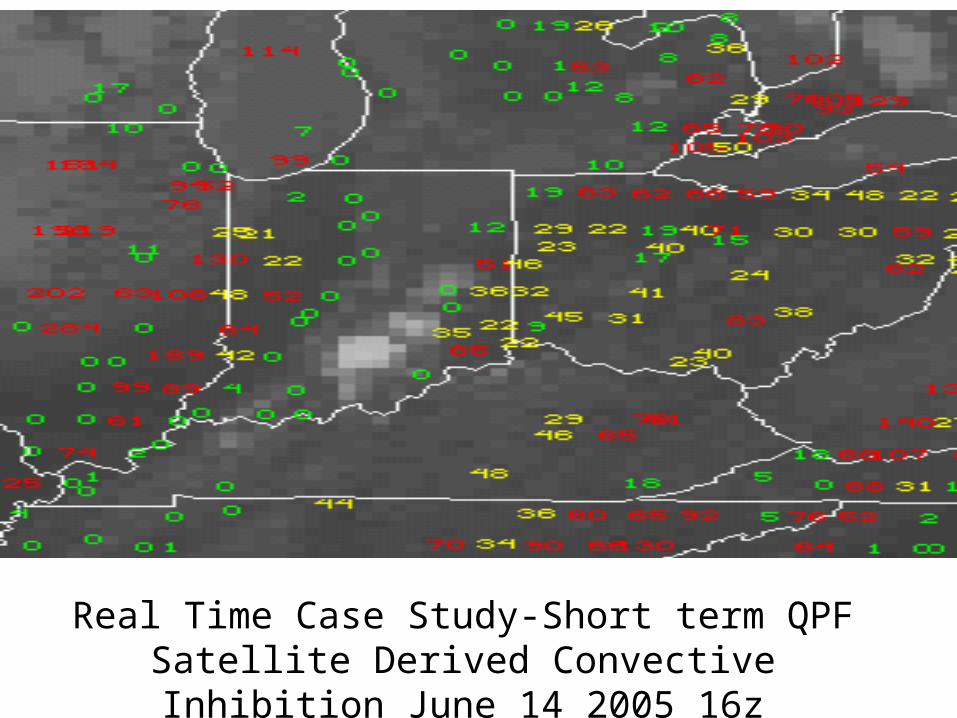
Real Time Case Study-Short term QPFSatellite Derived Convective Inhibition June 14 2005
16z

Real Time Case Study-Short term QPFSatellite Derived Precipitable Water June 14 2005 16z

OH Valley Case Study-Short term QPFJune 14 2005 Storm Total Precipitation

OH Valley Case Study-Short term QPFObserved 06 hour amounts ending 00z June 15 2005

Case Study Results
• NAM model diagnostics supported developing convection, but did not identify boundary to provide lift
• Satellite derived products supported model prognostics favorable for convection plus (combined with radar) identified boundaries to provide lift

Verification-How much Improvement Can We Derive from Satellite/Radar/Model
diagnostics?

Verification-24 Hour QPF vs. Models
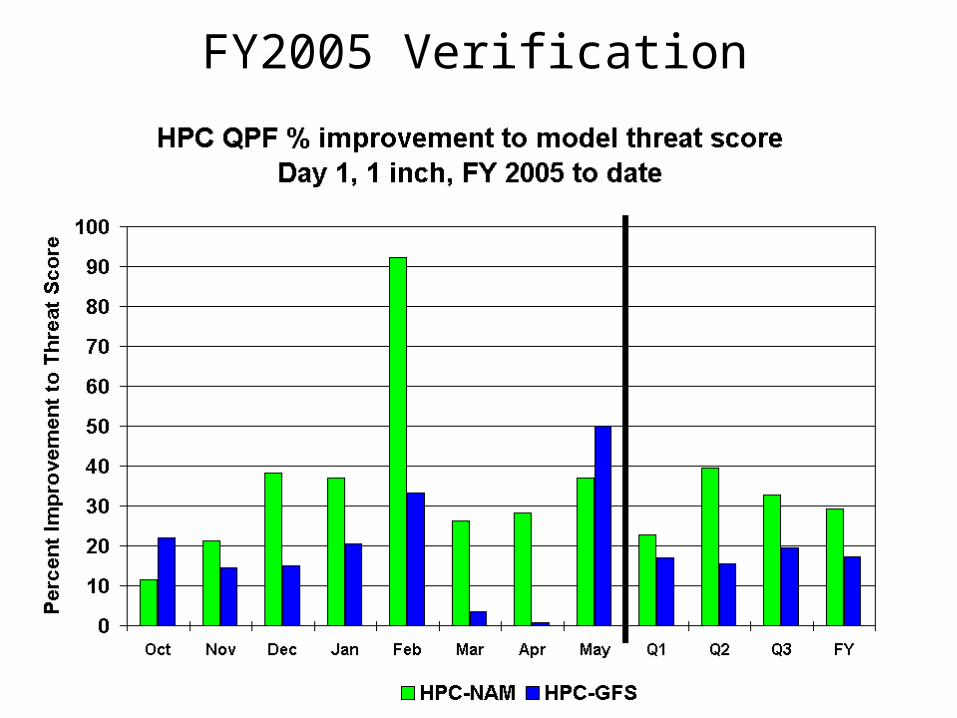
FY2005 Verification

Short Term QPF Benefits from Multi-sensor Analysis
• Improved real time multi-sensor analysis would - Reduce uncertainty of real time satellite/radar
estimates - Reduce uncertainty of post-event rainfall and
time spent on quality control (more reliable verification)
- Lead to improvements in moisture/lift/instability-related diagnostics/prognostics, and thus confidence in qpf and excessive rainfall forecasts
• Questions/needed clarifications?


Composing a QPF
• Must have knowledge of:
• Climatology
• Precipitation producing processes
• Sources of lift (boundaries, topography too)
• Forecasting Motion (propagation component vs. advection)
• Identifying areas of moisture/lift/instability

Analysis (Synoptic/Mesoscale)• Perform a synoptic & mesoscale analysis
• Upper air
• Upper fronts, cold pools, jet streaks
• Surface Data
• Boundaries
• Satellite Data
• Moisture plumes, Upper jet streaks
• Radar
• Boundaries
• Try to link ongoing precipitation with diagnostics

Analysis (Moisture)
• Precipitable Water (PW)
• Surface through 700 mb dew points
• Mean layer RH
• K indices
• Loops of WV imagery/derived PWs
• Consider changes in moisture
• Upslope/Down slope
• Veritical/Horizontal advection
• Soil moisture
• Nearby large bodies of water

Analysis (Lift)• Low/Mid level convergence
• Lows, fronts, troughs
• Synoptic scale lift
• Isentropic
• QG components (differential PVA & WAA)
• Jet dynamics
• Nose of LLJ
• Left front/right rear quadrants of relatively straight upper jets with good along stream variation of speed
• Mesoscale boundaries
• Outflow, terrain, sea breeze
• Orographic lift
• Solar heating

Analysis (Instability)• Soundings are your best tool
• CAPE/CIN is better than any single index
• Beware!! Models forecast CAPE/CIN poorly
• Equilibrium Level
•Convective Instability
• Mid-level drying over low-level moisture
• Increasing low-level moisture under mid-level dry air
• Changing Instability
• Try to anticipate change from
• Low level heating
• Horizontal/Vertical temperature/moisture advection
• Vertical Motion
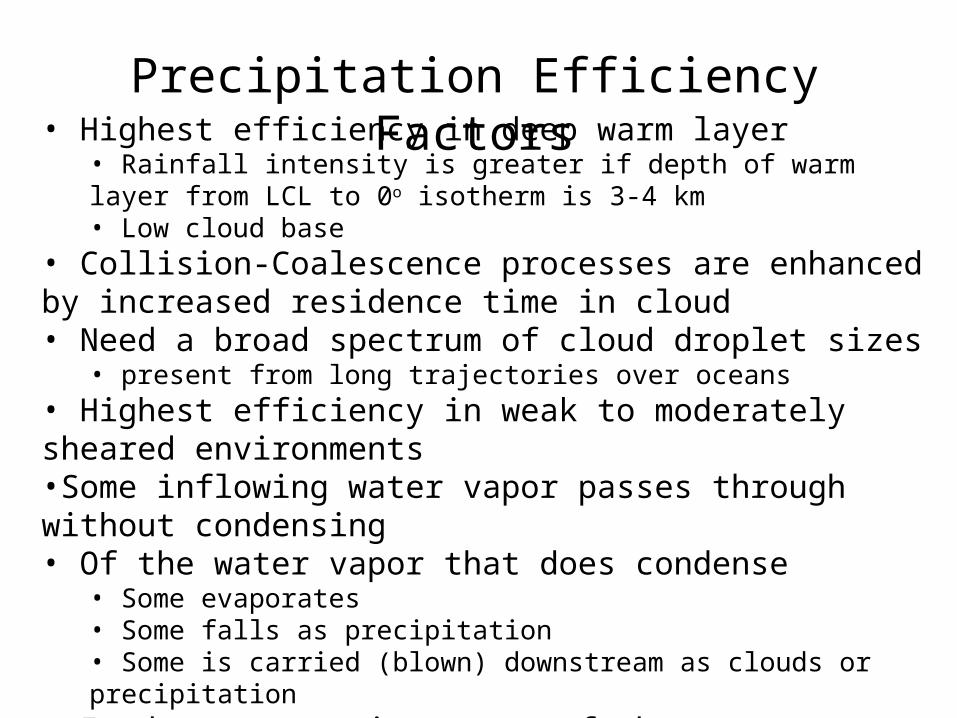
Precipitation Efficiency Factors• Highest efficiency in deep warm layer
• Rainfall intensity is greater if depth of warm layer from LCL to 0o isotherm is 3-4 km• Low cloud base
• Collision-Coalescence processes are enhanced by increased residence time in cloud• Need a broad spectrum of cloud droplet sizes
• present from long trajectories over oceans• Highest efficiency in weak to moderately sheared environments•Some inflowing water vapor passes through without condensing• Of the water vapor that does condense
• Some evaporates• Some falls as precipitation• Some is carried (blown) downstream as clouds or precipitation
• In deep convection, most of the water vapor input condenses

Low Level Jet
• Nocturnal maximum in the plains
• Inertial oscillation enhances the jet
• Often develops in response to lee low development
• LLJ can be enhanced by upper level jet streak
• Barrier jets (near mountains) can play a role in focusing lift
• Convection can induce very focused LLJs

LLJ Importance
• Speed convergence max at nose of LLJ• Confluent flow along axis of the LLJ• Vertical/Horizontal Moisture Flux positively related to strength of LLJ• Differential moisture/temperature advection can lead to rapid destabilization• Quasi-Stationary LLJ can lead to cell regeneration/training• Often located on the SW flank of a backward propagating MCS

Movement of a system is dependent on cell movement and propagation
The vector describing the propagation is the vector anti-parallel to the LLJ Vprop = -VLLJ
The vector that describes the movement of the most active part of an MCS is represented by
V = Vcell + Vprop
Propagation is dependent on how fast new cells form along some flank of the system

Factors leading to training/regenerating convection
• Slow moving low level boundary
• Quasi-stationary low level jet
• Quasi-stationary area of upper level divergence
• Low level boundary (moisture/convergence) nearly parallel to the mean flow
• Lack of strong vertical wind shear (speed & directional)
Related Documents