Quantitative passive soil vapor sampling for VOCs- part 3: field experiments† Todd McAlary, * ab Hester Groenevelt, a Paul Nicholson, a Suresh Seethapathy, b Paolo Sacco, c Derrick Crump, d Michael Tuday, e Heidi Hayes, f Brian Schumacher, g Paul Johnson, h Tadeusz G ´ orecki b and Ignacio Rivera-Duarte i Volatile organic compounds (VOCs) are commonly associated with contaminated land and may pose a risk to human health via subsurface vapor intrusion to indoor air. Soil vapor sampling is commonly used to assess the nature and extent of VOC contamination, but can be complicated because of the wide range of geologic material permeability and moisture content conditions that might be encountered, the wide variety of available sampling and analysis methods, and several potential causes of bias and variability, including leaks of atmospheric air, adsorption–desorption interactions, inconsistent sampling protocols and varying levels of experience among sampling personnel. Passive sampling onto adsorbent materials has been available as an alternative to conventional whole-gas sample collection for decades, but relationships between the mass sorbed with time and the soil vapor concentration have not been quantitatively established and the relative merits of various commercially available passive samplers for soil vapor concentration measurement is unknown. This paper presents the results of field experiments using several different passive samplers under a wide range of conditions. The results show that properly designed and deployed quantitative passive soil vapor samplers can be used to measure soil vapor concentrations with accuracy and precision comparable to conventional active soil vapor sampling (relative concentrations within a factor of 2 and RSD comparable to active sampling) where the uptake rate is low enough to minimize starvation and the exposure duration is not excessive for weakly retained compounds. Environmental impact Conventional soil vapor sampling for VOC analysis can be impractical in low-permeability soils and time-consuming if quality control measures are implemented to verify the absence of leaks. Passive adsorptive sampling has been an alternative to conventional active sampling for decades, but the uptake rate of the sampler has never been well understood or controlled, so passive sampling has been considered a qualitative or semi-quantitative method. This paper provides the results of a series of controlled eld sampling experiments, which demonstrate that passive soil vapor sampling can provide quantitative concentration measurements when the uptake rate is low enough to avoid the starvation effect and the sorbent is strong enough to retain the compounds of interest over the sampling period. 1. Introduction Quantitative passive vapor samplers of the kinetic variety provide time-weighted average concentrations (C) of vapors in the media (usually indoor or outdoor air) to which they are exposed. C is calculated by dividing the mass of each analyte sorbed (M) by the analyte-specic uptake rate of the sampler (UR) and the sample time (t). 1 Analyte uptake rates for quanti- tative samplers can be determined experimentally or estimated theoretically and they are typically supplied by the vendor of the passive sampler. This distinguishes the quantitative samplers tested in this study from qualitative or semi-quantitative passive samplers (e.g., Gore™ Modules, 2 Beacon BeSure Passive Soil Gas Technology™, 3 EMFLUX Cartridges™, 4 Petrex tubes™ 5,6 and similar devices) that are not specically designed to constrain and uniformly control analyte uptake rates. To date, passive soil vapor samplers have been shown to provide quali- tative or semi-quantitative soil vapor data; however, the ability to quantify soil vapor concentrations from the mass retained on the sampler has not been established. 2,4,7 As a result, many regulatory guidance documents caution that passive soil vapor a Geosyntec Consultants, Inc., 130 Research Lane, #2, Guelph, N1G 5G3, Ontario, Canada. E-mail: [email protected]; Fax: +1 519 822-3151; Tel: +1 519 515- 0861 b University of Waterloo, Waterloo, Ontario, Canada c Fondazione Salvatore Maugeri, Padova, Italy d Craneld University, Craneld, UK e Columbia Analytical Services, Simi Valley, CA, USA f Eurons Air Toxics, Inc. (formerly Air Toxics Ltd.), Folsom, CA, USA g USEPA, Las Vegas, NV, USA h Arizona State University, Tempe, AZ, USA i SPAWAR Systems Center Pacic, San Diego, CA, USA † Electronic supplementary information (ESI) available. See DOI: 10.1039/c3em00653k Cite this: Environ. Sci.: Processes Impacts, 2014, 16, 501 Received 30th November 2013 Accepted 21st January 2014 DOI: 10.1039/c3em00653k rsc.li/process-impacts This journal is © The Royal Society of Chemistry 2014 Environ. Sci.: Processes Impacts, 2014, 16, 501–510 | 501 Environmental Science Processes & Impacts PAPER Published on 21 January 2014. Downloaded by University of Waterloo on 02/03/2014 20:54:10. View Article Online View Journal | View Issue

Welcome message from author
This document is posted to help you gain knowledge. Please leave a comment to let me know what you think about it! Share it to your friends and learn new things together.
Transcript
EnvironmentalScienceProcesses & Impacts
PAPER
Publ
ishe
d on
21
Janu
ary
2014
. Dow
nloa
ded
by U
nive
rsity
of
Wat
erlo
o on
02/
03/2
014
20:5
4:10
.
View Article OnlineView Journal | View Issue
aGeosyntec Consultants, Inc., 130 Research
Canada. E-mail: [email protected];
0861bUniversity of Waterloo, Waterloo, Ontario,cFondazione Salvatore Maugeri, Padova, ItadCraneld University, Craneld, UKeColumbia Analytical Services, Simi Valley,fEurons Air Toxics, Inc. (formerly Air ToxicgUSEPA, Las Vegas, NV, USAhArizona State University, Tempe, AZ, USAiSPAWAR Systems Center Pacic, San Diego
† Electronic supplementary informa10.1039/c3em00653k
Cite this: Environ. Sci.: ProcessesImpacts, 2014, 16, 501
Received 30th November 2013Accepted 21st January 2014
DOI: 10.1039/c3em00653k
rsc.li/process-impacts
This journal is © The Royal Society of C
Quantitative passive soil vapor sampling forVOCs- part 3: field experiments†
Todd McAlary,*ab Hester Groenevelt,a Paul Nicholson,a Suresh Seethapathy,b
Paolo Sacco,c Derrick Crump,d Michael Tuday,e Heidi Hayes,f Brian Schumacher,g
Paul Johnson,h Tadeusz Goreckib and Ignacio Rivera-Duartei
Volatile organic compounds (VOCs) are commonly associatedwith contaminated land andmaypose a risk to
humanhealth via subsurface vapor intrusion to indoor air. Soil vapor sampling is commonly used to assess the
nature and extent of VOC contamination, but can be complicated because of the wide range of geologic
material permeability and moisture content conditions that might be encountered, the wide variety of
available sampling and analysis methods, and several potential causes of bias and variability, including
leaks of atmospheric air, adsorption–desorption interactions, inconsistent sampling protocols and varying
levels of experience among sampling personnel. Passive sampling onto adsorbent materials has been
available as an alternative to conventional whole-gas sample collection for decades, but relationships
between the mass sorbed with time and the soil vapor concentration have not been quantitatively
established and the relative merits of various commercially available passive samplers for soil vapor
concentration measurement is unknown. This paper presents the results of field experiments using several
different passive samplers under a wide range of conditions. The results show that properly designed and
deployed quantitative passive soil vapor samplers can be used to measure soil vapor concentrations with
accuracy and precision comparable to conventional active soil vapor sampling (relative concentrations
within a factor of 2 and RSD comparable to active sampling) where the uptake rate is low enough to
minimize starvation and the exposure duration is not excessive for weakly retained compounds.
Environmental impact
Conventional soil vapor sampling for VOC analysis can be impractical in low-permeability soils and time-consuming if quality control measures are implementedto verify the absence of leaks. Passive adsorptive sampling has been an alternative to conventional active sampling for decades, but the uptake rate of the samplerhas never been well understood or controlled, so passive sampling has been considered a qualitative or semi-quantitativemethod. This paper provides the resultsof a series of controlled eld sampling experiments, which demonstrate that passive soil vapor sampling can provide quantitative concentration measurementswhen the uptake rate is low enough to avoid the starvation effect and the sorbent is strong enough to retain the compounds of interest over the sampling period.
1. Introduction
Quantitative passive vapor samplers of the kinetic varietyprovide time-weighted average concentrations (C) of vapors in
Lane, #2, Guelph, N1G 5G3, Ontario,
Fax: +1 519 822-3151; Tel: +1 519 515-
Canada
ly
CA, USA
s Ltd.), Folsom, CA, USA
, CA, USA
tion (ESI) available. See DOI:
hemistry 2014
the media (usually indoor or outdoor air) to which they areexposed. C is calculated by dividing the mass of each analytesorbed (M) by the analyte-specic uptake rate of the sampler(UR) and the sample time (t).1 Analyte uptake rates for quanti-tative samplers can be determined experimentally or estimatedtheoretically and they are typically supplied by the vendor of thepassive sampler. This distinguishes the quantitative samplerstested in this study from qualitative or semi-quantitative passivesamplers (e.g., Gore™ Modules,2 Beacon BeSure Passive SoilGas Technology™,3 EMFLUX Cartridges™,4 Petrex tubes™5,6
and similar devices) that are not specically designed toconstrain and uniformly control analyte uptake rates. To date,passive soil vapor samplers have been shown to provide quali-tative or semi-quantitative soil vapor data; however, the abilityto quantify soil vapor concentrations from the mass retained onthe sampler has not been established.2,4,7 As a result, manyregulatory guidance documents caution that passive soil vapor
Environ. Sci.: Processes Impacts, 2014, 16, 501–510 | 501
Environmental Science: Processes & Impacts Paper
Publ
ishe
d on
21
Janu
ary
2014
. Dow
nloa
ded
by U
nive
rsity
of
Wat
erlo
o on
02/
03/2
014
20:5
4:10
. View Article Online
sampling should only be used as a qualitative or semi-quanti-tative screening tool.8,9 Even when a passive sampler is designedin a way that allows the analyte uptake rates to be controlled(e.g. by incorporation of a well-dened diffusion or permeationbarrier between the sampled medium and the sorbent), soilvapor sampling creates unique challenges. On the one hand,the sampler uptake rate must be high enough to allow quanti-cation of concentrations of concern for an acceptablesampling duration. On the other hand, the uptake rate must below enough that the sampler itself does not remove analytevapors faster than they are transported to its face from thesurrounding medium, because this would result in a localizedreduction in the vapor concentrations near the samplercompared to the surrounding soil, and a low bias in the vaporconcentrations (sometimes referred to as the “starvationeffect”).10
This paper describes a series of controlled eld experimentsdesigned to elucidate the optimal approach to soil vaporsampling using kinetic passive samplers. The tests were con-ducted over a wide range of operating conditions: sample dura-tions from 20 minutes to 11.7 days, concentrations from about100 to about 60 000 mg m�3, uptake rates from about 0.05 to80mLmin�1, several different chlorinated VOCs, 2.4 to 10 cm (1to 4 inch) diameter and 2.5 to 46 cm (1 to 18 inch) tall void spaces,ambient temperatures during sample collection from about 15to about 30 �C, analysis by several different laboratories anddifferent extraction methods (solvent extraction and thermaldesorption) for each of several different types of commercially-available passive samplers and sorbent media. This provides apreviously unavailable set of data with which to assess thecapabilities and limitations of passive soil vapor sampling forVOC concentration measurement. One companion paper10
provides theoretical information based on mathematicalmodeling, and a second paper11 provides laboratory testing datato support the experimental results provided herein.
2. ExperimentalMaterials and methods
The quantitative passive samplers used in this study included:SKC Ultra™12 from SKC, Inc.; Radiello®13 from FondazioneSalvatore Maugeri; OVM 3500™14 from 3M; WaterlooMembrane Sampler™ or WMS™15,16 from SiREM Laboratory,and Passive ATD tube samplers17,18 (Perkin Elmer type, but alsoavailable fromMarkes International and other suppliers). Someof these samplers are available with different sorbents anduptake rates, which allowed different combinations to be eval-uated, as described for each test site. The uptake rates used inthe study were either supplied by the vendor or estimated fromthe free-air diffusion coefficients19 for diffusive samplers. In thecase of the WMS sampler, which uses a polydimethylsiloxane(PDMS) membrane as the rate-limiting barrier, the uptake ratesfor compounds for which they had not been determinedexperimentally were estimated from the correlation between theUR and the linear temperature-programmed retention indicesof the analytes on PDMS-coated GC columns.15 Laboratoryanalytical methods are described in the ESI.†
502 | Environ. Sci.: Processes Impacts, 2014, 16, 501–510
Sampling locations
Samples were collected at: (1) the US Navy San Diego Old TownCampus (OTC), (2) the Arizona State University (ASU) studyhouse in Layton, Utah (near Hill Air Force Base) and (3) NavalAir Station Jacksonville, Florida (NAS JAX), all of which wereknown to have VOCs in the subsurface near occupiedstructures, in which case regulatory guidance recommendsassessment of potential health risks using lines of evidenceincluding soil vapor concentration measurement for individualcompounds. Sub-slab samples were collected immediatelybelow concrete slabs at OTC and NAS JAX and deeper soil vaporsamples were collected at the Layton House and NAS JAX. Forvapor intrusion assessments, most regulatory guidance docu-ments recommend that soil vapor samples be collected 1.5 m(5 feet) or deeper below ground surface. The experimentaldesigns were as follows:
Navy OTC. Passive sub-slab samples were collected imme-diately below the concrete slab-on-grade ground cover in twolocations with ve passive devices and one active sample(Summa canister with analysis by EPA Method TO-1520) in eachlocation. Both locations were outside of a building where aconcrete slab was accessible for drilling and coring. Initialscreening with a photoionization detector showed total ioniz-able vapor concentrations in the 0.1 to 10 parts per million v/v(ppmv) range. The primary contaminant of concern (COC) wastrichloroethene (TCE). Sampler deployment durations were 2 hat location SS-2 where the eld screening data showed higherconcentrations and 15 h at location SS-5 (where the eldscreening readings showed lower concentrations) in order toassure that sufficient mass would be collected to providedetectable results, but minimize the risk of overloading thesorptive capacity of the samplers. All ve passive samplers wereused for sub-slab sampling in congurations (uptake rate andadsorbent) described in Table 1. Samplers were placed in holesdrilled or cored through the concrete (depending on thediameter needed to accommodate the sampler), located in acircle of �1 m diameter, with the Summa canister samplecollected in the center of the circle. The volume of the voidspace in which the samplers were deployed ranged from about25mL for the 1-inch diameter drill holes to about 100mL for the2-inch diameter core holes. Immediately aer the passivesampler deployment, one liter of soil gas was purged to removeany atmospheric air that may have entered the hole, and thehole was sealed using a rubber stopper wrapped in aluminumfoil to provide a exible and inert plug. The purged gas wasscreened to conrm consistent total ionizable vapor concen-trations with a Phocheck+™ photoionization detector (PID)from Ionscience (Cambridge, UK), which was eld-calibratedaccording to manufacturer's instructions.
Layton House. Six passive soil vapor monitoring probes wereinstalled to a depth of about 4 m (12 ) in a circular pattern witha radius of about 1 m using a 10 cm (4-in) diameter hand-auger.Each probe was constructed of 3 m (10 ) length of 5 cm (2-in)diameter schedule 40 PVC pipe, with stilts on the bottom tosuspend the pipe 0.6 m (2 ) above the bottom of the borehole.The volume of the void space in which the samplers were
This journal is © The Royal Society of Chemistry 2014
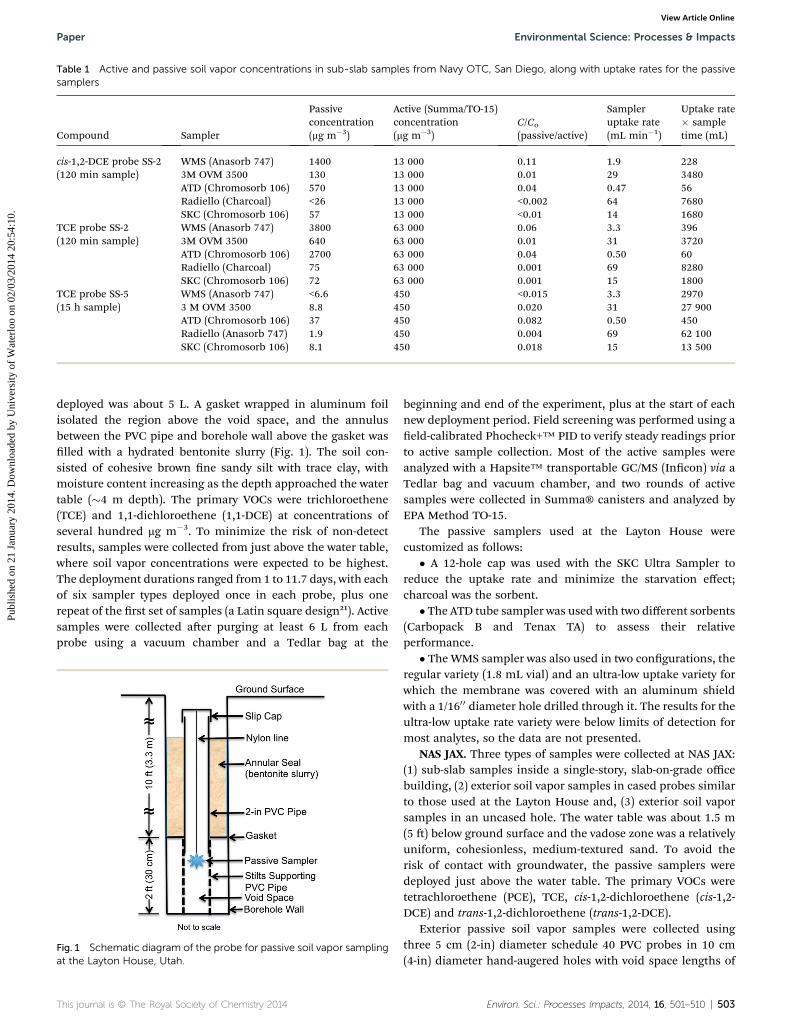
Table 1 Active and passive soil vapor concentrations in sub-slab samples from Navy OTC, San Diego, along with uptake rates for the passivesamplers
Compound Sampler
Passiveconcentration(mg m�3)
Active (Summa/TO-15)concentration(mg m�3)
C/Co
(passive/active)
Sampleruptake rate(mL min�1)
Uptake rate� sampletime (mL)
cis-1,2-DCE probe SS-2(120 min sample)
WMS (Anasorb 747) 1400 13 000 0.11 1.9 2283M OVM 3500 130 13 000 0.01 29 3480ATD (Chromosorb 106) 570 13 000 0.04 0.47 56Radiello (Charcoal) <26 13 000 <0.002 64 7680SKC (Chromosorb 106) 57 13 000 <0.01 14 1680
TCE probe SS-2(120 min sample)
WMS (Anasorb 747) 3800 63 000 0.06 3.3 3963M OVM 3500 640 63 000 0.01 31 3720ATD (Chromosorb 106) 2700 63 000 0.04 0.50 60Radiello (Charcoal) 75 63 000 0.001 69 8280SKC (Chromosorb 106) 72 63 000 0.001 15 1800
TCE probe SS-5(15 h sample)
WMS (Anasorb 747) <6.6 450 <0.015 3.3 29703 M OVM 3500 8.8 450 0.020 31 27 900ATD (Chromosorb 106) 37 450 0.082 0.50 450Radiello (Anasorb 747) 1.9 450 0.004 69 62 100SKC (Chromosorb 106) 8.1 450 0.018 15 13 500
Paper Environmental Science: Processes & Impacts
Publ
ishe
d on
21
Janu
ary
2014
. Dow
nloa
ded
by U
nive
rsity
of
Wat
erlo
o on
02/
03/2
014
20:5
4:10
. View Article Online
deployed was about 5 L. A gasket wrapped in aluminum foilisolated the region above the void space, and the annulusbetween the PVC pipe and borehole wall above the gasket waslled with a hydrated bentonite slurry (Fig. 1). The soil con-sisted of cohesive brown ne sandy silt with trace clay, withmoisture content increasing as the depth approached the watertable (�4 m depth). The primary VOCs were trichloroethene(TCE) and 1,1-dichloroethene (1,1-DCE) at concentrations ofseveral hundred mg m�3. To minimize the risk of non-detectresults, samples were collected from just above the water table,where soil vapor concentrations were expected to be highest.The deployment durations ranged from 1 to 11.7 days, with eachof six sampler types deployed once in each probe, plus onerepeat of the rst set of samples (a Latin square design21). Activesamples were collected aer purging at least 6 L from eachprobe using a vacuum chamber and a Tedlar bag at the
Fig. 1 Schematic diagram of the probe for passive soil vapor samplingat the Layton House, Utah.
This journal is © The Royal Society of Chemistry 2014
beginning and end of the experiment, plus at the start of eachnew deployment period. Field screening was performed using aeld-calibrated Phocheck+™ PID to verify steady readings priorto active sample collection. Most of the active samples wereanalyzed with a Hapsite™ transportable GC/MS (Incon) via aTedlar bag and vacuum chamber, and two rounds of activesamples were collected in Summa® canisters and analyzed byEPA Method TO-15.
The passive samplers used at the Layton House werecustomized as follows:
� A 12-hole cap was used with the SKC Ultra Sampler toreduce the uptake rate and minimize the starvation effect;charcoal was the sorbent.
� The ATD tube sampler was used with two different sorbents(Carbopack B and Tenax TA) to assess their relativeperformance.
� The WMS sampler was also used in two congurations, theregular variety (1.8 mL vial) and an ultra-low uptake variety forwhich the membrane was covered with an aluminum shieldwith a 1/160 0 diameter hole drilled through it. The results for theultra-low uptake rate variety were below limits of detection formost analytes, so the data are not presented.
NAS JAX. Three types of samples were collected at NAS JAX:(1) sub-slab samples inside a single-story, slab-on-grade officebuilding, (2) exterior soil vapor samples in cased probes similarto those used at the Layton House and, (3) exterior soil vaporsamples in an uncased hole. The water table was about 1.5 m(5 ) below ground surface and the vadose zone was a relativelyuniform, cohesionless, medium-textured sand. To avoid therisk of contact with groundwater, the passive samplers weredeployed just above the water table. The primary VOCs weretetrachloroethene (PCE), TCE, cis-1,2-dichloroethene (cis-1,2-DCE) and trans-1,2-dichloroethene (trans-1,2-DCE).
Exterior passive soil vapor samples were collected usingthree 5 cm (2-in) diameter schedule 40 PVC probes in 10 cm(4-in) diameter hand-augered holes with void space lengths of
Environ. Sci.: Processes Impacts, 2014, 16, 501–510 | 503
Environmental Science: Processes & Impacts Paper
Publ
ishe
d on
21
Janu
ary
2014
. Dow
nloa
ded
by U
nive
rsity
of
Wat
erlo
o on
02/
03/2
014
20:5
4:10
. View Article Online
about 15, 30 and 45 cm (6, 12 and 18-in) to assess whether thevoid volume (1.2 L, 2.4 L and 3.6 L, respectively) affected theresults. The samplers were deployed for 20, 40 and 60 minutesto assess whether the deployment duration affected the results.A total of seven passive samples were collected using each of the5 samplers and 35 Summa® canister samples were collected foranalysis by EPA Method TO-15 (1 : 1 ratio). This experimentaldesign was a randomized 2-factor, one-half fraction, fractionalfactorial with triplicates at the center-points21 (40 minutesample time in the 30 cm tall void).
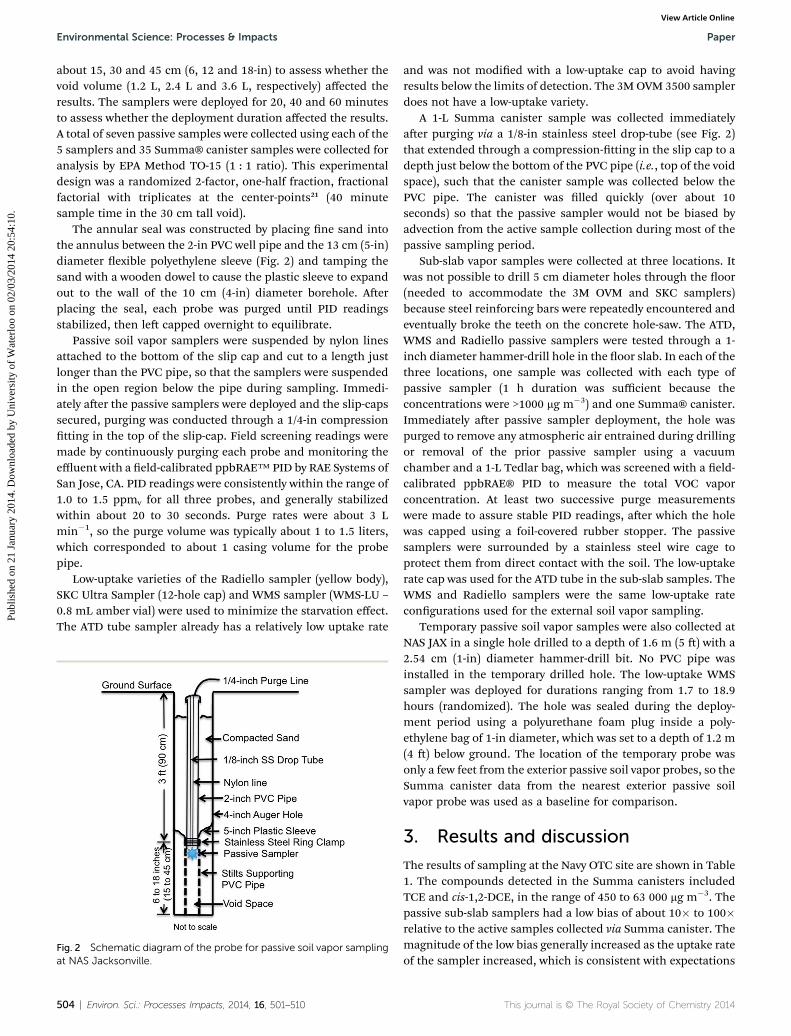
The annular seal was constructed by placing ne sand intothe annulus between the 2-in PVC well pipe and the 13 cm (5-in)diameter exible polyethylene sleeve (Fig. 2) and tamping thesand with a wooden dowel to cause the plastic sleeve to expandout to the wall of the 10 cm (4-in) diameter borehole. Aerplacing the seal, each probe was purged until PID readingsstabilized, then le capped overnight to equilibrate.
Passive soil vapor samplers were suspended by nylon linesattached to the bottom of the slip cap and cut to a length justlonger than the PVC pipe, so that the samplers were suspendedin the open region below the pipe during sampling. Immedi-ately aer the passive samplers were deployed and the slip-capssecured, purging was conducted through a 1/4-in compressiontting in the top of the slip-cap. Field screening readings weremade by continuously purging each probe and monitoring theeffluent with a eld-calibrated ppbRAE™ PID by RAE Systems ofSan Jose, CA. PID readings were consistently within the range of1.0 to 1.5 ppmv for all three probes, and generally stabilizedwithin about 20 to 30 seconds. Purge rates were about 3 Lmin�1, so the purge volume was typically about 1 to 1.5 liters,which corresponded to about 1 casing volume for the probepipe.
Low-uptake varieties of the Radiello sampler (yellow body),SKC Ultra Sampler (12-hole cap) and WMS sampler (WMS-LU –
0.8 mL amber vial) were used to minimize the starvation effect.The ATD tube sampler already has a relatively low uptake rate
Fig. 2 Schematic diagram of the probe for passive soil vapor samplingat NAS Jacksonville.
504 | Environ. Sci.: Processes Impacts, 2014, 16, 501–510
and was not modied with a low-uptake cap to avoid havingresults below the limits of detection. The 3MOVM 3500 samplerdoes not have a low-uptake variety.
A 1-L Summa canister sample was collected immediatelyaer purging via a 1/8-in stainless steel drop-tube (see Fig. 2)that extended through a compression-tting in the slip cap to adepth just below the bottom of the PVC pipe (i.e., top of the voidspace), such that the canister sample was collected below thePVC pipe. The canister was lled quickly (over about 10seconds) so that the passive sampler would not be biased byadvection from the active sample collection during most of thepassive sampling period.
Sub-slab vapor samples were collected at three locations. Itwas not possible to drill 5 cm diameter holes through the oor(needed to accommodate the 3M OVM and SKC samplers)because steel reinforcing bars were repeatedly encountered andeventually broke the teeth on the concrete hole-saw. The ATD,WMS and Radiello passive samplers were tested through a 1-inch diameter hammer-drill hole in the oor slab. In each of thethree locations, one sample was collected with each type ofpassive sampler (1 h duration was sufficient because theconcentrations were >1000 mg m�3) and one Summa® canister.Immediately aer passive sampler deployment, the hole waspurged to remove any atmospheric air entrained during drillingor removal of the prior passive sampler using a vacuumchamber and a 1-L Tedlar bag, which was screened with a eld-calibrated ppbRAE® PID to measure the total VOC vaporconcentration. At least two successive purge measurementswere made to assure stable PID readings, aer which the holewas capped using a foil-covered rubber stopper. The passivesamplers were surrounded by a stainless steel wire cage toprotect them from direct contact with the soil. The low-uptakerate cap was used for the ATD tube in the sub-slab samples. TheWMS and Radiello samplers were the same low-uptake ratecongurations used for the external soil vapor sampling.
Temporary passive soil vapor samples were also collected atNAS JAX in a single hole drilled to a depth of 1.6 m (5 ) with a2.54 cm (1-in) diameter hammer-drill bit. No PVC pipe wasinstalled in the temporary drilled hole. The low-uptake WMSsampler was deployed for durations ranging from 1.7 to 18.9hours (randomized). The hole was sealed during the deploy-ment period using a polyurethane foam plug inside a poly-ethylene bag of 1-in diameter, which was set to a depth of 1.2 m(4 ) below ground. The location of the temporary probe wasonly a few feet from the exterior passive soil vapor probes, so theSumma canister data from the nearest exterior passive soilvapor probe was used as a baseline for comparison.
3. Results and discussion
The results of sampling at the Navy OTC site are shown in Table1. The compounds detected in the Summa canisters includedTCE and cis-1,2-DCE, in the range of 450 to 63 000 mg m�3. Thepassive sub-slab samplers had a low bias of about 10� to 100�relative to the active samples collected via Summa canister. Themagnitude of the low bias generally increased as the uptake rateof the sampler increased, which is consistent with expectations
This journal is © The Royal Society of Chemistry 2014
Paper Environmental Science: Processes & Impacts
Publ
ishe
d on
21
Janu
ary
2014
. Dow
nloa
ded
by U
nive
rsity
of
Wat
erlo
o on
02/
03/2
014
20:5
4:10
. View Article Online
from mathematical modeling.10 Based on these results, loweruptake rate samplers were used at the Layton House andNAS JAX.
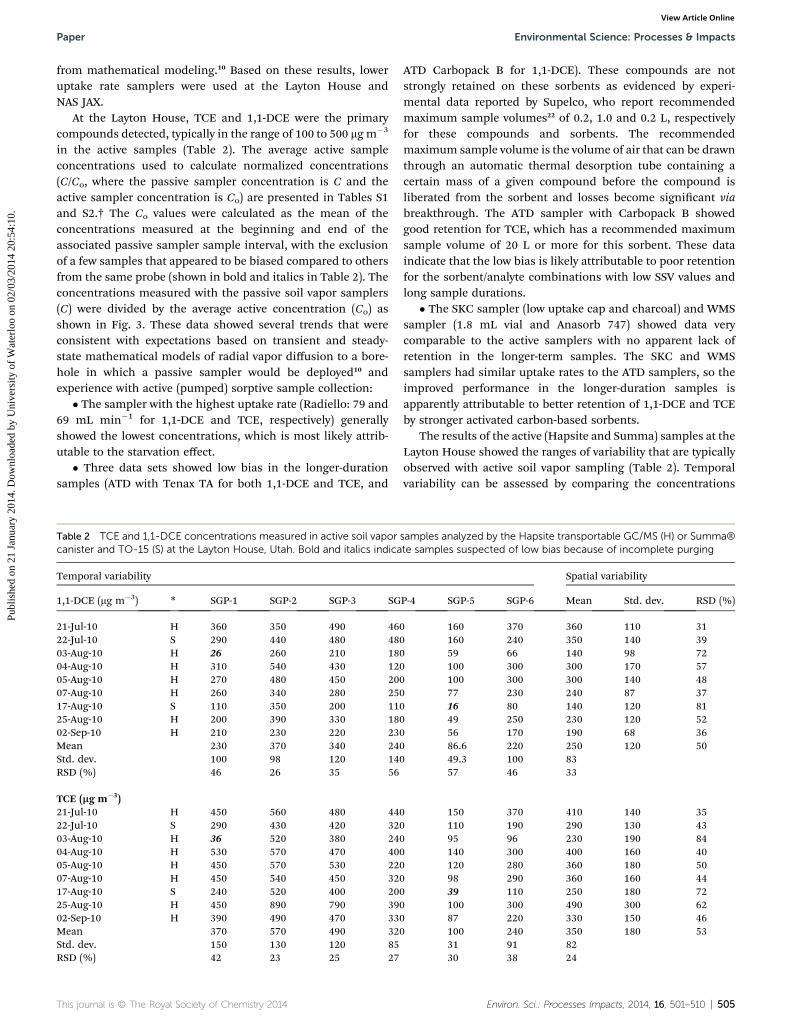
At the Layton House, TCE and 1,1-DCE were the primarycompounds detected, typically in the range of 100 to 500 mg m�3
in the active samples (Table 2). The average active sampleconcentrations used to calculate normalized concentrations(C/Co, where the passive sampler concentration is C and theactive sampler concentration is Co) are presented in Tables S1and S2.† The Co values were calculated as the mean of theconcentrations measured at the beginning and end of theassociated passive sampler sample interval, with the exclusionof a few samples that appeared to be biased compared to othersfrom the same probe (shown in bold and italics in Table 2). Theconcentrations measured with the passive soil vapor samplers(C) were divided by the average active concentration (Co) asshown in Fig. 3. These data showed several trends that wereconsistent with expectations based on transient and steady-state mathematical models of radial vapor diffusion to a bore-hole in which a passive sampler would be deployed10 andexperience with active (pumped) sorptive sample collection:
� The sampler with the highest uptake rate (Radiello: 79 and69 mL min�1 for 1,1-DCE and TCE, respectively) generallyshowed the lowest concentrations, which is most likely attrib-utable to the starvation effect.
� Three data sets showed low bias in the longer-durationsamples (ATD with Tenax TA for both 1,1-DCE and TCE, and
Table 2 TCE and 1,1-DCE concentrations measured in active soil vaporcanister and TO-15 (S) at the Layton House, Utah. Bold and italics indica
Temporal variability
1,1-DCE (mg m�3) * SGP-1 SGP-2 SGP-3 SG
21-Jul-10 H 360 350 490 4622-Jul-10 S 290 440 480 4803-Aug-10 H 26 260 210 1804-Aug-10 H 310 540 430 1205-Aug-10 H 270 480 450 2007-Aug-10 H 260 340 280 2517-Aug-10 S 110 350 200 1125-Aug-10 H 200 390 330 1802-Sep-10 H 210 230 220 23Mean 230 370 340 24Std. dev. 100 98 120 14RSD (%) 46 26 35 56
TCE (mg m�3)21-Jul-10 H 450 560 480 4422-Jul-10 S 290 430 420 3203-Aug-10 H 36 520 380 2404-Aug-10 H 530 570 470 4005-Aug-10 H 450 570 530 2207-Aug-10 H 450 540 450 3217-Aug-10 S 240 520 400 2025-Aug-10 H 450 890 790 3902-Sep-10 H 390 490 470 33Mean 370 570 490 32Std. dev. 150 130 120 85RSD (%) 42 23 25 27
This journal is © The Royal Society of Chemistry 2014
ATD Carbopack B for 1,1-DCE). These compounds are notstrongly retained on these sorbents as evidenced by experi-mental data reported by Supelco, who report recommendedmaximum sample volumes22 of 0.2, 1.0 and 0.2 L, respectivelyfor these compounds and sorbents. The recommendedmaximum sample volume is the volume of air that can be drawnthrough an automatic thermal desorption tube containing acertain mass of a given compound before the compound isliberated from the sorbent and losses become signicant viabreakthrough. The ATD sampler with Carbopack B showedgood retention for TCE, which has a recommended maximumsample volume of 20 L or more for this sorbent. These dataindicate that the low bias is likely attributable to poor retentionfor the sorbent/analyte combinations with low SSV values andlong sample durations.
� The SKC sampler (low uptake cap and charcoal) and WMSsampler (1.8 mL vial and Anasorb 747) showed data verycomparable to the active samplers with no apparent lack ofretention in the longer-term samples. The SKC and WMSsamplers had similar uptake rates to the ATD samplers, so theimproved performance in the longer-duration samples isapparently attributable to better retention of 1,1-DCE and TCEby stronger activated carbon-based sorbents.
The results of the active (Hapsite and Summa) samples at theLayton House showed the ranges of variability that are typicallyobserved with active soil vapor sampling (Table 2). Temporalvariability can be assessed by comparing the concentrations
samples analyzed by the Hapsite transportable GC/MS (H) or Summa®te samples suspected of low bias because of incomplete purging
Spatial variability
P-4 SGP-5 SGP-6 Mean Std. dev. RSD (%)
0 160 370 360 110 310 160 240 350 140 390 59 66 140 98 720 100 300 300 170 570 100 300 300 140 480 77 230 240 87 370 16 80 140 120 810 49 250 230 120 520 56 170 190 68 360 86.6 220 250 120 500 49.3 100 83
57 46 33
0 150 370 410 140 350 110 190 290 130 430 95 96 230 190 840 140 300 400 160 400 120 280 360 180 500 98 290 360 160 440 39 110 250 180 720 100 300 490 300 620 87 220 330 150 460 100 240 350 180 53
31 91 8230 38 24
Environ. Sci.: Processes Impacts, 2014, 16, 501–510 | 505
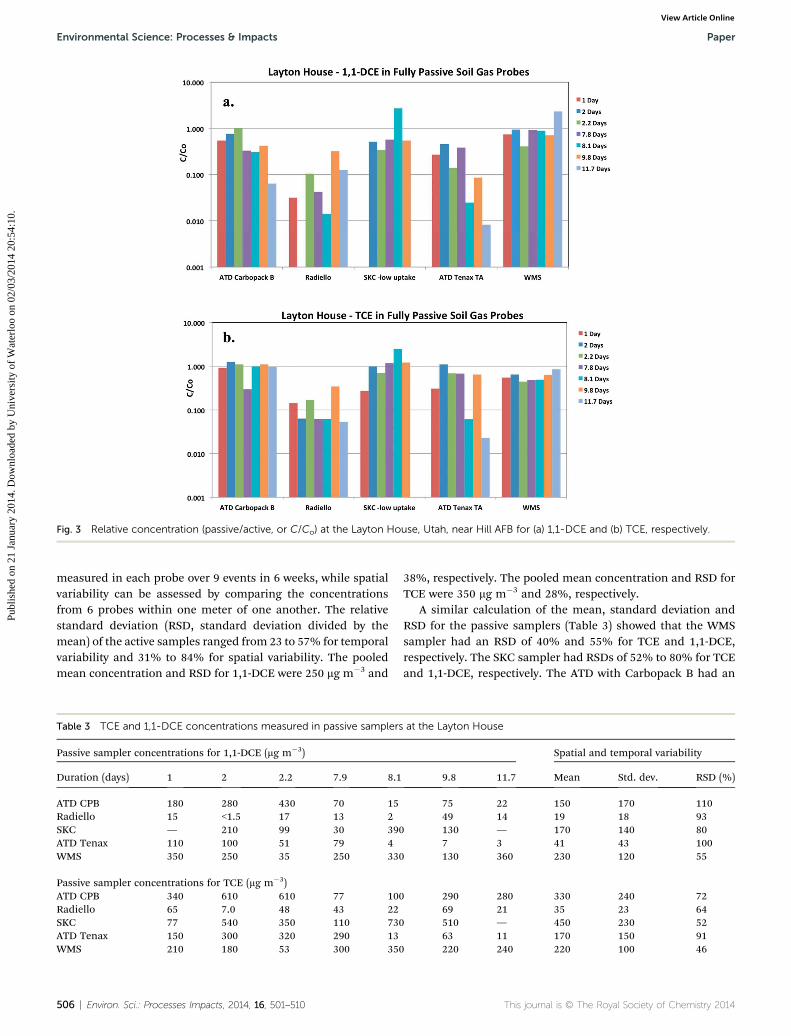
Fig. 3 Relative concentration (passive/active, or C/Co) at the Layton House, Utah, near Hill AFB for (a) 1,1-DCE and (b) TCE, respectively.
Environmental Science: Processes & Impacts Paper
Publ
ishe
d on
21
Janu
ary
2014
. Dow
nloa
ded
by U
nive
rsity
of
Wat
erlo
o on
02/
03/2
014
20:5
4:10
. View Article Online
measured in each probe over 9 events in 6 weeks, while spatialvariability can be assessed by comparing the concentrationsfrom 6 probes within one meter of one another. The relativestandard deviation (RSD, standard deviation divided by themean) of the active samples ranged from 23 to 57% for temporalvariability and 31% to 84% for spatial variability. The pooledmean concentration and RSD for 1,1-DCE were 250 mg m�3 and
Table 3 TCE and 1,1-DCE concentrations measured in passive samplers
Passive sampler concentrations for 1,1-DCE (mg m�3)
Duration (days) 1 2 2.2 7.9 8.1
ATD CPB 180 280 430 70 15Radiello 15 <1.5 17 13 2SKC — 210 99 30 390ATD Tenax 110 100 51 79 4WMS 350 250 35 250 330
Passive sampler concentrations for TCE (mg m�3)ATD CPB 340 610 610 77 100Radiello 65 7.0 48 43 22SKC 77 540 350 110 730ATD Tenax 150 300 320 290 13WMS 210 180 53 300 350
506 | Environ. Sci.: Processes Impacts, 2014, 16, 501–510
38%, respectively. The pooled mean concentration and RSD forTCE were 350 mg m�3 and 28%, respectively.
A similar calculation of the mean, standard deviation andRSD for the passive samplers (Table 3) showed that the WMSsampler had an RSD of 40% and 55% for TCE and 1,1-DCE,respectively. The SKC sampler had RSDs of 52% to 80% for TCEand 1,1-DCE, respectively. The ATD with Carbopack B had an
at the Layton House
Spatial and temporal variability
9.8 11.7 Mean Std. dev. RSD (%)
75 22 150 170 11049 14 19 18 93130 — 170 140 807 3 41 43 100130 360 230 120 55
290 280 330 240 7269 21 35 23 64510 — 450 230 5263 11 170 150 91220 240 220 100 46
This journal is © The Royal Society of Chemistry 2014
Paper Environmental Science: Processes & Impacts
Publ
ishe
d on
21
Janu
ary
2014
. Dow
nloa
ded
by U
nive
rsity
of
Wat
erlo
o on
02/
03/2
014
20:5
4:10
. View Article Online
RSD for TCE of 72%. These are all comparable to the activesampler variability, which is encouraging considering thepassive samples were collected in different probes, so each setincluded both spatial and temporal variability. The WMSsampler and SKC Ultra Low-Uptake samplers provided
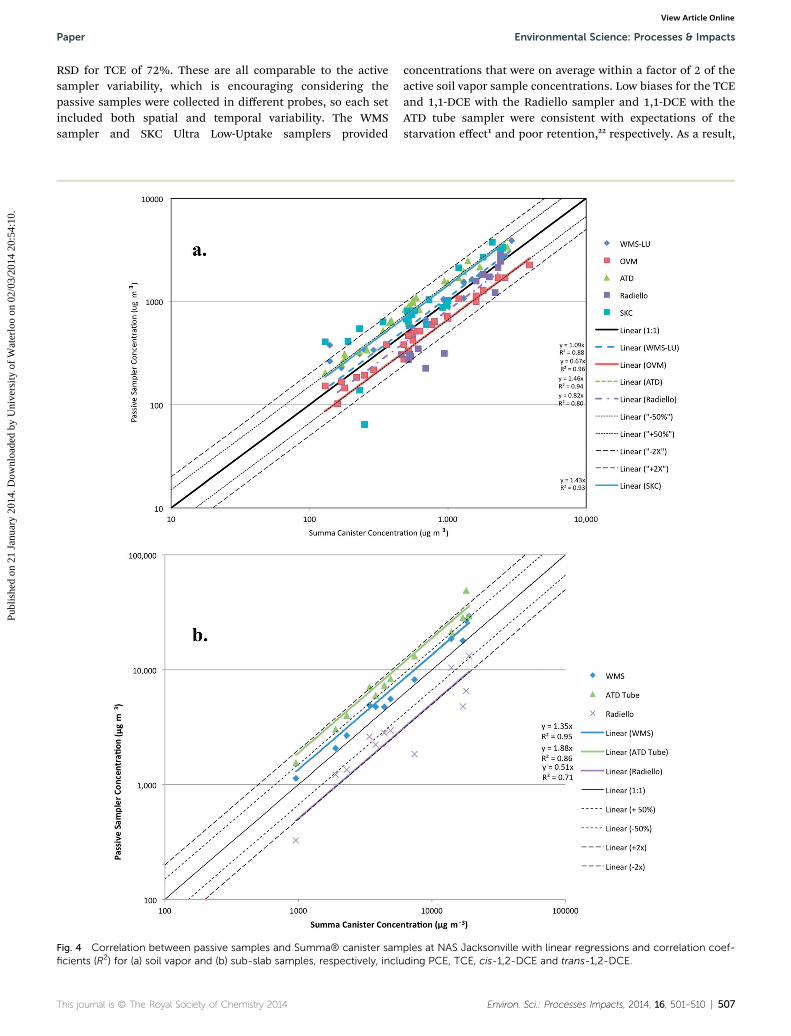
Fig. 4 Correlation between passive samples and Summa® canister samficients (R2) for (a) soil vapor and (b) sub-slab samples, respectively, inclu
This journal is © The Royal Society of Chemistry 2014
concentrations that were on average within a factor of 2 of theactive soil vapor sample concentrations. Low biases for the TCEand 1,1-DCE with the Radiello sampler and 1,1-DCE with theATD tube sampler were consistent with expectations of thestarvation effect1 and poor retention,22 respectively. As a result,
ples at NAS Jacksonville with linear regressions and correlation coef-ding PCE, TCE, cis-1,2-DCE and trans-1,2-DCE.
Environ. Sci.: Processes Impacts, 2014, 16, 501–510 | 507
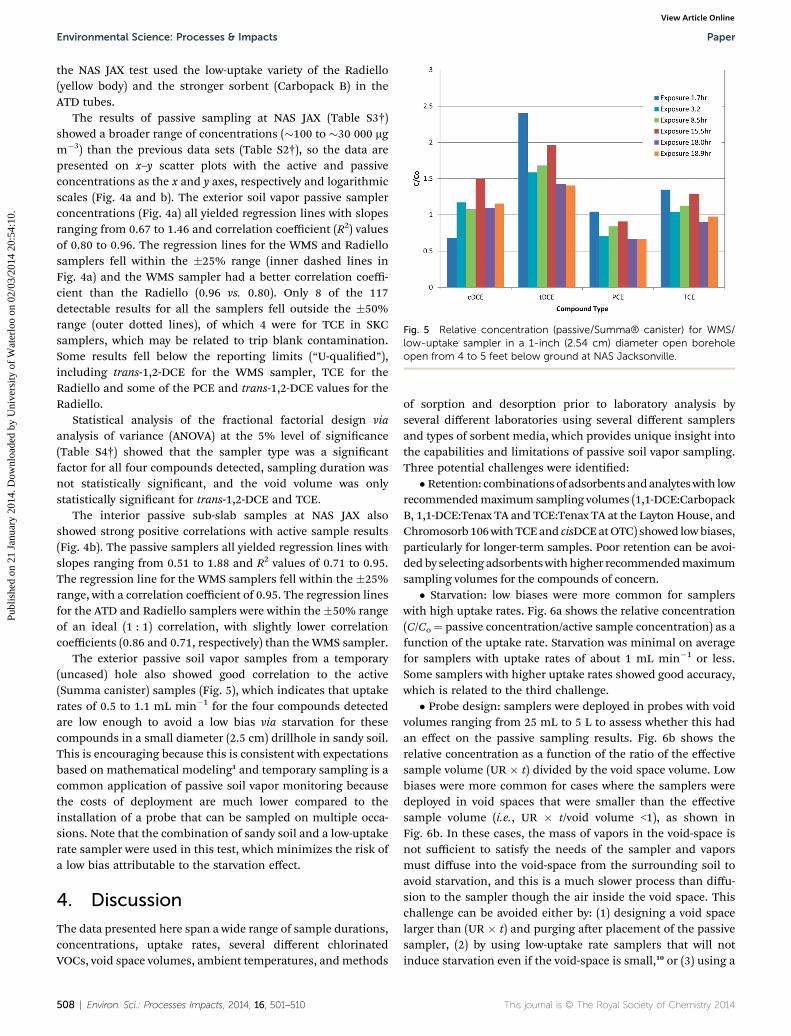
Fig. 5 Relative concentration (passive/Summa® canister) for WMS/low-uptake sampler in a 1-inch (2.54 cm) diameter open boreholeopen from 4 to 5 feet below ground at NAS Jacksonville.
Environmental Science: Processes & Impacts Paper
Publ
ishe
d on
21
Janu
ary
2014
. Dow
nloa
ded
by U
nive
rsity
of
Wat
erlo
o on
02/
03/2
014
20:5
4:10
. View Article Online
the NAS JAX test used the low-uptake variety of the Radiello(yellow body) and the stronger sorbent (Carbopack B) in theATD tubes.
The results of passive sampling at NAS JAX (Table S3†)showed a broader range of concentrations (�100 to �30 000 mgm�3) than the previous data sets (Table S2†), so the data arepresented on x–y scatter plots with the active and passiveconcentrations as the x and y axes, respectively and logarithmicscales (Fig. 4a and b). The exterior soil vapor passive samplerconcentrations (Fig. 4a) all yielded regression lines with slopesranging from 0.67 to 1.46 and correlation coefficient (R2) valuesof 0.80 to 0.96. The regression lines for the WMS and Radiellosamplers fell within the �25% range (inner dashed lines inFig. 4a) and the WMS sampler had a better correlation coeffi-cient than the Radiello (0.96 vs. 0.80). Only 8 of the 117detectable results for all the samplers fell outside the �50%range (outer dotted lines), of which 4 were for TCE in SKCsamplers, which may be related to trip blank contamination.Some results fell below the reporting limits (“U-qualied”),including trans-1,2-DCE for the WMS sampler, TCE for theRadiello and some of the PCE and trans-1,2-DCE values for theRadiello.
Statistical analysis of the fractional factorial design viaanalysis of variance (ANOVA) at the 5% level of signicance(Table S4†) showed that the sampler type was a signicantfactor for all four compounds detected, sampling duration wasnot statistically signicant, and the void volume was onlystatistically signicant for trans-1,2-DCE and TCE.
The interior passive sub-slab samples at NAS JAX alsoshowed strong positive correlations with active sample results(Fig. 4b). The passive samplers all yielded regression lines withslopes ranging from 0.51 to 1.88 and R2 values of 0.71 to 0.95.The regression line for the WMS samplers fell within the �25%range, with a correlation coefficient of 0.95. The regression linesfor the ATD and Radiello samplers were within the �50% rangeof an ideal (1 : 1) correlation, with slightly lower correlationcoefficients (0.86 and 0.71, respectively) than the WMS sampler.
The exterior passive soil vapor samples from a temporary(uncased) hole also showed good correlation to the active(Summa canister) samples (Fig. 5), which indicates that uptakerates of 0.5 to 1.1 mL min�1 for the four compounds detectedare low enough to avoid a low bias via starvation for thesecompounds in a small diameter (2.5 cm) drillhole in sandy soil.This is encouraging because this is consistent with expectationsbased on mathematical modeling1 and temporary sampling is acommon application of passive soil vapor monitoring becausethe costs of deployment are much lower compared to theinstallation of a probe that can be sampled on multiple occa-sions. Note that the combination of sandy soil and a low-uptakerate sampler were used in this test, which minimizes the risk ofa low bias attributable to the starvation effect.
4. Discussion
The data presented here span a wide range of sample durations,concentrations, uptake rates, several different chlorinatedVOCs, void space volumes, ambient temperatures, andmethods
508 | Environ. Sci.: Processes Impacts, 2014, 16, 501–510
of sorption and desorption prior to laboratory analysis byseveral different laboratories using several different samplersand types of sorbent media, which provides unique insight intothe capabilities and limitations of passive soil vapor sampling.Three potential challenges were identied:
� Retention: combinations of adsorbents andanalyteswith lowrecommendedmaximum sampling volumes (1,1-DCE:CarbopackB, 1,1-DCE:Tenax TA and TCE:Tenax TA at the Layton House, andChromosorb 106withTCEand cisDCEatOTC) showed lowbiases,particularly for longer-term samples. Poor retention can be avoi-dedby selecting adsorbentswithhigher recommendedmaximumsampling volumes for the compounds of concern.
� Starvation: low biases were more common for samplerswith high uptake rates. Fig. 6a shows the relative concentration(C/Co ¼ passive concentration/active sample concentration) as afunction of the uptake rate. Starvation was minimal on averagefor samplers with uptake rates of about 1 mL min�1 or less.Some samplers with higher uptake rates showed good accuracy,which is related to the third challenge.
� Probe design: samplers were deployed in probes with voidvolumes ranging from 25 mL to 5 L to assess whether this hadan effect on the passive sampling results. Fig. 6b shows therelative concentration as a function of the ratio of the effectivesample volume (UR � t) divided by the void space volume. Lowbiases were more common for cases where the samplers weredeployed in void spaces that were smaller than the effectivesample volume (i.e., UR � t/void volume <1), as shown inFig. 6b. In these cases, the mass of vapors in the void-space isnot sufficient to satisfy the needs of the sampler and vaporsmust diffuse into the void-space from the surrounding soil toavoid starvation, and this is a much slower process than diffu-sion to the sampler though the air inside the void space. Thischallenge can be avoided either by: (1) designing a void spacelarger than (UR � t) and purging aer placement of the passivesampler, (2) by using low-uptake rate samplers that will notinduce starvation even if the void-space is small,10 or (3) using a
This journal is © The Royal Society of Chemistry 2014
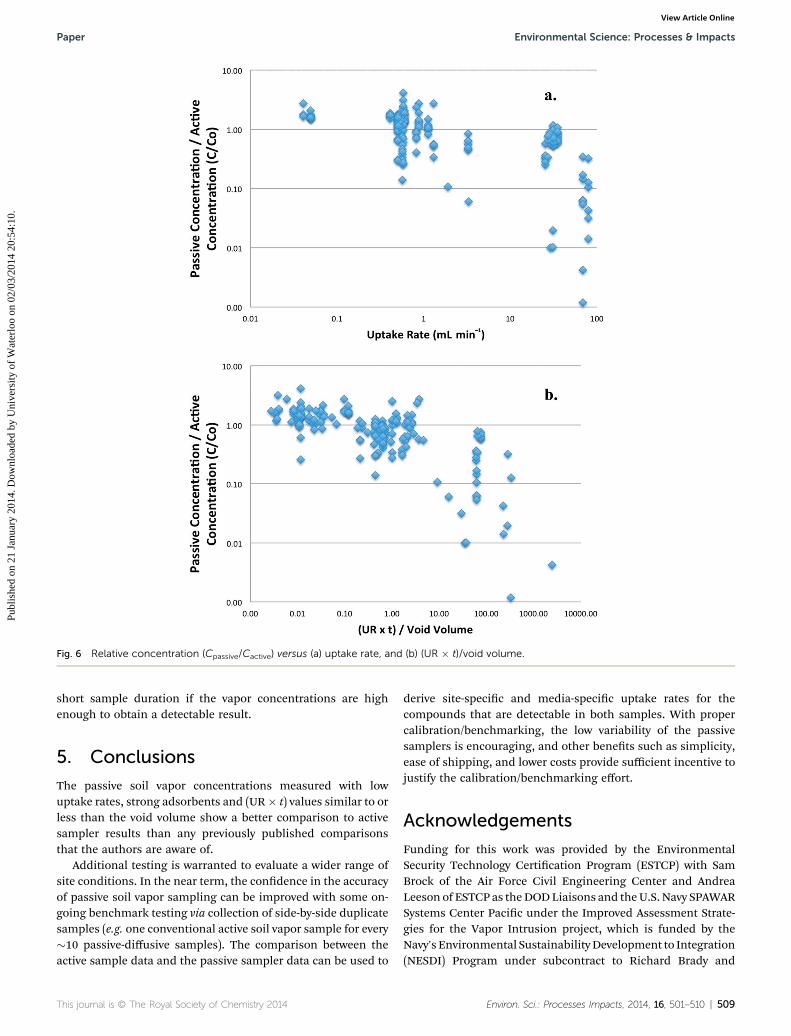
Fig. 6 Relative concentration (Cpassive/Cactive) versus (a) uptake rate, and (b) (UR � t)/void volume.
Paper Environmental Science: Processes & Impacts
Publ
ishe
d on
21
Janu
ary
2014
. Dow
nloa
ded
by U
nive
rsity
of
Wat
erlo
o on
02/
03/2
014
20:5
4:10
. View Article Online
short sample duration if the vapor concentrations are highenough to obtain a detectable result.
5. Conclusions
The passive soil vapor concentrations measured with lowuptake rates, strong adsorbents and (UR� t) values similar to orless than the void volume show a better comparison to activesampler results than any previously published comparisonsthat the authors are aware of.
Additional testing is warranted to evaluate a wider range ofsite conditions. In the near term, the condence in the accuracyof passive soil vapor sampling can be improved with some on-going benchmark testing via collection of side-by-side duplicatesamples (e.g. one conventional active soil vapor sample for every�10 passive-diffusive samples). The comparison between theactive sample data and the passive sampler data can be used to
This journal is © The Royal Society of Chemistry 2014
derive site-specic and media-specic uptake rates for thecompounds that are detectable in both samples. With propercalibration/benchmarking, the low variability of the passivesamplers is encouraging, and other benets such as simplicity,ease of shipping, and lower costs provide sufficient incentive tojustify the calibration/benchmarking effort.
Acknowledgements
Funding for this work was provided by the EnvironmentalSecurity Technology Certication Program (ESTCP) with SamBrock of the Air Force Civil Engineering Center and AndreaLeeson of ESTCP as theDODLiaisons and theU.S. Navy SPAWARSystems Center Pacic under the Improved Assessment Strate-gies for the Vapor Intrusion project, which is funded by theNavy's Environmental SustainabilityDevelopment to Integration(NESDI) Program under subcontract to Richard Brady and
Environ. Sci.: Processes Impacts, 2014, 16, 501–510 | 509
Environmental Science: Processes & Impacts Paper
Publ
ishe
d on
21
Janu
ary
2014
. Dow
nloa
ded
by U
nive
rsity
of
Wat
erlo
o on
02/
03/2
014
20:5
4:10
. View Article Online
Associates and Computer Sciences Corporation with BartChadwick and Ignacio Rivera-Duarte as contracting officers. Wegratefully acknowledge Arizona State University and Mike Sin-gletary of Naval Air Station Jacksonville for assistance and siteaccess for sample collection and Caterina Boaretto of Fonda-zione SalvatoreMaugeri forGCanalysis of theRadiello samplers.
References
1 T. Gorecki and J. Namiesnik, TrAC, Trends Anal. Chem., 2002,21, 276–291.
2 Environmental Technology Verication Report, Soil GasSampling Technology, W. L. Gore & Associates, Inc., GORE-SORBER Screening Survey, U.S. EPA Office of Research andDevelopment, EPA/600/R-98/095, 1998.
3 Beacon, 2013, http://www.beacon-usa.com/services/passive-soil-gas-surveys/, accessed on December 26, 2013.
4 Environmental Technology Verication Report, Soil GasSampling Technology, Quadrel Services, Inc., EMFLUX SoilGas System, U.S. EPA Office of Research and Development,EPA/600/R-98/096, 1998.
5 D. C. Gomes, M. Alarsa, M. C. Salvador and C. Kupferschmid,Water Sci. Technol., 1994, 29, 161.
6 M. Anderson and G. Church, J. Environ. Eng., 1998, 124, 555.7 ASTM Standard D7758, New Practice for Passive Soil GasSampling in the Vadose Zone for Source Identication, SpatialVariability Assessment, Monitoring and Vapor IntrusionEvaluations, ASTM International, West Conshohocken, PA,http//:www.astm.org, 2011.
8 Final Guidance for the Evaluation and Mitigation of SubsurfaceVapor Intrusion to Indoor Air (Vapor Intrusion Guidance),California Environmental Protection Agency/Department ofToxic Substances Control (EPA/DTSC), October 2011.
9 Vapor Intrusion Pathway: A Practical Guideline, InterstateTechnology and Regulatory Council (ITRC), 2007, http://www.itrcweb.org/Documents/VI-1.pdf.
10 T. A. McAlary, X. Wang, A. Unger, H. Groenevelt andT. Gorecki, Quantitative passive soil vapor sampling for
510 | Environ. Sci.: Processes Impacts, 2014, 16, 501–510
VOCs- part 1: theory, Environ. Sci.: Processes Impacts, DOI:10.1039/c3em00652b.
11 T. A. McAlary, H. Groenevelt, S. Seethapathy, P. Sacco,D. Crump, M. Tuday, B. Schumacher, H. Hayes, P. Johnsonand T. Gorecki, Quantitative passive soil vapor samplingfor VOCs- part 2: laboratory experiments, Environ. Sci.:Processes Impacts, 2014, DOI: 10.1039/c3em00128h.
12 K. Bergemalm-Rynell, B. Strandberg, E. Andersson andG. Sallsten, J. Environ. Monit., 2008, 10, 1172–1178.
13 V. Cocheo, C. Boaretto and P. Sacco, Am. Ind. Hyg. Assoc. J.,1996, 57, 897–904.
14 J. T. Purdham, A. M. Sass-Kortsak and P. R. Bozek, Ann.Occup. Hyg., 1994, 38, 721–740.
15 S. Seethapathy and T. Gorecki, J. Chromatogr. A, 2011, 1218,143–155.
16 S. Seethapathy and T. Gorecki, J. Chromatogr. A, 2010, 1217,7907–7913.
17 S. Batterman, T. Metts and P. Kalliokoski, J. Environ. Monit.,2002, 4, 870–878.
18 V. M. Brown, D. R. Crump and D. Gardiner, Environ.Technol., 1992, 13, 367–375.
19 USEPAOn-LineTool for SiteAssessmentCalculation–DiffusionCoefficients, http://www.epa.gov/athens/learn2model/part-two/onsite/estdiffusion.html.
20 Compendium of Methods for the Determination of ToxicOrganic Compounds in Ambient Air, 2nd edn, CompendiumMethod TO-15-Determination of Volatile OrganicCompounds (VOCs), In Air Collected, In Specially-PreparedCanisters and Analyzed by Gas Chromatography/MassSpectrometry (GC/MS), Center for Environmental Research,Information Office of Research and Development, U.S.EPA, Cincinnati, OH, January 1999, EPA/625/R-96/010b.
21 D. C. Montgomery, Design and Analysis of Experiments, JohnWiley & Sons, Inc., Hoboken, NJ, 7th edn, 2009, 656 pp.
22 A Tool for Selecting an Adsorbent for Thermal DesorptionApplications, http://www.sigmaaldrich.com/etc/medialib/docs/Supelco/General_Information/t402025.Par.0001.File.tmp/t402025.pdf, accessed December 30, 2013.
This journal is © The Royal Society of Chemistry 2014
Related Documents