QUANTITATIVE LITERACY ASSESSMENT Eric Gaze Semra Kilic-Bahi Linda Misener Bowdoin College Colby-Sawyer College S. Maine Community College What is QL? QL vs. Math Assessment The Bowdoin Story The Colby-Sawyer Story The SMCC Story

Quantitative Literacy assessment
Dec 31, 2015
What is QL? QL vs. Math Assessment The Bowdoin Story The Colby-Sawyer Story The SMCC Story. Eric Gaze Semra Kilic-Bahi Linda Misener Bowdoin College Colby-Sawyer College S. Maine Community College. Quantitative Literacy assessment. - PowerPoint PPT Presentation
Welcome message from author
This document is posted to help you gain knowledge. Please leave a comment to let me know what you think about it! Share it to your friends and learn new things together.
Transcript
QUANTITATIVE LITERACY ASSESSMENT
Eric Gaze Semra Kilic-Bahi Linda MisenerBowdoin College Colby-Sawyer College S. Maine Community College
What is QL? QL vs. Math Assessment The Bowdoin Story The Colby-Sawyer
Story The SMCC Story
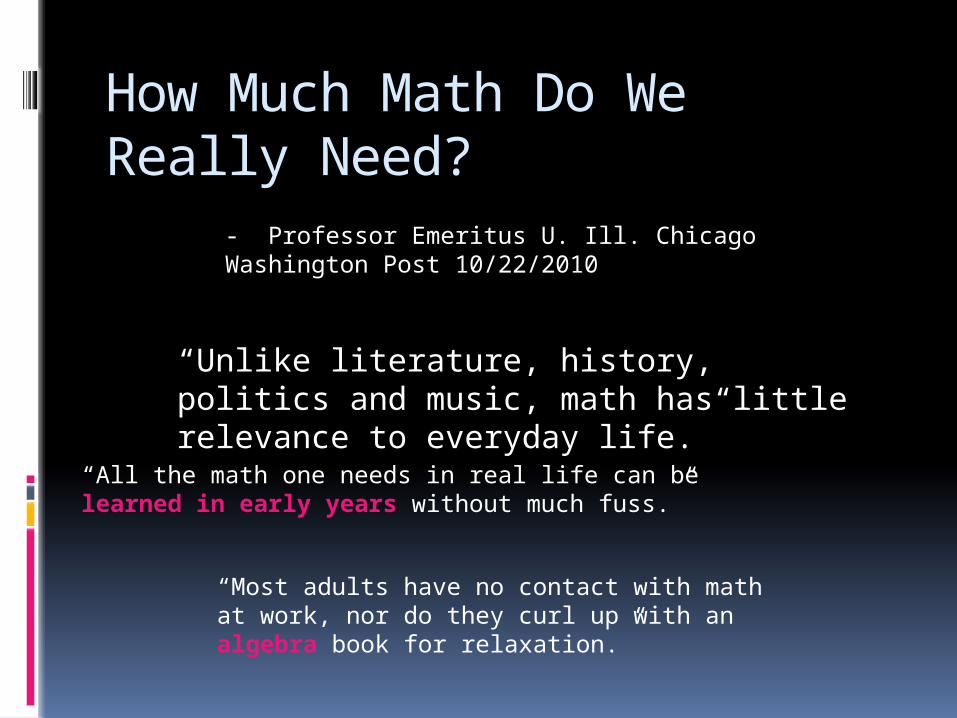
How Much Math Do We Really Need?
- Professor Emeritus U. Ill. Chicago Washington Post 10/22/2010
“Unlike literature, history, politics and music, math has little relevance to everyday life.”
“All the math one needs in real life can be learned in early years without much fuss.”
“Most adults have no contact with math at work, nor do they curl up with an algebra book for relaxation.”
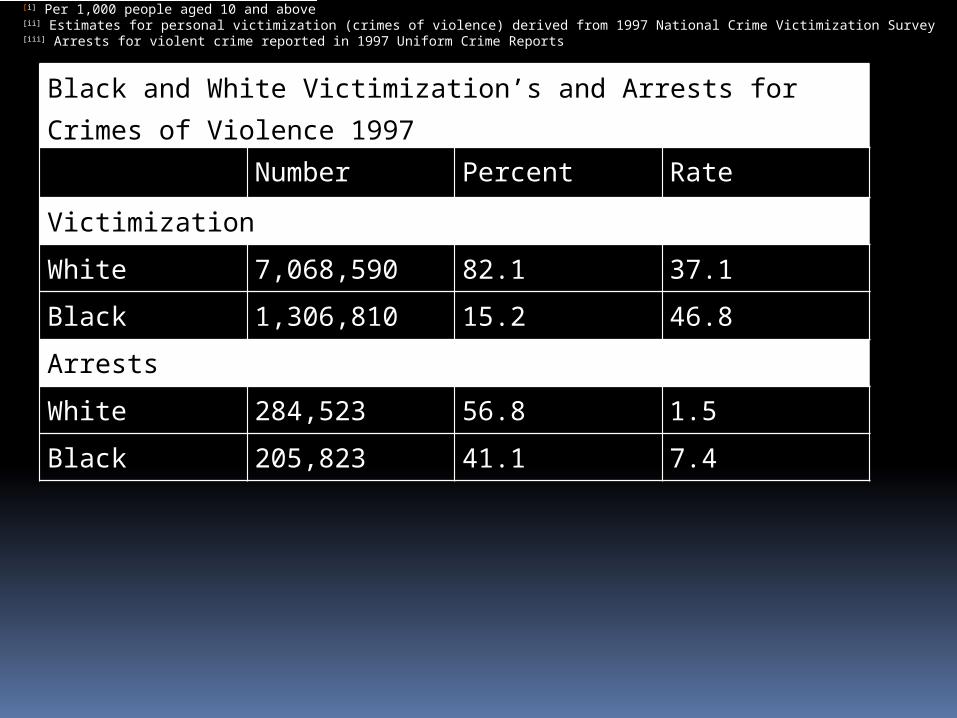
Black and White Victimization’s and Arrests for Crimes of Violence 1997
Number Percent Rate
Victimization
White 7,068,590 82.1 37.1
Black 1,306,810 15.2 46.8
Arrests
White 284,523 56.8 1.5
Black 205,823 41.1 7.4
[i] Per 1,000 people aged 10 and above[ii] Estimates for personal victimization (crimes of violence) derived from 1997 National Crime Victimization Survey[iii] Arrests for violent crime reported in 1997 Uniform Crime Reports
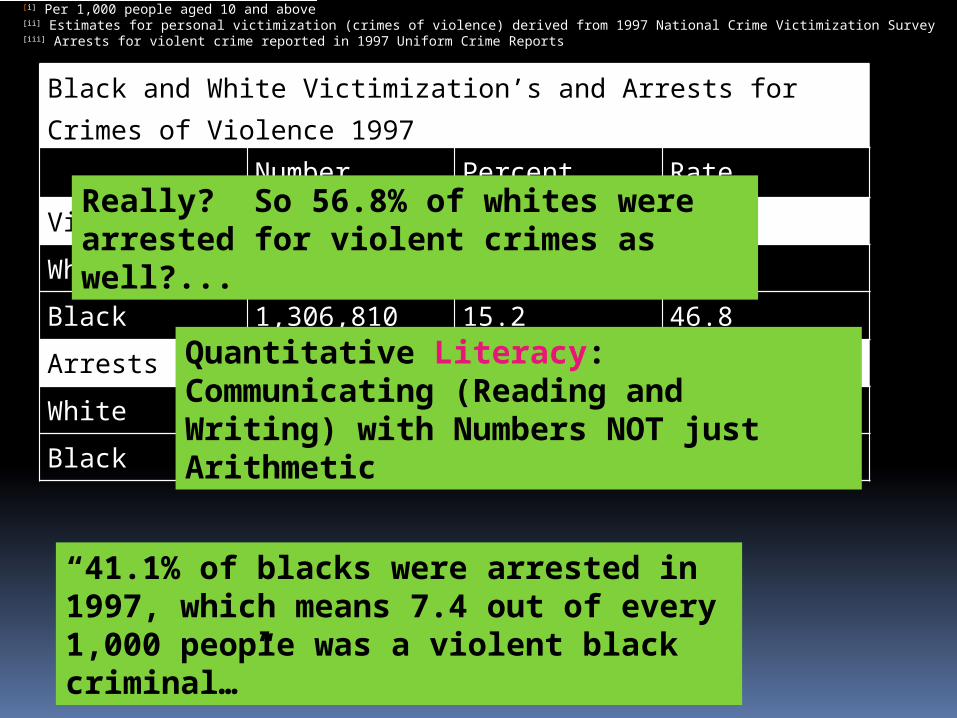
“41.1% of blacks were arrested in 1997, which means 7.4 out of every 1,000 people was a violent black criminal…”
Really? So 56.8% of whites were arrested for violent crimes as well?...
Quantitative Literacy: Communicating (Reading and Writing) with Numbers NOT just Arithmetic
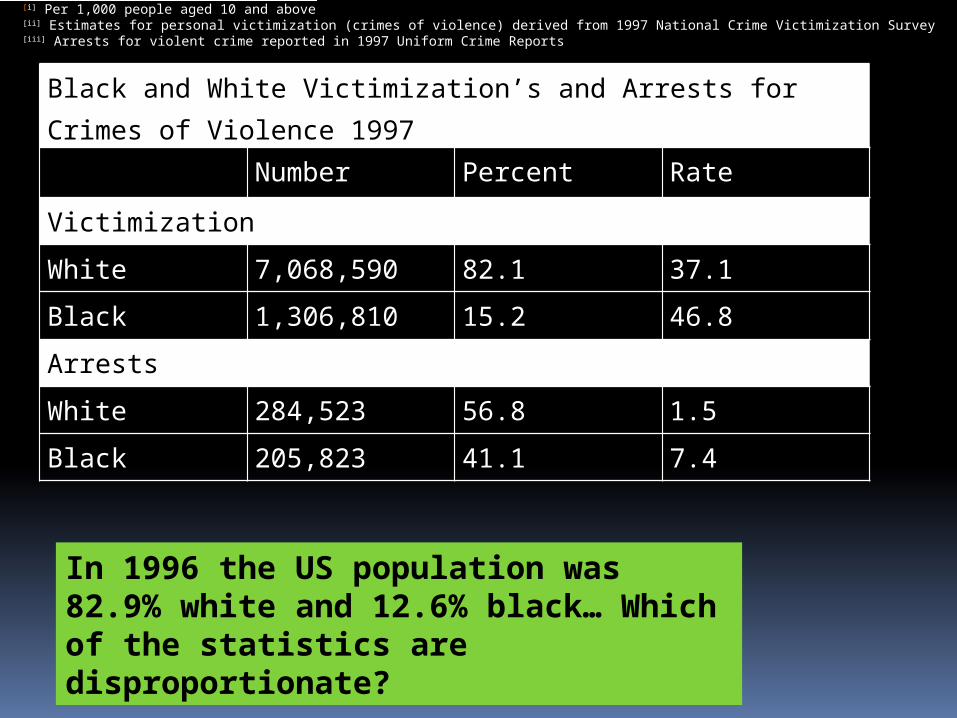
Black and White Victimization’s and Arrests for Crimes of Violence 1997
Number Percent Rate
Victimization
White 7,068,590 82.1 37.1
Black 1,306,810 15.2 46.8
Arrests
White 284,523 56.8 1.5
Black 205,823 41.1 7.4
[i] Per 1,000 people aged 10 and above[ii] Estimates for personal victimization (crimes of violence) derived from 1997 National Crime Victimization Survey[iii] Arrests for violent crime reported in 1997 Uniform Crime Reports
In 1996 the US population was 82.9% white and 12.6% black… Which of the statistics are disproportionate?
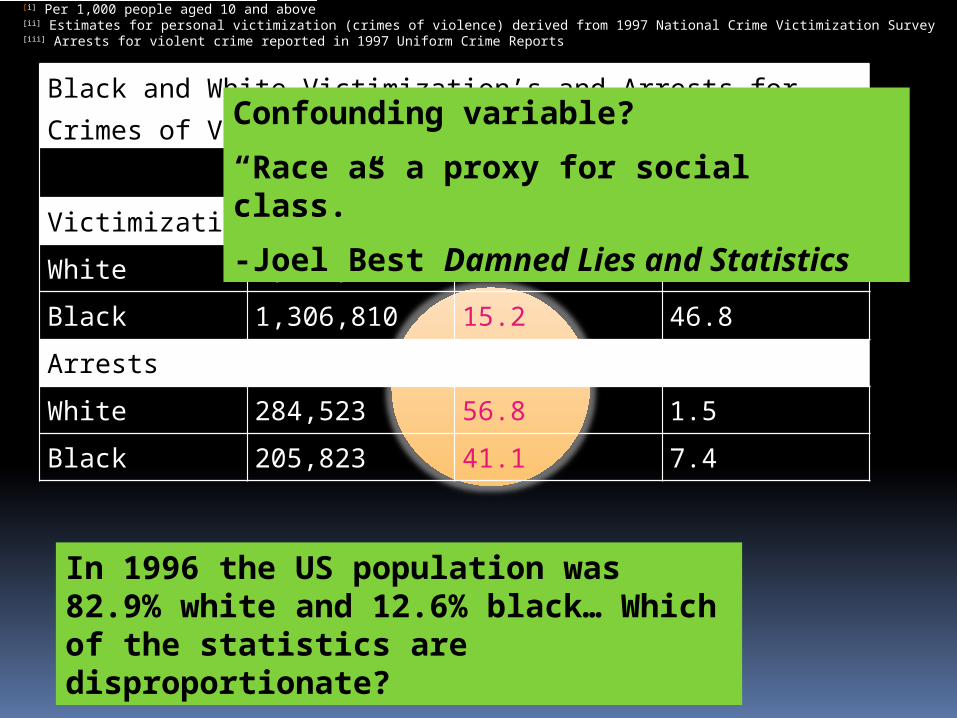
Confounding variable?
“Race as a proxy for social class.”
-Joel Best Damned Lies and Statistics
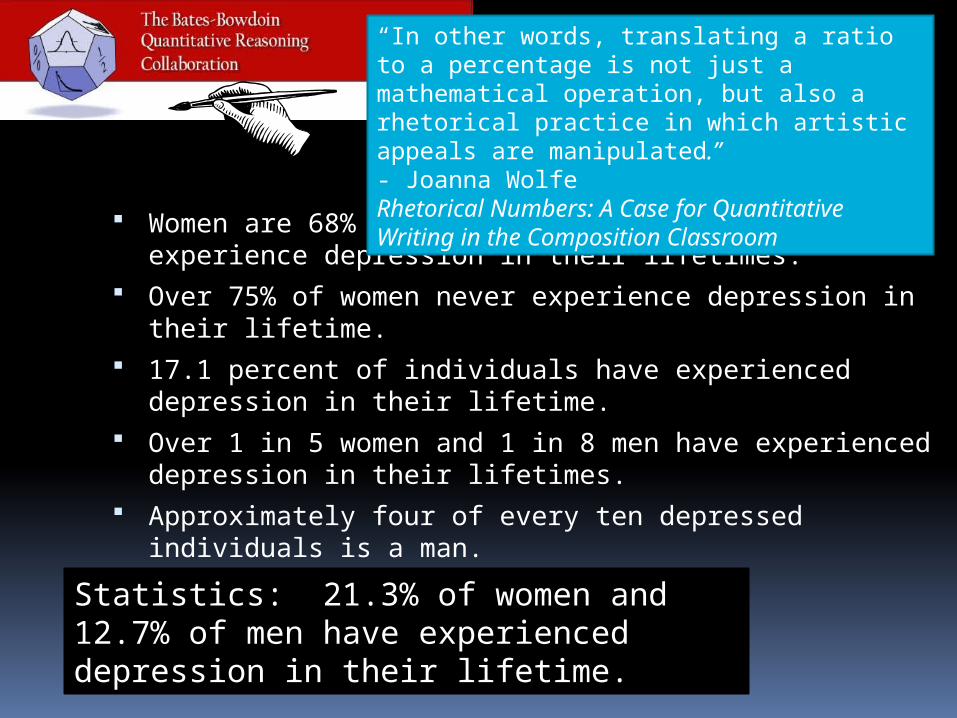
Women are 68% percent more likely than men to experience depression in their lifetimes.
Over 75% of women never experience depression in their lifetime.
17.1 percent of individuals have experienced depression in their lifetime.
Over 1 in 5 women and 1 in 8 men have experienced depression in their lifetimes.
Approximately four of every ten depressed individuals is a man.
“In other words, translating a ratio to a percentage is not just a mathematical operation, but also a rhetorical practice in which artistic appeals are manipulated.” - Joanna WolfeRhetorical Numbers: A Case for Quantitative Writing in the Composition Classroom
Statistics: 21.3% of women and 12.7% of men have experienced depression in their lifetime.
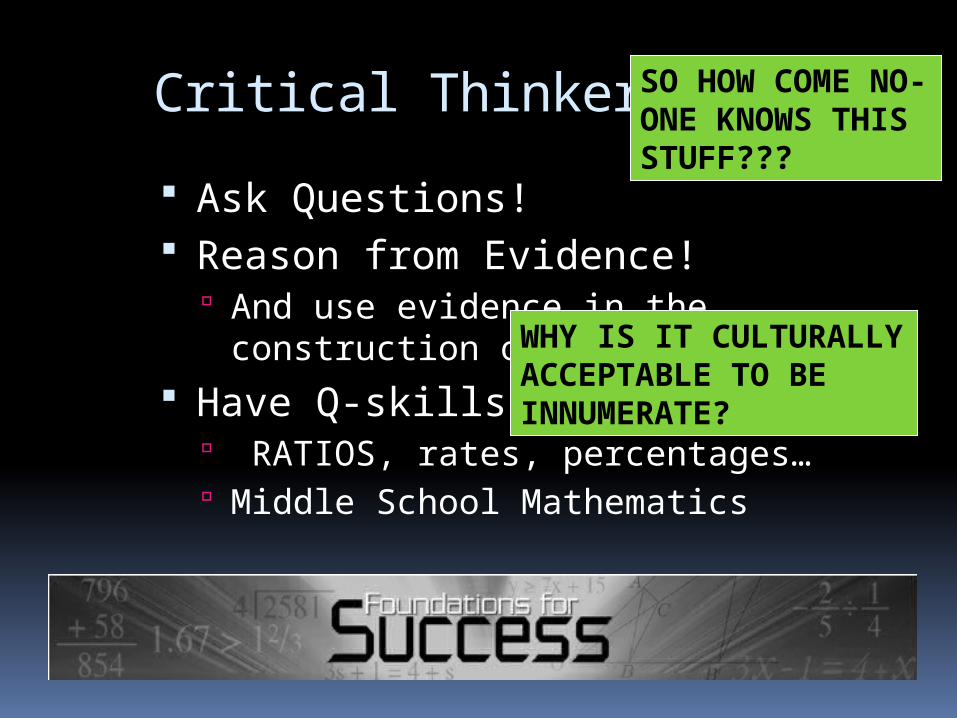
Critical Thinkers:
Ask Questions! Reason from Evidence!
And use evidence in the construction of argumentation
Have Q-skills! RATIOS, rates, percentages… Middle School Mathematics
SO HOW COME NO-ONE KNOWS THIS STUFF???
WHY IS IT CULTURALLY ACCEPTABLE TO BE INNUMERATE?
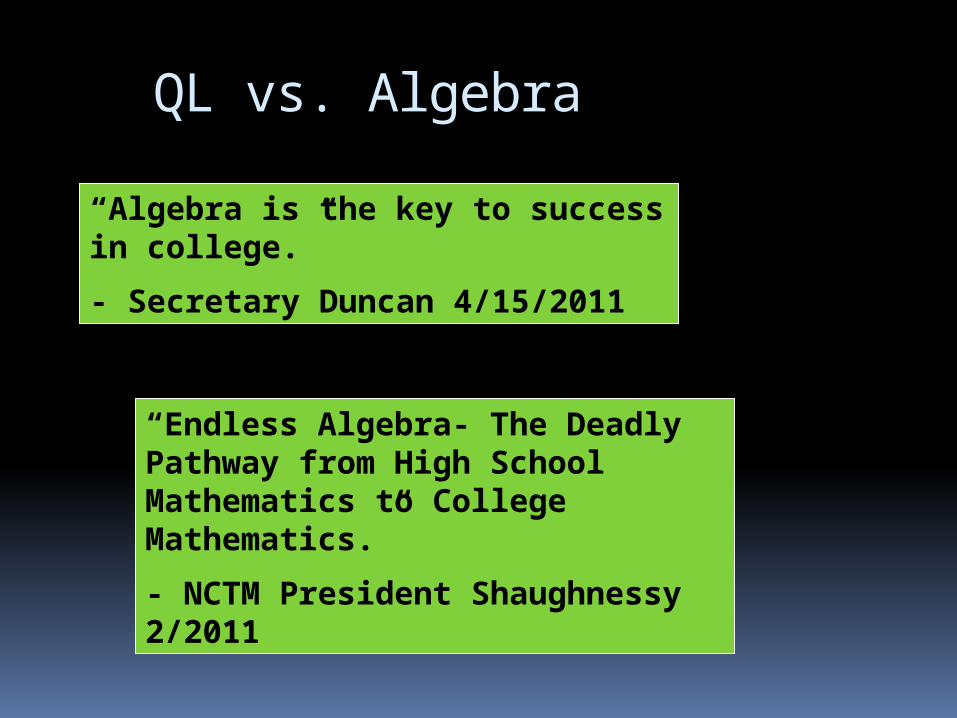
QL vs. Algebra
“Algebra is the key to success in college.”
- Secretary Duncan 4/15/2011
“Endless Algebra- The Deadly Pathway from High School Mathematics to College Mathematics.”
- NCTM President Shaughnessy 2/2011
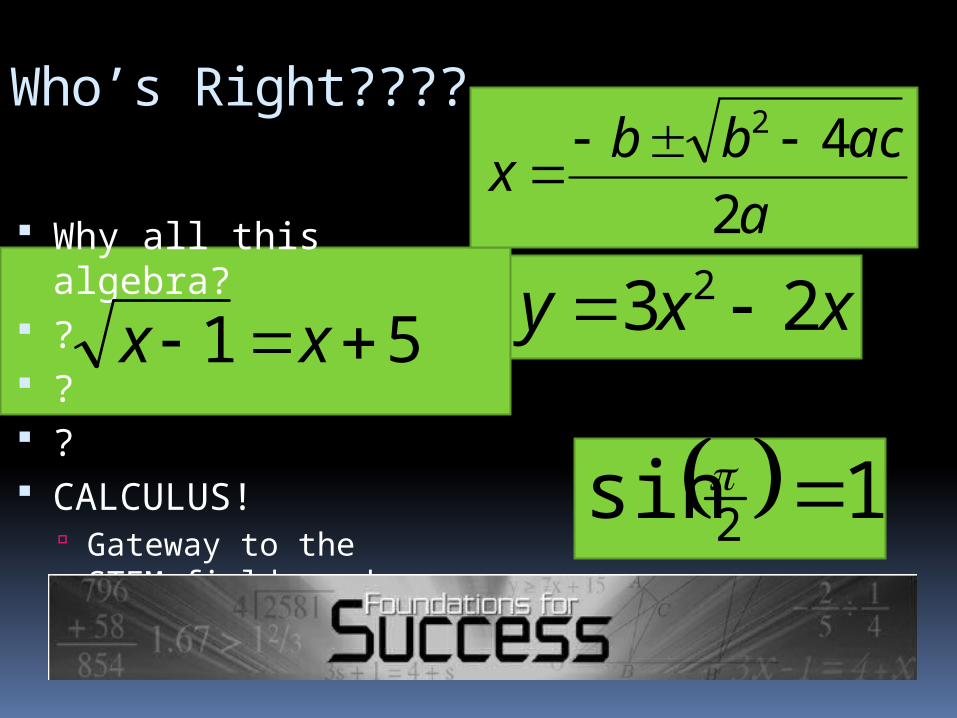
Who’s Right????
Why all this algebra?
? ? ? CALCULUS!
Gateway to the STEM fields and beyond!
623 2 xxy51 xx
1sin 2
a
acbbx
2
42
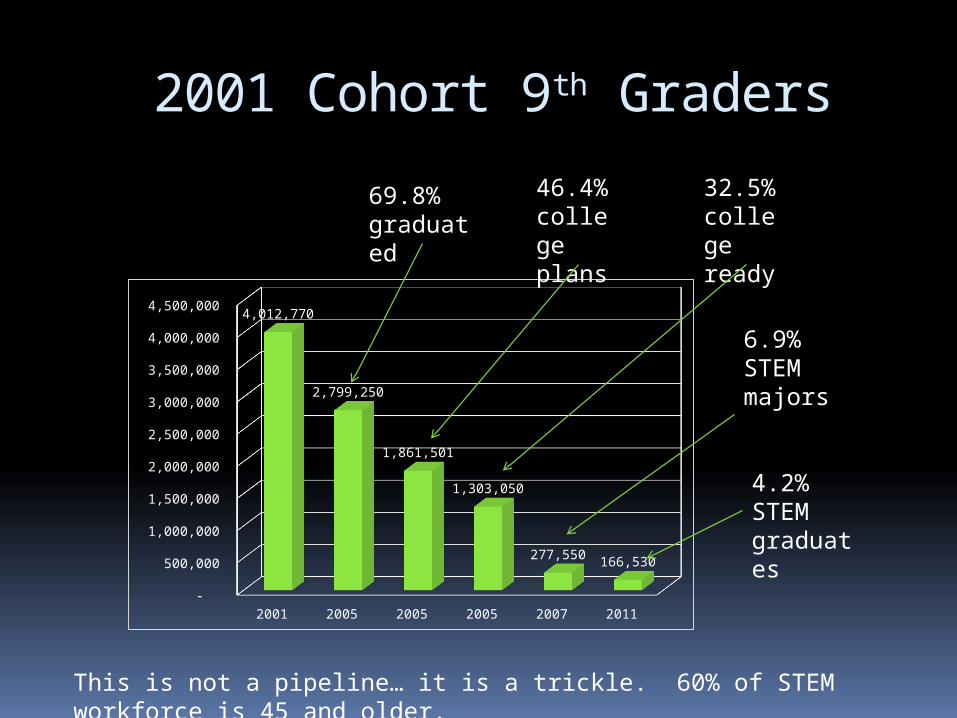
2001 Cohort 9th Graders
2001 2005 2005 2005 2007 2011 -
500,000
1,000,000
1,500,000
2,000,000
2,500,000
3,000,000
3,500,000
4,000,000
4,500,000 4,012,770
2,799,250
1,861,501
1,303,050
277,550 166,530
4.2%STEM graduates
69.8% graduated
46.4% college plans
32.5% college ready
6.9% STEM majors
This is not a pipeline… it is a trickle. 60% of STEM workforce is 45 and older.
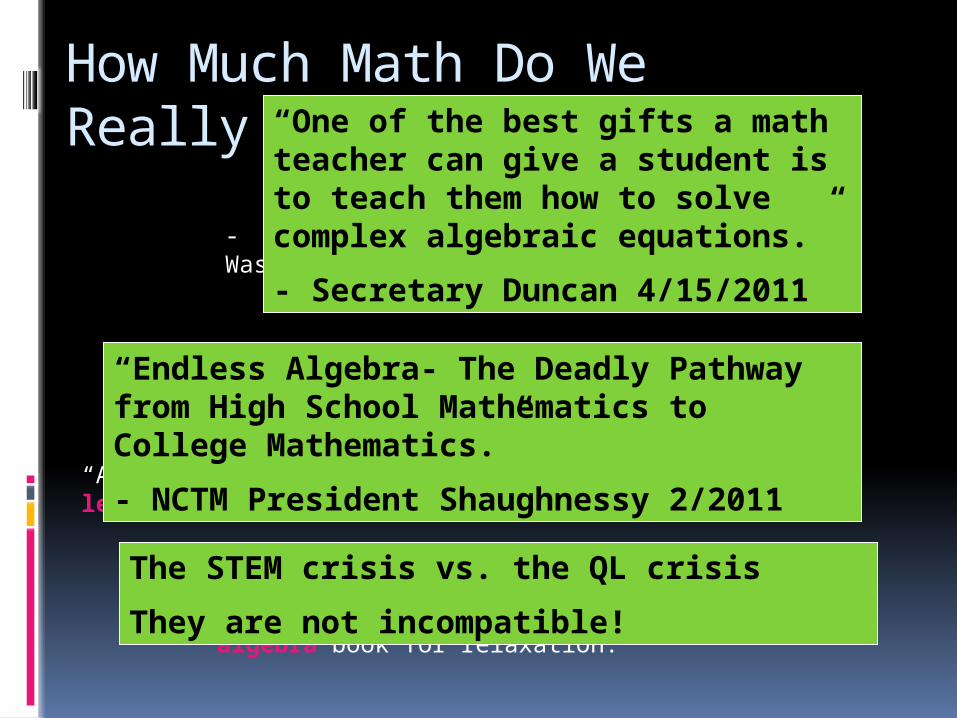
How Much Math Do We Really Need?
- Professor Emeritus U. Ill. Chicago Washington Post 10/22/2010
“Unlike literature, history, politics and music, math has little relevance to everyday life.”
“All the math one needs in real life can be learned in early years without much fuss.”
“Most adults have no contact with math at work, nor do they curl up with an algebra book for relaxation.”
“One of the best gifts a math teacher can give a student is to teach them how to solve complex algebraic equations.”
- Secretary Duncan 4/15/2011
“Endless Algebra- The Deadly Pathway from High School Mathematics to College Mathematics.”
- NCTM President Shaughnessy 2/2011
The STEM crisis vs. the QL crisis
They are not incompatible!
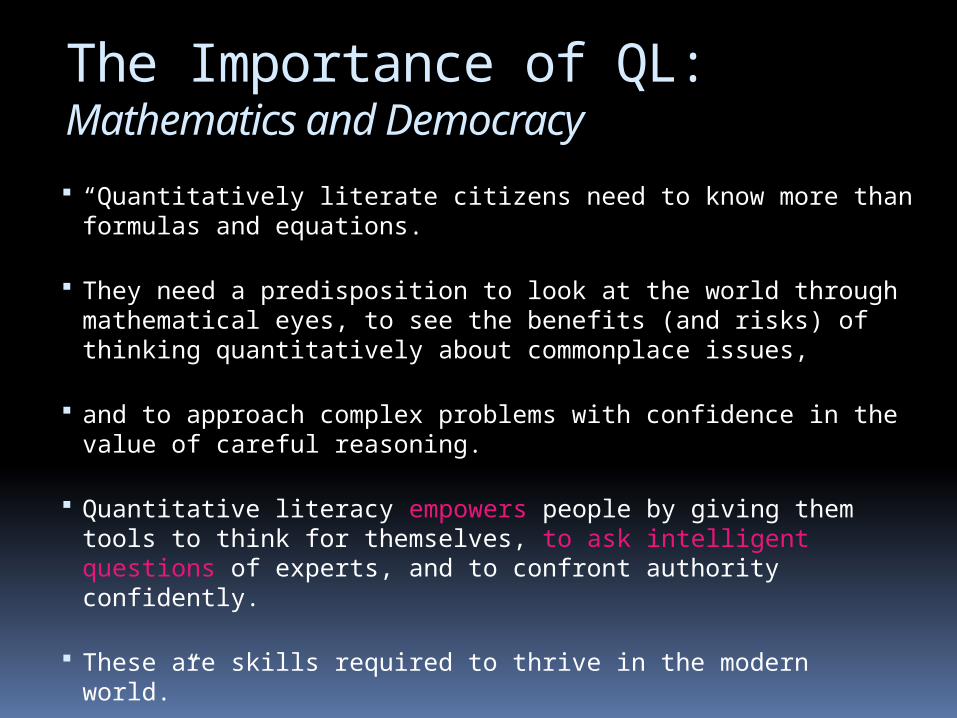
The Importance of QL: Mathematics and Democracy
“Quantitatively literate citizens need to know more than formulas and equations.
They need a predisposition to look at the world through mathematical eyes, to see the benefits (and risks) of thinking quantitatively about commonplace issues,
and to approach complex problems with confidence in the value of careful reasoning.
Quantitative literacy empowers people by giving them tools to think for themselves, to ask intelligent questions of experts, and to confront authority confidently.
These are skills required to thrive in the modern world.”
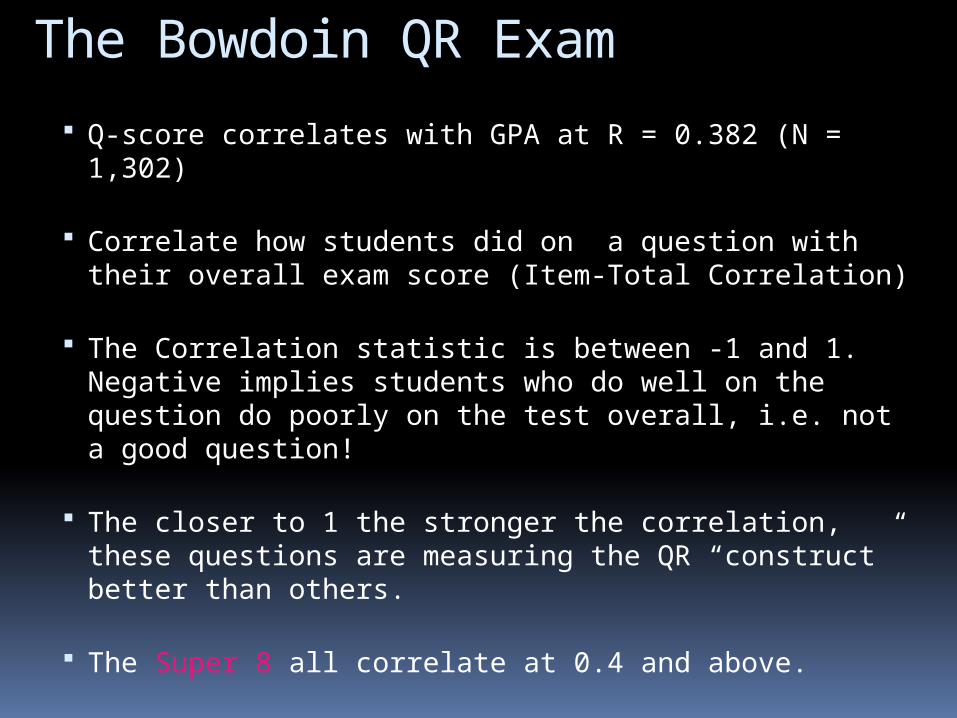
The Bowdoin QR Exam
Q-score correlates with GPA at R = 0.382 (N = 1,302)
Correlate how students did on a question with their overall exam score (Item-Total Correlation)
The Correlation statistic is between -1 and 1. Negative implies students who do well on the question do poorly on the test overall, i.e. not a good question!
The closer to 1 the stronger the correlation, these questions are measuring the QR “construct” better than others.
The Super 8 all correlate at 0.4 and above.
Lessons Learned
Replace procedural, algorithmic questions with more involved reasoning, critical thinking questions.
Ask students to interpret tables and charts rather than doing it for them.
Focus on quantitative literacy, using numbers in meaningful sentences rather than just computation.
Ask students to postulate possible explanations for statistics rather than traditional logic games.
#2 Taking 90% versus 5.2% increase.
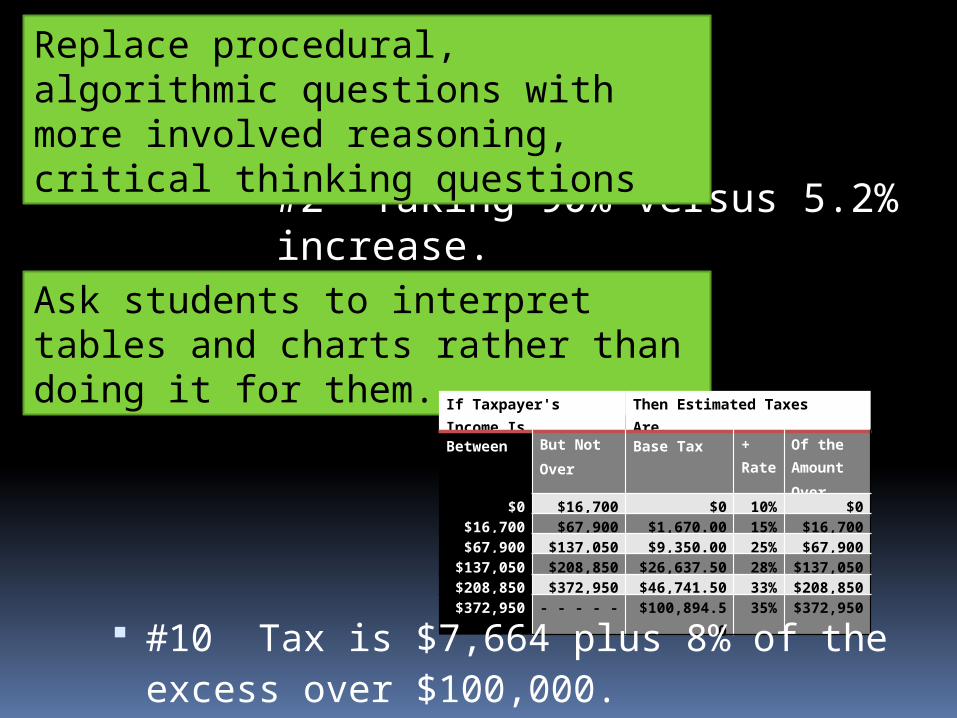
Replace procedural, algorithmic questions with more involved reasoning, critical thinking questions
Ask students to interpret tables and charts rather than doing it for them. If Taxpayer's Income Is... Then Estimated Taxes Are...
Between But Not Over
Base Tax + Rate
Of the Amount Over
$0 $16,700 $0 10% $0$16,700 $67,900 $1,670.00 15% $16,700$67,900 $137,050 $9,350.00 25% $67,900
$137,050 $208,850 $26,637.50 28% $137,050$208,850 $372,950 $46,741.50 33% $208,850$372,950 - - - - - $100,894.50 35% $372,950
#10 Tax is $7,664 plus 8% of the excess over $100,000.
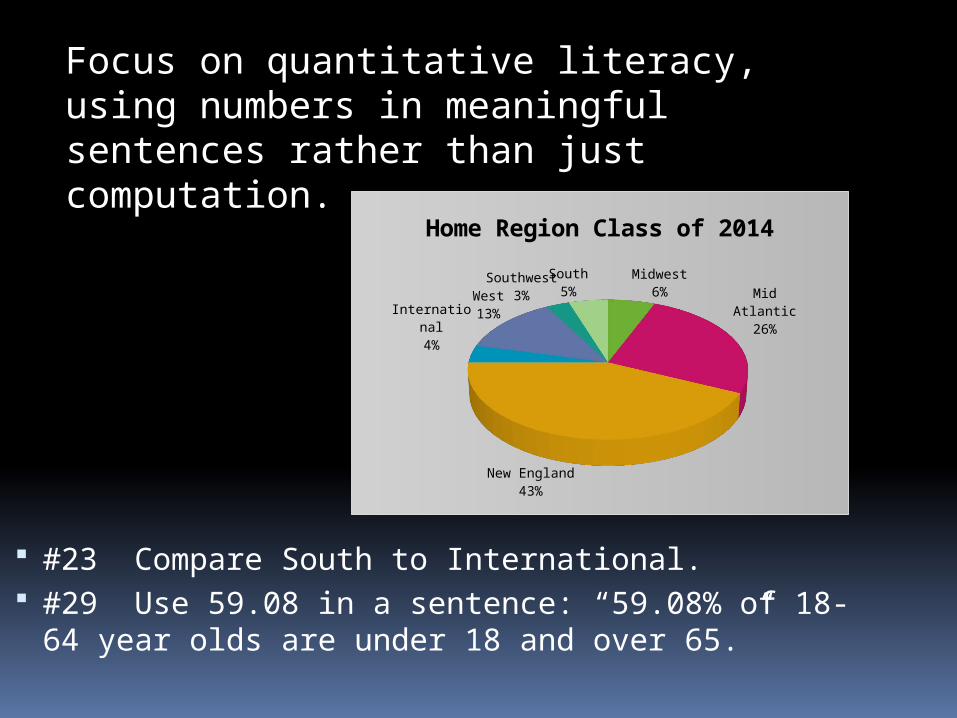
#23 Compare South to International. #29 Use 59.08 in a sentence: “59.08% of
18-64 year olds are under 18 and over 65.”
Focus on quantitative literacy, using numbers in meaningful sentences rather than just computation.
Midwest6%
Mid At-lantic26%
New England43%
Interna-tional
4%
West13%
Southwest3%
South5%
Home Region Class of 2014
Quantitative Literacy: Literacy Redefined
18
QL Across the Curriculum in a Liberal Arts Setting
Semra Kilic-Bahi
Colby-Sawyer College, New London, NH
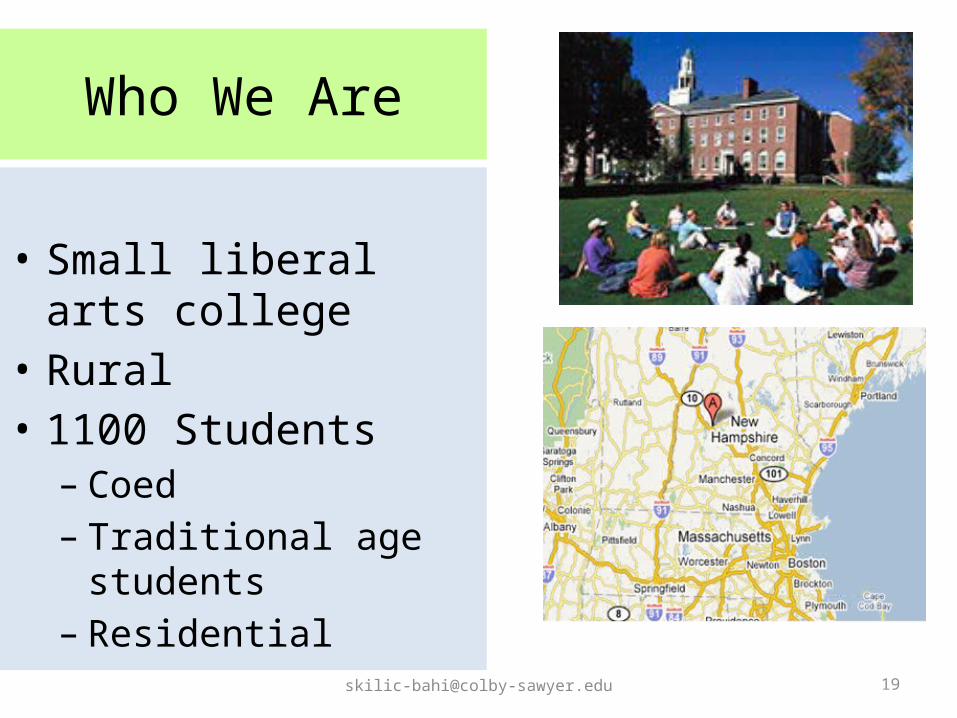
Who We Are
• Small liberal arts college • Rural• 1100 Students
– Coed– Traditional age students– Residential
[email protected] 2020
Math ProficiencySpring 2004
• Basic Mathematical Skills• The Conceptual Understanding• The ability and the flexibility to use those skills in
different contexts – CUPM Curriculum Guide 2004– The Mathematics Learning Study Committee of the National
Research Council “Adaptive Reasoning,”
QL Mission Statement
Spring 2006• Read, understand, interpret, use, and
communicate quantitative information given symbolically, visually, numerically, or verbally.
• Gather and analyze information, construct and test hypotheses, draw inferences, and make well-reasoned decisions.
• Use technology effectively
[email protected]@colby-sawyer.edu 2222
QL Across the Curriculum in a Liberal
Arts Setting
NSF Funded Project – 063313
PI: Semra Kilic-BahiCo-PIs: Ben Steele, Peter White,
Joe Carroll, Cheryl Coolidge
Senior Personnel: John Callewaert, Randy Hanson, Lynn Garrioch
Assessment Plan
• Students– Basic Skills– QL Skills– Attitude (Split survey)
• Faculty– Survey – Workshop Assessment
• Curriculum– Syllabi
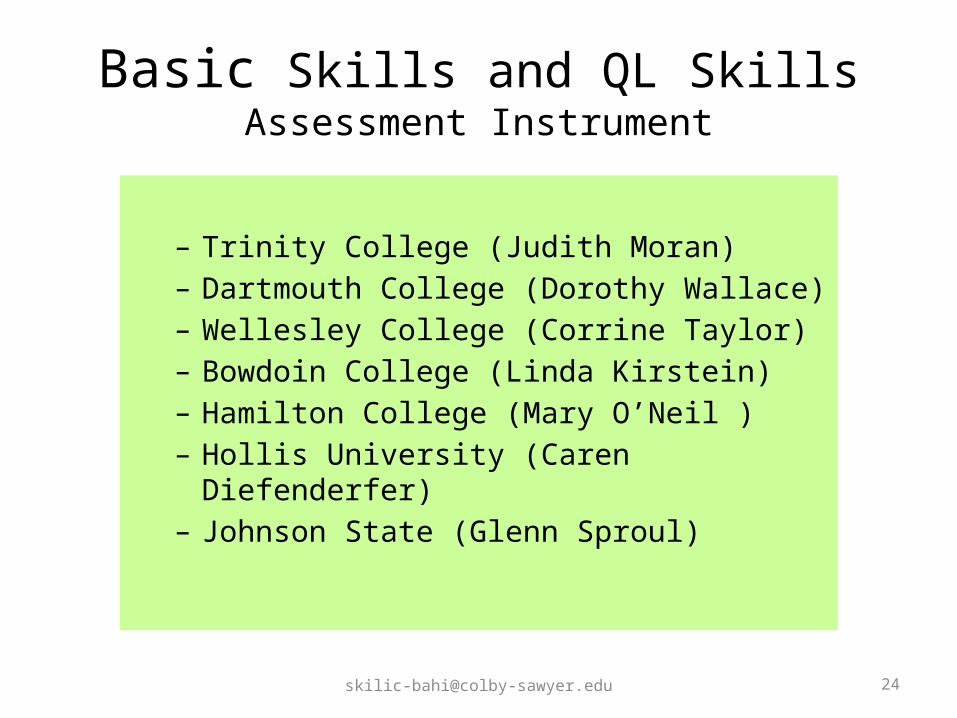
Basic Skills and QL SkillsAssessment Instrument
– Trinity College (Judith Moran)– Dartmouth College (Dorothy Wallace)– Wellesley College (Corrine Taylor)– Bowdoin College (Linda Kirstein) – Hamilton College (Mary O’Neil )– Hollis University (Caren Diefenderfer) – Johnson State (Glenn Sproul)
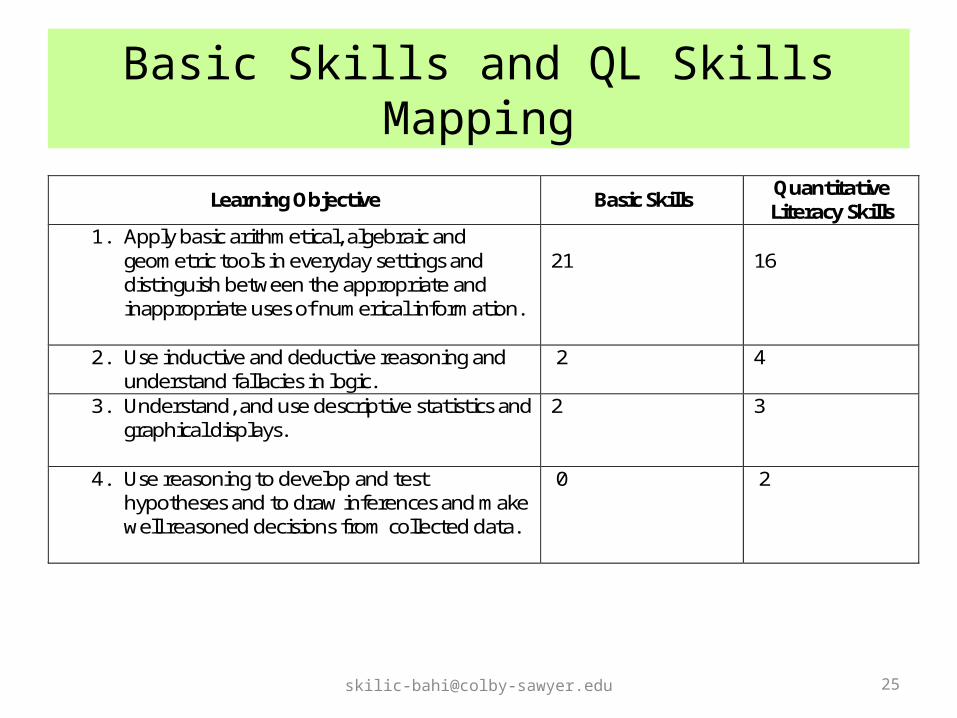
Basic Skills and QL Skills Mapping
Learning Objective Basic Skills Quantitative Literacy Skills
1. Apply basic arithmetical, algebraic and geometric tools in everyday settings and distinguish between the appropriate and inappropriate uses of numerical information.
21
16
2. Use inductive and deductive reasoning and understand fallacies in logic.
2 4
3. Understand, and use descriptive statistics and graphical displays.
2 3
4. Use reasoning to develop and test hypotheses and to draw inferences and make well reasoned decisions from collected data.
0 2
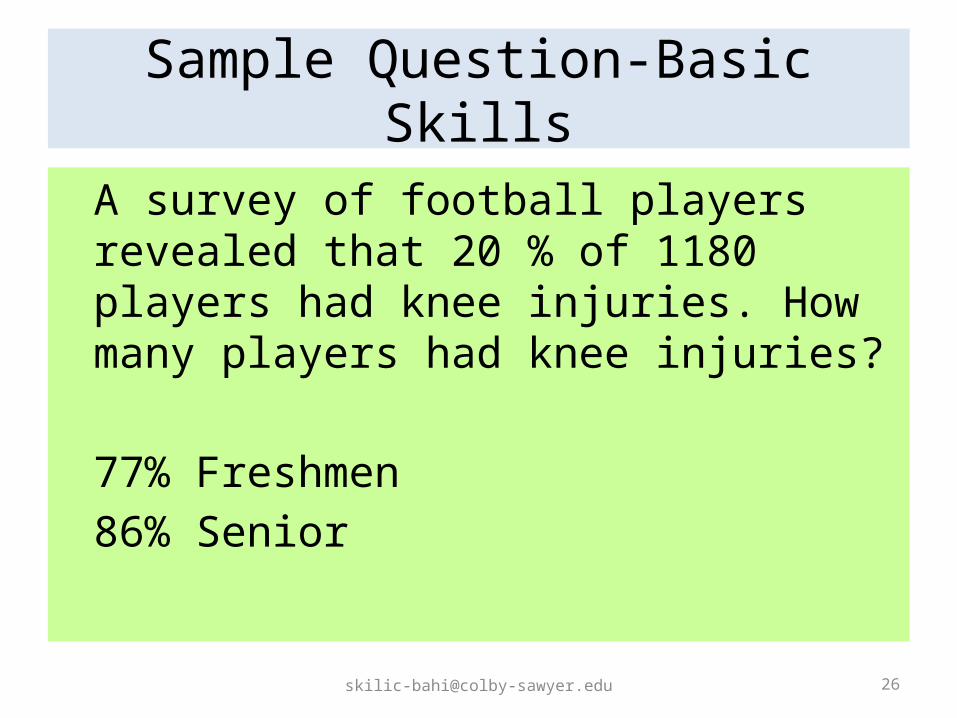
Sample Question-Basic Skills
A survey of football players revealed that 20 % of 1180 players had knee injuries. How many players had knee injuries?
77% Freshmen86% Senior
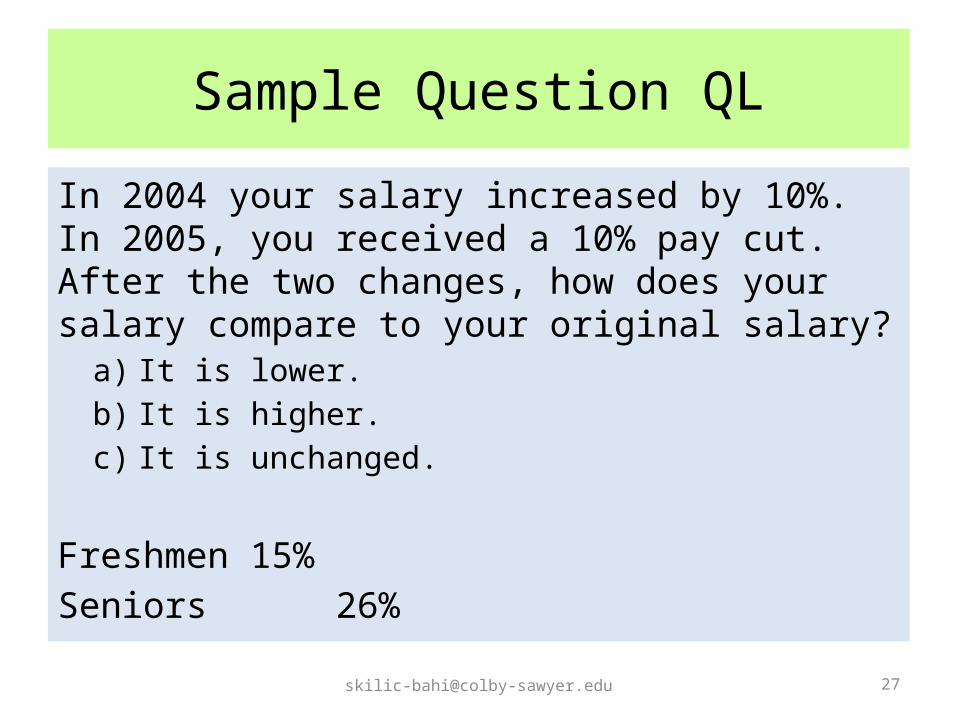
Sample Question QL
In 2004 your salary increased by 10%. In 2005, you received a 10% pay cut. After the two changes, how does your salary compare to your original salary?
a) It is lower. b) It is higher. c) It is unchanged.
Freshmen 15% Seniors 26%
27
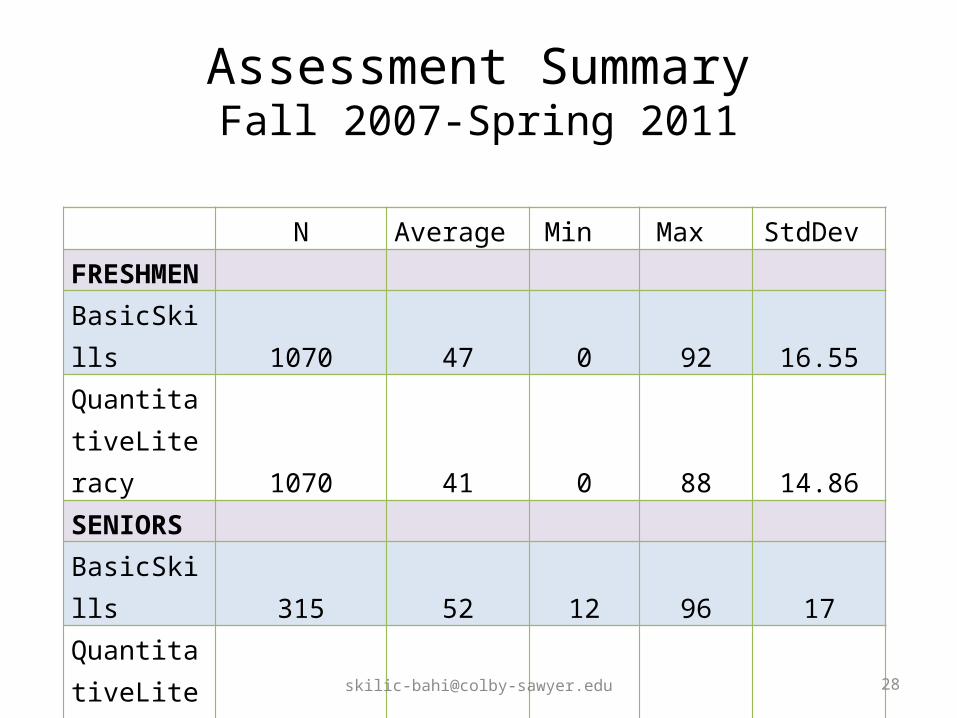
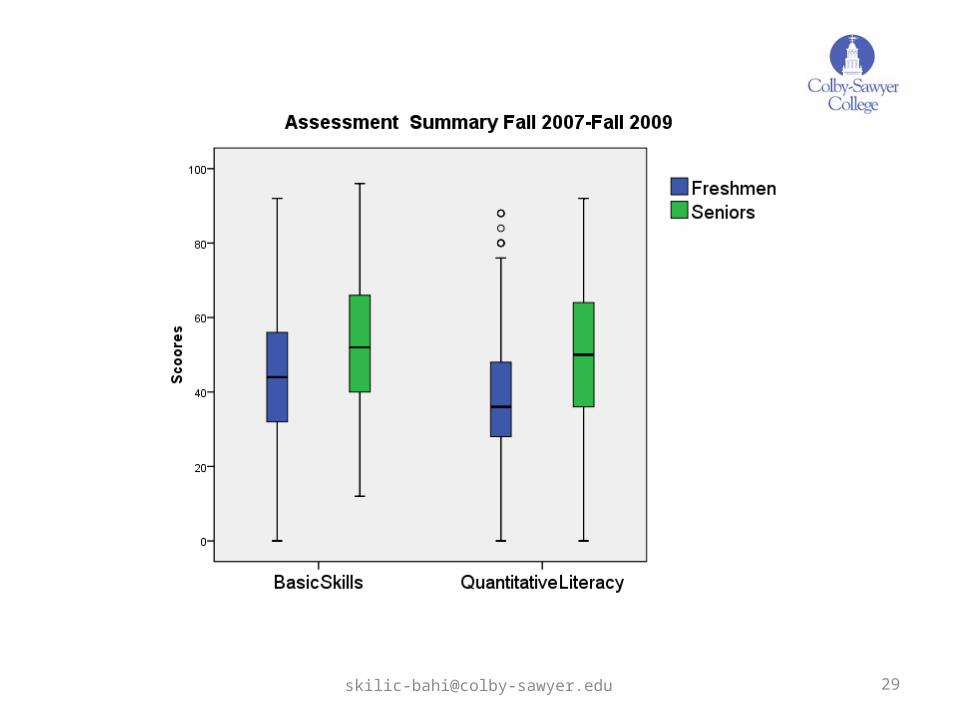
Assessment SummaryFall 2007-Spring 2011
N Average Min Max StdDev FRESHMENBasicSkills 1070 47 0 92 16.55
QuantitativeLiteracy 1070 41 0 88 14.86SENIORSBasicSkills 315 52 12 96 17
QuantitativeLiteracy 315 48 0 96 18
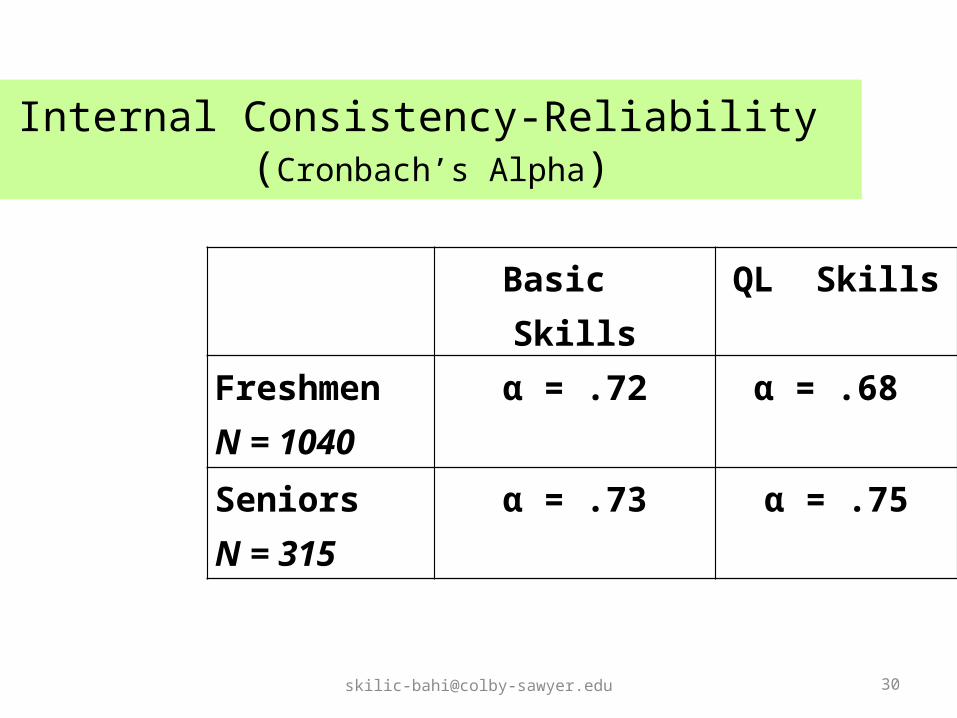
Internal Consistency-Reliability (Cronbach’s Alpha)
Basic Skills QL Skills
Freshmen N = 1040
α = .72 α = .68
Seniors N = 315
α = .73 α = .75
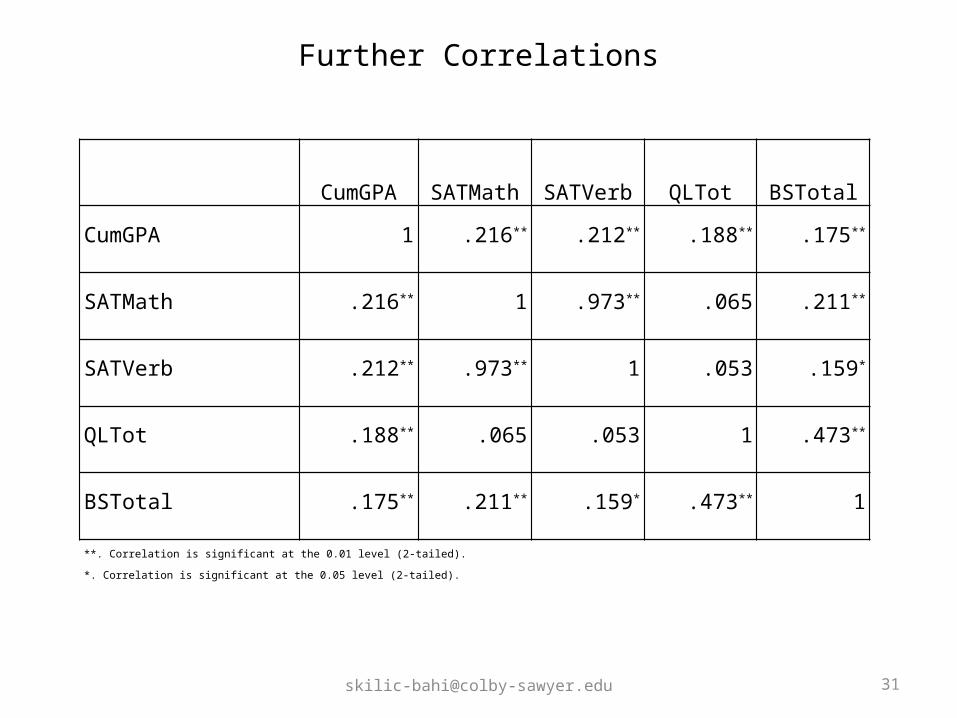
Further Correlations
CumGPA SATMath SATVerb QLTot BSTotal
CumGPA 1 .216** .212** .188** .175**
SATMath .216** 1 .973** .065 .211**
SATVerb .212** .973** 1 .053 .159*
QLTot .188** .065 .053 1 .473**
BSTotal .175** .211** .159* .473** 1
**. Correlation is significant at the 0.01 level (2-tailed).
*. Correlation is significant at the 0.05 level (2-tailed).
Attitude Survey
Thanks to:– Math Across the Curriculum, Dartmouth College (Dorothy
Wallace and Jane Korey)– MAC^3 Survey (Anne Chase) – Trinity College (Judy Moran) – An Instrument to Measure Mathematics Attitudes
Martha Tapia, Berry College, GA George E. Marsh II, The University of Alabama
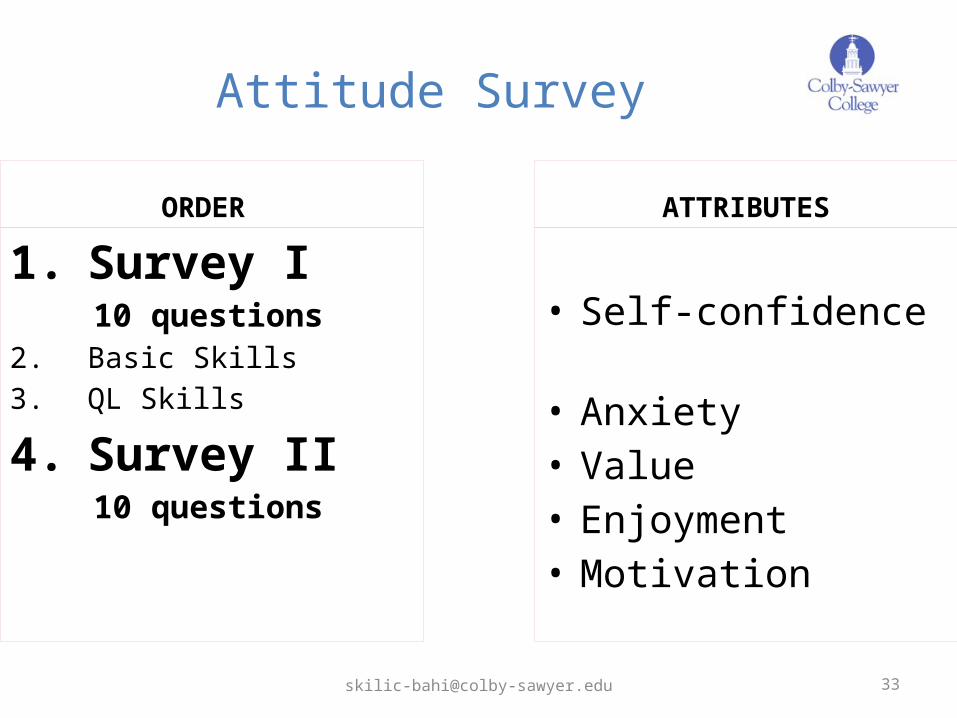
Attitude Survey
ORDER
1. Survey I10 questions
2. Basic Skills3. QL Skills
4. Survey II10 questions
ATTRIBUTES
• Self-confidence • Anxiety • Value • Enjoyment • Motivation
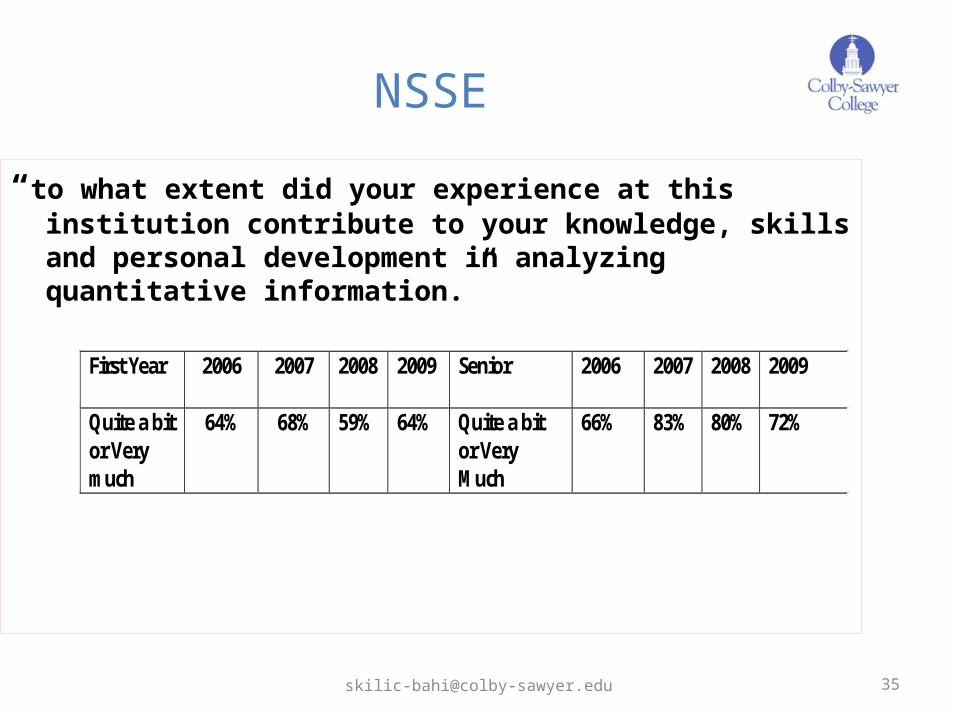
NSSE
“to what extent did your experience at this institution contribute to your knowledge, skills and personal development in analyzing quantitative information.”
First Year
2006 2007 2008 2009 Senior 2006 2007 2008 2009
Quite a bit or Very much
64% 68% 59% 64% Quite a bit or Very Much
66% 83% 80% 72%
Recent Developments
• James Madison University-Student Opinion Survey Motivation Survey
• Pilot evaluation of E-portfolios by using QuIRK rubrik developed by Carleton College

ANDQuantitative
Literacy
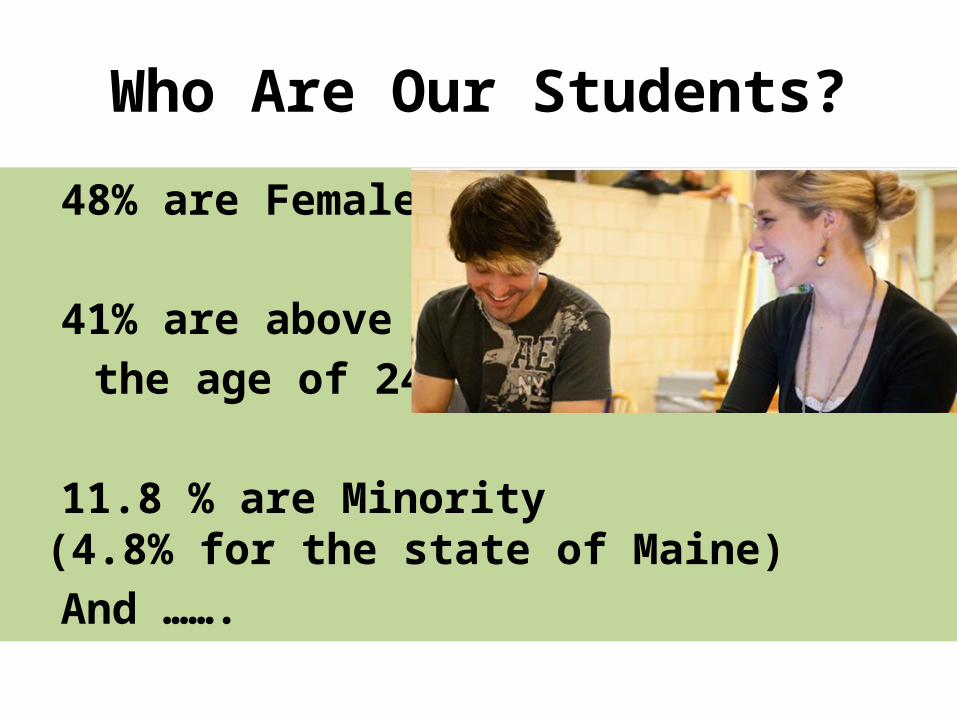
Who Are Our Students?
48% are Female
41% are above the age of 24
11.8 % are Minority (4.8% for the state of Maine)
And …….
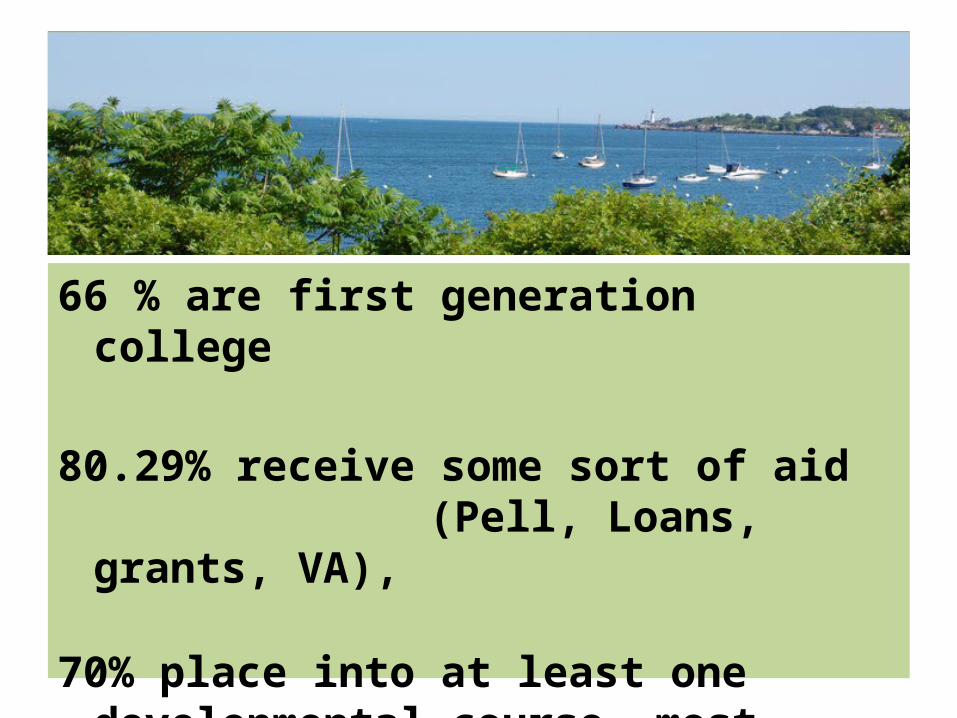
66 % are first generation college
80.29% receive some sort of aid (Pell, Loans, grants,
VA),
70% place into at least one developmental course, most likely math

What is Offered?
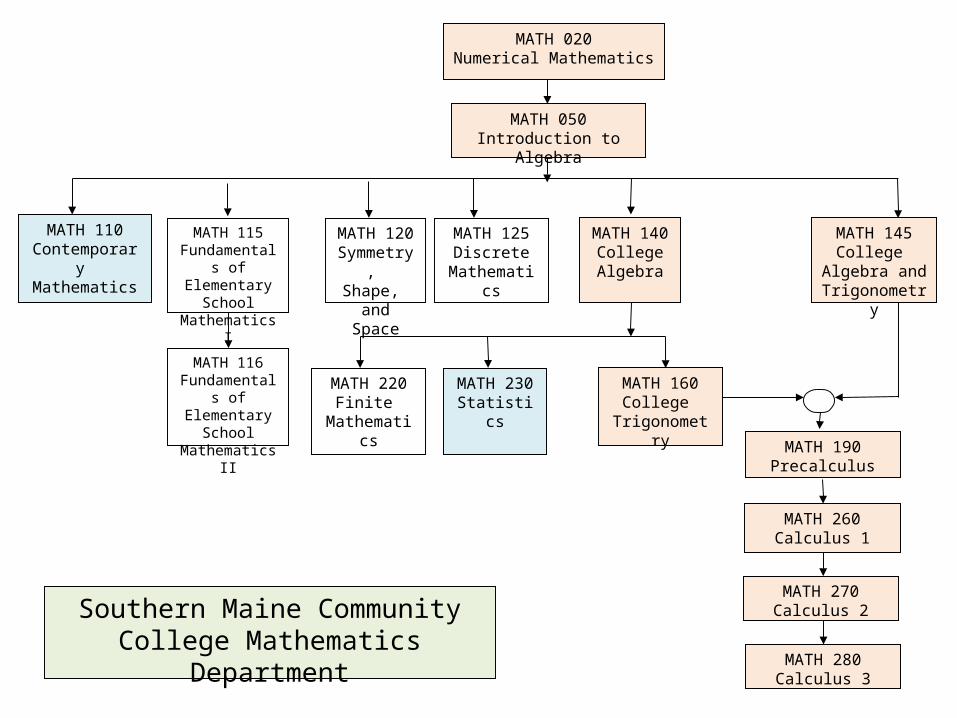
MATH 050Introduction to Algebra
MATH 020Numerical Mathematics
MATH 120Symmetry,
Shape, and Space
MATH 145College
Algebra and Trigonometry
MATH 125Discrete
Mathematics
MATH 140College Algebra
MATH 160College
Trigonometry
MATH 190Precalculus
MATH 260Calculus 1
MATH 270Calculus 2
MATH 230Statistics
MATH 115Fundamentals of Elementary
School Mathematics I
MATH 220Finite
Mathematics
Southern Maine Community College Mathematics Department
MATH 280Calculus 3
MATH 110Contemporary Mathematics
MATH 116Fundamentals of Elementary
School Mathematics II
What Is Taken?(Fall 2011)
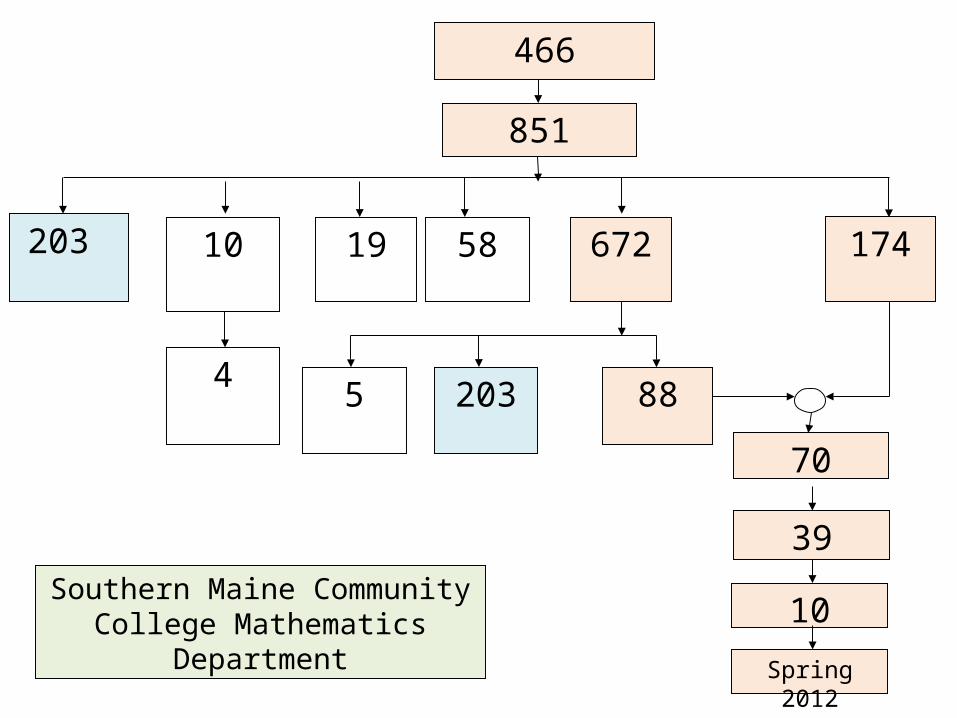
851
466
19 17458 672
88
70
39
10
203
10
5
Southern Maine Community College Mathematics
Department Spring 2012
203
4
What is our student success rate in the gateway course MATH 050 ?
Fall 09 and Fall 10
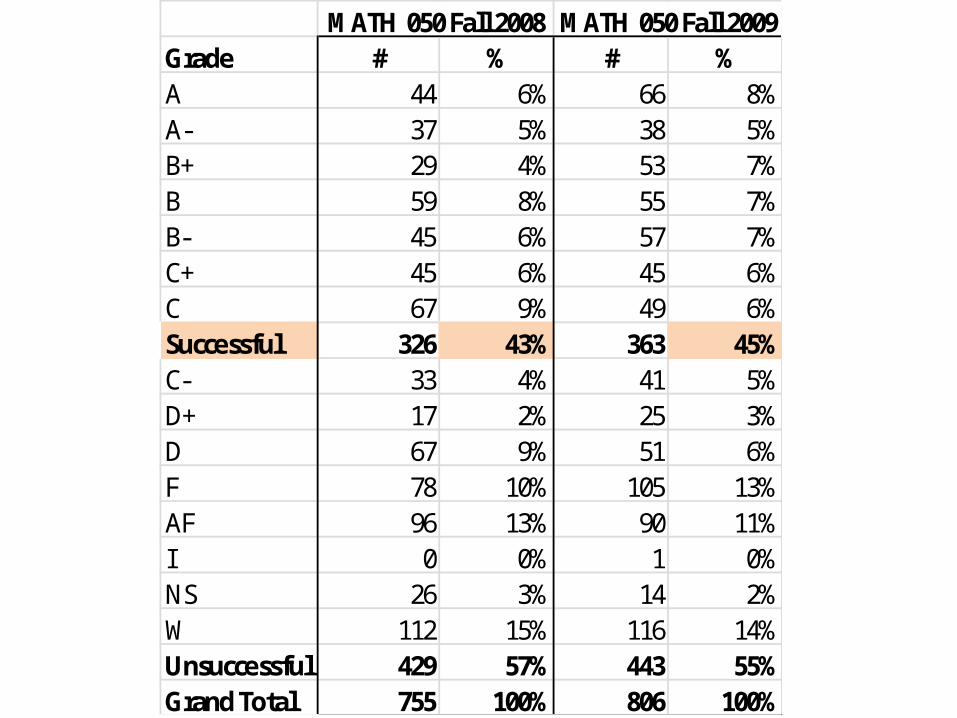
Course CompletionGrade # % # %A 44 6% 66 8%A- 37 5% 38 5%B+ 29 4% 53 7%B 59 8% 55 7%B- 45 6% 57 7%C+ 45 6% 45 6%C 67 9% 49 6%Successful 326 43% 363 45%C- 33 4% 41 5%D+ 17 2% 25 3%D 67 9% 51 6%F 78 10% 105 13%AF 96 13% 90 11%I 0 0% 1 0%NS 26 3% 14 2%W 112 15% 116 14%Unsuccessful 429 57% 443 55%Grand Total 755 100% 806 100%
MATH 050 Fall 2008 MATH 050 Fall 2009
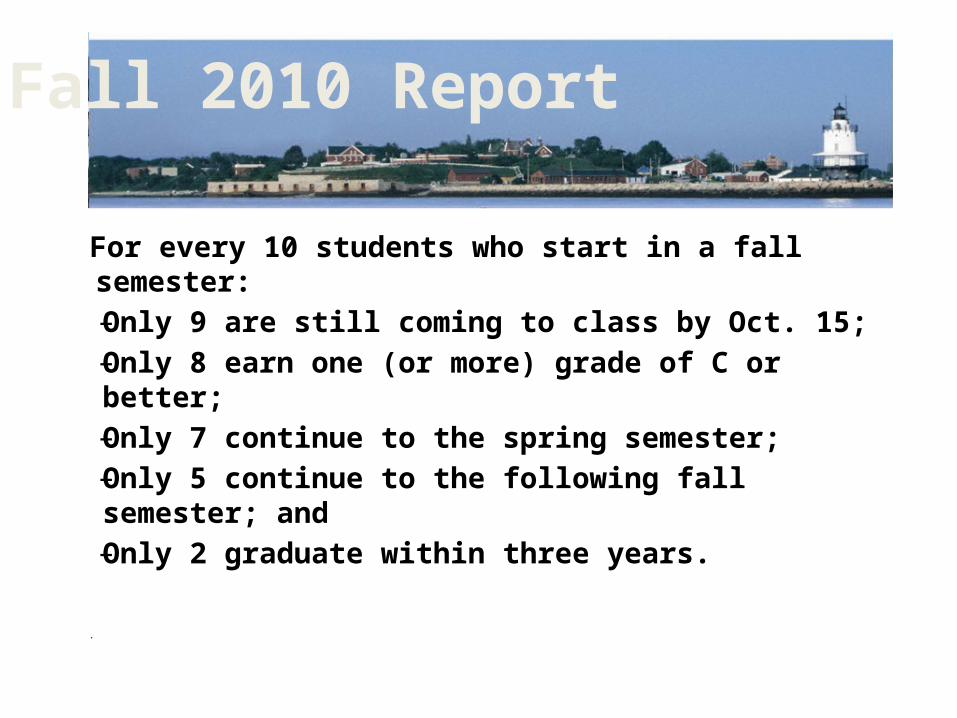
KEY PROBLEM
For every 10 students who start in a fall semester:– Only 9 are still coming to class by Oct. 15;– Only 8 earn one (or more) grade of C or better;– Only 7 continue to the spring semester;– Only 5 continue to the following fall semester;
and – Only 2 graduate within three years.
.
Fall 2010 Report
Voluntary Framework of Accountability
“As a nation we have focused on increasing access to higher education but have neglected completion and success rates. Among community college leaders there is a growing concern that providing access to students is not enough and that colleges must also assume responsibility for increasing the success rates for students.” http://www.aacc.nche.edu/Resources/aaccprograms/vfa/Pages/default.aspx
What is The Position of SMCC?
StrategiesWhat Are We Doing?
• Making services more available• Using more technology to increase access• Developing virtual tutoring and advising• Identifying and redesigning gateway courses• Using technology for learning solutions into gateway
courses.• Sharing successful instructional redesign strategies• Using Freshman Interest Groups and learning
communities to support students

How Can Quantitative Learning Help Us Meet our Goal?
Related Documents