Quantitative Interpretation of Satellite and Surface Measurements of Aerosols over North America Aaron van Donkelaar M.Sc. Defense December, 2005

Quantitative Interpretation of Satellite and Surface Measurements of Aerosols over North America
Jan 02, 2016
Quantitative Interpretation of Satellite and Surface Measurements of Aerosols over North America. Aaron van Donkelaar M.Sc. Defense December, 2005. Aerosols – Why do we care?. Climate Change Direct Effect Indirect Effect Health Effects (PM 2.5 ) Lung cancers Pulmonary Inflammation - PowerPoint PPT Presentation
Welcome message from author
This document is posted to help you gain knowledge. Please leave a comment to let me know what you think about it! Share it to your friends and learn new things together.
Transcript

Quantitative Interpretation of Satellite and Surface Measurements of Aerosols over
North America
Aaron van Donkelaar
M.Sc. Defense
December, 2005

Aerosols – Why do we care?
• Climate Change– Direct Effect– Indirect Effect
• Health Effects (PM2.5)– Lung cancers– Pulmonary Inflammation
• Visibility
Image from http://cariari.ucr.ac.cr/~faccienc/temas2/planeta.htm
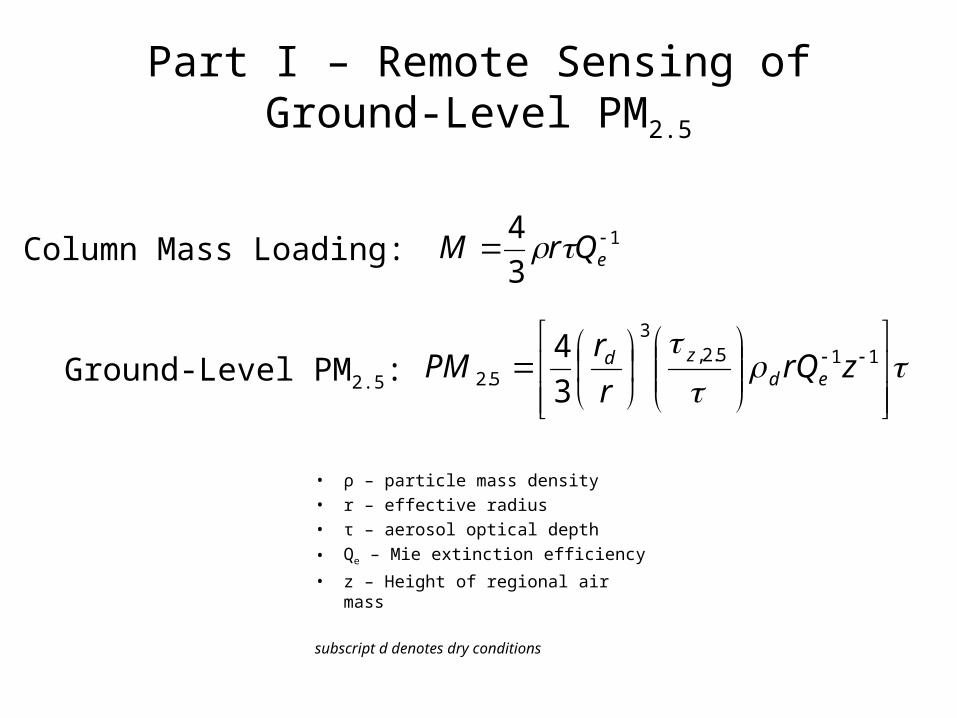
Part I – Remote Sensing of Ground-Level PM2.5
1
3
4 eQrM
115.2,
3
5.2 3
4zrQ
r
rPM ed
zd
Column Mass Loading:
Ground-Level PM2.5:
• ρ – particle mass density• r – effective radius• τ – aerosol optical depth
• Qe – Mie extinction efficiency
• z – Height of regional air mass
subscript d denotes dry conditions

InstrumentationMODIS• Moderate Resolution Imaging
Spectroradiometer• 32 channels (7 used for
Aerosol Retrieval): 0.47, 0.55, 0.67, 0.87, 1.24, 1.64 um
• Approx. daily global coverage• Requires dark surface for AOD
retrieval
MISR• Multiangle Imaging
Spectroradiometer• 4 spectral bands at 9 different
viewing angles• 6-9 days for global coverage• No assumption regarding
surface reflectivity

GEOS-CHEM
• 50 Tracers• 1º x 1º resolution• 30 vertical levels (lowest at ~10, 50, 100, 200, 300 m)• GMAO fields: temperature, winds, cloud properties, heat flux and
precipitation• sulphate, nitrate, mineral dust, fine/coarse seasalt, organic and black
carbon• Aerosol and oxidant simulations
coupled through– formation of sulphate and nitrate
– heterogeneous chemistry
– aerosol effect of photolysis rates
• Seasonal average biomass burning

Remote vs. Ground PM2.5

MODIS MISR
standard 0.68 0.54
constant vertical structure (τz/τ) 0.29 0.29
constant AOD 0.54 0.38
constant aerosol properties (Qe, r, rd, ρd)
0.73 0.52
115.2,
3
5.2 3
4zrQ
r
rPM ed
zd
Scatter Plot Comparison/Table Holding Constants

Temporal Correlation

Glo
bal P
M2.
5

Part II –Organic Aerosol Sources
• Primary Sources:– combustion (biomass/biofuel)
• Secondary Sources:– condensation of gaseous species– not well understood
• GEOS-CHEM OA Simulation– Seasonally varying biomass burning inventories– Inversion removed– SOA based upon Chung and Seinfeld [2002]
• Biogenic emissions from MEGAN inventory
• HxCy + (O3, OH, NO3) → semi-volatile products

IMPROVE Organic Aerosol
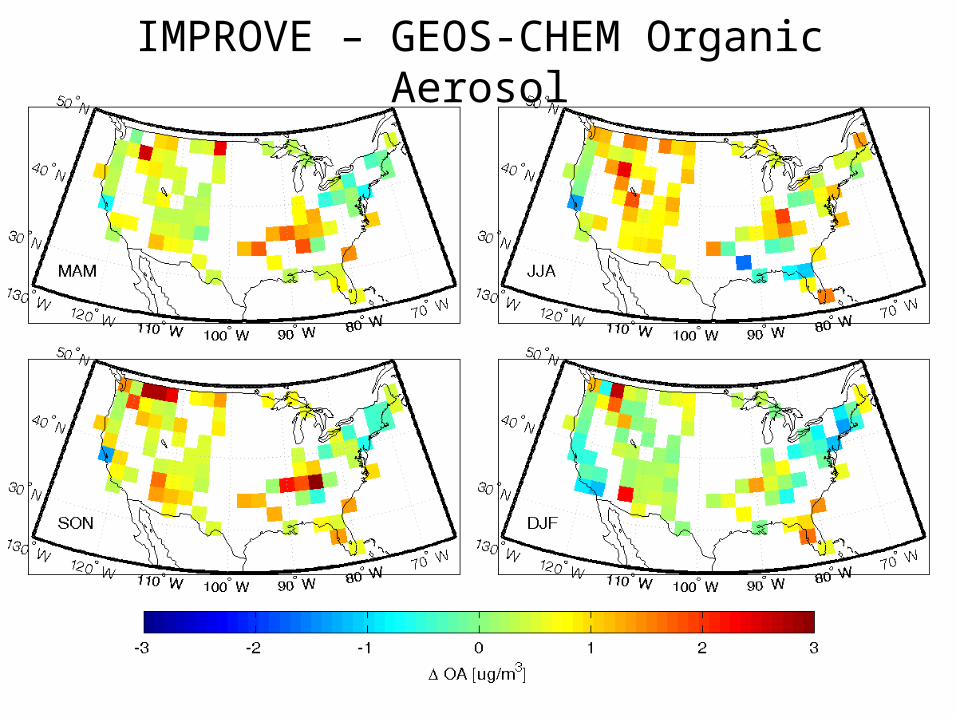
IMPROVE – GEOS-CHEM Organic Aerosol

Isoprene conversion fits within model biases

Large effect from non-OA condensation

Conclusions
• Remote PM2.5
– significant correlation (MODIS: R=0.68, MISR:0.54)– dominant factors include AOD and vertical structure
– reveals global regions of high PM2.5
• Sources of Organic Aerosol– isoprene conversion reduces model bias– non-OA condensation unclear
Related Documents