Quantitative Estimation of Capacity Fade Quantitative Estimation of Capacity Fade of Sony 18650 cells Cycled at Elevated of Sony 18650 cells Cycled at Elevated Temperatures Temperatures by Branko N. Popov, P.Ramadass and Bala S. Haran Center for Electrochemical Engineering Department of Chemical Engineering University of South Carolina Columbia, SC 29208 Center for Electrochemical Engineering University of South Carolina Center for Electrochemical Engineering University of South Carolina

Quantitative Estimation of Capacity Fade of Sony 18650 cells Cycled at Elevated Temperatures by Branko N. Popov, P.Ramadass and Bala S. Haran Center for.
Dec 19, 2015
Welcome message from author
This document is posted to help you gain knowledge. Please leave a comment to let me know what you think about it! Share it to your friends and learn new things together.
Transcript

Quantitative Estimation of Capacity Fade of Quantitative Estimation of Capacity Fade of
Sony 18650 cells Cycled at Elevated Sony 18650 cells Cycled at Elevated
TemperaturesTemperatures
by
Branko N. Popov, P.Ramadass and Bala S. HaranCenter for Electrochemical Engineering
Department of Chemical Engineering
University of South Carolina Columbia, SC 29208Center for Electrochemical Engineering
University of South CarolinaCenter for Electrochemical Engineering
University of South Carolina

ObjectivesObjectives
Develop a methodology to determine the cause of capacity fade in Li-ion cells:
Primary Active Material (Li+) loss
Secondary Active Material (LiCoO2/Carbon) losses
Rate Capability loss
Factors that control the capacity loss:
Charging protocol
Cycling Temperature
Charge and discharge rates
The depth of discharge (DOD)
Quantify capacity fade using experimental data.
Develop a capacity fade model that would predict cycle life of a Li-ion cell

Experimental – Cycling StudiesExperimental – Cycling Studies
Studies of 18650 Li-ion Cell:
Cells cycled using Constant Current-Constant Potential (CC-CV) protocol.
Charged at 1A current till potential reaches 4.2 V
Hold potential at 4.2V till current decays to 50 mA.
Cells were discharged at a constant current of 1 A.
Batteries were cycled at four temperatures: RT(25oC), 45oC, 50oC and 55oC.
Rate capability studies done after 150, 300 and 800 cycles
Cells charged at 1 A and discharged at different rates (C/9 to 1C).
EIS measurements were done for fresh and cycled cells. (100 kHz ~ 1 mHz ±5
mV)
Studies of fresh and cycled electrode materials were carried out using a T-Cell
assembly with Li metal being the counter and reference electrode.

Discharge Curves at Various CyclesDischarge Curves at Various Cycles
0.0 0.4 0.8 1.2 1.6 2.0
Capacity (Ah)
2.00
2.44
2.88
3.32
3.76
4.20
Volta
ge (V
)
55-Dicharge
1
150300
490
0.0 0.4 0.8 1.2 1.6 2.0
Capacity (Ah)
2.00
2.44
2.88
3.32
3.76
4.20
Vol
tage
(V)
RT-Dicharge
1
500150
300
800
0.0 0.4 0.8 1.2 1.6 2.0
Capacity (Ah)
2.00
2.44
2.88
3.32
3.76
4.20
Vol
tage
(V)
45 degree-Dicharge
1
150
300500
800
0.0 0.4 0.8 1.2 1.6 2.0
Capacity (Ah)
2.00
2.44
2.88
3.32
3.76
4.20
Vol
tage
(V)
50 degree-Discharge
1
150300
600
500
50 deg C 55 deg C
45 deg C25 deg C

Capacity Fade as a Function of Cycle LifeCapacity Fade as a Function of Cycle Life
Temperature% Capacity Fade (cycle number)
50 100 150 300 500 800
25oC 3.8 5.11 6.06 10.29 22.5 30.63
45oC 3.8 5.46 7 11.75 26.46 36.21
50oC 2.4 5.1 7.9 23.9 43.21 -
55oC 4.3 6.4 9.4 27 70.56 -

Change in Charging Times with CyclingChange in Charging Times with Cycling
Constant Current
Constant Voltage
RT 45 50 550.0
0.5
1.0
1.5
CC Time (h)
1
150
300
1
150
300
1
150
300800
800
300
1
150300
500
1
RT 45 50 550
1
2
3
CV Time (h)
1
150300
1150
300
1
150
300
800800
490
1
150
300
500
1

0.0 0.4 0.8 1.2 1.6 2.0
Applied Current (A)
0.75
1.00
1.25
1.50
1.75
2.00
Dis
char
ge C
apac
ity
(Ah)
Rate Capability comparison after 150 and 800 cycles
Fresh
800
300
150
0.0 0.4 0.8 1.2 1.6 2.0
Applied Current (A)
0.75
1.00
1.25
1.50
1.75
2.00
Dis
char
ge C
apac
ity
(Ah)
Rate Capability comparison after 150 and 800 cycles
Fresh
150
800
300
Rate Capability with CyclingRate Capability with Cycling
50 deg C 55 deg C
45 deg C25 deg C
0.0 0.4 0.8 1.2 1.6 2.0
Applied Current (A)
0.75
1.00
1.25
1.50
1.75
2.00
Dis
char
ge C
apac
ity
(Ah)
Rate Capability comparison after 150 and 800 cycles
Fresh
500
150
300
0.0 0.4 0.8 1.2 1.6 2.0
Applied Current (A)
0.75
1.00
1.25
1.50
1.75
2.00
Dis
char
ge C
apac
ity
(Ah)
Rate Capability comparison after 150 and 800 cycles
Fresh
150
300

Variation of Cell Impedance with CyclingVariation of Cell Impedance with Cycling
RT 45 50 550.0
0.1
0.2
0.3
0.4
0.5
0.6
0.7
0.8O
vera
ll C
ell R
esis
tanc
e ()
1111 150150150150300300300300
800
800
600
1

Comparison of Electrode ResistancesComparison of Electrode Resistances
150 Cycles 300 Cycles
800 Cycles
RT 45 50 550
200
400
600
800
1000
1200
Ele
ctro
de R
esis
tanc
e (-cm2 )
Electrode resistance after 150 cycles for a fully charged cell
LiCoO2Carbon
1
RT 45 50 550
200
400
600
800
1000
1200
Ele
ctro
de R
esis
tanc
e (-cm2 )
Electrode resistance after 300 cycles foa a fully charged cell
LiCoO2Carbon
1
RT 45 500
200
400
600
800
1000
1200
Electrode Resistance (-cm2 )
Electrode resistance after 800 cycles for a fully charged cell
600 cyclesLiCoO2Carbon
800 cycles800 cycles
1

Specific Capacity of Positive and Negative Electrodes at Various Specific Capacity of Positive and Negative Electrodes at Various Cycles and TemperatureCycles and Temperature
TemperatureCycle
Number
Specific Capacity (mAh/g)
LiCoO2 Carbon
Fresh 148.132 339.896
25oC
150 145.61 334.03
300 141.07 325.04
800 122.14 271.10
45oC
150 143.74 332.84
300 139.26 325.71
800 118.43 264.56
50oC
150 143.28 331.20
300 133.56 293.91
600 94.05 202.53
55oC150 142.84 328.90
300 131.13 286.92

Capacity Fade BalanceCapacity Fade Balance
Q = QQ = Q11 + Q + Q22 + Q + Q33
Q: Total Capacity Loss
Q1: Capacity Fade due to rate capability loss Difference in capacity between C/9 and C/2 rate discharges.
Q2: Capacity Fade due to loss of secondary
active material (LiCoO2 and Carbon) Measurement done on T-cells
Q3: Capacity Fade due to loss of primary
active material (Li+) and other losses.

Capacity Fade - QuantifiedCapacity Fade - Quantified
150 300 8000
20
40
60
80
100
% o
f Tot
al C
apac
ity
Los
s
Electrode resistance after 150 cycles
Cycle Number
Q1Q2Q3
1
150 300 8000
20
40
60
80
100
% o
f Tot
al C
apac
ity
Los
s
Electrode resistance after 150 cycles
Cycle Number
Q1Q2Q3
1
2525ooCC 5050ooCC
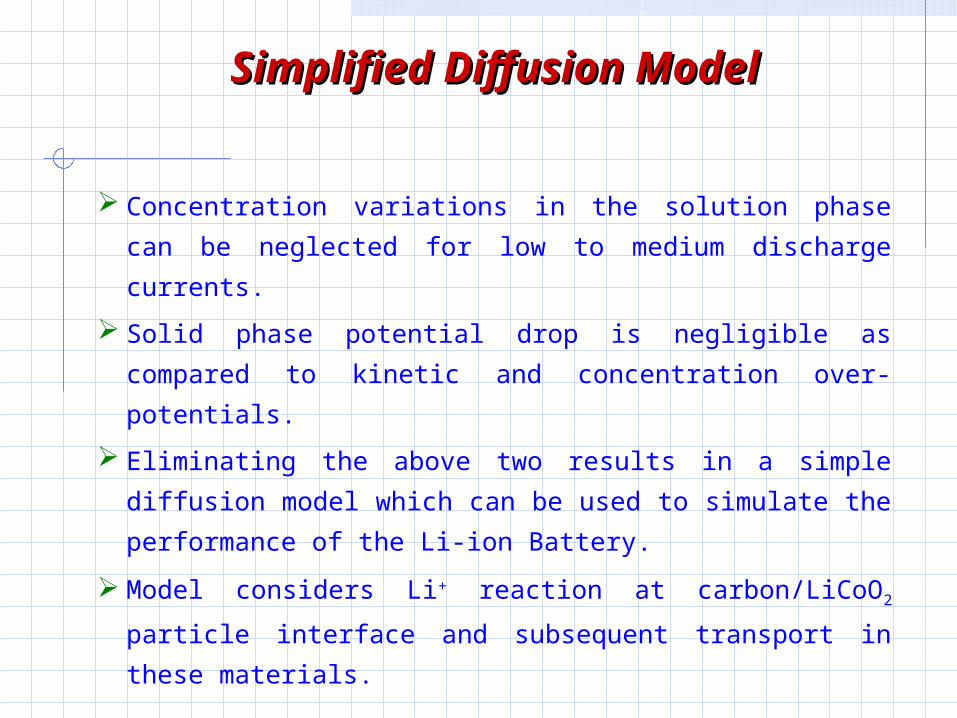
Simplified Diffusion ModelSimplified Diffusion Model
Concentration variations in the solution phase can be
neglected for low to medium discharge currents.
Solid phase potential drop is negligible as compared to
kinetic and concentration over-potentials.
Eliminating the above two results in a simple diffusion
model which can be used to simulate the performance of
the Li-ion Battery.
Model considers Li+ reaction at carbon/LiCoO2 particle
interface and subsequent transport in these materials.

Governing Equations: Diffusion Model Governing Equations: Diffusion Model
Fickian diffusion in spherical coordinates in carbon and LiCoO2
rc
rr
Dt
c Li2
r
effLiLi2
Initial ConditionoLiLi c c 0,t
Boundary Conditions
Li
eff Lip Li Li
cr 0, 0
rc j
r R , D rate r̂ F

a1 c1P P
F FΦ Φ
RT RT
Li,in o,1j j e e
ref reff fP PU jR U jR
Electrode Reaction RatesElectrode Reaction Rates
Concentration dependent exchange current density:
Lithium intercalation/deintercalation reaction:
a2 c2N N
F FΦ Φ
RT RT
Li,de o,2j j e e
ref reff fN NU jR U jR
P NV
, ,max, , , , , 1, 2
a j c js so j j Li j Li j Li jj k c c c j
Rf refer to total resistance that includes ohmic R and polarization RP resistances. (Rf=R+RP)
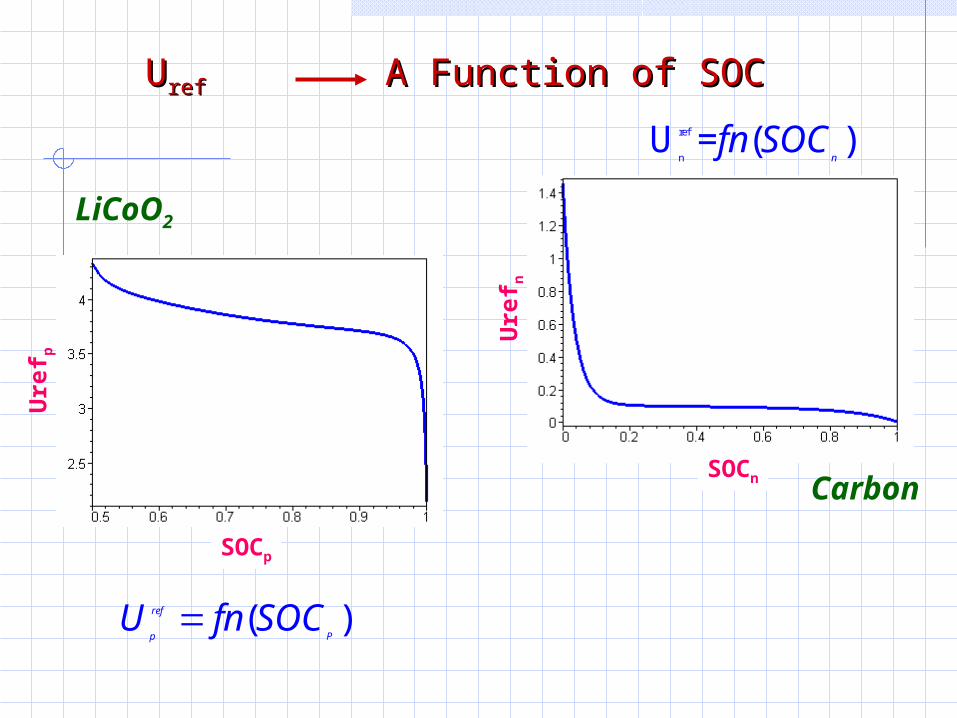
UUrefref A Function of SOC A Function of SOC
( )ref
p PU fn SOC
ref
nU = ( )
nfn SOC
SOCp
SOCn
Ure
f p
Ure
f n
LiCoO2
Carbon

Parameters Considered for Diffusion ModelParameters Considered for Diffusion Model
State of Charge of the electrode limited by capacity
To account for capacity loss due to primary and
secondary active materials.
Solid Phase Diffusion Coefficient
To account for capacity loss due to rate capability.
Film Resistance
To account for the drop in cell voltage due to increase
in ohmic resistance and polarization losses.

Incorporation of QIncorporation of Q22 and Q and Q33 in Diffusion Model in Diffusion Model
SOC of the electrode material could be estimated
from active material losses.
Calculate SOC of the negative electrode based on
the capacity loss (Q2 + Q3).
Develop a correlation for variation of SOC of
negative electrode with cycle number.
Using this capacity fade due to active material losses
could be incorporated in the diffusion model.

Comparison of Diffusion Model and RT Comparison of Diffusion Model and RT Experimental Data Experimental Data
Parameter Property
SOCActive material
losses
Dns Rate Capability
losses
RfDrop in cell voltage
with cycling
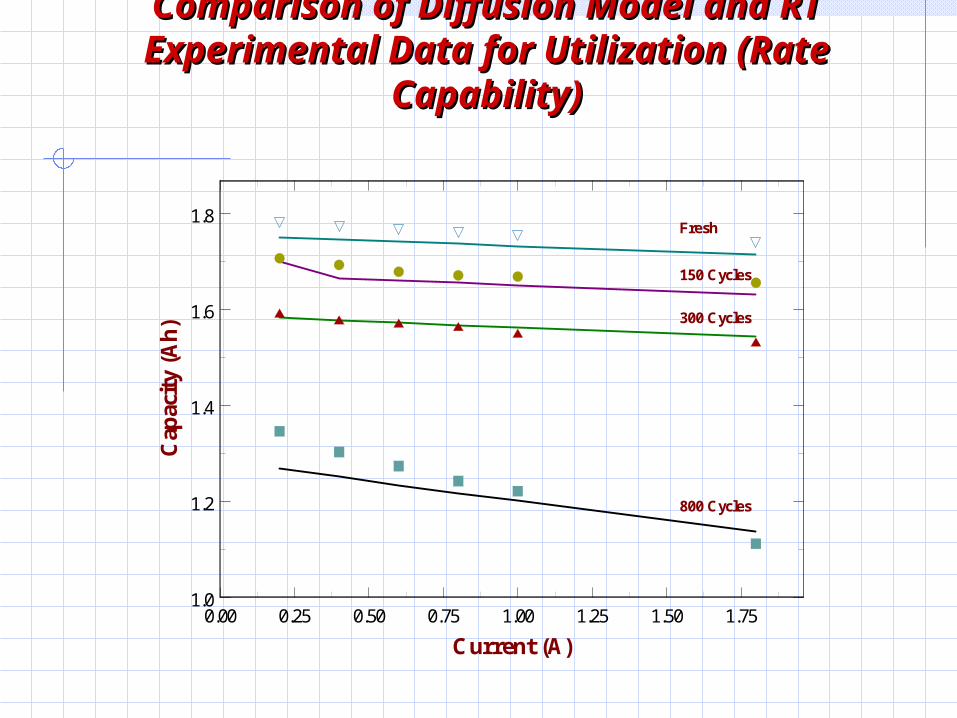
Comparison of Diffusion Model and RT Comparison of Diffusion Model and RT Experimental Data for Utilization (Rate Capability)Experimental Data for Utilization (Rate Capability)
0.00 0.25 0.50 0.75 1.00 1.25 1.50 1.75
Current (A)
1.0
1.2
1.4
1.6
1.8
Cap
acit
y (A
h)
150 Cycles
Fresh
300 Cycles
800 Cycles

ConclusionsConclusions
A diffusion model was developed to simulate the discharge curves of Li-ion cell.
Empirical correlations have been developed for variation of SOC of Li-ion cell with continuous cycling.
Active material losses have been accounted through the variation of negative electrode SOC in the diffusion model.
Rate capability losses and Polarization resistance increase have been accounted through varying the diffusion coefficient and exchange current density respectively.
Inclusion of effect of charging and discharge rates and DOD into diffusion model is currently in progress.

AcknowledgementsAcknowledgements
This work was carried out under a contract with the
National Reconnaissance Office
for
Hybrid Advanced Power Sources
# NRO-00-C-1034.
Center for Electrochemical EngineeringUniversity of South Carolina
Center for Electrochemical EngineeringUniversity of South Carolina
Related Documents