Quantitative Easing and Recent Monetary Policy November 30, 2009 Nottingham University Richard Anderson Economist, Federal Reserve Bank of St Louis Leverhulme Visiting Professor, Aston University

Quantitative Easing and Recent Monetary Policy November 30, 2009 Nottingham University Richard Anderson Economist, Federal Reserve Bank of St Louis Leverhulme.
Dec 16, 2015
Welcome message from author
This document is posted to help you gain knowledge. Please leave a comment to let me know what you think about it! Share it to your friends and learn new things together.
Transcript
Quantitative Easing and Recent Monetary Policy
November 30, 2009Nottingham University
Richard AndersonEconomist, Federal Reserve Bank of St Louis
Leverhulme Visiting Professor, Aston University
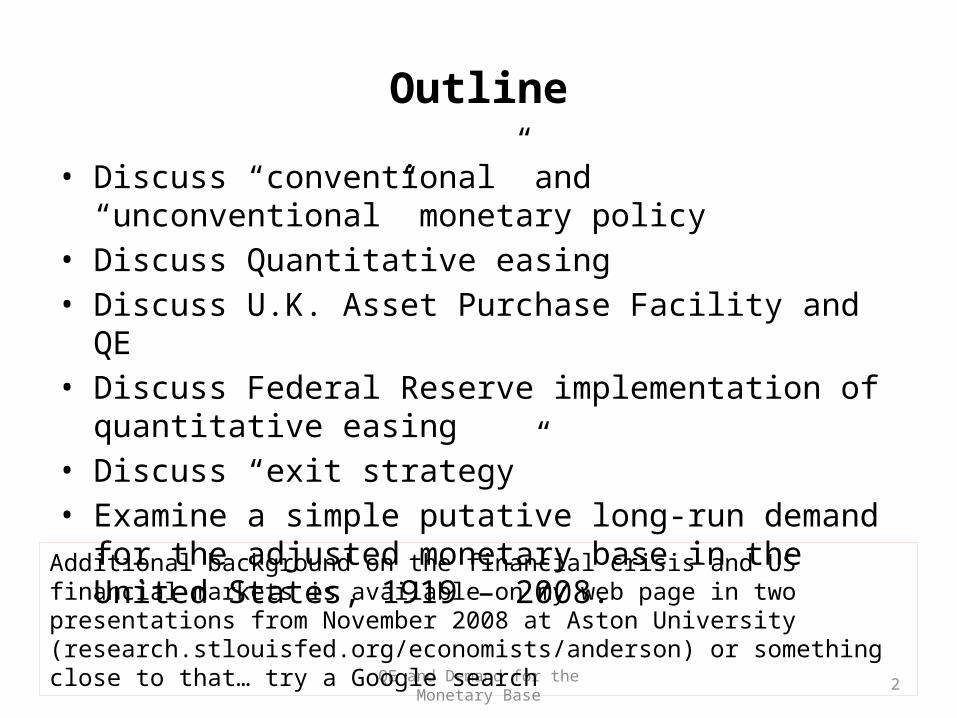
Outline
• Discuss “conventional” and “unconventional” monetary policy• Discuss Quantitative easing• Discuss U.K. Asset Purchase Facility and QE• Discuss Federal Reserve implementation of quantitative
easing• Discuss “exit strategy” • Examine a simple putative long-run demand for the adjusted
monetary base in the United States, 1919 – 2008.
2QE and Demand for the Monetary Base
Additional background on the financial crisis and US financial markets is available on my web page in two presentations from November 2008 at Aston University (research.stlouisfed.org/economists/anderson) or something close to that… try a Google search
Conventional and Unconventional Monetary Policy
Conventional:– “The key purpose of monetary policy is to preserve price
stability.” [A. Meier, 2009, IMF]– Monetary policy implementation is via targeting a short-
term interest rate (almost always, the overnight cost-of-carry on central government debt)
– Mainstay of New Keynesian macro models (and RBC models)
Does this mix objectives and constraints?– Inflation of the 1970s: peak 24 (26?) percent Britain, 10-13
percent U.S.– Fiscal pressures on monetary policy
QE and Recent Monetary Policy 3
“Traditional” (Historical) Monetary Policy• Provide means of payment that is irrevocable/final, efficient,
honest (above corruption or debasement)• Monitor/assure financial stability (avoid and/or temper
financial panics)• Emphasis on CB’s balance sheetBank of England in the 19th century, especially beginning 1825
– Specie or BOE notes as prime assets during panic: flight to quality and liquidity (counterparty risk, opaque balance sheets)
– As country banks held fewer and fewer notes, burden on BOE increased
– BOE policy: Halt panic at any cost, then lend only against good collateral to avoid itself failing [modern fiat money central banks cannot fail in that fashion]
Federal Reserve at its founding after Panic of 1907• Gold standard was to provide price stability (nominal anchor)
4
“Unconventional” Policy• Everything except conventional policy• Lending to banks against collateral [nice or not], foreign and
domestic (Federal Reserve)• Equity interests in banks (ring-fencing assets on-balance
sheet)• Purchasing private assets (with default risk)• Purchasing large quantities of government debt (no default
risk)
Rather conventional when compared to BOE in 19th century…• Halt the panic• Extend credit against good collateral [usually]• Two years or so for things to get sorted
5
Large balance sheet changes are more “conventional” than one might think.
• Goodfriend and King (JME, 1981) noted in a simple RE model that large balance sheet changes could be an effective monetary policy instrument so long as the central bank could credibly commit to the increases being temporary (rather than financing fiscal deficit)
• A number of central banks have embraced this lesson
6
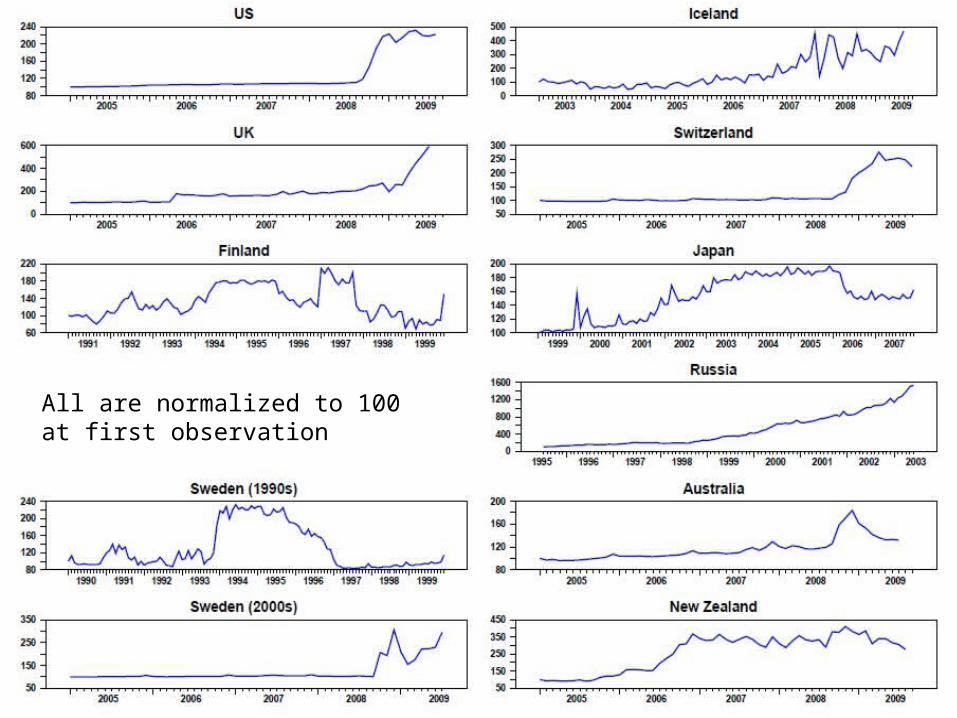
Demand for the Monetary Base 7
All are normalized to 100 at first observation
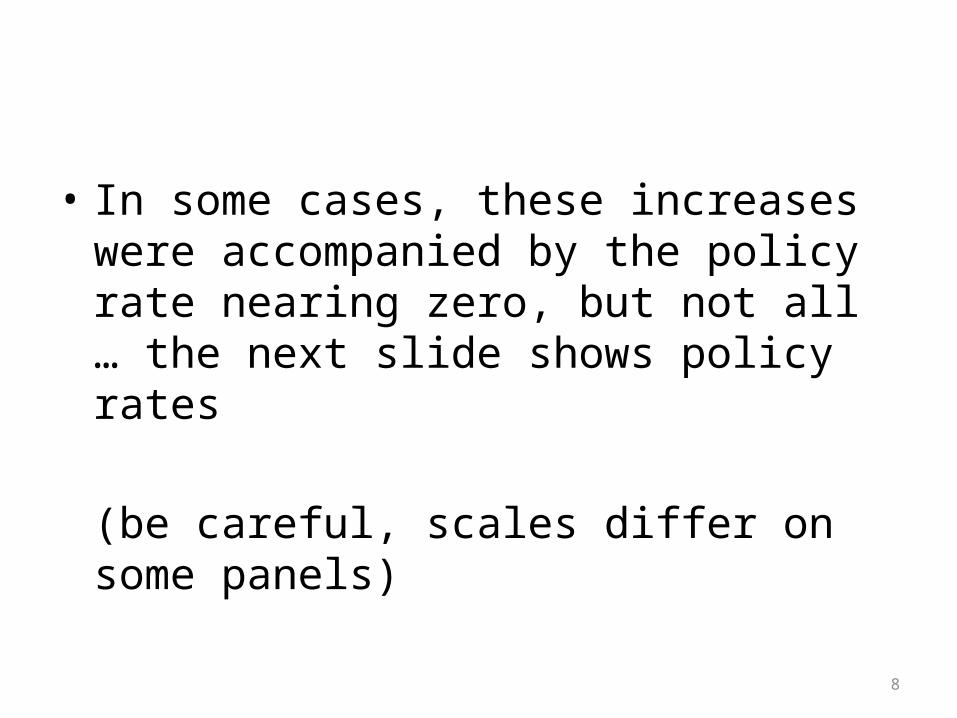
• In some cases, these increases were accompanied by the policy rate nearing zero, but not all … the next slide shows policy rates
(be careful, scales differ on some panels)
8
Demand for the Monetary Base 9
Demand for the Monetary Base 10
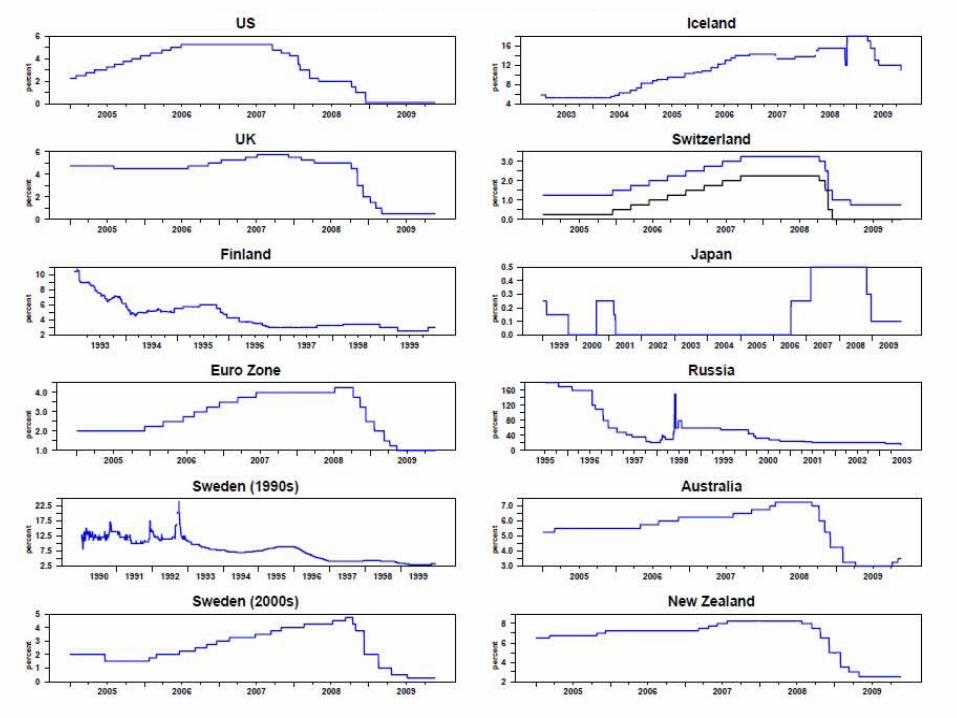
Countries with Major Increases in the Monetary Base
Country Measure of Monetary Base
Reference Date Range
Startingquantity
Ending quantity
Reason %Increase
FollowingInflation
Argentina Monetary Base Dec 2001 – Jun 2008 11,981M 102,223M political meltdown, high inflation, and expansionary policy
753.21% 11.88%
Belgium Currency and Liability to banking Institutions
Aug 2008 – Sep 2008Dec 2008 – Jun 2009
90,431M 141,216M
166,316M102,704M
likely to be a quantitative easing related to the current global recession
83.91% N/A
Finland Currency and Reserves of depository banks
Jul 1994 – Aug 1994Dec 1998 – Jan 1999
9,658M20,698M
21,304M3,844M
related to the 1990s Finnish banking crisis
120.58% 1.55%
Hong Kong Monetary Base Oct 2008 – Jul 2009 363.35B 771.17B likely to be a quantitative easing related to the current global recession
N/A
Iceland Monetary Base Q1 2006 – Q3 2007 35,825M 111,175M related to the Icelandic financial crisis, and the nationalization of failed banks
210.33% 8.13%
Ireland Currency and Liability to banking Institutions
Jun 2008 – Mar 2009 38,194M 125,349M likely to be a quantitative easing related to the current global recession
228.19% N/A
Israel Reserve Money (M0)
Jan 1997 – Dec 1997 28,095M 56,659M not clear 101.67% 4.39%
Japan Reserve Money (M0)
Mar 2001 – Mar 2003Mar 2006 – May 2006
68.64T110.63T
106.29T93.04T
the Japanese quantitative easing 54.85% -0.27%
Netherland Currency and Liability to banking Institutions
May 2008 – Oct 2008 59.74B 113.53B likely to be a quantitative easing related to the current global recession
90.04% N/A
New Zealand Reserve Money (M0)
Jun 2006 – Oct 2006 5,333M 10,661M started paying interest on reserve to create a liquidity management regime
99.91% 3.24%
Country Measure of Monetary Base
Reference Date Range
Startingquantity
Ending quantity
Reason %Increase
FollowingInflation
Qatar Reserve Money (M0)
Oct 2007 – Jul 2009 14,379M 41,107M likely to be a quantitative easing related to the current global recession
185.88% 14.4%
Russia Monetary Base Apr 2006 – May 2007 2,864.8B 5,350.8B likely to be a budget stimulus plan (fiscal policy)
86.78% 10.93%
Sweden Reserve Money (M0)
Oct 1993 – Mar 1994May 1996 – Feb 1997
95.52B156.68B
204.69B81.11B
related to the government bailout of early 1990s credit crunch
114.29% 2.07%
Countries with Major Increases in the Monetary Base
11
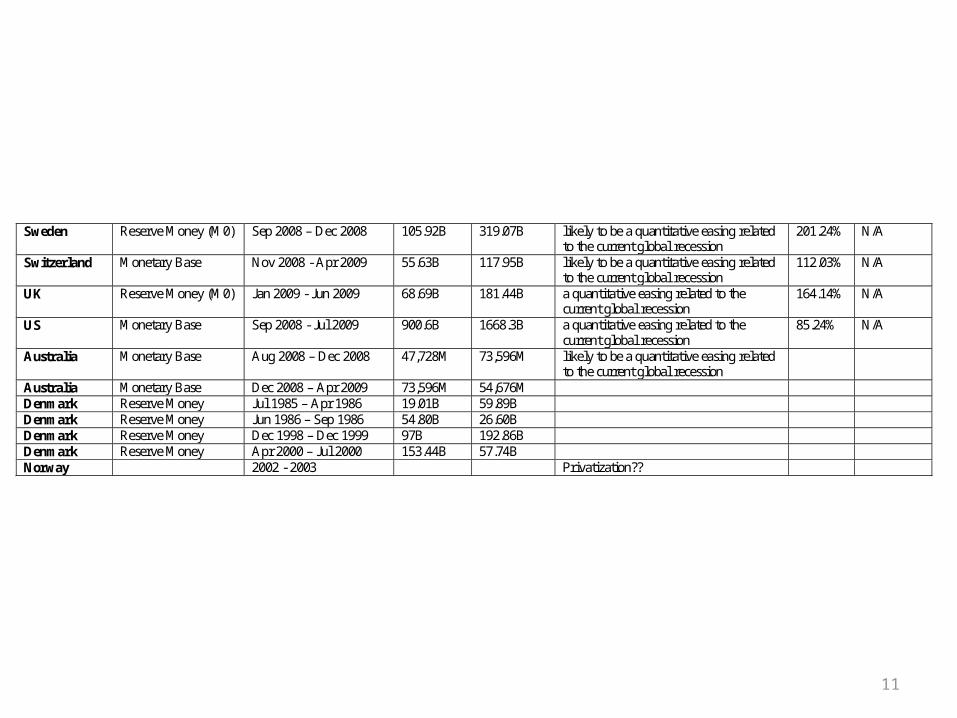
Sweden Reserve Money (M0) Sep 2008 – Dec 2008 105.92B 319.07B likely to be a quantitative easing related to the current global recession
201.24% N/A
Switzerland Monetary Base Nov 2008 - Apr 2009 55.63B 117.95B likely to be a quantitative easing related to the current global recession
112.03% N/A
UK Reserve Money (M0) Jan 2009 - Jun 2009 68.69B 181.44B a quantitative easing related to the current global recession
164.14% N/A
US Monetary Base Sep 2008 - Jul 2009 900.6B 1668.3B a quantitative easing related to the current global recession
85.24% N/A
Australia Monetary Base Aug 2008 – Dec 2008 47,728M 73,596M likely to be a quantitative easing related to the current global recession
Australia Monetary Base Dec 2008 – Apr 2009 73,596M 54,676M Denmark Reserve Money Jul 1985 – Apr 1986 19.01B 59.89B Denmark Reserve Money Jun 1986 – Sep 1986 54.80B 26.60B Denmark Reserve Money Dec 1998 – Dec 1999 97B 192.86B Denmark Reserve Money Apr 2000 – Jul 2000 153.44B 57.74B Norway 2002 - 2003 Privatization??
12
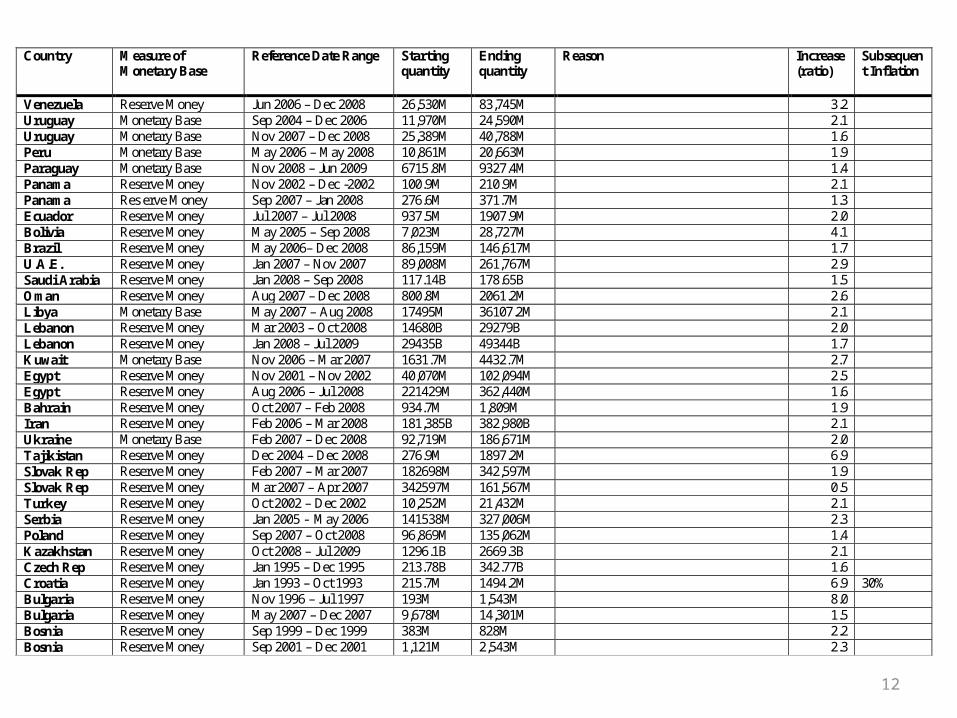
Country Measure of Monetary Base
Reference Date Range Starting quantity
Ending quantity
Reason Increase(ratio)
Subsequent Inflation
Venezuela Reserve Money Jun 2006 – Dec 2008 26,530M 83,745M 3.2 Uruguay Monetary Base Sep 2004 – Dec 2006 11,970M 24,590M 2.1 Uruguay Monetary Base Nov 2007 – Dec 2008 25,389M 40,788M 1.6 Peru Monetary Base May 2006 – May 2008 10,861M 20,663M 1.9 Paraguay Monetary Base Nov 2008 – Jun 2009 6715.8M 9327.4M 1.4 Panama Reserve Money Nov 2002 – Dec -2002 100.9M 210.9M 2.1 Panama Res erve Money Sep 2007 – Jan 2008 276.6M 371.7M 1.3 Ecuador Reserve Money Jul 2007 – Jul 2008 937.5M 1907.9M 2.0 Bolivia Reserve Money May 2005 – Sep 2008 7,023M 28,727M 4.1 Brazil Reserve Money May 2006– Dec 2008 86,159M 146,617M 1.7 U.A.E. Reserve Money Jan 2007 – Nov 2007 89,008M 261,767M 2.9 Saudi Arabia Reserve Money Jan 2008 – Sep 2008 117.14B 178.65B 1.5 Oman Reserve Money Aug 2007 – Dec 2008 800.8M 2061.2M 2.6 Libya Monetary Base May 2007 – Aug 2008 17495M 36107.2M 2.1 Lebanon Reserve Money Mar 2003 – Oct 2008 14680B 29279B 2.0 Lebanon Reserve Money Jan 2008 – Jul 2009 29435B 49344B 1.7 Kuwait Monetary Base Nov 2006 – Mar 2007 1631.7M 4432.7M 2.7 Egypt Reserve Money Nov 2001 – Nov 2002 40,070M 102,094M 2.5 Egypt Reserve Money Aug 2006 – Jul 2008 221429M 362,440M 1.6 Bahrain Reserve Money Oct 2007 – Feb 2008 934.7M 1,809M 1.9 Iran Reserve Money Feb 2006 – Mar 2008 181,385B 382,980B 2.1 Ukraine Monetary Base Feb 2007 – Dec 2008 92,719M 186,671M 2.0 Tajikistan Reserve Money Dec 2004 – Dec 2008 276.9M 1897.2M 6.9 Slovak Rep Reserve Money Feb 2007 – Mar 2007 182698M 342,597M 1.9 Slovak Rep Reserve Money Mar 2007 – Apr 2007 342597M 161,567M 0.5 Turkey Reserve Money Oct 2002 – Dec 2002 10,252M 21,432M 2.1 Serbia Reserve Money Jan 2005 - May 2006 141538M 327,006M 2.3 Poland Reserve Money Sep 2007 – Oct 2008 96,869M 135,062M 1.4 Kazakhstan Reserve Money Oct 2008 – Jul 2009 1296.1B 2669.3B 2.1 Czech Rep Reserve Money Jan 1995 – Dec 1995 213.78B 342.77B 1.6 Croatia Reserve Money Jan 1993 – Oct 1993 215.7M 1494.2M 6.9 30% Bulgaria Reserve Money Nov 1996 – Jul 1997 193M 1,543M 8.0 Bulgaria Reserve Money May 2007 – Dec 2007 9,678M 14,301M 1.5 Bosnia Reserve Money Sep 1999 – Dec 1999 383M 828M 2.2 Bosnia Reserve Money Sep 2001 – Dec 2001 1,121M 2,543M 2.3
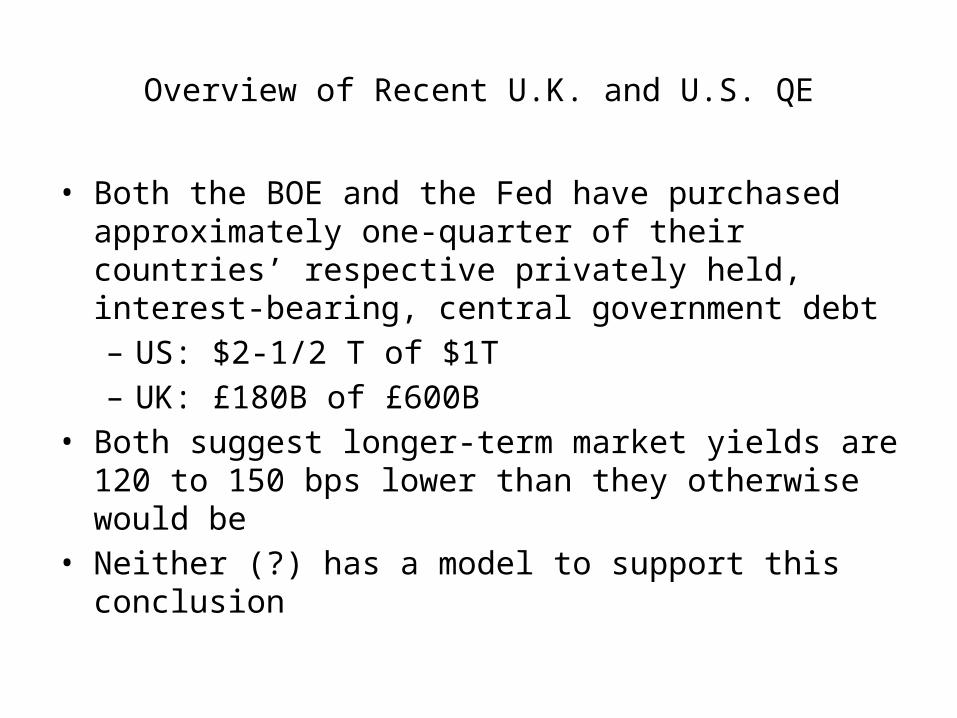
Overview of Recent U.K. and U.S. QE
• Both the BOE and the Fed have purchased approximately one-quarter of their countries’ respective privately held, interest-bearing, central government debt– US: $2-1/2 T of $1T– UK: £180B of £600B
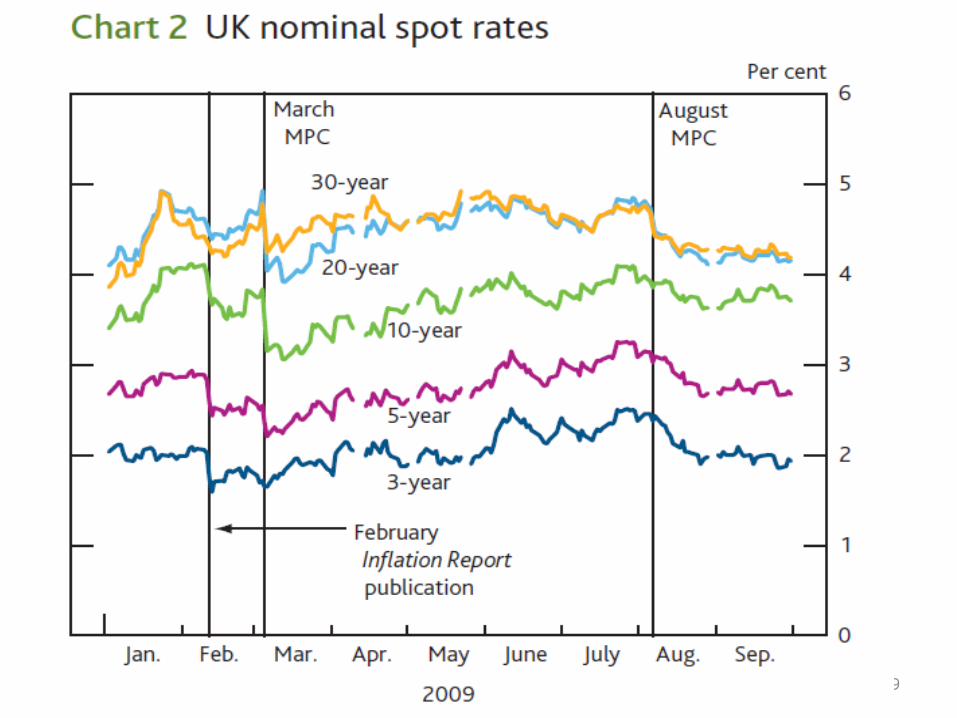
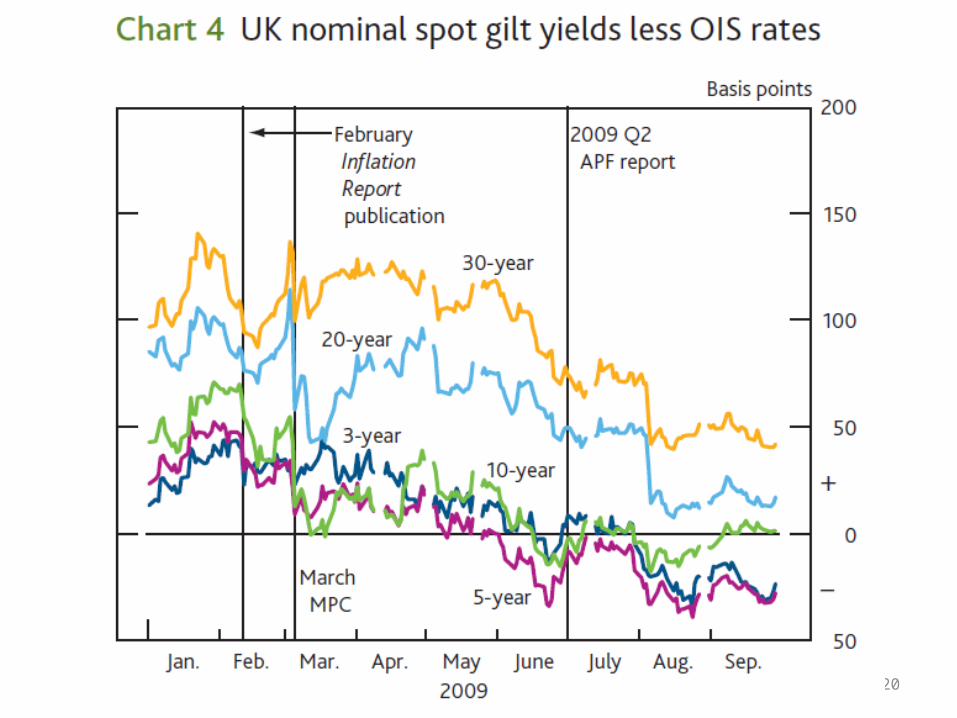
• Both suggest longer-term market yields are 120 to 150 bps lower than they otherwise would be
• Neither (?) has a model to support this conclusion
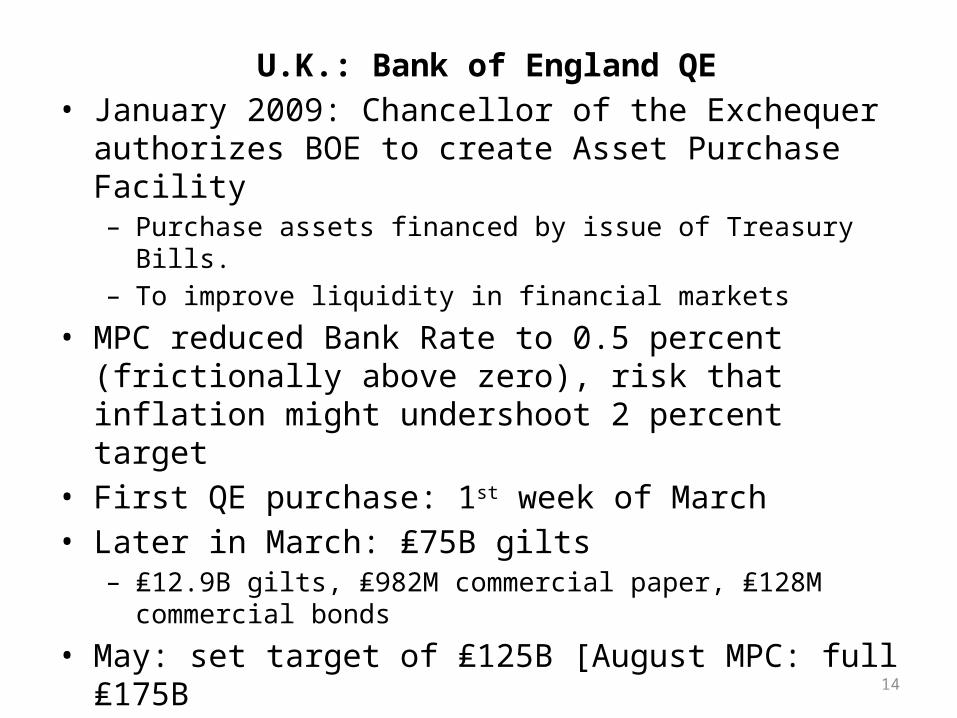
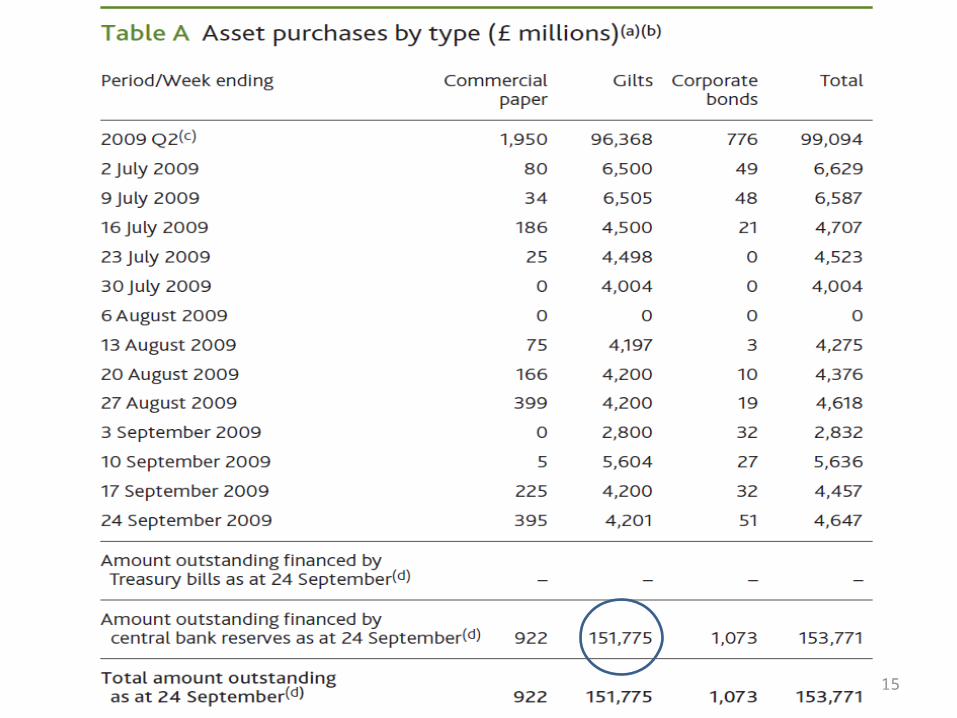
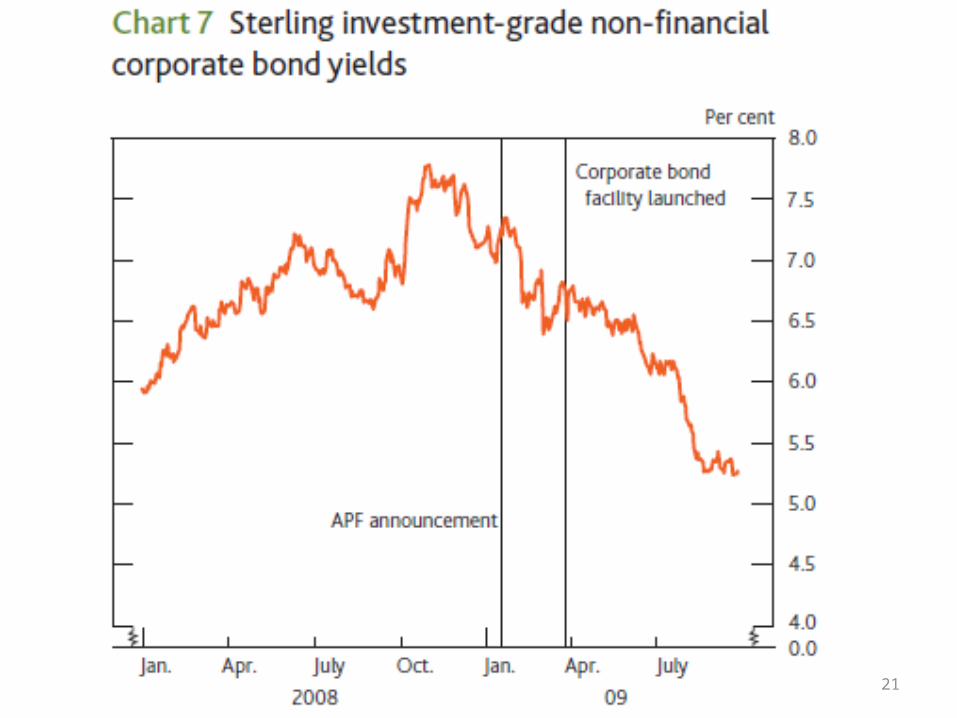
U.K.: Bank of England QE• January 2009: Chancellor of the Exchequer authorizes BOE to
create Asset Purchase Facility – Purchase assets financed by issue of Treasury Bills.– To improve liquidity in financial markets
• MPC reduced Bank Rate to 0.5 percent (frictionally above zero), risk that inflation might undershoot 2 percent target
• First QE purchase: 1st week of March• Later in March: ₤75B gilts
– ₤12.9B gilts, ₤982M commercial paper, ₤128M commercial bonds
• May: set target of ₤125B [August MPC: full ₤175B– Owned ₤93.3B gilts, ₤2.1B c.p., and ₤0.75 commercial bonds
• November: ₤178.3B – Purchased ₤1.7B gilts 17 Nov 2009 approx 4.3% yield
14
Demand for the Monetary Base 15
Demand for the Monetary Base 16
Demand for the Monetary Base 17
18
0
50
100
150
200
250
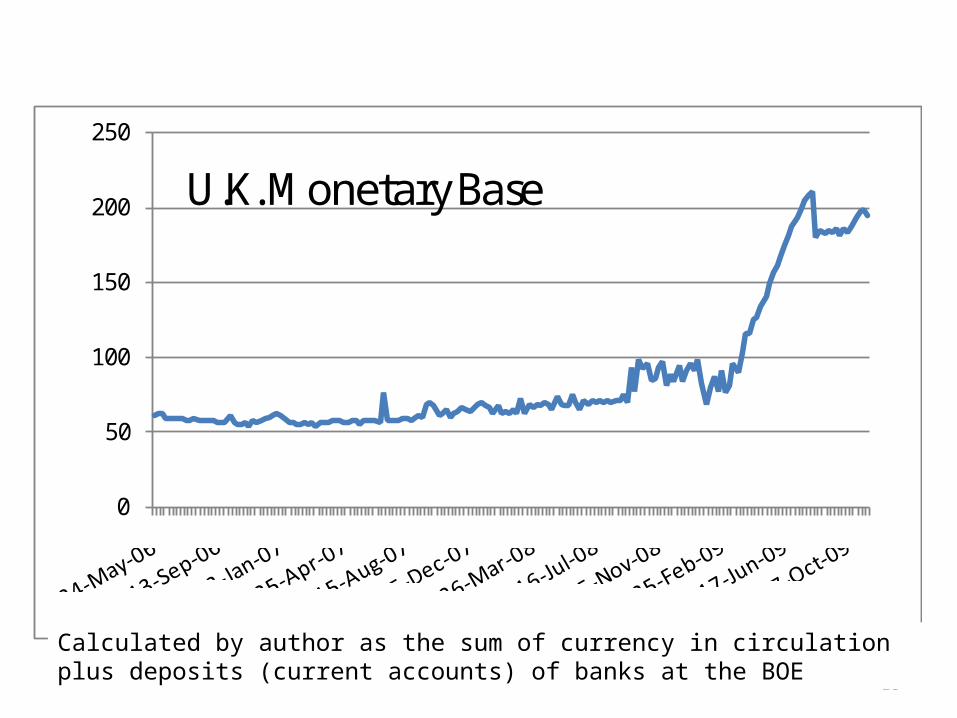
U.K. Monetary Base
Calculated by author as the sum of currency in circulation plus deposits (current accounts) of banks at the BOE
Demand for the Monetary Base 19
Demand for the Monetary Base 20
Demand for the Monetary Base 21
Demand for the Monetary Base 22
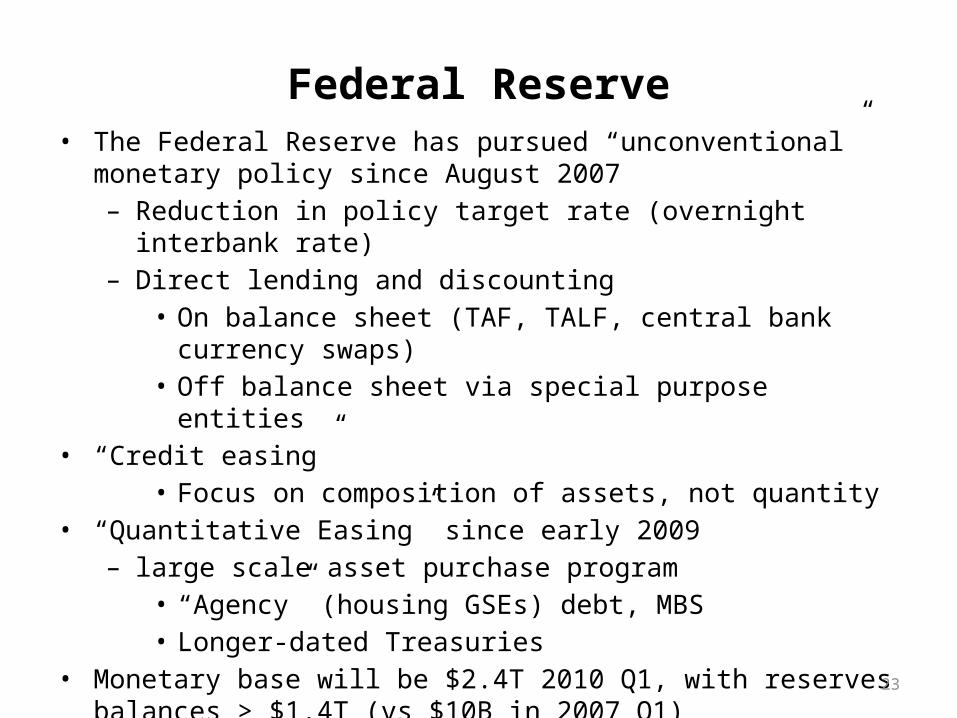
Federal Reserve• The Federal Reserve has pursued “unconventional” monetary policy since
August 2007– Reduction in policy target rate (overnight interbank rate)– Direct lending and discounting
• On balance sheet (TAF, TALF, central bank currency swaps)• Off balance sheet via special purpose entities
• “Credit easing”• Focus on composition of assets, not quantity
• “Quantitative Easing” since early 2009– large scale asset purchase program
• “Agency” (housing GSEs) debt, MBS• Longer-dated Treasuries
• Monetary base will be $2.4T 2010 Q1, with reserves balances > $1.4T (vs $10B in 2007 Q1)
23
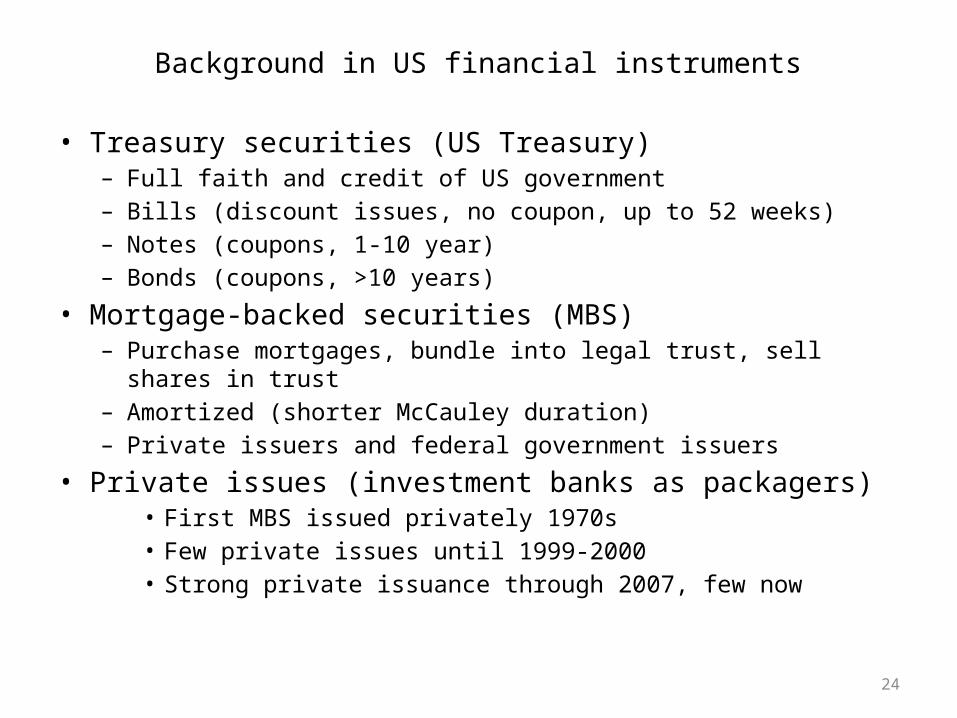
Background in US financial instruments
• Treasury securities (US Treasury)– Full faith and credit of US government– Bills (discount issues, no coupon, up to 52 weeks)– Notes (coupons, 1-10 year)– Bonds (coupons, >10 years)
• Mortgage-backed securities (MBS)– Purchase mortgages, bundle into legal trust, sell shares in trust– Amortized (shorter McCauley duration)– Private issuers and federal government issuers
• Private issues (investment banks as packagers)• First MBS issued privately 1970s• Few private issues until 1999-2000• Strong private issuance through 2007, few now
24
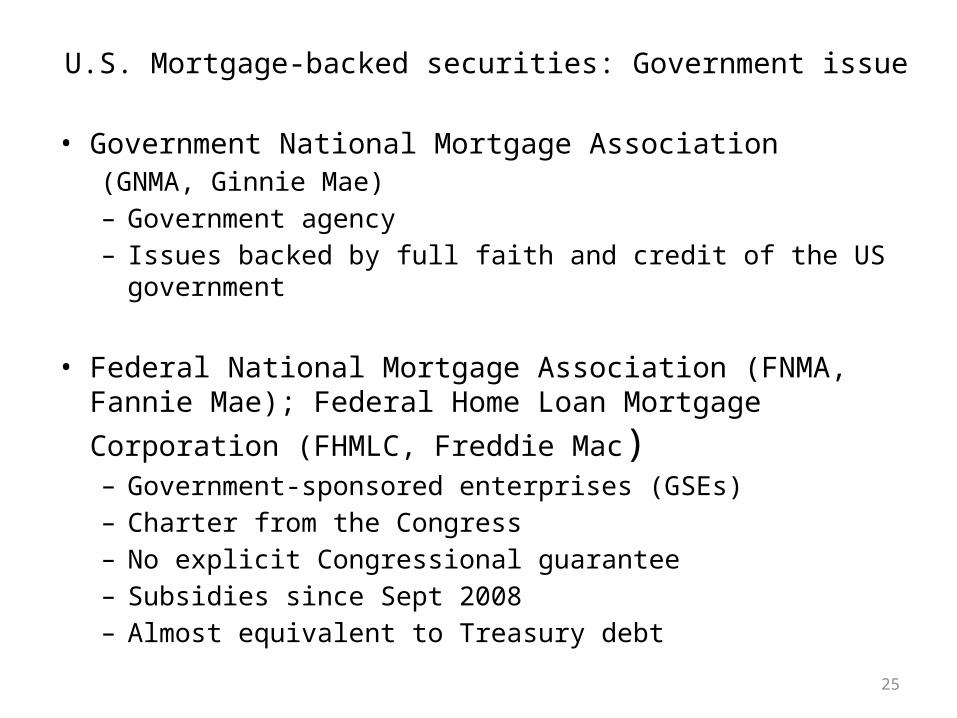
U.S. Mortgage-backed securities: Government issue
• Government National Mortgage Association (GNMA, Ginnie Mae)– Government agency– Issues backed by full faith and credit of the US government
• Federal National Mortgage Association (FNMA, Fannie Mae); Federal Home Loan Mortgage Corporation (FHMLC, Freddie
Mac)– Government-sponsored enterprises (GSEs)– Charter from the Congress– No explicit Congressional guarantee– Subsidies since Sept 2008– Almost equivalent to Treasury debt
25
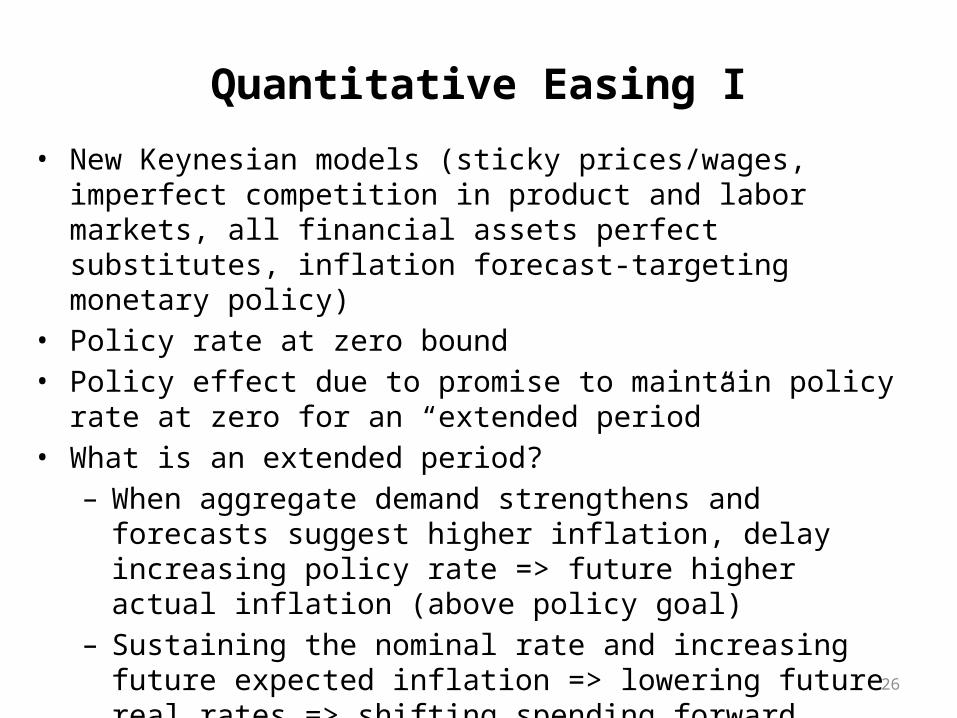
Quantitative Easing I
• New Keynesian models (sticky prices/wages, imperfect competition in product and labor markets, all financial assets perfect substitutes, inflation forecast-targeting monetary policy)
• Policy rate at zero bound• Policy effect due to promise to maintain policy rate at zero for an
“extended period”• What is an extended period?
– When aggregate demand strengthens and forecasts suggest higher inflation, delay increasing policy rate => future higher actual inflation (above policy goal)
– Sustaining the nominal rate and increasing future expected inflation => lowering future real rates => shifting spending forward
• Balance sheet increases are a commitment mechanism to increase the cost of policymakers reneging on the “extended period” promise
26
27
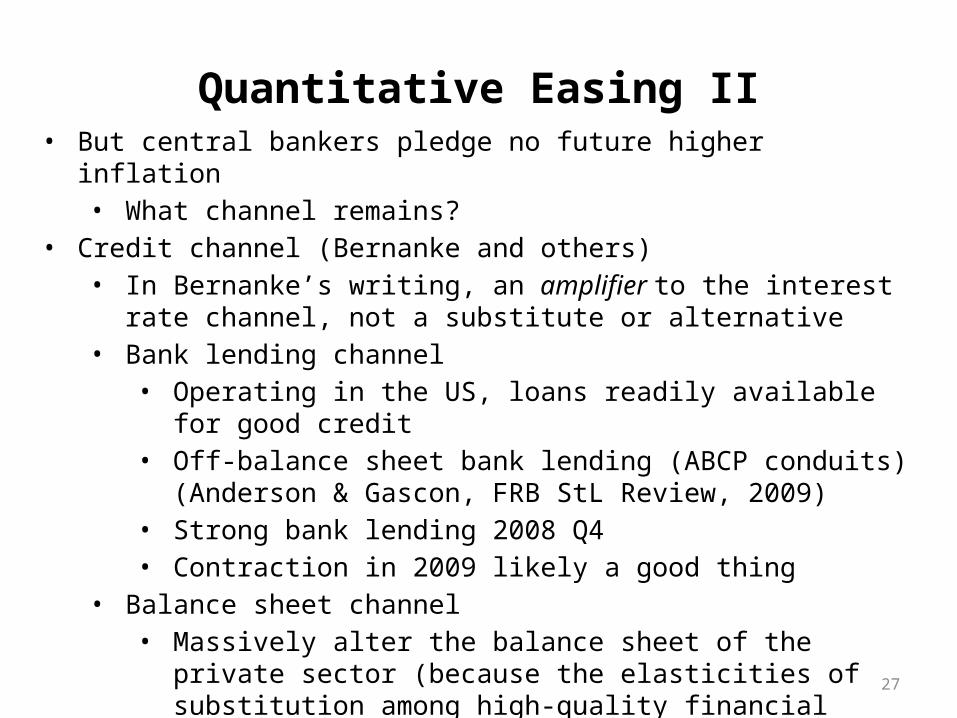
Quantitative Easing II• But central bankers pledge no future higher inflation
• What channel remains?• Credit channel (Bernanke and others)
• In Bernanke’s writing, an amplifier to the interest rate channel, not a substitute or alternative
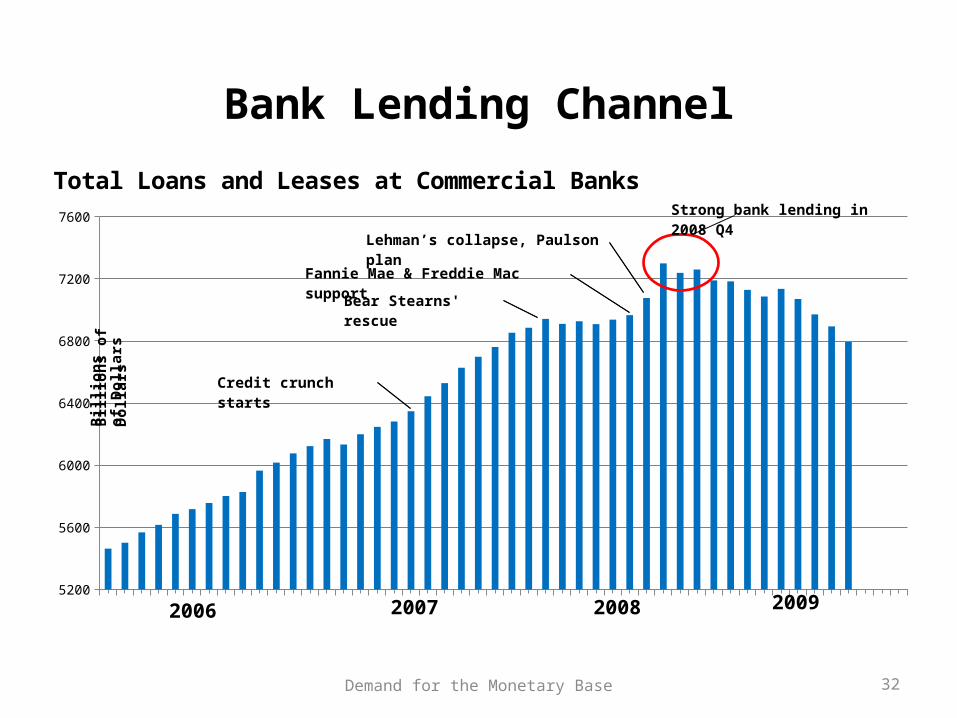
• Bank lending channel• Operating in the US, loans readily available for good credit• Off-balance sheet bank lending (ABCP conduits) (Anderson &
Gascon, FRB StL Review, 2009)• Strong bank lending 2008 Q4• Contraction in 2009 likely a good thing
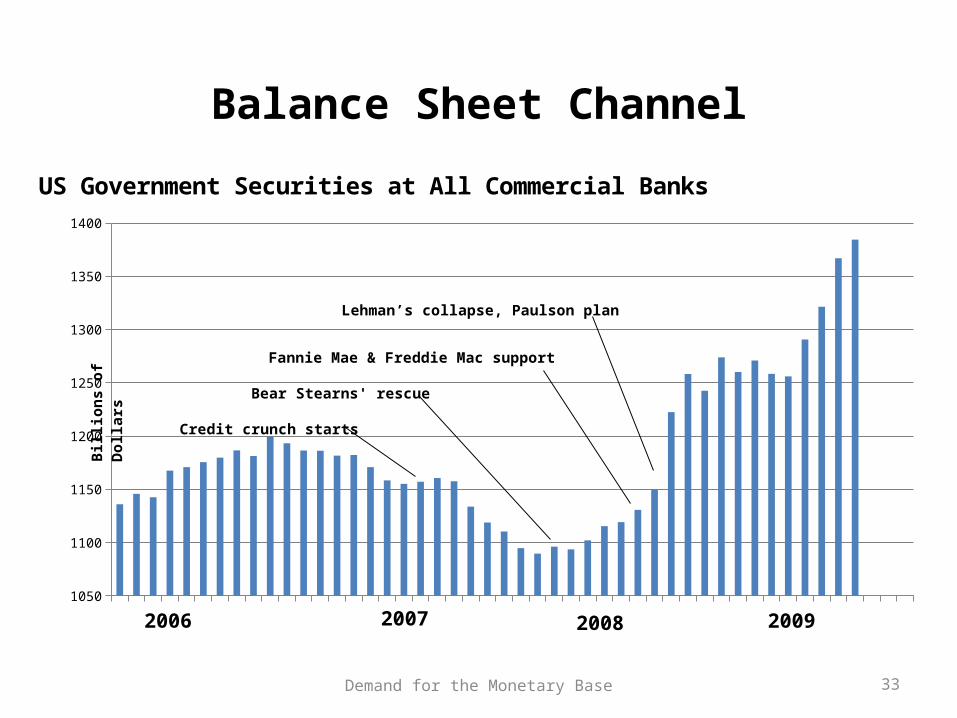
• Balance sheet channel• Massively alter the balance sheet of the private sector (because the
elasticities of substitution among high-quality financial assets are large => small price impact)
28
-140
-70
0
70
140
210
280
350
2007 2008 2009
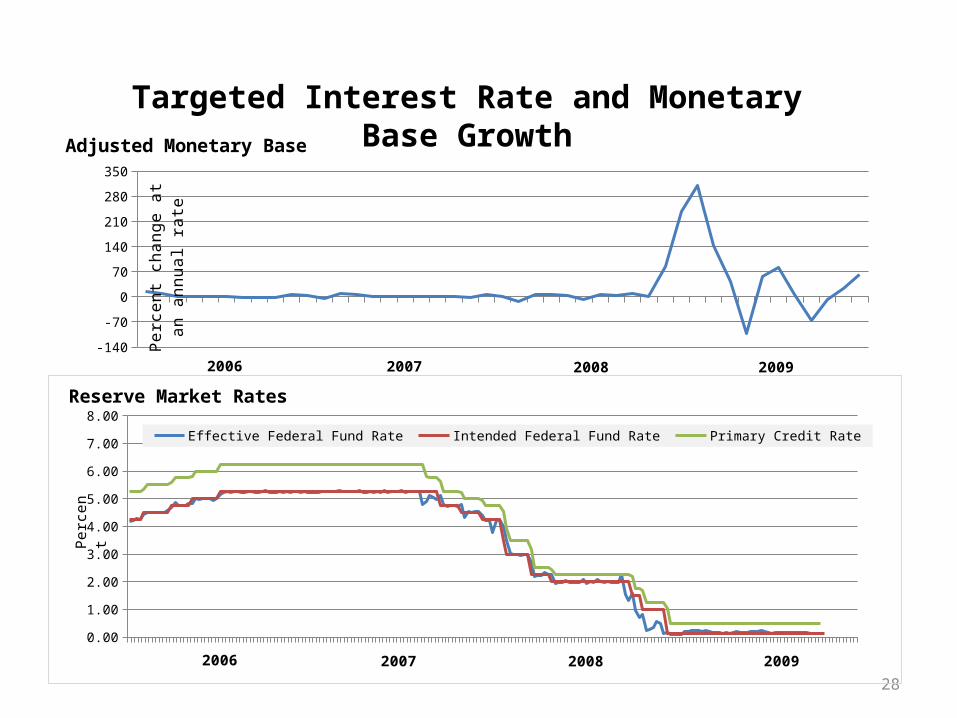
Adjusted Monetary BaseP
erce
nt c
hang
e at
an
annu
al
rate
2006
Targeted Interest Rate and Monetary Base Growth
0.00
1.00
2.00
3.00
4.00
5.00
6.00
7.00
8.00Effective Federal Fund Rate Intended Federal Fund Rate Primary Credit Rate
Perc
ent
Reserve Market Rates
20072006 2008 2009
29Demand for the Monetary Base
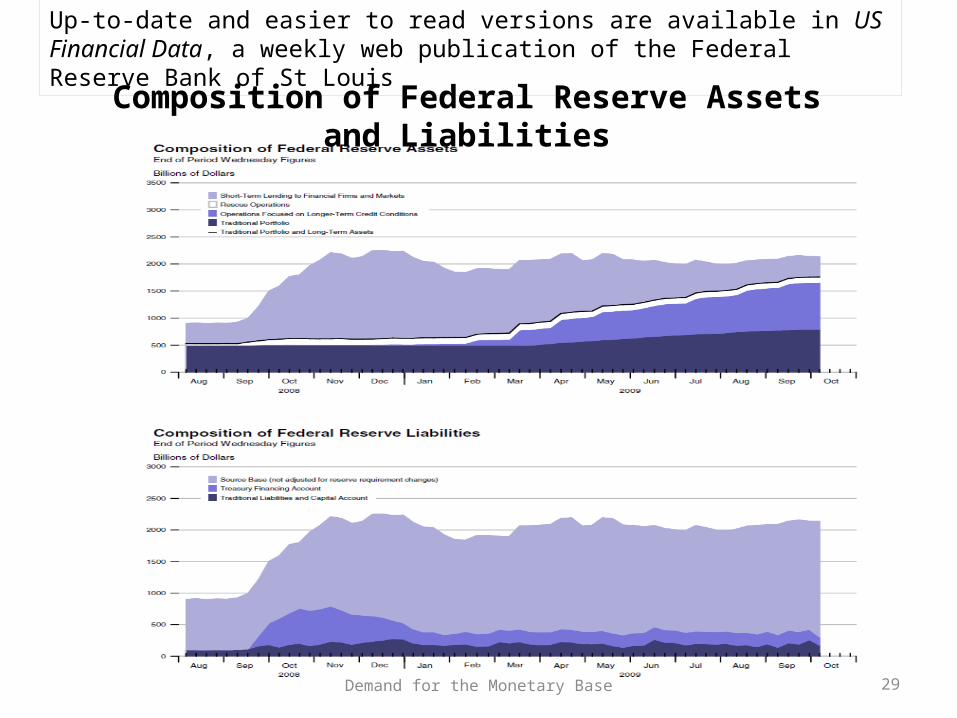
Composition of Federal Reserve Assets and Liabilities
Up-to-date and easier to read versions are available in US Financial Data, a weekly web publication of the Federal Reserve Bank of St Louis
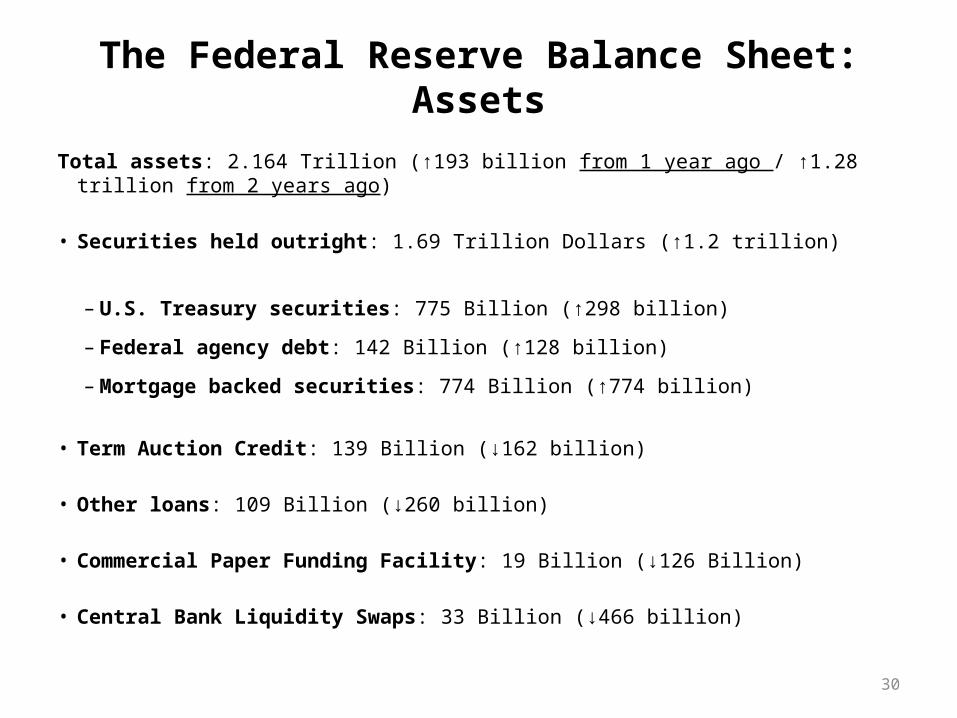
The Federal Reserve Balance Sheet: Assets
Total assets: 2.164 Trillion (↑193 billion from 1 year ago / ↑1.28 trillion from 2 years ago) • Securities held outright: 1.69 Trillion Dollars (↑1.2 trillion)
– U.S. Treasury securities: 775 Billion (↑298 billion)
– Federal agency debt: 142 Billion (↑128 billion)
– Mortgage backed securities: 774 Billion (↑774 billion)
• Term Auction Credit: 139 Billion (↓162 billion)
• Other loans: 109 Billion (↓260 billion)
• Commercial Paper Funding Facility: 19 Billion (↓126 Billion)
• Central Bank Liquidity Swaps: 33 Billion (↓466 billion)
30
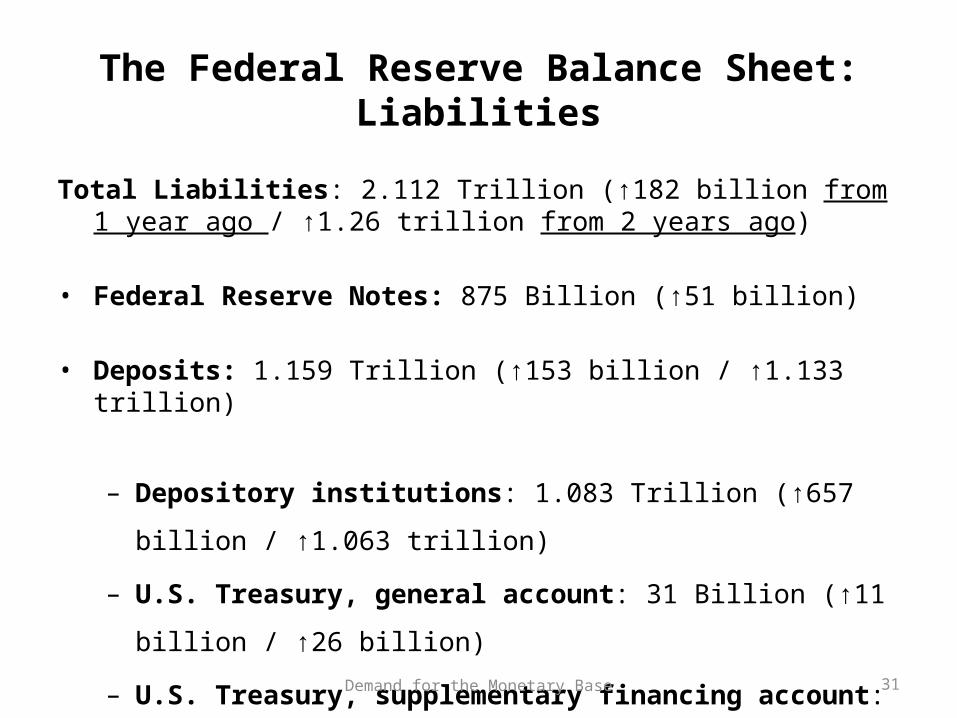
Total Liabilities: 2.112 Trillion (↑182 billion from 1 year ago / ↑1.26 trillion from 2 years ago)
• Federal Reserve Notes: 875 Billion (↑51 billion)
• Deposits: 1.159 Trillion (↑153 billion / ↑1.133 trillion)
– Depository institutions: 1.083 Trillion (↑657 billion / ↑1.063 trillion)
– U.S. Treasury, general account: 31 Billion (↑11 billion / ↑26 billion)
– U.S. Treasury, supplementary financing account: 30 Billion (↓529
billion)
Demand for the Monetary Base 31
The Federal Reserve Balance Sheet: Liabilities
Demand for the Monetary Base 32
5200
5600
6000
6400
6800
7200
7600
Bill
ions
of
Dol
-la
rs
Bear Stearns' res-cue
Fannie Mae & Freddie Mac sup-port
Lehman’s collapse, Paulson plan
2006 2007 2008 2009
Total Loans and Leases at Commercial Banks
Credit crunch starts
Bill
ions
of
Dol
-la
rs
Strong bank lending in 2008 Q4
Bank Lending Channel
Demand for the Monetary Base 33
1050
1100
1150
1200
1250
1300
1350
1400
US Government Securities at All Commercial Banks
2006 2007 2008 2009
Lehman’s collapse, Paulson plan
Fannie Mae & Freddie Mac support
Bear Stearns' rescue
Credit crunch starts
Billi
ons
of D
olla
rsBalance Sheet Channel
Demand for the Monetary Base 34
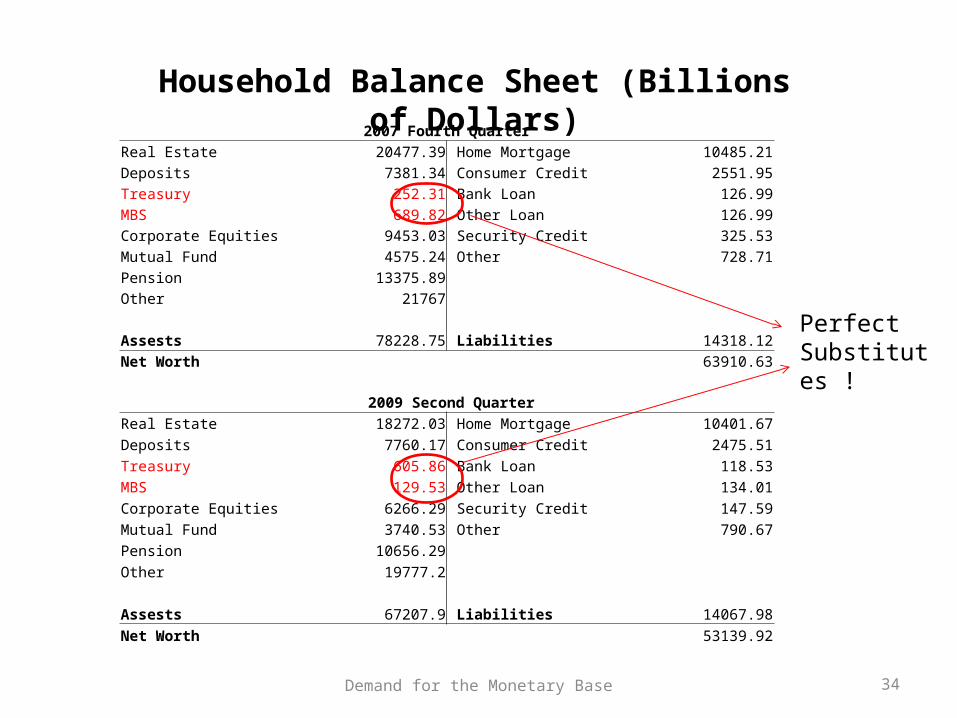
2007 Fourth Quarter Real Estate 20477.39 Home Mortgage 10485.21Deposits 7381.34 Consumer Credit 2551.95Treasury 252.31 Bank Loan 126.99MBS 689.82 Other Loan 126.99Corporate Equities 9453.03 Security Credit 325.53Mutual Fund 4575.24 Other 728.71Pension 13375.89Other 21767
Assests 78228.75 Liabilities 14318.12Net Worth 63910.63
2009 Second QuarterReal Estate 18272.03 Home Mortgage 10401.67Deposits 7760.17 Consumer Credit 2475.51Treasury 605.86 Bank Loan 118.53MBS 129.53 Other Loan 134.01Corporate Equities 6266.29 Security Credit 147.59Mutual Fund 3740.53 Other 790.67Pension 10656.29Other 19777.2
Assests 67207.9 Liabilities 14067.98Net Worth 53139.92
Household Balance Sheet (Billions of Dollars)
Perfect Substitutes !
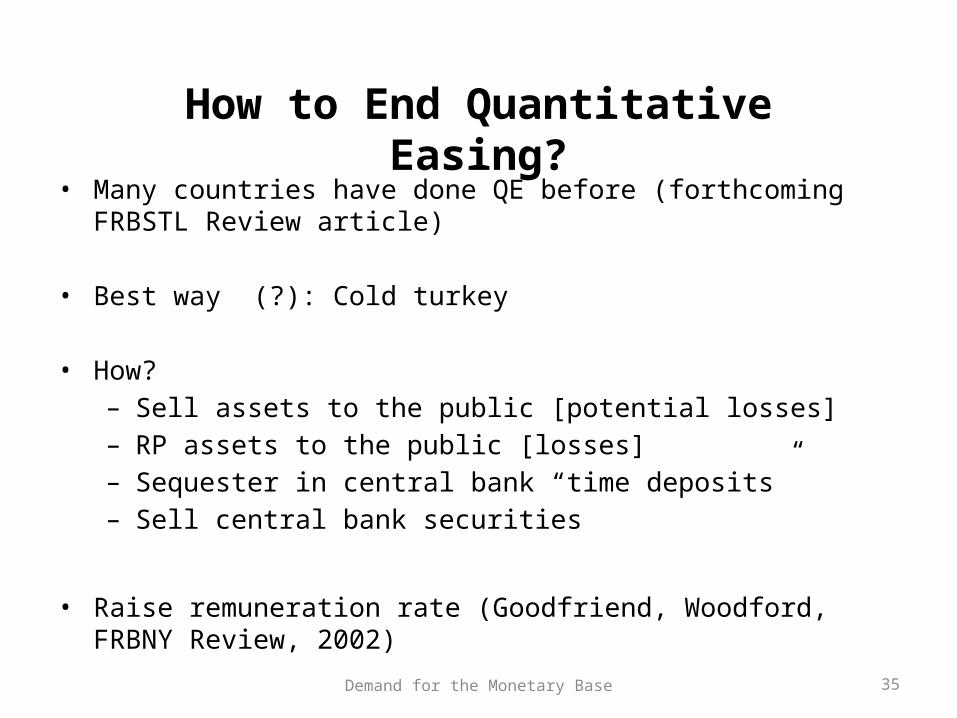
• Many countries have done QE before (forthcoming FRBSTL Review article)
• Best way (?): Cold turkey
• How?– Sell assets to the public [potential losses]– RP assets to the public [losses]– Sequester in central bank “time deposits”– Sell central bank securities
• Raise remuneration rate (Goodfriend, Woodford, FRBNY Review, 2002)
Demand for the Monetary Base 35
How to End Quantitative Easing?
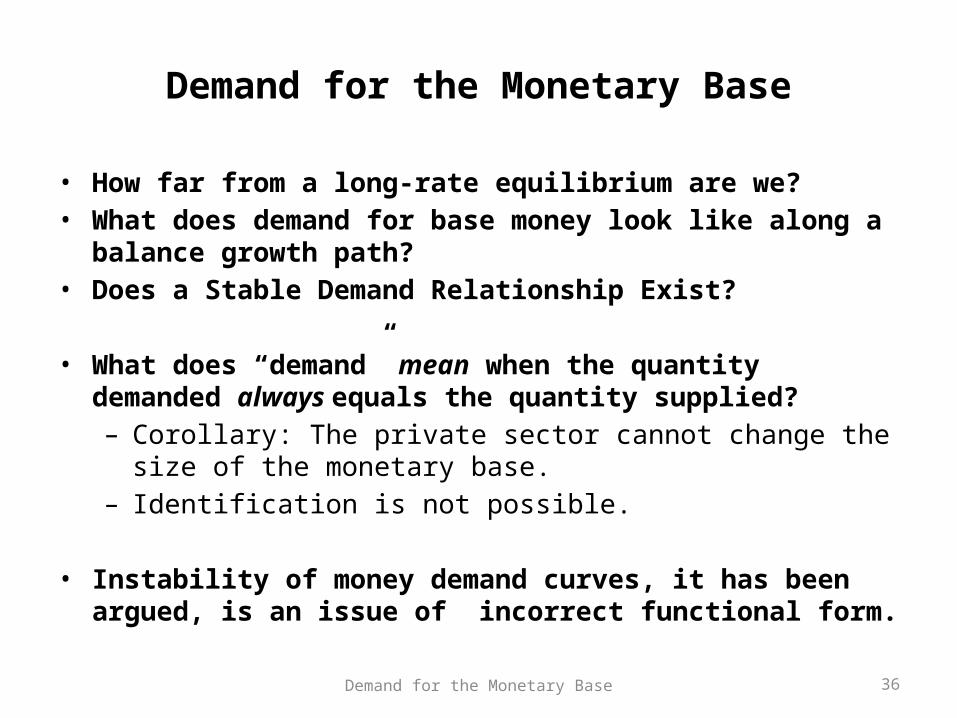
• How far from a long-rate equilibrium are we?• What does demand for base money look like along a balance growth
path?• Does a Stable Demand Relationship Exist?
• What does “demand” mean when the quantity demanded always equals the quantity supplied? – Corollary: The private sector cannot change the size of the
monetary base.– Identification is not possible.
• Instability of money demand curves, it has been argued, is an issue of incorrect functional form.
36Demand for the Monetary Base
Demand for the Monetary Base
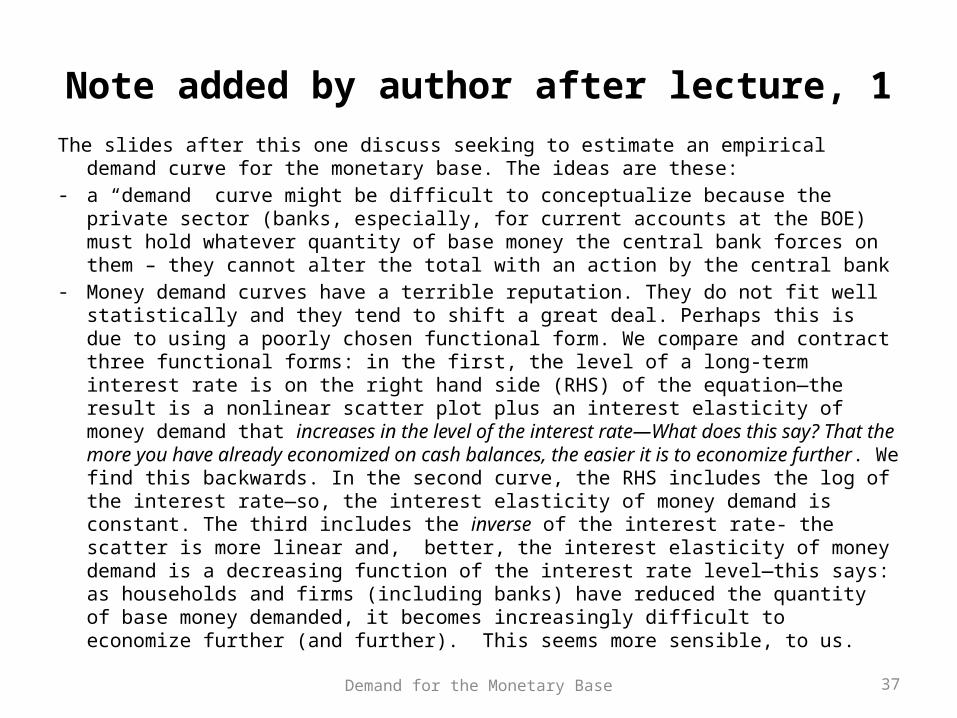
The slides after this one discuss seeking to estimate an empirical demand curve for the monetary base. The ideas are these:
- a “demand” curve might be difficult to conceptualize because the private sector (banks, especially, for current accounts at the BOE) must hold whatever quantity of base money the central bank forces on them – they cannot alter the total with an action by the central bank
- Money demand curves have a terrible reputation. They do not fit well statistically and they tend to shift a great deal. Perhaps this is due to using a poorly chosen functional form. We compare and contract three functional forms: in the first, the level of a long-term interest rate is on the right hand side (RHS) of the equation—the result is a nonlinear scatter plot plus an interest elasticity of money demand that increases in the level of the interest rate—What does this say? That the more you have already economized on cash balances, the easier it is to economize further. We find this backwards. In the second curve, the RHS includes the log of the interest rate—so, the interest elasticity of money demand is constant. The third includes the inverse of the interest rate- the scatter is more linear and, better, the interest elasticity of money demand is a decreasing function of the interest rate level—this says: as households and firms (including banks) have reduced the quantity of base money demanded, it becomes increasingly difficult to economize further (and further). This seems more sensible, to us.
37Demand for the Monetary Base
Note added by author after lecture, 1
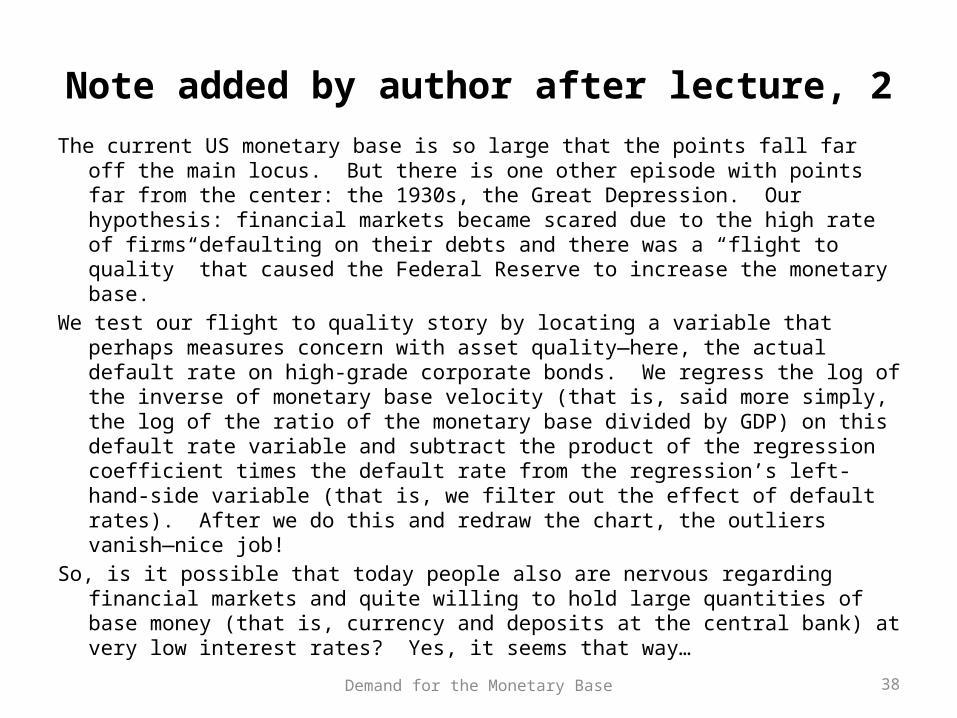
The current US monetary base is so large that the points fall far off the main locus. But there is one other episode with points far from the center: the 1930s, the Great Depression. Our hypothesis: financial markets became scared due to the high rate of firms defaulting on their debts and there was a “flight to quality” that caused the Federal Reserve to increase the monetary base.
We test our flight to quality story by locating a variable that perhaps measures concern with asset quality—here, the actual default rate on high-grade corporate bonds. We regress the log of the inverse of monetary base velocity (that is, said more simply, the log of the ratio of the monetary base divided by GDP) on this default rate variable and subtract the product of the regression coefficient times the default rate from the regression’s left-hand-side variable (that is, we filter out the effect of default rates). After we do this and redraw the chart, the outliers vanish—nice job!
So, is it possible that today people also are nervous regarding financial markets and quite willing to hold large quantities of base money (that is, currency and deposits at the central bank) at very low interest rates? Yes, it seems that way…
38Demand for the Monetary Base
Note added by author after lecture, 2
We proceed by using a Box-Cox test to examine how well the three functional forms match the data. The Box-Cox equation is nice because as a single parameter (λ) moves between -1 and +1, it mimics the scatter we had on the previous slides: -1 matches the inverse rate, 0 matches the log interest rate (number 2), and +1 matches the level interest rate (example 1). The third wins because it is more linear.
But, now, we have a different problem—in equation 3 (the inverse one) the interest elasticity of money demand is a function of the level of the rate– the regression coefficient estimate is a constant but the elasticity is not. So, we draw some charts of how the interest elasticity varies with λ when the interest rate is held constant at each of three values: the minimum in the dataset, the maximum in the dataset, and the median. When the interest rate is at the median, the interest elasticity of monetary base demand changes very little as λ varies between -1 and +1. But if the interest rate is far from the median value, the interest elasticity changes dramatically as λ moves from -1 to 0 to +1. Lesson: Functional form matters!
The final slides estimate a 3-equation structural VAR model, in which the third equation might be a demand curve for the monetary base. Too much econometrics to explain here… but we like the result.
39Demand for the Monetary Base
Note added by author after lecture, 3
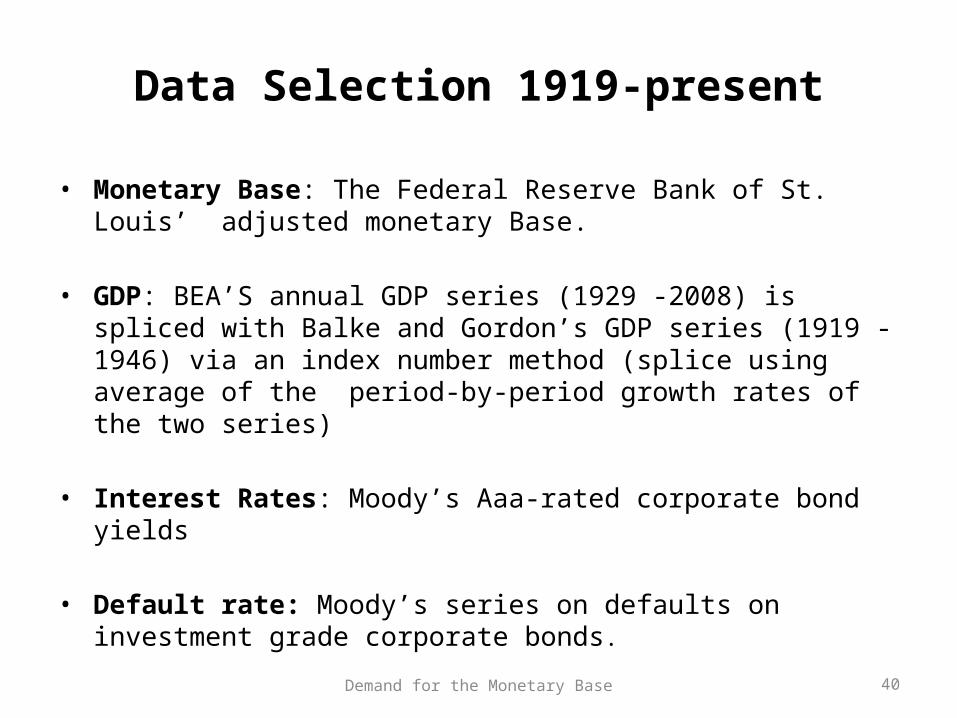
Data Selection 1919-present
• Monetary Base: The Federal Reserve Bank of St. Louis’ adjusted monetary Base.
• GDP: BEA’S annual GDP series (1929 -2008) is spliced with Balke and Gordon’s GDP series (1919 - 1946) via an index number method (splice using average of the period-by-period growth rates of the two series)
• Interest Rates: Moody’s Aaa-rated corporate bond yields
• Default rate: Moody’s series on defaults on investment grade corporate bonds.
40Demand for the Monetary Base
0 2 4 6 8 10 12 14 16-5.25
-5.00
-4.75
-4.50
-4.25
-4.00
-3.75
-3.50
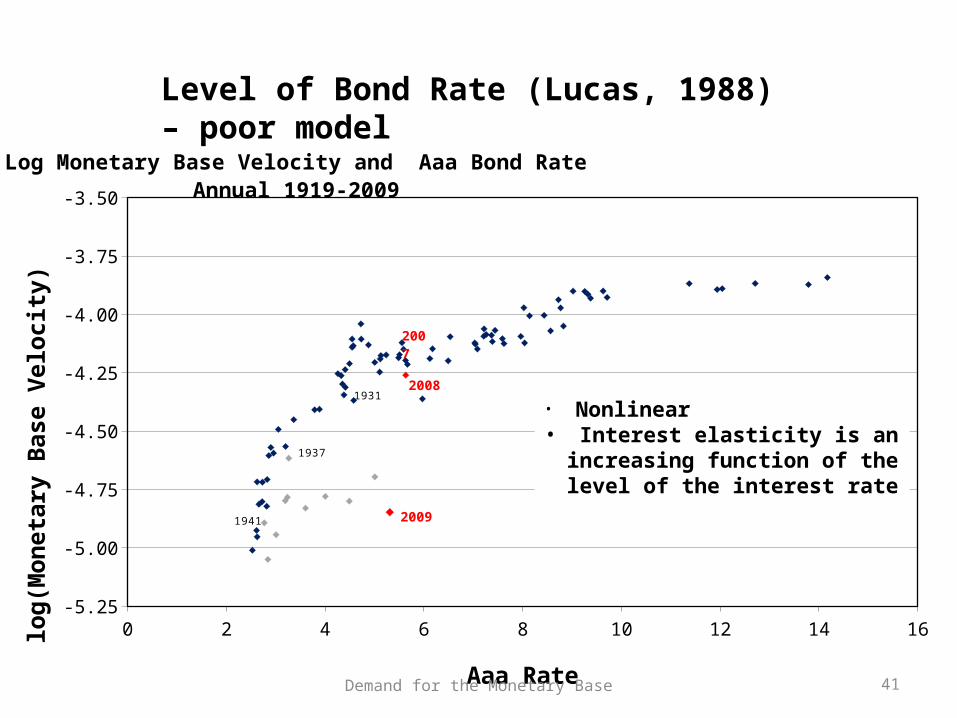
Log Monetary Base Velocity and Aaa Bond RateAnnual 1919-2009
Aaa Rate
log
(Mo
net
ary
Bas
e V
elo
city
)
2009
1941
1931
1937
2007
2008
Level of Bond Rate (Lucas, 1988) – poor model
• Nonlinear• Interest elasticity is an increasing
function of the level of the interest rate
41Demand for the Monetary Base
0.8 1 1.2 1.4 1.6 1.8 2 2.2 2.4 2.6 2.8-5.25
-5.00
-4.75
-4.50
-4.25
-4.00
-3.75
-3.50
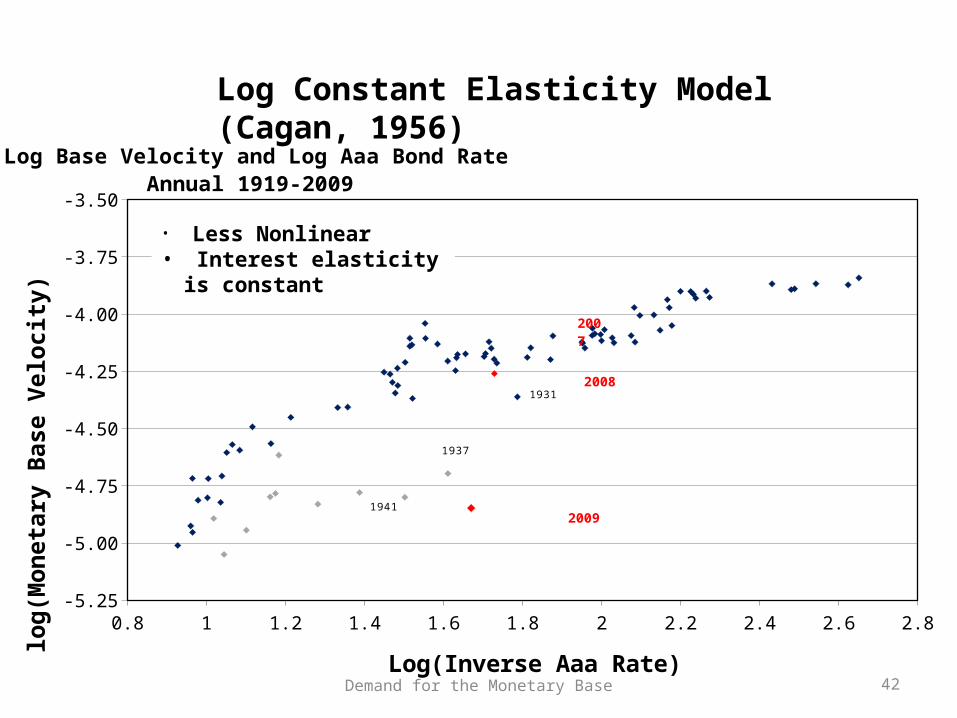
Log Base Velocity and Log Aaa Bond RateAnnual 1919-2009
Log(Inverse Aaa Rate)
log
(Mo
net
ary
Bas
e V
elo
city
)
2009
1941
1931
1937
2007
2008
Log Constant Elasticity Model (Cagan, 1956)
• Less Nonlinear• Interest elasticity is constant
42Demand for the Monetary Base
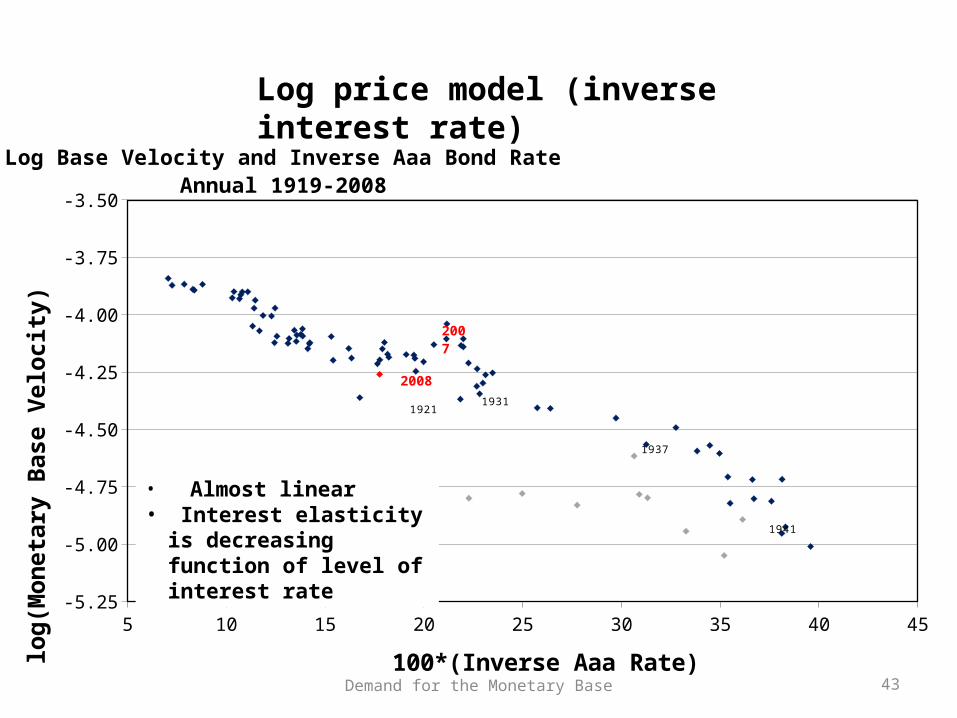
5 10 15 20 25 30 35 40 45-5.25
-5.00
-4.75
-4.50
-4.25
-4.00
-3.75
-3.50
Log Base Velocity and Inverse Aaa Bond RateAnnual 1919-2008
100*(Inverse Aaa Rate)
log
(Mo
net
ary
Bas
e V
elo
city
)
1941
19211931
1937
2007
2008
Log price model (inverse interest rate)
• Almost linear• Interest elasticity is
decreasing function of level of interest rate
43Demand for the Monetary Base
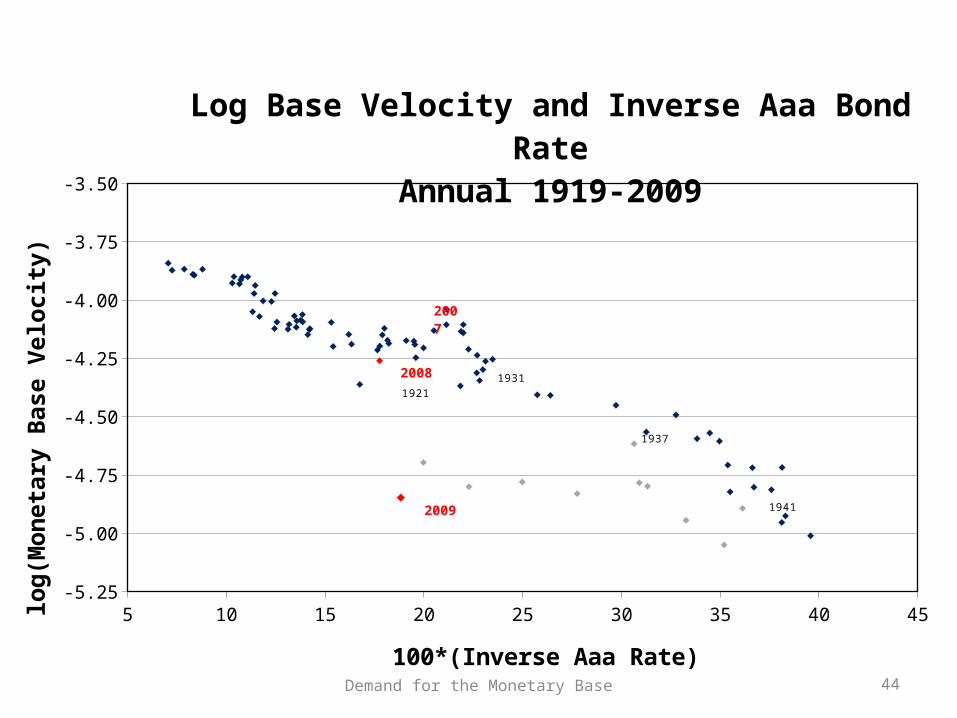
5 10 15 20 25 30 35 40 45-5.25
-5.00
-4.75
-4.50
-4.25
-4.00
-3.75
-3.50
Log Base Velocity and Inverse Aaa Bond RateAnnual 1919-2009
100*(Inverse Aaa Rate)
log
(Mo
net
ary
Bas
e V
elo
city
)
2009 1941
1921
1931
1937
2007
2008
44Demand for the Monetary Base
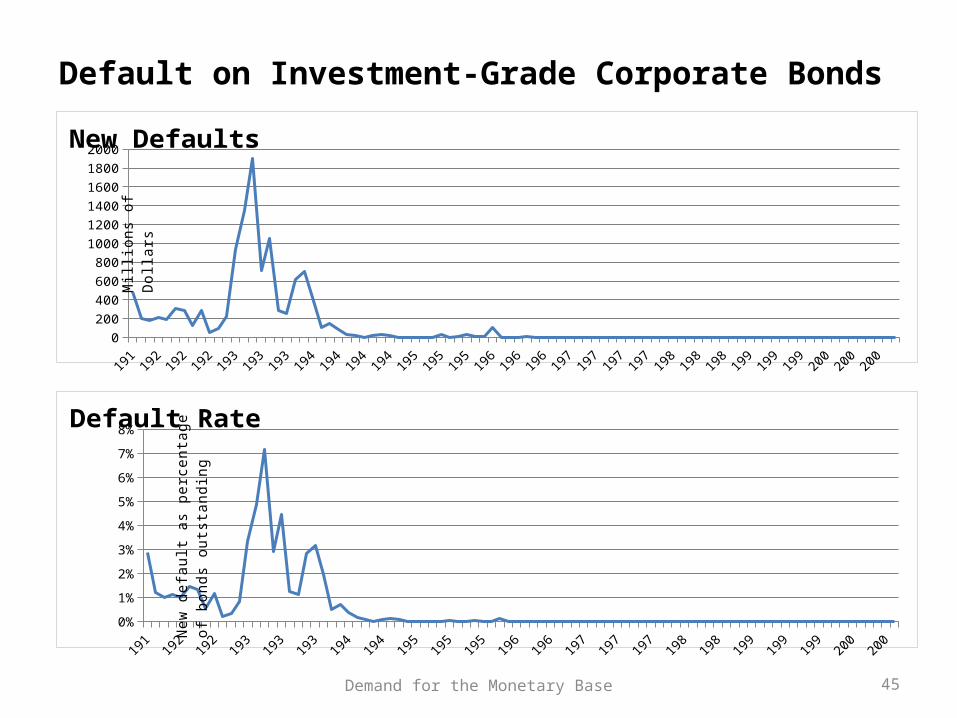
Default on Investment-Grade Corporate Bonds
0%
1%
2%
3%
4%
5%
6%
7%
8%Default Rate
New
def
ault
as p
erce
ntag
e of
bon
ds
outs
tand
ing
0200400600800
100012001400160018002000
New DefaultsM
illio
ns o
f D
olla
rs
45Demand for the Monetary Base
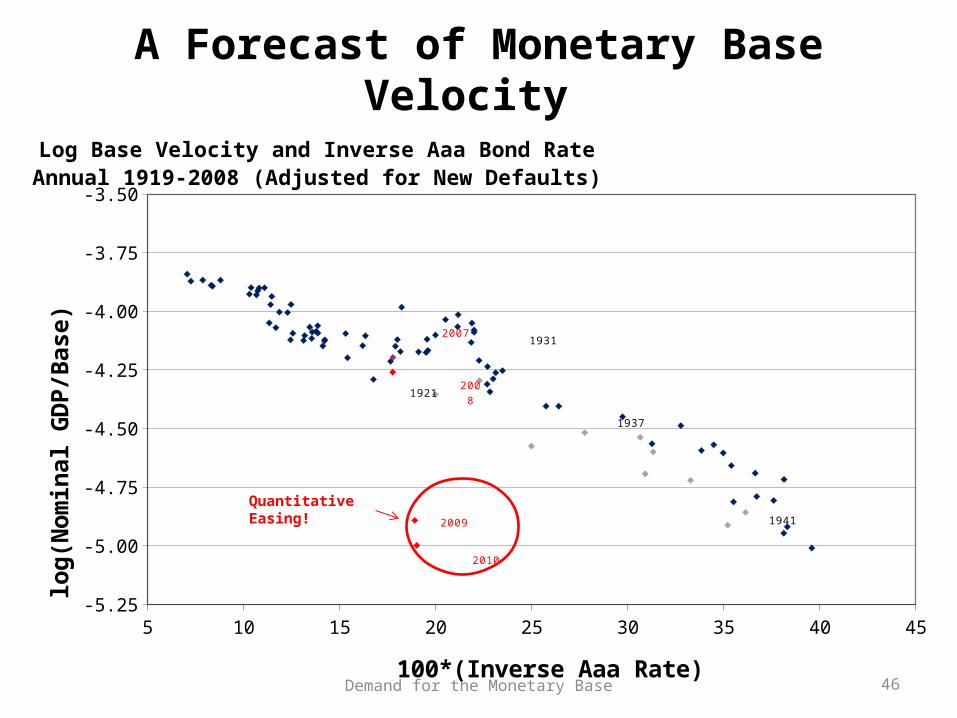
A Forecast of Monetary Base Velocity
46Demand for the Monetary Base
5 10 15 20 25 30 35 40 45-5.25
-5.00
-4.75
-4.50
-4.25
-4.00
-3.75
-3.50
Log Base Velocity and Inverse Aaa Bond RateAnnual 1919-2008 (Adjusted for New Defaults)
100*(Inverse Aaa Rate)
log
(No
min
al G
DP
/Bas
e)
1921
1931
1937
1941
2007
2008
2009
2010
Quantitative Easing!
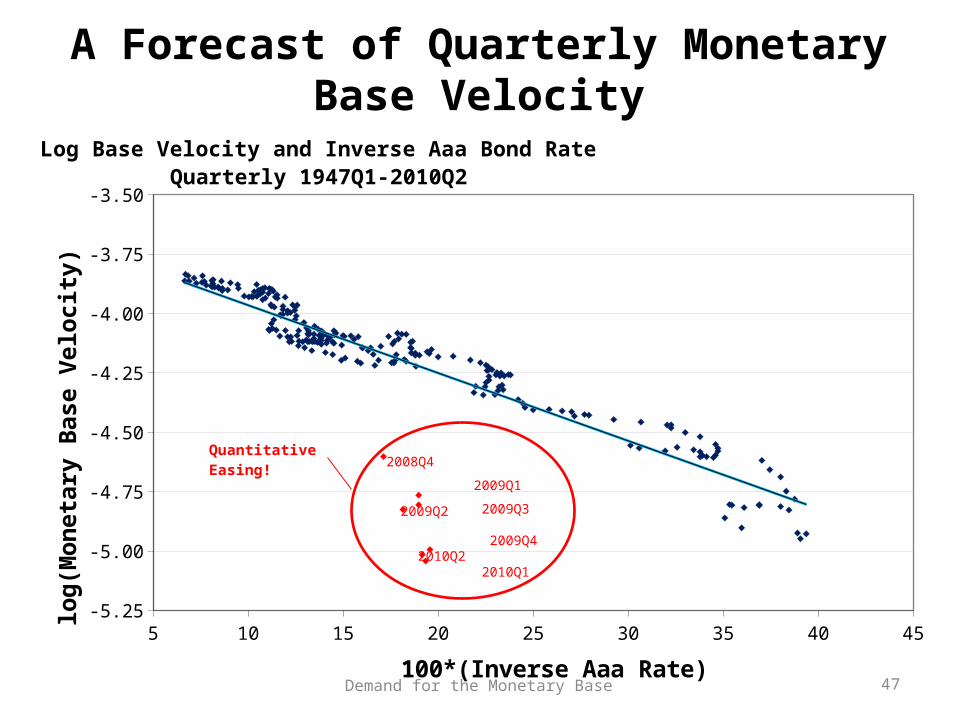
A Forecast of Quarterly Monetary Base Velocity
47Demand for the Monetary Base
5 10 15 20 25 30 35 40 45-5.25
-5.00
-4.75
-4.50
-4.25
-4.00
-3.75
-3.50
Log Base Velocity and Inverse Aaa Bond RateQuarterly 1947Q1-2010Q2
100*(Inverse Aaa Rate)
log
(Mo
net
ary
Bas
e V
elo
city
)
2008Q4
2009Q1
2009Q2 2009Q3
2009Q4
2010Q12010Q2
Quantitative Easing!
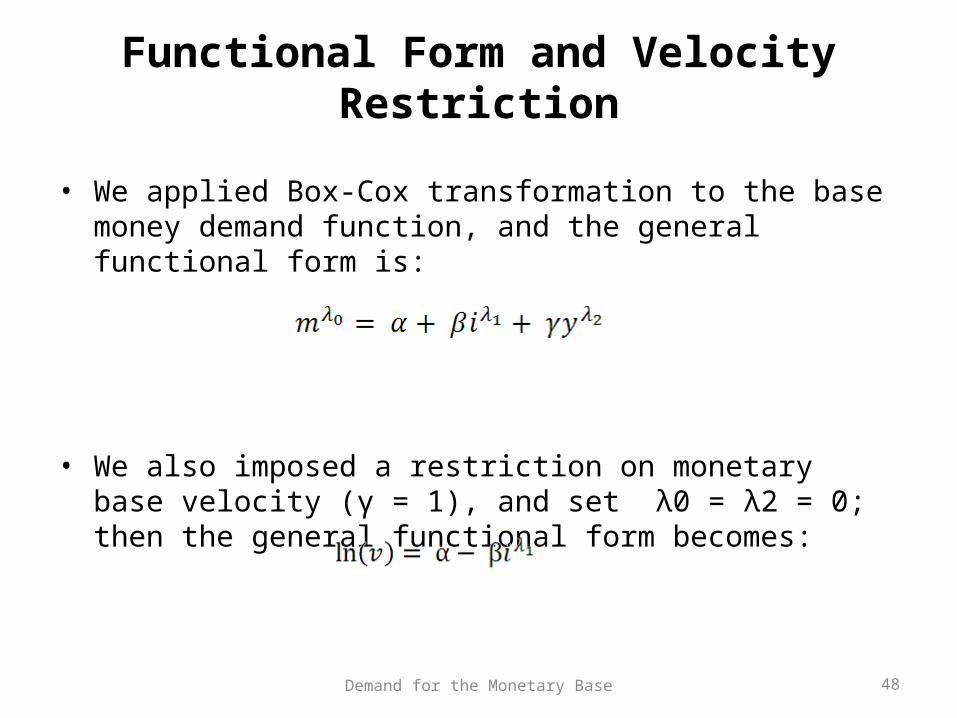
Functional Form and Velocity Restriction
• We applied Box-Cox transformation to the base money demand function, and the general functional form is:
• We also imposed a restriction on monetary base velocity (γ = 1), and set λ0 = λ2 = 0; then the general functional form becomes:
48Demand for the Monetary Base
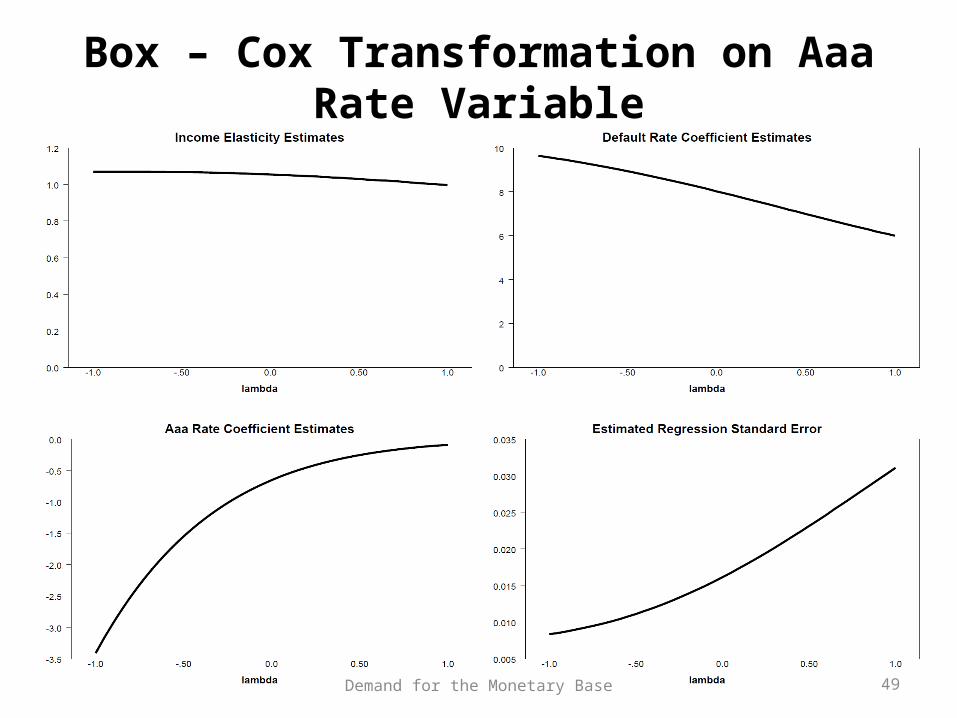
Box – Cox Transformation on Aaa Rate Variable
49Demand for the Monetary Base
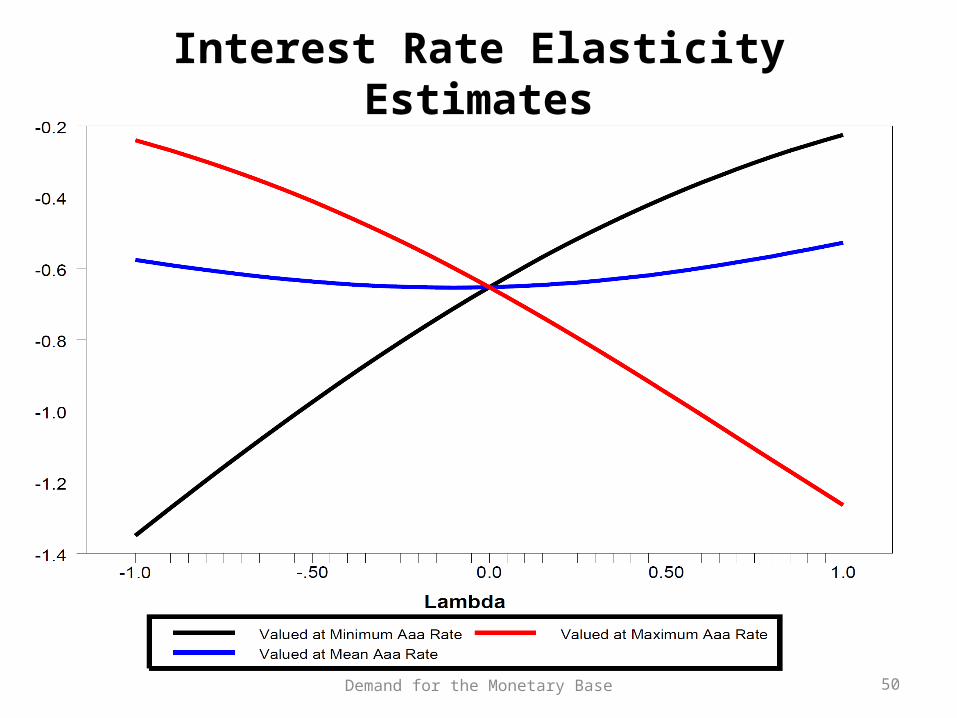
Interest Rate Elasticity Estimates
50Demand for the Monetary Base

Forward and Backward Recursive Estimations
51Demand for the Monetary Base
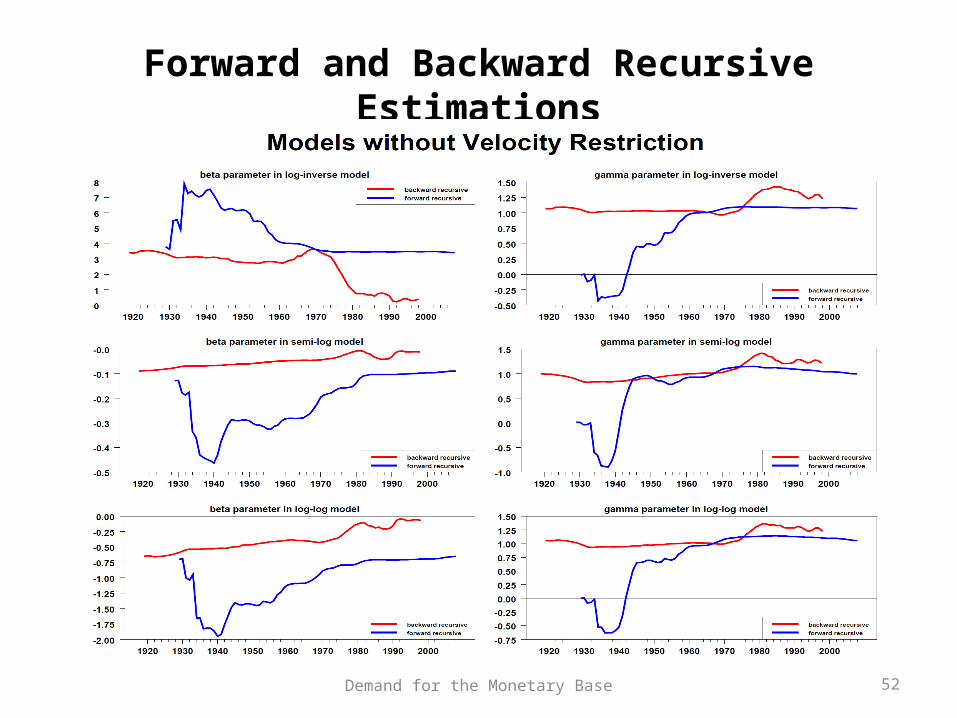
Forward and Backward Recursive Estimations
52Demand for the Monetary Base
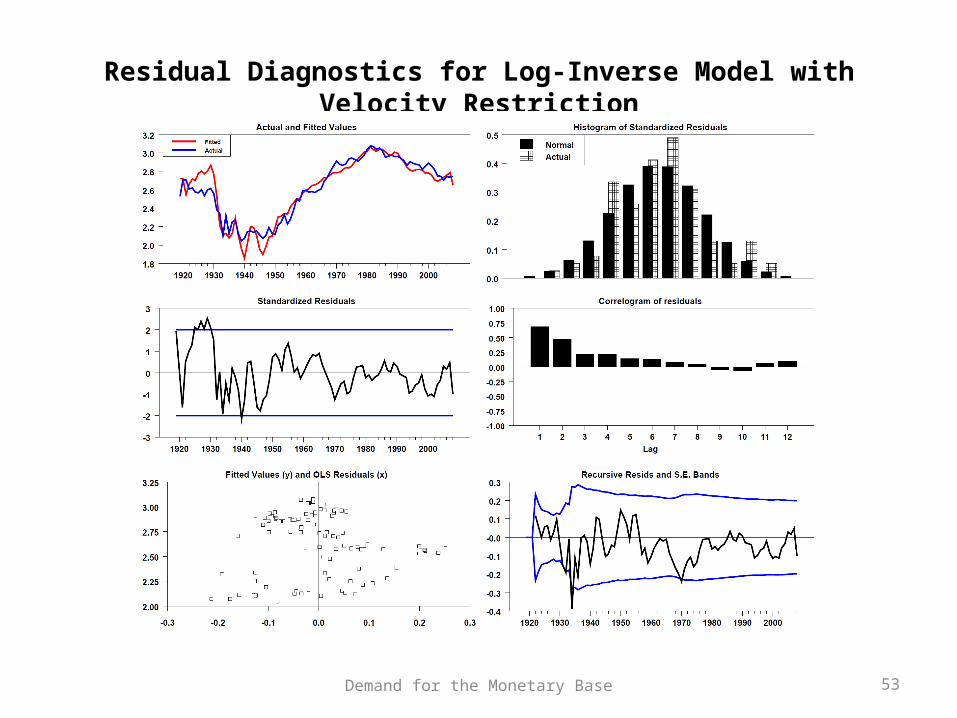
Residual Diagnostics for Log-Inverse Model with Velocity Restriction
53Demand for the Monetary Base
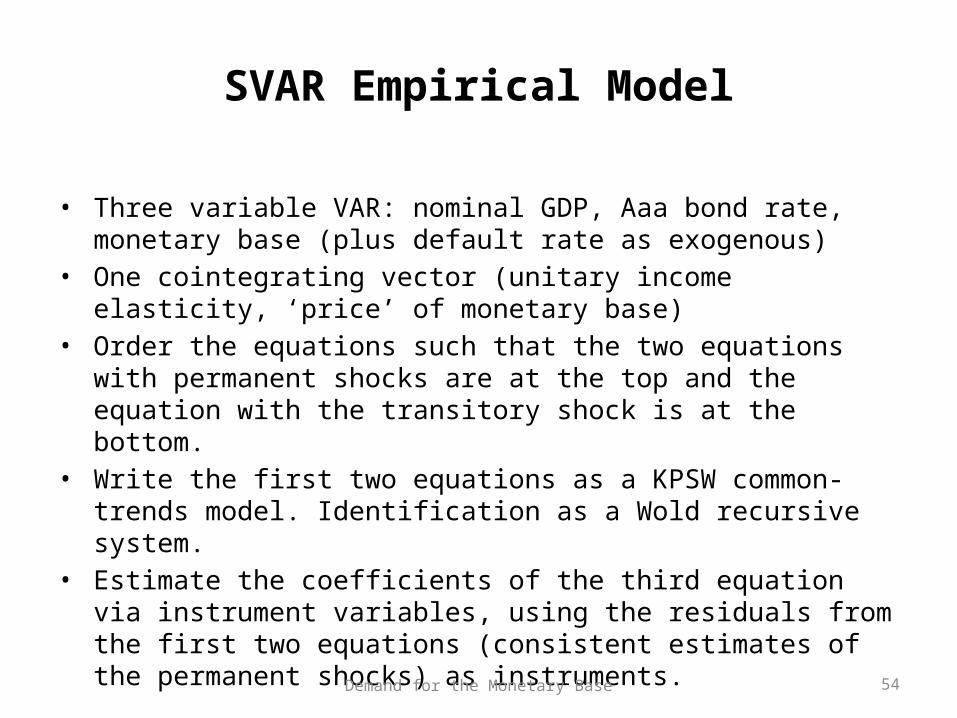
SVAR Empirical Model
• Three variable VAR: nominal GDP, Aaa bond rate, monetary base (plus default rate as exogenous)
• One cointegrating vector (unitary income elasticity, ‘price’ of monetary base)
• Order the equations such that the two equations with permanent shocks are at the top and the equation with the transitory shock is at the bottom.
• Write the first two equations as a KPSW common-trends model. Identification as a Wold recursive system.
• Estimate the coefficients of the third equation via instrument variables, using the residuals from the first two equations (consistent estimates of the permanent shocks) as instruments.
54Demand for the Monetary Base
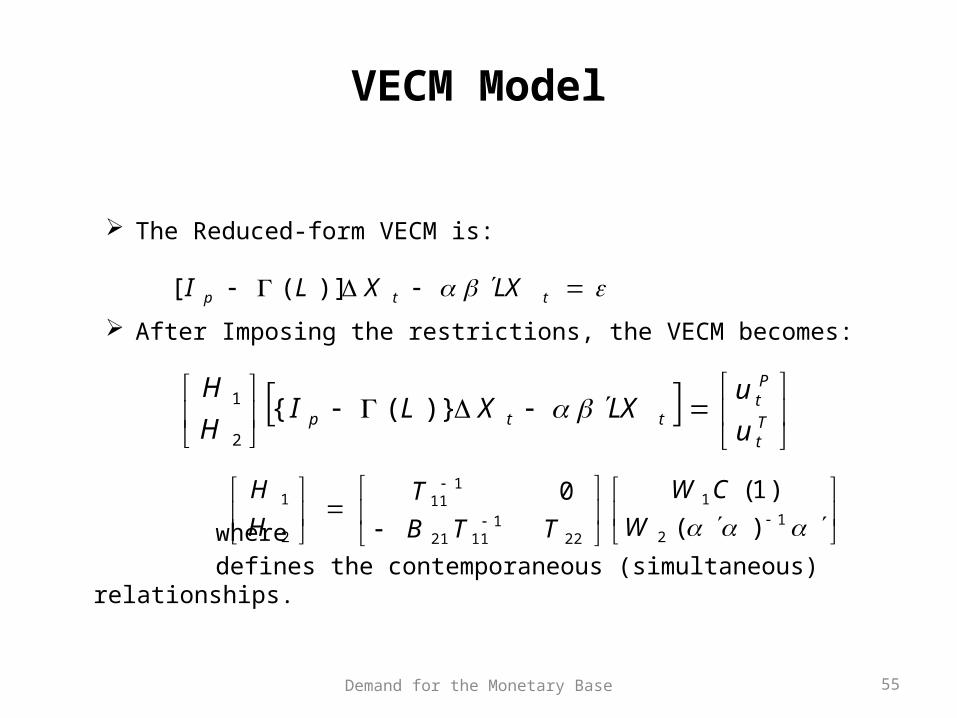
VECM Model
The Reduced-form VECM is:
After Imposing the restrictions, the VECM becomes:
where defines the contemporaneous (simultaneous) relationships.
Tt
Pt
ttpu
uLXXLI
H
H)}({
2
1
ttp LXXLI )]([
12
1
221
1121
111
2
1
)(
)1(0
W
CW
TTB
T
H
H
55Demand for the Monetary Base
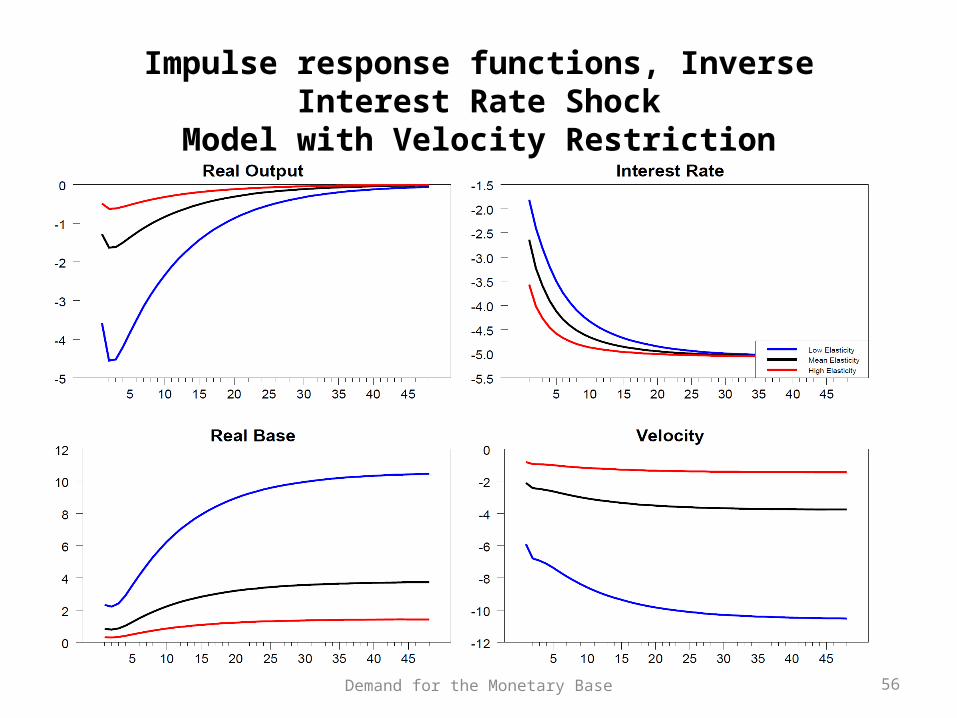
Impulse response functions, Inverse Interest Rate ShockModel with Velocity Restriction
56Demand for the Monetary Base
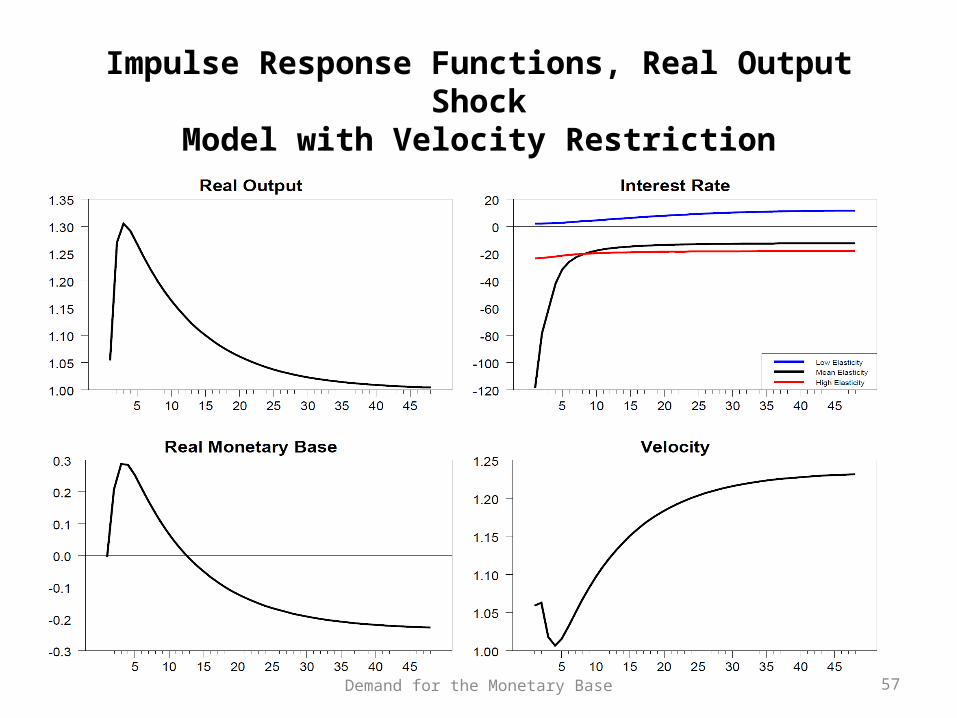
Impulse Response Functions, Real Output ShockModel with Velocity Restriction
57Demand for the Monetary Base
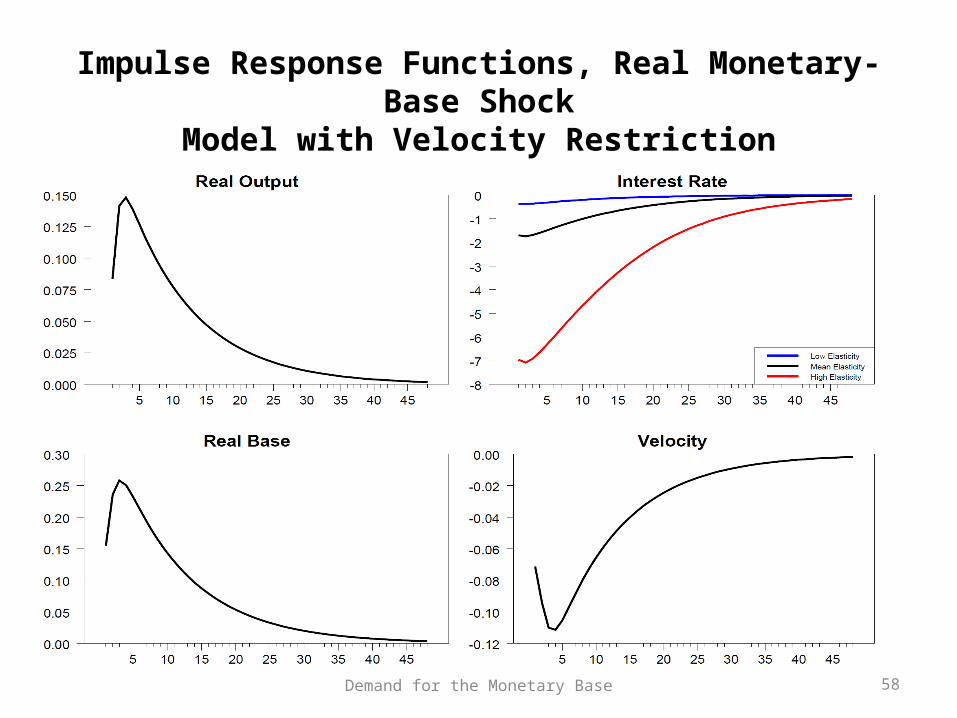
Impulse Response Functions, Real Monetary-Base ShockModel with Velocity Restriction
58Demand for the Monetary Base
Related Documents