Article Quantitative Dissection and Modeling of the NF-kB p100-p105 Module Reveals Interdependent Precursor Proteolysis Graphical Abstract Highlights LTbR pathway triggers interdependent proteolysis of NF-kB precursors p100 and p105 NIK and IKKa regulate p105 proteolysis through C-terminal de- gron serines in p100 Cogeneration of p50 and p52 depends on functional VCP/p97 Quantitative mathematical models predict direct signal respon- siveness of p100-p105 Authors Zekiye Buket Yılmaz, Bente Kofahl, ..., Gunnar Dittmar, Claus Scheidereit Correspondence [email protected] (Z.B.Y.), [email protected] (C.S.) In Brief Proteolytic precursor processing is a hall- mark of the NF-kB system. Yilmaz et al. show that in lymphotoxin-stimulated cells p100 acts upstream of p105, resulting in concurrent production of p52 and p50. Both precursors form complexes and bind to segregase (p97/VCP), which pro- motes proteasomal processing. The find- ings are supported by mass spectrometry and incorporated in quantitative mathe- matical models. Yılmaz et al., 2014, Cell Reports 9, 1756–1769 December 11, 2014 ª2014 The Authors http://dx.doi.org/10.1016/j.celrep.2014.11.014

Welcome message from author
This document is posted to help you gain knowledge. Please leave a comment to let me know what you think about it! Share it to your friends and learn new things together.
Transcript
Article
Quantitative Dissection an
d Modeling of the NF-kBp100-p105 Module Reveals InterdependentPrecursor ProteolysisGraphical Abstract
Highlights
LTbR pathway triggers interdependent proteolysis of NF-kB
precursors p100 and p105
NIK and IKKa regulate p105 proteolysis through C-terminal de-
gron serines in p100
Cogeneration of p50 and p52 depends on functional VCP/p97
Quantitative mathematical models predict direct signal respon-
siveness of p100-p105
Yılmaz et al., 2014, Cell Reports 9, 1756–1769December 11, 2014 ª2014 The Authorshttp://dx.doi.org/10.1016/j.celrep.2014.11.014
Authors
Zekiye Buket Yılmaz, Bente Kofahl, ...,
Gunnar Dittmar, Claus Scheidereit
[email protected] (Z.B.Y.),[email protected] (C.S.)
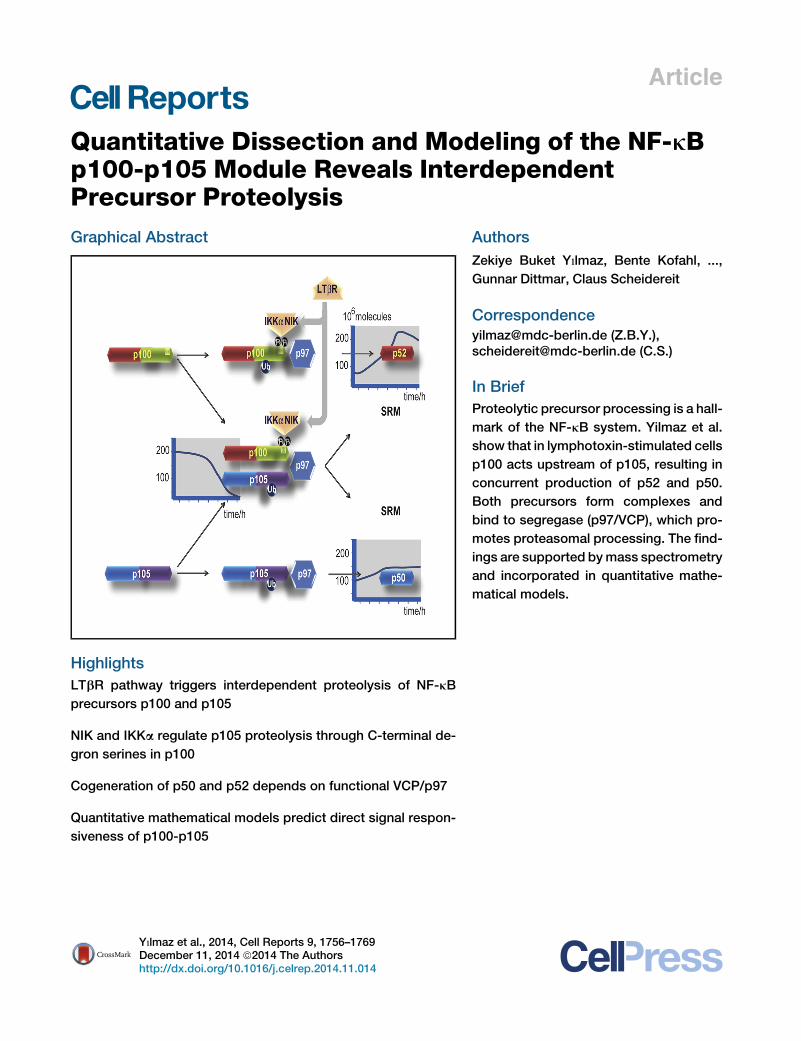
In Brief
Proteolytic precursor processing is a hall-
mark of the NF-kB system. Yilmaz et al.
show that in lymphotoxin-stimulated cells
p100 acts upstream of p105, resulting in
concurrent production of p52 and p50.
Both precursors form complexes and
bind to segregase (p97/VCP), which pro-
motes proteasomal processing. The find-
ings are supported bymass spectrometry
and incorporated in quantitative mathe-
matical models.
Cell Reports
Article
Quantitative Dissection and Modelingof the NF-kB p100-p105 Module RevealsInterdependent Precursor ProteolysisZekiye Buket Yılmaz,1,* Bente Kofahl,2 Patrick Beaudette,1,3 Katharina Baum,2 Inbal Ipenberg,1 FalkWeih,4,5 JanaWolf,2,6
Gunnar Dittmar,3,6 and Claus Scheidereit1,6,*1Signal Transduction Laboratory, Max Delbruck Center for Molecular Medicine, Robert-Rossle-Strasse 10, 13125 Berlin, Germany2Mathematical Modeling Group, Max Delbruck Center for Molecular Medicine, Robert-Rossle-Strasse 10, 13125 Berlin, Germany3Mass Spectrometry Group, Max Delbruck Center for Molecular Medicine, Robert-Rossle-Strasse 10, 13125 Berlin, Germany4Leibniz-Institute for Age Research-Fritz-Lipmann-Institute, Beutenbergstrasse 11, 07745 Jena, Germany5Deceased6Co-senior author
*Correspondence: [email protected] (Z.B.Y.), [email protected] (C.S.)http://dx.doi.org/10.1016/j.celrep.2014.11.014
This is an open access article under the CC BY-NC-ND license (http://creativecommons.org/licenses/by-nc-nd/3.0/).
SUMMARY
The mechanisms that govern proteolytic maturationor complete destruction of the precursor proteinsp100 and p105 are fundamental to homeostasis andactivation of NF-kB; however, they remain poorlyunderstood. Using mass-spectrometry-based quan-titative analysis of noncanonical LTbR-induced sig-naling, we demonstrate that stimulation inducessimultaneous processing of both p100 and p105.The precursors not only form hetero-oligomers butalso interact with the ATPase VCP/p97, and theirinduced proteolysis strictly depends on the signalresponse domain (SRD) of p100, suggesting that theSRD-targeting proteolytic machinery acts in cis andin trans. Separation of cellular pools by isotope label-ing revealedsynchronousdynamicsof p105andp100proteolysis. The generation of p50 and p52 from theirprecursors depends on functional VCP/p97. We havedeveloped quantitative mathematical models thatdescribe the dynamics of the system and predictthat p100-p105 complexes are signal responsive.
INTRODUCTION
The nuclear factor-kB (NF-kB) family of transcription factors
comprises p105/p50 (NF-kB1), p100/p52 (NF-kB2), RelA (p65),
c-Rel, and RelB and regulates numerous physiological pro-
cesses by controlling inducible gene expression programs. In
resting cells, NF-kB homo- and heterodimers are sequestered
in the cytoplasm through their interaction with IkB proteins or
with p105 and p100. Although they also are IkBs, p105 and
p100 primarily function as precursors for the mature NF-kB
proteins p50 and p52, respectively, which are generated by
ubiquitin-dependent proteasomal processing (Sun, 2012; Val-
labhapurapu and Karin, 2009).
1756 Cell Reports 9, 1756–1769, December 11, 2014 ª2014 The Aut
Various stimuli trigger rapid and transient activation of canon-
ical NF-kBpathways resulting in phosphorylation of IkBs through
the IkB kinase (IKK) complex that contains the catalytic subunits
IKKa and IKKb and the regulatory subunit IKKg/NEMO, and in
their subsequent proteasomal degradation. In contrast, a subset
of tumor necrosis factor receptor (TNFR) family members, such
as lymphotoxin beta receptor (LTbR), CD40, B cell activating fac-
tor receptor (BAFF-R), or receptor activator of NF-kB (RANK)
activate the noncanonical NF-kB pathway, which specifically in-
duces processing of p100 to generate p52 (Hayden and Ghosh,
2008; Razani et al., 2011; Scheidereit, 2006). Noncanonical
signaling critically depends on IKKa and NF-kB-inducing kinase
(NIK). NIK phosphorylates the T loop serines of IKKa, which then
phosphorylates p100 at C-terminal serines, to trigger ubiquitina-
tion and proteasomal processing of p100 (Senftleben et al.,
2001; Xiao et al., 2001).
Constitutive p105 processing to p50 and complete degrada-
tion are the two proteolytic processes that regulate cellular levels
of p105 and p50. Stimuli such as lipopolysaccharide, TNF-a, or
interleukin (IL)-1a trigger IKKb-mediated phosphorylation of ser-
ines 927 and 932 in a degron sequence of p105 followed by
SCFb�TrCP-mediated ubiquitination. This predominantly pro-
motes proteasomal p105 degradation, although IKKb-triggered
processing of p105 was also proposed (Heissmeyer et al.,
1999, 2001; Orian et al., 2000). These observations were largely
based on overexpression studies, and evidence of signal-
induced p105 processing in physiological settings has not
been demonstrated.
Thus far, the regulation of p100 and p105 proteolysis has been
considered as independent events. We report here that activa-
tion of noncanonical NF-kB signaling by LTbR also results in
induced p105 processing and the generation of p50, a process
that does not require the reported p105 phospho-acceptor sites
but instead is tightly coupled to p100 as themain signal receiving
component.
The regulatory mechanisms that control complete versus
partial proteolysis of the NF-kB precursor proteins have
largely remained elusive. To gain mechanistic insight into the
hors

coregulation of p100 and p105, it is important to dissect stim-
ulus-dependent and -independent processing and degradation
events and to study the role of de novo protein synthesis.
Hitherto the investigation of the mechanisms of precursor pro-
teolysis was limited to classical pulse-chase and western blot
techniques. We have now established dynamic stable isotope-
labeled amino acids in cell culture (SILAC) -coupled selected
reaction monitoring (SRM) mass spectrometry to quantitatively
determine the concentrations of endogenous p105, p100, p50,
and p52 over time in LTbR-stimulated mouse embryonic fibro-
blasts (MEFs) as a model system. SILAC provides an excellent
in vivo strategy to label proteins with different stable isotope-
containing amino acids and to monitor quantitative differences
at the protein level. The targeted SRM approach relies on the
quantification of quantotypic peptides that represent the pro-
teins of interest (Holman et al., 2012). SRM has recently
been applied to quantify the components of signal transduc-
tion pathways such as EGF signaling in mammary epithelial
cells (Wolf-Yadlin et al., 2007), and to absolute quantification
of proteins in S. cerevisiae (Costenoble et al., 2011; Picotti
et al., 2009).
SRM is a powerful asset in mathematical modeling of
signaling pathways, because precise copy numbers of pro-
teins can be determined at the basal level as well as in a
time-resolved manner following cellular stimulation. Thus, we
combined SRM-based quantitative data with mathematical
modeling to dissect the mechanism underlying the concerted
proteolytic responses of p100 and p105 to LTbR activation
and present a model that describes an interdependent regula-
tory network formed by both precursors. Although earlier
mathematical models of NF-kB signaling described the dy-
namics of canonical pathway activation (Basak et al., 2012;
Cheong et al., 2008) and an IkB function of p100 (Basak and
Hoffmann, 2008; Basak et al., 2007; Shih et al., 2012), the
model presented here dissects the processing of p100 and
p105.
A fundamental problem still to be solved is how partial
proteasomal proteolysis of the NF-kB precursors can be
achieved. It has recently been shown that Drosophila Ter94
and its mammalian counterpart Valosin-containing protein
(VCP)/p97 regulate the partial proteolysis of the transcription
factors Ci and Gli3, respectively, to modulate Hedgehog
signaling (Zhang et al., 2013). VCP/p97 is a hexameric AAA
(ATPases associated with diverse cellular activities) ATPase
and chaperone that functions in the modulation of substrate
ubiquitination via its interactions with ubiquitin ligases and
deubiquitinating enzymes and in various protein degradation
pathways by transferring ubiquitinated substrates to the pro-
teasome (Haines, 2010; Meyer et al., 2012). We demonstrate
that p97 binds to both p100 and p105 and that its ATPase ac-
tivity is required for LTbR-triggered processing of p100 and
p105.
Collectively, this work provides quantitative and mechanistic
insight into noncanonical LTbR signaling and highlights a
network that integrates p100 and p105, which may have impor-
tant implications for the regulation of target genes and for the
physiological and pathological functions of precursor-derived
NF-kB subunits.
Cell Re
RESULTS AND DISCUSSION
LTbR Induces Simultaneous Proteolysis of p105 andp100 and Generation of p50 and p52LTbR signaling is a prototype pathway that triggers noncanonical
NF-kB activation, in particular, the proteolytic conversion of
p100 to p52. We noticed an unexpected and strikingly similar
signal responsiveness of p105/p50 and p100/p52. The amount
of both precursors significantly declined in the cytoplasm within
the first 4 hr (Figure 1A, left), whereas nuclear translocation of
p50 and p52, along with RelB, was evident 3 hr poststimulation
(Figure 1, right). To allow a faithful, quantitative investigation of
precursor proteolysis, a SRM-based technique was established,
utilizing N- and C-terminal p100- and p105-specific proteotypic
peptides for absolute quantification of precursors and products
(Figure 1B; see legend and Table S1 for details). SRM-based
mass spectrometry allows quantitation when isotopically heavy
analogs of the targeted proteotypic peptides are spiked in during
sample preparation at a known concentration.
SRM analysis revealed a stimulus-dependent decrease with
similar kinetics for both p105 and p100 and for generation of
p50 and p52 (Figure 1B). The increase of p52 was slightly
more pronounced than that of p50 (see Figure S1C for nano-
molar ranges). Immunoblotting of cytoplasmic extracts did
not reveal this increase due to predominant nuclear transloca-
tion of the products (Figure 1A, left and right). Nuclear translo-
cation of p50 and p52 was also quantified by SRM analysis
of nuclear extracts (Figure S1D), indicating a similar nuclear
enrichment.
Signal-induced p100 processing strictly depends on de novo
protein synthesis (Claudio et al., 2002; Coope et al., 2002; Mord-
muller et al., 2003). Cycloheximide treatment blocks the upregu-
lation of NIK and subsequent p100 processing in BAFF and
CD40L-stimulated B cells (Qing et al., 2005). In line with this,
LTbR-induced p105 proteolysis and p50 nuclear translocation
were also completely impaired in cells treated with cyclohexi-
mide (Figure S1E). As seen in MEF, LTbR activation of macro-
phage and bone marrow stromal cell lines resulted in p105
proteolysis and nuclear accumulation of p50 and p50 DNA bind-
ing (Figures S1F and S1G; data not shown), indicating that the
responsiveness of p105 to noncanonical signaling is not cell
type restricted.
Requirement of NIK, IKKa, and p100 for LTbR-Inducedp105 ProteolysisExtensive studies with a variety of noncanonical NF-kB pathway
activating stimuli (BAFF, CD-40, LTbR) in different cell systems
established a central role of NIK and IKKa in regulating p100 pro-
cessing and p52 generation (Claudio et al., 2002; Coope et al.,
2002; Dejardin et al., 2002; Senftleben et al., 2001; Xiao et al.,
2001; Yilmaz et al., 2003). NIK and IKKa are also essential for
LTbR-induced p105 processing to generate p50. LTbR-induced
p105 proteolysis was completely abrogated in nik�/�, aly/aly, orIkka�/� MEF and, as a control, in ltbr�/� cells, whereas IKKb and
IKKg/NEMO were dispensable (Figure 2A). The alymphoplasia
(aly) mutation of the nik gene causes a deficiency of NIK in
IKKa and TRAF interaction (Luftig et al., 2001; Shinkura et al.,
1999). Altogether, the selective requirement of NIK, IKKa, and
ports 9, 1756–1769, December 11, 2014 ª2014 The Authors 1757

Figure 1. Quantitative Mass-Spectrometry-
Based Analysis of LTbR-Induced p105
Proteolysis
(A) Wild-type MEF were stimulated with anti-LTbR
agonistic antibody (AC.H6) for 12 hr. Cytoplasmic
extracts (CEs) were immunoblotted with p50/p105
or p52/p100 antibodies (left). One of three inde-
pendent experiments is shown. Nuclear extracts
(NE) were analyzed by western blotting (right).
(B) Top, schematic outline of p50/p105- and p52/
p100-specific proteotypic peptides and of SRM
mass spectrometry. Sequential mass filtering is
performed through quadrupoles (Q1–Q3). The
peptide of interest is isolated in Q1, followed by
collision-induced dissociation (CID) in Q2. Finally,
the selected fragment is isolated in Q3, resulting in
a measurable ion current.
Bottom, mass-spectrometric quantification of
p105, p100, p50, and p52. Wild-type MEF were
stimulated with anti-LTbR agonistic antibody
(5G11b), and samples at indicated time points
were subjected to SRM analysis with C-terminal
peptides for p105 and p100, and N-terminal pep-
tides for p50/p105 and p52/p100 (top, dark-blue
boxes). For each peptide, three transitions were
measured in triplicate injections, with the best two
used for quantification according to the highest
intensity or absence of coeluting interference. The
number of molecules (in millions) per microgram of
protein injected was plotted for each of the six
quantified measurements (dots). Trend curves
are the best fits obtained by performing a least-
square fit to a parameterized exponential, loga-
rithmic, or hyperbolic function curve for each
species separately, assuming an additive error
and normalizing by the SD in each time point. Note
that p50 and p52 were quantified by determining
the absolute values relative to the heavy standard
for the C-terminal p105 and p100 peptides and
subtracting these from the absolute values de-
tected for the N-terminal peptides. See Table S1
for peptide positions and transitions. See also
Figure S1A for western blots performed with
whole-cell extracts (WCEs) prepared from this
experiment.
de novo protein synthesis establishes p105 proteolysis and p50
production as part of noncanonical NF-kB signaling downstream
of LTbR.
The similarity in the kinetics of p100 and p105 proteolysis,
which was also observed in other cell types (data not shown),
and the prior characterization of a NIK/IKKa-responsive sub-
strate site only in p100 suggest a coupled process. This promp-
ted us to investigate the reciprocal functional dependencies of
the precursors. The requirement of p100 was tested using
p100�/� cells that are deficient in full-length p100 but were
engineered to constitutively express p52 (Ishikawa et al.,
1997), and in nfkb2�/� cells, lacking both p100 and p52. Strik-
ingly, LTbR-induced p105 proteolysis was completely abrogated
in p100�/� and nfkb2�/� MEF, demonstrating that it strictly de-
pended on p100. The loss of p105 responsiveness was also
observed after small interfering RNA (siRNA)-mediated downre-
gulation of p100 (Figure 2B). These results were confirmed by
1758 Cell Reports 9, 1756–1769, December 11, 2014 ª2014 The Aut
SRM analysis with absolute quantification of p105 in wild-type,
p100�/�, and nfkb2�/� MEF. Although LTbR triggered a reduc-
tion in p105 concentration of almost 50% in wild-type cells 6 hr
poststimulation, p105 concentrations did not change in p100-
deficient cells (Figure 2C). Impaired p105 proteolysis in these
cells correlated with the lack of nuclear translocation of p50
(Figure S2A, top). Importantly, reconstitution of p100�/� MEF
with p100 fully restored LTbR-triggered p105 proteolysis,
demonstrating that, in addition to NIK and IKKa, p100 acts up-
stream of p105 proteolysis (Figure 2D). Both precursors are
known to interact with their processing products and other
NF-kB subunits. However, LTbR-mediated p105 proteolysis
did not require RelA or RelB (Figure S2B).
The lack of p105 processing in p100-deficient cells cannot be
explained by a loss of function of the upstream components.
Albeit reduced in p100-deficient cells, NIK was stabilized upon
proteasomal inhibition (Figure S2C). LTbR-mediated TRAF2
hors
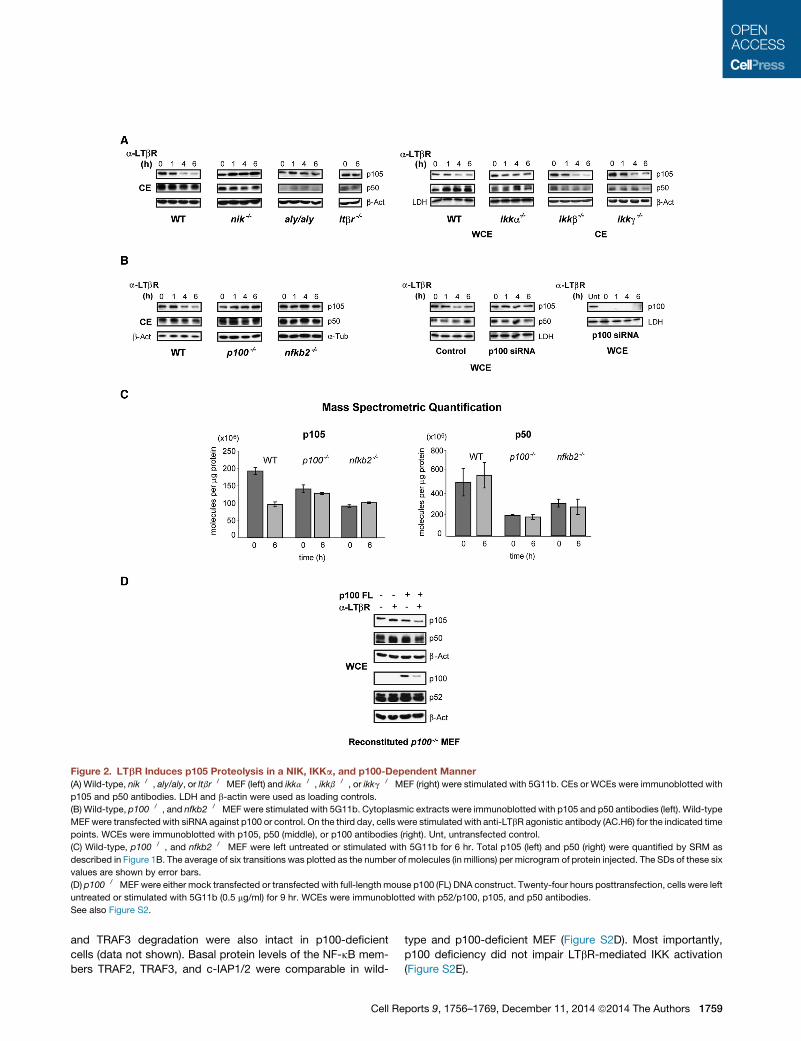
Figure 2. LTbR Induces p105 Proteolysis in a NIK, IKKa, and p100-Dependent Manner
(A) Wild-type, nik�/�, aly/aly, or ltbr�/� MEF (left) and ikka�/�, ikkb�/�, or ikkg�/� MEF (right) were stimulated with 5G11b. CEs or WCEs were immunoblotted with
p105 and p50 antibodies. LDH and b-actin were used as loading controls.
(B) Wild-type, p100�/�, and nfkb2�/�MEF were stimulated with 5G11b. Cytoplasmic extracts were immunoblotted with p105 and p50 antibodies (left). Wild-type
MEFwere transfected with siRNA against p100 or control. On the third day, cells were stimulated with anti-LTbR agonistic antibody (AC.H6) for the indicated time
points. WCEs were immunoblotted with p105, p50 (middle), or p100 antibodies (right). Unt, untransfected control.
(C) Wild-type, p100�/�, and nfkb2�/� MEF were left untreated or stimulated with 5G11b for 6 hr. Total p105 (left) and p50 (right) were quantified by SRM as
described in Figure 1B. The average of six transitions was plotted as the number of molecules (in millions) per microgram of protein injected. The SDs of these six
values are shown by error bars.
(D) p100�/�MEFwere either mock transfected or transfected with full-length mouse p100 (FL) DNA construct. Twenty-four hours posttransfection, cells were left
untreated or stimulated with 5G11b (0.5 mg/ml) for 9 hr. WCEs were immunoblotted with p52/p100, p105, and p50 antibodies.
See also Figure S2.
and TRAF3 degradation were also intact in p100-deficient
cells (data not shown). Basal protein levels of the NF-kB mem-
bers TRAF2, TRAF3, and c-IAP1/2 were comparable in wild-
Cell Re
type and p100-deficient MEF (Figure S2D). Most importantly,
p100 deficiency did not impair LTbR-mediated IKK activation
(Figure S2E).
ports 9, 1756–1769, December 11, 2014 ª2014 The Authors 1759
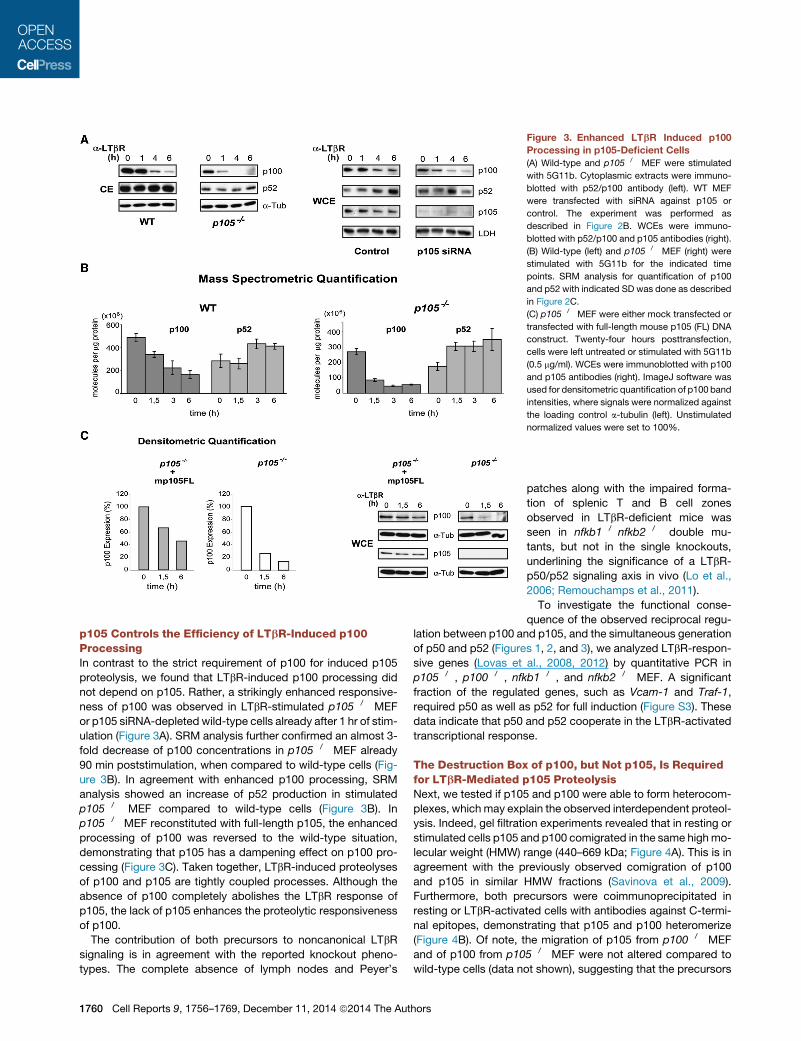
Figure 3. Enhanced LTbR Induced p100
Processing in p105-Deficient Cells
(A) Wild-type and p105�/� MEF were stimulated
with 5G11b. Cytoplasmic extracts were immuno-
blotted with p52/p100 antibody (left). WT MEF
were transfected with siRNA against p105 or
control. The experiment was performed as
described in Figure 2B. WCEs were immuno-
blotted with p52/p100 and p105 antibodies (right).
(B) Wild-type (left) and p105�/� MEF (right) were
stimulated with 5G11b for the indicated time
points. SRM analysis for quantification of p100
and p52 with indicated SD was done as described
in Figure 2C.
(C) p105�/� MEF were either mock transfected or
transfected with full-length mouse p105 (FL) DNA
construct. Twenty-four hours posttransfection,
cells were left untreated or stimulated with 5G11b
(0.5 mg/ml). WCEs were immunoblotted with p100
and p105 antibodies (right). ImageJ software was
used for densitometric quantification of p100 band
intensities, where signals were normalized against
the loading control a-tubulin (left). Unstimulated
normalized values were set to 100%.
p105 Controls the Efficiency of LTbR-Induced p100ProcessingIn contrast to the strict requirement of p100 for induced p105
proteolysis, we found that LTbR-induced p100 processing did
not depend on p105. Rather, a strikingly enhanced responsive-
ness of p100 was observed in LTbR-stimulated p105�/� MEF
or p105 siRNA-depleted wild-type cells already after 1 hr of stim-
ulation (Figure 3A). SRM analysis further confirmed an almost 3-
fold decrease of p100 concentrations in p105�/� MEF already
90 min poststimulation, when compared to wild-type cells (Fig-
ure 3B). In agreement with enhanced p100 processing, SRM
analysis showed an increase of p52 production in stimulated
p105�/� MEF compared to wild-type cells (Figure 3B). In
p105�/� MEF reconstituted with full-length p105, the enhanced
processing of p100 was reversed to the wild-type situation,
demonstrating that p105 has a dampening effect on p100 pro-
cessing (Figure 3C). Taken together, LTbR-induced proteolyses
of p100 and p105 are tightly coupled processes. Although the
absence of p100 completely abolishes the LTbR response of
p105, the lack of p105 enhances the proteolytic responsiveness
of p100.
The contribution of both precursors to noncanonical LTbR
signaling is in agreement with the reported knockout pheno-
types. The complete absence of lymph nodes and Peyer’s
1760 Cell Reports 9, 1756–1769, December 11, 2014 ª2014 The Authors
patches along with the impaired forma-
tion of splenic T and B cell zones
observed in LTbR-deficient mice was
seen in nfkb1�/�nfkb2�/� double mu-
tants, but not in the single knockouts,
underlining the significance of a LTbR-
p50/p52 signaling axis in vivo (Lo et al.,
2006; Remouchamps et al., 2011).
To investigate the functional conse-
quence of the observed reciprocal regu-
lation between p100 and p105, and the simultaneous generation
of p50 and p52 (Figures 1, 2, and 3), we analyzed LTbR-respon-
sive genes (Lovas et al., 2008, 2012) by quantitative PCR in
p105�/�, p100�/�, nfkb1�/�, and nfkb2�/� MEF. A significant
fraction of the regulated genes, such as Vcam-1 and Traf-1,
required p50 as well as p52 for full induction (Figure S3). These
data indicate that p50 and p52 cooperate in the LTbR-activated
transcriptional response.
The Destruction Box of p100, but Not p105, Is Requiredfor LTbR-Mediated p105 ProteolysisNext, we tested if p105 and p100 were able to form heterocom-
plexes, which may explain the observed interdependent proteol-
ysis. Indeed, gel filtration experiments revealed that in resting or
stimulated cells p105 and p100 comigrated in the same highmo-
lecular weight (HMW) range (440–669 kDa; Figure 4A). This is in
agreement with the previously observed comigration of p100
and p105 in similar HMW fractions (Savinova et al., 2009).
Furthermore, both precursors were coimmunoprecipitated in
resting or LTbR-activated cells with antibodies against C-termi-
nal epitopes, demonstrating that p105 and p100 heteromerize
(Figure 4B). Of note, the migration of p105 from p100�/� MEF
and of p100 from p105�/� MEF were not altered compared to
wild-type cells (data not shown), suggesting that the precursors
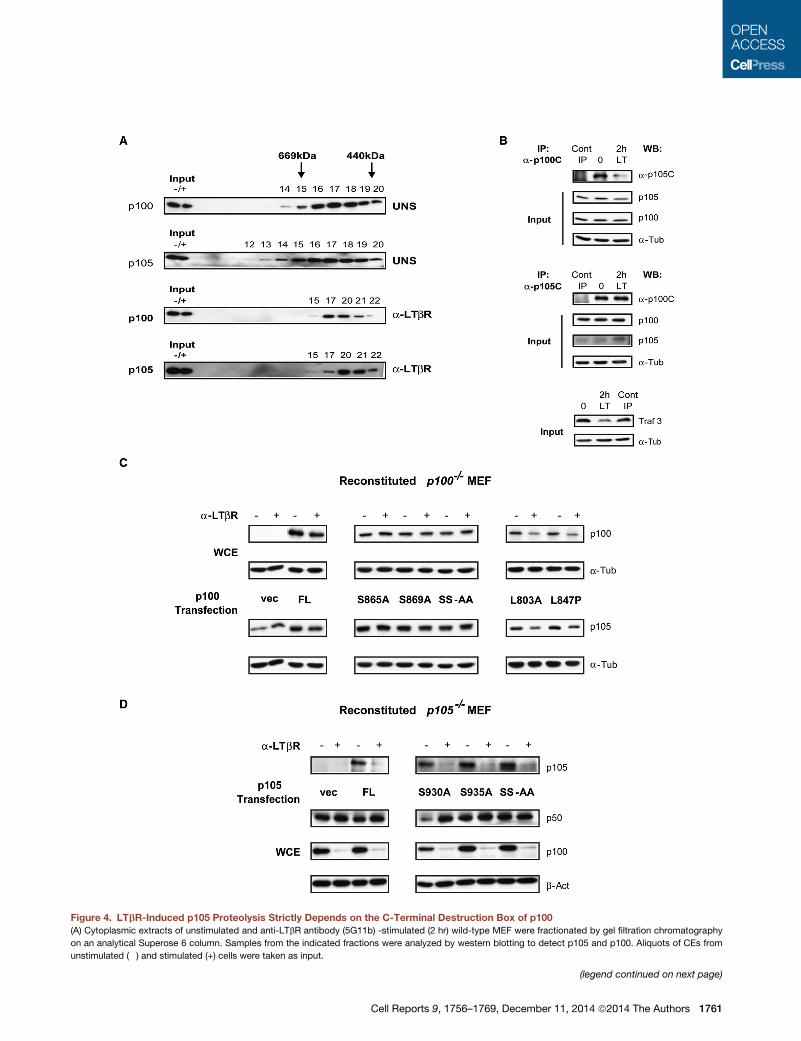
Figure 4. LTbR-Induced p105 Proteolysis Strictly Depends on the C-Terminal Destruction Box of p100
(A) Cytoplasmic extracts of unstimulated and anti-LTbR antibody (5G11b) -stimulated (2 hr) wild-type MEF were fractionated by gel filtration chromatography
on an analytical Superose 6 column. Samples from the indicated fractions were analyzed by western blotting to detect p105 and p100. Aliquots of CEs from
unstimulated (�) and stimulated (+) cells were taken as input.
(legend continued on next page)
Cell Reports 9, 1756–1769, December 11, 2014 ª2014 The Authors 1761

may undergo hetero- as well as homo-oligomerization. As in
fibroblasts, endogenous p100-p105 complexes were also
observed in RAW264.7 cells and in CD43+ mouse splenic B cells
(data not shown).
Signal-induced processing of p100 is mediated by IKKa
through phosphorylation at C-terminal serine residues 866 and
870 (Xiao et al., 2001). We addressed the role of the phospho-
acceptor sites of p100 for p105 proteolysis by reconstituting
p100�/� MEF with the corresponding mutant mouse p100
(mp100, serines 865, and 869 to alanines, respectively). As ex-
pected, mp100 SS865/869AA was not polyubiquitinated when
coexpressed with NIK in HEK293 cells (data not shown), and
LTbR-mediated p100 proteolysis was blocked in cells reconsti-
tuted with any one of the p100 serine mutants (Figure 4C). Strik-
ingly, endogenous p105 also failed to respond to the stimulus
(Figure 4C). This suggests that only a signal-responsive p100
can restore LTbR-activated p105 proteolysis in p100-deficient
cells in trans. Reconstitution experiments in nfkb2�/� MEF
showed similar results (data not shown).
The conserved C-terminal death domain of mp105 (801–888)
and mp100 (764–851) may play a role in critical protein-protein
interactions and in precursor oligomerization. It was reported
that death domain point mutations in human p100 (L831P)
(Fong et al., 2002) and human p105 (L841A) (Beinke et al.,
2002) impair p100 processing and TNF-a-mediated p105 prote-
olysis, respectively. We tested the effect of death domain muta-
tions in mouse p100 (L847P and L803) and observed that these
mutations affected neither p100 nor p105 proteolysis (Figure 4C).
Importantly, all the serine and death domain point mutant forms
of mp100 were still able to interact with endogenous p105, as
shown by coimmunoprecipitation data (data not shown). In
human p105, serines 927 and 932 are essential for IKKb-medi-
ated phosphorylation, followed by the recruitment of b-TrCP
for signal-induced complete degradation (Heissmeyer et al.,
2001). However, the equivalent substrate serine residues in
mp105 (serines 930 and 935) were not required for proteolysis
of p105 in noncanonical LTbR-dependent signaling (Figure 4D).
Because p105 and p100 form heterocomplexes, the ubiquitin
ligases and/or other regulators recruited by the phosphorylated
C-terminal degron of p100 may act not only in cis on p100, but
also in trans on p105. The dependence of LTbR-induced p105
proteolysis on the p100 degron may restrict p105 ‘‘copro-
cessing’’ to noncanonical stimuli that specifically act on the
NIK and IKKa-selective p100 degron. In contrast, the p105 de-
gron that triggers complete degradation of p105 has been shown
to be essential for canonical signaling, such as optimal TCR-
induced NF-kB activation in CD4+ T cells and mature T cell func-
tion in vivo (Sriskantharajah et al., 2009) and is not responsive to
NIK and IKKa.
(B) Unstimulated and stimulated (5G11b) wild-typeMEFwere lysed after 2 hr, and
antibodies. Coimmunoprecipitation of precursors was detected by western blottin
stimulation control, TRAF3 degradation is shown.
(C) p100�/�MEFwere eithermock transfected (vec) or transfectedwith full-length
domain point mutants (L803A, L847P). Twenty-four hours posttransfection, cells
were immunoblotted with p100 and p105 antibodies.
(D) p105�/� MEF were either mock transfected or transfected with full-length mo
were analyzed as described in (C).
1762 Cell Reports 9, 1756–1769, December 11, 2014 ª2014 The Aut
p97 Is Recruited to Both p100 and p105 and RegulatesNoncanonical NF-kB ActivationThe Drosophila Ter94 ATPase and the mammalian homolog p97
interact with their substrates, Ci and IkBa, respectively, and
thereby regulate their proteolysis (Li et al., 2014; Zhang et al.,
2013). To analyze a potential involvement of p97 in p100 and
p105 processing, we first tested its interaction with the individual
precursors. Indeed, endogenous p97 was associated with both
p100 and p105 in resting and stimulated cells (Figure 5A). Coim-
munoprecipitation experiments with p100�/� and p105�/� MEF
showed that p97 can interact with each precursor independently
(data not shown).
To demonstrate that p97 acts at the level of the precursors,
we first used, as the simplest established system, ectopic NIK
expression, which induces p100 processing in the absence of
any additional upstream stimulatory signaling (Qing et al.,
2005; Xiao et al., 2001). Either wild-type p97 or a dominant-
negative p97 mutant (M39) were cotransfected with NIK. The
mutant p97 (M39) is defective in its ATPase function and as-
sembles with endogenous p97 into heteromeric, dysfunctional
hexamers. This mutant bears point mutations in the D1
(K251A) and D2 (K524A) ATPase domains (Figure 5B) and effec-
tively inhibits p97 function in the endoplasmic reticulum associ-
ated degradation (ERAD) pathway (DeLaBarre et al., 2006). NIK-
induced p52 formation was indeed strongly impaired by mutant
p97 (M39), but not by wild-type p97 (Figure 5C). The ectopic
p97 expression levels were in a similar range compared to
endogenous p97 (Figure 5C). The p97 mutation did not affect
the interaction with p100, because wild-type and mutant p97
bound to the precursor comparably (Figure 5D). Of note, NIK-
induced C-terminal phosphorylation of p100 was unaffected
(Figure 5C), suggesting that p97 acts downstream of phosphor-
ylation, e.g., at the level of recruitment of the substrate to the
proteasome (Figure S6B).
In order to further investigate the functional role of p97, a
potent p97 inhibitor (DBeQ) (Chou et al., 2011), which efficiently
blocks the ATPase activity of p97, was used. As shown in Fig-
ure 5E, NIK-induced processing of p100 to p52 was reduced
following DBeQ treatment. The reduction is more moderate
than with p97 M39 because NIK-induced p100 processing was
ongoing before DBeQ addition. Collectively, these experiments
demonstrate that an impairment of functional p97 either through
dominant-negative mutant expression or chemical inhibition in-
terferes with NIK-induced p100 processing.
Li et al. reported that p97 depletion blocks IkBa degradation in
TNF-a-stimulated cells (Li et al., 2014). Indeed, siRNA-mediated
p97 depletion resulted in the impairment of TNF-a-induced acti-
vation of canonical NF-kB (Figure 5F). The TNF superfamily
member LIGHT predominantly activates noncanonical NF-kB
full-length p105 and p100 precursors were immunoprecipitated with C-terminal
g with C terminus-specific antibodies (a-p100C and a-p105C, respectively). As
mouse p100 (FL), serine point mutants (S865A, S869A, SS865,869AA), or death
were either left untreated or stimulated with 5G11b (0.5 mg/ml) for 24 hr. WCEs
use p105 (FL), or serine point mutants (S930A, S935A, SS930,935AA). WCEs
hors

Figure 5. Precursor Processing and Noncanonical NF-kB Activation Is Regulated by p97
(A) Immunoprecipitations of full-length precursorswere performedas in Figure 4B.Coimmunoprecipitation of precursorswith p97wasdetected bywestern blotting.
(B) Scheme of wild-type human p97 and its dominant-negative (DN) form, M39.
(C) HEK293 cells were transfected with FLAG-p100 construct with or without NIK coexpression and with wild-type GFP-p97 (WT) or p97 DN (M39) expression.
Forty-eight hours posttransfection cells were lysed and assayed by immunoblotting. A representative sample of three experiments is shown.
(D) In the experimental setting as described in (C), FLAG-p100was immunoprecipitated by FLAGM2 resin, and the eluates were analyzed for GFP-p97 interaction
by immunoblotting.
(E) HEK293 cells were transfected with FLAG-p100 construct with or without NIK coexpression. Twenty-four hours posttransfection, cells were treated with
DMSO or 10 mM DBeQ for 6 hr. NIK-mediated p100 processing was assayed by immunoblotting.
(F) HeLa cells were transfected with siRNAs against p97 or control (C). Seventy-two hours posttransfection, cells were either left untreated or were stimulated
with TNF-a (20 ng/ml) for 10 min (top) or with LIGHT (100 ng/ml) for 6 hr (bottom). CEs were immunoblotted for knockdown efficiency (right). NF-kB activation and
Oct-1 as loading control were assayed with EMSA (left) as described previously (Stilmann et al., 2009).
Cell Reports 9, 1756–1769, December 11, 2014 ª2014 The Authors 1763
(legend on next page)
1764 Cell Reports 9, 1756–1769, December 11, 2014 ª2014 The Authors
(Mordmuller et al., 2003) through LTbR ligation (Kim et al., 2005).
Depletion of p97 significantly reduced LIGHT-induced nonca-
nonical NF-kB activity (Figure 5F, bottom left). Whereas Li et al.
(2014) demonstrated p97 recruitment to IkBa, we show that
p97 is recruited to the NF-kB precursors and that p97 inhibition
blocks stimulus-induced NF-kB DNA binding activities in the
canonical as well as in the noncanonical pathway.
Dissection of Subpopulations by Dynamic SILAC-SRMReveals Equivalent LTbR-Induced p50 and p52Generation that Requires p97 ATPase ActivityThe requirement of translation for precursor processing in
noncanonical signaling was previously investigated, and co-
translational mechanisms for p50 and p52 generation have
been suggested (Heusch et al., 1999; Lin et al., 2000;Mordmuller
et al., 2003). However, multiple processes (precursor synthesis,
degradation, processing, and turnover of the products) have to
be considered. Thus, to further scrutinize the equivalent dy-
namics of LTbR-stimulated p100 and p105 proteolysis and of
the generation of their products, we performed SILAC-SRM ex-
periments. This allows to trace protein populations that were
translated before or after adding M Arg-6 isotope labeled me-
dium to cells initially grown in L Arg-0 medium (Figure 6A).
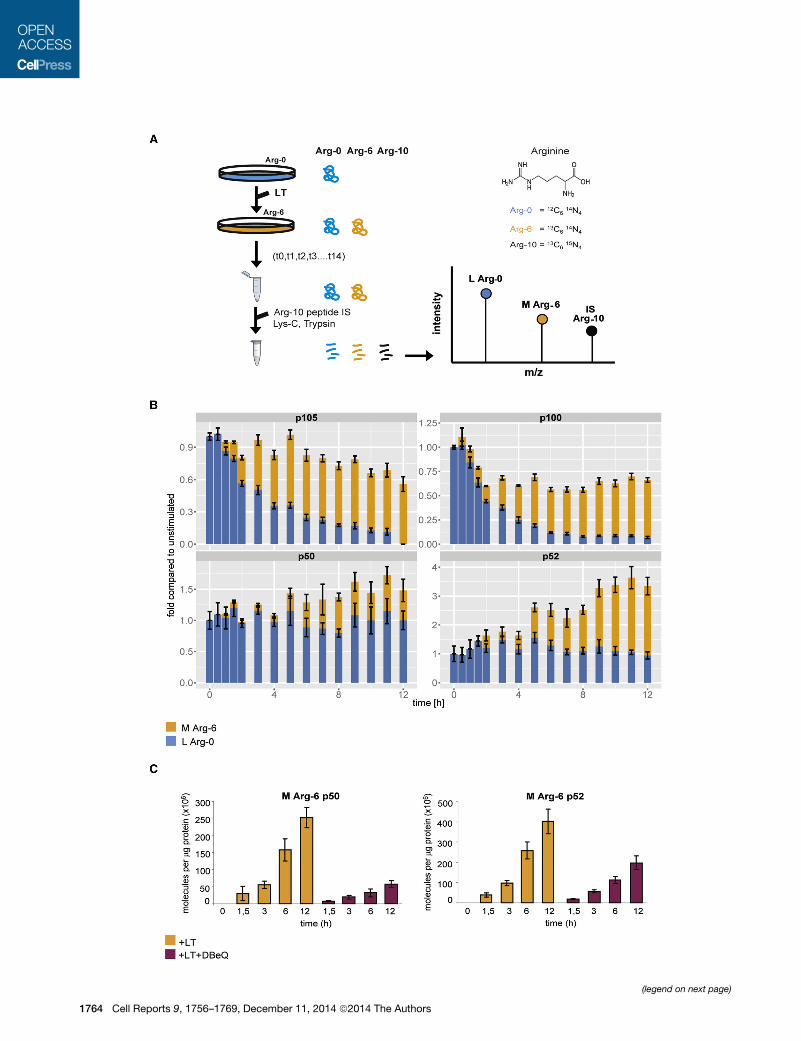
SRM analysis of these samples revealed distinct dynamics of
the two populations designated as proteinsL, containing L Arg-
0, and proteinsM, containingMArg-6 (Figure 6B, blue and orange
bars, respectively). Relative p105L and p100L levels (blue)
decreased over time, leading to an overall loss of almost 90%
of both precursorsL, whereas relative levels of p50L and p52L
did not show a strong alteration. In contrast, the relative levels
of precursorsM and productsM increased over time, such that
an overall gain in p50 and p52 was observed in the M population
(Figure 6B, orange bars). As expected, the accumulation of p50M
and p52M was almost completely abolished by cycloheximide or
proteasome inhibitor (MG132) treatment (Figure S5A), whereas
p50L and p52L were unaffected (Figure S5B). Thus, the overall
dynamics of the two populations of precursors and their prod-
ucts in response to LTbR signaling reveal a striking similarity.
The quantitative data obtained by SILAC-SRM served as a basis
for mathematical models to dissect the various processes regu-
lating the interdependent reactions of both precursors to LTbR
stimulation (see below).
Figure 6. Dynamic SILAC-Based Mass Spectrometry Unfolds a Concer
Requirement for p97
(A) Schematic presentation of dynamic SILAC experiments. Cells were grown in S
L Arg-0 medium was replaced with SILAC (M Arg-6) medium (t0), with or witho
trometry, and proteins quantified via SRM analysis. The internal standard peptide
except for containing the heavy isotope Arg-10. Note the mass differences in m
isotopes. See also Figure S4.
(B) L Arg-0 medium was exchanged with M-Arg-6 medium containing the agonis
points indicated. The unstimulated sample was treated with M-Arg-6 medium on
experiments is shown, where p105, p50, p100, and p52 were quantified followin
respective unstimulated proteinL levels at t = 0 were plotted as stacked bar graphs
orange bars show p105M, p50M, p100M, p52M proteins (M Arg-6). Note that for t
(C) Wild-type MEF were subjected to dynamic SILAC with 5G11b antibody, i
benzylquinazoline-2,4-diamine). M Arg-6 p50 (p50M) and M Arg-6 p52 (p52M) wer
as the number of molecules (in millions) per microgram of protein injected. Error b
See also Figure S6A.
Cell Re
In order to investigate the functional role of p97 in LTbR-
induced processing of p100 and p105, the p97 inhibitor DBeQ
was used in dynamic SILAC experiments. Of note, DBeQ treat-
ment alone did not show any adverse effects on total protein
levels of NIK, TRAF2, or TRAF3 (data not shown). Although
DBeQ treatment barely affected p50L and p52L concentrations
(Figure S5B), p97 inhibition significantly reduced the accumula-
tion of p50M and p52M (Figure 6C; see also Figure S6A for effects
on basal processing and on precursors). Thus, p97 is required for
LTbR-induced processing of p100 and p105. Consequently, p97
inhibition similarly affects the dynamics of both productsM.
A main function of p97 is the conversion of energy generated
through ATP hydrolysis into mechanical force to dissociate pro-
tein complexes or extract proteins from intracellular structures
such as the ER membrane (Baek et al., 2013; Yamanaka et al.,
2012). Hence, one plausible scenario is that the p97 complex
may pull out the N-terminal parts of the precursors from the pro-
teasome to rescue them from complete degradation. In the
absence of p97 ATPase activity (DBeQ treatment), this rescue
mechanism may fail and lead to complete degradation of
p105M and p100M, which is in line with the significant decrease
in p50M and p52M concentrations. Indeed, DBeQ treatment
caused reduced precursorM levels (Figure S6A). That the precur-
sors are reduced proportionally to the diminished formation of
their products in presence of DBeQ may indicate that in the
absence of p97 function complete precursor degradation may
occur, instead of processing. This is the case for basal, as well
as for induced processing.
Overall, our data suggest a potential mechanistic explanation
how the proteasome may be guided for partial versus complete
degradation of NF-kB precursors upon LTbR activation (see also
Figure S6B).
Quantitative Modeling Reveals Direct Responsivenessof the p100-p105 Complex to LTbR ActivationGiven the intricate interdependency of both precursors, mathe-
matical models were designed to gain insight into the concerted
signal responsiveness of p100 and p105 and to investigate the
contribution of the p100-p105 complex for the dynamics of the
system.We thus developed a set of mathematical models, which
describe the different possible fates of the p100-p105 complex
(Figure 7A; see the Supplemental Information, development of
ted Proteolytic Response of p100 and p105 to LTbR Activation and a
ILAC light (L Arg-0) medium for several passages. On the day of the experiment,
ut LTbR stimulation (LT). Samples were collected, processed for mass spec-
(IS) is identical in sequence to each of the SRM peptides used in the analysis,
/z spectra (SRM transitions, see Table S1) resulting from the different arginine
tic LTbR antibody 5G11b. Wild-type MEF samples were collected at the time
ly and was collected with the 30 min sample. A representative sample of three
g SRM analysis. Fold changes in the differently labeled proteins relative to the
. The blue bars denote p105L, p50L, p100L, p52L proteins (L Arg-0), whereas the
his experiment, p105L at 12 hr time point was below detection limit.
n the absence (orange) or presence (red) of p97 inhibitor DBeQ (N2,N4-di-
e quantified following SRM analysis. The average of six transitions was plotted
ars represent the SDs of these six values. One of three experiments is shown.
ports 9, 1756–1769, December 11, 2014 ª2014 The Authors 1765

(legend on next page)
1766 Cell Reports 9, 1756–1769, December 11, 2014 ª2014 The Authors

the set of mathematical models). The kinetic parameters of the
models were estimated by fitting each model to the temporal
changes of the absolute numbers of p100, p105, p52, and p50
molecules that were measured by quantitative SILAC-SRM un-
der stimulated and unstimulated conditions. Simulations are
shown exemplarily for model M3, using its best-fitting parame-
ters, in comparison with the SILAC-SRM data in Figure 7B (for
details of the fitting procedure, see the Supplemental Informa-
tion, experimental data, model fitting, and parameter estimation,
and Table S2). All models were qualitatively in accordance with
the SRM and western blot data describing LTbR-induced
temporal concentration changes of p100, p105, p52, and p50
(compare Figure 1 with Figure 7C). For further validation, the
data obtained for NIK, IKKa, or LTbR mutant cells (Figure 2A),
p105-deficient cells (Figure 3), and p97 inhibition (Figures 6C
and S6) were qualitatively reproduced by model simulations,
as shown in Figures S7B–S7D for model M3. Importantly, these
data have not been used for model development and parameter
fitting (for details of the validation procedure, see the Supple-
mental Information, model validation).
The fit quality of the models was compared with Akaike
weights (Burnham and Anderson, 2004) (see the Supplemental
Information, corrected Akaike information criterion [AICc]). The
Akaike weights revealed that probability to be the best model
is 82% for M3 and 10% and around 8% for M4 and M2, respec-
tively, and negligible (5*10�26%) forM1 (Figure 7D). Hence, M3, in
which the p100-p105 complex components undergo signal-
induced processing, is the most likely model. Models M2 and
M4, in which p100-p105 is subject to inducible degradation or
combined inducible processing and degradation, respectively,
are considerably less but still likely. In contrast, model M1, which
considers p100-p105 as nonresponsive complex, can be re-
jected due to its low Akaike weight. Similar results have been
obtained for extended models that include inducible p100
degradation or allow for different parameters for the speciesM
and speciesL (see Figure S7F).
In addition, the mathematical models allow to predict the con-
centrations of the p100-p105 complex and to trace its absolute
temporal behavior upon LTbR stimulation (Figure 7E forM3). Cal-
culations showed that around 14% of total p100 and around
Figure 7. Mathematical Modeling Underscores Signal Responsiveness
(A) Mathematical models including the production, interaction, degradation, and
degradation of the products p52 and p50. Four different models (M1–M4) were co
components are neither degraded nor processed, whereas in M2 the precursor
manner. InM3, stimulus-dependent and -independent exclusive processing of p1
processing of the p100-p105 complex. A detailed description of the models is g
(B) Simulated time courses of model M3 (curves) fitted to the quantitative, time-
labeled precursors and products. The results according to the best-fitting para
obtained by parameter profile likelihood estimation (light curves) are given. Measu
and orange dots (curves), respectively.
(C) Total p105 (p105 + p100-p105) and total p100 (p100 + p100-p105) were simula
parameter sets used for Figure 7B (compare to SRM analysis in Figure 1B).
(D) Akaike weights for models M1 to M4 (differences of the corrected Akaike inf
obtained for model M3, are given in Figure S7E).
(E) The simulated (M3) temporal change of the p100-p105 complex concentratio
(F) Fractions of the precursors bound in the p100-p105 complex at unstimulated
confidence interval, as estimated by parameter profile likelihood (dotted frame).
See also Figure S7.
Cell Re
42% of total p105 are involved in p100-p105 complex formation
(Figure 7F). An analysis of models M2 and M4 yielded similar
values for their best fits (Table S4).
Taken together, mathematical modeling clearly revealed that
the p100-p105 complex is directly signal responsive.
In summary, this work provides a quantitative dissection and
modeling of the NF-kB precursor network and reports an unex-
pected functional hierarchy between p100 and p105 along with
the discovery of a p97 requirement for cogeneration of p50
and p52. Importantly, the gain of p50 and p52 from newly synthe-
sized precursors could implicate that de novo synthesized pre-
cursors have a particular conformation, state of posttranslational
modifications or protein associations, permissive for processing,
that is transformed after a yet-unknown time into a state that
allows only complete degradation. The experimental definition
of these events and the mechanistic details of p97 action will
be subject to subsequent studies.
The coupled responsiveness of both precursors to lympho-
toxin signaling also explains why only nfkb1�/�nfkb2�/� double
knockout shares the complete defect in lymph node formation
and splenic microarchitecture observed in LTbR-deficient
mice. Taken together, the data presented here provide compel-
ling evidence that demands a profound revision of our under-
standing of noncanonical NF-kB activation downstream of
LTbR.
EXPERIMENTAL PROCEDURES
Cell Culture and Reagents
MEF, HEK293, and HeLa cells were cultured in Dulbecco’s modified
Eagle’s medium (DMEM, GIBCO, for MEF DMEM-Glutamax) supplemented
with 10% fetal bovine serum (Gibco; for MEF 10% heat inactivated bovine
calf serum HyClone, Thermo Scientific), penicillin (100 U/ml), and strepto-
mycin (100 mg/ml). MEFs were stimulated with the agonistic anti-LTbR an-
tibodies AC.H6 (0.3 mg/ml; BD Pharmingen), 5G11b (0.3 mg/ml) (Daller et al.,
2011), and 4H8 WH2 (2 mg/ml; Adipogen) (Dejardin et al., 2002). Specificity
was confirmed by using isotype-matched control Ha4/8 (BD Pharmingen)
for AC.H6 (Figure S1B), and LTbR-deficient MEF for 5G11b and 4H8
WH2. HeLa cells were stimulated with LIGHT (100 ng/ml; Enzo Life Sci-
ences). Cycloheximide (Calbiochem) was used at 10 mg/ml, and MG132
(Alexis) and DBeQ (BioVision Technologies) were used at 10 mM final
concentration.
of p100-p105 Complexes
processing of the precursors p100 and p105, as well as the production and
nsidered which differ in the fate of the p100-p105 complex. In M1, the complex
s in the complex are only degraded in a stimulus-dependent or -independent
00 and p105 in the complex are considered.M4 allows for both degradation and
iven in the Supplemental Information.
resolved SILAC data under stimulated and unstimulated conditions (dots) for
meter set (dark curves) and the 95% confidence intervals of the parameters
red (simulated) L Arg-0- and M Arg-6-labeled species are represented by blue
ted as the sum of stimulated L Arg-0 andMArg-6 species, according toM3with
ormation criterion (DAICc) of the best fit for each model to the minimal AICc,
n in response to LTbR activation is shown.
steady state are given for the best parameter set of M3 (gray bar) and the 95%
ports 9, 1756–1769, December 11, 2014 ª2014 The Authors 1767

Antibodies
RelA/p65 (sc-372), RelB (sc-226), p52/p100 (sc-7386), p50/p105 (sc-1192, sc-
8414, sc-114), TRAF2 (sc-876), TRAF3 (sc-947), and c-jun (sc-45) antibodies
were from Santa Cruz Biotechnology. Anti-p100C, b-Actin, a-Tubulin, and
FLAG M2 antibodies were from Sigma-Aldrich. Anti-p105C (4717), IKKa
(2682), NIK (4994), and phospho p100 (4810) antibodies were from Cell
Signaling. GFP antibody was from Abcam. Anti-cIAP1/2, anti-LDH, and p97
antibodies were from R&D Systems, Chemicon International, and Progen,
respectively.
The Supplemental Experimental Procedures can be found in the Supple-
mental Information section.
SUPPLEMENTAL INFORMATION
Supplemental Information includes Supplemental Experimental Procedures,
seven figures, and five tables and can be found with this article online at
http://dx.doi.org/10.1016/j.celrep.2014.11.014.
AUTHOR CONTRIBUTIONS
Z.B.Y. performed the biochemical and cell biological experiments. P.B. devel-
oped the SRM procedure and performed mass spectrometry (MS) measure-
ments. G.D. conceived and designed the MS analyses. B.K., K.B., and J.W.
designed mathematical models. B.K. and K.B. performed model simulations
and statistical analyses. I.I. performed biochemical analyses of p97. Z.B.Y.
and C.S. wrote the manuscript with feedback of J.W., G.D., and all other au-
thors. F.W. provided advice and material. B.K. and P.B. contributed equally
to this work. All authors contributed to the discussion of the results. Along
with Z.B.Y., G.D., and J.W., C.S. conceived the study and supervised the
project.
ACKNOWLEDGMENTS
We thank Sabine Jungmann and Sandra Rohrmoser for excellent technical
assistance. We thank Anup Arumughan for p97 constructs and discussions.
We also thank Ruth Schmidt-Ullrich, Marc Riemann, Michael Hinz, Seda
Coel Arslan, Felix Oden, Kristina Schradi, Uwe Benary, and Niklas Hartung
for valuable discussions and reagents. This work was supported in part by
grants fromBMBF (ProSiTu) to G.D., J.W., and C.S and from the Helmholtz As-
sociation (MSBN Systems Biology) to J.W. and C.S. Our paper is dedicated to
the memory of Falk Weih.
Received: February 7, 2014
Revised: October 20, 2014
Accepted: November 8, 2014
Published: December 4, 2014
REFERENCES
Baek, G.H., Cheng, H., Choe, V., Bao, X., Shao, J., Luo, S., and Rao, H.
(2013). Cdc48: a swiss army knife of cell biology. J. Amino Acids 2013,
183421.
Basak, S., and Hoffmann, A. (2008). Crosstalk via the NF-kappaB signaling
system. Cytokine Growth Factor Rev. 19, 187–197.
Basak, S., Kim, H., Kearns, J.D., Tergaonkar, V., O’Dea, E., Werner, S.L.,
Benedict, C.A., Ware, C.F., Ghosh, G., Verma, I.M., and Hoffmann, A.
(2007). A fourth IkappaB protein within the NF-kappaB signaling module.
Cell 128, 369–381.
Basak, S., Behar, M., and Hoffmann, A. (2012). Lessons from mathematically
modeling the NF-kB pathway. Immunol. Rev. 246, 221–238.
Beinke, S., Belich, M.P., and Ley, S.C. (2002). The death domain of NF-kappa
B1 p105 is essential for signal-induced p105 proteolysis. J. Biol. Chem. 277,
24162–24168.
Burnham, K.P., and Anderson, D.R. (2004). Multimodel Inference Understand-
ing AIC and BIC in Model Selection. Sociol. Methods Res. 33, 261–304.
1768 Cell Reports 9, 1756–1769, December 11, 2014 ª2014 The Aut
Cheong, R., Hoffmann, A., and Levchenko, A. (2008). Understanding NF-kap-
paB signaling via mathematical modeling. Mol. Syst. Biol. 4, 192.
Chou, T.F., Brown, S.J., Minond, D., Nordin, B.E., Li, K., Jones, A.C., Chase,
P., Porubsky, P.R., Stoltz, B.M., Schoenen, F.J., et al. (2011). Reversible inhib-
itor of p97, DBeQ, impairs both ubiquitin-dependent and autophagic protein
clearance pathways. Proc. Natl. Acad. Sci. USA 108, 4834–4839.
Claudio, E., Brown, K., Park, S., Wang, H., and Siebenlist, U. (2002). BAFF-
induced NEMO-independent processing of NF-kappa B2 in maturing B cells.
Nat. Immunol. 3, 958–965.
Coope, H.J., Atkinson, P.G., Huhse, B., Belich, M., Janzen, J., Holman, M.J.,
Klaus, G.G., Johnston, L.H., and Ley, S.C. (2002). CD40 regulates the process-
ing of NF-kappaB2 p100 to p52. EMBO J. 21, 5375–5385.
Costenoble, R., Picotti, P., Reiter, L., Stallmach, R., Heinemann, M., Sauer, U.,
and Aebersold, R. (2011). Comprehensive quantitative analysis of central car-
bon and amino-acid metabolism in Saccharomyces cerevisiae under multiple
conditions by targeted proteomics. Mol. Syst. Biol. 7, 464.
Daller, B., Musch, W., Rohrl, J., Tumanov, A.V., Nedospasov, S.A., Mannel,
D.N., Schneider-Brachert, W., and Hehlgans, T. (2011). Lymphotoxin-b recep-
tor activation by lymphotoxin-a(1)b(2) and LIGHT promotes tumor growth in an
NFkB-dependent manner. Int. J. Cancer 128, 1363–1370.
Dejardin, E., Droin, N.M., Delhase, M., Haas, E., Cao, Y., Makris, C., Li, Z.W.,
Karin, M., Ware, C.F., and Green, D.R. (2002). The lymphotoxin-beta receptor
induces different patterns of gene expression via two NF-kappaB pathways.
Immunity 17, 525–535.
DeLaBarre, B., Christianson, J.C., Kopito, R.R., and Brunger, A.T. (2006). Cen-
tral pore residues mediate the p97/VCP activity required for ERAD. Mol. Cell
22, 451–462.
Fong, A., Zhang, M., Neely, J., and Sun, S.C. (2002). S9, a 19 S proteasome
subunit interacting with ubiquitinated NF-kappaB2/p100. J. Biol. Chem. 277,
40697–40702.
Haines, D.S. (2010). p97-containing complexes in proliferation control and
cancer: emerging culprits or guilt by association? Genes Cancer 1, 753–763.
Hayden, M.S., and Ghosh, S. (2008). Shared principles in NF-kappaB
signaling. Cell 132, 344–362.
Heissmeyer, V., Krappmann, D.,Wulczyn, F.G., and Scheidereit, C. (1999). NF-
kappaB p105 is a target of IkappaB kinases and controls signal induction of
Bcl-3-p50 complexes. EMBO J. 18, 4766–4778.
Heissmeyer, V., Krappmann, D., Hatada, E.N., and Scheidereit, C. (2001).
Shared pathways of IkappaB kinase-induced SCF(betaTrCP)-mediated ubiq-
uitination and degradation for the NF-kappaB precursor p105 and IkappaBal-
pha. Mol. Cell. Biol. 21, 1024–1035.
Heusch,M., Lin, L., Geleziunas, R., andGreene,W.C. (1999). The generation of
nfkb2 p52: mechanism and efficiency. Oncogene 18, 6201–6208.
Holman, S.W., Sims, P.F., and Eyers, C.E. (2012). The use of selected reaction
monitoring in quantitative proteomics. Bioanalysis 4, 1763–1786.
Ishikawa, H., Carrasco, D., Claudio, E., Ryseck, R.P., and Bravo, R. (1997).
Gastric hyperplasia and increased proliferative responses of lymphocytes in
mice lacking the COOH-terminal ankyrin domain of NF-kappaB2. J. Exp.
Med. 186, 999–1014.
Kim, Y.S., Nedospasov, S.A., and Liu, Z.G. (2005). TRAF2 plays a key, nonre-
dundant role in LIGHT-lymphotoxin beta receptor signaling. Mol. Cell. Biol. 25,
2130–2137.
Li, J.M., Wu, H., Zhang, W., Blackburn, M.R., and Jin, J. (2014). The p97-
UFD1L-NPL4 protein complex mediates cytokine-induced IkBa proteolysis.
Mol. Cell. Biol. 34, 335–347.
Lin, L., DeMartino, G.N., andGreene,W.C. (2000). Cotranslational dimerization
of the Rel homology domain of NF-kappaB1 generates p50-p105 hetero-
dimers and is required for effective p50 production. EMBO J. 19, 4712–4722.
Lo, J.C., Basak, S., James, E.S., Quiambo, R.S., Kinsella, M.C., Alegre, M.L.,
Weih, F., Franzoso, G., Hoffmann, A., and Fu, Y.X. (2006). Coordination be-
tween NF-kappaB family members p50 and p52 is essential for mediating
LTbetaR signals in the development and organization of secondary lymphoid
tissues. Blood 107, 1048–1055.
hors

Lovas, A., Radke, D., Albrecht, D., Yilmaz, Z.B., Moller, U., Habenicht, A.J.,
and Weih, F. (2008). Differential RelA- and RelB-dependent gene transcription
in LTbetaR-stimulated mouse embryonic fibroblasts. BMC Genomics 9, 606.
Lovas, A., Weidemann, A., Albrecht, D., Wiechert, L., Weih, D., and Weih, F.
(2012). p100 Deficiency is insufficient for full activation of the alternative NF-
kB pathway: TNF cooperates with p52-RelB in target gene transcription.
PLoS ONE 7, e42741.
Luftig, M.A., Cahir-McFarland, E., Mosialos, G., and Kieff, E. (2001). Effects of
the NIK aly mutation on NF-kappaB activation by the Epstein-Barr virus latent
infection membrane protein, lymphotoxin beta receptor, and CD40. J. Biol.
Chem. 276, 14602–14606.
Meyer, H., Bug, M., and Bremer, S. (2012). Emerging functions of the VCP/p97
AAA-ATPase in the ubiquitin system. Nat. Cell Biol. 14, 117–123.
Mordmuller, B., Krappmann, D., Esen, M., Wegener, E., and Scheidereit, C.
(2003). Lymphotoxin and lipopolysaccharide induce NF-kappaB-p52 genera-
tion by a co-translational mechanism. EMBO Rep. 4, 82–87.
Orian, A., Gonen, H., Bercovich, B., Fajerman, I., Eytan, E., Israel, A., Mercurio,
F., Iwai, K., Schwartz, A.L., and Ciechanover, A. (2000). SCF(beta)(-TrCP) ubiq-
uitin ligase-mediated processing of NF-kappaB p105 requires phosphoryla-
tion of its C-terminus by IkappaB kinase. EMBO J. 19, 2580–2591.
Picotti, P., Bodenmiller, B., Mueller, L.N., Domon, B., and Aebersold, R. (2009).
Full dynamic range proteome analysis of S. cerevisiae by targeted proteomics.
Cell 138, 795–806.
Qing, G., Qu, Z., and Xiao, G. (2005). Stabilization of basally translated NF-kap-
paB-inducing kinase (NIK) protein functions as a molecular switch of process-
ing of NF-kappaB2 p100. J. Biol. Chem. 280, 40578–40582.
Razani, B., Reichardt, A.D., and Cheng, G. (2011). Non-canonical NF-kB
signaling activation and regulation: principles and perspectives. Immunol.
Rev. 244, 44–54.
Remouchamps, C., Boutaffala, L., Ganeff, C., and Dejardin, E. (2011). Biology
and signal transduction pathways of the Lymphotoxin-ab/LTbR system. Cyto-
kine Growth Factor Rev. 22, 301–310.
Savinova, O.V., Hoffmann, A., and Ghosh, G. (2009). The Nfkb1 and Nfkb2
proteins p105 and p100 function as the core of high-molecular-weight hetero-
geneous complexes. Mol. Cell 34, 591–602.
Scheidereit, C. (2006). IkappaB kinase complexes: gateways to NF-kappaB
activation and transcription. Oncogene 25, 6685–6705.
Cell Re
Senftleben, U., Cao, Y., Xiao, G., Greten, F.R., Krahn, G., Bonizzi, G., Chen, Y.,
Hu, Y., Fong, A., Sun, S.C., and Karin, M. (2001). Activation by IKKalpha of a
second, evolutionary conserved, NF-kappa B signaling pathway. Science
293, 1495–1499.
Shih, V.F., Davis-Turak, J., Macal, M., Huang, J.Q., Ponomarenko, J., Kearns,
J.D., Yu, T., Fagerlund, R., Asagiri, M., Zuniga, E.I., and Hoffmann, A. (2012).
Control of RelB during dendritic cell activation integrates canonical and nonca-
nonical NF-kB pathways. Nat. Immunol. 13, 1162–1170.
Shinkura, R., Kitada, K., Matsuda, F., Tashiro, K., Ikuta, K., Suzuki, M., Kogishi,
K., Serikawa, T., and Honjo, T. (1999). Alymphoplasia is caused by a point mu-
tation in the mouse gene encoding Nf-kappa b-inducing kinase. Nat. Genet.
22, 74–77.
Sriskantharajah, S., Belich, M.P., Papoutsopoulou, S., Janzen, J., Tybulewicz,
V., Seddon, B., and Ley, S.C. (2009). Proteolysis of NF-kappaB1 p105 is
essential for T cell antigen receptor-induced proliferation. Nat. Immunol. 10,
38–47.
Stilmann, M., Hinz, M., Arslan, S.C., Zimmer, A., Schreiber, V., and Scheider-
eit, C. (2009). A nuclear poly(ADP-ribose)-dependent signalosome confers
DNA damage-induced IkappaB kinase activation. Mol. Cell 36, 365–378.
Sun, S.C. (2012). The noncanonical NF-kB pathway. Immunol. Rev. 246,
125–140.
Vallabhapurapu, S., and Karin, M. (2009). Regulation and function of NF-kap-
paB transcription factors in the immune system. Annu. Rev. Immunol. 27,
693–733.
Wolf-Yadlin, A., Hautaniemi, S., Lauffenburger, D.A., and White, F.M. (2007).
Multiple reaction monitoring for robust quantitative proteomic analysis of
cellular signaling networks. Proc. Natl. Acad. Sci. USA 104, 5860–5865.
Xiao, G., Harhaj, E.W., and Sun, S.C. (2001). NF-kappaB-inducing kinase reg-
ulates the processing of NF-kappaB2 p100. Mol. Cell 7, 401–409.
Yamanaka, K., Sasagawa, Y., and Ogura, T. (2012). Recent advances in p97/
VCP/Cdc48 cellular functions. Biochim. Biophys. Acta 1823, 130–137.
Yilmaz, Z.B., Weih, D.S., Sivakumar, V., and Weih, F. (2003). RelB is required
for Peyer’s patch development: differential regulation of p52-RelB by lympho-
toxin and TNF. EMBO J. 22, 121–130.
Zhang, Z., Lv, X., Yin, W.C., Zhang, X., Feng, J., Wu, W., Hui, C.C., Zhang, L.,
and Zhao, Y. (2013). Ter94 ATPase complex targets k11-linked ubiquitinated ci
to proteasomes for partial degradation. Dev. Cell 25, 636–644.
ports 9, 1756–1769, December 11, 2014 ª2014 The Authors 1769
Related Documents