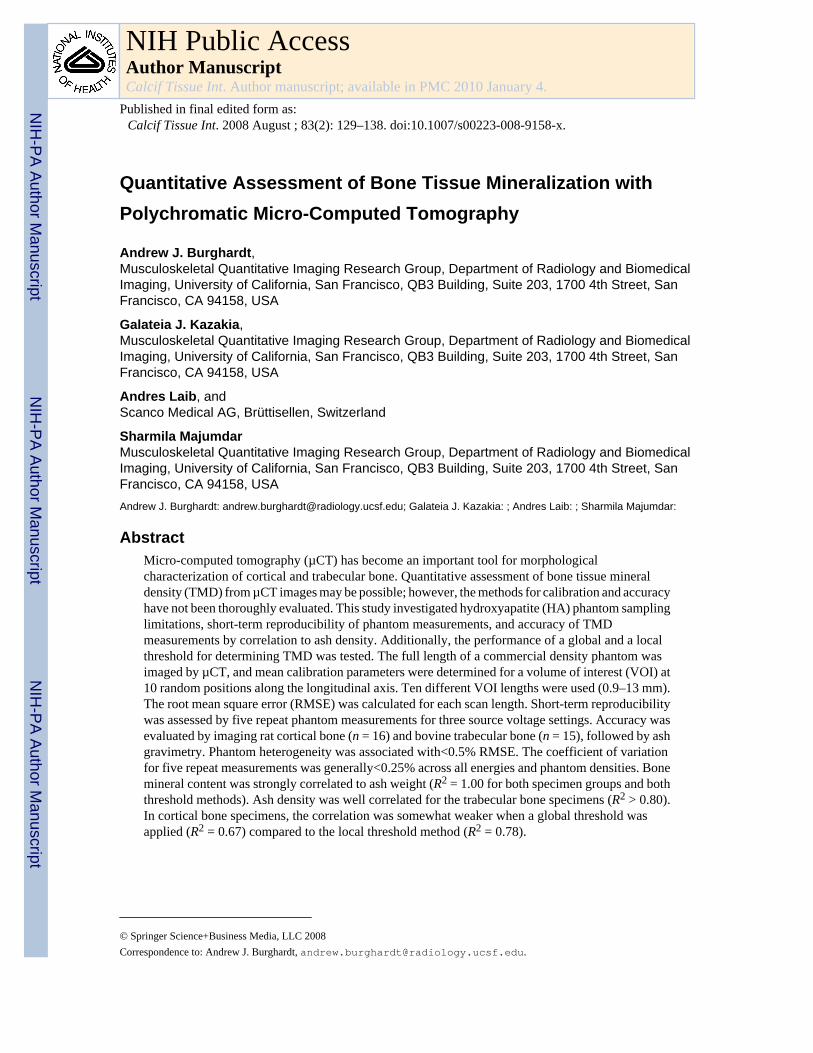
Quantitative Assessment of Bone Tissue Mineralization with Polychromatic Micro-Computed Tomography Andrew J. Burghardt, Musculoskeletal Quantitative Imaging Research Group, Department of Radiology and Biomedical Imaging, University of California, San Francisco, QB3 Building, Suite 203, 1700 4th Street, San Francisco, CA 94158, USA Galateia J. Kazakia, Musculoskeletal Quantitative Imaging Research Group, Department of Radiology and Biomedical Imaging, University of California, San Francisco, QB3 Building, Suite 203, 1700 4th Street, San Francisco, CA 94158, USA Andres Laib, and Scanco Medical AG, Brüttisellen, Switzerland Sharmila Majumdar Musculoskeletal Quantitative Imaging Research Group, Department of Radiology and Biomedical Imaging, University of California, San Francisco, QB3 Building, Suite 203, 1700 4th Street, San Francisco, CA 94158, USA Andrew J. Burghardt: [email protected]; Galateia J. Kazakia: ; Andres Laib: ; Sharmila Majumdar: Abstract Micro-computed tomography (μCT) has become an important tool for morphological characterization of cortical and trabecular bone. Quantitative assessment of bone tissue mineral density (TMD) from μCT images may be possible; however, the methods for calibration and accuracy have not been thoroughly evaluated. This study investigated hydroxyapatite (HA) phantom sampling limitations, short-term reproducibility of phantom measurements, and accuracy of TMD measurements by correlation to ash density. Additionally, the performance of a global and a local threshold for determining TMD was tested. The full length of a commercial density phantom was imaged by μCT, and mean calibration parameters were determined for a volume of interest (VOI) at 10 random positions along the longitudinal axis. Ten different VOI lengths were used (0.9–13 mm). The root mean square error (RMSE) was calculated for each scan length. Short-term reproducibility was assessed by five repeat phantom measurements for three source voltage settings. Accuracy was evaluated by imaging rat cortical bone (n = 16) and bovine trabecular bone (n = 15), followed by ash gravimetry. Phantom heterogeneity was associated with<0.5% RMSE. The coefficient of variation for five repeat measurements was generally<0.25% across all energies and phantom densities. Bone mineral content was strongly correlated to ash weight (R 2 = 1.00 for both specimen groups and both threshold methods). Ash density was well correlated for the trabecular bone specimens (R 2 > 0.80). In cortical bone specimens, the correlation was somewhat weaker when a global threshold was applied (R 2 = 0.67) compared to the local threshold method (R 2 = 0.78). © Springer Science+Business Media, LLC 2008 Correspondence to: Andrew J. Burghardt, [email protected]. NIH Public Access Author Manuscript Calcif Tissue Int. Author manuscript; available in PMC 2010 January 4. Published in final edited form as: Calcif Tissue Int. 2008 August ; 83(2): 129–138. doi:10.1007/s00223-008-9158-x. NIH-PA Author Manuscript NIH-PA Author Manuscript NIH-PA Author Manuscript

Welcome message from author
This document is posted to help you gain knowledge. Please leave a comment to let me know what you think about it! Share it to your friends and learn new things together.
Transcript
Quantitative Assessment of Bone Tissue Mineralization withPolychromatic Micro-Computed Tomography
Andrew J. Burghardt,Musculoskeletal Quantitative Imaging Research Group, Department of Radiology and BiomedicalImaging, University of California, San Francisco, QB3 Building, Suite 203, 1700 4th Street, SanFrancisco, CA 94158, USA
Galateia J. Kazakia,Musculoskeletal Quantitative Imaging Research Group, Department of Radiology and BiomedicalImaging, University of California, San Francisco, QB3 Building, Suite 203, 1700 4th Street, SanFrancisco, CA 94158, USA
Andres Laib, andScanco Medical AG, Brüttisellen, Switzerland
Sharmila MajumdarMusculoskeletal Quantitative Imaging Research Group, Department of Radiology and BiomedicalImaging, University of California, San Francisco, QB3 Building, Suite 203, 1700 4th Street, SanFrancisco, CA 94158, USAAndrew J. Burghardt: [email protected]; Galateia J. Kazakia: ; Andres Laib: ; Sharmila Majumdar:
AbstractMicro-computed tomography (µCT) has become an important tool for morphologicalcharacterization of cortical and trabecular bone. Quantitative assessment of bone tissue mineraldensity (TMD) from µCT images may be possible; however, the methods for calibration and accuracyhave not been thoroughly evaluated. This study investigated hydroxyapatite (HA) phantom samplinglimitations, short-term reproducibility of phantom measurements, and accuracy of TMDmeasurements by correlation to ash density. Additionally, the performance of a global and a localthreshold for determining TMD was tested. The full length of a commercial density phantom wasimaged by µCT, and mean calibration parameters were determined for a volume of interest (VOI) at10 random positions along the longitudinal axis. Ten different VOI lengths were used (0.9–13 mm).The root mean square error (RMSE) was calculated for each scan length. Short-term reproducibilitywas assessed by five repeat phantom measurements for three source voltage settings. Accuracy wasevaluated by imaging rat cortical bone (n = 16) and bovine trabecular bone (n = 15), followed by ashgravimetry. Phantom heterogeneity was associated with<0.5% RMSE. The coefficient of variationfor five repeat measurements was generally<0.25% across all energies and phantom densities. Bonemineral content was strongly correlated to ash weight (R2 = 1.00 for both specimen groups and boththreshold methods). Ash density was well correlated for the trabecular bone specimens (R2 > 0.80).In cortical bone specimens, the correlation was somewhat weaker when a global threshold wasapplied (R2 = 0.67) compared to the local threshold method (R2 = 0.78).
© Springer Science+Business Media, LLC 2008Correspondence to: Andrew J. Burghardt, [email protected].
NIH Public AccessAuthor ManuscriptCalcif Tissue Int. Author manuscript; available in PMC 2010 January 4.
Published in final edited form as:Calcif Tissue Int. 2008 August ; 83(2): 129–138. doi:10.1007/s00223-008-9158-x.
NIH
-PA Author Manuscript
NIH
-PA Author Manuscript
NIH
-PA Author Manuscript
KeywordsMicro-computed tomography; Computed tomography; Mineralization; Bone tissue; Density
Micro-computed tomography (µCT) has become an important tool for addressing a wide rangeof research questions related to the biology of bone and other calcified tissues. Quantitativemeasures derived from µCT have generally been limited to geometric and topologicalparameters describing the size and shape of trabecular and cortical bone [1–4]. Thesemicrostructural features have been shown to improve the prediction of bone strengthindependently of traditional measures of bone density [5,6] and, therefore, represent a targetfor therapeutic manipulation. In addition to geometry, bone material composition is adeterminant of bone strength [7] and can be positively modified pharmacologically [8].Quantification of the mineral and organic properties of bone tissue has primarily been limitedto two-dimensional (2D), destructive methods, including microradiography [9], infraredspectroscopic imaging [10], and backscatter electron imaging [11]. The ability to characterizetissue-level mineralization through 3D, nondestructive means would be an attractivecomplement to microstructural and biomechanical analyses already established for µCT.
Analogous to clinical quantitative computed tomography (QCT), µCT image intensity values(X-ray linear attenuation) reflect compositional properties of the imaged field of view (FOV).Where QCT gives apparent level measures of bone mineral density (BMD), the resolution ofµCT is sufficient to potentially permit tissue-level characterization of the degree ofmineralization. Recently, synchrotron radiation µCT (SR-µCT) experiments have establishedthe principle of densitometric µCT [12,13] and have been applied to demonstrate pathologicaland pharmacological changes in tissue composition [14–17]. However, translation to widelyavailable polychromatic µCT (X-ray tube desktop systems) faces several challenges.Specifically, polychromatic µCT is subject to beam-hardening effects, which result in spatialand geometric dependencies in the depiction of linear attenuation across the imaged FOV.Additionally, the signal-to-noise ratio (SNR) is typically lower for standard µCT, andcommonly used cone-beam reconstruction methods are subject to geometric artifacts [18].Nevertheless, a few commercial systems now provide protocols for calibrating reconstructedlinear attenuation to mineral density.
The purpose of this study was to evaluate several important aspects of quantitativepolychromatic µCT. Specifically, the following were characterized: (1) the error associatedwith sampling a relatively small section of a phantom comprised of hydroxyapatite (HA) andepoxy resin cylinders with known bulk concentrations but apparent microscale heterogeneity,(2) the short-term reproducibility of calibration measurements, and (3) the accuracy of meanmeasures of the degree of mineralization in trabecular and cortical bone through comparisonto ash density reference measurements, with a focus on the effects of two different segmentationmethods for identifying mineralized tissue.
Materials and MethodsµCT
All imaging measurements in the present study were made on a commercial µCT system(µCT-40; Scanco Medical, Brüttiselen, Switzerland). This device consists of a micro-focus X-ray source with a 0.5-mm-thick aluminum filter that produces a narrow-angle cone beam,incident upon a 1,024 × 64 element CCD detector. A previous generation of this scanner hasbeen described in detail [19]. The reconstruction algorithm, beam-hardening correction, andHA phantom detailed below were provided by the manufacturer. Unless stated otherwise, allimaging measurements described below were acquired as follows: 1,000 half-field projection
Burghardt et al. Page 2
Calcif Tissue Int. Author manuscript; available in PMC 2010 January 4.
NIH
-PA Author Manuscript
NIH
-PA Author Manuscript
NIH
-PA Author Manuscript
images were collected spanning 360 degrees, with each projection sampled for 200milliseconds. The projections were then reconstructed across a 1,024 × 1,024 matrix spanninga 36.9 mm FOV and resulting in an isotropic nominal resolution of 36 µm. Projection frameaveraging (n = 10) was used for improved SNR for establishing the baseline calibration, andsubsequently the calibration was routinely monitored for quality-control purposes using single-frame acquisitions (n = 1).
Beam-Hardening CorrectionTo minimize geometric dependencies in reconstructed linear attenuation values, voltage-specific beam-hardening correction (BHC) factors were determined by the manufacturer. Awedge-shaped phantom (70 × 35 mm) composed of a 200 mg HA/cm3 HA–epoxy resin mixturewas imaged for three source voltages (45, 55, 70 kVp). This concentration was assumed to bea reasonable approximation of apparent level mineral density for cancellous bone biopsies/necropsies and whole-bone samples from small animals. This model for beam hardeningassumes bone to be composed of two phases: a highly attenuating calcium phosphate mineralcomponent and a soft tissue-equivalent, organic phase. The phantom geometry is shown inschematic form in Fig. 1a. For each voltage setting, the transmitted X-ray intensity through thephantom (Imeas) and the unimpeded reference intensity (I0) were measured at 15 positions alongthe length of the wedge, corresponding to thicknesses of 0–7 mm. For unit attenuation, thedeviation in the absorption curve (ln[I0/Imeas]) from linearity—ln(I0/Itheory)—indicates thedegree of beam hardening (Fig. 1b). A voltage-specific correction equation (εv, Fig. 1c) wasderived using a third-order polynomial least squares fit of the difference—ln(I0/Itheory) – ln(I0/Imeas)—as a function of ln(I0/Imeas). Corrected absorption values (ln[I0/Icorr]) are calculatedat reconstruction time for tomographic acquisitions based on this correction equation for thecorresponding voltage configuration:
(1)
Density CalibrationCalibration of the reconstructed gray-scale attenuation values against mineral density wasperformed using a phantom composed of five cylinders of HA–resin mixtures with a range ofmineral concentrations (0, 100, 200, 400, 800 mg HA/cm3), where 0 mg HA/cm3 represents asoft tissue equivalent background devoid of mineral. For each anode voltage (45, 55, 70 kVp),24 slices were acquired near the mid-length of the phantom. The mean attenuation value foreach cylinder was calculated at each voltage setting, and individual linear relationships weredetermined against the known mineral concentrations:
(2)
where m and b represent the slope and intercept relating HA concentration ([HA] in mg HA/cm3) to linear attenuation (μ). A representative tomographic image of the phantom andcorresponding calibration plots are presented in Fig. 2. A simple script was developed to allowconvenient calibration scan repetition at a fixed position for the reproducibility experimentsdescribed below and routine monitoring of system stability.
Phantom SamplingDue to the low solubility of HA, phantoms for bone mineral are typically composed of HA–epoxy resin composites. The granularity of such phantoms—readily apparent at µCTresolutions—is a potential source of error for the proposed calibration scheme [20,21]. To
Burghardt et al. Page 3
Calcif Tissue Int. Author manuscript; available in PMC 2010 January 4.
NIH
-PA Author Manuscript
NIH
-PA Author Manuscript
NIH
-PA Author Manuscript
characterize sampling limitations due to phantom heterogeneity, a single acquisition coveringthe full length of the phantom (16 mm) was acquired at 70 kVp. Mean attenuation values weredetermined for each HA cylinder in 10 regions of interest (ROI) randomly placed along thelength of the phantom. This was repeated for six different ROI lengths ranging 0.9–13 mm(number of slices = 24, 48, 96, 182, 288, 360), which corresponded to even multiples of thedetector stack size for this acquisition mode (24 slices). The root mean square error (RMSE)was calculated for each length against the mean attenuation of the full cylinder:
(3)
where RMSEc,l is the RMSE for a length l in the cylinder with concentration c, µc,l,i is the meanattenuation of the ith randomly placed ROI with length l in the cylinder with concentration c,Mc is the mean attenuation for the full length of the cylinder with concentration c, and n is thenumber of regions sampled for each of the six lengths l (here n = 10). RMSE has been reportedas a percent of Mc. RMSE was also calculated for the calibration slope and intercept.
ReproducibilityShort-term reproducibility of phantom calibration measurements was evaluated using thestandardized calibration technique described above. Reproducibility was determined byacquiring five sets of calibration data for each voltage over the course of 3 days. Phantomrepositioning was performed between repetitions, and scan localization was set to a fixedposition in the scanner coordinate system. The mean linear attenuation coefficient wasdetermined for each cylinder, for each repetition, and at each energy level. The coefficient ofvariation (CV%) was calculated for each cylinder at each energy level. Similarly, CV% wasdetermined for the calibration slope and intercepts calculated for each repetition.
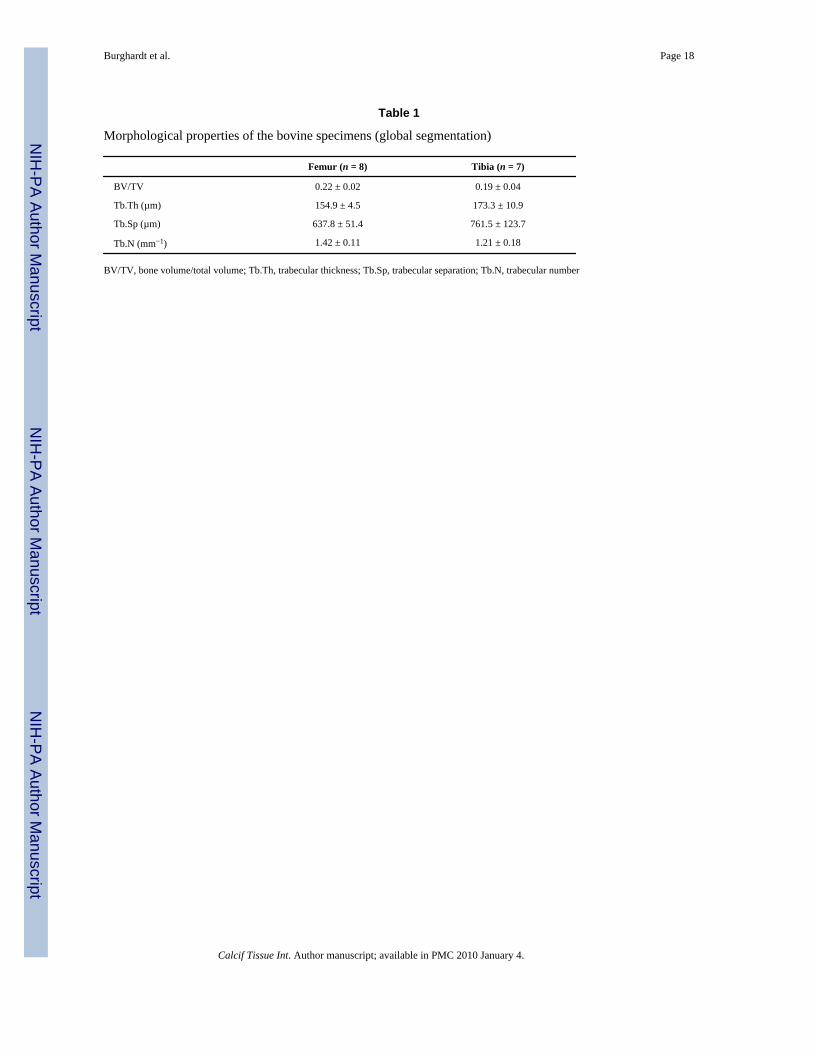
AccuracyThe accuracy of µCT-derived measures of tissue-level mineral density was assessed bycomparison to empirical measures of mineral content (ash gravimetrics) in two distinct groupsof bone tissue: Cylindrical cores (8 × 18 mm) of bovine trabecular bone were acquired fromthe proximal femur (n = 8) and proximal tibia (n = 7). The mean morphological properties forthis specimen group, calculated by direct 3D methods from µCT images described below [3],are listed in Table 1. A second set of specimens included mid-diaphyseal sections (4 mm inlength) from the tibia (n = 9) and femur (n = 9) of adult Sprague-Dawley rats. All specimenswere defatted using alternating cycles of deionized water and a mild biological detergentsolution (1%, Tergazyme; Alconox Inc., New York, NY) under sonication and a mild waterjet-wash. This process was necessary for gravimetry and was performed prior to imaging toavoid discrepancies in µCT and gravimetry data related to minor changes in bone mass as aresult of the cleaning process. Specimens were stored at −20°C when not being processed.
All specimens were imaged using a similar protocol as described earlier with two exceptions:the FOV was 16.4 mm (16 µm nominal resolution) and no projection averaging was used inorder to be consistent with a typical specimen protocol. Because the BHC and calibrationmodels assume a soft tissue-equivalent background, all bone specimens were immersed indeionized water and air bubbles were removed by repeat vacuum cycles at 28 psi. The SNR ofthe reconstructed images was calculated as the mean attenuation of the bone phase divided bythe standard deviation of the water background.
Segmentation of the reconstructed gray-scale image into a binary bone/background image wascarried out using two methods in an in-house customized version of IPL (IPL v5.01c-ucsf,
Burghardt et al. Page 4
Calcif Tissue Int. Author manuscript; available in PMC 2010 January 4.
NIH
-PA Author Manuscript
NIH
-PA Author Manuscript
NIH
-PA Author Manuscript
Scanco Medical): (1) a global threshold automatically determined for each specimen using acommon adaptive iterative method [22] and (2) a local adaptive threshold [23]. Briefly, theglobal adaptive iterative threshold method was implemented as follows: a 3D constrainedgaussian filter (σ = 0.7, kernel = 3) was applied to remove high-frequency noise prior to thebinarization step. Assuming a bimodal intensity distribution, the midpoint between bone andbackground peaks in the intensity histogram is iteratively determined according to Eq. 4:
(4)
where Tk is the trial threshold, h(i) is the histogram count for intensity i, and N is the maximumimage intensity. When subsequent thresholds are identical, convergence has been reached,which effectively is equivalent to the midpoint between bone and background peaks. Thisvalue, determined for each specimen, was used as the global threshold. The mean globalthreshold values were equivalent to [HA] values of 515 ± 12 and 573 ± 14 mg HA/cm3 for thetrabecular and cortical specimens, respectively. The trabecular bone morphometric resultspresented in Table 1 were determined using global segmentation.
A summary schematic of the local threshold algorithm is presented in Fig. 3, while the completealgorithm details have been described elsewhere [23]. In this method, a Canny edge detectoris used to locate bone marrow surfaces in the original gray-scale image. The intensity valuesof these edge voxels are then used as local threshold values for adjacent voxels. First, a 3Dconstrained gaussian filter (σ = 0.7, kernel = 3) is applied to remove high-frequency noise andtexture. To further minimize false edge detection arising from noise or real image texture, theintensity values in the smoothed image were truncated using a floor and ceiling operator([HA]min = 0 mg HA/cm3, [HA]max = 1,050 mg HA/cm3). A lower (Glow) and upper (Ghigh)gradient magnitude cut-off is required as input for the Canny algorithm to determine true edges.These parameters were automatically selected for each specimen based on the histogram ofthe gradient magnitude image. The same adaptive iterative approach used for the globalsegmentation was used to determine Glow from the gradient magnitude histogram [22]. Asapplied here, this technique iteratively selected the midpoint between the histogram peaksrepresenting weak gradients (noise, texture) and strong gradients (bone–marrow interfaces).The histogram peak position corresponding to the strong gradient magnitude was taken asGhigh (Fig. 4).
The mean tissue mineral density of the bone matrix (TMD), intraspecimen distribution of tissuemineral density (TMD.SD), and bone mineral content (BMC) were calculated in IPL based onthe calibrated voxel attenuation values according to Eq. 2. To calculate TMD, the binary imagefrom either segmentation process was used to mask the original gray-scale data. Each maskwas eroded by two voxels to exclude partial volume. The mean linear attenuation value ofvoxels in the mask was converted to an equivalent HA concentration (mg HA/cm3) using thecalibration slope and intercept for the appropriate source voltage. Additionally, the TMD.SDwithin each specimen was calculated as the standard deviation of TMD across all bone voxels.BMC was calculated as the product of TMD and total bone volume.
Following the completion of imaging experiments, all specimens were transferred topreweighed porcelain crucibles, then placed inside a furnace (FB1300; Barnstead Thermolyne,Dubuque, IA) for 48 h at 600°C to remove all organic tissue components. The remaining ashmineral mass was weighed and corrected with the weight of the empty crucible to give ash
Burghardt et al. Page 5
Calcif Tissue Int. Author manuscript; available in PMC 2010 January 4.
NIH
-PA Author Manuscript
NIH
-PA Author Manuscript
NIH
-PA Author Manuscript
weight. Bone volume determined by µCT (global threshold method) was used to calculate ashdensity. In this case, bone volume was determined prior to the voxel-peeling process used tocalculate TMD.
StatisticsThe mean and standard deviation for all indices were calculated for trabecular and corticalspecimens. A one-way analysis of variance (ANOVA) with Tukey’s honest significantdifference (HSD) post hoc test was used to evaluate statistical differences for thereproducibility results. Regression analysis was performed to compare µCT-derived measuresof mineralization to the gravimetric results. Linear correlations between BMC and ash weightwere determined individually for trabecular and cortical specimens due to the large differencein weight between these groups. The correlation between ash density and TMD was alsocalculated separately for the trabecular and cortical specimen groups.
ResultsPhantom Sampling
RMSE in the mean attenuation value for a phantom cylinder was found to decrease as thesampled length along the phantom increased (Fig. 5). For a single stack acquisition (24 slices,0.86 mm) RMSE ranged 0.19–0.39%, while the longest sampled length (360 slices, 12.96 mm)yielded RMSE of 0.04–0.13%. The largest RMSE for attenuation was generally found in thelow-density cylinders with non-zero HA concentrations and the lowest in the background (pureepoxy) and highest-density cylinders. The errors for the calibration ranged 0.15–0.21% for theslope and 0.29–0.50% for the intercept. The mean slope and intercept for the shortest andlongest sampled lengths were not statistically different (P > 0.05).
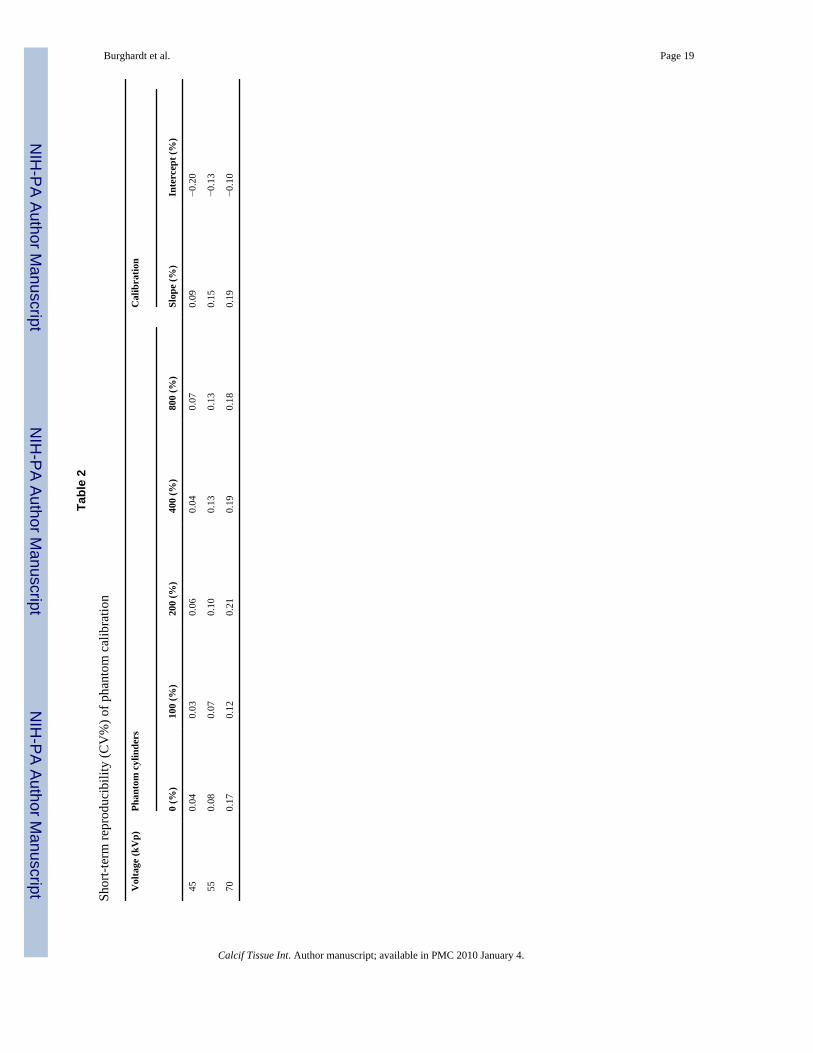
ReproducibilityShort-term reproducibility errors for phantom density calibration measurements were low(Table 2). The CV% of mean linear attenuation values calculated for repeat phantom scansranged 0.03–0.21%. Reproducibility for the derived calibration slope and intercept was 0.09–0.20%. In general, CV% was highest for 70 kVp scans and lowest at 45 kVp. Results wereanalyzed using a one-way ANOVA between 45, 55, and 70 kVp acquisitions. This analysisrevealed a significant effect for voltage (P < 0.0001). Tukey’s HSD test showed significantdifferences in CV% between each voltage configuration (P < 0.05).
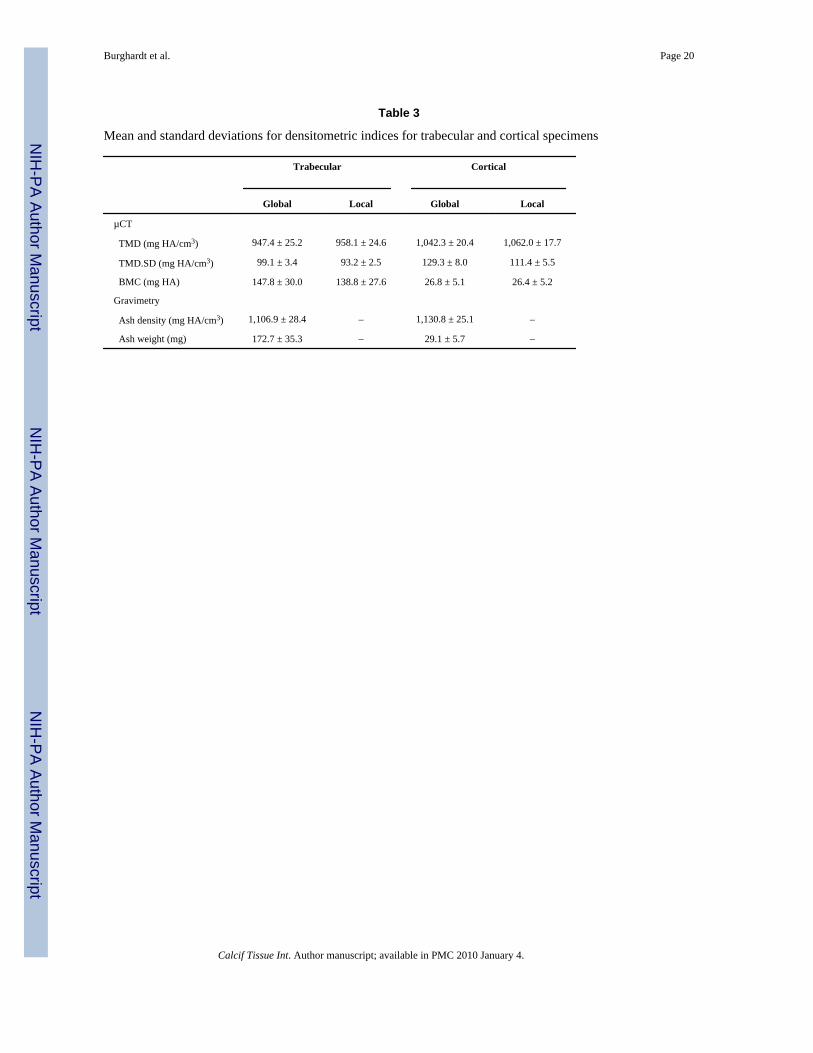
AccuracyRepresentative images from the trabecular and cortical specimens are presented in Fig. 6, andmean densitometric indices are given in Table 3. Using a typical acquisition protocol, a meanSNR of 27.9 was found for the trabecular bone images, while mean SNR was 28.9 for corticalbone images. The regression analysis results are plotted in Fig. 7. TMD ranged 900–1,100 mgHA/cm3, with the trabecular specimens spanning the lower half of the range and corticalspecimens spanning the higher half. Global segmentation tended to yield a lower TMD valuecompared to local segmentation; however, this was only statistically significant for the corticalbone specimens (P < 0.01), where local segmentation was more strongly correlated to ashdensity (R2 = 0.78 vs. R2 = 0.67). Qualitatively, cortical specimens appeared to have a greaterrange of mineralization levels. This was corroborated by a greater average TMD.SD for corticalspecimens compared to trabecular specimens (111.4 vs. 93.2 mg HA/cm3, P < 0.0001). BMCwas very strongly correlated to ash weight (R2 = 1.00) for both specimen groups using eithersegmentation method. Local segmentation underestimated ash weight to a larger degree thandid global segmentation (slope = 0.78 vs. 0.85, respectively).
Burghardt et al. Page 6
Calcif Tissue Int. Author manuscript; available in PMC 2010 January 4.
NIH
-PA Author Manuscript
NIH
-PA Author Manuscript
NIH
-PA Author Manuscript
DiscussionQuantitative characterization of tissue-level mineralization in a nondestructive, 3D fashionwould be an attractive complement to bone morphometry and whole-bone measures of bonemass (BMD). In this study, the reproducibility and accuracy of a density calibration methodfor quantitative polychromatic µCT have been established. In addition, the accuracy of meandensity parameters has been characterized in cortical and trabecular bone specimens bycomparison to physical measures of mineral content.
Based on the results of phantom sampling experiments, a single stack acquisition(corresponding to 24 slices/0.864 mm) was deemed reasonable for routine calibration scansand, by extension, for evaluation of reproducibility and accuracy of the device for quantitativemeasures of tissue density. Errors related to reproducibility of calibration measurements at afixed position in the phantom were low for all X-ray source voltages (CV < 0.25%), thoughCV tended to increase with increasing voltage. It is important to note that these results arespecific to the phantom design, BHC method, and type of scanner used and may not be fullygeneralized across all µCT systems and phantom configurations.
An early study by Mulder et al. [21] presented a density calibration scheme for a similarpolychromatic µCT system, which employed the manufacturer’s generalized BHC used at thetime and a polynomial calibration determined from sequential scans of liquid K2HPO4solutions. Accuracy was estimated by comparing mean density measures in a set of individualcylindrical phantoms to theoretical attenuation values [24] based on the phantom concentrationand mean effective energy (estimated from the same phantom scans). More recently, customsoftware BHC techniques have been introduced that are energy- and material-specific.Additionally, a standard density calibration phantom has been developed. The primary strengthof this study is that the calibration methods applied include the new energy-specific BHC,optimized for bone tissue (using a 200 mg HA/cm3 wedge phantom). Furthermore, in this studyaccuracy was determined in real bone specimens using empirical means (gravimetry) ratherthan estimated comparisons to theory in homogenous solutions. Finally, the solid phantomused in this study is widely available and not subject to air bubble formation and the temporalinstability associated with aqueous phantoms.
Two different segmentation techniques have been applied to identify bone voxels forcalculating TMD in trabecular and cortical bone specimens: (1) a global method, where a singlethreshold level is automatically determined from the image intensity histogram, and (2) a localsegmentation method, where voxel-specific thresholds are chosen based on local edge intensityvalues. The global iterative threshold method is advantageous in that it is fully automatic, isnonparametric, and requires no subjective input. Similar local adaptive threshold methods havebeen shown to provide improved segmentation under limited resolution scenarios and wherebone tissue density is variable across the region of analysis [23,25]. Visually, it is apparent thatthe cortical specimens (TMD.SD = 111 mg HA/cm3) exhibit greater variability in TMD (Fig.6b). Furthermore, the corresponding composite image (Fig. 6d) demonstrates that globalsegmentation excludes some significant regions of hypomineralization and does not capturesome fine cortical pore structure. Our regression analysis results indicate that a moresophisticated segmentation can improve measures of TMD when a significant degree ofvariability in the degree of mineralization exists within a sample. Qualitatively, the discrepancybetween the global and local segmentations was minimal for the trabecular specimens used inthis study (Fig. 6c). This coincided with a significantly lower average TMD.SD (93 mg HA/cm3). These results suggest that simple global thresholding is sufficient for more homogenousspecimens.
Burghardt et al. Page 7
Calcif Tissue Int. Author manuscript; available in PMC 2010 January 4.
NIH
-PA Author Manuscript
NIH
-PA Author Manuscript
NIH
-PA Author Manuscript
A limitation and potential source of error in the calibration scheme used here is the range ofHA concentrations represented in the phantom (0–800 mg HA/cm3). Because the biologicalrange of TMD typically exceeds 1,000 mg HA/cm3, extrapolation of the calibration curve isnecessary for most applications in bone biology. Beyond these concentrations it is difficult tomanufacture relatively homogeneous HA–epoxy resin mixtures. Recently, Schweizer et al.[26] proposed methods to manufacture pure HA-based phantoms with concentrations ofapproximately 1,200–3,000 mg HA/cm3. While differences in background matrix betweenthese phantoms must be taken into account, composite phantoms may overcome the need forextrapolated calibrations. It is not clear how multiple acquisitions for each density, as done bySchweizer et al., would differ from the calibration using a single phantom. Additionally, unlikeclinical QCT, a limitation of this calibration method is that the calibration is performed as aseparate acquisition from the specimen. While the calibration scan is highly reproducible overthe short term, it is critical that stability is monitored over the longer course of an experimentto identify possible deviations.
The performance of the BHC has not been tested directly. Typically, µCT experiments aredesigned to compare specimens of comparable dimensions. For this reason, it was deemedmore relevant to consider the regression analysis independently for trabecular and corticalspecimens. Nevertheless, it is important to note that there is a significant shift in the regressionequations (i.e., the equation intercepts) between these two groups. This indicates a residualbeam hardening–related geometric dependence in the depiction of mineralization. It is not clearto what extent these errors are affected by geometric and compositional variability; therefore,these results suggest that this BHC and calibration scheme are not well suited for densitometriccomparisons across specimens with disparate geometries.
The results of this study recommend several important directions for future research. First, theaccuracy results presented here only represent volume-averaged analysis of meanmineralization and do not demonstrate the local accuracy of mineralization depiction.Forthcoming studies presenting spatially resolved comparisons of polychromatic µCT-derivedmineralization maps to SR-µCT and Fourier transform infrared spectral imaging will addressthis question. Second, the resolution dependence of tissue density measures is unknown. Theoptical resolution of the system corresponds to approximately 1–2 voxels. For this reason, itis important to exclude two layers of voxels at the bone surface when calculating TMD becausethese voxels would be expected to contain significant partial signal from the marrow. Basedon the morphology of our specimens (Table 1), mean trabecular thickness was spanned byapproximately 10 voxels (16 lm). Therefore, approximately 60% of the mean trabecular widthwas included in the density calculation following the peeling procedure. Accordingly, a greaterfraction of bone volume would be excluded for specimens with higher surface areas (more rod-like structures); therefore, shape should be considered when establishing acquisition protocols.The results of this study do not necessarily extend to more limited resolution protocols. Finally,the accuracy results of this study were limited to two specimen types with moderatemorphological variability. The feasibility of comparing densitometrics across specimens withmore widely divergent geometries and compositions remains to be established.
In summary, several important aspects of quantitative polychromatic µCT have beencharacterized in this study. Errors due to sampling a small section of the calibration phantomdo not exceed 0.5%, even when the sampled length is below 1 mm. Furthermore, calibrationscans were found to be highly reproducible over the short term. Measures of bone mineral massand density derived from µCT were moderately well correlated to gravimetric measures ofmineral content when trabecular and cortical specimens were considered individually. Thisindicates that accurate measures of bone matrix mineralization are possible for samplepopulations with relatively consistent geometries. Finally, a simple global threshold techniqueis preferred for moderately homogenous bone tissue. However, more sophisticated
Burghardt et al. Page 8
Calcif Tissue Int. Author manuscript; available in PMC 2010 January 4.
NIH
-PA Author Manuscript
NIH
-PA Author Manuscript
NIH
-PA Author Manuscript
segmentation schemes can be beneficial when a significant degree of variability inmineralization is present.
AcknowledgmentsWe thank Professor Tony Keaveny and the Orthopedic Biomechanics Lab at the University of California Berkeleyfor providing tissue and use of tissue-processing facilities. We also thank Margarita Meta of the University of CaliforniaLos Angeles and Jennifer Schuyler of the University of California San Francisco Anesthesiology for providing andhelping with the rat specimens. This study was supported with funds from the National Institutes of Health (RO1AG17762 to S. M. and F32 AR053446 to G.J.K.).
References1. Hildebrand T, Laib A, Muller R, Dequeker J, Ruegsegger P. Direct three-dimensional morphometric
analysis of human cancellous bone: microstructural data from spine, femur, iliac crest, and calcaneus.J Bone Miner Res 1999;14:1167–1174. [PubMed: 10404017]
2. Hildebrand T, Ruegsegger P. Quantification of bone microarchitecture with the structure model index.Comput Methods Biomech Biomed Engin 1997;1:15–23. [PubMed: 11264794]
3. Hildebrand T, Ruegsegger P. A new method for the model-independent assessment of thickness inthree-dimensional images. J Microsc 1997;185:67–75.
4. Odgaard A, Gundersen HJ. Quantification of connectivity in cancellous bone, with special emphasison 3-D reconstructions. Bone 1993;14:173–182. [PubMed: 8334036]
5. Ulrich D, van Rietbergen B, Laib A, Ruegsegger P. The ability of three-dimensional structural indicesto reflect mechanical aspects of trabecular bone. Bone 1999;25:55–60. [PubMed: 10423022]
6. Mosekilde L, Mosekilde L. Iliac crest trabecular bone volume as predictor for vertebral compressivestrength, ash density and trabecular bone volume in normal individuals. Bone 1988;9:195–199.[PubMed: 3166835]
7. Follet H, Boivin G, Rumelhart C, Meunier PJ. The degree of mineralization is a determinant of bonestrength: a study on human calcanei. Bone 2004;34:783–789. [PubMed: 15121009]
8. Boivin GY, Chavassieux PM, Santora AC, Yates J, Meunier PJ. Alendronate increases bone strengthby increasing the mean degree of mineralization of bone tissue in osteoporotic women. Bone2000;27:687–694. [PubMed: 11062357]
9. Boivin G, Meunier PJ. The degree of mineralization of bone tissue measured by computerizedquantitative contact microradiography. Calcif Tissue Int 2002;70:503–511. [PubMed: 12019458]
10. Paschalis EP, Betts F, DiCarlo E, Mendelsohn R, Boskey AL. FTIR microspectroscopic analysis ofhuman iliac crest biopsies from untreated osteoporotic bone. Calcif Tissue Int 1997;61:487–492.[PubMed: 9383276]
11. Roschger P, Fratzl P, Eschberger J, Klaushofer K. Validation of quantitative backscattered electronimaging for the measurement of mineral density distribution in human bone biopsies. Bone1998;23:319–326. [PubMed: 9763143]
12. Nuzzo S, Peyrin F, Cloetens P, Baruchel J, Boivin G. Quantification of the degree of mineralizationof bone in three dimensions using synchrotron radiation microtomography. Med Phys 2002;29:2672–2681. [PubMed: 12462734]
13. Postnov AA, Vinogradov AV, van Dyck D, Saveliev SV, De Clerck NM. Quantitative analysis ofbone mineral content by X-ray microtomography. Physiol Meas 2003;24:165–178. [PubMed:12636194]
14. Sone T, Tamada T, Jo Y, Miyoshi H, Fukunaga M. Analysis of three-dimensional microarchitectureand degree of mineralization in bone metastases from prostate cancer using synchrotronmicrocomputed tomography. Bone 2004;35:432–438. [PubMed: 15268894]
15. Nuzzo S, Lafage-Proust MH, Martin-Badosa E, Boivin G, Thomas T, Alexandre C, Peyrin F.Synchrotron radiation microtomography allows the analysis of three-dimensional microarchitectureand degree of mineralization of human iliac crest biopsy specimens: effects of etidronate treatment.J Bone Miner Res 2002;17:1372–1382. [PubMed: 12162491]
16. Borah B, Ritman EL, Dufresne TE, Jorgensen SM, Liu S, Sacha J, Phipps RJ, Turner RT. The effectof risedronate on bone mineralization as measured by micro-computed tomography with synchrotron
Burghardt et al. Page 9
Calcif Tissue Int. Author manuscript; available in PMC 2010 January 4.
NIH
-PA Author Manuscript
NIH
-PA Author Manuscript
NIH
-PA Author Manuscript
radiation: correlation to histomorphometric indices of turnover. Bone 2005;37:1–9. [PubMed:15894527]
17. Borah B, Dufresne TE, Ritman EL, Jorgensen SM, Liu S, Chmielewski PA, Phipps RJ, Zhou X,Sibonga JD, Turner RT. Long-term risedronate treatment normalizes mineralization and continuesto preserve trabecular architecture: sequential triple biopsy studies with micro-computedtomography. Bone 2006;39:345–352. [PubMed: 16571382]
18. Feldkamp LA, Davis LC, Kress JW. Practical cone-beam algorithm. J Opt Soc Am A 1984;1:612–619.
19. Ruegsegger P, Koller B, Muller R. A microtomographic system for the nondestructive evaluation ofbone architecture. Calcif Tissue Int 1996;58:24–29. [PubMed: 8825235]
20. Nazarian, A.; von Stechow, D.; Zurakowski, D.; Muller, R.; Snyder, BD. A quantitative technique toassess bone density from micro-computed tomography; ORS Annual Meeting Transactions ISSN0149-6433; 2003.
21. Mulder L, Koolstra JH, Van Eijden TM. Accuracy of microCT in the quantitative determination ofthe degree and distribution of mineralization in developing bone. Acta Radiol 2004;45:769–777.[PubMed: 15624521]
22. Ridler TW. Picture thresholding using an iterative selection method. IEEE Trans Syst Man Cybern1978;8:630–632.
23. Burghardt AJ, Kazakia GJ, Majumdar S. A local adaptive threshold strategy for high resolutionperipheral quantitative computed tomography of trabecular bone. Ann Biomed Eng 2007;35:1678–1686. [PubMed: 17602299]
24. Berger, MJ.; Hubbell, JH.; Seltzer, SM.; Chang, J.; Coursey, JS.; Sukumar, R.; Zucker, DS. XCOM:photon cross sections database. Gaithersburg, MD: National Institute of Standards and Technology;1990.
25. Waarsing JH, Day JS, Weinans H. An improved segmentation method for in vivo microCT imaging.J Bone Miner Res 2004;19:1640–1650. [PubMed: 15355559]
26. Schweizer S, Hattendorf B, Schneider P, Aeschlimann B, Gauckler L, Muller R, Gunther D.Preparation and characterization of calibration standards for bone density determination bymicrocomputed tomography. Analyst 2007;132:1040–1045. [PubMed: 17893808]
Burghardt et al. Page 10
Calcif Tissue Int. Author manuscript; available in PMC 2010 January 4.
NIH
-PA Author Manuscript
NIH
-PA Author Manuscript
NIH
-PA Author Manuscript
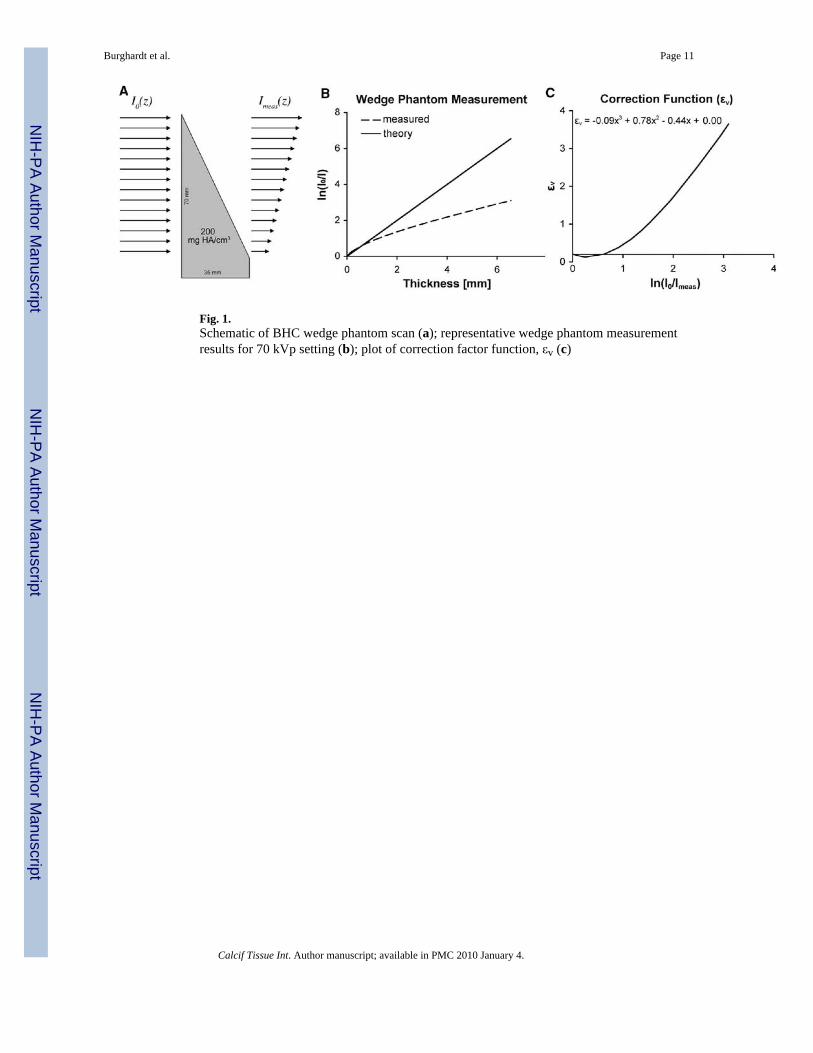
Fig. 1.Schematic of BHC wedge phantom scan (a); representative wedge phantom measurementresults for 70 kVp setting (b); plot of correction factor function, εv (c)
Burghardt et al. Page 11
Calcif Tissue Int. Author manuscript; available in PMC 2010 January 4.
NIH
-PA Author Manuscript
NIH
-PA Author Manuscript
NIH
-PA Author Manuscript
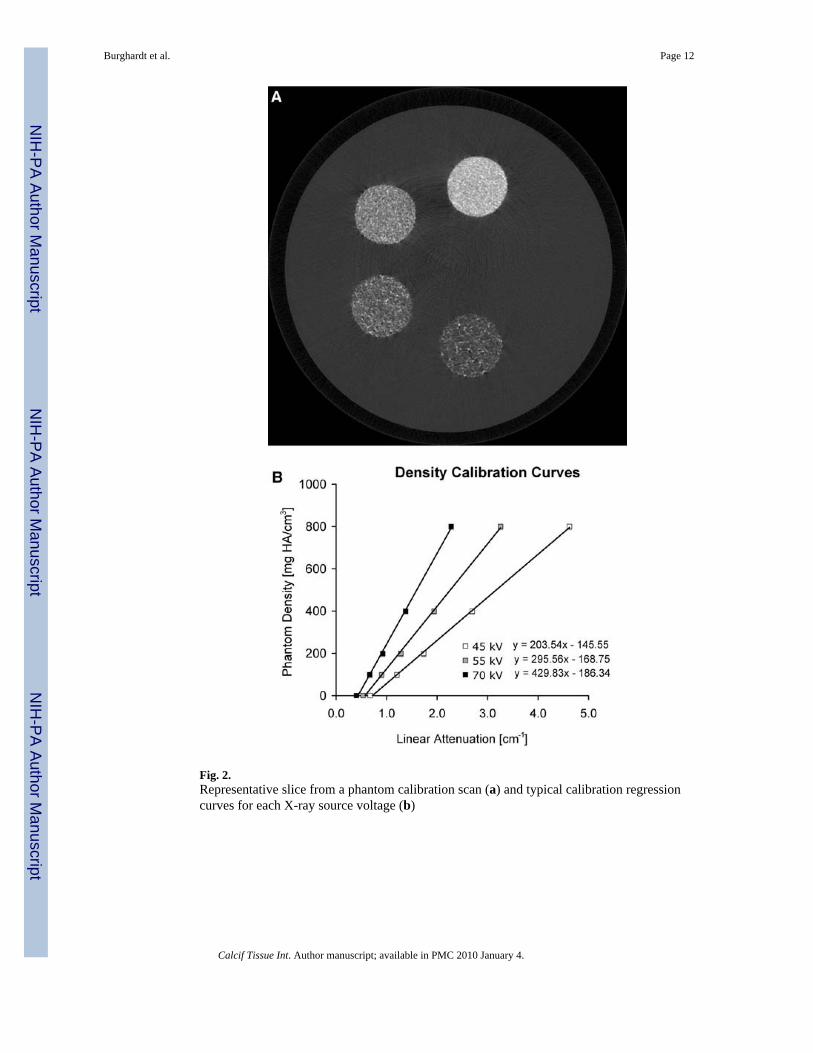
Fig. 2.Representative slice from a phantom calibration scan (a) and typical calibration regressioncurves for each X-ray source voltage (b)
Burghardt et al. Page 12
Calcif Tissue Int. Author manuscript; available in PMC 2010 January 4.
NIH
-PA Author Manuscript
NIH
-PA Author Manuscript
NIH
-PA Author Manuscript
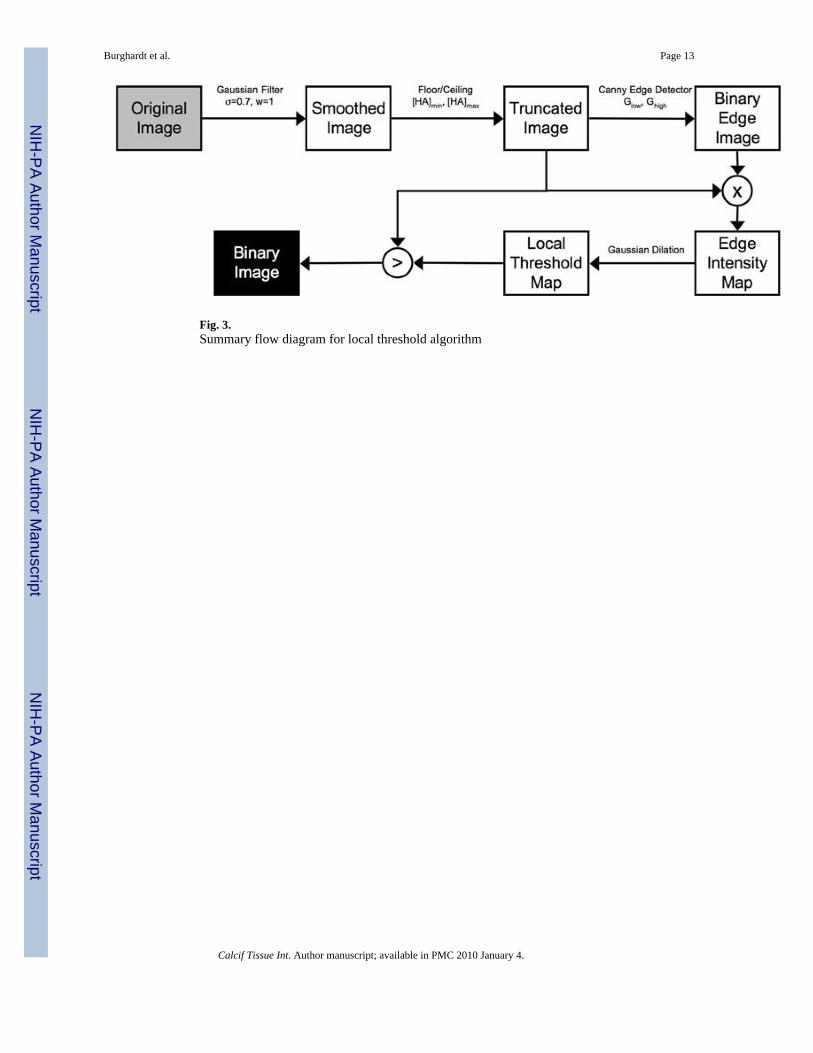
Fig. 3.Summary flow diagram for local threshold algorithm
Burghardt et al. Page 13
Calcif Tissue Int. Author manuscript; available in PMC 2010 January 4.
NIH
-PA Author Manuscript
NIH
-PA Author Manuscript
NIH
-PA Author Manuscript
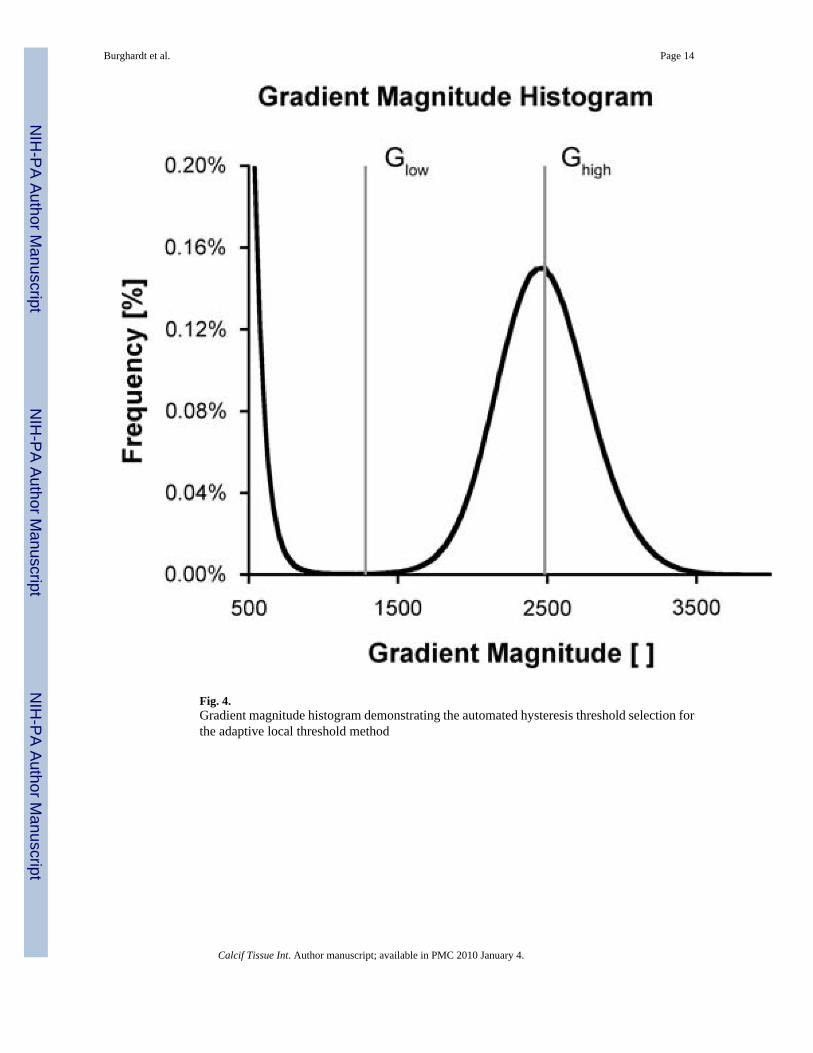
Fig. 4.Gradient magnitude histogram demonstrating the automated hysteresis threshold selection forthe adaptive local threshold method
Burghardt et al. Page 14
Calcif Tissue Int. Author manuscript; available in PMC 2010 January 4.
NIH
-PA Author Manuscript
NIH
-PA Author Manuscript
NIH
-PA Author Manuscript
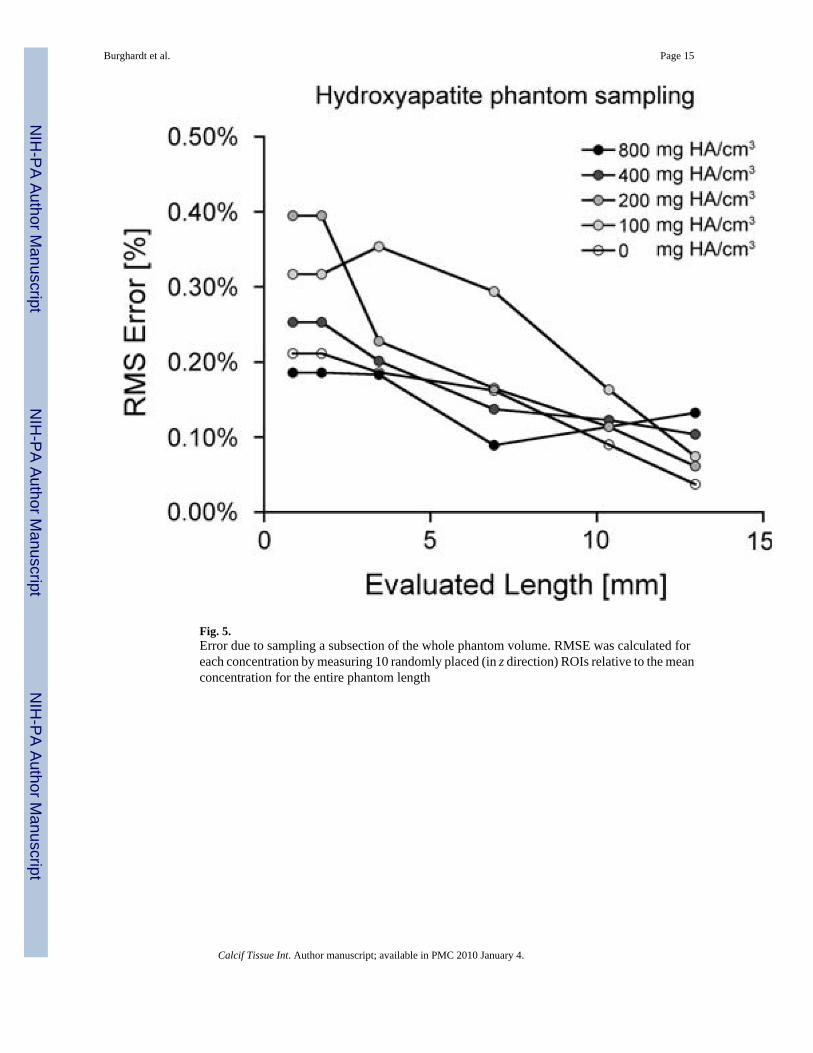
Fig. 5.Error due to sampling a subsection of the whole phantom volume. RMSE was calculated foreach concentration by measuring 10 randomly placed (in z direction) ROIs relative to the meanconcentration for the entire phantom length
Burghardt et al. Page 15
Calcif Tissue Int. Author manuscript; available in PMC 2010 January 4.
NIH
-PA Author Manuscript
NIH
-PA Author Manuscript
NIH
-PA Author Manuscript
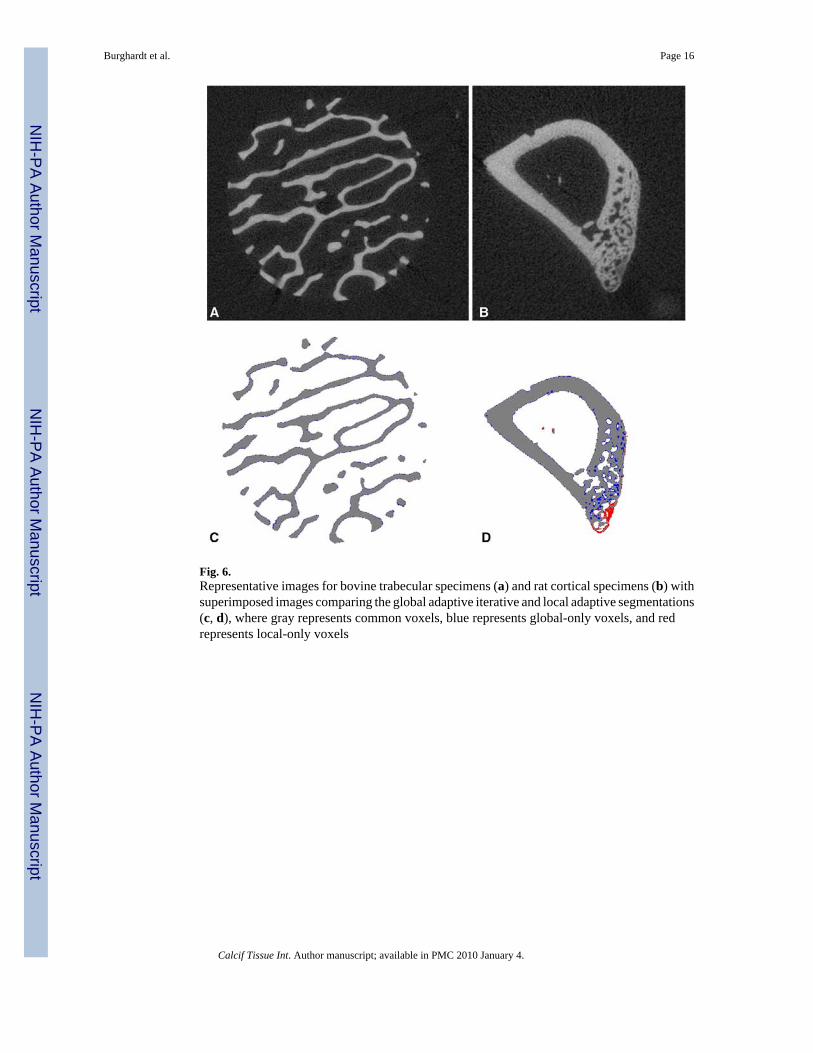
Fig. 6.Representative images for bovine trabecular specimens (a) and rat cortical specimens (b) withsuperimposed images comparing the global adaptive iterative and local adaptive segmentations(c, d), where gray represents common voxels, blue represents global-only voxels, and redrepresents local-only voxels
Burghardt et al. Page 16
Calcif Tissue Int. Author manuscript; available in PMC 2010 January 4.
NIH
-PA Author Manuscript
NIH
-PA Author Manuscript
NIH
-PA Author Manuscript
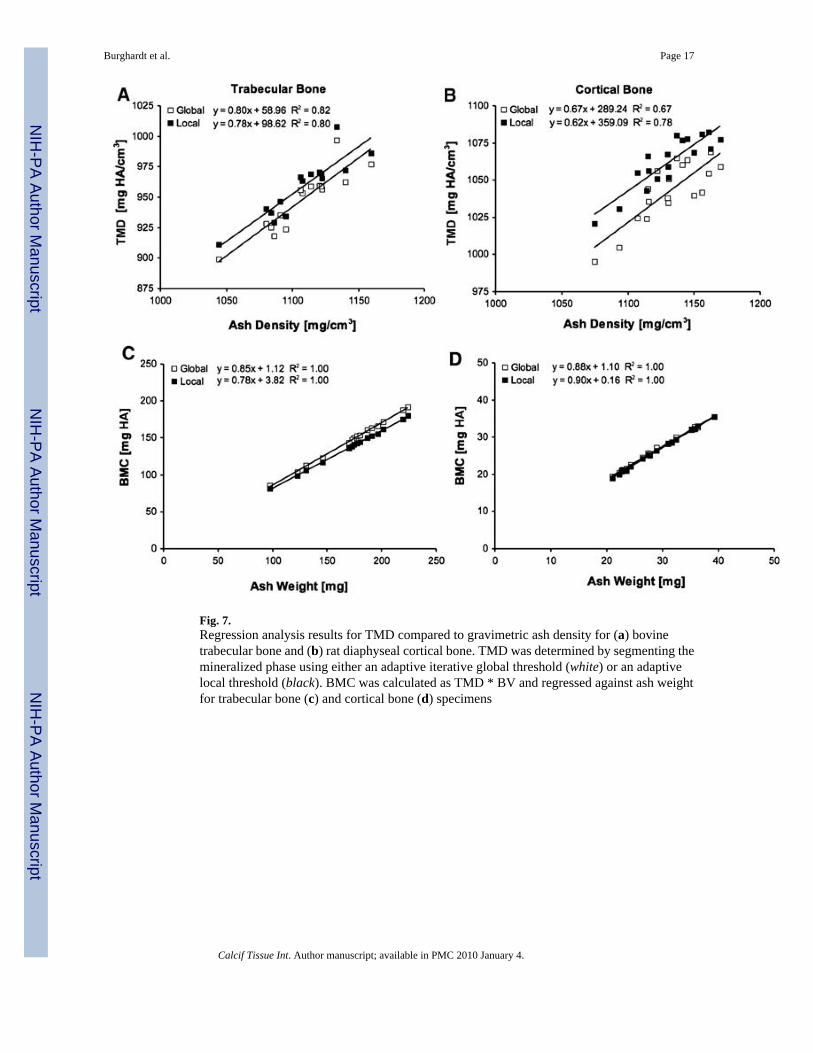
Fig. 7.Regression analysis results for TMD compared to gravimetric ash density for (a) bovinetrabecular bone and (b) rat diaphyseal cortical bone. TMD was determined by segmenting themineralized phase using either an adaptive iterative global threshold (white) or an adaptivelocal threshold (black). BMC was calculated as TMD * BV and regressed against ash weightfor trabecular bone (c) and cortical bone (d) specimens
Burghardt et al. Page 17
Calcif Tissue Int. Author manuscript; available in PMC 2010 January 4.
NIH
-PA Author Manuscript
NIH
-PA Author Manuscript
NIH
-PA Author Manuscript
NIH
-PA Author Manuscript
NIH
-PA Author Manuscript
NIH
-PA Author Manuscript
Burghardt et al. Page 18
Table 1
Morphological properties of the bovine specimens (global segmentation)
Femur (n = 8) Tibia (n = 7)
BV/TV 0.22 ± 0.02 0.19 ± 0.04
Tb.Th (µm) 154.9 ± 4.5 173.3 ± 10.9
Tb.Sp (µm) 637.8 ± 51.4 761.5 ± 123.7
Tb.N (mm−1) 1.42 ± 0.11 1.21 ± 0.18
BV/TV, bone volume/total volume; Tb.Th, trabecular thickness; Tb.Sp, trabecular separation; Tb.N, trabecular number
Calcif Tissue Int. Author manuscript; available in PMC 2010 January 4.
NIH
-PA Author Manuscript
NIH
-PA Author Manuscript
NIH
-PA Author Manuscript
Burghardt et al. Page 19
Tabl
e 2
Shor
t-ter
m re
prod
ucib
ility
(CV
%) o
f pha
ntom
cal
ibra
tion
Vol
tage
(kV
p)Ph
anto
m c
ylin
ders
Cal
ibra
tion
0 (%
)10
0 (%
)20
0 (%
)40
0 (%
)80
0 (%
)Sl
ope
(%)
Inte
rcep
t (%
)
450.
040.
030.
060.
040.
070.
09−0
.20
550.
080.
070.
100.
130.
130.
15−0
.13
700.
170.
120.
210.
190.
180.
19−0
.10
Calcif Tissue Int. Author manuscript; available in PMC 2010 January 4.
NIH
-PA Author Manuscript
NIH
-PA Author Manuscript
NIH
-PA Author Manuscript
Burghardt et al. Page 20
Table 3
Mean and standard deviations for densitometric indices for trabecular and cortical specimens
Trabecular Cortical
Global Local Global Local
µCT
TMD (mg HA/cm3) 947.4 ± 25.2 958.1 ± 24.6 1,042.3 ± 20.4 1,062.0 ± 17.7
TMD.SD (mg HA/cm3) 99.1 ± 3.4 93.2 ± 2.5 129.3 ± 8.0 111.4 ± 5.5
BMC (mg HA) 147.8 ± 30.0 138.8 ± 27.6 26.8 ± 5.1 26.4 ± 5.2
Gravimetry
Ash density (mg HA/cm3) 1,106.9 ± 28.4 – 1,130.8 ± 25.1 –
Ash weight (mg) 172.7 ± 35.3 – 29.1 ± 5.7 –
Calcif Tissue Int. Author manuscript; available in PMC 2010 January 4.
Related Documents