Quantitative and Qualitative Environmental Surveillance of SARS-CoV-2 in Ohio Nichole Brinkman, PhD US Environmental Protection Agency Office of Research and Development The views expressed in this presentation are those of the author(s) and do not necessarily represent the views or policies of the U.S. Environmental Protection Agency. Any mention of trade names or commercial products does not constitute EPA endorsement or recommendation for use.

Welcome message from author
This document is posted to help you gain knowledge. Please leave a comment to let me know what you think about it! Share it to your friends and learn new things together.
Transcript

Quantitative and Qualitative Environmental Surveillance of
SARS-CoV-2 in OhioNichole Brinkman, PhD
US Environmental Protection Agency Office of Research and Development
The views expressed in this presentation are those of the author(s) and do not necessarily represent the views or policies of the U.S. Environmental Protection Agency. Any mention of trade names or commercial products does not constitute EPA endorsement or recommendation for use.

Research Team and Partners
2
EPA/ORD
Maitreyi Nagarkar
Chloe Hart
Emily Wheaton
Scott Keely
Michael Jahne
Eunice Varughese
Jay Garland
Brian Morris
Ana Braam
Barry Wiechman
Sarah Okrum
Utilities
Metropolitan Sewer District of Greater Cincinnati
Robin Schaefer
City of Dayton
Chris Clark, Walter Schroder
City of Marion
Steve Morris
City of Portsmouth
Tommy Stewart
Montgomery County
Jim Davis
City of Hamilton
Mark Smith
City of Springfield
Jeff Yinger
Hamilton County Public Health Department
Chris Griffith
Ohio Water Resources Center
Zuzana Bohrerova
Ohio Department of Health
Rebecca Fugitt
Ohio EPA
Brian Hall
Tiffani Kavalec
University Labs
Ohio State University
University of Toledo
Kent State University
University of Akron
Bowling Green State University
Commercial Lab
LuminUltra
Private Lab
Battelle

Ohio Wastewater Monitoring Network (OWMN)
• Statewide Network
• Started July 2020• Coordinated by Ohio Water Resources
Center at OSU• Leveraged expertise and resources • 67 utilities, twice a week• 9 labs (university, commercial, private,
government)• Dashboard with results
• Goal
• Monitor trend of SARS-CoV-2 RNA in sewersheds
• Screen for presence of SARS-CoV-2 variants of concern/interest (VOC/VOI) by sequencing and RT-ddPCR
https://coronavirus.ohio.gov/wps/portal/gov/covid-19/dashboards/other-resources/wastewater

OWMN
• Application• The focus is on trends or significant
changes in the number of viral gene copies detected at each site
• Action is taken when at least 3 samples show a sustained increase of at least 10-fold (1 log)
• Accomplishments• Statewide network represents
wastewater flow from nearly 5 million residents
• 1 year of weekly data collected• Provided nearly 500 warnings to local
health communities
Aver
age
N2
Gene
Cop
ies
Viral Load
Mill
ion
Gene
Cop
ies
(MGC
) per
Day
Wastewater and Clinical Data
per L
iter (
Red)
Tota
l Cas
es (7
Day
Mov
ing
Aver
age
(Bla
ck)

US EPA Support to OWMN
• 12 sites
• 11 sewersheds• 1 subsewershed
• 1-2x weekly
• 12-14 months of monitoring
• Quantitative data
• RT-ddPCR to assess community viral load and temporal trends
• Qualitative data
• SARS-CoV-2 sequencing (full genome and spike gene) to screen for variants of concern (VOC) in communities
• Interlab data comparisons
https://coronavirus.ohio.gov/wps/portal/gov/covid-19/dashboards/other-resources/wastewater

USEPA Sample Processing and Analysis
24-hr composite sample, 225 ml
Centrifuge3000 x g, 15 min
Membrane filtration, 0.45µm
PBSOC43
Super-natant
Pellet Filter
0.2 mlDirect
Extraction
Nucleic Acid Extraction
Quantitative AnalysisRT-ddPCR/ddPCR: SARS-CoV-2, OC43,
PMMoV, Inhibition control, crAssphage, specific mutations
Qualitative AnalysisGenome/Genetic Sequencing:
Tiled amplicon sequencing, Illumina NextSeq550

Wastewater SARS-CoV-2 RNA Trends: May 2020-July 2021

Factors that influence the relationship between wastewater and clinical data
Factor Factor Details Data Parameter
Fecal shedding Load, duration up to 107 copies/g
Fate and transport of viral particle
Decay during conveyance Decay rate
Sewershed Characteristics Physical data FlowTSS
Sampling Scheme Frequency, grab/composite 24-hour flow-weighted composite
RNA Measurement ReplicationProcessing recovery efficiencyRT-ddPCR inhibitionSensitive and precise analysis
Duplicate Sample Human Betacoronavirus (OC43)Control RNART-ddPCR
Human Fecal Contribution Fecal indicator organisms Pepper mild mottle virus (PMMoV)crAssphageHF183
Case Counts Sewershed case counts Point estimates from public health departments

Factors that influence the relationship between wastewater and clinical data
Factor Factor Details Data Parameter
Fecal shedding Load, duration up to 107 copies/g
Fate and transport of viral particle
Decay during conveyance Decay rate
Sewershed Characteristics
Physical data FlowTSS
Sampling Scheme Frequency, grab/composite 24-hour flow-weighted composite
RNA Measurement ReplicationProcessing recovery efficiencyRT-ddPCR inhibitionSensitive and precise analysis
Duplicate Sample Human Betacoronavirus (OC43)Control RNART-ddPCR
Human Fecal Contribution
Fecal indicator organisms Pepper mild mottle virus (PMMoV)crAssphageHF183
Case Counts Sewershed case counts Point estimates from public health departments

Case Study of Sewersheds
Hamilton Co., Ohio
Parameter Mill Creek Taylor Creek
Population size 488,000 34,000
Mean MGD 93.17 2.79
MGD range 55.12-350.31 2.11-6.87
% Combined sewers 40 0
% Industrial flow 5 0
pH range 6.04-8.86 6.4-7.38
Mean TSS (mg/L) 247.87 340.96
TSS range 90-640 180-700
Do sewersheds with stormwater/industrial intrusion need to incorporate additional data parameters to understand relationship between wastewater and clinical case data?

Trend DataMay – October 2020
• N1 and N2 (raw and OC43-adjusted) concentrations were highly correlated (r = 0.87, BF10 >100)
• Raw and OC43-adjusted N1/N2 concentrations were strongly correlated (r = 0.64, BF10 > 100)
• Peak clinical cases: Mill Creek (7/27), Lick Run (7/20), Taylor Creek (8/3)
• Wastewater RNA peaked 1-2 weeks prior to peak in reported clinical data Nagarkar et al., submitted
Fecal Indicators, Flow and TSS
.HF183PMMoV
crAssphageFlow
105
106
107
108
109
105
106
107
108
109
2
4
6
8
12
10
100
200
300
400
500
600
700
Cop
ies/
L
Flow (M
GD
)
06/20 07/20 08/20 09/20 10/20
Mill Creek
Taylor Creek
Mill Creek Lick Run Taylor Creek
Pearson’s r BF10 Pearson’s r BF10 Pearson’s r BF10
crAssphage HF183 0.9 *** 0.845 *** 0842 ***
crAssphage PMMoV 0.562 * 0.6 * 0.291
PMMoV HF183 0.455 0.418 0.559
Flow (MGD) crAssphage -0.3 -0.062
Flow (MGD) PMMoV 0.054 -0.291
Flow (MGD) HF183 -0.502 -0.341
TSS (mg/L) crAssphage 0.318 -0.141
TSS (mg/L) PMMoV 0.085 -0.053
TSS (mg/L) HF183 0.359 -0.244
Nagarkar et al., submitted

Correlations of Wastewater and New Case Data
Nagarkar et al., submitted

Variants of Concern (VOC) in Wastewater
• Wastewater contains a mixture of variants from human populations
• ODH is focused on key mutations in spike gene
• 2 approaches: RT-ddPCR mutation assays and tiled amplicon sequencing
• Results may be used by ODH to direct resources for clinical sequencing
= CDC identified VOChttps://outbreak.info [as of July 14, 2021]

RT-ddPCR Mutation AssaysRT-ddPCR was used to monitor signatures of B.1.1.7 (Alpha) by detecting Spike: DEL69/70 and 501Y
https://outbreak.info
0%
20%
40%
60%
80%
100%
0
2000
4000
6000
8000
10000
12000
4/4/2021 4/11/2021 4/18/2021 4/25/2021 5/2/2021
Perc
ent o
f RN
A M
olec
ules
N2
RNA
Mol
ecul
es/L
Date
69-70WT 69-70del N2
del 69-70
RNA sequences with deletions of nucleotides that result in absence of spike aa 69-70 increases over time
0%
20%
40%
60%
80%
100%
0
2000
4000
6000
8000
10000
12000
4/4/2021 4/11/2021 4/18/2021 4/25/2021 5/2/2021 Perc
ent o
f RN
A M
olec
ules
N2
RNA
Mol
ecul
es/L
Date
N501Y
N501 501Y N2
RNA sequences with nucleotides that change spike aa 501 increases over time

US Region 5 Distribution of B.1.1.7
https://covid.cdc.gov/covid-data-tracker/#variant-proportions
Date Human B.1.1.7% (95% CI )
Sewershed %del69/70
Sewershed %501Y
4/10/21 66.7 (53.1-78.0) 58.2(38.9-77.5) 69.4(58.3-80.5)
4/24/21 73.2 (60.3-83.1) 72.2(59.5-84.9) 76.9(68.6-85.2)
¶average of 10 Ohio sewersheds during sample dates April 11,12 and April 25,26April 4 and 5: 69/70del 30.3(7.8-52.8); 501Y 33.5(13.5-53.5)
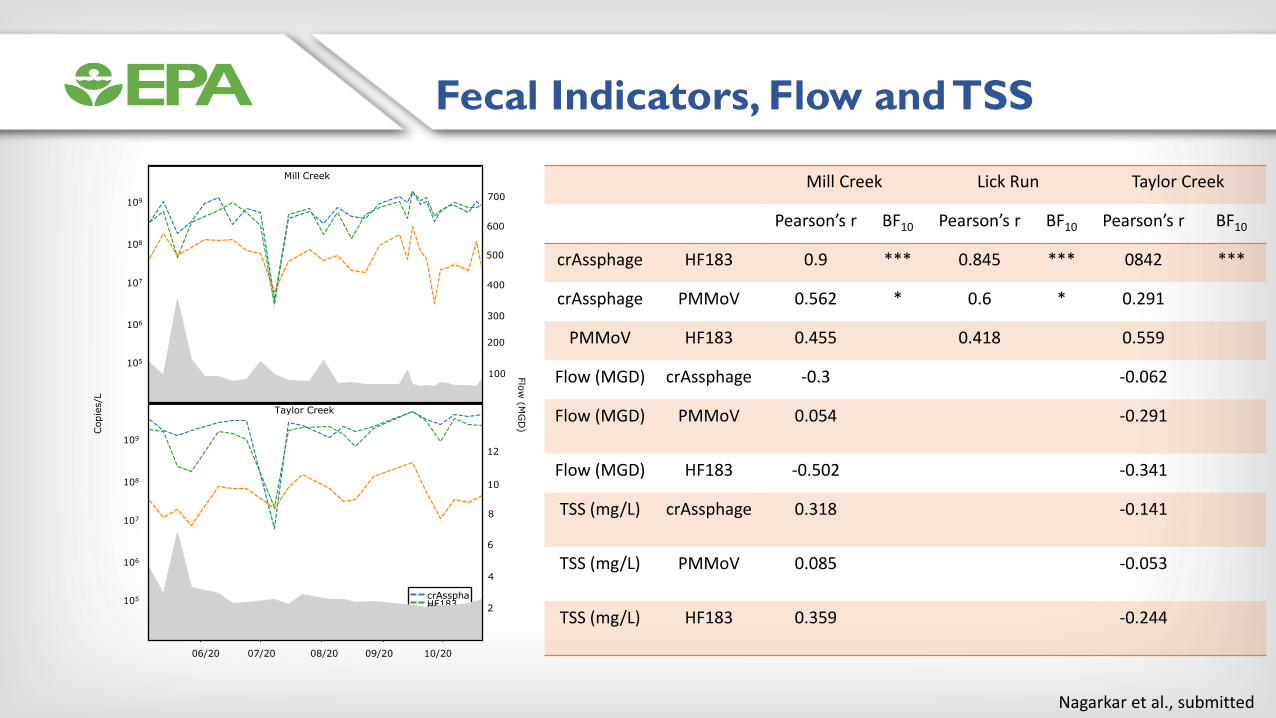
Alpha (B.1.1.7) and Delta (B.1.617.2) Signatures in Wastewater
Tiled amplicon sequencing from mid-May through mid-JuneAlpha
Muddy Creek
5/24
Delta
5/31 6/14 6/2 6/9 6/2 5/24 6/7 5/24 5/24 6/7 6/14
Dayton Mill Creek Portsmouth Springfield Western
US Region 5 VOC Distribution
https://covid.cdc.gov/covid-data-tracker/#variant-proportions
Summary and Conclusions• Wastewater sampling has enabled large-scale monitoring of SARS-CoV-2 dynamics and has successfully enabled the
Ohio Health Department to notify local communities when interventions are needed
• Understanding the relationship between 2 imperfect data sets is complex
• SARS-CoV-2 RNA concentrations adjusted to account for recovery efficiency and human fecal input increased correlation with new case data in a large sewershed with stormwater and industrial intrusion, but not in a small sewershed with no outside intrusion
• ddPCR mutation assays show that the ratio of the 69/70 deletion and N501Y alternative allele (associated with Alpha variant) increasing over time and corresponds with increase in B.1.1.7 proportion of clinical data in USA Region 5
• Sequencing confirms presence of amino acid changes associated with Alpha and Delta variants in wastewater samples and is consistent with proportion of clinical data in USA Region 5
Related Documents