RESEARCH PAPER Quantitative analysis of the a.c. susceptibility of core–shell nanoparticles M. A. Lucchini • P. Riani • F. Canepa Received: 14 November 2012 / Accepted: 22 March 2013 Ó Springer Science+Business Media Dordrecht 2013 Abstract Magnetite (Fe 3 O 4 ) and silica-coated mag- netite (Fe 3 O 4 @SiO 2 ) nanoparticles (NPs) were syn- thesized and characterized by scanning and transmission electron microscopy and by a.c. suscep- tibility measurements as a function of the frequency both at room temperature and 80 K. A new mathe- matical approach based on the explicit coexistence (at room temperature) of Brownian and Ne ´el contribu- tions is proposed: the magnetic data were quantita- tively analyzed following this approach and the results well agree with microscopic data. This mathematical procedure allows the achievement of the complete size distribution of coated magnetic NPs in solution as well as the real dimension of the magnetic nuclei. Keywords Core–shell nanoparticles Ac susceptibility Nanoparticle magnetism Introduction Magnetic nanoparticles (MNPs) are extensively stud- ied due to their possibility to be chemically or biologically functionalized for different applications in medicine and bioanalytics like drug delivery (Veiseh et al. 2010), Magnetic resonance imaging contrast enhancement (Na et al. 2009), protein separation (Kim et al. 2010), and hyperthermia (Laurent et al. 2011). All these applications require the minimization of the dipole–dipole magnetic interactions to reduce the possibility of agglomeration among the different MNPs. A successful method to stabilize these nano- particles (NPs) is their coating with an organic (Griffete et al. 2012) or inorganic shell (Mahmoudi et al. 2010). In both cases, a reduction of the magnetic interactions is obtained: An inorganic coating like Au or SiO 2 can be easily detected by transmission electron microscopy (TEM) analysis (Im et al. 2005) and scanning probe microscopy (both atomic force, AFM Colombo et al. 2012, and tunneling, STM Koo et al. 2012), while an organic one is usually invisible to this type of technique. An alternative method is dynamic light scattering (DLS); in this technique, the signal is mainly due to the larger particles or the aggregates M. A. Lucchini Dipartimento di Chimica e Chimica Industriale, Via Dodecaneso 31, 16146 Genoa, Italy P. Riani INSTM-UdR Genova and Dipartimento di Chimica e Chimica Industriale, Via Dodecaneso 31, 16146 Genoa, Italy F. Canepa (&) CNR—Unita ` di Genova and Dipartimento di Chimica e Chimica Industriale, Via Dodecaneso 31, 16146 Genoa, Italy e-mail: [email protected] 123 J Nanopart Res (2013) 15:1601 DOI 10.1007/s11051-013-1601-x

Welcome message from author
This document is posted to help you gain knowledge. Please leave a comment to let me know what you think about it! Share it to your friends and learn new things together.
Transcript

RESEARCH PAPER
Quantitative analysis of the a.c. susceptibility of core–shellnanoparticles
M. A. Lucchini • P. Riani • F. Canepa
Received: 14 November 2012 / Accepted: 22 March 2013
� Springer Science+Business Media Dordrecht 2013
Abstract Magnetite (Fe3O4) and silica-coated mag-
netite (Fe3O4@SiO2) nanoparticles (NPs) were syn-
thesized and characterized by scanning and
transmission electron microscopy and by a.c. suscep-
tibility measurements as a function of the frequency
both at room temperature and 80 K. A new mathe-
matical approach based on the explicit coexistence (at
room temperature) of Brownian and Neel contribu-
tions is proposed: the magnetic data were quantita-
tively analyzed following this approach and the results
well agree with microscopic data. This mathematical
procedure allows the achievement of the complete size
distribution of coated magnetic NPs in solution as well
as the real dimension of the magnetic nuclei.
Keywords Core–shell nanoparticles �Ac susceptibility � Nanoparticle magnetism
Introduction
Magnetic nanoparticles (MNPs) are extensively stud-
ied due to their possibility to be chemically or
biologically functionalized for different applications
in medicine and bioanalytics like drug delivery (Veiseh
et al. 2010), Magnetic resonance imaging contrast
enhancement (Na et al. 2009), protein separation (Kim
et al. 2010), and hyperthermia (Laurent et al. 2011). All
these applications require the minimization of the
dipole–dipole magnetic interactions to reduce the
possibility of agglomeration among the different
MNPs. A successful method to stabilize these nano-
particles (NPs) is their coating with an organic
(Griffete et al. 2012) or inorganic shell (Mahmoudi
et al. 2010). In both cases, a reduction of the magnetic
interactions is obtained: An inorganic coating like Au
or SiO2 can be easily detected by transmission electron
microscopy (TEM) analysis (Im et al. 2005) and
scanning probe microscopy (both atomic force, AFM
Colombo et al. 2012, and tunneling, STM Koo et al.
2012), while an organic one is usually invisible to this
type of technique. An alternative method is dynamic
light scattering (DLS); in this technique, the signal is
mainly due to the larger particles or the aggregates
M. A. Lucchini
Dipartimento di Chimica e Chimica Industriale,
Via Dodecaneso 31, 16146 Genoa, Italy
P. Riani
INSTM-UdR Genova and Dipartimento di Chimica e
Chimica Industriale, Via Dodecaneso 31, 16146 Genoa,
Italy
F. Canepa (&)
CNR—Unita di Genova and Dipartimento di Chimica e
Chimica Industriale, Via Dodecaneso 31, 16146 Genoa,
Italy
e-mail: [email protected]
123
J Nanopart Res (2013) 15:1601
DOI 10.1007/s11051-013-1601-x

present in the sample: the scattered light intensity
shows a quadratic dependence on the volume of
scattering particles according to the classical Rayleigh
theory (Kerker 1969), so the contribution of larger
molecules is more pronounced in a polydispersed
sample1 (Sipos et al. 2003).
Another method to detect the dimensions of MNPs in
solution, based on a.c. susceptibility measurements, was
developed some years ago by Kotitz et al. (1995), and
later modified (Connolly and St Pierre 2001; Nutting
et al. 2006). This approach, adopted for magnetic
particles in the superparamagnetic regime, is based on
the Debye theory developed to describe the dielectric
dispersion on dipolar fluids (Debye 1929), leading to an
expression for the frequency dependence of the complex
magnetic susceptibility. Recently (Ludwig et al. 2009),
the magnetorelaxometry and the a.c. susceptibility of
Fe3O4 MNPs with polyacrylic acid shells were analyzed
in the framework of Brownian and Neel mechanisms. In
the Brownian mechanism, the whole MNP rotates
including shell and attached solvent molecules, while in
the Neel mechanism, only the magnetic moment inside
the MNP can flip by thermal activation. The authors
took into account the fact that both mechanisms are
present due to a large size distribution function observed
from TEM measurements on several hundreds of NPs,
and they fixed an effective relaxation time given by
seff = (sBsN)/(sB ? sN) where sB is the Brownian
relaxation time and sN is the Neel relaxation time
(Shliomis and Raikher 1980).
However, up to now, very few data on MNPs and
composite MNPs, related to the frequency dependence
of the complex susceptibility at low temperatures, i.e.,
when the Brownian contribution vanishes, are known.
This fact prevented the determination by magnetic
measurements of dimensional parameters of compos-
ite NPs in solution. So, in this paper, the results
obtained preparing magnetite NPs and covering them
with silica in order to obtain Fe3O4@SiO2 MNPs were
reported. Both sets of NPs were characterized by TEM
and a.c. susceptibility measurements at room temper-
ature (RT) as well as at 80 K. The analysis of the
magnetic results was performed taking into account
both the Brownian and Neel contributions and the
results are reported here.
Experimental details
Magnetite NPs were prepared by coprecipitation using a
modified Massart method (Riani et al. 2011). Once
obtained, the MNPs were coated with silica by hydro-
lysis and condensation following the Stober process
(Stober et al. 1968): 5.4 mmol of tetraethyl orthosilicate
was added to 200 ml of ethanol and 4 ml of water. The
reaction occured at a temperature of 40 �C (water bath)
for 20 min and at basic pH (pH [ 9 by NH3(aq)) to
advantage the condensation over the hydrolysis (Schu-
bert and Husing 2005) of silica NPs. Once the silica
primary NPs were obtained, 8 ml of Fe3O4 NPs solution,
with a concentration of 60 mg/l, was added and the
solution was mechanically stirred for 2 h (Lu et al.
2008). The final solution was then centrifuged to collect
the coated MNPs as well as the SiO2 NPs formed: The
solvent in excess was eliminated to stop the reaction.
The NPs were again dispersed in pure ethanol and finally
the Fe3O4@SiO2-composite NPs were collected and
separated from the SiO2 NPs by means of magnetic
levitation with a permanent magnet.
The morphology of the Fe3O4 and Fe3O4@SiO2
MNPs was detected by microscopic techniques like
TEM (JEOL JEM 2010 200 kV) and a field emission
scanning electron microscope (FE-SEM, ZEISS
SUPRA 40 VP) equipped with an energy dispersive
X-ray spectrometer (EDX-OXFORD ‘‘INCA Energie
450 9 3’’) for microanalysis. a.c. susceptibility mea-
surements were obtained using an OXFORD Mag-
lab2000 magnetic measurements system operating in
the 1–104 Hz frequency range with an a.c. magnetic
field of 10 Oe. The resolution of the a.c. signal was
better than 10-7 emu.
Results and discussion
Magnetic relaxations in a ferrofluid
When an alternate magnetic field is applied to a
ferrofluid formed by superparaMNPs, two different
relaxation mechanisms can take place: the Brownian
relaxation and the Neel relaxation.
In the Brownian relaxation, the whole magnetic
nanoparticle with the solvent molecules bound to it by
ionic interactions can rotate with the a.c. field and, in
this case, the time constant sB, i.e., the time that a
particle needs to complete the rotation, is related to the
1 Thiele G, Poston M, Brown R. A case of study in sizing
particles. Micromeritics analytical services.
www.particletesting.com
Page 2 of 10 J Nanopart Res (2013) 15:1601
123
hydrodynamic radius of the NP (under the assumption
of a spherical shape) and to the viscosity of the solvent
by the equation
sB ¼4p � g � r3
h
kB � Tð1Þ
where g is the solvent viscosity, rh is the hydrody-
namic radius of the NP, kB is the Boltzmann constant,
and T is the absolute temperature.
In the Neel relaxation, only the magnetic moment
of the spherical core of the NP can rotate with the a.c.
field, and the corresponding time constant sN is related
to the anisotropy energy following the equation
sN ¼ s0 � exp4p � r3
c � Ka
3kB � T
� �ð2Þ
where s0 is a constant with values ranging in the order
of 10-9 7 10-13 s, rc is the magnetic core radius, and
Ka is the magnetic anisotropy constant. The sB and sN
time constants are related to the experimental applied
frequency m by the relation s = 1/(2pm).
In the framework of the Debye model (Debye 1929;
Fannin and Coffey 1995), the real and imaginary
components of the a.c. susceptibility are given by
v mð Þ ¼ v0 mð Þ � iv00ðmÞ ð3Þ
v0 ¼ v1 þv0 � v1
1þ x � sð Þ2and
v00 ¼ v0 � v1ð Þ � x � s1þ x � sð Þ2
ð4Þ
where v0 and v00 are the real and imaginary component
of the a.c. susceptibility, respectively, v0 is the
susceptibility at zero frequency (static approxima-
tion), v? is the susceptibility at the highest frequency,
x is 2pm, and s is the relaxation time.
To take into account the size dispersion distribu-
tion, typically a log-normal distribution is considered:
p r½ � ¼ 1
r � r �ffiffiffiffiffiffi2pp � e
� ln rrmð Þ
2
2r2
h ið5Þ
where rm is the mean particle radius and r is the
standard deviation. As can be found in the reference
(Riani et al. 2011), more than one population can be
considered and, in this case, the total distribution will
be the weighed sum of all components.
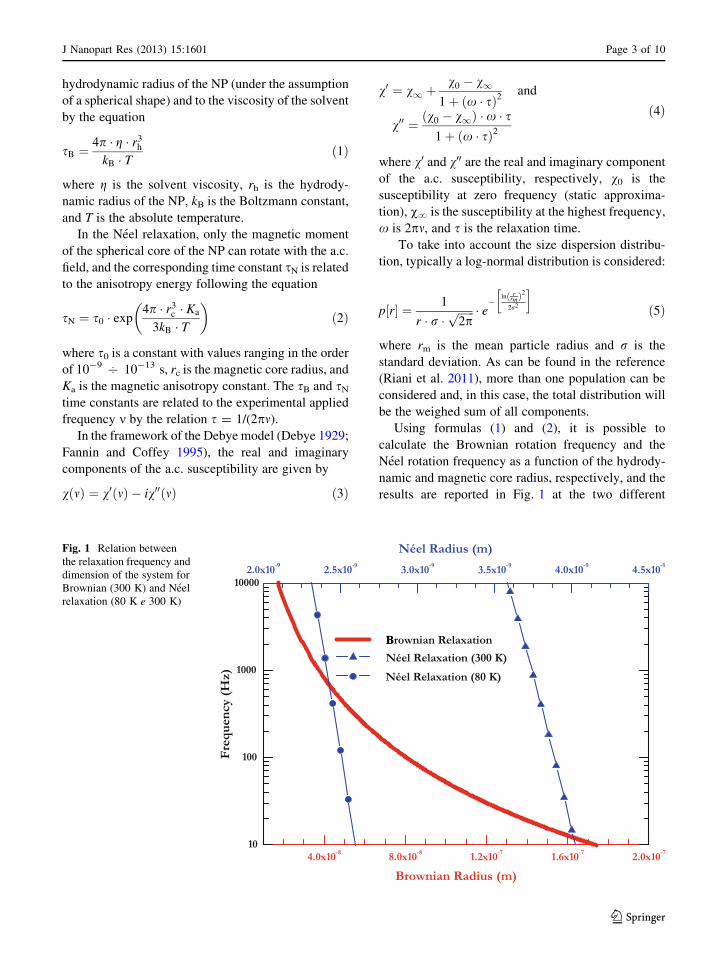
Using formulas (1) and (2), it is possible to
calculate the Brownian rotation frequency and the
Neel rotation frequency as a function of the hydrody-
namic and magnetic core radius, respectively, and the
results are reported in Fig. 1 at the two different
B
Fig. 1 Relation between
the relaxation frequency and
dimension of the system for
Brownian (300 K) and Neel
relaxation (80 K e 300 K)
J Nanopart Res (2013) 15:1601 Page 3 of 10
123

temperatures of 80 and 300 K. At RT, in the
100–104 Hz frequency range of the instrumentation
adopted here, the Brownian relaxation occurs for NPs
or aggregates of NPs with a radius between 20 and
180 nm; the Neel relaxation, under the hypothesis that
s0 = 9 9 10-13 s and Ka = 3.56�105 J/m3 (Goya
et al. 2003), is restricted to NPs with a magnetic core
radius between 3.6 and 4.0 nm. At 80 K, obviously,
only the Neel relaxation exists and our frequency
window allows the detection of NPs with a magnetic
radius between 2.3 and 2.6 nm. This simulation
suggests the contemporary presence of the two
Fig. 2 Transmission
electron microscope image
of Fe3O4 NPs. As inset the
distribution of radii,
obtained by several TEM
images can be found
Fig. 3 TEM photograph of Fe3O4@SiO2 NPs; a dark Fe3O4 NP
aggregates imbedded in gray silica sphere can be observed. The
chemical composition of the gray spheres b and of the embedded
darker aggregates c has been characterized by EDX analysis
carried out with a 5-nm-diameter electron probe. Cu contribu-
tion is related to the supporting grid
Page 4 of 10 J Nanopart Res (2013) 15:1601
123
different relaxation mechanisms at RT, and this
evidence was taken into account to obtain the fit of
experimental data.
Microscopic results
Figure 2 reports a typical example of magnetite NPs:
The MNPs present a spherical shape with small
dimensions; as an inset of Fig. 2, a size distribution
histogram of the radius of the NPs, obtained from the
measurements of one hundred NPs, is presented. The
histogram presents a distribution of radii between 2
and 8 nm and an average radius around 4 nm. Since
the critical radius for superparamagnetism is 6.5 nm
(O’Handley 2000), this value confirms that our MNPs
are in the superparamagnetic regime.
Figure 3a shows TEM image of Fe3O4@SiO2
MNPs: The small dark magnetite NPs are enclosed
in the clearly visible silica shell with mean radius
around 20 nm. This core–shell structure has been also
confirmed by the EDX spectra reported in Fig. 3b, c.
Polycondensation occurs among the different coated
NPs. The TEM images are very similar to those
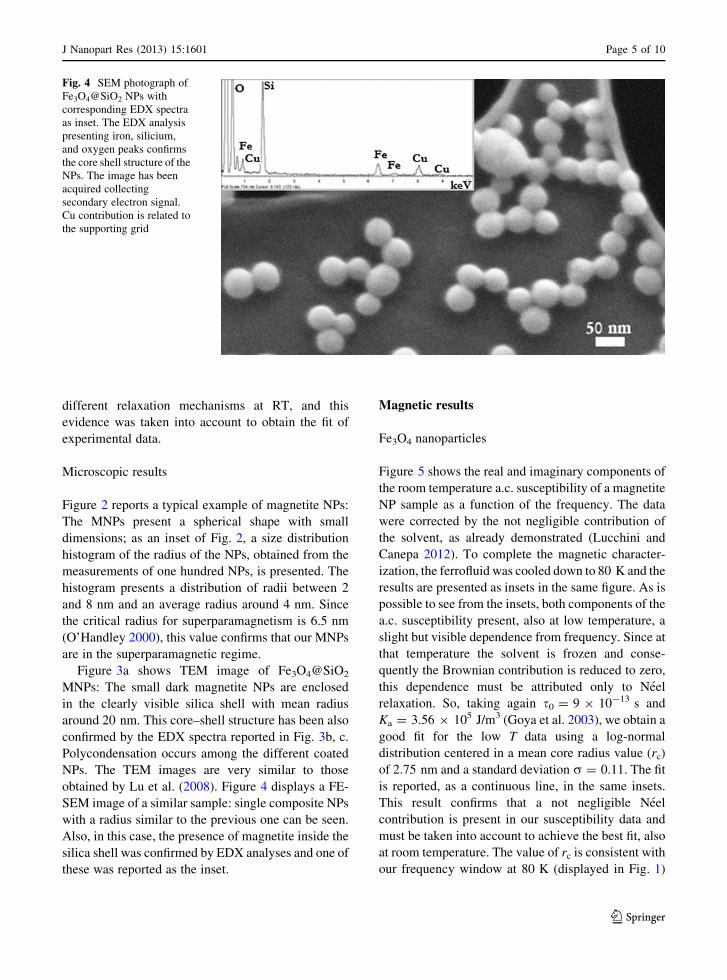
obtained by Lu et al. (2008). Figure 4 displays a FE-
SEM image of a similar sample: single composite NPs
with a radius similar to the previous one can be seen.
Also, in this case, the presence of magnetite inside the
silica shell was confirmed by EDX analyses and one of
these was reported as the inset.
Magnetic results
Fe3O4 nanoparticles
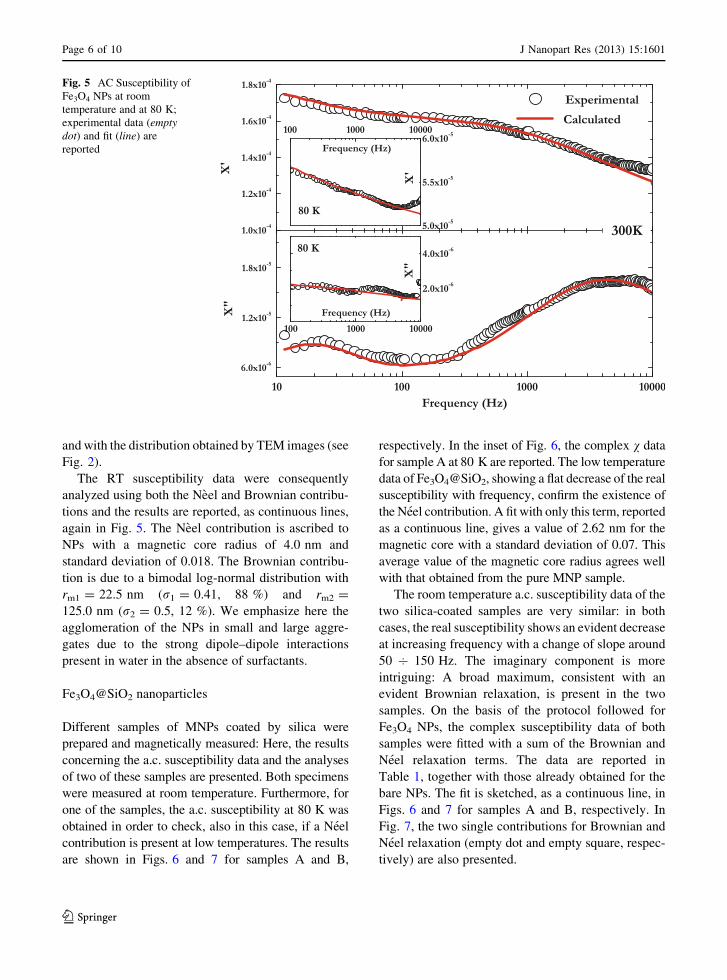
Figure 5 shows the real and imaginary components of
the room temperature a.c. susceptibility of a magnetite
NP sample as a function of the frequency. The data
were corrected by the not negligible contribution of
the solvent, as already demonstrated (Lucchini and
Canepa 2012). To complete the magnetic character-
ization, the ferrofluid was cooled down to 80 K and the
results are presented as insets in the same figure. As is
possible to see from the insets, both components of the
a.c. susceptibility present, also at low temperature, a
slight but visible dependence from frequency. Since at
that temperature the solvent is frozen and conse-
quently the Brownian contribution is reduced to zero,
this dependence must be attributed only to Neel
relaxation. So, taking again s0 = 9 9 10-13 s and
Ka = 3.56 9 105 J/m3 (Goya et al. 2003), we obtain a
good fit for the low T data using a log-normal
distribution centered in a mean core radius value (rc)
of 2.75 nm and a standard deviation r = 0.11. The fit
is reported, as a continuous line, in the same insets.
This result confirms that a not negligible Neel
contribution is present in our susceptibility data and
must be taken into account to achieve the best fit, also
at room temperature. The value of rc is consistent with
our frequency window at 80 K (displayed in Fig. 1)
Fig. 4 SEM photograph of
Fe3O4@SiO2 NPs with
corresponding EDX spectra
as inset. The EDX analysis
presenting iron, silicium,
and oxygen peaks confirms
the core shell structure of the
NPs. The image has been
acquired collecting
secondary electron signal.
Cu contribution is related to
the supporting grid
J Nanopart Res (2013) 15:1601 Page 5 of 10
123
and with the distribution obtained by TEM images (see
Fig. 2).
The RT susceptibility data were consequently
analyzed using both the Neel and Brownian contribu-
tions and the results are reported, as continuous lines,
again in Fig. 5. The Neel contribution is ascribed to
NPs with a magnetic core radius of 4.0 nm and
standard deviation of 0.018. The Brownian contribu-
tion is due to a bimodal log-normal distribution with
rm1 = 22.5 nm (r1 = 0.41, 88 %) and rm2 =
125.0 nm (r2 = 0.5, 12 %). We emphasize here the
agglomeration of the NPs in small and large aggre-
gates due to the strong dipole–dipole interactions
present in water in the absence of surfactants.
Fe3O4@SiO2 nanoparticles
Different samples of MNPs coated by silica were
prepared and magnetically measured: Here, the results
concerning the a.c. susceptibility data and the analyses
of two of these samples are presented. Both specimens
were measured at room temperature. Furthermore, for
one of the samples, the a.c. susceptibility at 80 K was
obtained in order to check, also in this case, if a Neel
contribution is present at low temperatures. The results
are shown in Figs. 6 and 7 for samples A and B,
respectively. In the inset of Fig. 6, the complex v data
for sample A at 80 K are reported. The low temperature
data of Fe3O4@SiO2, showing a flat decrease of the real
susceptibility with frequency, confirm the existence of
the Neel contribution. A fit with only this term, reported
as a continuous line, gives a value of 2.62 nm for the
magnetic core with a standard deviation of 0.07. This
average value of the magnetic core radius agrees well
with that obtained from the pure MNP sample.
The room temperature a.c. susceptibility data of the
two silica-coated samples are very similar: in both
cases, the real susceptibility shows an evident decrease
at increasing frequency with a change of slope around
50 7 150 Hz. The imaginary component is more
intriguing: A broad maximum, consistent with an
evident Brownian relaxation, is present in the two
samples. On the basis of the protocol followed for
Fe3O4 NPs, the complex susceptibility data of both
samples were fitted with a sum of the Brownian and
Neel relaxation terms. The data are reported in
Table 1, together with those already obtained for the
bare NPs. The fit is sketched, as a continuous line, in
Figs. 6 and 7 for samples A and B, respectively. In
Fig. 7, the two single contributions for Brownian and
Neel relaxation (empty dot and empty square, respec-
tively) are also presented.
Fig. 5 AC Susceptibility of
Fe3O4 NPs at room
temperature and at 80 K;
experimental data (emptydot) and fit (line) are
reported
Page 6 of 10 J Nanopart Res (2013) 15:1601
123

Discussion
The control of the dimensions of the functionalized
MNPs is very important and, typically, it is analyzed
by microscopic techniques (SEM, TEM, AFM). If the
NPs are functionalized, the possibility to detect the
functionalization strongly depends by its nature. An
organic functionalization of the NP can be hardly
detected by standard electron microscopy. So, to
obtain the size distribution of the functionalized
Fig. 6 AC Susceptibility of
Fe3O4@SiO2 NPs (sample
A) at room temperature and
at 80 K; experimental data
(empty dot) and fit (line) are
reported
Fig. 7 AC Susceptibility of
sample B of Fe3O4@SiO2
NPs: fit of the experimental
data is reported as total
contribution (line) and as
single contribution
Brownian (circle) and Neel
(square)
J Nanopart Res (2013) 15:1601 Page 7 of 10
123

MNPs, the use of an alternative method based on the
measurement of a physical property related to the
dimension of the nanoparticle, and its optimization,
seems to be an interesting target to reach. Within this
assumption, the use of the a.c. susceptibility is very
promising, either for the high sensitivity achievable by
this technique or by the possibility to know, from non-
destructive measurements, the behavior of a real
magnetic drug delivery system.
Our low temperature analyses of different systems
of bare or coated MNPs always evidenced the
existence of a Neel contribution. Furthermore, differ-
ent tentatives to fit the room temperature data (both
real and imaginary components of the complex
susceptibility) with a simple Brownian term were
made, mainly for the Fe3O4@SiO2 NPs where an
evident maximum in v00 was observed in each studied
system. In any case, the fit was unsatisfactory. These
results suggested that we adopt a different approach to
that used up to now, i.e., the use of an effective
relaxation time. We hypothesized an effective inde-
pendence between Brownian and Neel rotations with a
mathematical system based on a sum of the two
contributions. Under this hypothesis, some mathemat-
ical corrections have been taken into account:
• The experimental susceptibility will be the sum of
the Brownian contribution and Neel contribution;
• The experimental susceptibility at zero frequency
(v0) is the sum of two different values arising from
the two different contributions, i.e., the Brownian
and Neel ones;
• The v? value in v00 formula for Brownian relax-
ation for coated MNPs is fixed equal to zero since,
as it is enhanced in the mathematical analysis of
Fig. 7, the imaginary contribution of the Brownian
relaxation of our coated MNPs approaches zero at
high frequency.
Using this correction, the new model proposed is
based on the following equations:
vexp ¼ vB þ vN
v0 mð Þ ¼ v0B mð Þ þ v0N mð Þv00ðmÞ ¼ v00BðmÞ þ v00NðmÞ
ð6Þ
where the two contributions can be considered as
follows:
v0 mð ÞB¼ v1 þZr2
r1
PB rð Þ � v0B � v1ð Þ
1þ 2p � m � 4p�gkB�T � r
3h
� �2dr ð7Þ
v00 mð ÞB¼Zr2
r1
PB rð Þ � ðv0B � v1Þ � 2p � m � 4�p�gkE�T � r3
h
� �1þ 2p � m � 4�p�g
kB�T � r3h
� �2dr
ð8Þ
for the Brownian contribution, where PB(r) is the
radius distribution for Brownian relaxation (see Eq.
(5)) and rh is the hydrodynamic radius of the particles.
v0 mð ÞN¼ v1 þZr2
r1
PN rð Þ � v0N � v1ð Þ
1þ 2p � m � eKa4�p�r3
c3�kB �T
� �2dr ð9Þ
v00ðmÞN ¼Zr2
r1
PN rð Þ � ðv0N � v1Þ � 2p � m � eKa4�p�r3
c3�kB �T
� �
1þ 2p � m � eKa4�p�r3
c3�kB �T
� �2dr
ð10Þ
for Neel contribution, where PN(r) is the radius
distribution for Neel relaxation (see Eq. (5)) and rc is
the radius of the magnetic NPs.
So, the data obtained from the different fits are
totally self-consistent: Brownian radii obtained for the
Fe3O4 NPs are in excellent agreement with data from
the reference (Riani et al. 2011). The Neel mean radius
calculated at room temperature presents the same
value for the Fe3O4 and Fe3O4@SiO2 NPs, as
presented in Table 1, and this value is in complete
agreement with the mean value obtained from TEM
images. The reason for the existence of the Neel
contribution, together with the Brownian one, can be
Table 1 Summary of data obtained by fit of experimental data
for bare magnetite and silica-covered magnetite NPs
rm Brownian (nm)
(distribution)
rm Neel (nm)
(distribution)
Fe3O4 (80 K) – 2.75 (0.11)
Fe3O4 (300 K) 22.5 (0.41)a 4.0 (0.02)
Fe3O4@SiO2 (80 K) – 2.62 (0.07)
Fe3O4@SiO2 (300 K)
(sample A)
118 (0.57) 3.56 (0.07)
Fe3O4@SiO2 (300 K)
(sample B)
70 (0.45) 3.46 (0.06)
a For this sample, only the main population (88 %) is reported
Page 8 of 10 J Nanopart Res (2013) 15:1601
123

deduced from Fig. 7, where, as an example, the
experimental data of the B-Fe3O4@SiO2 sample with
the two relaxation contributions to the fit are reported.
As is possible see from the plot, the slow but
continuous increase of Neel relaxation with the
synchronous decrease of the Brownian relaxation
toward zero values at higher frequencies must be
explained in terms of progressive freezing of the
dynamic rotation motion of the NPs in solution. When
the NPs are blocked, the magnetization vector of the
magnetic core of the NPs begins to rotate with the
applied alternate magnetic field, thus giving the Neel
contribution to the overall susceptibility.
This approach, which can be easily adopted for any
other magnetic nanosystem characterized by a higher
or lower complexity without worsening of the solu-
tion, allows to know accurately the dimensional
distribution of composite NPs irrespective of the type
(and number) of coatings used as well as the dimen-
sion of magnetic nuclei.
Quantitative magnetic analyses on Fe3O4@SiO2
NPs functionalized with fluorescent molecules are
now in progress at our laboratory to confirm the
present mathematical approach.
Conclusions
Magnetite NPs were coated with silica following the
literature data. These core–shell NPs were characterized
by electron microscopy and ac susceptibility measure-
ments at 300 and 80 K. The data were quantitatively
analyzed with a new mathematical approach based on
the coexistence of Brownian and Neel rotations in the
same fluid. The results are in agreement with direct
microscopic observations and the literature data. The
adopted procedure seems a good starting point to
quantitatively evaluate the morphology of complex
functionalized MNPs not discernible in other way.
Acknowledgments The support of Miss. Agnese Carino is
gratefully acknowledged.
References
Colombo C, Palumbo G, Ceglie A, Angelico R (2012) Char-
acterization of synthetic hematite (a-Fe2O3) Nanoparticles
using a multi-technique approach. J Colloid Interface Sci
374:118
Connolly J, St Pierre TG (2001) Proposed biosensors based on
time-dependent properties of magnetic fluids. J Magn
Magn Mater 225:156
Debye P (1929) Polar molecules. Chemical Catalog Company,
New York
Fannin PC, Coffey WT (1995) Contribution of particles inertial
effect to resonance in ferrofluid. Phys Rev E 52:6129
Goya GF, Berquo TS, Fonseca FC, Morales MP (2003) Static
and dynamic magnetic properties of spherical magnetite
nanoparticles. J Appl Phys 94:3520
Griffete N, Clift MJD, Lamouri A, Digigow RG, Mihut AM,
Fink A, Rothen-Rutishauser B, Dietsch H (2012) Amino
covalent binding approach on iron oxide nanoparticle
surface: toward biological applications. Colloids surf A
415:98–104
Im SH, Herricks T, Lee YT, Xia Y (2005) Synthesis and char-
acterization of monodisperse silica colloids loaded with
superparamagnetic iron oxide nanoparticles. Chem Phys
Lett 401:19
Kerker M (1969) The scattering of light. Academic Press, New
York, p 414
Kim J, Piao Y, Lee N, Park YI, Lee I, Lee J, Paik SR, Hyeon T
(2010) Magnetic nanocomposite spheres decorated with
NiO nanoparticles for a magnetically recyclable protein
separation system. Adv Mater 22:57
Koo H, Kano S, Tanaka D, Sakamoto M, Teranishi T, Cho G,
Majima Y (2012) Charcaterization of thiolfunctionalized
oligo(phenylene-ethynylene)-protected Au nanoparticles
by scanning tunneling microscopy and spectroscopy. Appl
Phys Lett 101(083115):1–5
Kotitz R, Fannin PC, Trahms L (1995) Time domain study of
Brownian and Neel relaxation in ferrofluids. J Magn Magn
Mater 149:42
Laurent S, Dutz S, Hafeli UO, Mahmoudi M (2011) Magnetic
fluid hyperthermia: focus on superparamagnetic iron oxide
nanoparticles. Adv Colloid Interface Sci 166:8
Lu Z, Dai J, Song X, Wang G, Yang W (2008) Facile synthesis
of Fe3O4/SiO2 composite nanoparticles from primary sil-
ica particles. Colloids Surf A 317:450–456
Lucchini MA, Canepa F (2012) Brownian relaxation of mag-
netic nanoparticles in fluid: the effect of the solvent.
J Nanopart Res 14:809
Ludwig F, Heim E, Schilling M (2009) Characterization of
magnetic core–shell nanoparticles by fluxgate magnetore-
laxometry, ac susceptibility, transmission electron
microscopy and photon correlation spectroscopy-a com-
parative study. J Magn Magn Mater 321:1644
Mahmoudi M, Sant S, Wang B, Laurent S, Sen T (2010) Su-
perparamagnetic iron oxide nanoparticles (SPIONs):
development, surface modification and applications in
chemotherapy. Adv Drug Deliv Rev 63:24
Na HB, Song IC, Hyeon T (2009) Inorganic nanoparticles for
MRI contrast agents. Adv Mater 21:2133
Nutting J, Antony J, Meyer D, Sharma A, Qiang Y (2006) The
effect of particle size distribution on the usage of the ac
susceptibility in biosensors. J Appl Phys 99:08B319
O’Handley RC (2000) Modern magnetic materials: principles
and applications. Wiley-Interscience, New York
Riani P, Napoletano M, Canepa F (2011) Synthesis, character-
ization and a.c. magnetic analysis of magnetite nanoparti-
cles. J Nanopart Res 13:7013–7015
J Nanopart Res (2013) 15:1601 Page 9 of 10
123
Schubert U, Husing N (2005) Synthesis of inorganic materials.
John Wiley & Son, New York
Shliomis MI, Raikher YL (1980) Experimental investigations of
magnetic fluids. IEEE Trans Magn 16:237
Sipos P, Berkesi O, Tombacz E, Pierre TG, Webb J (2003)
Formation of spherical iron(III) oxyhydroxide nanoparti-
cles sterically stabilized by chitosan in aqueous solutions.
J Inorg Biochem 95:55
Stober W, Fink A, Bohn E (1968) Controlled growth of mono-
disperse silica spheres in the micron size range. J Colloid
Interface Sci 26:62
Veiseh O, Gunn JW, Zhang M (2010) Design and fabrication of
magnetic nanoparticles for targeted drug delivery and
imaging. Adv Drug Deliv Rev 62:284
Page 10 of 10 J Nanopart Res (2013) 15:1601
123
Related Documents