Quantitative analysis of gallstones using laser-induced breakdown spectroscopy Vivek K. Singh, 1,6 Vinita Singh, 2 Awadhesh K. Rai, 1, * Surya N. Thakur, 3 Pradeep K. Rai, 4 and Jagdish P. Singh 5 1 Laser Spectroscopy Research Laboratory, Department of Physics, University of Allahabad, Allahabad-211002, India 2 4100 Central Pike, Hermitage, Tennessee 37076, USA 3 Department of Physics, Banaras Hindu University, Varanasi-221005, India 4 Opal Hospital, DLW Road, Varanasi-221005, India 5 Institute for Clean Energy Technology, Mississippi State University, Starkville, Mississippi, USA 6 [email protected] *Corresponding author: [email protected] Received 2 April 2008; revised 4 July 2008; accepted 7 July 2008; posted 8 July 2008 (Doc. ID 94389); published 13 August 2008 The utility of laser-induced breakdown spectroscopy (LIBS) for categorizing different types of gallbladder stone has been demonstrated by analyzing their major and minor constituents. LIBS spectra of three types of gallstone have been recorded in the 200–900 nm spectral region. Calcium is found to be the major element in all types of gallbladder stone. The spectrophotometric method has been used to classify the stones. A calibration-free LIBS method has been used for the quantitative analysis of metal elements, and the results have been compared with those obtained from inductively coupled plasma atomic emis- sion spectroscopy (ICP-AES) measurements. The single-shot LIBS spectra from different points on the cross section (in steps of 0:5 mm from one end to the other) of gallstones have also been recorded to study the variation of constituents from the center to the surface. The presence of different metal elements and their possible role in gallstone formation is discussed. © 2008 Optical Society of America OCIS codes: 140.3440, 300.2140, 300.6210, 120.6200, 300.0300, 350.5400. 1. Introduction Gallbladder stones (gallstones) affect a significant percentage of the population in many countries throughout the world. It is one of the most painful diseases, because of the mechanical irritation of the stones on the gallbladder tissues. It commonly occurs in both sexes regardless of age. The pathogen- esis of this disease is still not well known. Thus, it is important to determine the major and trace elemen- tal content of gallstones. Both deficiencies and ex- cesses of trace elements may result in a number of disorders in the human body, and thus their presence in appropriate amounts in the human body is essen- tial. On the other hand the toxic elements are known to be very harmful even at extremely low concentra- tions, and for this reason reliable elemental analyses will help to clarify and define effective treatment. Factors responsible for the formation of stones are altered hepatic bile composition, biliary glycoprotein, infection, age, genetics, sex, oestrogens, dietary fac- tors, geographical prevalence and cirrhosis of the li- ver [1]. The chemical composition of gallstones is complex and varied, but these could still be classified into three types such as cholesterol stone, pigment stone, and mixed stone according to their major che- mical composition [2,3], although other types of gall- stone, such as combined (cholesterol and pigment) [4–6] and rare stones [7,8] have been also reported. 0003-6935/08/310G38-10$15.00/0 © 2008 Optical Society of America G38 APPLIED OPTICS / Vol. 47, No. 31 / 1 November 2008

Welcome message from author
This document is posted to help you gain knowledge. Please leave a comment to let me know what you think about it! Share it to your friends and learn new things together.
Transcript
Quantitative analysis of gallstones usinglaser-induced breakdown spectroscopy
Vivek K. Singh,1,6 Vinita Singh,2 Awadhesh K. Rai,1,* Surya N. Thakur,3
Pradeep K. Rai,4 and Jagdish P. Singh5
1Laser Spectroscopy Research Laboratory, Department of Physics, University of Allahabad, Allahabad-211002, India24100 Central Pike, Hermitage, Tennessee 37076, USA
3Department of Physics, Banaras Hindu University, Varanasi-221005, India4Opal Hospital, DLW Road, Varanasi-221005, India
5Institute for Clean Energy Technology, Mississippi State University, Starkville, Mississippi, [email protected]
*Corresponding author: [email protected]
Received 2 April 2008; revised 4 July 2008; accepted 7 July 2008;posted 8 July 2008 (Doc. ID 94389); published 13 August 2008
The utility of laser-induced breakdown spectroscopy (LIBS) for categorizing different types of gallbladderstone has been demonstrated by analyzing their major and minor constituents. LIBS spectra of threetypes of gallstone have been recorded in the 200–900nm spectral region. Calcium is found to be themajorelement in all types of gallbladder stone. The spectrophotometric method has been used to classify thestones. A calibration-free LIBS method has been used for the quantitative analysis of metal elements,and the results have been compared with those obtained from inductively coupled plasma atomic emis-sion spectroscopy (ICP-AES) measurements. The single-shot LIBS spectra from different points on thecross section (in steps of 0:5mm from one end to the other) of gallstones have also been recorded to studythe variation of constituents from the center to the surface. The presence of different metal elements andtheir possible role in gallstone formation is discussed. © 2008 Optical Society of America
OCIS codes: 140.3440, 300.2140, 300.6210, 120.6200, 300.0300, 350.5400.
1. Introduction
Gallbladder stones (gallstones) affect a significantpercentage of the population in many countriesthroughout the world. It is one of the most painfuldiseases, because of the mechanical irritation ofthe stones on the gallbladder tissues. It commonlyoccurs in both sexes regardless of age. The pathogen-esis of this disease is still not well known. Thus, it isimportant to determine the major and trace elemen-tal content of gallstones. Both deficiencies and ex-cesses of trace elements may result in a number ofdisorders in the human body, and thus their presence
in appropriate amounts in the human body is essen-tial. On the other hand the toxic elements are knownto be very harmful even at extremely low concentra-tions, and for this reason reliable elemental analyseswill help to clarify and define effective treatment.Factors responsible for the formation of stones arealtered hepatic bile composition, biliary glycoprotein,infection, age, genetics, sex, oestrogens, dietary fac-tors, geographical prevalence and cirrhosis of the li-ver [1]. The chemical composition of gallstones iscomplex and varied, but these could still be classifiedinto three types such as cholesterol stone, pigmentstone, and mixed stone according to their major che-mical composition [2,3], although other types of gall-stone, such as combined (cholesterol and pigment)[4–6] and rare stones [7,8] have been also reported.
0003-6935/08/310G38-10$15.00/0© 2008 Optical Society of America
G38 APPLIED OPTICS / Vol. 47, No. 31 / 1 November 2008
The size of gallstones can also vary depending on theindividual case.Identification of the constituents of gallstones is
the first step in medical diagnosis to determinethe metabolic abnormality in the patient. It is wellknown that metals are minor components that arepresent in the body and play an important role inthe pathogenesis of gallstones. Reports are availablein the literature in which the concentration ofelements in different stones (gallbladder stones[9,10], renal stones [11–14], urinary stones [14–18],and biliary stones [2–10,19–21]) are determined bycrushing the whole stone and performing the analy-sis for such samples. Salimi et al. [20] used a proton-induced x-ray emission spectroscopic technique forthe variational analysis of trace elements with atom-ic numbers greater than 24 in the shell and the cen-ter of cholesterol and pigment gallstones, but theyfound the presence of only four such heavy elements.To understand the process of formation of gallstonesin the human body, it is desirable to perform varia-tional studies (from center to shell and the surfacepart) of major and trace elements regardless of theiratomic number. In view of the above, there is a greatneed for a technique that can determine the elemen-tal content (all kinds of elements) and their spatialdistribution in intact gallstones in order to assesstheir possible role in metabolic processes and to iden-tify the origin of the concretions of the stones.Laser-induced breakdown spectroscopy (LIBS) is a
well-established nondestructive spectrochemicalanalysis technique for the detection and quantifica-tion of any element (light as well as heavy) in biolo-gical samples. Kumar et al. [22] discussed thecharacterization of malignant tissue cells by LIBS,and Fang et al. [15] used the laser-induced plasmaspectroscopy technique to analyze and identify theelemental constituents of urinary stones but withoutgiving any specification for their spatial distribution.Detection and quantification of traces in any matrixby using LIBS can be performed with sensitivity lim-its in the range of parts per billion (parts in 109, ppb)along with spatial information [23–27]. The presentwork has been initiated to perform a comparativestudy of different types of gallstones to get informa-tion about their nucleation.The most convenient approach to determine ele-
mental abundance is by comparing the analytic lineintensities with those obtained from certified refer-ence materials having a similar matrix composition.It is, however, not always possible to obtain such ca-libration curves because there are no standard sam-ples of known concentration [28,29], especially in thecase of biological samples [27]. Calibration-free (CF)analysis is possible in the LIBS technique that allowsthe plasma matrix effects to be overcome and yieldssatisfactory quantitative results for elemental com-position without using calibration curves and certi-fied reference materials [27–37]. CF-LIBS hasrecently developed as an alternative approach tothe quantitative analysis using calibration curves
[24–27] and this technique seems to be the most suit-able for the quantitative analysis of gallstones in thepresent work. Recently, we carried out a LIBS-basedvariational study of constituents of cholesterol stones[38] and here we report a comparative study of cho-lesterol stones, black pigment stones, and mixedstones. The results of CF-LIBS are compared withinductively coupled plasma atomic emission spectro-scopy (ICP-AES) measurements.
2. Materials and Methods
A. Sample Collection
The gallstones frompatientswere surgically removedby the expert surgeon at Motilal Nehru Medical Col-lege, Allahabad, India. The stones were washed withdeionized water to remove traces of urine, blood, andother possible contaminants and then dried andstored in sealed pots and supplied to the LaserSpectroscopy Research Laboratory by Manav SevaSansthan Eaom Anusandhan Kendra, Beli Road, Al-lahabad, India. Theywere cut into halveswith abladeso that the laser beam could be focused on the crosssection at different points from the center to the shelland the surface (see Fig. 6 below). To perform the ICP-AES analysis, minute samples from the center, shell,and surface of the stone were carefully removed. Thesample codes GS1, GS2, and GS3 refer to the center,the shell, and the surface, respectively, for the mixedstone (dark brown); the codes GS4, GS5, and GS6 re-fer to the cholesterol stone; and GS7, GS8, and GS9represent the black pigment stone.
B. LIBS Instrumentation
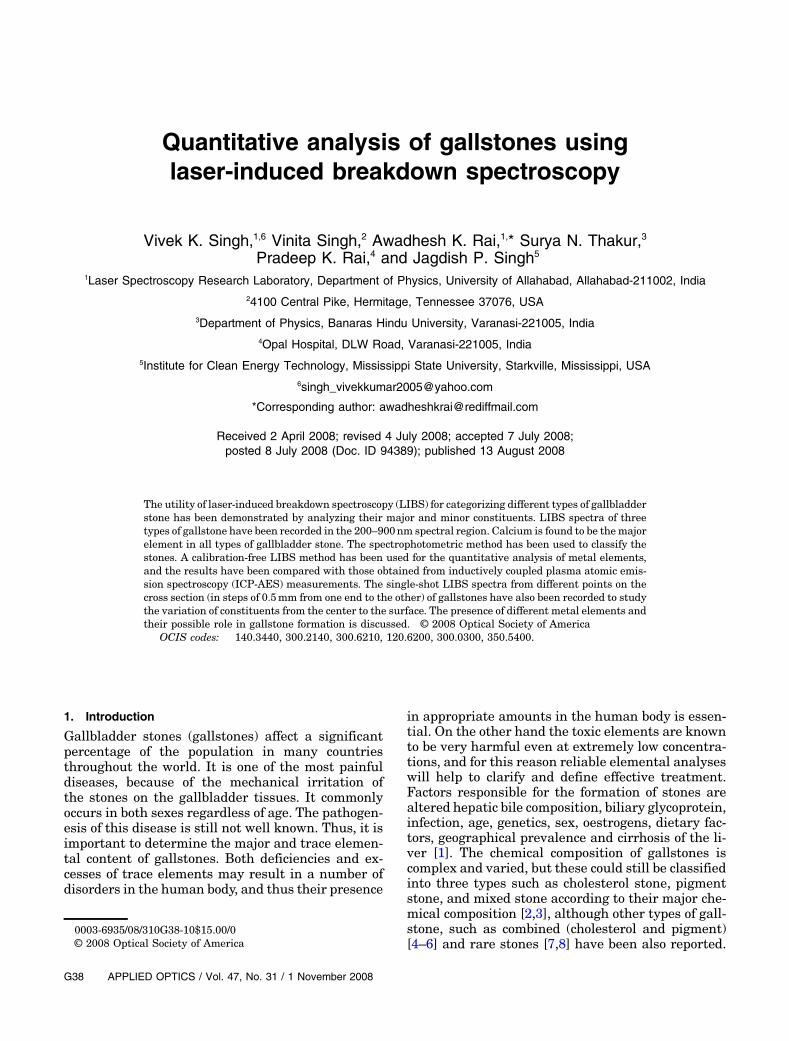
LIBS is based on recording the spectrum of a plasmaplume generated by a laser beam focused at the sam-ple surface [39–42]. The spectra of gallstones wererecorded by using the LIBS instrument schemati-cally shown in Fig. 1. The beam of a pulsed Nd:YAG laser (Continuum Surelite III-10), capable ofa maximum energy of 425mJ at 532nm with a pulseduration of 3–4ns (FWHM) and a maximum pulserepetition rate of 10Hz, was focused at the surface
Fig. 1. Schematic diagram of LIBS experimental setup for theanalysis of gallstone samples.
1 November 2008 / Vol. 47, No. 31 / APPLIED OPTICS G39
of the stone by using a quartz lens of 15 cm focallength. To avoid crater formation on the sample sur-face, the sample was placed on an x–z translationstage. The plasma emission was collected at a 45° an-gle to the incident laser beam by using an optical fi-ber system and fed into a multichannel gratingspectrometer (Ocean Optics, LIBS 2000þ) equippedwith a CCD. The spectrum was analyzed by usingOcean Optics LIBS 2000þ software, and the best con-ditions for high signal-to-noise and signal-to-back-ground ratios were found to correspond to 20mJ oflaser energy/pulse and a 10Hz repetition rate. Thelaser pulse energy was measured with an energy-meter (Genetec-e Model UP19K-30H-VM-DO) byplacing it in the path of the laser beam with a preci-sion of 0.04%.The LIBS spectra of center, shell, and surface parts
of the stones were recorded by using a 1:5 μs gate de-lay with spectral resolution 0:1nm in the spectralrange 200–500nm and a spectral resolution0:75nm in the spectral range 200–900nm. The aver-aged spectra for 50 laser shots were recorded to en-hance the signal-to-noise ratio, whereas single-shotspectra were recorded for the study of the spatial dis-tribution of the elements in the stones to avoid degra-dation of the sample.
C. Inductively Coupled Plasma Spectroscopy
The gallstone samples were analyzed using the in-ductively coupled plasma (ICP) spectroscopy techni-que. These samples were digested by using thestandard EPA 3050B method, and in each case only0:1 g was digested because of the limited quantity, toprepare the solution for ICP analysis. The sampleswere dried in the furnace at 600 °C for 1h, and the
dried samples were initially dissolved in 10%HNO3 and 1% HCl with a microwave digestion pro-cedure. Finally, the liquid samples after appropriatedilution were fed to the ICP plasma through argon(Ar) buffer gas. The ICP system was calibrated withthe standard solution for various elements beforerunning the gallstone samples. It has been observedduring the digestion procedure that all the gallstonesamples lost 85%–95% of their weight after beingheated in the furnace at 600 °C for 1h. This showsthat the gallstones contain organic compounds astheir major constituents.
3. Results
A. Macroscopic Classification of Gallbladder Stones
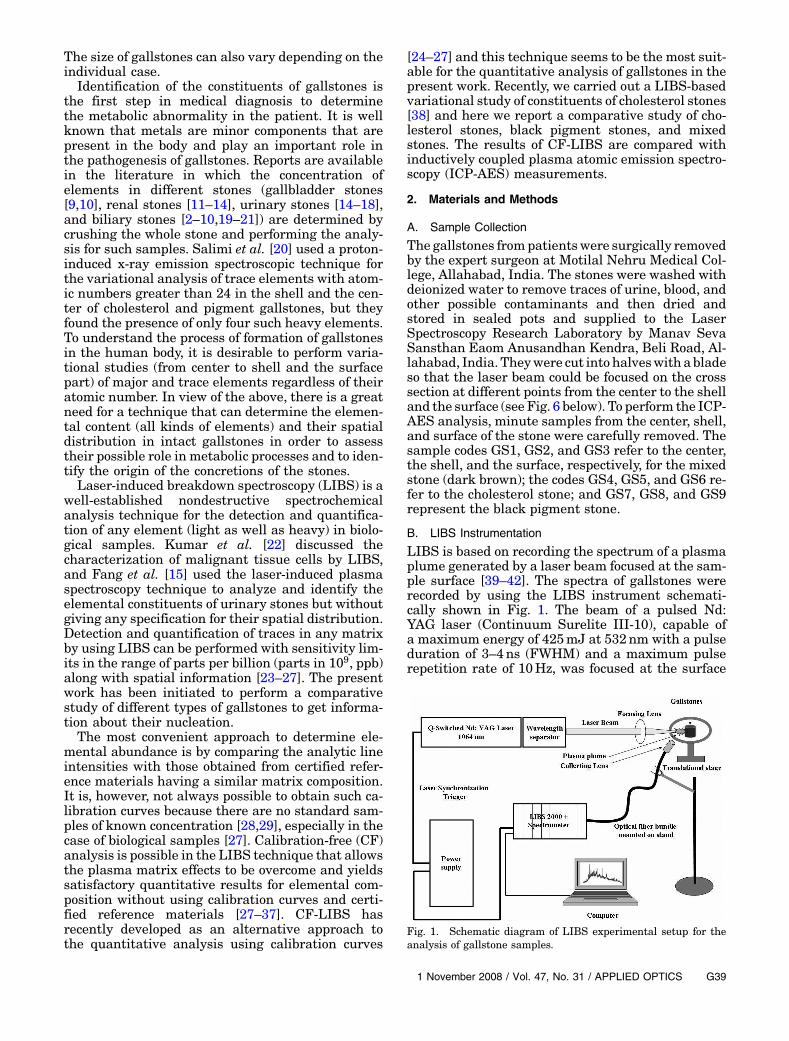
The gallstones collected from the pathological la-boratory were classified into three categories as sum-marized in Table 1. Figure 2(a) shows two yellowish-white (10–12mm) stones, classified as cholesterolstones, which exhibit a brownish-black color at thecenter and concentric rings spreading from the cen-ter to the outer surface. The mixed stones are shownin Figs. 2(b)–2(d). Figures 2(b) and 2(c) are photo-graphs of four dark brown (20–25mm) stones havingmultifaceted shapes, and Fig. 2(c) shows a cross-sectional view of one of them with a blackish-brown
Table 1. Specifications of the Sample Gallbladder Stones
Type ColorsPatient Age(years), Sex
No. ofgallstones
Cholesterol Creamy yellow 56, Male 2Mixed Dark brown, bottle green 35, Male 4þ 1Pigment Black 40, Male 3
Fig. 2. Photographs of the gallstone samples used in the present study.
G40 APPLIED OPTICS / Vol. 47, No. 31 / 1 November 2008
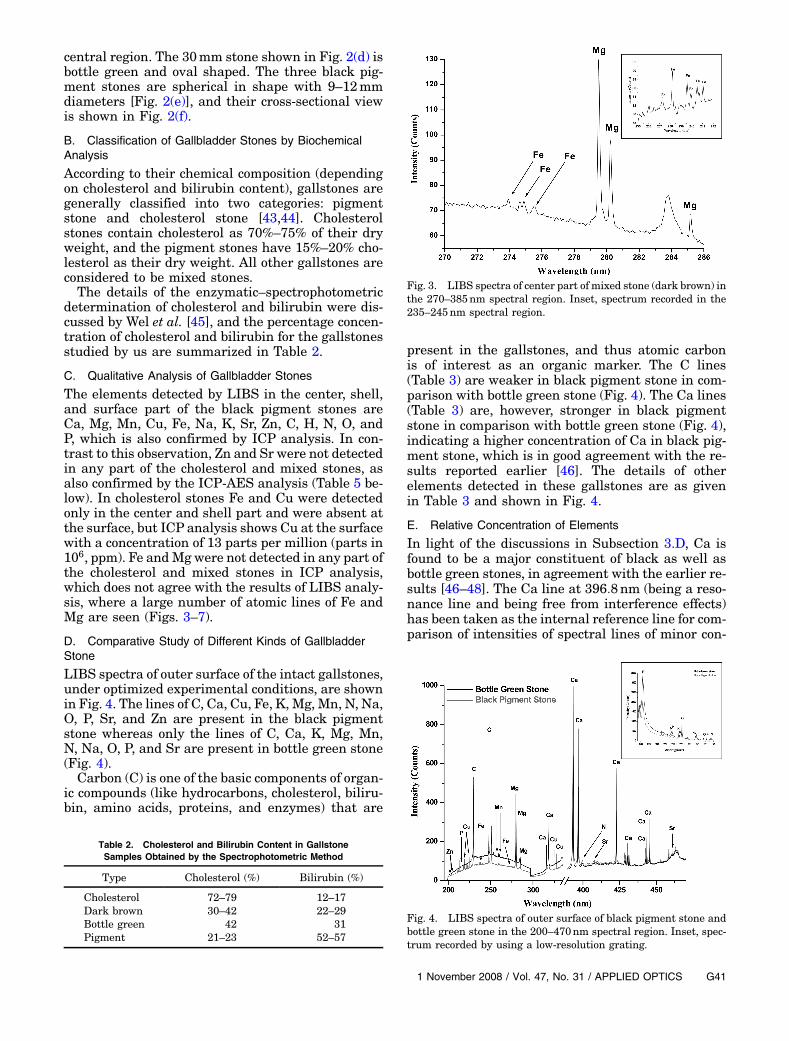
central region. The 30mm stone shown in Fig. 2(d) isbottle green and oval shaped. The three black pig-ment stones are spherical in shape with 9–12mmdiameters [Fig. 2(e)], and their cross-sectional viewis shown in Fig. 2(f).
B. Classification of Gallbladder Stones by BiochemicalAnalysis
According to their chemical composition (dependingon cholesterol and bilirubin content), gallstones aregenerally classified into two categories: pigmentstone and cholesterol stone [43,44]. Cholesterolstones contain cholesterol as 70%–75% of their dryweight, and the pigment stones have 15%–20% cho-lesterol as their dry weight. All other gallstones areconsidered to be mixed stones.The details of the enzymatic–spectrophotometric
determination of cholesterol and bilirubin were dis-cussed by Wel et al. [45], and the percentage concen-tration of cholesterol and bilirubin for the gallstonesstudied by us are summarized in Table 2.
C. Qualitative Analysis of Gallbladder Stones
The elements detected by LIBS in the center, shell,and surface part of the black pigment stones areCa, Mg, Mn, Cu, Fe, Na, K, Sr, Zn, C, H, N, O, andP, which is also confirmed by ICP analysis. In con-trast to this observation, Zn and Sr were not detectedin any part of the cholesterol and mixed stones, asalso confirmed by the ICP-AES analysis (Table 5 be-low). In cholesterol stones Fe and Cu were detectedonly in the center and shell part and were absent atthe surface, but ICP analysis shows Cu at the surfacewith a concentration of 13 parts per million (parts in106, ppm). Fe andMgwere not detected in any part ofthe cholesterol and mixed stones in ICP analysis,which does not agree with the results of LIBS analy-sis, where a large number of atomic lines of Fe andMg are seen (Figs. 3–7).
D. Comparative Study of Different Kinds of GallbladderStone
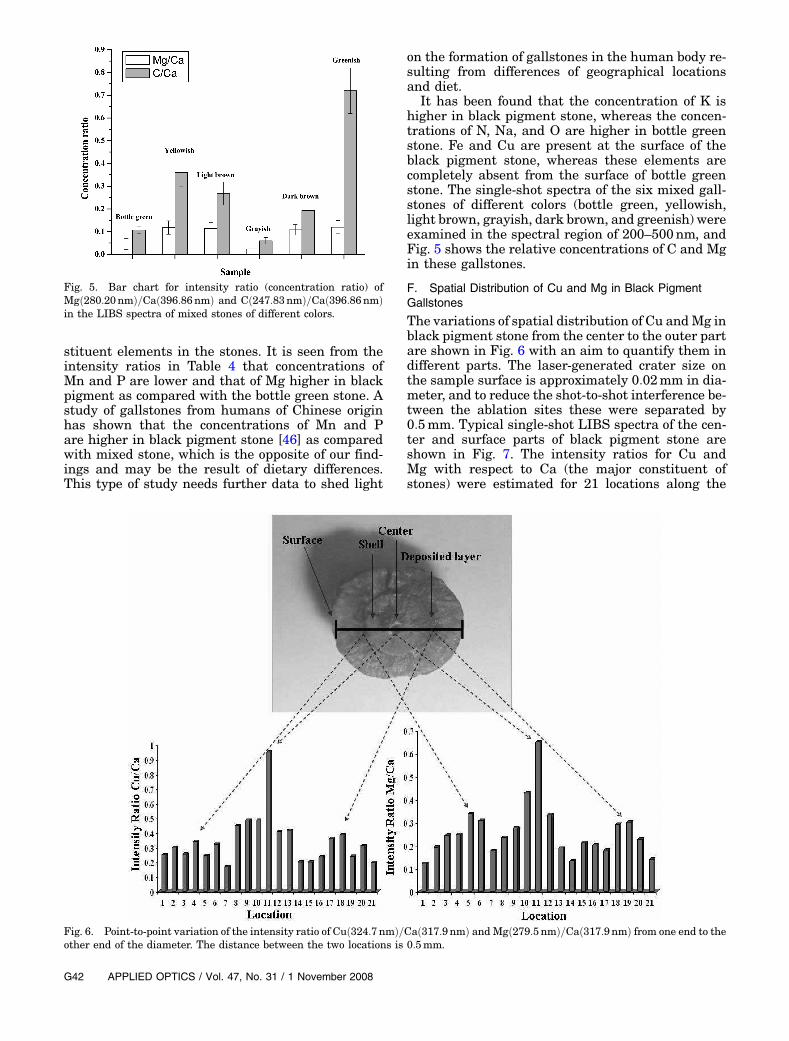
LIBS spectra of outer surface of the intact gallstones,under optimized experimental conditions, are shownin Fig. 4. The lines of C, Ca, Cu, Fe, K, Mg, Mn, N, Na,O, P, Sr, and Zn are present in the black pigmentstone whereas only the lines of C, Ca, K, Mg, Mn,N, Na, O, P, and Sr are present in bottle green stone(Fig. 4).Carbon (C) is one of the basic components of organ-
ic compounds (like hydrocarbons, cholesterol, biliru-bin, amino acids, proteins, and enzymes) that are
present in the gallstones, and thus atomic carbonis of interest as an organic marker. The C lines(Table 3) are weaker in black pigment stone in com-parison with bottle green stone (Fig. 4). The Ca lines(Table 3) are, however, stronger in black pigmentstone in comparison with bottle green stone (Fig. 4),indicating a higher concentration of Ca in black pig-ment stone, which is in good agreement with the re-sults reported earlier [46]. The details of otherelements detected in these gallstones are as givenin Table 3 and shown in Fig. 4.
E. Relative Concentration of Elements
In light of the discussions in Subsection 3.D, Ca isfound to be a major constituent of black as well asbottle green stones, in agreement with the earlier re-sults [46–48]. The Ca line at 396:8nm (being a reso-nance line and being free from interference effects)has been taken as the internal reference line for com-parison of intensities of spectral lines of minor con-
Fig. 3. LIBS spectra of center part of mixed stone (dark brown) inthe 270–385nm spectral region. Inset, spectrum recorded in the235–245nm spectral region.
Fig. 4. LIBS spectra of outer surface of black pigment stone andbottle green stone in the 200–470nm spectral region. Inset, spec-trum recorded by using a low-resolution grating.
Table 2. Cholesterol and Bilirubin Content in GallstoneSamples Obtained by the Spectrophotometric Method
Type Cholesterol (%) Bilirubin (%)
Cholesterol 72–79 12–17Dark brown 30–42 22–29Bottle green 42 31Pigment 21–23 52–57
1 November 2008 / Vol. 47, No. 31 / APPLIED OPTICS G41
stituent elements in the stones. It is seen from theintensity ratios in Table 4 that concentrations ofMn and P are lower and that of Mg higher in blackpigment as compared with the bottle green stone. Astudy of gallstones from humans of Chinese originhas shown that the concentrations of Mn and Pare higher in black pigment stone [46] as comparedwith mixed stone, which is the opposite of our find-ings and may be the result of dietary differences.This type of study needs further data to shed light
on the formation of gallstones in the human body re-sulting from differences of geographical locationsand diet.
It has been found that the concentration of K ishigher in black pigment stone, whereas the concen-trations of N, Na, and O are higher in bottle greenstone. Fe and Cu are present at the surface of theblack pigment stone, whereas these elements arecompletely absent from the surface of bottle greenstone. The single-shot spectra of the six mixed gall-stones of different colors (bottle green, yellowish,light brown, grayish, dark brown, and greenish) wereexamined in the spectral region of 200–500nm, andFig. 5 shows the relative concentrations of C and Mgin these gallstones.
F. Spatial Distribution of Cu and Mg in Black PigmentGallstones
The variations of spatial distribution of Cu andMg inblack pigment stone from the center to the outer partare shown in Fig. 6 with an aim to quantify them indifferent parts. The laser-generated crater size onthe sample surface is approximately 0:02mm in dia-meter, and to reduce the shot-to-shot interference be-tween the ablation sites these were separated by0:5mm. Typical single-shot LIBS spectra of the cen-ter and surface parts of black pigment stone areshown in Fig. 7. The intensity ratios for Cu andMg with respect to Ca (the major constituent ofstones) were estimated for 21 locations along the
Fig. 5. Bar chart for intensity ratio (concentration ratio) ofMgð280:20nmÞ=Cað396:86nmÞ and Cð247:83nmÞ=Cað396:86nmÞin the LIBS spectra of mixed stones of different colors.
Fig. 6. Point-to-point variation of the intensity ratio of Cuð324:7nmÞ=Cað317:9nmÞ andMgð279:5nmÞ=Cað317:9nmÞ from one end to theother end of the diameter. The distance between the two locations is 0:5mm.
G42 APPLIED OPTICS / Vol. 47, No. 31 / 1 November 2008
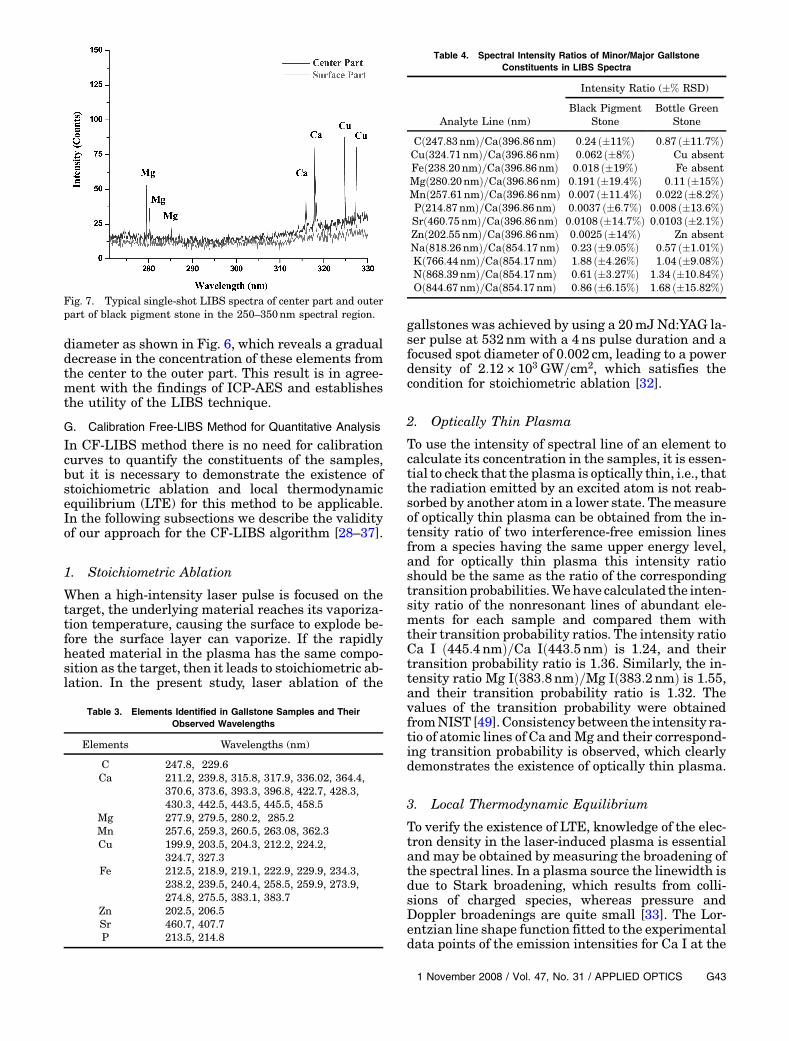
diameter as shown in Fig. 6, which reveals a gradualdecrease in the concentration of these elements fromthe center to the outer part. This result is in agree-ment with the findings of ICP-AES and establishesthe utility of the LIBS technique.
G. Calibration Free-LIBS Method for Quantitative Analysis
In CF-LIBS method there is no need for calibrationcurves to quantify the constituents of the samples,but it is necessary to demonstrate the existence ofstoichiometric ablation and local thermodynamicequilibrium (LTE) for this method to be applicable.In the following subsections we describe the validityof our approach for the CF-LIBS algorithm [28–37].
1. Stoichiometric Ablation
When a high-intensity laser pulse is focused on thetarget, the underlying material reaches its vaporiza-tion temperature, causing the surface to explode be-fore the surface layer can vaporize. If the rapidlyheated material in the plasma has the same compo-sition as the target, then it leads to stoichiometric ab-lation. In the present study, laser ablation of the
gallstones was achieved by using a 20mJNd:YAG la-ser pulse at 532nm with a 4ns pulse duration and afocused spot diameter of 0:002 cm, leading to a powerdensity of 2:12 × 103 GW=cm2, which satisfies thecondition for stoichiometric ablation [32].
2. Optically Thin Plasma
To use the intensity of spectral line of an element tocalculate its concentration in the samples, it is essen-tial to check that the plasma is optically thin, i.e., thatthe radiation emitted by an excited atom is not reab-sorbed by another atom in a lower state. Themeasureof optically thin plasma can be obtained from the in-tensity ratio of two interference-free emission linesfrom a species having the same upper energy level,and for optically thin plasma this intensity ratioshould be the same as the ratio of the correspondingtransitionprobabilities.Wehave calculated the inten-sity ratio of the nonresonant lines of abundant ele-ments for each sample and compared them withtheir transition probability ratios. The intensity ratioCa I ð445:4nmÞ=Ca Ið443:5nmÞ is 1.24, and theirtransition probability ratio is 1.36. Similarly, the in-tensity ratio Mg Ið383:8nmÞ=Mg Ið383:2nmÞ is 1.55,and their transition probability ratio is 1.32. Thevalues of the transition probability were obtainedfromNIST [49].Consistency between the intensity ra-tio of atomic lines of Ca andMg and their correspond-ing transition probability is observed, which clearlydemonstrates the existence of optically thin plasma.
3. Local Thermodynamic Equilibrium
To verify the existence of LTE, knowledge of the elec-tron density in the laser-induced plasma is essentialand may be obtained by measuring the broadening ofthe spectral lines. In a plasma source the linewidth isdue to Stark broadening, which results from colli-sions of charged species, whereas pressure andDoppler broadenings are quite small [33]. The Lor-entzian line shape function fitted to the experimentaldata points of the emission intensities for Ca I at the
Fig. 7. Typical single-shot LIBS spectra of center part and outerpart of black pigment stone in the 250–350nm spectral region.
Table 3. Elements Identified in Gallstone Samples and TheirObserved Wavelengths
Elements Wavelengths (nm)
C 247.8, 229.6Ca 211.2, 239.8, 315.8, 317.9, 336.02, 364.4,
370.6, 373.6, 393.3, 396.8, 422.7, 428.3,430.3, 442.5, 443.5, 445.5, 458.5
Mg 277.9, 279.5, 280.2, 285.2Mn 257.6, 259.3, 260.5, 263.08, 362.3Cu 199.9, 203.5, 204.3, 212.2, 224.2,
324.7, 327.3Fe 212.5, 218.9, 219.1, 222.9, 229.9, 234.3,
238.2, 239.5, 240.4, 258.5, 259.9, 273.9,274.8, 275.5, 383.1, 383.7
Zn 202.5, 206.5Sr 460.7, 407.7P 213.5, 214.8
Table 4. Spectral Intensity Ratios of Minor/Major GallstoneConstituents in LIBS Spectra
Intensity Ratio (�% RSD)
Analyte Line (nm)Black Pigment
StoneBottle Green
Stone
Cð247:83nmÞ=Cað396:86nmÞ 0:24 ð�11%Þ 0:87 ð�11:7%ÞCuð324:71nmÞ=Cað396:86nmÞ 0:062 ð�8%Þ Cu absentFeð238:20nmÞ=Cað396:86nmÞ 0:018 ð�19%Þ Fe absentMgð280:20nmÞ=Cað396:86nmÞ 0:191 ð�19:4%Þ 0:11 ð�15%ÞMnð257:61nmÞ=Cað396:86nmÞ 0:007 ð�11:4%Þ 0:022 ð�8:2%ÞPð214:87nmÞ=Cað396:86nmÞ 0:0037 ð�6:7%Þ 0:008 ð�13:6%ÞSrð460:75nmÞ=Cað396:86nmÞ 0:0108 ð�14:7%Þ 0:0103 ð�2:1%ÞZnð202:55nmÞ=Cað396:86nmÞ 0:0025 ð�14%Þ Zn absentNað818:26nmÞ=Cað854:17nmÞ 0:23 ð�9:05%Þ 0:57 ð�1:01%ÞKð766:44nmÞ=Cað854:17nmÞ 1:88 ð�4:26%Þ 1:04 ð�9:08%ÞNð868:39nmÞ=Cað854:17nmÞ 0:61 ð�3:27%Þ 1:34 ð�10:84%ÞOð844:67nmÞ=Cað854:17nmÞ 0:86 ð�6:15%Þ 1:68 ð�15:82%Þ
1 November 2008 / Vol. 47, No. 31 / APPLIED OPTICS G43
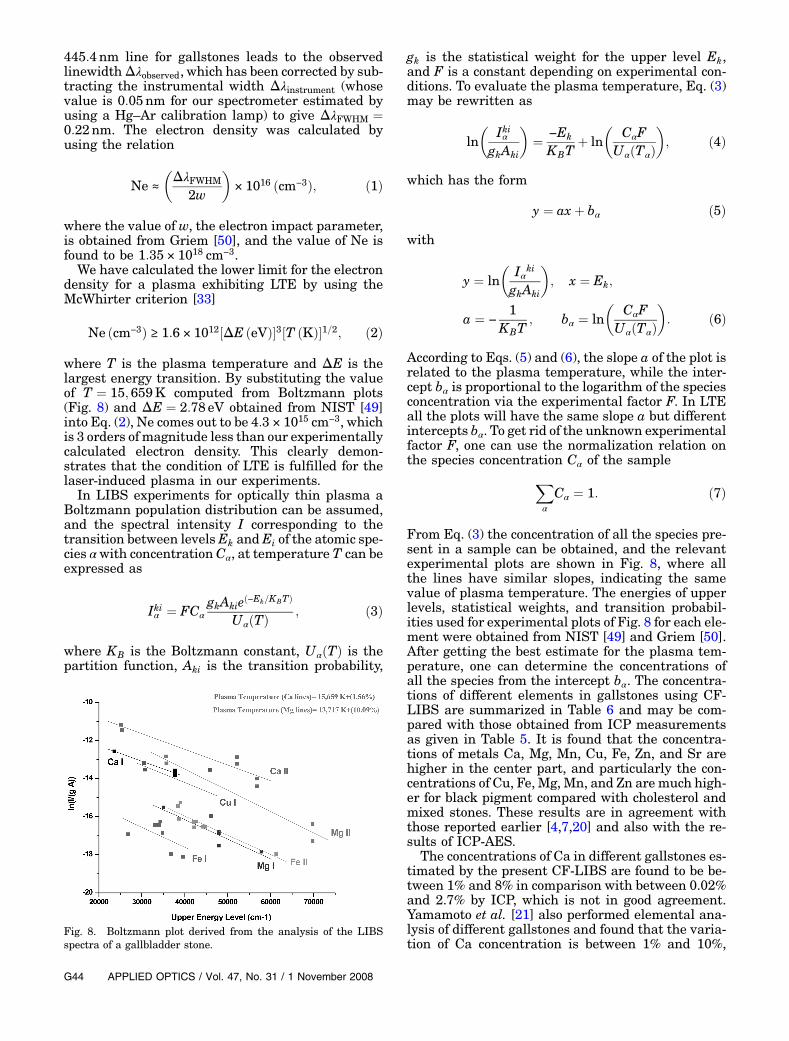
445:4nm line for gallstones leads to the observedlinewidthΔλobserved, which has been corrected by sub-tracting the instrumental width Δλinstrument (whosevalue is 0:05nm for our spectrometer estimated byusing a Hg–Ar calibration lamp) to give ΔλFWHM ¼0:22nm. The electron density was calculated byusing the relation
Ne ≈
�ΔλFWHM
2w
�× 1016 ðcm−3Þ; ð1Þ
where the value of w, the electron impact parameter,is obtained from Griem [50], and the value of Ne isfound to be 1:35 × 1018 cm−3.We have calculated the lower limit for the electron
density for a plasma exhibiting LTE by using theMcWhirter criterion [33]
Ne ðcm−3Þ ≥ 1:6 × 10¹²½ΔE ðeVÞ�3½T ðKÞ�1=2; ð2Þ
where T is the plasma temperature and ΔE is thelargest energy transition. By substituting the valueof T ¼ 15; 659K computed from Boltzmann plots(Fig. 8) and ΔE ¼ 2:78 eV obtained from NIST [49]into Eq. (2), Ne comes out to be 4:3 × 1015 cm−3, whichis 3 orders of magnitude less than our experimentallycalculated electron density. This clearly demon-strates that the condition of LTE is fulfilled for thelaser-induced plasma in our experiments.In LIBS experiments for optically thin plasma a
Boltzmann population distribution can be assumed,and the spectral intensity I corresponding to thetransition between levels Ek andEi of the atomic spe-cies αwith concentrationCα, at temperature T can beexpressed as
Ikiα ¼ FCαgkAkieð−Ek=KBTÞ
UαðTÞ; ð3Þ
where KB is the Boltzmann constant, UαðTÞ is thepartition function, Aki is the transition probability,
gk is the statistical weight for the upper level Ek,and F is a constant depending on experimental con-ditions. To evaluate the plasma temperature, Eq. (3)may be rewritten as
ln�
IkiαgkAki
�¼ −Ek
KBTþ ln
�CαF
UαðTαÞ�; ð4Þ
which has the form
y ¼ axþ bα ð5Þ
with
y ¼ ln�
Iαki
gkAki
�; x ¼ Ek;
a ¼ −1
KBT; bα ¼ ln
�CαF
UαðTαÞ�: ð6Þ
According to Eqs. (5) and (6), the slope a of the plot isrelated to the plasma temperature, while the inter-cept bα is proportional to the logarithm of the speciesconcentration via the experimental factor F. In LTEall the plots will have the same slope a but differentintercepts bα. To get rid of the unknown experimentalfactor F, one can use the normalization relation onthe species concentration Cα of the sample
XαCα ¼ 1: ð7Þ
From Eq. (3) the concentration of all the species pre-sent in a sample can be obtained, and the relevantexperimental plots are shown in Fig. 8, where allthe lines have similar slopes, indicating the samevalue of plasma temperature. The energies of upperlevels, statistical weights, and transition probabil-ities used for experimental plots of Fig. 8 for each ele-ment were obtained from NIST [49] and Griem [50].After getting the best estimate for the plasma tem-perature, one can determine the concentrations ofall the species from the intercept bα. The concentra-tions of different elements in gallstones using CF-LIBS are summarized in Table 6 and may be com-pared with those obtained from ICP measurementsas given in Table 5. It is found that the concentra-tions of metals Ca, Mg, Mn, Cu, Fe, Zn, and Sr arehigher in the center part, and particularly the con-centrations of Cu, Fe, Mg, Mn, and Zn are much high-er for black pigment compared with cholesterol andmixed stones. These results are in agreement withthose reported earlier [4,7,20] and also with the re-sults of ICP-AES.
The concentrations of Ca in different gallstones es-timated by the present CF-LIBS are found to be be-tween 1% and 8% in comparison with between 0.02%and 2.7% by ICP, which is not in good agreement.Yamamoto et al. [21] also performed elemental ana-lysis of different gallstones and found that the varia-tion of Ca concentration is between 1% and 10%,
Fig. 8. Boltzmann plot derived from the analysis of the LIBSspectra of a gallbladder stone.
G44 APPLIED OPTICS / Vol. 47, No. 31 / 1 November 2008
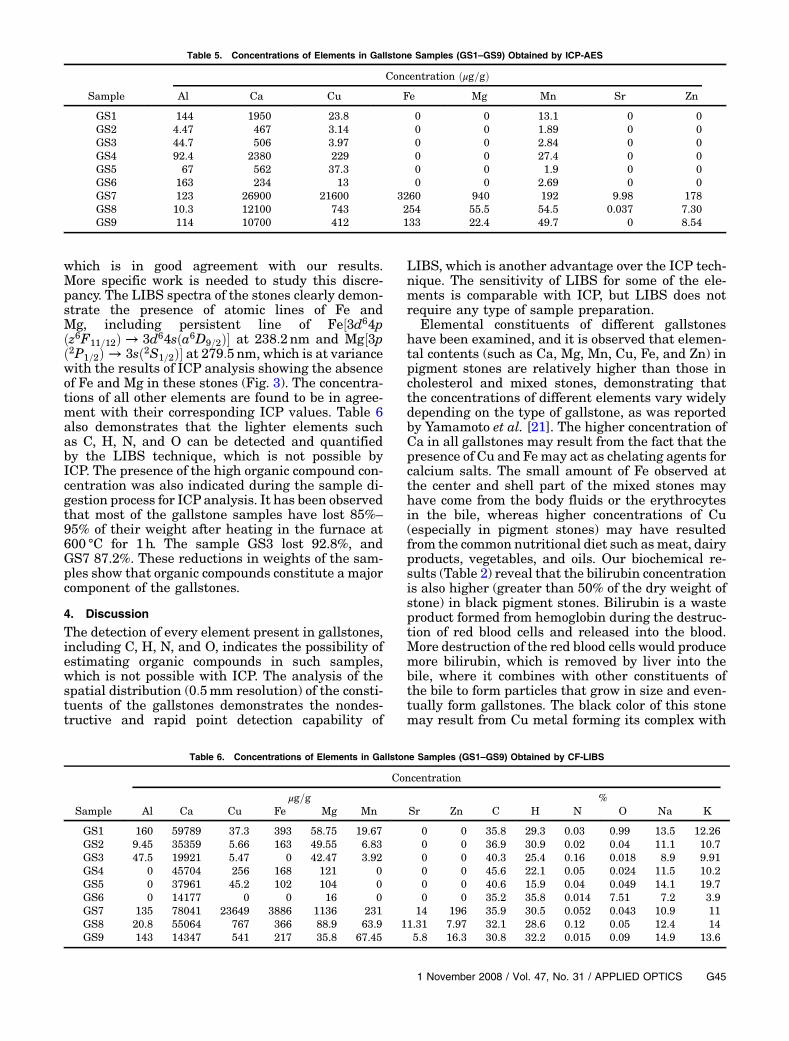
which is in good agreement with our results.More specific work is needed to study this discre-pancy. The LIBS spectra of the stones clearly demon-strate the presence of atomic lines of Fe andMg, including persistent line of Fe½3d64pðz6F11=12Þ → 3d64sða6D9=2Þ� at 238:2nm and Mg½3pð2P1=2Þ → 3sð2S1=2Þ� at 279:5nm, which is at variancewith the results of ICP analysis showing the absenceof Fe and Mg in these stones (Fig. 3). The concentra-tions of all other elements are found to be in agree-ment with their corresponding ICP values. Table 6also demonstrates that the lighter elements suchas C, H, N, and O can be detected and quantifiedby the LIBS technique, which is not possible byICP. The presence of the high organic compound con-centration was also indicated during the sample di-gestion process for ICP analysis. It has been observedthat most of the gallstone samples have lost 85%–
95% of their weight after heating in the furnace at600 °C for 1h. The sample GS3 lost 92.8%, andGS7 87.2%. These reductions in weights of the sam-ples show that organic compounds constitute a majorcomponent of the gallstones.
4. Discussion
The detection of every element present in gallstones,including C, H, N, and O, indicates the possibility ofestimating organic compounds in such samples,which is not possible with ICP. The analysis of thespatial distribution (0:5mm resolution) of the consti-tuents of the gallstones demonstrates the nondes-tructive and rapid point detection capability of
LIBS, which is another advantage over the ICP tech-nique. The sensitivity of LIBS for some of the ele-ments is comparable with ICP, but LIBS does notrequire any type of sample preparation.
Elemental constituents of different gallstoneshave been examined, and it is observed that elemen-tal contents (such as Ca, Mg, Mn, Cu, Fe, and Zn) inpigment stones are relatively higher than those incholesterol and mixed stones, demonstrating thatthe concentrations of different elements vary widelydepending on the type of gallstone, as was reportedby Yamamoto et al. [21]. The higher concentration ofCa in all gallstones may result from the fact that thepresence of Cu and Femay act as chelating agents forcalcium salts. The small amount of Fe observed atthe center and shell part of the mixed stones mayhave come from the body fluids or the erythrocytesin the bile, whereas higher concentrations of Cu(especially in pigment stones) may have resultedfrom the common nutritional diet such asmeat, dairyproducts, vegetables, and oils. Our biochemical re-sults (Table 2) reveal that the bilirubin concentrationis also higher (greater than 50% of the dry weight ofstone) in black pigment stones. Bilirubin is a wasteproduct formed from hemoglobin during the destruc-tion of red blood cells and released into the blood.More destruction of the red blood cells would producemore bilirubin, which is removed by liver into thebile, where it combines with other constituents ofthe bile to form particles that grow in size and even-tually form gallstones. The black color of this stonemay result from Cu metal forming its complex with
Table 5. Concentrations of Elements in Gallstone Samples (GS1–GS9) Obtained by ICP-AES
Concentration ðμg=gÞSample Al Ca Cu Fe Mg Mn Sr Zn
GS1 144 1950 23.8 0 0 13.1 0 0GS2 4.47 467 3.14 0 0 1.89 0 0GS3 44.7 506 3.97 0 0 2.84 0 0GS4 92.4 2380 229 0 0 27.4 0 0GS5 67 562 37.3 0 0 1.9 0 0GS6 163 234 13 0 0 2.69 0 0GS7 123 26900 21600 3260 940 192 9.98 178GS8 10.3 12100 743 254 55.5 54.5 0.037 7.30GS9 114 10700 412 133 22.4 49.7 0 8.54
Table 6. Concentrations of Elements in Gallstone Samples (GS1–GS9) Obtained by CF-LIBS
Concentration
μg=g %Sample Al Ca Cu Fe Mg Mn Sr Zn C H N O Na K
GS1 160 59789 37.3 393 58.75 19.67 0 0 35.8 29.3 0.03 0.99 13.5 12.26GS2 9.45 35359 5.66 163 49.55 6.83 0 0 36.9 30.9 0.02 0.04 11.1 10.7GS3 47.5 19921 5.47 0 42.47 3.92 0 0 40.3 25.4 0.16 0.018 8.9 9.91GS4 0 45704 256 168 121 0 0 0 45.6 22.1 0.05 0.024 11.5 10.2GS5 0 37961 45.2 102 104 0 0 0 40.6 15.9 0.04 0.049 14.1 19.7GS6 0 14177 0 0 16 0 0 0 35.2 35.8 0.014 7.51 7.2 3.9GS7 135 78041 23649 3886 1136 231 14 196 35.9 30.5 0.052 0.043 10.9 11GS8 20.8 55064 767 366 88.9 63.9 11.31 7.97 32.1 28.6 0.12 0.05 12.4 14GS9 143 14347 541 217 35.8 67.45 5.8 16.3 30.8 32.2 0.015 0.09 14.9 13.6
1 November 2008 / Vol. 47, No. 31 / APPLIED OPTICS G45
bilirubin. This is in good agreement with Li et al.[51], who described the formation of copper bilirubi-nate complex in black pigment stones.The higher concentration of Fe in black pigment
stones [Table 6] may be attributed to the processin which red blood cells are destroyed, the hemoglo-bin molecule is broken up, and the resulting productis recycled and secreted in the bile by the liver. How-ever, the presence of iron in pigment stones in itscompound form is not well known, as was discussedby Chua-anusorn et al. [52].The elements Na and K have been detected in all
types of stones, which is due to the secretion of bilejuice by the hepatocytes in the liver. Bile is composedof water, inorganic electrolytes such as Naþ, Kþ, Cl−,Caþ, and HCO3− and organic solutes.The initiation phase of stone formation is as impor-
tant as the growth phases, and the element status inthe local environment where the stone forms may beof particular significance. The knowledge of differentelements in the center part of the stone may give use-ful information about the precipitation and initiationphases, whereas that of the elements in shell andsurface parts may give more information about thepromotion and growth phases. The higher contentof Ca, Cu, Fe, Mg, and Mn in the nucleus of the gall-bladder stones than in the shell and surface suggeststhat bile may initiate their formation, because it hasa high concentration of these elements.
5. Conclusion
LIBS is found to be a suitable technique for the var-iational study of the constituent elements of any kindof gallbladder stone. We have been able to differenti-ate between gallstones on the basis of the elementalcontent, and the CF-LIBS method is found to be sui-table for quantifying the major and trace elements.Elemental compositions of three types of stone (pig-ment, cholesterol, and mixed) show that the centerpart of the pigment stones are very similar to thoseof cholesterol and mixed stones. It is concluded thatthe origination of these three types of gallstone in hu-mans may be very similar but that their growth pro-cesses may be quite different (in view of the differentelements found in the shell and surface regions). Pre-sent work also demonstrates that LIBS may be usedfor real-time clinical detection of elemental contentin biomaterials without any sample preparation.
The financial assistance of the Defence Researchand Development Organization (DRDO) project(ERIP/ER/04303481/M/01/787) isdulyacknowledged.We are grateful to S. P. Singh for providing the gall-bladder stone samples and valuable discussions. Weare thankful to Geeta Watal, Department of Chemis-try, University of Allahabad, India, for providing uswith the necessary facility for biochemical analysis.
References and Links1. R. Agarwal and V. R. Singh, “Ultrasonic parameters and rela-
tionship between compressive strength, microstructure ofgallbladder stones,” Eur. J. Ultrasound 11, 143–146 (2000).
2. O. Kleiner, J. Ramesh, M. Huleihel, B. Cohen, K. Kantarovich,C. Levi, B. Polyak, R. S. Marks, J. Mordehai, Z. Cohen, andS. Mordechai, “A comparative study of gallstones from chil-dren and adults using FTIR spectroscopy and fluorescence mi-croscopy,” BioMed Central: BMCGastroenterology 2, 3 (2002).
3. G. Liu, D. Xing, H. Yang, and J. Wu, “Vibrational spectroscopicstudy of human pigment gallstones and their insoluble mate-rials,” J. Mol. Struct. 616, 187–191 (2002).
4. P. F. Malet, M. A. Dabezies, G. Huang, W. B. Long,T. R. Gadacz, and R. D. Soloway, “Quantitative infrared spec-troscopy of common bile duct gallstones,”Gastroenterology 94,1217–1221 (1988).
5. U. Wosiewitz, “Scanning electron microscopy in gallstone re-search,” Scanning Electron Microsc. Part 1, 419–430 (1983).
6. M. Tabata and F. Nakayama, “Bacteria and gallstones: etiolo-gical significance,” Dig. Dis. Sci. 26, 218–224 (1981).
7. N. Suzuki, Y. Nakamura, and T. Sato, “Infrared absorptionspectroscopy of pure pigment gallstones,” Tohoku J. Exp.Med. 116, 259–265 (1975).
8. T. Maki, “Pathogenesis of calcium bilirubinate gallstones: roleof E. coli, β-glucuronidase and coagulation by inorganic ions,polyelectrolytes and agitation,” Ann. Surg. 164, 90–100(1966).
9. T. Kodaka, T. Sano, K. Nakagawa, J. Kakino, and R. Mori,“Structural and analytical comparison of gallbladder stonescollected from a single patient: studies of five cases,” Med.Electron Microsc. 37, 130–140 (2004).
10. A. T. Al-Kinani, I. A. Harris, and D. E.Watt, “Analysis of minorand trace elements in gallstones by induction of characteristicionizing radiation,” Phys. Med. Biol. 29, 175–184 (1984).
11. C. Paluszkiewicz, M. Galka, W. Kwiatek, A. Parczewski, andS. Walls, “Renal stone studies using vibrational spectroscopyand trace elemental analysis,” Biospectroscopy 3, 403–407(1997).
12. A. Rodges, L. Barbour, B. Pougnet, C. Lombard, and R. Ryall,“Urinary element concentrations in kidney stone formers andnormal controls: the weekend effect,” J. Trace Elem. Electro-lytes Health Dis. 8, 87–91 (1994).
13. C. Koeberl and P. M. Bayer, “Concentrations of rare earth ele-ments in human brain tissue and kidney stones determined byneutron activation analysis,” J. Alloys Compd. 180, 63–70(1992).
14. J. Joost and R. Tessadri, “Trace element investigations in kid-ney stone patients,” Eur. Urol. 13, 264–270 (1987).
15. X. Fang, S. R. Ahmad, M. Mayo, and S. Iqbal, “Elemental ana-lysis of urinary calculi by laser induced plasma spectroscopy,”Lasers Med. Sci. 20, 132–137 (2005).
16. H. Perk, T. A. Serel, A. Kobar, N. Deniz, and A. Sayin, “Ana-lysis of the trace element contents of inner nucleus and outercrust parts of urinary calculi,” Urol. Int. 68, 286–290 (2002).
17. W. R. Premasiri, R. H. Clarke, and M. E. Womble, “Urine ana-lysis by laser Raman spectroscopy,” Laser Surg. Med. 28, 330–334 (2001).
18. J. Hofbauer, I. Steffan, K. Hobarth, G. Vujicic, H. Schwetz,G. Reich, and O. Zechner, “Trace elements and urinary stoneinformation: new aspects of the pathological mechanism of ur-inary stone formation [Erratum],” J. Urol. 148, 898–901(1992).
19. P. Chandran, P. Garg, and C. S. Pundir, “Correlation betweenchemical components of biliary calculi and bile & sera and bileof gallstone patients,” Ind. J. Clin. Biochem. 20, 81–85 (2005).
20. J. Salimi, K. Moosavi, and S. Vatankhah, “The concentrationof heavy trace elements in pigment and cholesterol humangallstones: comparative studies by PIXE analysis,” Iran. J.Radiat. Res. 1, 93–97 (2003).
21. I. Yamamoto, M. Itoh, S. Narimatsu, N. Suzuki, R. Demura,N. Kotani, and S. Tsukada, “Determination of metal content
G46 APPLIED OPTICS / Vol. 47, No. 31 / 1 November 2008
in three types of human gallstone,” Bull. Environ. Contam.Toxicol. 42, 1–8 (1989).
22. A. Kumar, F. Y. Yueh, J. P. Singh, and S. Burgess, “Character-ization of malignant tissue cells by laser-induced breakdownspectroscopy,” Appl. Opt. 43, 5399–5403 (2004).
23. C. Pasquini, J. Cortez, L. M. C. Silva, and F. B. Gonzaga,“Laser induced breakdown spectroscopy,” J. Braz. Chem.Soc. 18, 463–512 (2007).
24. J. P. Singh and S. N. Thakur, Laser Induced Breakdown Spec-troscopy (Elsevier Science, 2007).
25. A. K. Rai, V. N. Rai, F. Yu. Yueh, and J. P. Singh, “Laser-induced breakdown spectroscopy: a versatile technique for ele-mental analysis,” Trends Appl. Spectrosc. 4, 165–214 (2002).
26. A. W. Miziolek, V. Palleschi, and I. Schechter, Laser InducedBreakdown Spectroscopy: Fundamentals and Applications(Cambridge U. Press, 2006).
27. M. Corsi, G. Cristoforetti, M. Hidalgo, S. Legnaioli,V. Palleschi, A. Salvetti, E. Tognoni, and C. Vallebona, “Appli-cation of laser-induced breakdown spectroscopy technique tohair tissuemineral analysis,”Appl. Opt. 42, 6133–6137 (2003).
28. A. Ciucci, M. Corsi, V. Palleschi, V. Rastelli, A. Salvetti, andE. Tognoni, “A new procedure for quantitative elemental ana-lyses by laser-induced plasma spectroscopy,” Appl. Spectrosc.53, 960–964 (1999).
29. D. Bulajic, M. Corsi, G. Cristoforetti, S. Legnaioli, V. Palleschi,A. Salvetti, and E. Tognoni, “A procedure for correcting self-absorption in calibration-free laser induced breakdown spec-troscopy,” Spectrochim. Acta Part B 57, 339–353 (2002).
30. I. Borgia, L. Burgio, M. Corsi, R. Fantoni, V. Palleschi,A. Salvetti, M. C. Squarcialupi, and E. Tognoni, “Self-calibrated quantitative elemental analysis by laser-inducedplasma spectroscopy: application to pigment analysis,”J. Cultural Heritage 1, S281–S286 (2000).
31. V. S. Burakov, V. V. Kiris, P. A. Naumenkov, and S. N. Raikov,“Calibration-free laser spectral analysis of glasses and copperalloys,” J. Appl. Spectrosc. 71, 740–746 (2004).
32. M. Corsi, V. Palleschi, A. Salvetti, and E. Tognoni, “Calibra-tion free laser induced plasma spectroscopy: a new methodfor combustion products analysis,” Clean Air 3, 69–79 (2002).
33. O. Barthélemy, J. Margot, S. Laville, F. Vidol, M. Chaker,B. L. Drogoff, T. W. Johnston, and M. Sabsabi, “Investigationof the state of local thermodynamic equilibrium of a laser-produced aluminum plasma,” Appl. Spectrosc. 59, 529–536(2005).
34. F. Colao, R. Fantoni, V. Lazic, A. Paolini, F. Fabbri, G. G. Ori,L. Marinangeli, and A. Baliva, “Investigation of LIBS feasibil-ity for in situ planetary exploration: an analysis on Martianrock analogues,” Planet. Space Sci. 52, 117–123 (2004).
35. L. Fornarini, F. Colao, R. Fantoni, V. Lazic, and V. Spizzicchi-no, “Calibration analysis of bronze samples by nanosecondlaser induced breakdown spectroscopy: a theoretical andexperimental approach,” Spectrochim. Acta Part B 60,1186–1201 (2005).
36. B. Sallé, J. L. Lacour, P. Mauchien, P. Fichet, S. Maurice, andG. Manhes, “Comparative study of different methodologies forquantitative rock analysis by laser-induced breakdown spec-
troscopy in a simulated Martian atmosphere,” Spectrochim.Acta Part B 61, 301–313 (2006).
37. E. Tognoni, G. Cristoforetti, S. Legnaioli, V. Palleschi,A. Salvetti, M. Mueller, U. Panne, and I. Gornushkin, “Anumerical study of expected accuracy and precision incalibration-free laser-induced breakdown spectroscopy inthe assumption of ideal analytical plasma,” Spectrochim. ActaPart B 62, 1287–1302 (2007).
38. V. K. Singh, V. Rai, and A. K. Rai, “Variational study of theconstituents of cholesterol stones by laser-induced breakdownspectroscopy,” Lasers Med. Sci. DOI: 10.1007/s10103-007-0516-0.
39. A. K. Rai, F. Y. Yueh, J. P. Singh, and D. K. Rai, “Laser inducedbreakdown spectroscopy for solid and molten materials,” inLaser Induced Breakdown Spectroscopy, J. P. Singh andS. N. Thakur, ed. (Elsevier, 2007), pp. 255–284.
40. S. Pandhija and A. K. Rai, “Screening of brick-kiln area soil fordetermination of heavymetal Pb using LIBS,”Environ.Monit.Assess. DOI: 10.1007/s10661-008-0173-1.
41. S. Pandhija and A. K. Rai, “Laser induced breakdown spectro-scopy: a versatile tool for monitoring of traces in materials,”Pramana J. Phys. 70, 553–563 (2008).
42. N. K. Rai and A. K. Rai, “LIBS—an efficient approach for thedetermination of Cr in industrial wastewater,” J. Hazard.Mater. 150, 835–838 (2008).
43. R. A. Berhoft, C. A. Pellegrini, R. W. Motson, andL. W. Way, “Composition and morphologic and clinicalfeatures of common duct stones,” Am. J. Surg. 148, 77–85(1984).
44. B. W. Trotman, J. D. Ostrow, and R. D. Soloway, “Pigment vs.cholesterol cholelithiasis: comparison of stone and bile compo-sition,” Am. J. Dig. Dis. 19, 585–590 (1974).
45. J. S. Wel, H. M. Huang, W. C. Shyu, and C. S. Wu, “Simple en-zymatic determination of total cholesterol in gallstones,” Clin.Chem. 35, 2247–2249 (1989).
46. N. Suzuki, Y. Nakamura, N. Kobayashi, and T. Sato, “Onmetalelements in pure pigment gallstones,” Tohoku J. Exp. Med.116, 233–240 (1975).
47. Q. Peng, J. G. Wu, R. D. Soloway, T. D. Hu, W. D. Huang,Y. Z. Xu, L. B. Wang, X. F. Li, W. H. Li, D. F. Xu, andG. X. Xu, “Periodic and chaotic precipitation phenomena inbile salt system related to gallstone formation,” Biospectro-scopy 3, 195–205 (1997).
48. J. M. Donovan, “Physical and metabolic factors in gallstonepathogenesis,” Gastroenterol. Clin. North Am. 28, 75–97(1999).
49. NIST Atomic Spectra Database, http://physics.nist.gov/PhysRefData/ASD/lines_form.html.
50. H. R. Griem, Plasma Spectroscopy (McGraw-Hill, 1964).51. W. H. Li, G. R. Shen, R. D. Soloway, Z.-L. Yang, X.-B. Tong ,
E. Wu , D.-F. Xu, J. G. Wu, and G.-X. Xu, “Copper bilirubinateand black pigment gallstone,” Biospectroscopy 1, 149–156(1995).
52. W. Chua-anusorn, T. G. St. Pierre, J. Webb, K. Wang, andJ. F. Lu, “The form of iron in pigment gallstones,” HyperfineInteract. 91, 911–916 (1994).
1 November 2008 / Vol. 47, No. 31 / APPLIED OPTICS G47
Related Documents