Ethology, 76, 101-115 (1987) 0 1987 Paul Parey Scientific Publishers, Berlin and Hamburg ISSN 0179-1613 The Rockefeller University Field Research Center, Millbrook Quantitative Analysis of Animal Vocal Phonology: an Application to Swamp Sparrow Song CHRISTOPHER W. CLARK, PETER MARLER & KIMBEEMAN With 9 figures Receiaed: November 17, 1986 Accepted: January 14, 1987 (G. M. Burghardt) Abstract Sound spectrograms have been a traditional method for comparing animal vocalizations and demonstrating their similarities or differences, but quantification of the comparative process has been difficult. This lack of quantification has hindered progress in documenting the timing and degree of song development in song birds. With this in mind, computer-based methods for sound comparison and sound averaging were developed. These methods utilize a numerical representation of a sound’s frequency-time structure to compute a similarity value between any two sounds and an average sound spectrogram for a set of sounds. These analytical techniques were applied to an analysis of song notes of the swamp sparrow (Mefospizageorgiana). The results demonstrate the usefulness of the methods and reveal new details in the description of the swamp sparrow’s set of species-universal note types and in the decrease of note variability during the course of developmental transitions from subsong, through plastic song to song crystallization. Introduction One common approach in the analysis of animal vocalizations is to compare sounds in order to describe and ultimately explain the biological significance of their similarities or differences. Techniques for comparing animal sounds range from subjective impressions based on visual inspection of sound spectrograms (e.g. STRUHSAKER 1967; BAKER 1974; PAYNE 1985) to more objective methods such as multivariate analysis (e.g. SYMMES et a]. 1979; MARTINDALE 1980; CLARK 1982). Sorting spectrograms by eye can be a reliable means of categorization, but the features upon which the sorting is based are often unspecified and intuitive (BORROR 1965; LEMON 1965; KROODSMA 1974; MUNDINGER 1975). Such compari- sons are liable to vary between observers and are insensitive to subtle differences U.S. Copyright Clearance Center Codr ~tatrnient 01 79-1 61 3/87/7602-0101$02.50/0

Welcome message from author
This document is posted to help you gain knowledge. Please leave a comment to let me know what you think about it! Share it to your friends and learn new things together.
Transcript
Ethology, 76, 101-115 (1987) 0 1987 Paul Parey Scientific Publishers, Berlin and Hamburg ISSN 0179-1613
The Rockefeller University Field Research Center, Millbrook
Quantitative Analysis of Animal Vocal Phonology: an Application to Swamp Sparrow Song
CHRISTOPHER W. CLARK, PETER MARLER & KIM BEEMAN
With 9 figures
Receiaed: November 17, 1986
Accepted: January 14, 1987 (G. M . Burghardt)
Abstract
Sound spectrograms have been a traditional method for comparing animal vocalizations and demonstrating their similarities o r differences, but quantification of the comparative process has been difficult. This lack of quantification has hindered progress in documenting the timing and degree of song development in song birds. With this in mind, computer-based methods for sound comparison and sound averaging were developed. These methods utilize a numerical representation of a sound’s frequency-time structure to compute a similarity value between any two sounds and an average sound spectrogram for a set of sounds. These analytical techniques were applied to an analysis of song notes of the swamp sparrow (Mefospiza georgiana). The results demonstrate the usefulness of the methods and reveal new details in the description of the swamp sparrow’s set of species-universal note types and in the decrease of note variability during the course of developmental transitions from subsong, through plastic song to song crystallization.
Introduction
O n e common approach in the analysis of animal vocalizations is to compare sounds in order to describe and ultimately explain the biological significance of their similarities o r differences. Techniques for comparing animal sounds range from subjective impressions based on visual inspection of sound spectrograms (e.g. STRUHSAKER 1967; BAKER 1974; PAYNE 1985) to more objective methods such as multivariate analysis (e.g. SYMMES et a]. 1979; MARTINDALE 1980; CLARK 1982).
Sorting spectrograms by eye can be a reliable means of categorization, but the features upon which the sorting is based are often unspecified and intuitive (BORROR 1965; LEMON 1965; KROODSMA 1974; MUNDINGER 1975). Such compari- sons are liable to vary between observers and are insensitive to subtle differences
U.S. Copyright Clearance Center Codr ~ t a t r n i e n t 01 79-1 61 3/87/7602-0101$02.50/0
102 CHRISTOPHI K w. CLAKh, 1’1 I I K MAKLLK & KIM BEEMAN
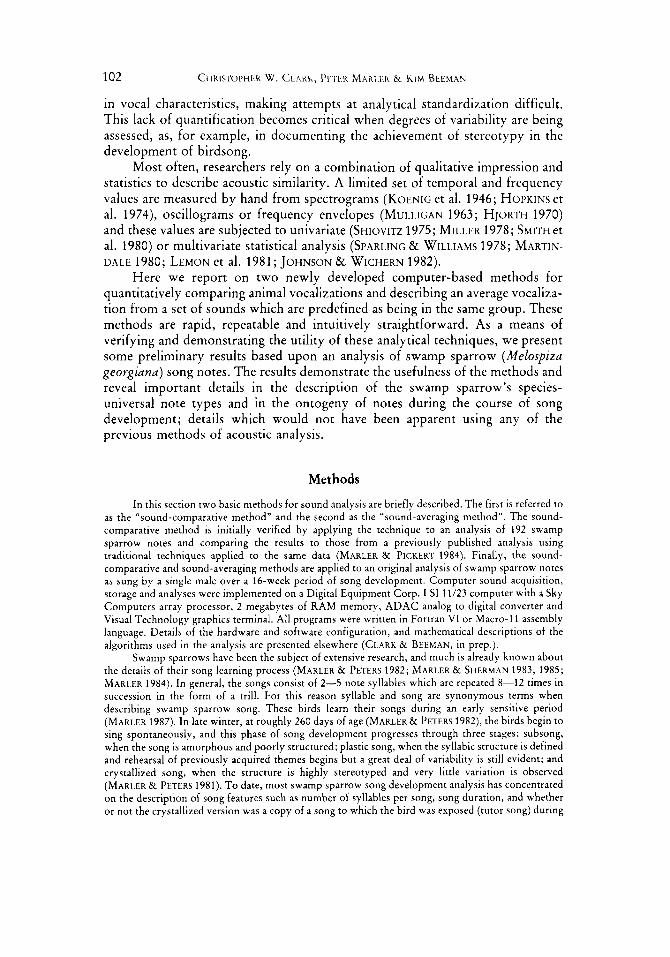
in vocal characteristics, making attempts at analytical standardization difficult. This lack of quantification becomes critical when degrees of variability are being assessed, as, for example, in documenting the achievement of stereotypy in the development of birdsong.
Most often, researchers rely on a combination of qualitative impression and statistics to describe acoustic similarity. A limited set of temporal and frequency values are measured by hand from spectrograms (KOENIG et al. 1946; HOPKINS et al. 1974), oscillograms or frequency envelopes (MULLIGAN 1963; HJORTH 1970) and these values are subjected to univariate (SHIOVITZ 1975; MILLER 1978; SMITH et a]. 1980) or multivariate statistical analysis (SPARLING & WILLIAMS 1978; MARTIN-
Here we report on two newly developed computer-based methods for quantitatively comparing animal vocalizations and describing an average vocaliza- tion from a set of sounds which are predefined as being in the same group. These methods are rapid, repeatable and intuitively straightforward. As a means of verifying and demonstrating the utility of these analytical techniques, we present some preliminary results based upon an analysis of swamp sparrow (Melospzza geovgiuna) song notes. The results demonstrate the usefulness of the methods and reveal important details in the description of the swamp sparrow’s species- universal note types and in the ontogeny of notes during the course of song development; details which would not have been apparent using any of the previous methods of acoustic analysis.
DALE 1980; LEMON et a]. 1981; JOHNSON & WICHERN 1982).
Methods
In this section two basic methods for sound analysis are briefly described. The first is referred to as the “sound-comparative method” and the second as the “sound-averaging method”. The sound- comparative method is initially verified by applying the technique to an analysis of 192 swamp sparrow notes and comparing the results to those from a previously published analysis using traditional techniques applied to the same data (MARLER & PICKERT 1984). Finally, the sound- comparative and sound-averaging methods are applied to an original analysis of swamp sparrow notes as sung by a single male over a 16-week period of song development. Computer sound acquisition, storage and analyses were implemented on a Digital Equipment Corp. LSI 11/23 computer with a Sky Computers array processor, 2 megabytes of RAM memory, ADAC analog to digital converter and Visual Technology graphics terminal. All programs were written in Fortran VI or Macro-1 1 assembly language. Details of the hardware and software configuration, and mathematical descriptions of the algorithms used in the analysis are presented elsewhere (CLARK & BEEMAN, in prep.).
Swamp sparrows have been the subject of extensive research, and much is already known about the details of their song learning process (MARLER & PETERS 1982; MARLER & SHERMAN 1983, 1985; MARLER 1984). In general, the songs consist of 2-5 note syllables which are repeated 8-12 times in succession in the form of a trill. For this reason syllable and song are synonymous terms when describing swamp sparrow song. These birds learn their songs during an early sensitive period (MARLER 1987). In late winter, at roughly 260 days of age (MARLER & PETERS 1982), the birds begin to sing spontaneously, and this phase of song development progresses through three stages: subsong, when the song is amorphous and poorly structured; plastic song, when the syllabic structure is defined and rehearsal of previously acquired themes begins but a great deal of variability is still evident; and crystallized song, when the structure is highly stereotyped and very little variation is observed (MARLER & PETERS 1981). To date, most swamp sparrow song development analysis has concentrated on the description of song features such as number of syllables per song, song duration, and whether o r not the crystallized version was a copy of a song to which the bird was exposed (tutor song) during

Quantitative Analysis of Animal Vocal Phonology
Q 11-4 t3 i 1-14 t r l ~~
L
100 200 OJ " I ' ! ' ' ' I I 0
103
Fig. f ; Illustration of computer spectrograms for three swamp sparrow syllables as sung in week 39 (A) and week 45 (B and C) of song development for the same male. Right: the two correlation
functions resulting from the two-dimensional correlations of matrices A and B, and B and C
its sensitive period. An initial swamp sparrow note analysis has shown that there are approx. 6 general, species-universal note types, referred to as note types I-VI (MARLER & PICKERT 1984). Prior to this report there has been no analysis which quantitatively describes the development of song notes in any passerine species.
Sound-Comparative Method
The underlying idea for the sound comparative method is that a full representation of a sound's frequency-time structure, rather than a few of its acoustic features, better serves the analytical process. This idea is reminiscent of the notion of behavioral gestalt as developed by K o H L E R ( ~ ~ ~ ~ ) . Although the idea of using the entire sound for comparison is not new (see, for example, BIRTRAM 1970; GOEL)EKING 1983; MII.I.ER 1979; PICKSTOCK et al. 1980), automation of the process has not been previously implemented.
Sounds to be compared are acquired from tape recordings and stored as digitized waveforms in the computer. Using the computer, sounds are transformed into digital spectrograms using standard time-dependent Fourier transform techniques (see OPPENHEIM 1978, for a review). This process yields a set of discrete frequency spectra taken at successive time intervals over the duration of the signal, and the resultant spectrogram is a 51 x 100 matrix with time and frequency as rows and columns in the matrix, respectively, and signal energy o r RMS amplitude as the matrix contents. In the present work the digital sampling rate is 25 kHz and a 256 point transform is performed. This results in an overall matrix bandwidth of 10 kHz with a frequency resolution of 196 Hz and a temporal resolution of
104 CHRISTOPHER w . CLARh, I’LTLR M A K L ~ K o( KIM BEEMAN
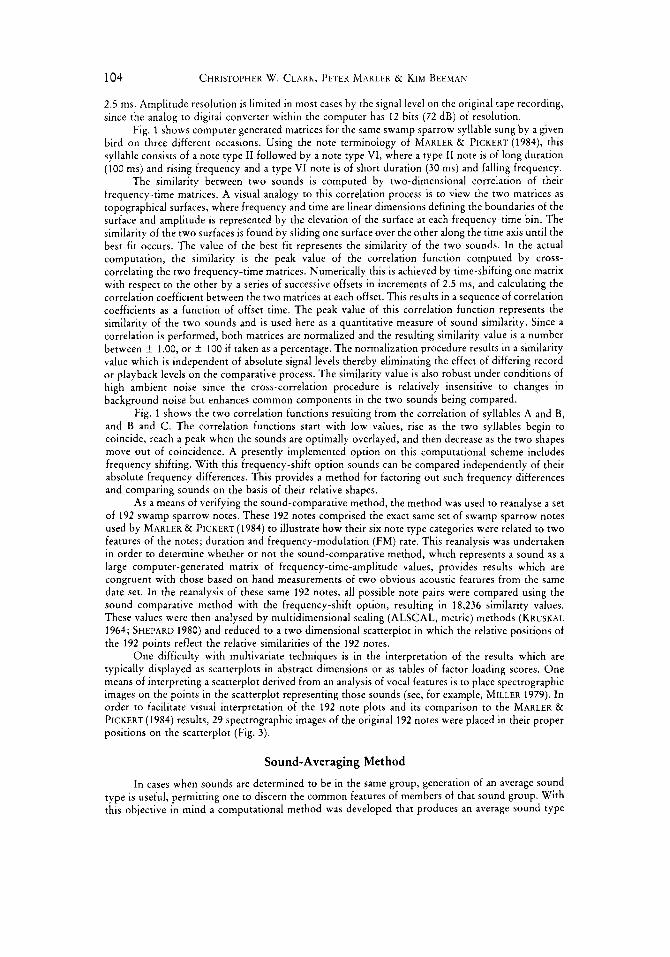
2.5 ms. Amplitude resolution is limited in most cases by the signal level on the original tape recording, since the analog to digital converter within the computer has 12 bits (72 dB) of resolution.
Fig. 1 shows computer generated matrices for the same swamp sparrow syllable sung by a given bird on three different occasions. Using the note terminology of MARLER & PICKERT (1984), this syllable consists of a note type I1 followed by a note type VI, where a type I1 note is of long duration (100 ms) and rising frequency and a type VI note is of short duration (30 ms) and falling frequency.
The similarity between two sounds is computed by two-dimensional correlation of their frequency-time matrices. A visual analogy to this correlation process is to view the two matrices as topographical surfaces, where frequency and time are linear dimensions defining the boundaries of the surface and amplitude is represented by the elevation of the surface at each frequency-time bin. The similarity of the two surfaces is found by sliding one surface over the other along the time axis until the best fi t occurs. The value of the best fit represents the similarity of the two sounds. In the actual computation, the similarity is the peak value of the correlation function computed by cross- correlating the two frequency-time matrices. Numerically this is achieved by time-shifting one matrix with respect to the other by a series of successive offsets in increments of 2.5 ms, and calculating the correlation coefficient between the two matrices at each offset. This results in a sequence of correlation coefficients as a function of offset time. The peak value of this correlation function represents the similarity of the two sounds and is used here as a quantitative measure of sound similarity. Since a correlation is performed, both matrices are normalized and the resulting similarity value is a number between ? 1.00, o r f 100 if taken as a percentage. The normalization procedure results in a similarity value which is independent of absolute signal levels thereby eliminating the effect of differing record o r playback levels on the comparative process. The similarity value is also robust under conditions of high ambient noise since the cross-correlation procedure is relatively insensitive to changes in background noise but enhances common components in the two sounds being compared.
Fig. 1 shows the two correlation functions resulting from the correlation of syllables A and B, and B and C. The correlation functions start with low values, rise as the two syllables begin to coincide, reach a peak when the sounds are optimally overlayed, and then decrease as the two shapes move out of coincidence. A presently implemented option on this computational scheme includes frequency shifting. With this frequency-shift option sounds can be compared independently of their absolute frequency differences. This provides a method for factoring out such frequency differences and comparing sounds on the basis of their relative shapes.
As a means of verifying the sound-comparative method, the method was used to reanalyse a set of 192 swamp sparrow notes. These 192 notes comprised the exact same set of swamp sparrow notes used by MARLER & PICKERT(1984) to illustrate how their six note type categories were related to two features of the notes; duration and frequency-modulation (FM) rate. This reanalysis was undertaken in order to determine whether o r not the sound-comparative method, which represents a sound as a large computer-generated matrix of frequency-time-amplitude values, provides results which are congruent with those based on hand measurements of two obvious acoustic features from the same date set. In the reanalysis of these same 192 notes, all possible note pairs were compared using the sound comparative method with the frequency-shift option, resulting in 18,236 similarity values. These values were then analysed by multidimensional scaling (ALSCAL, metric) methods (KRUSKAL 1964; SHEPARD 1980) and reduced to a two dimensional scatterplot in which the relative positions of the 192 points reflect the relative similarities of the 192 notes.
O n e difficulty with multivariate techniques is in the interpretation of the results which are typically displayed as scatterplots in abstract dimensions o r as tables of factor loading scores. O n e means of interpreting a scatterplot derived from an analysis of vocal features is to place spectrographic images on the points in the scatterplot representing those sounds (see, for example, MILLER 1979). In order to facilitate visual interpretation of the 192 note plots and its comparison to the MARLER & PICKERT (1984) results, 29 spectrographic images of the original 192 notes were placed in their proper positions on the scatterplot (Fig. 3).
Sound-Averaging Method
In cases when sounds are determined to be in the same group, generation of an average sound type is useful, permitting one to discern the common features of members of that sound group. With this objective in mind a computational method was developed that produces an average sound type

Quantitative Analybi, ot Animal Voc.11 Phonology 105
from any given set of sounds. This averaging process is accomplished by optimally aligning the set of frequency-time matrices using the sound-comparative method, summing the matrices, and dividing the resultant summed matrix by the number of sounds in the set. The end result is an average sound matrix which represents the average sound type for the set and which can be displayed in a visual spectrographic format identical to that used for displaying individual sounds.
Note Development Analysis The methods of sound comparison and averaging were applied to an analysis of the notes in one
song type of an individual male swamp sparrow. This song was acquired by the male from tape recordings heard early in life between 20-60 days of age and sung over the course of song development. The song consisted of repetitions of a two note syllable composed of a note type I1 and a note type VI (see Fig. 1). This song type was sampled in 9 periods covering the 16 weeks from subsong through crystallized song, beginning at 36 weeks of age. 10 random syllables per period were taken, resulting in 10 note type I1 samples and 10 note type VI samples for each of the 9 periods. To track a note’s development relative to its crystallized form, all 10 notes from a sampling period were compared to the 10 notes from the final crystallized song using the sound-comparative method without the frequency-shift option. The comparison of 10 notes from one period with the 10 crystallized notes of the final period resulted in 100 correlation values. These were reduced to an average and standard deviation correlation value for each sampling period. This average correlation value represents the degree of similarity between crystallized notes and renditions of that same note type as sung during an earlier developmental period; the standard deviation is indicative of the precision with which those notes were sung.
To track a note’s development relative to the tutor version of that note a similar procedure was followed except that here the ten notes from a developmental period were compared to all 8 versions of that note in the tutor song. The time sequence of average note correlations and standard deviations resulting from the comparative analysis will be referred to as a “note development profile”. Relative to crystallized notes and tutor notes, these profiles will be referred to as crystallized and tutor profiles, respectively.
In order to illustrate the development of the two note types as produced in each of the 9 sampling periods, all 10 versions of a note for a sampling period were merged into an average note using the sound-averaging method. Each average note for a sampling period was then plotted as a spectrogram. The sequence of average note spectrograms, representing the development of the note from subsong through crystallized song in the visual format, serves to complement the quantitative results based on a comparative analysis of the same notes.
Results
The results are presented in two sections. The first describes the results from reanalysis of the 192 swamp sparrow notes. The second describes the results of the developmental analysis of the two notes from the song of a single male swamp sparrow.
Reanalysis of 192 Swamp Sparrow Notes Fig. 2 A shows the scatterplot of the 192 swamp sparrow notes as replotted
from the original MARLER & PICKERT (1984) data. Fig. 2 B shows the same plot with 29 of the points in Fig. 2 A represented by their spectrographic images. These figures show three general note groups; notes with positive slope and a wide range of durations (note types IB, I C and II), notes with negative slope and a wide range of durations (note types IA, VI and V), and notes with very little slope, either positive or negative, and of intermediate durations (note type 111).
Ethology. Vol. 76 (2) 8

106 CHRISTOPHER w. CI AKh, 1’1 I I K blAK11 K & KIbt BFEMAN
* 2 0-
t l O ’
Fzg. 2: A. Scatterplot ot 192 swamp spar- row notes (replotted from MARLER & PICKERT 1984). B. Spectrograms of 29 of
positions in the scatterplot
I B/c . . I
. I I . .!” :. . . ...... . . . . . . . . . . the original notes placed on their proper . . _.
111 O I . .
- J o . I A
1
A
B
I . . . . . . . 10 100
Note durotion (ms)
Fig. 3 A shows the two-dimensional scatterplot resulting from a mul- tidimensional scaling analysis on the 18,236 similarity values as computed using the sound-comparative method on the 192 swamp sparrow notes (rZ = 0.71, stress = 0.23). Fig. 3B shows the same plot with 29 of the points replaced with their spectrographic images. These figures show that the 192 notes fall on a continuum with certain types more common than others. This continuum can be viewed as a circle with four major note groups. A note’s position on the circle appears to be primarily dependent on its duration and FM rate, both diagnosed by MARLER& PICKERT (1984) as salient features for note type classification; notes in the lower righthand half of the circle are of short duration with rapid FM, while notes in the upper lefthand half of the circle are longer in duration and have slower FM.
Figs. 2 and 3 are quite similar. The apparent divergence in Fig. 2 of note type IA and IB/C is the result of using note slope as one of the acoustic dimensions. If the inverse of note slope were used, note types IA and IB/C would

(Y
c u - c 0
a,
.- 2 0
n - E .-
cy I
(Y
c u - c 0 .- 2 0
n -
a, E .-
(Y I
Quantitative Analysis of Animal Vocal Phonology 107
A
................
I I
. / v . ... . . :.+. .. . . . . . . *
. . . ."-n . . . ............... ? ..................................... ... .... . *. 0 . : .. .... . .
. . IB/c* *
- *- ... i ....................... * ..................................... ... .. . . . . ... .. : . ~. 4
.. ...... .. :* .: . * I P
- 2 -1 0 1 2 Dimension 1
B
, . .....................................................................
I ' I /
I
I
- 2 -1
I \ 1 I '
I '
1 2 Dimension 1
Fzg. 3: A. Two-dimensional scatterplot from the multidimensional scaling analysis of 1 X,236 pairwise comparisons between 192 swamp sparrow notes. B. Spectrograms of 29 of the original notes
placed on their proper positions in the scatterplot
converge in an apparent continuum, as they do in Fig. 3. The concurrence of the results from these two analyses demonstrates that the sound-comparative method yields results which, although different in details, are basically in agreement with those derived by the traditional method of hand measurement of sound spectrog- rams. This would indicate that for these types of simple FM notes, the sound- comparative method is a useful means of describing similarity between notes.
Note Development Analysis
Fig. 4 shows the crystallized profile for note type 11. This figure defines in quantitative terms how well the bird sang note type I1 throughout the 16-week period of song development relative to the final crystallized version of that note
::

108 CHRISTOPHER W. CLARK, PETER MARLER & KIM BEEMAN
l0L 0
36 37
J
Plastic
Fig. 4: Crystallized profile for note type 11 for a single male swamp sparrow. The profile shows the basic statistics for 9 of the 16 4
71
01 I i 1J
Crystallized
weekly periods of song develop- ment (see text for details). The computer-averaged crystallized note type I1 for week 52 is shown as an inset. Black dots: average corre- lation values; ends of rectangles: S. D. distances; ends of bars: min.
and max. ranges
1 8 39 40 41 42 43 44 45 46 47 48 49 50 51 52
Age (weeks)
type. This is essentially a learning curve for acquisition of the skill of motor production of the note. In week 36, for example, the average similarity between subsong notes produced at that age and final crystallized notes produced in week 52 is 38 f S.D. 13 %. When the final crystallized notes are compared to themselves, the average similarity is 92 & S.D. 3 YO. Two significant features of this plot are: I ) the most rapid period of change from 38 % to 79 %, indicative of rapid learning and convergence toward the crystallized type, occurs over a 2-3- week period during early phases of plastic song (weeks 3 7 4 0 ) , and 2) there is a steady improvement in the precision with which the note is sung, indicated by the diminishing size of the standard deviation from 13 % to 3 %.
Fig. 5 illustrates this quantitative profile of note development in a visual format. Here one can clearly see the improvement in note structure with time; the average notes in subsong are smeared and less distinct, the average notes in plastic song are more defined, and the notes in late plastic and crystallized song embody the flourishes or improvizations which the bird imparts to the note in its final form (e.g. the slight inflection at the end of the note). Fig. 5 also demonstrates the potential of the sound-averaging technique to visually reinforce what the quan- titative results display: the most dramatic change in note structure occurs over the 2-3-week period between subsong and plastic song.
Fig. 6 shows the tutor profile for note type I1 together with the crystallized profile for purposes of comparison. This figure shows that as song development proceeds through plastic song, the note type 11’s as sung by the bird, although clearly originating as imitations of the tutor note, become less similar to the tutor notes as crystallization proceeds. The pattern of development for this note type I1

Quantitative Analysis of Animal Vocal Phonology 109
10-
Fzg. 5: Sequence of average note type 11’s computed for each of 9 weekly sampling periods (num-
Sub Plarllc Crystallized
I I I I 38 Plastic song I 136 i 37 I 1 Subsong - - -
bers 36-52 refer to the age of the bird in weeks) covering the three stages of song development for a single swamp sparrow. These
same notes used to compute the crystallized profile in Fig. 4
averages were computed from the ‘ F I
Plasttc song Plastic song ! 1 1 -
‘0°1 90
20-
n H
Plastic sy jl ~~ f Crystallized song
01 I
B
Age (weeks)
= Tutor 1 = Crystallized
Fig. 6: Tutor profile and crystal- lized profile for note type 11 for a single swamp sparrow. The compu- ter-averaged tutor note type 11 is
shown as an inset

110
100-
90 -
80-
70.
60
30 40 50#
20.
10-
CtiRI5TOPHER w. cl .\Kh, PLTER MhKl I R & KIM BLEMAN
]: Sub
0- 36 3
7-
kHz .
ji Plastic
's 39 40 41 42 43
I: I Crystallized
45 46 47 48 49 50 51 52
Fig. 7: Crystallized profile for note type VI for a single swamp sparrow. The profile shows the basic statistics for 9 of the 16 weekly periods of song develop- ment, The computer-averaged crystallized note type VI for week 52 is shown as an inset. Black dots: average correlation values; ends of rectangles: S. D. dis- tances; ends of bars: min. and
max. ranges
Age (weeks)
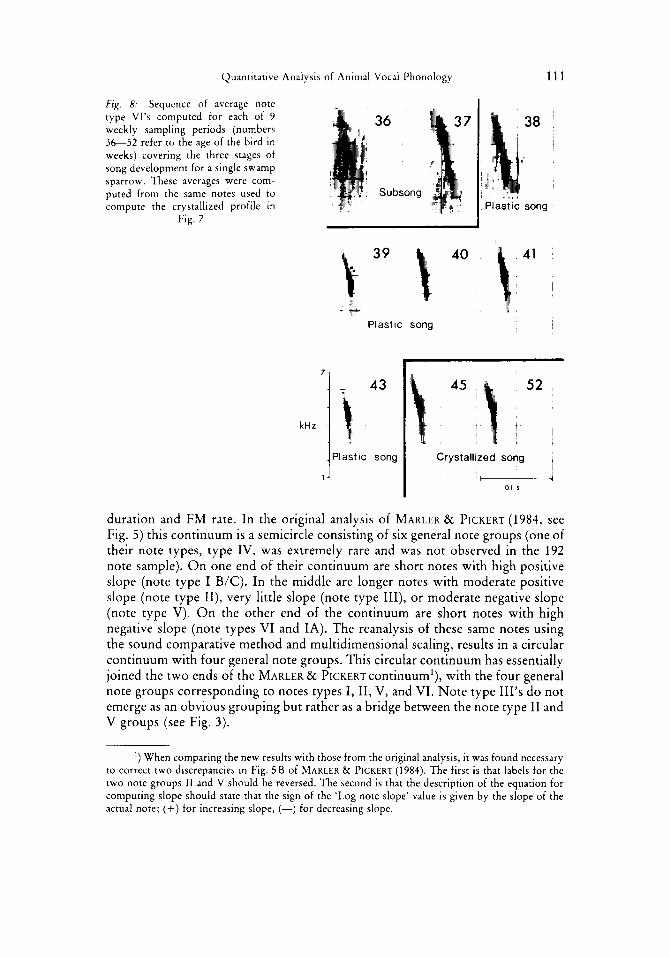
is somewhat different from that of the song's other component, a note type VI, as shown in Figs. 7 and 8. For note type VI there is no sharp development in the note occurring between subsong and early plastic song. Instead, there is a gradual development over a 5-6-week period that includes all of the plastic song period. The final average correlation value for note type VI is only 73 O/O compared to 92 YO for note type 11. Also, the precision with which note type VI is produced does not improve very much; it begins at 11 % in subsong and decreases to only 7 % by final crystallized song.
Fig. 9 illustrates the tutor profile for note type VI together with the crystallized profile. This figure shows that during song development the note type VIs as sung by the bird are only slightly less similar to the tutor notes than to the crystallized notes.
Discussion
The two computer analysis methods presented here yield results which both confirm those derived from previous studies by other methods and also provide new insights into a biologically complex process at a level of detail which was not previously possible.
The reanalysis of 192 swamp sparrow notes using the computer method of sound comparison not only confirms MARLER & PICKERT'S (1984) finding that swamp sparrow notes can be arranged in groups, with certain note types more common than others, but also shows that the groupings are not discrete but form a continuum. This continuum can basically be described by changes in note
Quantitative Analysis of Animal Vocal Phonology 111
Fig. 8: Sequence of average note type Vl’s computed for each of 9 weekly sampling periods (numbers 3 6 5 2 refer to the age of the bird in weeks) covering the three stages of song development for a single swamp sparrow. These averages were com- puted from the same notes used to compute the crystallized profile in
Fig. 7
Plastic song
1 ..., Plastic song
1 Crystallized song - I 01 s
Plastic song
duration and FM rate. In the original analysis of MARLER & PICKERT (1984, see Fig. 5) this continuum is a semicircle consisting of six general note groups (one of their note types, type IV, was extremely rare and was not observed in the 192 note sample). O n one end of their continuum are short notes with high positive slope (note type I B/C). In the middle are longer notes with moderate positive slope (note type 11), very little slope (note type 111), or moderate negative slope (note type V). O n the other end of the continuum are short notes with high negative slope (note types VI and IA). The reanalysis of these same notes using the sound comparative method and multidimensional scaling, results in a circular continuum with four general note groups. This circular continuum has essentially joined the two ends of the MARLER EL PICKERT continuum’), with the four general note groups corresponding to notes types I, 11, V, and VI. Note type 111’s do not emerge as an obvious grouping but rather as a bridge between the note type 11 and V groups (see Fig. 3).
’) When comparing the new results with those from the original analysis, it was found necessary to correct two discrepancies in Fig. 5 B of MARLER & PICKERT (1984). The first is that labels for the two note groups 11 and V should be reversed. The second is that the description of the equation for computing slope should state that the sign of the ‘Log note slope’ value is given by the slope of the actual note; (+) for increasing slope, (-) for decreasing slope.

100.
90‘
80
n 70 . s W
c 60‘
z so.
8
0 .- - ?! 40.
30-
20-
10-
0 36 37
-
. > i )
, \
CHRISTOPHER w. CLAKh. 1’1 T L K MAKLLK & KIM BEEMAN
Plastic
I 39 40 41 42 43
Cr yrta llized
45 46 47 48 49 50 51 52
Fig. 9: Tutor profile and crystal- lized profile for note type VI for a single swamp sparrow. The compu- ter-averaged tutor note type VI is
shown as an inset
Age (weeks)
1 = Tutor [ = Crystallized
Typically swamp sparrow syllables begin and end with short duration, rapid FM notes. Long duration, slow FM notes typically occur in the middle of syllables. Bearing this note sequence in mind, and viewing Fig. 3 as an acoustic map of note distance, syllables appear to be constructed so as to maximize the acoustic distances between successive notes. This would suggest that song types are selected in part on the basis of acoustic contrast between successive notes, an idea similar to the notion of antimonotony as originally discussed by HARTS- HORNE (1956) and more recently by WHITNEY (1981).
The application of the sound-comparative and sound-averaging methods to note development analysis yield quantitative results which are in keeping with descriptions of the song development process (MARLER & PETERS 1981, 1982) in which qualitative interpretation of song development was based on visual inspec- tion of spectrograms and the ‘presence or absence of syllabic structure and on the relative stability of syllabic morphology. . .’ (MARLER & PETERS 1982). The results of the present note analysis indicate that note development does not progress at the same rate or with the same precision for different notes in the same song. In the male swamp sparrow studied, note type I1 developed very rapidly and crystallized into a highly stereotypic form. Note type VI developed slowly and crystallized into a more variable form. This contrast is particularly interesting in light of the evidence on song development for swamp sparrows raised in isolation (no tutoring during the early sensitive period) which demonstrated that such birds will sing songs composed of note VI trills but never produce note 11’s (or any of the longer, slower FM note types) (MARLER & SHERMAN 1985). One

Quantitative Analysis of Animal Vocal Phonology 113
interpretation of the isolation experiments and the results on note development presented here is that note type VI is an innate type on which the bird does not devote much effort toward learning, while the longer note types (e.g. type 11) for which there is perhaps a less specific innate sensorimotor pattern, require prior acquisition of a learned model for proper development.
Another interpretation as to why note VI shows such poor development is that, while the bird is attempting to learn to reproduce the note, it lacks control over the note’s features. This might indeed be the case since detailed inspection of note VI variability reveals that it is due to variation in the note’s spectral content not its duration or FM rate. This suggests that a male swamp sparrow may lack the ability to control spectral features on a moment by moment basis at this degree of temporal detail (2 .5 ms), although there is evidence to support the idea that the birds do possess this degree of temporal resolution at the perceptual level (DOOLING 1980, 1982).
When developing notes were tracked relative to the tutor notes instead of the crystallized notes, different patterns emerged for the two note types. The tutor and crystallized profiles for note type VI were similar (Fig. 9) except for the late plastic and crystallized periods when the bird’s notes were shifted down by ca. 200 Hz compared to tutor notes. For note type 11, however, the tutor profile was different from the crystallized profile: starting in the fourth week (at 39 weeks of age) of song rehearsal the two profiles diverged as the bird sang notes that were increasingly more similar to the eventual crystallized notes (and to themselves) than they were to the tutor. By the end of crystallization the type I1 notes sung by the bird were no more similar to the notes on which it was tutored than they were to the notes it sang in early plastic song. One obvious difference between the crystallized and tutor notes was in note duration: the 8 tutor notes were, on average, 15 % longer (138 vs. 120 ms) than the 10 crystallized notes. Further analysis and inspection of notes sung in the third to fifth weeks of song rehearsal (at 3 8 4 0 weeks of age) reveal that during this period the bird was singing two general note morphs; one similar to the crystallized note form and one similar to the tutor note form. The presence of both morphs can be seen as a bifurcation in the ending of the average note for week 39 as shown in Fig. 5. This result suggests that we are perhaps witnessing the vocal manifestations of two competing motor patterns, with one pattern more strictly rooted in early auditory experience than the other.
The results from the application of these methods to the investigation of birdsong ontogeny are novel in that they provide quantitative evidence of aspects of phonological development which have previously been qualitatively described or suspected but could not be quantified. The analytical tools of sound-compari- son and sound-averaging now provide a means of answering specific questions related to the development of a complex behavior from its origins to its final production. These same tools are also generally applicable to a broad range of bioacoustical studies where quantification of phonological structure is required.

114 CHRISTOPHER w . CLAKh, PFTER MARLFR & KIM BEEMAN
Acknowledgements
We wish to thank Susan PETERS and Virginia SHERMAN for their help in editing the song recordings. Susan BROWN and Robert DOOLING made significant contributions in the multidimen- sional scaling analysis. Helpful comments and criticisms were provided by Alfred DUFTY, Douglas NELSON, Steven NowlcKI, and two anonymous reviewers. This research was supported by grant number BNS-8411766, MH14651 and in part by BRSG SO7 RR07065 awarded by the Biomedical Research Support Grant Program, Division of Research Resources, N.I.H.
Literature Cited
BAKER, M. C., 1974: Genetic structure of two populations of white-crowned sparrows with different
BERTRAM, B., 1970: The vocal behavior of the Indian hill mynah, Gruculu religiosu. Anim. Behav.
BORROR, D. J., 1965: Song variation in Maine song sparrows. Wilson Bull. 77, 5-37. CLARK, C. W., 1982: The acoustic repertoire of the southern right whale, a quantitative analysis.
Anim. Behav. 30, 1060-1071. DOOLING, R. J., 1980: Behavior and psychophysics of hearing in birds. In: Comparative Studies on
Hearing in Vertebrates. (POPPER, A. N., & R. R. FAY, eds.) Springer-Verlag, New York,
_ _ , 1982: Auditory perception in birds. In: Acoustic Communication in Birds. Vol. 1.
GOEDEKING, P., 1983: A minicomputer-aided method for the pattern analysis of vocalizations of the
HARTSHORNE, C., 1956: The monotony-threshold in singing birds. Auk 73, 176-192. HJORTH, I., 1970: A comment on graphic displays of bird sounds and analyses with a new device, the
HOPKINS, C. D., M. ROSSETTO, & A. LUTJEN, 1974: A continuous sound spectrum analyser for
JOHNSON, R. A,, & D. W. WICHERN, 1982: Applied Multivariate Statistical Analysis. Prentice Hall,
KOENIG, W., H . K. DUNN, & L. Y. LACY, 1946: The sound spectrograph. J . Acoust. SOC. Am. 18,
KOHLER, W., 1929: Gestalt Psychology. Liveright, New York. KROODSMA, D. E., 1974: Song learning, dialects and dispersal in Bewick's wren. 2. Tierpsychol. 35,
KRUSKAL, J. B., 1964: Multidimensional scaling by optimizing goodness of fit to a non-metric
LEMON, R. E., 1965: Geographic variation in the song of cardinals. J. Zool. 44, 413-428. _- , J. STRUGER, M. J. LECHOWICZ, & R. F. NORMAN, 1981: Song features and singing heights of
American warblers: maximization or optimization of distance? J. Acoust. S O ~ . Am. 69, 1169-1176.
MARLER, P., 1984: Song learning: innate species differences in the learning process. In: The Biology of Learning. (MAKLER, P., & H. S. TERRACE, eds.). Dahlem Konf. 1984, Springer-Verlag, Berlin, pp. 289-309.
_ - , 1987: Sensitive periods and the role of specific sensory stimulation in birdsong learning. In: Imprinting and Cortical Plasticity. (RAUSCHENCKER, J. P., & P. MARLER, eds.). John Wiley & Sons, New York, pp. 99-135.
-_ , & S. PETERS, 1981: Sparrows learn adult song and more from memory. Science 213, 780-782. -_ , & - -, 1982: Subsong and plastic song: their role in the vocal learning process. In: Acoustic
Communication in Birds. Vol. 2. (KROODSMA, D. E., & E. H. MILLER, eds.). Acad. Press, New York, pp. 25-50.
-- , & R. PICKERT, 1984: Species-universal microstructure in the learned song of the swamp sparrow (Melospiza georgiunu). Anim. Behav. 32, 673-689.
song dialects. Condor 76, 351-356.
Monogr. 3, 79-192.
pp. 261-288.
(KROODSMA, D. E., & E. H. MILLER, eds.) Acad. Press, New York, pp. 95-130.
cotton-top tamarin (Suguinus oedipus oedipus). Z. Tierpsychol. 62, 321-328.
melograph mona. J. Theor. Biol. 26, 1-10.
animal sounds. Z. Tierpsychol. 24, 313-320.
New Jersey.
21-32.
353-380.
hypothesis. Psychometrica 29, 115-129.
Quantitative Analysis ot Animal Vocal I’hunology 115
-- , & V. SI1EKMAN, 1983: Song structure without auditory feedback: emendations of the auditory
_ - , & --, 1985: Innate differences in singing behavior of sparrows reared in isolation from
MARTINUALE, S., 1980: A numerical approach to the analysis of vireo songs. Condor 82, 199-21 I . M I I I I.K, D. B., 1978: Species typical and individually distinctive acoustic features of crow calls of red
MLI.I.I,R, E. H., 1979: An approach to the analysis of graded vocalizations of birds. Behav. Neur. Biol.
MUI.I.IGAN, FK. J. A,, 1963: A description of song sparrow song based on instrumental analysis. Proc. XI11 Int. Om. Congr. 1962, Ithaca, pp. 273-284.
MUNIIINGER, P. C., 1975: Song dialects and colonization in the house finch, Carpodacus mexicanus, on the east coast. Condor 77, 4 0 7 4 2 2 .
O I W N H E I M , A. V., 1978: Digital processing of speech. In: Applications of Digital Signal Processing. (OPPENHEIM, A. V., ed.). Prentice-Hall Inc., New Jersey, pp. 276.
PAYNE, R. B., 1985: Behavioral continuity and change in local song populations of village indigobirds, Vidua chalybeata. Z. Tierpsychol. 70, 1 4 4 .
PICKSTOCK, J . C. , J. R. KRI~BS, & S. BRADBURY, 1980: Quantitative comparison of sonagrams using an automatic image analyser: application to song dialects of chaffinches, Fringilla coelebs. Ibis 122, 103-109.
SIIFIJARI), R. N., 1980: Multidimensional scaling, tree-fitting and clustering. Science 210, 390-398. SllloVlTZ, K. A, , 1975: The process of species-specific song recognition by the indigo-bunting,
Passerina ryanea, and its relationship to the organization of avian acoustical behavior. Behaviour 55, 128-179.
SMITH, D. G., F. REID, & C. B. BREEN, 1980: Stereotypy of some parameters of red-winged blackbird song. Condor 82, 259-266.
SPARLING, D. W., & J . D. WIL.LIAMS, 1978: Multivariate analysis o f avian vocalizations. J. Theor. Biol. 74, 88-107.
STKUHSAKER, T. T., 1967: Auditory communication among vervet monkeys (Cercopithecus aethiops). In: Social Communication among Primates. (ALTMANN, J., ed.). Univ. of Chicago Press, Chicago, pp. 281-324.
SYMMES, D., J. D. N E W M A N , G. TALMAGE-RIGGS, & A. KATZ LIEBLICH, 1979: Individuality and stability of isolation peeps in squirrel monkeys. Anim. Behav. 27, 1142-1152.
WtiITNtY, C. L., 1981: Patterns of singing in the varied thrush: I. The similarity of songs with individual repertoires. Z. Tierpsychol. 57, 131-140.
Author’s address: Christopher W. CLARK, Cornell University, Laboratory of Ornithology,
template hypothesis. J . Neurosci. 3, 517-531.
adult conspecific song. Anim. Behav. 33, 57-71.
jungle fowl. 2. Tierpsychol. 47, 182-193.
22, 25-38.
Sapsucker Woods Road, Ithaca, New York 14850, U S A .
Related Documents