Quantitative analysis methods for sugars Suzanne de Goeij

Welcome message from author
This document is posted to help you gain knowledge. Please leave a comment to let me know what you think about it! Share it to your friends and learn new things together.
Transcript

Quantitative analysis methods for sugars
Suzanne de Goeij
Quantitative analysis methods for sugars
Suzanne de Goeij
2
MSc Chemistry
Analytical Sciences
Literature Thesis
Quantitative analysis methods for sugars
by
Suzanne de Goeij
August 2013
Supervisor:
dr. W.Th. Kok
Quantitative analysis methods for sugars
Suzanne de Goeij
3
ABBREVIATIONS
AA anthranilic acid
ABEE p-aminobenzoic ethyl ester
API Atmospheric Pressure Ionization
BGE Background Electrolyte
CAD Charged Aerosol Detection
CTAB cetyltrimethylammonium bromide
C(Z)E Capillary (Zone) Electrophoresis
DL Detection Limit
DMP 2,6-dimethoxyphenol
ECL Electro generated Chemilluminescence
ELSD Evaporative Light Scattering Detection
ESI Electrospray Ionization
FID Flame Ionization Detector
GC Gas Chromatography
HILIC Hydrophilic Interaction Liquid Chromatography
HPAEC High Performance Anion-Exchange Chromatography
HPLC High Performance Liquid Chromatography
ICH International Conference on Harmonization
LC Liquid Chromatography
LIF Laser Induced Fluorescence
Min Minutes
MRM Multiple Reaction Monitoring
MS Mass Spectrometry
NMP 1-(2-naphthyl)-3-methylpyrazolone
n.r. Not Reported
PAD Pulsed Amperometric Detection
PMP 1-phenyl- 3-methyl-5-pyrazolone
PMT Photomultiplier tube
QL Quantitation Limit
R2 Correlation coefficient
REF Reference
RI Refractive Index
RSD Relative Standard Deviation
SDS sodium dodecyl sulfate
SIM Selected Ion Monitoring
S/N Signal to noise ratio
Temp Temperature
TMS TriMethyl Silyl
UV-VIS Ultra Violet-Visible Spectroscopy

Quantitative analysis methods for sugars
Suzanne de Goeij
4
INDEX
Abbreviations ................................................................................................................................................ 3
1 Introduction ........................................................................................................................................... 5
2 Liquid Chromatography (LC) .................................................................................................................. 6
2.1 Columns ......................................................................................................................................... 6
2.2 Detectors in Liquid Chromatography ............................................................................................ 7
2.2.1 Evaporating Light Scattering Detection (ELSD)...................................................................... 7
2.2.2 Refractive Index Detector (RI) ............................................................................................... 9
2.2.3 Ultra Violet Detection (UV).................................................................................................. 10
2.2.4 Mass Spectrometry (MS) ..................................................................................................... 11
2.2.5 Fluorescence Detection ....................................................................................................... 13
2.2.6 Charged Aerosol Detection (CAD) ....................................................................................... 14
2.3 Discussion liquid chromatography .............................................................................................. 15
3 High Performance Anion-exchange Chromatography (HPAEC) .......................................................... 21
3.1 HPAEC with pulsed amperometric detection (PAD) .................................................................... 21
3.2 HPAEC with Mass detection ........................................................................................................ 22
3.3 Discussion high performance anion-exchange chromatography ................................................ 22
4 Gas Chromatography (GC) ................................................................................................................... 25
4.1 Derivatization .............................................................................................................................. 25
4.2 Detection ..................................................................................................................................... 25
4.3 Discussion gas chromatography .................................................................................................. 26
5 Capillary Electrophoresis (CE) .............................................................................................................. 29
5.1 Detection in Capillary Electrophoresis ........................................................................................ 29
5.1.1 UV detection after derivatization ........................................................................................ 29
5.1.2 Indirect UV ........................................................................................................................... 31
5.1.3 Amperometric/Electrochemical Detection ......................................................................... 32
5.2 Discussion Capillary Electrophoresis ........................................................................................... 33
6 Conclusion ........................................................................................................................................... 38
References ................................................................................................................................................... 40

Quantitative analysis methods for sugars
Suzanne de Goeij
5
1 INTRODUCTION
The separation and quantitative analysis of sugars is challenging for several reasons. To find a proper
technique, column and detector for the separation and quantitative detection of sugars is difficult.
Liquid chromatography (LC) is most widely used to separate sugars due to the availability. However
traditional reversed phase columns cannot be used for underivatized sugars, as the stationary phase will
not provide the required retention and specialized columns are necessary. Detection of sugars faces
troubles as their structure contains no chromophores. Detection by UV-VIS, as commonly used in HPLC,
is not possible in sugar analysis. Detection techniques such as evaporate light scattering (ELSD),
refractive index (RI), Mass spectrometry (MS) can be used but every detector has its own limitations. All
liquid chromatography methods in combination with several detectors will be discussed in chapter 2.
Another type of liquid chromatography that can be used for sugar analysis is high-performance anion-
exchange chromatography with pulsed amperometric detection (HPAEC–PAD). Anionic separation and
PAD detection improves the sensitivity and specificity compared to other LC methods. HPAEC-PAD will be
discussed in chapter 3.
Due to their high polarity, hydrophilicity and low volatility, saccharides have to be converted into volatile
and stable derivatives, i.e., trimethylsilyl or acetate derivatives, before GC analysis. In general GC
methods with FID or MS detection provide a good separation of sugars and a good sensitivity, but
require prior steps of reduction and derivation, which are very time consuming and not very practical in
routine analysis. The use of GC for sugar separation will be discussed in chapter 4.
Beside the LC and GC methods, capillary electrophoresis (CE) can also be used for quantitatively
separation of sugars. As in LC detection in CE is the most challenging part. Methods and details are
described in chapter 5.
In this review a summary of different techniques used for the separation of sugars is given with a focus
on method and validation details (recoveries, detection limits etc.) The articles covered in this review
have a focus on mono- and disaccharides like fructose, glucose, sucrose etc.
In the different chapters the possibilities of analysing sugars are summarized and concluded.
Quantitative analysis methods for sugars
Suzanne de Goeij
6
2 LIQUID CHROMATOGRAPHY (LC)
Separation and detection of sugars can be done with liquid chromatography using different column types
and detectors. In liquid chromatography there are various ways of analysing sugars, a distinguish can be
made between columns and detection techniques. Different columns will result in other separation of
sugars and results in different validation parameters like detection limits.
2.1 Columns
The stationary phases that can be used for the LC separation of native (underivatized) sugars are cyano-
or amino silica-bonded columns, cationic exchange resins (see chapter 3) or hydrophilic stationary
phases.
A column packed with hydrogen sulfonated divinyl benzene-styrene copolymer particles can be used for
the separation of sugars by ion-exchange chromatography.1-2
The addition of acetonitrile (6%) to the
mobile phase (0.045 N H2SO4) allowed good separation of the desired products within acceptable
retention times (< 30 min).2
Hydrophilic interaction liquid chromatography (HILIC) may be described as a variant of normal-phase
chromatography, where a hydrophilic bonded stationary phase is used in combination with a mostly
organic mobile phase, and gradient elution is usually performed by increasing the water concentration.
Separation by HILIC columns has been used to analyse different types of carbohydrates. Karlsson et al.
used a HILIC column for the separation of sugars. However, in the short retention time reported
(separation within 20 minutes) not all sugars were baseline separated.3
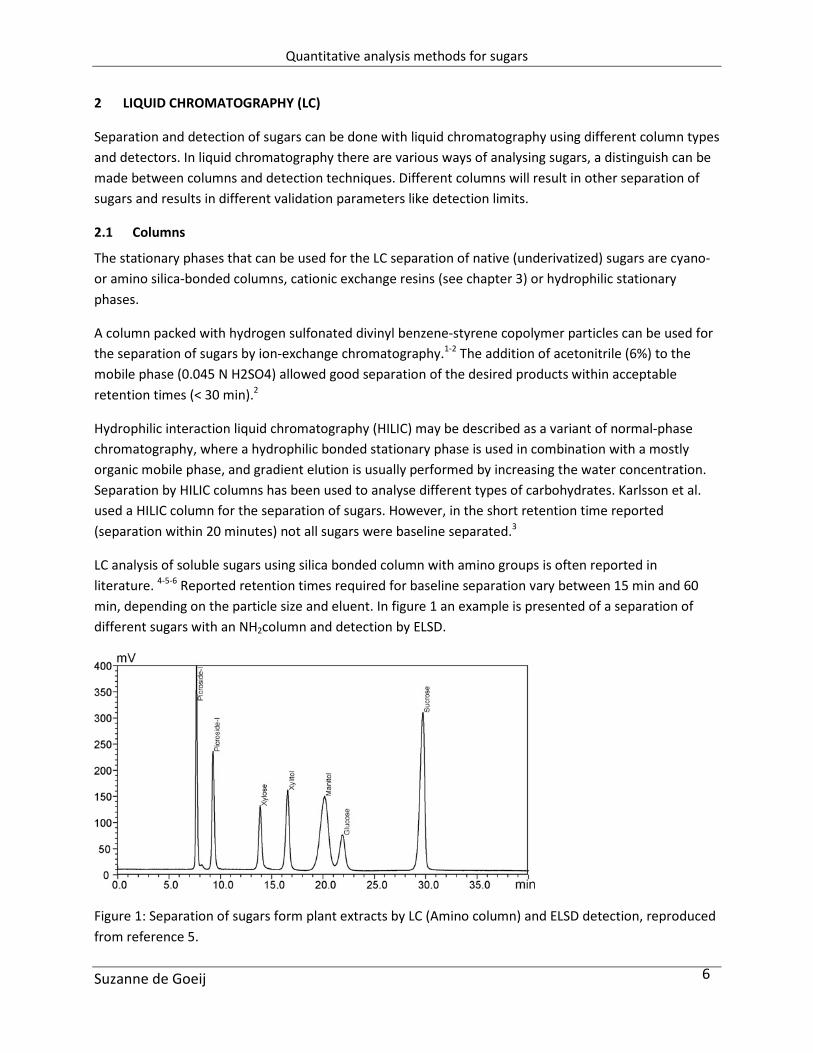
LC analysis of soluble sugars using silica bonded column with amino groups is often reported in
literature. 4-5-6
Reported retention times required for baseline separation vary between 15 min and 60
min, depending on the particle size and eluent. In figure 1 an example is presented of a separation of
different sugars with an NH2column and detection by ELSD.
Figure 1: Separation of sugars form plant extracts by LC (Amino column) and ELSD detection, reproduced
from reference 5.
Quantitative analysis methods for sugars
Suzanne de Goeij
7
After derivatization of the sugars for UV or fluorescence detection, separation can be performed on a
normal silica based C8 or C18 column, and numerous examples are reported in the literature.7-8-9
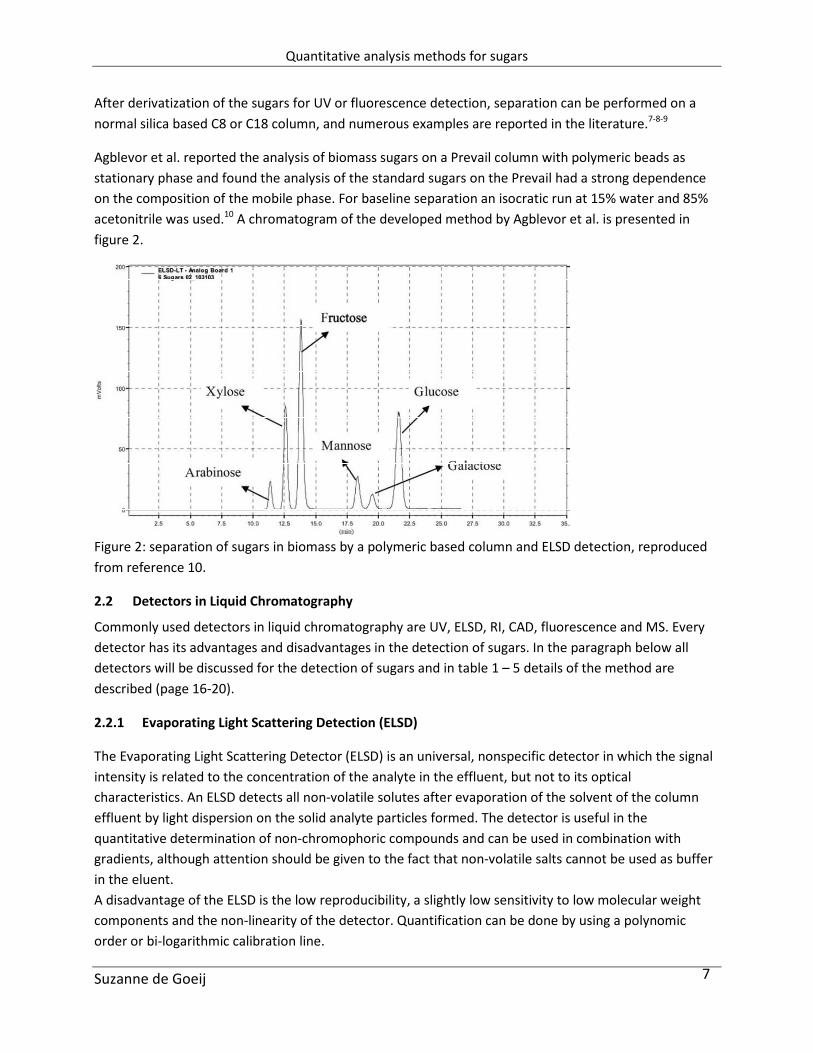
Agblevor et al. reported the analysis of biomass sugars on a Prevail column with polymeric beads as
stationary phase and found the analysis of the standard sugars on the Prevail had a strong dependence
on the composition of the mobile phase. For baseline separation an isocratic run at 15% water and 85%
acetonitrile was used.10
A chromatogram of the developed method by Agblevor et al. is presented in
figure 2.
Figure 2: separation of sugars in biomass by a polymeric based column and ELSD detection, reproduced
from reference 10.
2.2 Detectors in Liquid Chromatography
Commonly used detectors in liquid chromatography are UV, ELSD, RI, CAD, fluorescence and MS. Every
detector has its advantages and disadvantages in the detection of sugars. In the paragraph below all
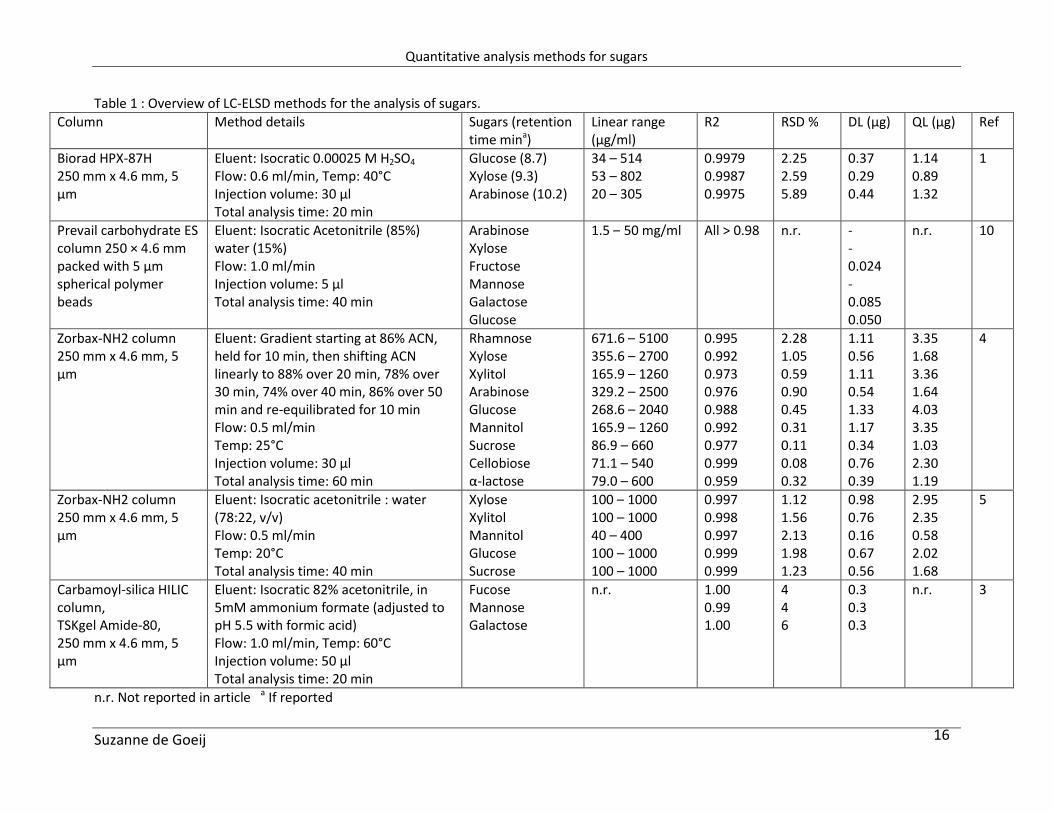
detectors will be discussed for the detection of sugars and in table 1 – 5 details of the method are
described (page 16-20).
2.2.1 Evaporating Light Scattering Detection (ELSD)
The Evaporating Light Scattering Detector (ELSD) is an universal, nonspecific detector in which the signal
intensity is related to the concentration of the analyte in the effluent, but not to its optical
characteristics. An ELSD detects all non-volatile solutes after evaporation of the solvent of the column
effluent by light dispersion on the solid analyte particles formed. The detector is useful in the
quantitative determination of non-chromophoric compounds and can be used in combination with
gradients, although attention should be given to the fact that non-volatile salts cannot be used as buffer
in the eluent.
A disadvantage of the ELSD is the low reproducibility, a slightly low sensitivity to low molecular weight
components and the non-linearity of the detector. Quantification can be done by using a polynomic
order or bi-logarithmic calibration line.
Quantitative analysis methods for sugars
Suzanne de Goeij
8
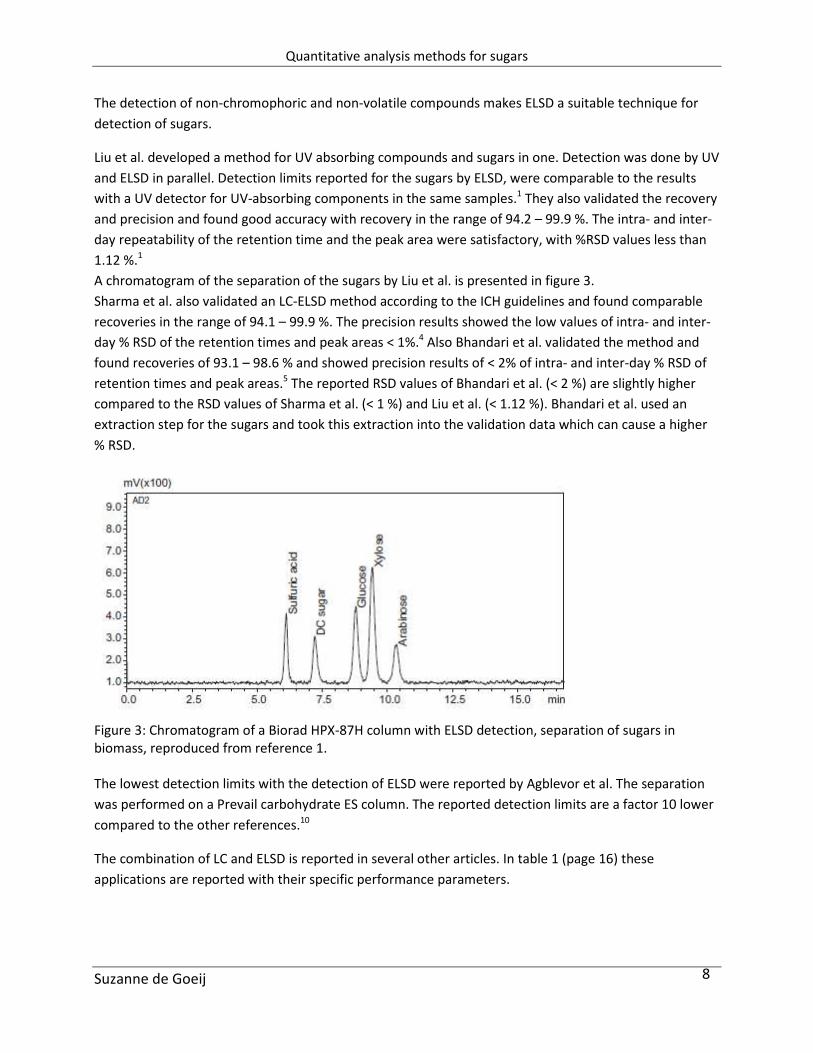
The detection of non-chromophoric and non-volatile compounds makes ELSD a suitable technique for
detection of sugars.
Liu et al. developed a method for UV absorbing compounds and sugars in one. Detection was done by UV
and ELSD in parallel. Detection limits reported for the sugars by ELSD, were comparable to the results
with a UV detector for UV-absorbing components in the same samples.1 They also validated the recovery
and precision and found good accuracy with recovery in the range of 94.2 – 99.9 %. The intra- and inter-
day repeatability of the retention time and the peak area were satisfactory, with %RSD values less than
1.12 %.1
A chromatogram of the separation of the sugars by Liu et al. is presented in figure 3.
Sharma et al. also validated an LC-ELSD method according to the ICH guidelines and found comparable
recoveries in the range of 94.1 – 99.9 %. The precision results showed the low values of intra- and inter-
day % RSD of the retention times and peak areas < 1%.4 Also Bhandari et al. validated the method and
found recoveries of 93.1 – 98.6 % and showed precision results of < 2% of intra- and inter-day % RSD of
retention times and peak areas.5 The reported RSD values of Bhandari et al. (< 2 %) are slightly higher
compared to the RSD values of Sharma et al. (< 1 %) and Liu et al. (< 1.12 %). Bhandari et al. used an
extraction step for the sugars and took this extraction into the validation data which can cause a higher
% RSD.
Figure 3: Chromatogram of a Biorad HPX-87H column with ELSD detection, separation of sugars in
biomass, reproduced from reference 1.
The lowest detection limits with the detection of ELSD were reported by Agblevor et al. The separation
was performed on a Prevail carbohydrate ES column. The reported detection limits are a factor 10 lower
compared to the other references.10
The combination of LC and ELSD is reported in several other articles. In table 1 (page 16) these
applications are reported with their specific performance parameters.
Quantitative analysis methods for sugars
Suzanne de Goeij
9
2.2.2 Refractive Index Detector (RI)
A RI detector detects components based on the refraction of light in solution. When components are
eluting from the column, the composition change in the analytical and reference cell is recorded, which
changes its photorefractive level. As a result, the amount of light received by the light-receiving section
changes, showing a peak which can be detected. Any component in the eluent can be detected which
make RI suitable for sugar detection.
The response of RI detection results in linear calibration curves. One of the disadvantages of RI detection
is the temperature sensitivity, small fluctuations in temperature results in high variations. RI detection
cannot be used in combination with gradients which makes method development limited.
Chavez-Servin et al., Castellari et al. and Barreira et al. all reported validated methods for sugar
separation with the use of RI detection. The detection limits are in the same order (see Table 2),
although different columns were used for the separation.2-6-11
Castellari et al. validated the method and found a precision of <1% and a recovery of 99.3% for fructose
and 99.6% for fructose. They also validated the difference between direct injection and injection after
sample clean up. No significant difference was observed. 2 Barreira et al. determined the precision of the
method by repeatability (intra-day) and intermediate precision (inter-day). The intra-day precision was
found to be <1.4% and the intra-day precision <3.6%.The recovery was determined by spiking
experiments and are between 88.5 and 99.8%.6 Chavez-Servin et al. found repeatability results of less
than 1% and reproducibility of less than 7.0%. Recoveries in all sugars were between 93 and 113%. 11
Lopes et al. described a HPLC-RI method with the use of a chiral column.12
The method allows the
carbohydrate identification and determination of the absolute configuration (d or l) and simultaneously
also determine the configuration of the anomeric centre (α or β) of the monosaccharide.
They also studied the effect of the column temperature on the separation.12
The elution profiles of the
sugars are depended on column temperature. The change was not uniform for all monosaccharides: for
example, when the temperature was increased, the elution profile of lyxose became worse, while for
glucose the best elution profile was achieved at 40 °C. Finally 25 °C was chosen as reasonable
temperature for all sugars.12
No complete validation was performed of this method.
Liquid chromatography in combination with RI detection is reported in literature. A few applications of
sugar separations are summarized in the table below, table 2 (page 17). However more HPLC-RI methods
are reported in literature, in which no validation parameters are reported.12-13-14
Quantitative analysis methods for sugars
Suzanne de Goeij
10
2.2.3 Ultra Violet Detection (UV)
In liquid chromatography UV/UV-VIS detectors are frequently used to measure components showing an
absorption spectrum in the ultraviolet or visible region. An UV detector is equipped with a deuterium
lamp (D2 lamp) as a light source and has a light ranging from 190 to 380 nm.
As a lot of components exhibit a chromophoric group, so a broad range of substances can be detected.
Sensitivity of the detection depends on the component. However the lack of chromophores in the
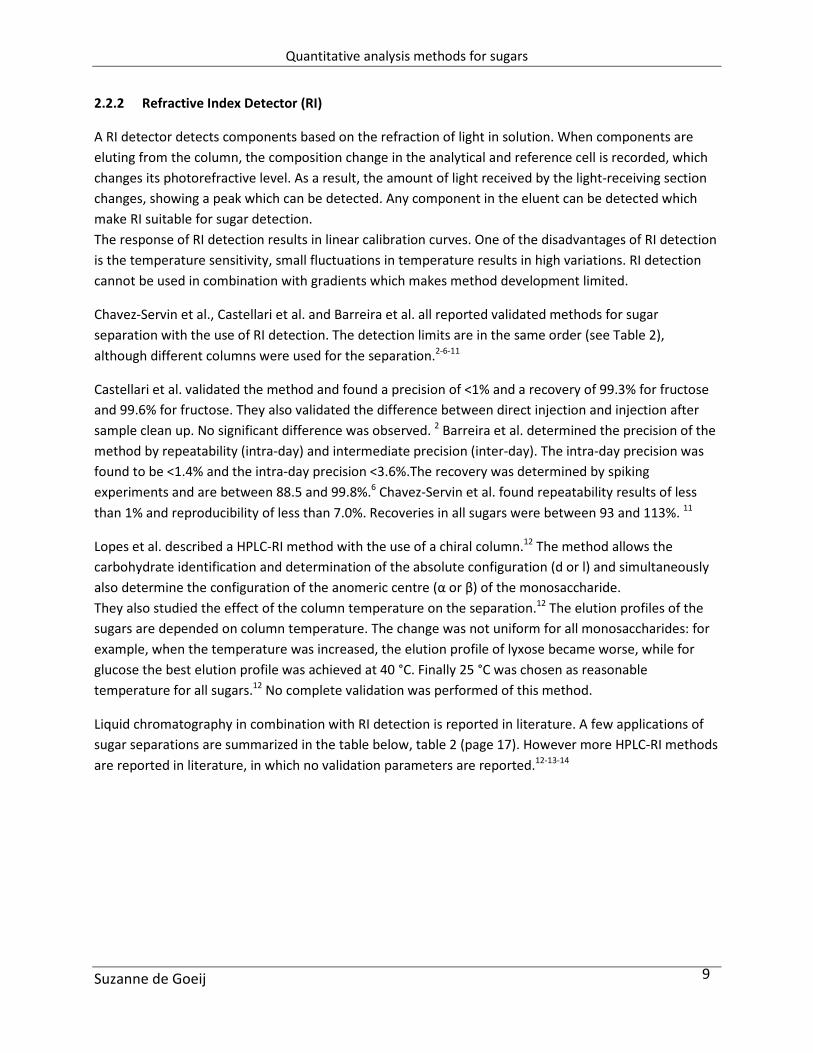
structure prevents the use of UV detection for native sugars. Therefore, the derivatization of sugars is
necessary to apply UV detection. The reagents 1-phenyl- 3-methyl-5-pyrazolone (PMP) and p-
aminobenzoic ethyl ester are the most popular labels that react with reducing carbohydrates under mild
conditions. 7-8
Figure 4: Labelling reaction of glucose with p-aminobenzoic ethyl ester, reproduced from reference 8
Lv et al. used 1-Phenyl-3-methyl-5-pyrazolone as derivatization reagent and reported recoveries of 94.6 –
108 %.7 Blanco Gomis et al. used p-aminobenzoic ethyl ester as derivatization reagent to detect the
desired sugars and reported recoveries between 90 – 120 %.8
Lv et al. performed a full validation of the method as described by the ICH guidelines. They reported RSD
% values for intra- and inter-day precision of less than 2.4 % for the retention time and less than 4.5 for
the peak areas.7 Blanco-Gomis et al. determined the repeatability as less than 1.6% and the inter-day
reproducibility as less than 5%. 8
The reported detection limits of both references are in the nanogram range, which is significant lower
compared to the reported detection limits by ELSD and RI. Low detection limits can be interesting in food
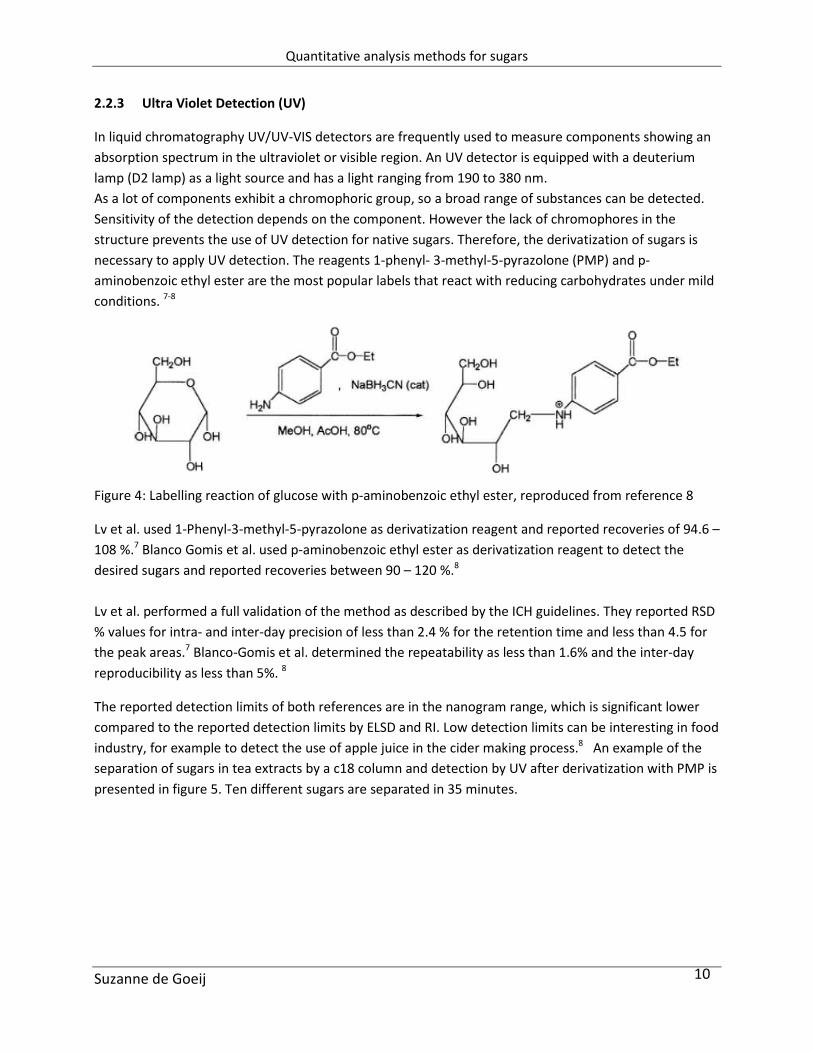
industry, for example to detect the use of apple juice in the cider making process.8 An example of the
separation of sugars in tea extracts by a c18 column and detection by UV after derivatization with PMP is
presented in figure 5. Ten different sugars are separated in 35 minutes.
Quantitative analysis methods for sugars
Suzanne de Goeij
11
Figure 5: Separation (C18 column) of sugars in tea extracts, detection of sugars by UV after derivatization
with PMP, reproduced from reference 7. (Peaks: 1. mannose; 2. ribose; 3. rhamnose; 4. glucuronic acid;
5. galacturonic acid; 6. glucose; 7. xylose; 8. galactose; 9. arabinose; 10. Fucose.)
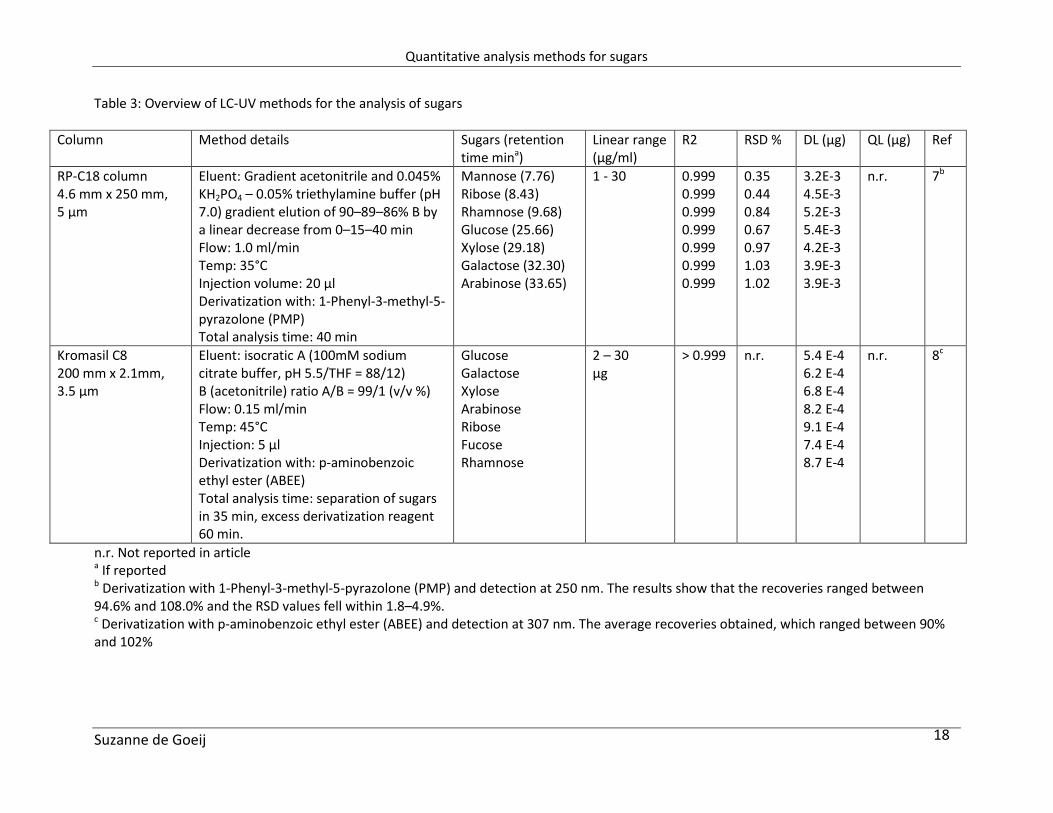
Separation of sugars using derivatization and UV detection is reported in several applications, as
presented in table 3 (page 18).
2.2.4 Mass Spectrometry (MS)
Over the past decade, the development of LC/MS methods dedicated to the analysis of sugars and
monosaccharide’s in particular, has led to significant advances in terms of sensitivity and specificity while
maintaining speed and simplicity of implementation.15
The principle of mass spectrometry is ionizing chemical compounds to generate charged molecules or
molecule fragments. The ions are detected. The signal is processed into the spectra of the relative
abundance of ions as a function of the mass to charge ratio.
Mass spectrometry can be used in combination with liquid chromatography for the analysis of sugars.
Sugar ionization in atmospheric pressure ionization (API) type sources represented the main challenge
because of their low efficiency of ionization in negative mode directly related to their low acidic
character. However using MS information about chemical structures can be generated which can be very
useful in development phases.
Ricochon et al. described an analysis method for the separation and detection of sugars in orange juice.
After calibration and analysing samples they found poor linearity and repeatability. The use of an
internal standard did not improve the results. They decided to add 1% chloroform to the eluent to form
Cl adducts and analysed the sugars in APCI in negative ion mode [M+35]- and [M+37]
-.15
After validation
of the method the inter-day precision is determined as less than 0.3% based on peak area.
Quantitative analysis methods for sugars
Suzanne de Goeij
12
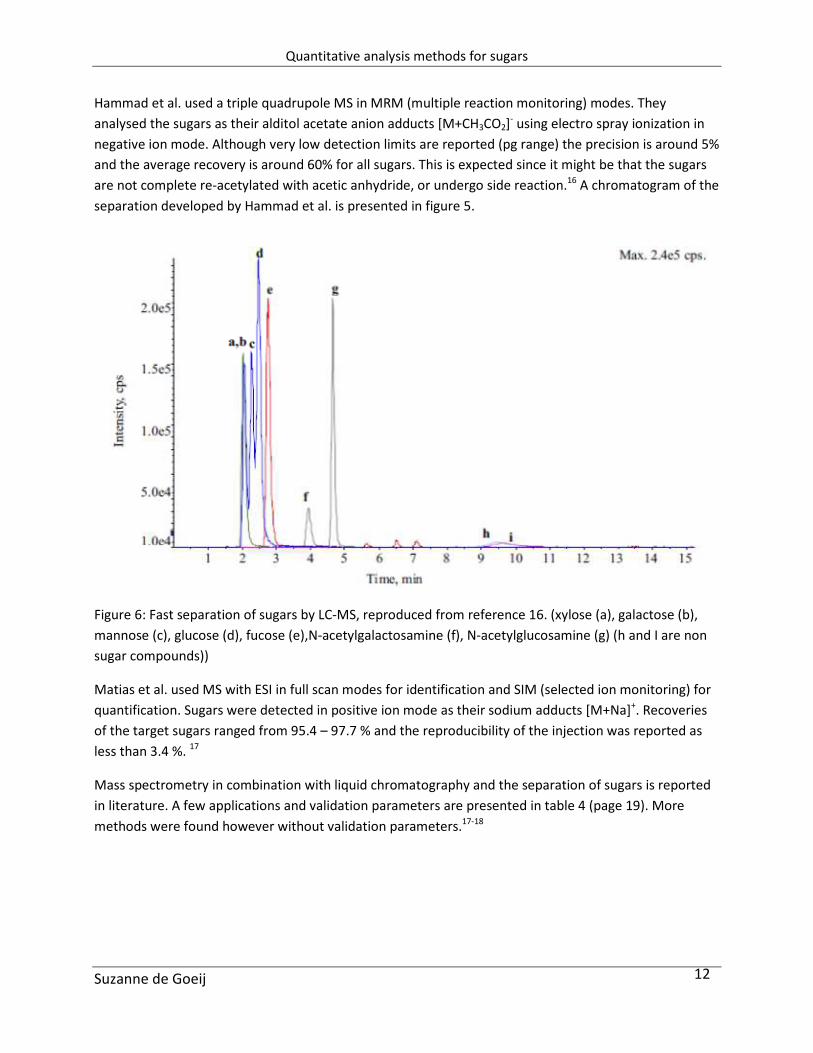
Hammad et al. used a triple quadrupole MS in MRM (multiple reaction monitoring) modes. They
analysed the sugars as their alditol acetate anion adducts [M+CH3CO2]- using electro spray ionization in
negative ion mode. Although very low detection limits are reported (pg range) the precision is around 5%
and the average recovery is around 60% for all sugars. This is expected since it might be that the sugars
are not complete re-acetylated with acetic anhydride, or undergo side reaction.16
A chromatogram of the
separation developed by Hammad et al. is presented in figure 5.
Figure 6: Fast separation of sugars by LC-MS, reproduced from reference 16. (xylose (a), galactose (b),
mannose (c), glucose (d), fucose (e),N-acetylgalactosamine (f), N-acetylglucosamine (g) (h and I are non
sugar compounds))
Matias et al. used MS with ESI in full scan modes for identification and SIM (selected ion monitoring) for
quantification. Sugars were detected in positive ion mode as their sodium adducts [M+Na]+. Recoveries
of the target sugars ranged from 95.4 – 97.7 % and the reproducibility of the injection was reported as
less than 3.4 %. 17
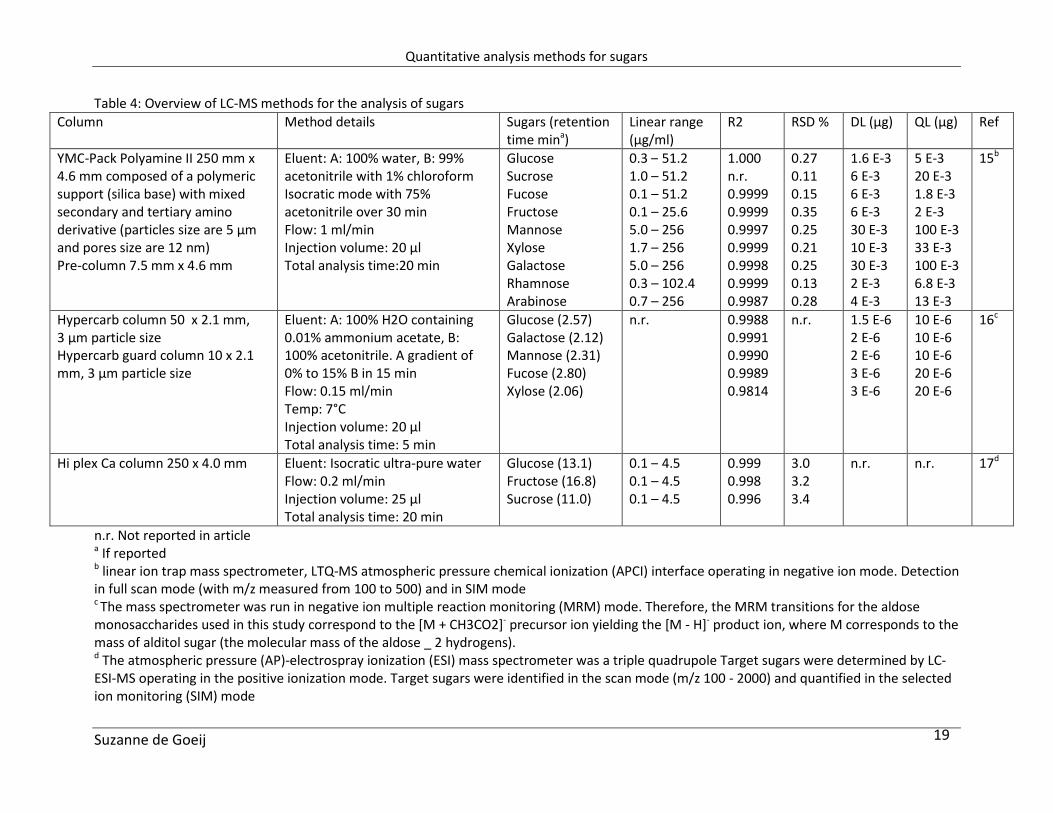
Mass spectrometry in combination with liquid chromatography and the separation of sugars is reported
in literature. A few applications and validation parameters are presented in table 4 (page 19). More
methods were found however without validation parameters.17-18
Quantitative analysis methods for sugars
Suzanne de Goeij
13
2.2.5 Fluorescence Detection
Fluorescence detection is also reported in combination with applications for the separation and
detections of sugars.
In fluorescence substances absorbs light at one wavelength and emit light at another wavelength.
Substances have specific wavelengths of light that it absorbs (excitation wavelengths) and emits
(emission wavelengths).
Fluorescence detection is suitable for trace analysis due to generally having high sensitivity and
selectivity (not detecting impurities). There are not many components that originally emit fluorescence
(natural fluorescence). However, after reaction with a fluorescence reagent (derivatization) a lot of
compounds can be detected as fluorescent substances. This method makes it possible to measure
various components with high sensitivity.
Since sugars contain no fluorophores, derivatization of the sugars is required. Common fluorescent tags
used for labelling of the monosaccharides prior to HPLC analysis are: anthranilic acid (AA), 2-
aminobenzamide, 2-aminopyridine, phenyl isothiocyanate, 9-fluorenylmethoxycarbonylhydrazine, 7-
amino-4-methylcoumarin and 7-amino-1,3-naphthalene-disulphonate.9 Kakita used benzamidide as
derivatization reagent and reported high sensitivity, good linearity and good reproducibility.19
Racaityte
et al. used anthranilic acid (AA) as derivatization reagent.9
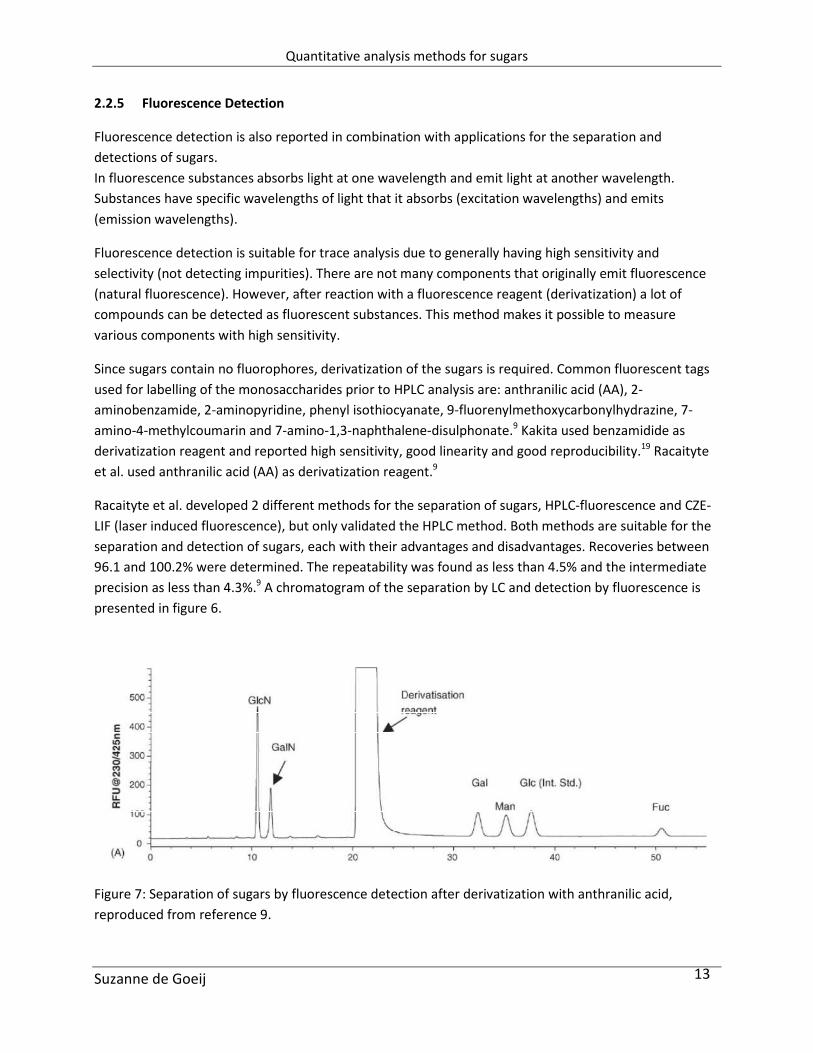
Racaityte et al. developed 2 different methods for the separation of sugars, HPLC-fluorescence and CZE-
LIF (laser induced fluorescence), but only validated the HPLC method. Both methods are suitable for the
separation and detection of sugars, each with their advantages and disadvantages. Recoveries between
96.1 and 100.2% were determined. The repeatability was found as less than 4.5% and the intermediate
precision as less than 4.3%.9 A chromatogram of the separation by LC and detection by fluorescence is
presented in figure 6.
Figure 7: Separation of sugars by fluorescence detection after derivatization with anthranilic acid,
reproduced from reference 9.
Quantitative analysis methods for sugars
Suzanne de Goeij
14
Kakita et al. validated the method and found the RSD for the retention time varied between 0.05 – 0.36%
and for the fluorescence intensity between 1.14 – 1.62%.19
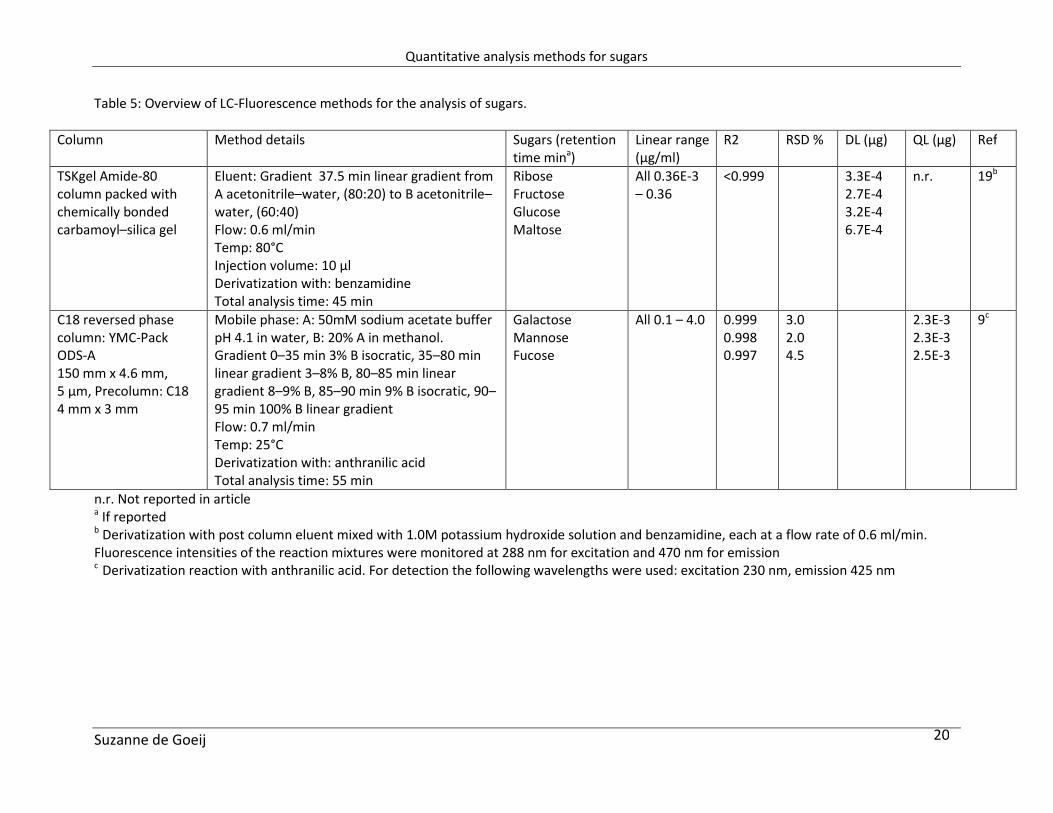
Sensitive methods with fluorescence detection are available for quantification of sugars and are
summarized in the table below, table 5 (page 20). Although low detection limits can be reached,
derivatization is always required, which makes the method not suitable for routine analysis.
2.2.6 Charged Aerosol Detection (CAD)
Charged Aerosol Detection (CAD) is a recent developed detector based on the detection of scattered
particles, like in ELSD. The eluent coming from the LC is nebulized using a flow of nitrogen and the
resulting aerosol is transported through a drift tube where the volatile components and solvents are
evaporated. The dried particle stream is charged with a corona discharge needle, resulting in an
electrical charge measured by an electrometer. Like ELSD, the CAD is mass-dependent and is called
universal.20
Aerosol detectors are well-suited to detect all non-volatile analytes, regardless of whether these analytes
contain a chromophore. These properties make aerosol detectors suitable for the detection of sugars.21
A performance evaluation between ELSD and CAD is reported by Vervoort et al. Fitting of the
exponential factor in the calibration equation showed that for the chosen concentration interval the
linearity of the CAD is much better than that of the ELSD. In general the CAD is more sensitive than ELSD,
the peak shape is little worse in CAD (higher tailing factor) and the repeatability of both detectors is still
around a factor 2 worse compared to UV detection. 20
Applications of sugars separations are reported, however without validation parameters.21-22
Quantitative analysis methods for sugars
Suzanne de Goeij
15
2.3 Discussion liquid chromatography
Different types of liquid chromatography columns are available for the separation of sugars. In all cases
separation of sugars is challenging and method development is required to optimize separation in
reasonable retention times.
After separation, detection is also difficult as sugars contain no chromophores to analyse them with UV,
what mostly is done in LC.
The use of ELSD in combination with the separation of sugars has been reported by different authors.
With the use of different columns for the separation, detection limits in the same order were found (in
the order of 0.1 – 1 µg per injection). A recovery of 93 – 99.9 % was reported and an intra- and inter-day
precision as % RSD of the retention time and peak are < 2 %.
A recent developed detector for the analysis of sugars is the CAD detector; however the performance is
comparable to the ELSD detector.
Detection of sugars by RI was reported in the first applications of the analysis of sugars. Detection limits
are in the same range as reported in ELSD applications. Lopes et al. did some method development by
varying the column temperature on a chiral column and RI detection.12
Castellari et al. found excellent
recoveries (>99.3%) and precision results <1%.2 However other authors reported lower recoveries
(between 89 – 113%) and higher precision values.
Mass spectrometry is also an option for the detection of sugars. Several applications are reported where
sugars were analysed as their sodium adduct, acetate adduct or chloride adduct. Compared to the
detection limits of other detectors, the lowest limits were reported by Hammad et al. using a quadrupole
MS, detection limits in pg range per injection are reported.16
Although very low detection limits are
reported (pg range) the precision is around 5% and the average recovery is around 60% for all sugars.
Comparable precision values are found in other applications.
For detection by UV a derivatization reagent is required. Applications are reported where 1-Phenyl-3-
methyl-5-pyrazolone7 and p-aminobenzoic ethyl ester
8 is used as derivatization reagent, with recoveries
between 90 – 120 %. The reported detection limits of both references are in the nanogram range, which
is significant lower compared to the reported detection limits by ELSD and RI. The reported values for
precision are <2.4% for intra-day precision and <5% for inter-day precision.
Different derivatization reagents are applicable for detection by fluorescence. Low detection limits are
reported with the use of anthranilic acid9 and benzamidide
19 as derivatization reagent. The detection
limits of sugar separation with the use of a fluorescence detector are significant lower compared to the
ELSD and RI detection, however a derivatization step is always required.
Quantitative analysis methods for sugars
Suzanne de Goeij
16
Table 1 : Overview of LC-ELSD methods for the analysis of sugars.
Column Method details Sugars (retention
time mina)
Linear range
(µg/ml)
R2 RSD % DL (µg) QL (µg) Ref
Biorad HPX-87H
250 mm x 4.6 mm, 5
µm
Eluent: Isocratic 0.00025 M H2SO4
Flow: 0.6 ml/min, Temp: 40°C
Injection volume: 30 µl
Total analysis time: 20 min
Glucose (8.7)
Xylose (9.3)
Arabinose (10.2)
34 – 514
53 – 802
20 – 305
0.9979
0.9987
0.9975
2.25
2.59
5.89
0.37
0.29
0.44
1.14
0.89
1.32
1
Prevail carbohydrate ES
column 250 × 4.6 mm
packed with 5 μm
spherical polymer
beads
Eluent: Isocratic Acetonitrile (85%)
water (15%)
Flow: 1.0 ml/min
Injection volume: 5 µl
Total analysis time: 40 min
Arabinose
Xylose
Fructose
Mannose
Galactose
Glucose
1.5 – 50 mg/ml
All > 0.98 n.r. -
-
0.024
-
0.085
0.050
n.r. 10
Zorbax-NH2 column
250 mm x 4.6 mm, 5
µm
Eluent: Gradient starting at 86% ACN,
held for 10 min, then shifting ACN
linearly to 88% over 20 min, 78% over
30 min, 74% over 40 min, 86% over 50
min and re-equilibrated for 10 min
Flow: 0.5 ml/min
Temp: 25°C
Injection volume: 30 µl
Total analysis time: 60 min
Rhamnose
Xylose
Xylitol
Arabinose
Glucose
Mannitol
Sucrose
Cellobiose
α-lactose
671.6 – 5100
355.6 – 2700
165.9 – 1260
329.2 – 2500
268.6 – 2040
165.9 – 1260
86.9 – 660
71.1 – 540
79.0 – 600
0.995
0.992
0.973
0.976
0.988
0.992
0.977
0.999
0.959
2.28
1.05
0.59
0.90
0.45
0.31
0.11
0.08
0.32
1.11
0.56
1.11
0.54
1.33
1.17
0.34
0.76
0.39
3.35
1.68
3.36
1.64
4.03
3.35
1.03
2.30
1.19
4
Zorbax-NH2 column
250 mm x 4.6 mm, 5
µm
Eluent: Isocratic acetonitrile : water
(78:22, v/v)
Flow: 0.5 ml/min
Temp: 20°C
Total analysis time: 40 min
Xylose
Xylitol
Mannitol
Glucose
Sucrose
100 – 1000
100 – 1000
40 – 400
100 – 1000
100 – 1000
0.997
0.998
0.997
0.999
0.999
1.12
1.56
2.13
1.98
1.23
0.98
0.76
0.16
0.67
0.56
2.95
2.35
0.58
2.02
1.68
5
Carbamoyl-silica HILIC
column,
TSKgel Amide-80,
250 mm x 4.6 mm, 5
µm
Eluent: Isocratic 82% acetonitrile, in
5mM ammonium formate (adjusted to
pH 5.5 with formic acid)
Flow: 1.0 ml/min, Temp: 60°C
Injection volume: 50 µl
Total analysis time: 20 min
Fucose
Mannose
Galactose
n.r. 1.00
0.99
1.00
4
4
6
0.3
0.3
0.3
n.r. 3
n.r. Not reported in article a If reported

Quantitative analysis methods for sugars
Suzanne de Goeij
17
Table 2: Overview of LC-RI methods for the analysis of sugars
Column Method details Sugars (retention
time mina)
Linear range
(µg/ml)
R2 RSD % DL
(µg)
QL (µg) Ref
Tracer carbohydrates
column 250 mm x 4.6 mm,
5µm and an NH2 pre-
column 13 mm x 3 mm
Eluent: Isocratic acetonitrile–water
(75:25)
Flow: 1.8 ml/min
Temp: 25°C
Injection volume: 20 µl
Total analysis time: 15 min
Fructose (5.8)
Glucose (6.8)
Galactose (7.4)
Sucrose (9.8)
Lactulose (11.7)
Lactose (13.7)
0.5 – 10
0.5 – 10
0.5 – 10
0.5 – 10
0.25 – 3
2 – 15
0.998
0.998
0.997
0.999
0.999
0.998
0.78
-
-
0.99
2.91
0.46
3.4
2.6
1.2
3.2
1.0
5.0
5.4
4.8
4.0
5.2
4.4
7.6
11
Aminex HPX-87H
300 × 7.8 mm with a pre-
column 30 × 4.6 mm
Eluent: Isocratic 0.003 – 0.05 N
H2SO4 with 6% acetonitrile (v/v).
Flow: 0.5 ml/min
Temp: 45°C
Injection volume: 20 µl
Total analysis time: 25 min
Glucose (12.5)
Fructose (13.4)
0.5 – 20
0.5 – 20
0.999
0.999
1.41
1.22
0.2
0.6
n.r. 2
Eurospher 100-5
NH2 column 4.6 × 250
mm, 5 µm
Eluent: Isocratic acetonitrile/water,
7:3 (v/v)
Flow: 1.0 ml/min
Temp: 35°C
Injection volume: 20 µl
Total analysis time: 15 min
Fructose (5.97)
Glucose (6.36)
Sucrose (7.41)
Raffinose (10.75)
0.2 – 24
0.3 – 24
0.2 – 24
0.3 – 24
0.9999
0.9999
0.9999
0.9991
0.27
0.26
0.33
0.36
1.0
1.6
1.2
1.8
3.6
5.0
4.2
6.0
6
a If reported
n.r. Not reported in article
Quantitative analysis methods for sugars
Suzanne de Goeij
18
Table 3: Overview of LC-UV methods for the analysis of sugars
Column Method details Sugars (retention
time mina)
Linear range
(µg/ml)
R2 RSD % DL (µg) QL (µg) Ref
RP-C18 column
4.6 mm x 250 mm,
5 µm
Eluent: Gradient acetonitrile and 0.045%
KH2PO4 – 0.05% triethylamine buffer (pH
7.0) gradient elution of 90–89–86% B by
a linear decrease from 0–15–40 min
Flow: 1.0 ml/min
Temp: 35°C
Injection volume: 20 µl
Derivatization with: 1-Phenyl-3-methyl-5-
pyrazolone (PMP)
Total analysis time: 40 min
Mannose (7.76)
Ribose (8.43)
Rhamnose (9.68)
Glucose (25.66)
Xylose (29.18)
Galactose (32.30)
Arabinose (33.65)
1 - 30 0.999
0.999
0.999
0.999
0.999
0.999
0.999
0.35
0.44
0.84
0.67
0.97
1.03
1.02
3.2E-3
4.5E-3
5.2E-3
5.4E-3
4.2E-3
3.9E-3
3.9E-3
n.r. 7b
Kromasil C8
200 mm x 2.1mm,
3.5 µm
Eluent: isocratic A (100mM sodium
citrate buffer, pH 5.5/THF = 88/12)
B (acetonitrile) ratio A/B = 99/1 (v/v %)
Flow: 0.15 ml/min
Temp: 45°C
Injection: 5 µl
Derivatization with: p-aminobenzoic
ethyl ester (ABEE)
Total analysis time: separation of sugars
in 35 min, excess derivatization reagent
60 min.
Glucose
Galactose
Xylose
Arabinose
Ribose
Fucose
Rhamnose
2 – 30
µg
> 0.999 n.r. 5.4 E-4
6.2 E-4
6.8 E-4
8.2 E-4
9.1 E-4
7.4 E-4
8.7 E-4
n.r. 8c
n.r. Not reported in article
a If reported
b Derivatization with 1-Phenyl-3-methyl-5-pyrazolone (PMP) and detection at 250 nm. The results show that the recoveries ranged between
94.6% and 108.0% and the RSD values fell within 1.8–4.9%. c Derivatization with p-aminobenzoic ethyl ester (ABEE) and detection at 307 nm. The average recoveries obtained, which ranged between 90%
and 102%
Quantitative analysis methods for sugars
Suzanne de Goeij
19
Table 4: Overview of LC-MS methods for the analysis of sugars
Column Method details Sugars (retention
time mina)
Linear range
(µg/ml)
R2 RSD % DL (µg) QL (µg) Ref
YMC-Pack Polyamine II 250 mm x
4.6 mm composed of a polymeric
support (silica base) with mixed
secondary and tertiary amino
derivative (particles size are 5 µm
and pores size are 12 nm)
Pre-column 7.5 mm x 4.6 mm
Eluent: A: 100% water, B: 99%
acetonitrile with 1% chloroform
Isocratic mode with 75%
acetonitrile over 30 min
Flow: 1 ml/min
Injection volume: 20 µl
Total analysis time:20 min
Glucose
Sucrose
Fucose
Fructose
Mannose
Xylose
Galactose
Rhamnose
Arabinose
0.3 – 51.2
1.0 – 51.2
0.1 – 51.2
0.1 – 25.6
5.0 – 256
1.7 – 256
5.0 – 256
0.3 – 102.4
0.7 – 256
1.000
n.r.
0.9999
0.9999
0.9997
0.9999
0.9998
0.9999
0.9987
0.27
0.11
0.15
0.35
0.25
0.21
0.25
0.13
0.28
1.6 E-3
6 E-3
6 E-3
6 E-3
30 E-3
10 E-3
30 E-3
2 E-3
4 E-3
5 E-3
20 E-3
1.8 E-3
2 E-3
100 E-3
33 E-3
100 E-3
6.8 E-3
13 E-3
15b
Hypercarb column 50 x 2.1 mm,
3 µm particle size
Hypercarb guard column 10 x 2.1
mm, 3 µm particle size
Eluent: A: 100% H2O containing
0.01% ammonium acetate, B:
100% acetonitrile. A gradient of
0% to 15% B in 15 min
Flow: 0.15 ml/min
Temp: 7°C
Injection volume: 20 µl
Total analysis time: 5 min
Glucose (2.57)
Galactose (2.12)
Mannose (2.31)
Fucose (2.80)
Xylose (2.06)
n.r. 0.9988
0.9991
0.9990
0.9989
0.9814
n.r. 1.5 E-6
2 E-6
2 E-6
3 E-6
3 E-6
10 E-6
10 E-6
10 E-6
20 E-6
20 E-6
16c
Hi plex Ca column 250 x 4.0 mm Eluent: Isocratic ultra-pure water
Flow: 0.2 ml/min
Injection volume: 25 µl
Total analysis time: 20 min
Glucose (13.1)
Fructose (16.8)
Sucrose (11.0)
0.1 – 4.5
0.1 – 4.5
0.1 – 4.5
0.999
0.998
0.996
3.0
3.2
3.4
n.r. n.r. 17d
n.r. Not reported in article
a If reported
b linear ion trap mass spectrometer, LTQ-MS atmospheric pressure chemical ionization (APCI) interface operating in negative ion mode. Detection
in full scan mode (with m/z measured from 100 to 500) and in SIM mode c The mass spectrometer was run in negative ion multiple reaction monitoring (MRM) mode. Therefore, the MRM transitions for the aldose
monosaccharides used in this study correspond to the [M + CH3CO2]- precursor ion yielding the [M - H]
- product ion, where M corresponds to the
mass of alditol sugar (the molecular mass of the aldose _ 2 hydrogens). d The atmospheric pressure (AP)-electrospray ionization (ESI) mass spectrometer was a triple quadrupole Target sugars were determined by LC-
ESI-MS operating in the positive ionization mode. Target sugars were identified in the scan mode (m/z 100 - 2000) and quantified in the selected
ion monitoring (SIM) mode
Quantitative analysis methods for sugars
Suzanne de Goeij
20
Table 5: Overview of LC-Fluorescence methods for the analysis of sugars.
Column Method details Sugars (retention
time mina)
Linear range
(µg/ml)
R2 RSD % DL (µg) QL (µg) Ref
TSKgel Amide-80
column packed with
chemically bonded
carbamoyl–silica gel
Eluent: Gradient 37.5 min linear gradient from
A acetonitrile–water, (80:20) to B acetonitrile–
water, (60:40)
Flow: 0.6 ml/min
Temp: 80°C
Injection volume: 10 µl
Derivatization with: benzamidine
Total analysis time: 45 min
Ribose
Fructose
Glucose
Maltose
All 0.36E-3
– 0.36
<0.999 3.3E-4
2.7E-4
3.2E-4
6.7E-4
n.r. 19b
C18 reversed phase
column: YMC-Pack
ODS-A
150 mm x 4.6 mm,
5 µm, Precolumn: C18
4 mm x 3 mm
Mobile phase: A: 50mM sodium acetate buffer
pH 4.1 in water, B: 20% A in methanol.
Gradient 0–35 min 3% B isocratic, 35–80 min
linear gradient 3–8% B, 80–85 min linear
gradient 8–9% B, 85–90 min 9% B isocratic, 90–
95 min 100% B linear gradient
Flow: 0.7 ml/min
Temp: 25°C
Derivatization with: anthranilic acid
Total analysis time: 55 min
Galactose
Mannose
Fucose
All 0.1 – 4.0 0.999
0.998
0.997
3.0
2.0
4.5
2.3E-3
2.3E-3
2.5E-3
9c
n.r. Not reported in article
a If reported
b Derivatization with post column eluent mixed with 1.0M potassium hydroxide solution and benzamidine, each at a flow rate of 0.6 ml/min.
Fluorescence intensities of the reaction mixtures were monitored at 288 nm for excitation and 470 nm for emission c
Derivatization reaction with anthranilic acid. For detection the following wavelengths were used: excitation 230 nm, emission 425 nm
Quantitative analysis methods for sugars
Suzanne de Goeij
21
3 HIGH PERFORMANCE ANION-EXCHANGE CHROMATOGRAPHY (HPAEC)
Another type of liquid chromatography is High Performance Anion-Exchange Chromatography (HPAEC)
with pulsed amperometric detection (PAD). HPAEC-PAD is often used for the separation of sugars. It
requires a dedicated system and special detector. All references make use of a PA type (PA-1/PA-10/PA-
20/PA-100/PA-200) of column.23-24-25-26-27-28
The PA column is an anion-exchange column, suitable for the
separation of sugars. The choice of the PA column depends on the types of sugars to be separated
(mono, - disaccharide etc) and the resolution needed for the specific sample matrix.
3.1 HPAEC with pulsed amperometric detection (PAD)
HPAEC-PAD takes advantage of the affinity between the ionized group of sugars at alkaline pH (pH 12)
and a pellicular quaternary amine stationary phase. Therefore high resolution and highly selective
separation of non-derivatized sugars can be achieved.23
PAD has gained prominence as a selective and sensitive technique for the determination of
carbohydrates due to the fact that oxidefree detection for aldehyde and alcohol-containing compounds
at gold (Au) electrodes in alkaline media (pH 12) can be easily executed. Pulsed amperometric detection
uses a triple-step potential waveform to combine amperometric detection with alternating anodic and
cathodic polarization pulses to clean and reactivate the electrode surface. The use of Au electrodes has
the distinct advantage that detection can be achieved without simultaneous reduction of oxygen
(dissolved in the mobile phase).24
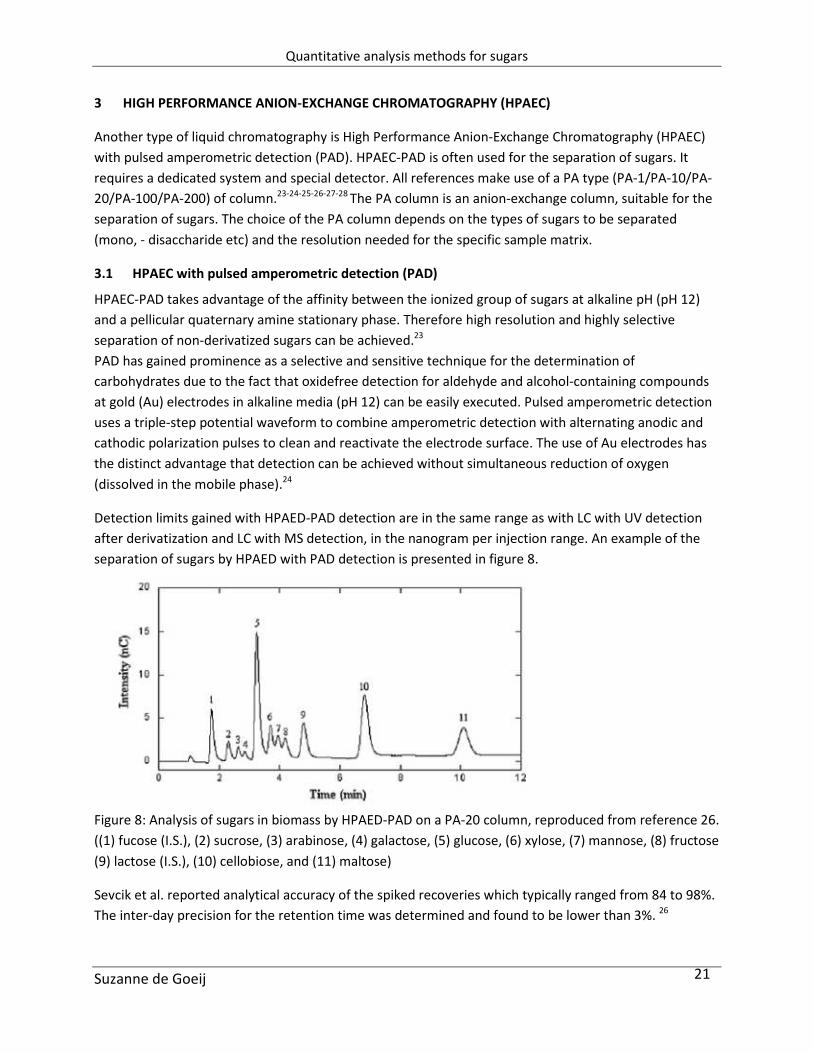
Detection limits gained with HPAED-PAD detection are in the same range as with LC with UV detection
after derivatization and LC with MS detection, in the nanogram per injection range. An example of the
separation of sugars by HPAED with PAD detection is presented in figure 8.
Figure 8: Analysis of sugars in biomass by HPAED-PAD on a PA-20 column, reproduced from reference 26.
((1) fucose (I.S.), (2) sucrose, (3) arabinose, (4) galactose, (5) glucose, (6) xylose, (7) mannose, (8) fructose
(9) lactose (I.S.), (10) cellobiose, and (11) maltose)
Sevcik et al. reported analytical accuracy of the spiked recoveries which typically ranged from 84 to 98%.
The inter-day precision for the retention time was determined and found to be lower than 3%. 26
Quantitative analysis methods for sugars
Suzanne de Goeij
22
Raessler et al. tested the stability of the retention times after subsequent injections (at the same day)
and found RSD <1%.24
3.2 HPAEC with Mass detection
Beside PAD detection, MS detection can be used in combination with HPAEC although this is a
technological challenge. Typical alkali acetate and hydroxide eluents are not compatible with
atmospheric pressure ionization (API) due to their non-volatility and high conductance. Bruggink et al.
created a system with a desalting device installed between the column and the MS. The desalter
converts the alkali hydroxide and acetate into water and acetic acid continuously exchanging the alkali
cations by hydronium ions using a selective cation exchange membrane and a regenerant.25
Bruggink et
al. created a HPAED-MS system where quantification was done in SIM mode. In this case MS was only
used for structure elucidation. In the validation of both detectors it appeared that the detection limits of
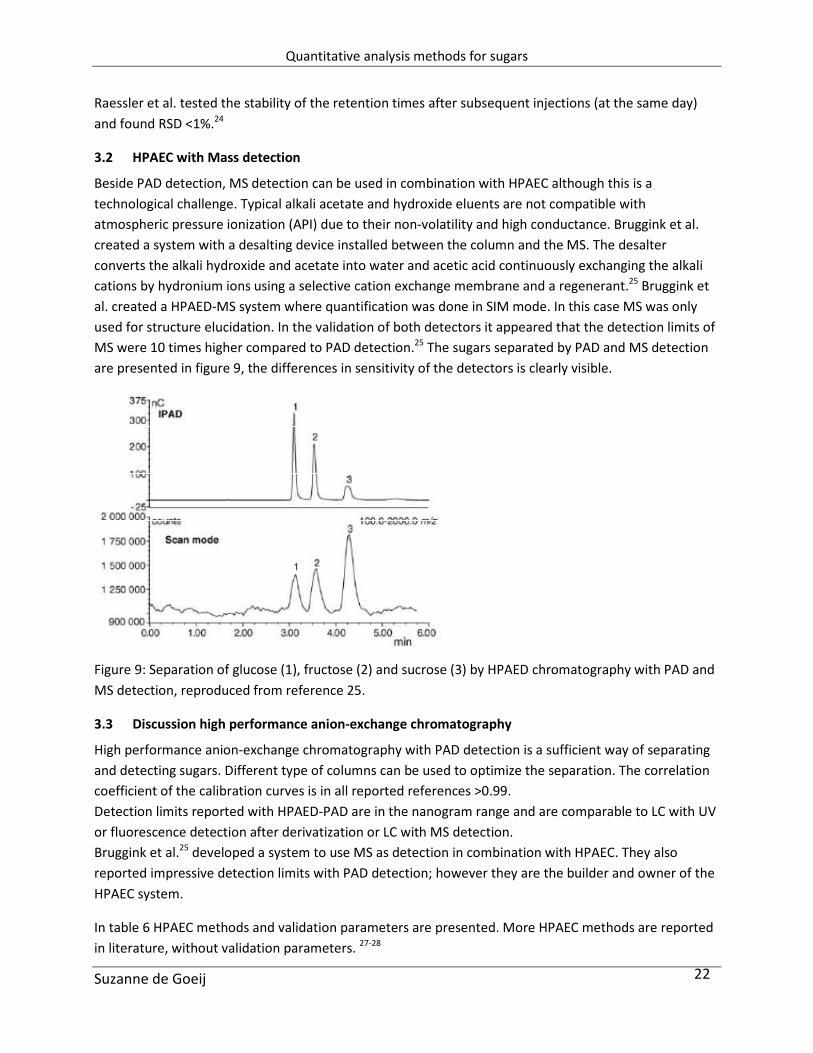
MS were 10 times higher compared to PAD detection.25
The sugars separated by PAD and MS detection
are presented in figure 9, the differences in sensitivity of the detectors is clearly visible.
Figure 9: Separation of glucose (1), fructose (2) and sucrose (3) by HPAED chromatography with PAD and
MS detection, reproduced from reference 25.
3.3 Discussion high performance anion-exchange chromatography
High performance anion-exchange chromatography with PAD detection is a sufficient way of separating
and detecting sugars. Different type of columns can be used to optimize the separation. The correlation
coefficient of the calibration curves is in all reported references >0.99.
Detection limits reported with HPAED-PAD are in the nanogram range and are comparable to LC with UV
or fluorescence detection after derivatization or LC with MS detection.
Bruggink et al.25
developed a system to use MS as detection in combination with HPAEC. They also
reported impressive detection limits with PAD detection; however they are the builder and owner of the
HPAEC system.
In table 6 HPAEC methods and validation parameters are presented. More HPAEC methods are reported
in literature, without validation parameters. 27-28
Quantitative analysis methods for sugars
Suzanne de Goeij
23
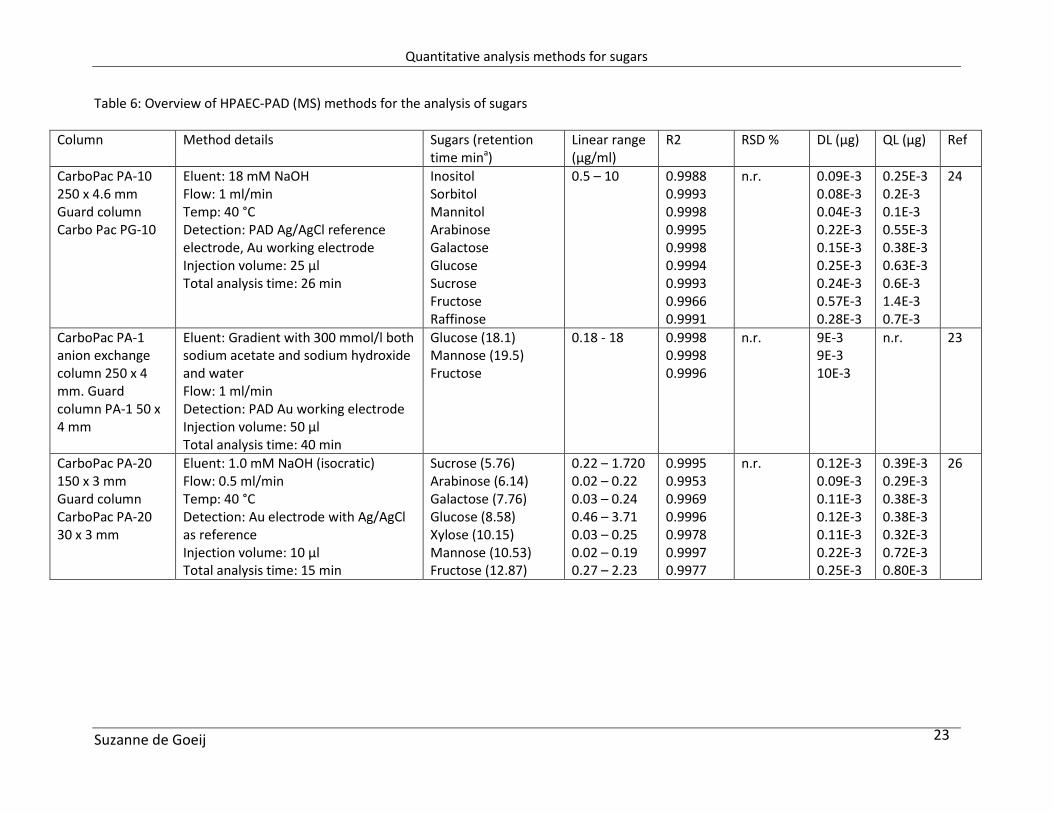
Table 6: Overview of HPAEC-PAD (MS) methods for the analysis of sugars
Column Method details Sugars (retention
time mina)
Linear range
(µg/ml)
R2 RSD % DL (µg) QL (µg) Ref
CarboPac PA-10
250 x 4.6 mm
Guard column
Carbo Pac PG-10
Eluent: 18 mM NaOH
Flow: 1 ml/min
Temp: 40 °C
Detection: PAD Ag/AgCl reference
electrode, Au working electrode
Injection volume: 25 µl
Total analysis time: 26 min
Inositol
Sorbitol
Mannitol
Arabinose
Galactose
Glucose
Sucrose
Fructose
Raffinose
0.5 – 10
0.9988
0.9993
0.9998
0.9995
0.9998
0.9994
0.9993
0.9966
0.9991
n.r. 0.09E-3
0.08E-3
0.04E-3
0.22E-3
0.15E-3
0.25E-3
0.24E-3
0.57E-3
0.28E-3
0.25E-3
0.2E-3
0.1E-3
0.55E-3
0.38E-3
0.63E-3
0.6E-3
1.4E-3
0.7E-3
24
CarboPac PA-1
anion exchange
column 250 x 4
mm. Guard
column PA-1 50 x
4 mm
Eluent: Gradient with 300 mmol/l both
sodium acetate and sodium hydroxide
and water
Flow: 1 ml/min
Detection: PAD Au working electrode
Injection volume: 50 µl
Total analysis time: 40 min
Glucose (18.1)
Mannose (19.5)
Fructose
0.18 - 18 0.9998
0.9998
0.9996
n.r. 9E-3
9E-3
10E-3
n.r. 23
CarboPac PA-20
150 x 3 mm
Guard column
CarboPac PA-20
30 x 3 mm
Eluent: 1.0 mM NaOH (isocratic)
Flow: 0.5 ml/min
Temp: 40 °C
Detection: Au electrode with Ag/AgCl
as reference
Injection volume: 10 µl
Total analysis time: 15 min
Sucrose (5.76)
Arabinose (6.14)
Galactose (7.76)
Glucose (8.58)
Xylose (10.15)
Mannose (10.53)
Fructose (12.87)
0.22 – 1.720
0.02 – 0.22
0.03 – 0.24
0.46 – 3.71
0.03 – 0.25
0.02 – 0.19
0.27 – 2.23
0.9995
0.9953
0.9969
0.9996
0.9978
0.9997
0.9977
n.r. 0.12E-3
0.09E-3
0.11E-3
0.12E-3
0.11E-3
0.22E-3
0.25E-3
0.39E-3
0.29E-3
0.38E-3
0.38E-3
0.32E-3
0.72E-3
0.80E-3
26

Quantitative analysis methods for sugars
Suzanne de Goeij
24
Column Method details Sugars (retention
time mina)
Linear range
(µg/ml)
R2 RSD % DL (µg) QL (µg) Ref
CarboPac PA-200
3 x 250 mm with a
CarboPac PA-200
3 x 50 mm guard
column
Eluent: 60 mM NaOH
Flow: 0.5 ml/min
Temp: 30 °C
Detection: Ag/AgCl reference
electrode and Au working electrode
and MS detection with electrospray
ionisation
Total analysis time: 6 min
Glucose
Fructose
Sucrose
n.r. 0.9999
0.9999
0.9999
n.r. 0.02E-3
0.04E-3
0.04E-3
0.27E-3b
0.21E-3
0.12E-3
25
n.r. Not reported in article a If reported
b Detection limits of Mass detection in SIM (selected ion monitoring) mode.
Quantitative analysis methods for sugars
Suzanne de Goeij
25
4 GAS CHROMATOGRAPHY (GC)
Beside liquid chromatography, gas chromatography is a good alternative for the analysis of sugars.
Compared to liquid chromatography the main advantage of GC is much higher separation power. In GC
many sugars can be detected, even chiral components, in relative short retention times. Although the
resolution in GC is much better compared to other techniques, a derivatization step is always required
which can be seen as a drawback.
4.1 Derivatization
Due to their high polarity, hydrophilicity and low volatility, all sugars needs to be converted into
volatilizable and stable derivatives prior to the GC or GC-MS analysis.
Preparation of carbohydrate derivatives for GC and GC–MS present several difficulties. First, there is a
high number of functional groups in the molecule (about one in each carbon atom, most of them being
hydroxyls). Secondly, the presence of different tautomeric forms in solution gives rise to complex
chromatograms. Finally, the lability of some molecules and in certain cases, the steric hindrance must be
considered.29
Due to the relatively low volatility of carbohydrates, GC analysis is limited to derivatized sugars of low
molecular weight, mainly mono-, di- and tri-saccharides. Classical derivatization methods consist in the
substitution of the polar groups of carbohydrates in order to increase their volatility. Methyl ethers,
acetates, trifluoroacetates and trimethylsilyl ethers are the most common derivatives used for
carbohydrate determination. The good volatility and stability characteristics of the derivatives formed
make trimethylsilyl (TMS) ethers the most popular derivatives applied to GC analysis of saccharides
which are reported in the references in table 6.29-30-31-32-33
Medeiros et al.30
determined the recoveries of derivative sugars, which is between 68 and 118 % for
different sugars at different levels. In the review of Ruiz-Matute et al. a summary of the most common
derivatization methods used for sugar analysis, including advantages and disadvantages, is presented.29
4.2 Detection
After derivatization detection can be done by FID (flame ionisation detector) and MS (mass
spectrometry). The FID detection is based on the detection of ions formed during combustion of organic
compounds in a hydrogen flame. The ions formed are proportional to the concentration of the organic
species in the gas stream. FID is a suitable detector for the detection of sugars. Beside FID detection also
MS detection is a proper detector for sugars analysis. Mass detection can be used in both full scan and in
single ion mode. Medeiros et al.30
reported detection limits in the range of 0.1-0.3 ng, also Gomez-
Gonzalez et al. detection limits in the low nanogram range.31
The detection limits of Gomez-Gonzalez et
al. are slightly lower compared to the limits reported by Medeiros et al. This can be explained by the
differences in MS detection, Medeiros et al. quantified the sugars in TIC (total ion current) mode, while
Gomez-Gonzales et al. used SRM (single reaction monitoring).
Quantitative analysis methods for sugars
Suzanne de Goeij
26
Medeiros et al. determined the reproducibility of the analytical procedure through the relative standard
deviation of replicate measurement. The RSD values ranged from 5.5 – 9.3%.30
Fernandez-Artigas et al. reported a RSD range of 3.8 – 5.6% for the precision study.32
Fuzfai et al.
reported an average RSD of 3.3%. 35
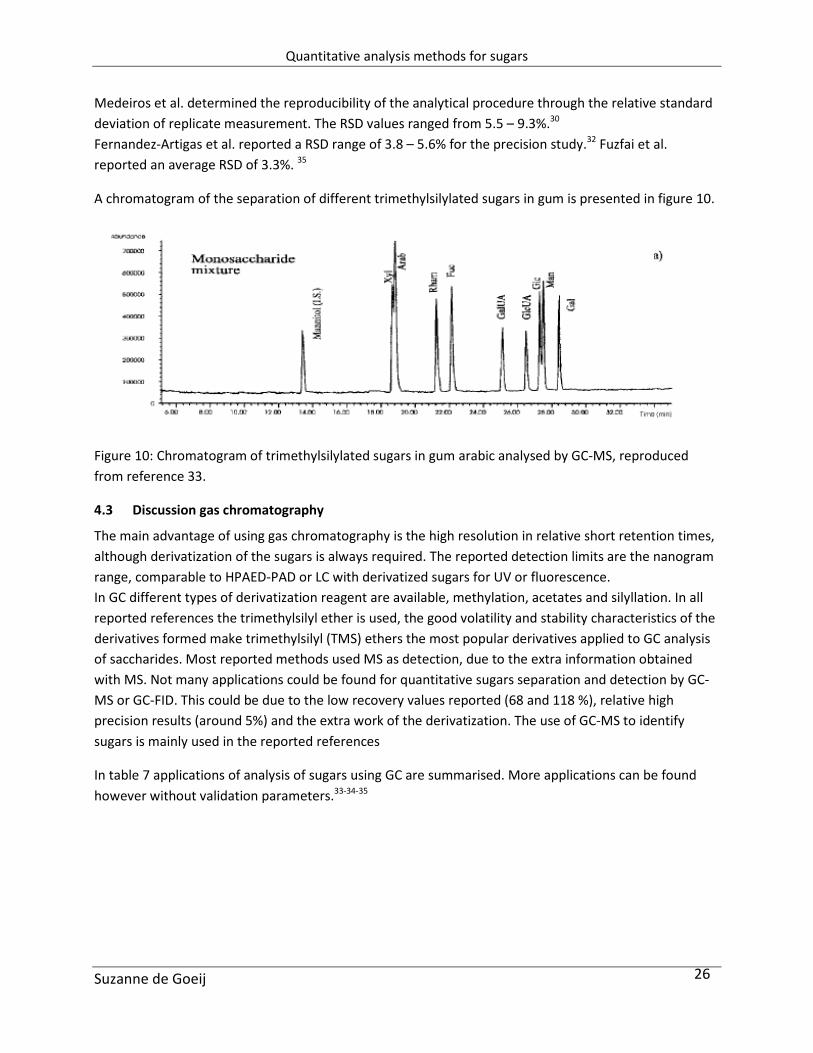
A chromatogram of the separation of different trimethylsilylated sugars in gum is presented in figure 10.
Figure 10: Chromatogram of trimethylsilylated sugars in gum arabic analysed by GC-MS, reproduced
from reference 33.
4.3 Discussion gas chromatography
The main advantage of using gas chromatography is the high resolution in relative short retention times,
although derivatization of the sugars is always required. The reported detection limits are the nanogram
range, comparable to HPAED-PAD or LC with derivatized sugars for UV or fluorescence.
In GC different types of derivatization reagent are available, methylation, acetates and silyllation. In all
reported references the trimethylsilyl ether is used, the good volatility and stability characteristics of the
derivatives formed make trimethylsilyl (TMS) ethers the most popular derivatives applied to GC analysis
of saccharides. Most reported methods used MS as detection, due to the extra information obtained
with MS. Not many applications could be found for quantitative sugars separation and detection by GC-
MS or GC-FID. This could be due to the low recovery values reported (68 and 118 %), relative high
precision results (around 5%) and the extra work of the derivatization. The use of GC-MS to identify
sugars is mainly used in the reported references
In table 7 applications of analysis of sugars using GC are summarised. More applications can be found
however without validation parameters.33-34-35

Quantitative analysis methods for sugars
Suzanne de Goeij
27
Table 7: Overview of GC methods for the analysis of sugars
Column Method details Sugars (retention time mina)
(α, β if applicable)
Linear range
(µg/ml)
R2 RSD % DL (µg) QL (µg) Ref
DB5-MS capillary
column 30 m x
0.25mm I.D. and
film thickness of
0.25 µm
Carrier gas: He
Constant flow 1.3 mL/min.
MS source temp: 230◦C
Injection: Split less mode, split less time
30 s.
Injector temp: 280°C
Injection volume: 1 µl
Temp program: Consisted of injection at
65 ◦C and hold for 2 min, temperature
increase of 6 ◦C/min to 300 ◦C, followed
by an isothermal hold at 300 ◦C for 15
min
Total analysis time: 45 min
Glucose (24.53 – 26.02)
Levoglucosan (21.11)
Sorbitol (25.33)
Sucrose (35.33)
More sugars separated, 4
sugars (groups) validated
2.0 – 200
1.6 – 160
1.9 – 190
1.2 – 120
Recovery in
range 68-118%
0.9857
0.9998
0.9975
0.9990
7.4
7.5
9.3
5.5
0.15E-3
0.13E-3
0.36E-3
0.28E-3
n.r. 30b
Factor Four fused-
silica capillary
column
VF-5 ms, 30 m x
0.25 mm, 0.25 μm
Carrier gas: He
Constant flow 1.3 mL/min
Detection: MS
Injection: split/splitless mode
Injector temp: 280 °C
Injection volume: 1µl
Temp program: initial temperature = 65
°C (held for 2 min), increased at 6 °C/min
to 300 °C (held for 30 min)
Total analysis time: 50 min
Arabinose (19.69, 19.75)
Xylose (21.56, 22.50)
Glucose (24.83, 26.75)
Mannose (22.85)
Galactose (24.10, 24.98)
Fructose (23.14, 23.29)
Sucrose (35.15)
Rhamnose (19.69, 21.19)
Xylitol (21.39)
Mannitol (25.21)
All range 0.1 –
150
0.997
0.998
0.997
0.997
0.997
0.995
0.990
0.994
0.997
0.996
n.r. 0.076E-3
0.076E-3
0.015E-3
0.30E-3
0.076E-3
0.03E-3
0.015E-3
0.076E-3
0.076E-3
0.076E-3
0.25E-3
0.25E-3
0.05E-3
1.0E-3
0.25E-3
0.1E-3
0.05E-3
0.25E-3
0.25E-3
0.25E-3
31c
Quantitative analysis methods for sugars
Suzanne de Goeij
28
Column Method details Sugars (retention time mina)
(α, β if applicable)
Linear range
(µg/ml)
R2 RSD % DL (µg) QL (µg) Ref
The fused silica
capillary column
C-382 25QC2/SGL-
1; 25 m x 0.25 mm
I.D., 0.25 mm film
thickness coated
with 100%
dimethyl
polysiloxane
Carrier gas: N2
Constant flow 1.5 mL/min
Detection: FID
Injection split ratio: 1:20
Injection temp: 290°C
Detector temp: 300°C
Temp program: Initial temperature was
180 °C, followed by a heating rate of
3°C/min to 280°C. The final
temperature was maintained for 23 min
Total analysis time: not reported
Fructose
Glucose
Sucrose
Maltose
Raffinose
n.r. 0.999
0.998
0.998
0.998
0.997
5.6
5.3
4.1
3.8
-
n.r. n.r. 32d
30m x 0.25 mm I.
D. fused-silica
column coated
with a 0.25 µL film
of SE-54
Carrier gas: He
Detection: MS
Inlet pressure of 110 kPa
Split-splitless injector
Injection temp: 300°C
Temp program: from 165°C up to235°C
at2°C/min
Total analysis time: 35 min
Xylose (17.79)
Arabinose(18.92)
Rhamnose(21.42Fucose
(22.31)
Glucose (27.41)
Mannose (27.63)
Galactose(28.57)
n.r. n.r. n.r. n.r. n.r 33e
n.r. Not reported in article a If reported
b The MS was operated in the electron impact mode with an ionization energy of 70 eV. The scan range was set from 50 to 650 Da at 1.27 scan/s
Derivatization performed using N,O-bis-(trimethylsilyl)trifluoroacetamide (BSTFA) containing 1% trimethylchlorosilane (TMCS) and pyridine. c ion trap mass spectrometer was operated in the electron impact ionization (EI) positive mode, for which the instrumental parameters were set
at the following values: filament emission current=80 μA; transfer line, ion trap, and manifold temperatures=280, 200, and 50 °C, respectively. A
filament multiplier delay of 6 min was established to prevent instrument damage. The MS/MS step was carried out by collision induced
dissociation (CID) in non-resonant excitation mode. Derivatization to obtain the trimethylsilyl derivatives using 100 μL of BSTFA containing 2%
TMCS d The carbohydrate analysis was based on the preparation of the oxime trimethylsilyl sugar (TMS) ethers. Detection by FID. No full validation is
reported. e No validation parameters reported. Derivatization with Trimethylsilylation pyridine (50 µl) and hexamethyldisilazane (100 µl). The operating MS
conditions were electron impact ionisation (70eV), scan rate 1 scans 1 over the range m/z 40 650, and source temperature 200 °C, EI in TIC mode.
Quantitative analysis methods for sugars
Suzanne de Goeij
29
5 CAPILLARY ELECTROPHORESIS (CE)
Besides liquid and gas chromatography, a number of analytical methods are described using capillary
electrophoresis as separation technique for the separation of sugars. CE utilizes an open tubular
capillary, which can be rapidly flushed with fresh buffer directly after detection of interesting peaks and
be prepared for the next injection. It is a powerful technique concerning the simplicity, short analysis
time, efficiency and low sample consumption.
Due to the pKa of monosaccharide’s being more than 11, monosaccharide’s are negatively charged in
strong basic running buffer and can be further separated under a fixed electric field. For improving the
separation efficiency, some surface-active agents, such as SDS, tetrahydrofuran (THF),
hexadecyltrimethylammonium bromide (CTAB), etc. can be added into the running buffer.36
5.1 Detection in Capillary Electrophoresis
As well as LC and GC chromatographic methods, detection of sugars in CE is challenging because of the
absence of chromophoric groups. In this review the CE separation of sugars is described and compared
with three types of detection: UV after derivatization37-38-39
, indirect UV detection40-41-42
and
amperometric/electrochemical detection43-44-45-46
. All different types of detection are discussed and
tabulated separately.
5.1.1 UV detection after derivatization
Carbohydrates lack a light-absorbing chromophore, which makes direct UV detection impossible unless a
derivatization procedure is involved prior to analysis. The combination of a sensitive functional group
such as pyrazolone together with a strong absorption moiety would result in an attractive reagent. The
reagent 1-phenyl-3-methyl-5-pyrazolone (PMP) with strong UV absorbance at 245 nm is a popular label
for the HPLC method that can react with reducing carbohydrates under mild conditions, requiring no
acids catalyst and causing no isomerisation. Wang et al. used this reagent for derivatization with a
recovery of 94 – 102.5 %.39
Beside PMP also 1-(2-naphthyl)-3-methylpyrazolone (NMP) is reported as
derivatization reagent. 37-38
You et al. reported a recovery of 93.9 – 105.1 % using NMP as derivatization
reagent.37
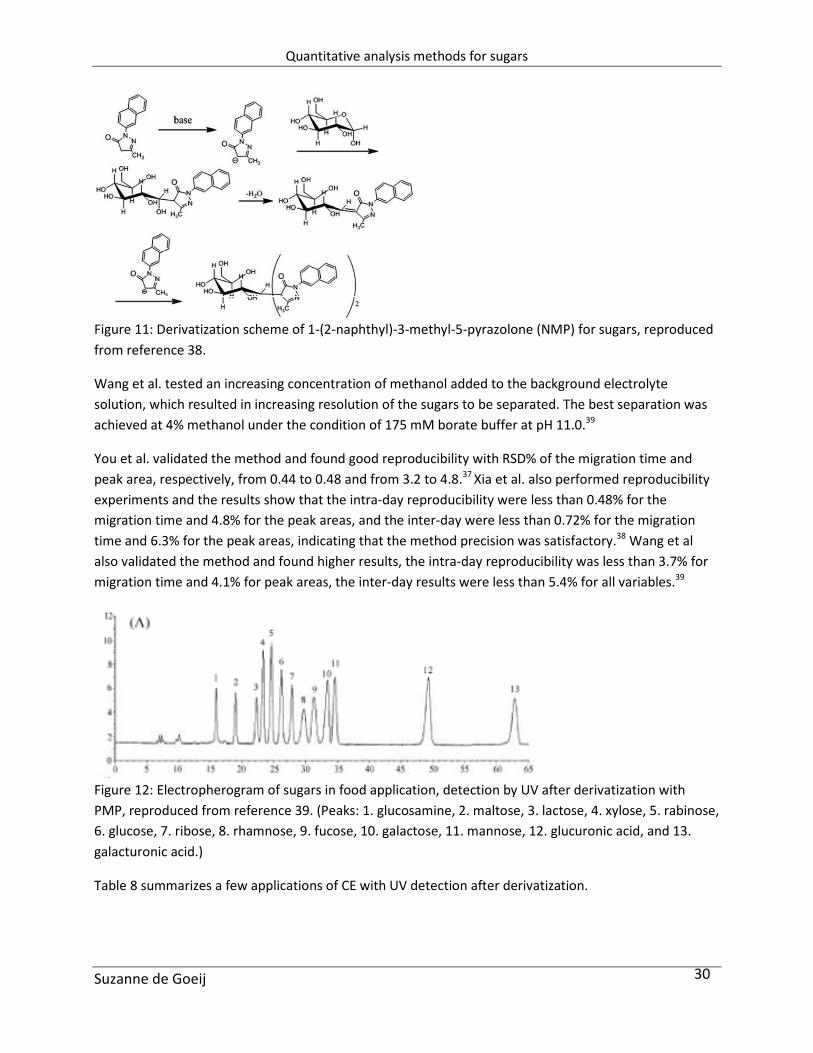
The reaction of NMP with sugars is presented in figure 11.
Quantitative analysis methods for sugars
Suzanne de Goeij
30
Figure 11: Derivatization scheme of 1-(2-naphthyl)-3-methyl-5-pyrazolone (NMP) for sugars, reproduced
from reference 38.
Wang et al. tested an increasing concentration of methanol added to the background electrolyte
solution, which resulted in increasing resolution of the sugars to be separated. The best separation was
achieved at 4% methanol under the condition of 175 mM borate buffer at pH 11.0.39
You et al. validated the method and found good reproducibility with RSD% of the migration time and
peak area, respectively, from 0.44 to 0.48 and from 3.2 to 4.8.37
Xia et al. also performed reproducibility
experiments and the results show that the intra-day reproducibility were less than 0.48% for the
migration time and 4.8% for the peak areas, and the inter-day were less than 0.72% for the migration
time and 6.3% for the peak areas, indicating that the method precision was satisfactory.38
Wang et al
also validated the method and found higher results, the intra-day reproducibility was less than 3.7% for
migration time and 4.1% for peak areas, the inter-day results were less than 5.4% for all variables.39
Figure 12: Electropherogram of sugars in food application, detection by UV after derivatization with
PMP, reproduced from reference 39. (Peaks: 1. glucosamine, 2. maltose, 3. lactose, 4. xylose, 5. rabinose,
6. glucose, 7. ribose, 8. rhamnose, 9. fucose, 10. galactose, 11. mannose, 12. glucuronic acid, and 13.
galacturonic acid.)
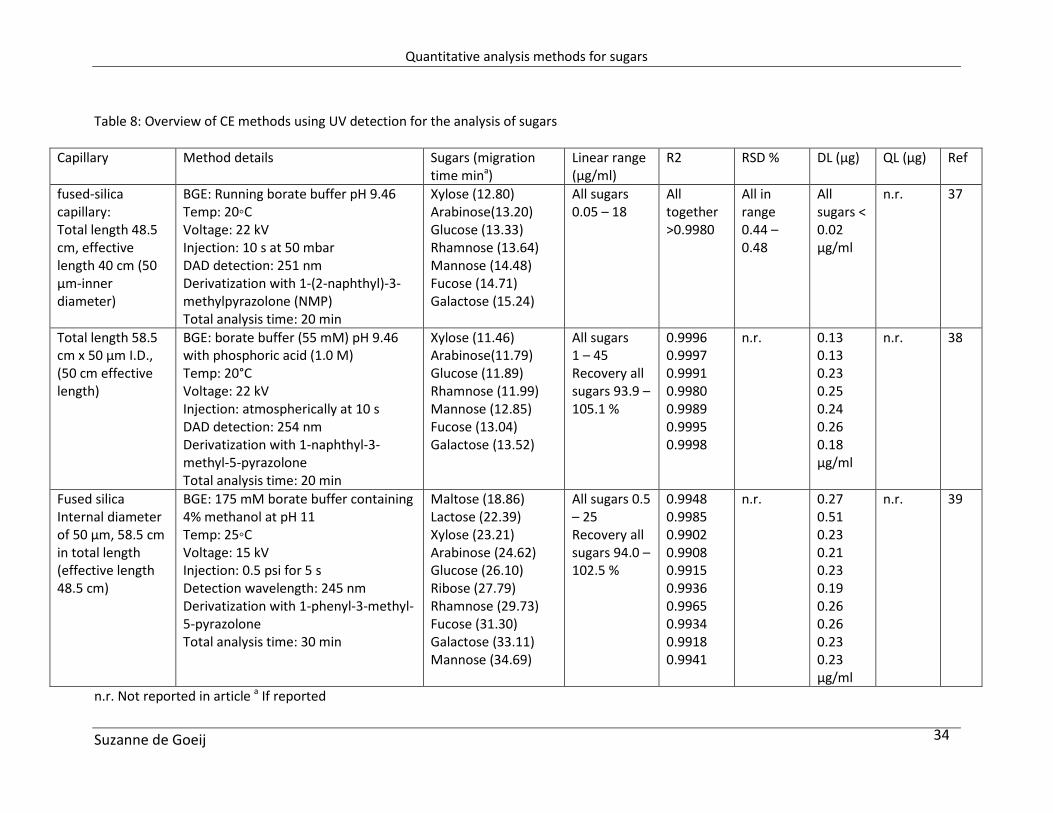
Table 8 summarizes a few applications of CE with UV detection after derivatization.

Quantitative analysis methods for sugars
Suzanne de Goeij
31
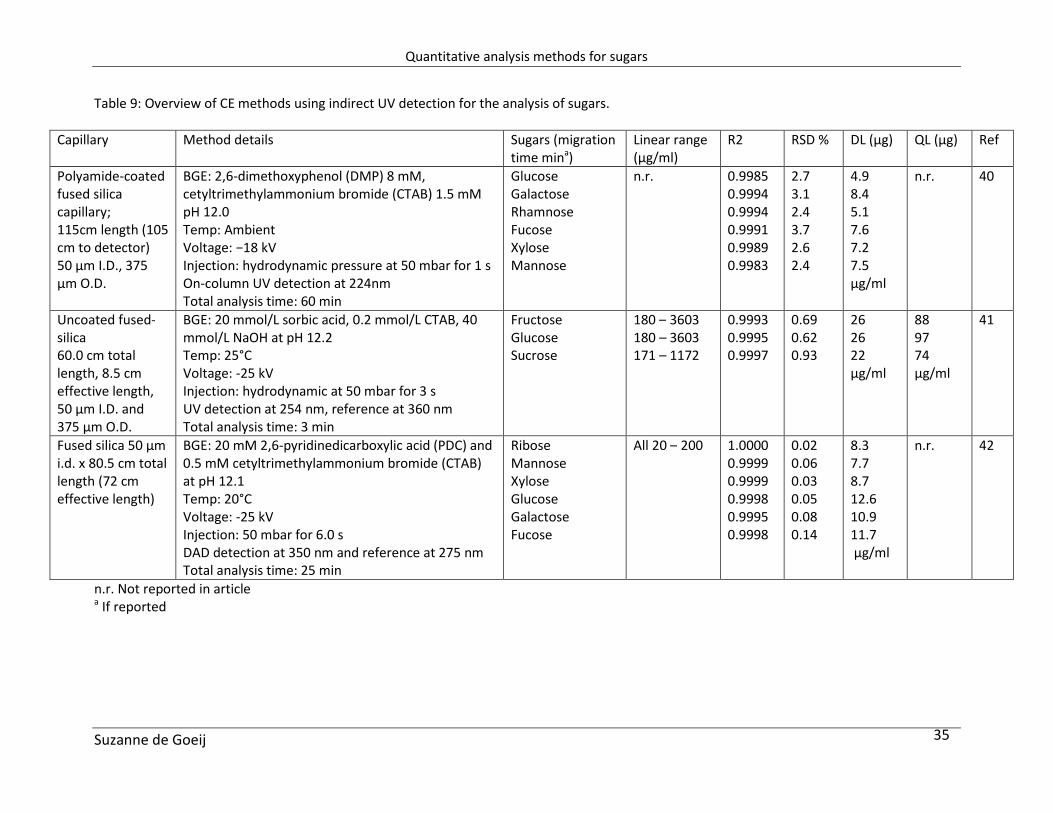
5.1.2 Indirect UV
As discussed previously, direct UV detection of sugars is impossible. However adding an UV active
reagent to the background electrolyte makes indirect UV detection possible. A highly alkaline pH
condition was used in order to charge carbohydrates negatively and to promote migration towards the
anode. Electroosmotic flow was reversed to the direction of the anode by adding
cetyltrimethylammonium bromide CTAB) to the electrolyte. All references use CTAB in combination with
an UV active compound in the BGE. Rizelio et al. selected sorbate as the co-ion because it is a strong
chromophore with mobility similar to that of fructose, glucose and sucrose.41
Gao et al. used 2,6-
dimethoxyphenol (DMP) for indirect UV detection as the electrophoretic mobility of DMP matches well
with that of monosaccharide’s and DMP has a high extinction coefficient or high UV absorption at the
detection wavelength chosen which ensures an enhanced detectability. The limitation of choosing DMP
to facilitate indirect UV detection is that DMP is prone to be oxidized under exposure of air or light and
the BGE has to be made freshly to maintain a constant pH. 40
Soga et al. selected 2,6-pyridinedicarboxylic acid (PDC) for this work based on its excellent capacity for
anion analysis by indirect UV detection.42
An electropherogram of the separation done by Soga et al. is
presented in figure 13.
In all cases similar results were obtained with respect to separation of sugars and detection limits.
Figure 13: Determination of sugars in glycoproteins by capillary electrophoresis with indirect UV
detection, reproduced from reference 42.
Gao et al. determined the repeatability and found RSD values of less than 2.2% for migration time and
less than 2.5% for peak height.40
Rizelio et al. reported RSD values of the migration time and peak are all
below 5%.41
Soga et al. determined the RSD% for migration time < 0.23% and for peak area < 2.7%.42
In table 9 applications are summarized using CE and indirect UV detection.40-41-42

Quantitative analysis methods for sugars
Suzanne de Goeij
32
5.1.3 Amperometric/Electrochemical Detection
Another option in CE detection is electrochemical detection, especially amperometric detection.
This detection technique is suitable for analysis of sugars because the electro active hydroxyl groups in
carbohydrates can be catalytically oxidized to produce significant current responses on the surface of
metal electrodes such as copper and nickel disk electrodes. This is reported in several papers.43-44-45
Carbohydrates are not considered electro-active compounds under normal amperometric conditions at
the surface of carbon electrodes. Luo et al. have developed several electrode materials for the catalytic
oxidation of carbohydrates at constant applied potentials; one of these electrodes is copper electrode. 47
All reported references selected copper disk electrode acting as working electrode for the determination
of the sugars.43-44-45
In order to select a proper potential applied to the working electrode, Hu et al. performed hydrodynamic
voltammograms for three sugars. The response of the three sugars was monitored after separation at
different applied potentials. Considering the detection sensitivity of the studied analyzes and the
baseline noise, Hu et al. choose a potential of 0.65 V (vs. Ag/AgCl, 3 mol/l KCl) for detection.43
In all cases NaOH is used as background electrolyte. The alkaline conditions also satisfied the pH
requirements for the proper performance of the Cu microelectrode in the electro-catalytic detection of
sugars. Yang et al. tested the NaOH concentration from 30 to 150 mmol/L. Increasing the NaOH
concentration resulted in better separation of the desired sugars however, also the noise level increased
by increasing NaOH concentration. Finally 120 mmol/L was selected as separation electrolyte.44
Coa et al.
and Hu et al. selected 50 mmol/L NaOH concentration as running buffer to obtain satisfactory separation
in relative short analysis time.43-45
An example of the separation of the sugars by Yang et al. is presented
in figure 14.
Figure 14: Electropherogram of sugars by CE with amperometric detection, reproduced from reference
44. (1: fucose, 2: galactose, 3: glucose, 4: rhamnose, 5: arabinose, 6: fructose and 7: xylose)

Quantitative analysis methods for sugars
Suzanne de Goeij
33
Hu et al. and Yang et al. were able to separate their interested sugars within 30 minutes were Coa et al.
managed the separation of the desired sugars within 15 minutes.
Hu et al. validated the method on precision and found the precisions of migration time and peak current
(in terms of relative standard deviation(RSD)) were 0.17 - 0.24% and 2.32- 2.81%, respectively. 43
Yang et al. found the RSD of the migration time <1% and the RSD of the peak area was <5%. 44
Beside amperometric detection using a copper electrode, applications are reported tris(2,2′-
bipyridyl)ruthenium(II) [Ru(bpy)3 3+
]-based electrogenerated chemiluminescence (ECL) detection.46
Li et
al. used in the CE a Pt working electrode (1.0 mm in diameter), a Pt wire counter electrode (1 mm in
diameter) and a Ag/AgCl reference electrode in a conventional three-electrode system. Controlled
potential electrolysis for Ru(bpy)3 2+
oxidation was carried out with an electrochemical analyser. The ECL
light was captured by a photomultiplier tube (PMT). Derivatization is still required; Li et al. used 2-
diethylaminoethanethiol (DEAET) as a derivatization reagent.46
Table 10 represents a few applications of CE using amperometric and electrochemical detection.
5.2 Discussion Capillary Electrophoresis
CE is a good alternative for the separation of sugars. In relative short retention times (within ~ 30
minutes) separation of different sugars can be achieved. For the optimization of the required separation
of the sugars different capillaries can be used. Due to the pKa of monosaccharides being more than 11,
monosaccharides are negatively charged in strong basic running buffer, like borate or NaOH buffer.
Playing around with the concentration of the running buffer can improve the separation.
After separation a few possible detection methods are available; UV after derivatization, indirect UV and
electrochemical detection. UV after derivatization always requires extra work where the recovery need
to be taken into account. Reported recoveries are >95%. Indirect UV results in significant higher
detection limits compared to UV with derivatization and electrochemical detection. Advantage of
indirect UV is that limited extra work is required.
All detectors reported repeatability results of the migration time and peak are <5%, mostly <1% for
migration time. Reproducibility results reported are <6%.
Quantitative analysis methods for sugars
Suzanne de Goeij
34
Table 8: Overview of CE methods using UV detection for the analysis of sugars
Capillary Method details Sugars (migration
time mina)
Linear range
(µg/ml)
R2 RSD % DL (µg) QL (µg) Ref
fused-silica
capillary:
Total length 48.5
cm, effective
length 40 cm (50
µm-inner
diameter)
BGE: Running borate buffer pH 9.46
Temp: 20◦C
Voltage: 22 kV
Injection: 10 s at 50 mbar
DAD detection: 251 nm
Derivatization with 1-(2-naphthyl)-3-
methylpyrazolone (NMP)
Total analysis time: 20 min
Xylose (12.80)
Arabinose(13.20)
Glucose (13.33)
Rhamnose (13.64)
Mannose (14.48)
Fucose (14.71)
Galactose (15.24)
All sugars
0.05 – 18
All
together
>0.9980
All in
range
0.44 –
0.48
All
sugars <
0.02
µg/ml
n.r. 37
Total length 58.5
cm x 50 µm I.D.,
(50 cm effective
length)
BGE: borate buffer (55 mM) pH 9.46
with phosphoric acid (1.0 M)
Temp: 20°C
Voltage: 22 kV
Injection: atmospherically at 10 s
DAD detection: 254 nm
Derivatization with 1-naphthyl-3-
methyl-5-pyrazolone
Total analysis time: 20 min
Xylose (11.46)
Arabinose(11.79)
Glucose (11.89)
Rhamnose (11.99)
Mannose (12.85)
Fucose (13.04)
Galactose (13.52)
All sugars
1 – 45
Recovery all
sugars 93.9 –
105.1 %
0.9996
0.9997
0.9991
0.9980
0.9989
0.9995
0.9998
n.r. 0.13
0.13
0.23
0.25
0.24
0.26
0.18
µg/ml
n.r. 38
Fused silica
Internal diameter
of 50 µm, 58.5 cm
in total length
(effective length
48.5 cm)
BGE: 175 mM borate buffer containing
4% methanol at pH 11
Temp: 25◦C
Voltage: 15 kV
Injection: 0.5 psi for 5 s
Detection wavelength: 245 nm
Derivatization with 1-phenyl-3-methyl-
5-pyrazolone
Total analysis time: 30 min
Maltose (18.86)
Lactose (22.39)
Xylose (23.21)
Arabinose (24.62)
Glucose (26.10)
Ribose (27.79)
Rhamnose (29.73)
Fucose (31.30)
Galactose (33.11)
Mannose (34.69)
All sugars 0.5
– 25
Recovery all
sugars 94.0 –
102.5 %
0.9948
0.9985
0.9902
0.9908
0.9915
0.9936
0.9965
0.9934
0.9918
0.9941
n.r. 0.27
0.51
0.23
0.21
0.23
0.19
0.26
0.26
0.23
0.23
µg/ml
n.r. 39
n.r. Not reported in article a If reported
Quantitative analysis methods for sugars
Suzanne de Goeij
35
Table 9: Overview of CE methods using indirect UV detection for the analysis of sugars.
Capillary Method details Sugars (migration
time mina)
Linear range
(µg/ml)
R2 RSD % DL (µg) QL (µg) Ref
Polyamide-coated
fused silica
capillary;
115cm length (105
cm to detector)
50 µm I.D., 375
µm O.D.
BGE: 2,6-dimethoxyphenol (DMP) 8 mM,
cetyltrimethylammonium bromide (CTAB) 1.5 mM
pH 12.0
Temp: Ambient
Voltage: −18 kV
Injection: hydrodynamic pressure at 50 mbar for 1 s
On-column UV detection at 224nm
Total analysis time: 60 min
Glucose
Galactose
Rhamnose
Fucose
Xylose
Mannose
n.r. 0.9985
0.9994
0.9994
0.9991
0.9989
0.9983
2.7
3.1
2.4
3.7
2.6
2.4
4.9
8.4
5.1
7.6
7.2
7.5
µg/ml
n.r. 40
Uncoated fused-
silica
60.0 cm total
length, 8.5 cm
effective length,
50 µm I.D. and
375 µm O.D.
BGE: 20 mmol/L sorbic acid, 0.2 mmol/L CTAB, 40
mmol/L NaOH at pH 12.2
Temp: 25°C
Voltage: -25 kV
Injection: hydrodynamic at 50 mbar for 3 s
UV detection at 254 nm, reference at 360 nm
Total analysis time: 3 min
Fructose
Glucose
Sucrose
180 – 3603
180 – 3603
171 – 1172
0.9993
0.9995
0.9997
0.69
0.62
0.93
26
26
22
µg/ml
88
97
74
µg/ml
41
Fused silica 50 µm
i.d. x 80.5 cm total
length (72 cm
effective length)
BGE: 20 mM 2,6-pyridinedicarboxylic acid (PDC) and
0.5 mM cetyltrimethylammonium bromide (CTAB)
at pH 12.1
Temp: 20°C
Voltage: -25 kV
Injection: 50 mbar for 6.0 s
DAD detection at 350 nm and reference at 275 nm
Total analysis time: 25 min
Ribose
Mannose
Xylose
Glucose
Galactose
Fucose
All 20 – 200 1.0000
0.9999
0.9999
0.9998
0.9995
0.9998
0.02
0.06
0.03
0.05
0.08
0.14
8.3
7.7
8.7
12.6
10.9
11.7
µg/ml
n.r. 42
n.r. Not reported in article a If reported
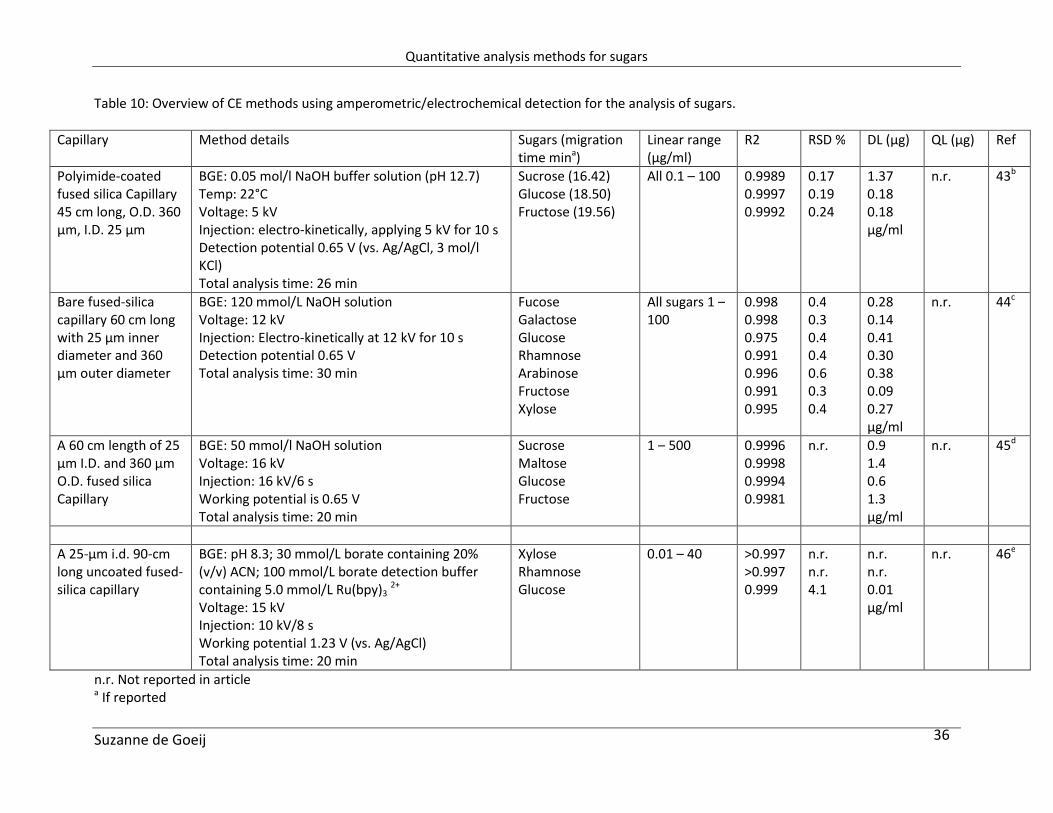
Quantitative analysis methods for sugars
Suzanne de Goeij
36
Table 10: Overview of CE methods using amperometric/electrochemical detection for the analysis of sugars.
Capillary Method details Sugars (migration
time mina)
Linear range
(µg/ml)
R2 RSD % DL (µg) QL (µg) Ref
Polyimide-coated
fused silica Capillary
45 cm long, O.D. 360
µm, I.D. 25 µm
BGE: 0.05 mol/l NaOH buffer solution (pH 12.7)
Temp: 22°C
Voltage: 5 kV
Injection: electro-kinetically, applying 5 kV for 10 s
Detection potential 0.65 V (vs. Ag/AgCl, 3 mol/l
KCl)
Total analysis time: 26 min
Sucrose (16.42)
Glucose (18.50)
Fructose (19.56)
All 0.1 – 100 0.9989
0.9997
0.9992
0.17
0.19
0.24
1.37
0.18
0.18
µg/ml
n.r. 43b
Bare fused-silica
capillary 60 cm long
with 25 µm inner
diameter and 360
µm outer diameter
BGE: 120 mmol/L NaOH solution
Voltage: 12 kV
Injection: Electro-kinetically at 12 kV for 10 s
Detection potential 0.65 V
Total analysis time: 30 min
Fucose
Galactose
Glucose
Rhamnose
Arabinose
Fructose
Xylose
All sugars 1 –
100
0.998
0.998
0.975
0.991
0.996
0.991
0.995
0.4
0.3
0.4
0.4
0.6
0.3
0.4
0.28
0.14
0.41
0.30
0.38
0.09
0.27
µg/ml
n.r. 44c
A 60 cm length of 25
µm I.D. and 360 µm
O.D. fused silica
Capillary
BGE: 50 mmol/l NaOH solution
Voltage: 16 kV
Injection: 16 kV/6 s
Working potential is 0.65 V
Total analysis time: 20 min
Sucrose
Maltose
Glucose
Fructose
1 – 500 0.9996
0.9998
0.9994
0.9981
n.r. 0.9
1.4
0.6
1.3
µg/ml
n.r. 45d
A 25-µm i.d. 90-cm
long uncoated fused-
silica capillary
BGE: pH 8.3; 30 mmol/L borate containing 20%
(v/v) ACN; 100 mmol/L borate detection buffer
containing 5.0 mmol/L Ru(bpy)3 2+
Voltage: 15 kV
Injection: 10 kV/8 s
Working potential 1.23 V (vs. Ag/AgCl)
Total analysis time: 20 min
Xylose
Rhamnose
Glucose
0.01 – 40 >0.997
>0.997
0.999
n.r.
n.r.
4.1
n.r.
n.r.
0.01
µg/ml
n.r. 46e
n.r. Not reported in article a If reported
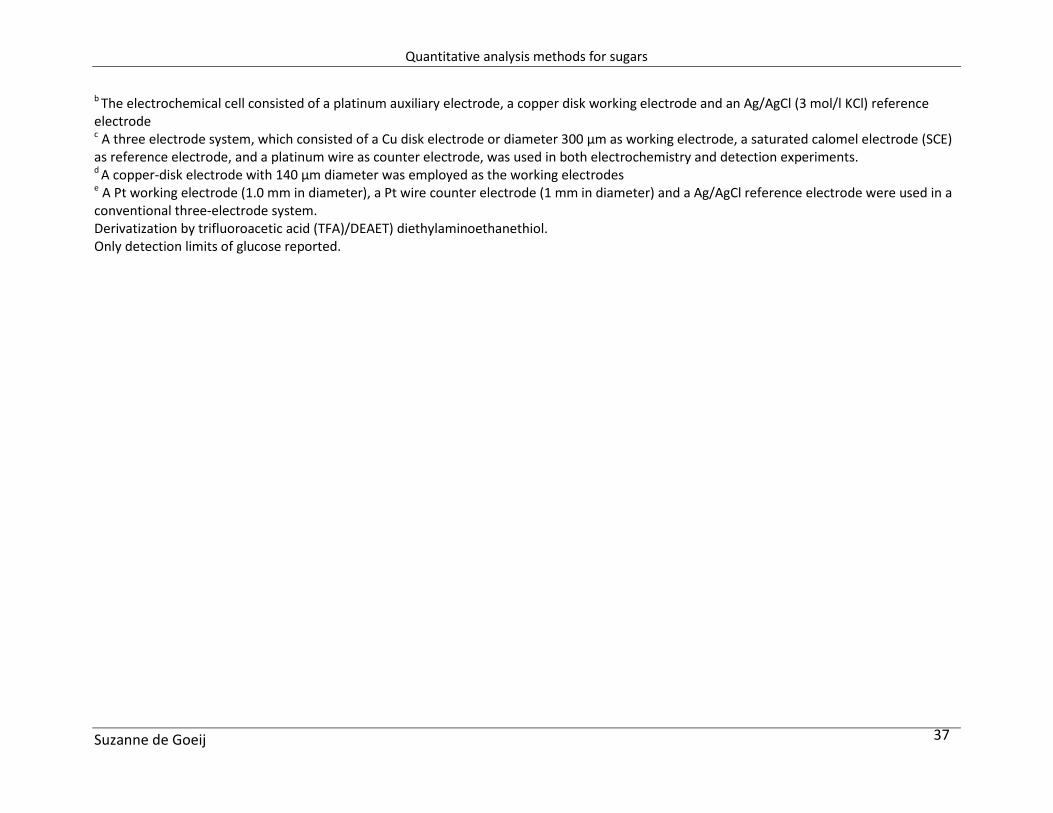
Quantitative analysis methods for sugars
Suzanne de Goeij
37
b The electrochemical cell consisted of a platinum auxiliary electrode, a copper disk working electrode and an Ag/AgCl (3 mol/l KCl) reference
electrode c A three electrode system, which consisted of a Cu disk electrode or diameter 300 µm as working electrode, a saturated calomel electrode (SCE)
as reference electrode, and a platinum wire as counter electrode, was used in both electrochemistry and detection experiments. d
A copper-disk electrode with 140 µm diameter was employed as the working electrodes e A Pt working electrode (1.0 mm in diameter), a Pt wire counter electrode (1 mm in diameter) and a Ag/AgCl reference electrode were used in a
conventional three-electrode system.
Derivatization by trifluoroacetic acid (TFA)/DEAET) diethylaminoethanethiol.
Only detection limits of glucose reported.

Quantitative analysis methods for sugars
Suzanne de Goeij
38
6 CONCLUSION
The separation and quantitative analysis of sugars is challenging for several reasons. To find a proper
technique, column and detector makes separation and detection of quantitative sugars analysis a
challenge.
Liquid chromatography is the most popular technique to detect sugars although there are several
challenges to overcome. Special columns are on the market for sugars separation, but in all cases
method development is still required and not always optimum baseline separation is achieved. Typical
analysis times are between 30 – 50 minutes.
Detection of sugars in LC gives several possibilities, ELSD, RI, UV, MS, Fluorescence and CAD, all with their
own advantages and disadvantages.
A disadvantage of the ELSD is the low reproducibility, slightly low sensitivity to low molecular weight
components and the non-linearity of the detector. An advantage is relative simple use of the detector.
The use of ELSD in combination with the separation of sugars has been reported by different authors.
With the use of different columns for the separation, detection limits in the same order were found (in
the order of 0.1 – 1 µg per injection). A recovery of 93 – 99.9 % was reported and an intra- and inter-day
precision as % RSD of the retention time and peak are < 2 %.
The response of RI detection results in linear calibration curves. A disadvantage in RI detection is the
temperature sensitivity, small fluctuations in temperature results in high variations. RI detection cannot
be used in combination with gradients which makes method development limited. Detection limits of RI
are in the same range as ELSD applications. Castellari et al. found excellent recoveries (>99.3%) and
precision results <1%.2 However other authors reported lower recoveries (between 89 – 113%) and
higher precision values, repeatability <1.5% and reproducibility <7.0%.
Mass spectrometry is also an option for the detection of sugars. Mass spectrometry for the detection of
sugars is difficult due to the low efficiency of ionization related to the low acidic character of sugars.
Several applications are reported were sugars were analysed as their sodium adduct, acetate adduct or
chloride adduct. Compared to the detection limits of other detectors, the lowest limits were reported by
Hammad et al. using a quadrupole MS, detection limits in pg range per injection are reported.16
Although
very low detection limits are reported (pg range) the precision is around 5% and the average recovery is
around 60% for all sugars. Comparable precision values are found in other applications.
Beside quantification, the use of MS can generate information about chemical structures which can be
very useful development phases.
For detection by UV a derivatization reagent is required. Applications are reported where 1-Phenyl-3-
methyl-5-pyrazolone7 and p-aminobenzoic ethyl ester
8 is used as derivatization reagent, with recoveries
between 90 – 120 %. The reported detection limits are in the nanogram range, which is significant lower
compared to the reported detection limits by ELSD and RI. The reported values for precision are <2.4%
for intra-day precision and <5% for inter-day precision.
Quantitative analysis methods for sugars
Suzanne de Goeij
39
Different derivatization reagents are applicable for detection by fluorescence. Low detection limits are
reported with the use of anthranilic acid9 and benzamidide
19 as derivatization reagent. The detection
limits of sugar separation with the use of a fluorescence detector are significant lower compared to the
ELSD and RI detection, and comparable to the detection limits found by UV after derivatization, however
a derivatization step is always required.
Another type of liquid chromatography is high-performance anion-exchange chromatography with PAD
detection. Different types of columns can be used to optimize the separation. The correlation coefficient
of the calibration curves is in all reported references >0.99. Detection limits reported with HPAED-PAD
are in the nanogram range and are comparable to LC with UV or fluorescence detection after
derivatization or LC with MS detection. Bruggink et al32
developed a system to use MS as detection. They
also reported impressive detection limits with PAD detection; however they are the builder and owner of
the HPAEC system.
Besides LC, gas chromatography is an option for the separation and detection of sugars. The main
advantage of using gas chromatography is the high resolution in relative short retention times. A
disadvantage is that derivatization of the sugars always is required. In all reported references the
trimethylsilyl ether is used, the good volatility and stability characteristics of the derivatives formed
make trimethylsilyl (TMS) ethers the most popular derivatives applied to GC analysis of saccharides. Not
many applications could be found for quantitative sugars separation and detection by GC-MS or GC-FID.
This could be due to the low recovery values reported (68 and 118 %), relative high precision results
(around 5%) and the extra work of the derivatization. Most reported methods used MS as detection, due
to the extra information obtained with MS.
CE is a good alternative for the separation of sugars. It is a powerful technique concerning the simplicity,
short analysis time, efficiency and low sample consumption. In relative short retention times (within ~ 30
minutes) separation of different sugars can be achieved. For the optimization of the required separation
of the sugars different capillaries can be used. Due to the pKa of monosaccharide’s being more than 11,
monosaccharide’s are negatively charged in strong basic running buffer, like borate or NaOH buffer.
Playing around with the concentration of the running buffer can improve the separation.
After separation a few possible detection methods are available; UV after derivatization, indirect UV and
electrochemical detection. UV after derivatization always requires extra work where the recovery needs
to be taken into account. Reported recoveries are >95%. Indirect UV results in significant higher
detection limits compared to UV with derivatization and electrochemical detection. An advantage of
indirect UV is that limited extra work is required. All detectors reported repeatability results of the
migration time and peak are <5%, mostly <1% for migration time. Reproducibility results reported are
<6%.
Depending on the separation needed, amount of samples to be analysed and the required detection
limits different methods can be applied. For traces of sugars in routine analysis in the food industry, a
HPAED-PAD can be used. For bulk analysis for research purposes when having lots of samples a LC-ELSD
method is sufficient. When traces of sugars are not analyses routinely, LC-UV or CE-UV can be applied. If
the sample contains lot of different sugars and high resolution is needed, a GC method is the best option.
Quantitative analysis methods for sugars
Suzanne de Goeij
40
REFERENCES
[1] X. Liu, N. Ai, H. Zang, M. Lu, D. Ji, F. Yu and J. Ji, Quantification of glucose, xylose arabinose, furfural
and HMF in corncob hydrolysate by HPLC-ELSD, Carbohydrate Research 353 (2012) 111-114
[2] M. Castellari, A. Versari, U. Spinabelli, S. Galassi and A. Amati, An improved HPLC method for the
analysis of organic acids, carbohydrates and alcohols in grape musts and wines, J. Liq. Chrom. & Rel.
Technol. 23 (2000) 2047-2056
[3] G. Karlsson, S. Winge and H. Sandberg, Separation of monosaccharides by hydrophilic interaction
chromatography with evaporative light scattering detection, Journal of Chromatography A 1092 (2005)
246-249
[4] U. Sharma, P. Bhandari, N. Kumar, B. Singh, Simultaneous determination of Ten Sugars in Tinospora
cordifolia by Ultrasonic Assisted Extraction and LC-ELSD, Chromatographia 71 (2010) 633-638
[5] P. Bhandari, N. Kumar, B. Singh and V. Kaul, Simultaneous determination of sugars and picrosides in
Picrorhiza species using ultrasonic extraction and high-performance liquid chromatography with
evaporative light scattering, Journal of Chromatography A, 1194 (2008) 257-261
[6] J.C.M. Barreira, J.A. Pereira, M. Beatriz, P.P. Oliveira and I.C.F.R. Ferreira, Sugars Profiles of Different
Chestnut (Castanea sativa Mill.) and Almond (Prunus dulcis) Cultivars by HPLC-RI. Plants Foods Hum Nutr,
65 (2010) 38-43
[7] Y. Lv, X. Yang, Y. Zhao, Y. Ruan, Y. Yang and Z. Wang, Separation and quantification of component
monosaccharides of the tea polysaccharides from Gynostemma pentaphyllum by HPLC with indirect UV
detection, Food Chemistry, 112 (2009) 742-746
[8] D.B. Gomis, D.M. Tamayo and J.M. Alonso, Determination of monosaccharides in cider by reversed-
phase liquid chromatography, Analytica Chimica Acta, 436 (2001) 172-180
[9] K. Racaityte, S. Kiessig and F. Kalman, Application of capillary zone electrophoresis and reversed-
phase-high-performance liquid chromatography in the biopharmaceutical industry for the quantitative
analysis of the monosaccharides released form a highly glycosylated therapeutic protein, Journal of
Chromatography A, 1079 (2005) 354-365
[10] F.A. Agblevor, A. Murden and B.R. Hames, Improved method of analysis of biomass sugars using
high-performance liquid chromatography, Biotechnology Letters, 26 (2004) 1207-1210
[11] J.L. Chavez-Servin, A.I. Castellote and M.C. Lopez-Sabater, Analysis of mono- and disaccharides in
milk-based formulae by high-performance liquid chromatography with refractive index detection, Journal
of Chromatography A, 1043 (2004) 211-215
[12] J.F. Lopes and E.M.S.M. Gaspar, Simultaneous chromatographic separation of enantiomers, anomers
and structural isomers of some biologically relevant monosaccharides, Journal of Chromatography A,
1188 (2008) 34-43
[13] T. Nishikawa, S. Suzuki, H. Kubo and H. Ohtani, On-column isomerization of sugars during high-
performance liquid chromatography: analysis of the elution profile, Journal of Chromatography A, 720
(1996) 167-172
[14] V.M. Glyad, Determination of Monosaccharides, Disaccharides and Oligosaccharides in the Same
Plant Sample by High-Performance Liquid Chromatography, Russian Journal of Plant Technology, 49-2
(2002) 277-282
Quantitative analysis methods for sugars
Suzanne de Goeij
41
[15] G. Ricochon, G. Ricochon, C. Paris, M. Girardin and L. Muniglia, Highly sensitive, quick and simple
quantification method for mono and disaccharides in aqueous media using liquid chromatography-
atmospheric pressure chemical ionization-mass spectrometry, Journal of Chromatography B, 879 (2011)
1529-1536
[16] L.A. Hammad, M.M. Saleh, M.V. Novotny and Y. Mechref, Multiple-Reaction Monitoring Liquid
Chromatography Mass Spectrometry for Monosaccharides Compositional Analysis of Glycoproteins, J.
Am. Soc. Mass Spectrom, 20 (2009) 1224-1234
[17] J. Matias, J. Gonzalez, L. Royano and R.A. Barrena, Analysis of sugars by liquid chromatography-mass
spectrometry in Jerusalem artichoke tubers for bioethanol production optimization, Biomass and
Bioenergy, 35 (2011) 2006-2012
[18] T. Ikegami, K. Horie, N. Saad, K. Hosoya, O. Fiehn and N. Tanaka, Highly efficient analysis of
underivatized carbohydrates using monolithic-silica-based capillary hydrophilic interaction (HILIC) HPLC,
Anal Bioanal Chem, 391 (2008) 2533-2542
[19] H. Kakita, H. Kamishama, K. Komiya and Y. Kato, Simultaneous analysis of monosaccharides and
oligosaccharides by high-performance liquid chromatography with postcolumn fluorescence
derivatization, Journal of chromatography A, 961 (2002) 77-82.
[20] N. Vervoort, D. Daemen and G. Torok, Performance evaluation of evaporative light scattering
detection and charged aerosol detection in reversed phase chromatography, Journal of Chromatography
A, 1189 (2008) 92-100
[21] J.P. Hutchinson, T. Remenyi, P. Nesterenko, W. Farrell, E. Groeber, R. Szucs, G. Dicinoski and P.R.
Haddad, Investigation of polar organic solvents compatible with Corona Charged Aerosol Detection and
their use for the determination of sugars by hydrophilic interaction liquid chromatography, Analytica
Chimica Acta, 750 (2012) 199-206
[22] R.W. Dixon and G. Baltzell, Determination of levoglucosan in atmospheric aerosols using high
performance liquid chromatography with aerosol charge detection, Journal of Chromatography A, 1109
(2006) 214-221
[23] T. Davidek, N. Clety, S. Devaud, F. Robert and I. Blank, Simultaneous Quantification Analysis of
Maillard Reaction Precursors and Products by High-Performance Anion Exchange Chromatography,
Journal of Agricultural and Food Chemistry, 51 (2003) 7259-7265
[24] M. Raessler, B. Wissuwa, A. Breul, W. Unger and T. Grimm, Chromatographic analysis of major non-
structural carbohydrates in several wood species – an analytical approach for higher accuracy of data,
Royal Society of Chemistry Anal. Methods, 2 (2010) 532-538
[25] C. Bruggink. R. Maurer, H. Herrmann, S. Cavalli and F. Hoefler, Analysis of carbohydrates by anion
exchange chromatography and mass spectrometry, Journal of Chromatography A, 1085 (2005) 104-109
[26] R.S. Sevcik, R.A. Mowery, C. Becker and C.K. Chambliss, Rapid analysis of carbohydrates in aqueous
extracts and hydrolysates for biomass using a carbonate-modified anion-exchange column, Journal of
Chromatography A, 1218 (2011) 1236-1243
[27] S. Ouchemoukh, P. Schweitzer, M.B. Bey, H. Djoudad-Kadij and H. Louaileche, HPLC sugar profiles of
Algerian honeys, Food Chemistry, 121 (2010) 561-568
[28] X. Lu and S. Saka, New insights on monosaccharides isomerisation, dehydration and fragmentation in
hot-compressed water, Journal of Supercritical Fluids, 61 (2012) 146-156

Quantitative analysis methods for sugars
Suzanne de Goeij
42
[29] A.I. Ruiz-Matute, O. Hernandez-Hernandez, S. Rodriquez-Sanchez, M.L. Sanz and I. Martinez-Castro,
Derivatization of carbohydrates for GC and GC-MS analyses, Journal of Chromatography B, 879 (2011)
1226-1240
[30] P.M. Medeiros and B.R.T. Simoneit, Analysis of sugars in environmental samples by gas
chromatography-mass spectrometry, Journal of Chromatography A, 1141 (2007) 271-278
[31] S. Gomez-Gonzalez, J. Ruiz-Jimenez, F. Priego-Capote and M.D. Luque de Castro, Quantitative and
Quantitative Sugar Profiling in Olive Fruits, Leaves and Stems by Gas Chromatography-Tandem Mass
Spectrometry (GC-MS/MS) after Ultrasound-Assisted Leaching, J. Agric Food Chem, 58 (2010) 12292-
12299
[32] P. Fernandez-Artigas, E. Guerra-Hernandez and B. Garcia-Villanova, Changes in sugar profile during
infant cereal manufacture, Food Chemistry, 74 (2001) 499-505
[33] V. Pitthard and P. Finch, GC-MS Analysis of Monosaccharides Mixtures as their Diethyldithioacetal
derivatives: Application to Plant Gums Used in Art Works, Chromatographia, 53 Suppl. (2001) 317-321
[34] V. Ratsimba, J.M. Garcia Fernandez, J. Defaye, H. Nigay and A. Voilley, Qualitative and quantitative
evaluation of mono- and disaccharides in D-fructose, D-glucose and sucrose caramel by gas-liquid
chromatography-mass spectrometry. Di-D-fructose dianhydrides as tracers of caramel authenticity,
Journal of Chromatographia A, 844 (1999) 283-293
[35] Z. Fuzfai, Z.F. Katona, E. Kovacs and I. Molnar-Perl, Simultaneous Identification and Quantification of
the Sugar, Sugar Alcohol and Carboxylic Acid Contents of Sour Cherry, apple and Ber Fruits as their
Trimethylsilyl Derivatives, by Gas-Chromatography-Mass Spectrometry, J. Agric. Food Chem. 52 (2004)
7444-7452
[36] Q. Wang and Y. Fang, Analysis of sugars in traditional Chinese drugs, Journal of Chromatography B,
812 (2004) 309-324
[37] J. You, X. Sheng, C. Ding, Z. Sun, Y. Suo, H. Wang and Y. Li, Detection of carbohydrates using new
labelling reagent 1-(2-naphthyl)-3-methyl-5-pyrazolone by capillary zone electrophoresis with absorbance
(UV), Analytica Chimica Acta, 609 (2008) 66-75
[38] L.Xia, Z.W. Sun, G.L. Li, Y.R. Suo and J.M. You, A sensitive analytical method for the component
monosaccharides of the polysaccharides from a Tibetan herb Potentilla anserine L by capillary zone
electrophoresis with UV detector, Eur Food Res Technology, 230 (2010) 715-722
[39] T. Wang, X. Yang, D. Wang, Y. Jiao, Y. Wang and Y. Zhao, Analysis of compositional carbohydrates in
polysaccharides and foods by capillary electrophoresis, Carbohydrate Polymers, 88 (2012) 754-762
[40] Q. Gao, M. Araia, C. Leak and A. Emmer, Characterization of exopolysaccharides in marine colloids by
capillary electrophoresis with indirect UV detection, Analytica Chimica Acta, 662 (2010) 193-199
[41] V.M. Rizelio, L. Tenfen, R. da Silveira, L. Valdemiro Gonzaga, A.C.O. Costa and R. Fett, Fast
determination of cations in honey by capillary electrophoresis, Talanta, 99 (2012) 450-456
[42] T. Soga and D.N. Heiger, Simultaneous Determination of Monosaccharides in Glycoproteins by
Capillary Electrophoresis, Analytical Biochemistry, 261 (1998) 73-78
[43] Q. Hu, T. Zhou, G. Hu and Y. Fang, Determination of sugars in Chinese traditional drugs by CE with
amperometric detection, Journal of Pharmaceutical and Biomediacal Analysis, 30 (2002) 1047-1053
[44] Z. Yang, H. Wang, W. Zang, Q. Wang, P. He and Y. Fang, Analysis of Neutral Sugars of Asparagus
officinalis Linn Polysaccharides by CZE with Amperometric Detection, Chromatographia, 75 (2012) 297-
304
Quantitative analysis methods for sugars
Suzanne de Goeij
43
[45] Y. Cao, Y. Wang, X. Chen, J. Ye, Study on sugar profile of rice during ageing by capillary
electrophoresis with electrochemical detection, Food Chemistry, 86 (2004) 131-136
[46] M. Li and S.H. Lee, Analysis of Monosaccharides by Capillary Electrophoresis with
Electrochemiluminescence Detection, Analytical Sciences, 23 (2007) 1347-1349
[47] P. Luo, F. Zang and R.P. Baldwin, Comparison of metallic electrodes for constant-potential
amperometric detection of carbohydrate, amino acids and related compounds in flow systems, Analytica
Chimica Acta, 244 (1991) 169-178
Related Documents