Quantitative techniques in competition analysis Prepared for the Office of Fair Trading by LECG Ltd October 1999 Research paper 17 OFT 266 LECG Ltd provides sophisticated economic and financial analysis, public policy analysis, litigation support and strategic management consulting. It is a subsidiary of Navigant Consulting Inc, a US-based company with offices in the United States, Canada, New Zealand, Argentina and Europe. This report was prepared by Thomas Hoehn James Langenfeld Meloria Meschi Leonard Waverman based at LECG Ltd 40-43 Chancery Lane Stéphanie Square Centre 1603 Orrington Ave London WC2A 1SL Avenue Louise 65 Suite 1500

Welcome message from author
This document is posted to help you gain knowledge. Please leave a comment to let me know what you think about it! Share it to your friends and learn new things together.
Transcript

Quantitative
techniques in
competition
analysis
Prepared for the Office of Fair
Trading
by LECG Ltd
October 1999 Research paper
17
OFT 266
LECG Ltd provides sophisticated economic and financial analysis, public
policy analysis, litigation support and strategic management consulting. It is a
subsidiary of Navigant Consulting Inc, a US-based company with offices in
the United States, Canada, New Zealand, Argentina and Europe.
This report was prepared by
Thomas Hoehn
James Langenfeld
Meloria Meschi
Leonard Waverman
based at LECG Ltd
40-43 Chancery Lane Stéphanie Square Centre 1603 Orrington Ave
London WC2A 1SL Avenue Louise 65 Suite 1500
England 1050 Brussels Evanston, Illinois
Belgium IL60201
USA

tel: 0171-269 0500 tel: 00 322-534 5545 tel: 001-847 475 1566
fax: 0171-269 0515 fax: 00 322-535 7700 fax: 001-847 475 1031
Please note any views expressed in this paper are those of the authors:
they do not necessarily reflect the views of the Director General of Fair
Trading.
1
QUANTITATIVE TECHNIQUES IN
COMPETITION ANALYSIS
PREFACE
This paper is the 17th of a series of research papers (listed overleaf) to be
published by the Office of Fair Trading. These papers report the findings of
projects commissioned by the OFT as part of its ongoing programme of
research into aspects of UK Competition and Consumer Policy. The intention
is that research findings should be made available to a wider audience of
practitioners, both for information and as a basis for discussion. Any views
expressed in this paper are those of the authors: they do not necessarily reflect
the views of the Director General of Fair Trading. This report is not and
should not be treated as a guideline issued as a consequence of the Director
General’s obligation to publish general advice and information under the
Competition Act 1998.
Comments on the paper should be sent to me, at the address shown below.
Research proposals on other aspects of UK Competition and Consumer Policy
would also be welcomed. Requests for additional copies of this paper (or
copies of earlier papers in this series) should, however, be sent to the address
shown on page 2.

Peter Bamford
Chief Economist
Office of Fair Trading
Chancery House
53 Chancery Lane
London WC2A 1SP
2
OFFICE OF FAIR TRADING RESEARCH PAPERS
1 Market Definition in UK Competition Policy, National Economic Research Association, February
1993
2 Barriers to Entry and Exit in UK Competition Policy, London Economics, March 1994
3 Packaged Mortgages: Results of Consumer Surveys , Research Surveys of Great Britain, June 1994
4 Consumers’ Appreciation of Annual Percentage Rates - Taylor Nelson AGB survey results, June 1994
5 Predatory Behaviour in UK Competition Policy, Geoffrey Myers, November 1994
6 Underwriting of Rights Issues: a study of the returns earned by sub-underwriters from UK rights
issues , Paul Marsh, November 1994
7 Transparency and Liquidity: a study of large trades on the London Stock Exchange under different
publication rules, Gordon Gemmill, November 1994
8 Gambling, Competitions and Prize Draws - Taylor Nelson AGB survey results, September 1996
9 Consumer dissatisfaction - Taylor Nelson AGB survey results, December 1996
10 The Assessment of Profitability by Competition Authorities, Martin Graham and Anthony Steele,
February 1997
11 Consumer detriment under conditions of imperfect information, London Economics, August 1997
12 Vertical Restraints and Competition Policy, Paul W Dobson and Michael Waterson, December 1996
13 Competition in retailing, London Economics, September 1997

14 The effectiveness of undertakings in the bus industry, National Economic Research Associates,
December 1997
15 Vulnerable Consumer Groups: Quantification and Analysis, Ramil Burden, April 1998
16 The Welfare Consequences of the Exercise of Buyer Power, Paul Dobson, Michael Waterson and
Alex Chu, September 1998
Copies of these papers are available, free of charge, from:
Office of Fair Trading, PO Box 366, Hayes UB3 1XB
Tel: 0870 60 60 321, Fax: 0870 60 70 321, e-mail: [email protected]
3
CONTENTS
Preface 1
Office of Fair Trading Research Papers 2
List of Abbreviations 4
PART I: INTRODUCTION AND OVERVIEW
1 Introduction 5
2 How quantitative techniques support antitrust analysis in practice 11
PART II: STATISTICAL TESTS OF PRICES AND PRICE TRENDS
3 Cross-sectional price tests 43
4 Hedonic price analysis 49
5 Price correlation 53
6 Speed of adjustment test 57
7 Causality tests 59
8 Dynamic price regressions and co-integration analysis 63
PART III: DEMAND ANALYSIS
9 Residual demand analysis 69

10 Critical loss analysis 77
11 Import penetration tests 81
12 Survey techniques 83
PART IV: MODELS OF COMPETITION
13 Price-concentration studies 87
14 Analysis of differentiated products: the diversion ratio 93
15 Analysis of differentiated products: estimation of demand systems 97
16 Bidding studies 103
PART V: OTHER TECHNIQUES AND CONCLUSIONS
17 Time series event studies of stock markets’ reactions to news 107
18 Conclusions 109
Appendix
A Glossary of terms 117
B Bibliography 127
C List of case summaries 137
4
LIST OF ABBREVIATIONS
Below are the full versions of those abbreviations which occur regularly in the text.
For an explanation of some common words or phrases please refer to Appendix A.
BEUC Bureau Européen des Unions de Consommateurs
- also known as the European Consumers’ Organisation
DGFT Director General of Fair Trading
DOJ United States’ Department of Justice
ECJ European Court of Justice
FTC United States’ Federal Trade Commission

HHI Herfindahl-Hirschman Index
IIAA Independence of Irrelevant Alternatives Assumption
IFS Institute for Fiscal Studies
IO industrial organisation
MMC Monopolies and Mergers Commission
OLS Ordinary Least Squares (see also glossary)
SAS a dedicated statistical package
SPSS a dedicated statistical package
5
PART I: INTRODUCTION AND OVERVIEW
1 INTRODUCTION
Background to the study
1.1 LECG Ltd has been commissioned by the Office of Fair Trading (OFT) to undertake a
study of the main quantitative techniques used in competition, that is, antitrust, analysis.
1.2 This project is one of a series of studies the OFT has commissioned on issues relevant
to UK competition policy. The purpose of these studies is to stimulate debate among a
wider audience of antitrust practitioners. These studies do not necessarily reflect the
views of the Director General of Fair Trading (DGFT). In particular, this report should
not be taken as providing general advice and information about the way the Director
General expects competition policy to operate. Other related past studies include Market
Definition in UK Competition Policy by National Economic Research Associates, 1993,
and Barriers to Entry and Exit in UK Competition Policy by London Economics, 1994.
1.3 Over recent years, the use of quantitative analysis in antitrust has increased for a variety
of reasons. These reasons include the development of modern and fairly reliable
quantitative techniques, advancements in user-friendly software and cheap hardware,

availability of more and better data and, not least, an increasing use of economists and
economic evidence, by antitrust authorities and the companies concerned. None of the
previous OFT studies have dealt specifically with the range of quantitative techniques
used in competition policy cases. This project therefore fills an important gap in the series
of research papers published by the OFT.
Antitrust legislation in the UK
1.4 Competition policy in the UK is conducted within the framework of certain pieces of
legislation. The main areas of antitrust that fall under the jurisdiction of the OFT and/or
the Competition Commission - formerly the Monopolies and Mergers Commission
(MMC) - are:
As of May 1 1999, Articles 85 and 86 have been renumbered as Articles 81 and 82 under the Treaty of
1
Amsterdam. This report however generally refers to the prohibitions as Articles 85 and 86.
6
monopoly and abuse of dominant position;
mergers; and
agreements between firms (vertical and horizontal).
1.5 Until 1998, UK policy in these areas of antitrust was covered by four main pieces of
legislation. Mergers are governed by the Fair Trading Act 1973, which together with
the Competition Act 1980 also covers monopolies and anti-competitive practices.
Agreements between firms could be investigated as part of monopoly enquiries under the
Fair Trading Act or under the Restrictive Trade Practices Act 1976 and the Resale
Prices Act 1976 .
1.6 Competition policy legislation in the UK is currently however, in the process of change
with the introduction of the Competition Act 1998. The Competition Act 1998 replaces

or amends much of the above legislation, notably the Restrictive Trade Practices Act, the
Resale Prices Act, and the majority of the Competition Act 1980. Some parts of the
previous legislation remain unchanged, such as the provisions for dealing with mergers
under the Fair Trading Act.
1.7 The new legislation introduces two prohibitions: one of agreements (whether written or
not) which prevent, restrict or distort competition and may affect trade within the UK; the
other of conduct by dominant companies which amounts to an abuse of their position in
a market in the UK. The two prohibitions come into force on 1 March 2000. The
prohibitions in the Competition Act are based on Articles 85 and 86 of the EC Treaty.
1
The Competition Act gives the DGFT powers to investigate undertakings believed to be
involved in anti-competitive activities, and to impose financial penalties where
appropriate.
1.8 The Competition Act is applied and enforced by the DGFT and, in relation to the
regulated utility sectors, concurrently with the regulators for telecommunications, gas,
electricity, water and sewerage and railway services. A new Competition Commission,
incorporating the former MMC, has been established which hears appeals.
The Competition Act 1998: OFT 400, The Major Provisions; OFT 401, The Chapter I Prohibition;
2
OFT 402,The Chapter II Prohibition; OFT 403, Market Definition; OFT 404, Powers of Investigation;
OFT 405, Concurrent Application to Regulated Industries; OFT 406, Transitional Arrangements; OFT 407,
Enforcement; OFT 408, Trade Associations, Professions and Self-Regulating Bodies .
These approaches may not always be appropriate under the Competition Act 1998 .
3
7

1.9 In March 1999, the DGFT published a series of guidelines under the Competition Act
2
setting out general advice and information about the application and enforcement of the
prohibitions. As noted earlier this report is an independent piece of economic research
and, as such, does not constitute a guideline under the Act.
Antitrust issues requiring quantitative techniques
1.10 The application of quantitative techniques to antitrust has arisen naturally from the need
to answer the central questions of antitrust analysis, many of which may involve
quantification, as these examples make clear:
3
Market definition: What products, geographic areas, and suppliers/buyers form
part of the relevant market?
Market structure issues: How should one measure concentration, market
shares, entry barriers and exit conditions?
Pricing issues : Are movements in market prices consistent with competition,
with monopoly or with collusion? Do we observe prices in one geographic
market that are significantly higher than in others? Are price-cost relationships
consistent with predatory pricing?
Other behavioural issues: To what extent do leading firms’ non-price
strategies, for example, on matters such as supply constraints, distribution
agreements, investment, advertising or patent licensing, lessen competition or
improve industry performance? Where both effects exist, which is more
significant? Do variations in cost efficiency explain profit variations?
Vertical issues: To what extent does vertical integration or contracting (such as
tied pubs or other exclusive arrangements) by leading firms reduce competition

and/or yield efficiencies?
Special merger issues : How much might the merger concerned change pricing
and other market behaviour, either by lessening competition or by promoting
efficiency?
8
Potential entry and competitive expansion: How responsive are both potential
entrants and competing fringe firms to increased prices or margins in the
relevant market?
1.11 Each of these areas provides scope for some degree of quantitative analysis; however not
all such analyses need to use complex formal mathematical or statistical techniques. It
should be noted that quantitative analysis interacts with qualitative analysis in a complex
way. Rarely will quantitative techniques and analysis alone decide matters, though they
can provide very valuable evidence in cases. It should be stressed that the weighing and
sifting of evidence will always involve expert judgement on the part of the competition
authorities.
Classification of quantitative techniques
1.12 The techniques outlined in this review are those designed to test an economic hypothesis
to the exclusion of exploratory data analysis. The menu of selected techniques below
ranges from uncomplicated descriptive statistics (for example, average price levels, and
sales and price trends) to advanced econometric estimation of demand and supply
functions.
Statistical tests of prices and price trends (Part II)
Cross-sectional price test
Hedonic price analysis
Price correlation
Speed of adjustment test
Causality test
Dynamic price regressions and co-integration analysis
Demand analysis (Part III)
Residual demand analysis
Critical loss analysis
Import penetration tests
Survey techniques
9
Models of competition (Part IV)
Price-concentration studies
Analysis of differentiated products
Bidding studies
1.13 Other techniques not covered by this report in detail are:
analysis of profitability;
analysis of acquisition price;
time series event studies of stock market’s reactions to news;
econometric and Data Envelopment Analysis (DEA) of relative efficiency;
cost analysis; and
cluster analysis, discriminant analysis, factor analysis etc.
Aim and structure of this report
1.14 This study reviews the application of quantitative techniques from both a technical and
practical perspective. Each technique, or major group of techniques, is summarised in
terms of its main elements. At the same time, care is taken to put these techniques into
context and provide an overview of their uses.

1.15 Each technique is discussed under three headings. First, each statistical test is described
briefly. Secondly, comments on data requirements and ease of computation are added.
Thirdly, the technique is discussed in terms of problems of interpretation. The latter
heading is vital, as it is the interpretation of statistical relationships that is crucial in
antitrust cases. Economic significance can be different from statistical significance.
1.16 Before dealing with the various tests we also present an overview in Chapter 2 of the
general uses and applications of quantitative techniques in US, UK and EU competition
policy. This overview places the techniques that are examined in later chapters into a
broader context and offers an illustration of the competition issues that typically require
quantification using statistical and econometric tests.
1.17 Throughout the report we include case studies that illustrate the applications of
quantitative techniques. These case studies often deal with more than one technique and
so should be read within the context of the entire report. However, they do illustrate how
quantitative questions can be at the core of a case and its outcomes.
10
1.18 In the following six chapters, we describe statistical techniques that analyse price only:
price tests, covering cross-sectional statistical comparisons (Chapter 3); hedonic price
analysis (Chapter 4); and time series price comparisons (Chapters 5 to 8). Next, we
examine quantitative techniques that are more closely connected to economic theory, and
are used in antitrust analysis for market definition and for the analysis of demand:
residual demand analysis and critical loss analysis (Chapters 9 and 10); import
penetration tests (Chapter 11); and survey techniques (Chapter 12). In the final four
chapters, we describe those techniques that are used to estimate or simulate models of
competition in order to detect anti-competitive behaviour: price-concentration studies
(Chapter 13); analysis of differentiated product markets using the diversion ratio (Chapter

14); analysis of differentiated product markets using an estimation of demand system
(Chapter 15); bidding techniques (Chapter 16); and, time series event studies
(Chapter 17).
11
2 HOW QUANTITATIVE TECHNIQUES SUPPORT ANTITRUST
ANALYSIS IN PRACTICE
2.1 This chapter reviews the use of quantitative techniques in the context of antitrust analysis
and draws on the application of these techniques to real life cases in the UK, US and EC.
While this cannot be comprehensive, the aim is to illustrate the central role that
quantitative questions and techniques can play in casework. It is not the intention in this
chapter to go into each and every detail of how a specific technique is employed. The
reader who wants to have more detailed information about a specific technique can turn
to later pages of the report where fuller explanations can be found.
2.2 The analysis of mergers, restrictive agreements and abuses of a dominant position have
all followed a similar analytical approach. This approach has involved a number of steps:
Step 1 Identification of the firms concerned; preliminary analysis of their activities;
determination of relevant jurisdiction
Step 2 Definition of the affected markets in their product and geographic dimension,
leading to an assessment of the position of the firms in the affected markets
Step 3 Assessment of any potential adverse effects on competition of the alleged
restrictive or abusive behaviour, or the proposed merger
Step 4 Assessment of possible efficiency defences and other relevant public interest
justifications.
2.3 Each step may involve a degree of quantification. Step 1 requires the description of the

activities of a firm principally through the use of financial indicators. Quantitative
techniques that are essentially economic and of a minimum degree of technical
sophistication have more often been used in Steps 2 and 3. Step 2 dominates merger
proceedings, where the assessment of the competitive effect of an acquisition of a
competitor is highly dependent on the assessment of the change in concentration in the
affected markets. In monopoly situations Steps 2 and 3 have generally been given equal
importance as both a monopoly and its abuse must be found, while restrictive agreements
or practices focussed more on Steps 3 and 4. In general, the more contentious and
complex the case, the more sophisticated the techniques that have been applied.
For an overview see Doern, G.B., 1996.
4
Commission Notice on the definition of the relevant market for the purposes of Community competition
5
law OJ 1997 C372/5.
Supra footnote 5.
6
12
2.4 The use of quantitative techniques has differed from country to country and, in some
instances, between different authorities within the same country. In the US, antitrust
authorities and the courts have a longer tradition of relying on economic analysis and
empirical verification. This is partly due to the increased influence of economists in the
Department of Justice, which became noticeable during the 1970s, but is also due to the
more litigious nature of US antitrust policy which is very demanding in terms of
supporting economic and factual evidence. Expert testimony is more often required in a
litigation setting where the adversarial process pitches expert against expert and where

each party tries to expose the weakness of the other parties’ arguments and evidence. An
investigative procedure poses different demands on the parties involved and does not
allow them to influence the investigative process as much. On the contrary it is the
investigating authority which drives the process and this is typically the case in Europe
(MMC, the European Commission’s DGIV, etc).
4
2.5 European antitrust authorities have only more recently paid more explicit attention to
empirical evidence provided by economists. The introduction of the European Merger
Regulation 4064/89 has arguably provoked a major change in the use of economics and
expert economic evidence, culminating in the recent Commission Notice on market
definition, which explicitly advocates the use of quantitative techniques to provide
5
evidence of demand substitution:
‘There are a number of quantitative tests that have specifically been
designed for the purpose of delineating markets. These tests consist of
various econometric and statistical approaches: estimates of elasticities and
cross-price elasticities for the demand of a product, tests based on similarity
of price movements over time, the analysis of causality between price series
and similarity of price levels and/or their convergence. The Commission
takes into account the available quantitative evidence capable of
withstanding rigorous scrutiny for the purposes of establishing patterns of
substitution in the past.’
6
2.6 Four basic applications of quantitative analysis in antitrust are examined in the rest of
this chapter:

the determination of relevant antitrust markets;
the analysis of market structure;
Department of Justice and Federal Trade Commission, 1992, Horizontal Merger Guidelines, Antitrust
7
and Trade Regulation Report , 69(1559), Washington D.C. For a more thorough discussion on the
application of the guidelines see Langenfeld, J., 1996, The Merger Guidelines as Applied, in Coate,
M. and A. Kleit, eds., The Economics of the Antitrust Process. An interesting discussion on the
evolution of US merger policy with respect to market definition can be found in Lande, R. and J.
Langenfeld, 1997, From Surrogates to Stories: The Evolution of Federal Merger Policy, Antitrust
Magazine , Spring: 5-9
13
the analysis of competition, in particular the analysis of pricing
behaviour; and
the analysis of efficiency effects.
The delineation of markets
2.7 Because of the increased importance of quantitative analysis for defining antitrust
markets it is worth spelling out in more detail the type of empirical evidence that is
required to establish the extent of demand-side and supply-side substitution, these being
the key criteria for defining a relevant antitrust market.
2.8 The most well known and largely accepted method used by competition authorities in
many countries is the hypothetical monopolist , or cartel, test. This test seeks to identify
the smallest set of products and producers (containing the product under investigation),
where a hypothetical monopolist or cartel, controlling the supply of all the products in
that set, could increase profits by instituting a small, but appreciable, permanent increase
in price over the competitive level. This is also known as the SSNIP (Small but

Significant, Non-transitory Increase in Price) test. The underlying approach can be
applied to geographic market identification as well as to product market identification.
2.9 This approach was pioneered in the USA where the competition authorities - primarily
the Department of Justice (DOJ) and the Federal Trade Commission (FTC) - first set out
these principles in the 1984 Horizontal Merger Guidelines which have since been revised
several times. This approach has also been set out by the European Commission in its
7
In its Notice on market definition the European Commission says:
8
‘The question to be answered is whether the parties’ customers would switch to readily
available substitutes or to suppliers located elsewhere in response to a hypothetical small (in
the region of 5-10%) permanent relative price increase in the products and areas being
considered. If substitution would be enough to make the price increase unprofitable because
of the resulting loss of sales, additional substitutes and areas are included in the relevant
market. This would be done until the set of products and geographic areas is such that small
permanent increases in relative prices would be profitable.’
This Notice is also referred to in paragraph 2.5.
The cost here does not have to be in monetary terms, for example, if a consumer has to take a bus three
9
hours earlier than his normal time to be able to switch to another operator, it is a cost to this customer.
14
Notice on market definition. In the UK, the OFT has recently referred to the use of this
8
approach in the guideline Market Definition (reference: OFT403) issued under the
Competition Act 1998.

2.10 In the past, MMC reports have not always set out a rigorous definition of the relevant
market. There are of course exceptions such as the London Clubs International/Capital
Corporation merger report (1997) where the SSNIP test is used to define the relevant
market.
2.11 The correct definition of the relevant antitrust market is an important feature of an
accurate competition analysis. A too narrowly defined market can lead to unnecessary
competition concerns, and on the other hand, a too widely defined market may disguise
real competition problems. This will certainly be the case if too much emphasis is placed
on the market share arising from an ‘incorrect’ market definition.
Demand-side substitution
2.12 Analysis of demand-side substitution focuses on what substitutes exist for buyers and
whether enough customers would switch, in the event of a price increase, without
incurring a cost, to constrain the behaviour of suppliers of the products in question. This
9
is an essentially empirical question.
2.13 Subs titutes do not have to be identical products to be included in the same market. Indeed
most products and services today are differentiated products. Nor do product prices have
to be identical. For example, if two products serve the same purpose, but one is of a
different specification, perhaps a higher quality, they might still be in the same market,
as long as customers prefer it due to a higher price-quality ratio. For example, a
Mercedes-Benz may last 400,000 kilometres, but a luxury Ford may last 200,000
kilometres. If the two cars were the same except for the life of the car, then one would
not expect their prices to be the same. If the price of the Mercedes were to increase, its
cost per kilometre driven would then be greater than the Ford’s and some consumers

would switch to the Ford. In addition, products do not have to be direct substitutes to be
See diversion analysis below, for a more detailed discussion of this concept.
10
The profit change is not simply the result of demand side changes but depends also on the way lower
11
output, arising as a result of the increased price, affects costs.
The European Commission is known to take evidence of demand-side substitution in the range of 10-12
20% very seriously.
The MMC investigated the relevance of switching costs in their report on Video Games (1995) and
13
undertook a similar analysis in the context of Telephone Number Portability (1995).
Cfr. DOJ-FTC, 1992, Horizontal Merger Guidelines, op. cit. , paragraph 2.9.
14
15
included in the same market. There may be a chain of substitution between them.
10
2.14 Moreover, it is not necessary for all consumers, or even the majority, to switch actively
to substitute products for the products still to be regarded as substitutes and in the same
market. The important factor is whether the number of customers likely to switch is large
enough to prevent a hypothetical monopolist maintaining prices above competitive levels.
In fact if a 10% price increase were to lead to as little as 10-20% of customers switching
to substitute products the benefit of the price increase would be lost and it would be
unprofitable for the company to make the price increase. The behaviour of so-called
11
‘marginal consumers’ who are most likely to switch keeps prices competitive not only

for themselves but also for other consumers who are not able to switch, assuming that
suppliers cannot price discriminate among customer groups. Clearly the stronger the
evidence that consumers would switch, the less likely it is that a particular product or
group of products is in a market on its own.
12
2.15 The costs of switching can, however, be very important for customers. For example,
changing from electric to gas heating, following a fall in the price of gas, may involve a
substantial amount of investment in new equipment. Another example of a market where
switching costs can be significant, is the market for video games. Here consumers are
faced with video games developed around different hardware – the PC, or the console –
giving rise to switching costs for consumers in the video games market. In the presence
13
of switching costs there may be a large gap between short and long run demand
substitution.
Supply-side substitution
2.16 In the absence of demand-side substitution market power may still be constrained by
supply-side substitution. Supply-side substitution occurs where suppliers are able to
14
respond rapidly to small but permanent changes in relative prices by switching production
to the relevant products, without incurring significant additional costs or risks.
European Commission, 1992, Case IV/M.0291, 1992, Torras/Sarrio .
15
European Commission,1973, Case 6/72, ECR 215, Europemballage Corpn and Continental Can Co Inc
16
The same factors apply to the analysis of consumer switching costs for the assessment of demand-side

17
substitutability.
16
In these circumstances, the potential for supply-side substitution will have a similar
disciplinary effect to demand-side substitution on the competitive behaviour of the
companies involved.
2.17 As with demand-side substitution, supply-side substitution needs to be relatively quick,
for without speed its effectiveness in constraining current market power is reduced. It is
a matter of opinion about how quickly supply-side substitution should take place, to
distinguish it from entry, but it is often set by competition authorities to within a year.
2.18 An example of this is the supply of paper used in publishing. Paper is produced in
15
various grades dependent on the coating used. From a customer’s point of view these
types of paper are not viewed as substitutes. However, these grades are produced with the
same plant and raw materials so it is relatively easy for manufacturers to switch
production between different grades. If a hypothetical monopolist in one grade of paper
tried to set prices above competitive levels, manufacturers currently producing other
grades can start to supply this grade.
2.19 Analysing short run supply-side substitution raises similar issues to the consideration of
barriers to entry. Both are concerned with establishing whether firms will be able to begin
supplying a product in competition with another existing firm. The distinction is only one
of timing, that is, the speed of set-up.
2.20 The European Commission now makes explicit reference to short run supply-side
substitution as a factor that should be considered in defining markets. This reflects the
European Court of Justice’s judgement in Continental Can, which was critical of the

16
failure by the Commission to include supply-side substitutes within the market.
2.21 The type of evidence to be used in an assessment of supply-side substitution include the
following:
17
systematic analysis of firms that have started or stopped producing the products
in question;
the time required to begin supplying the products in question;
enquiries of potential suppliers to see if substitution is possible (even if the
potential supplier currently has no plans to enter the market) and at what cost;
Nestle Perrier, 92/553/Cee, OJ 5-12-1992 vol. L 356
18
17
enquiries of firms might be included to determine whether existing capacity is
tied up, perhaps because of long term contracts;
the views of customers - in particular, their views on whether they would switch
to the new supply, and whether the costs of switching were prohibitive; and
an evaluation of the ‘sunk costs’ of switching, to see if potential suppliers can
begin producing the products in question without risking substantial investment.
2.22 It is probably fair to say that quantitative measurement techniques have so far been
applied rather more to the demand side than to the supply side, in competition cases.
CASE STUDY 1: NESTLE-PERRIER MERGER
The Nestle-Perrier merger case of 1992 is interesting for a number of reasons. First, the
18
Nestle-Perrier case is interesting because it provides an example of how markets can be defined

for antitrust purposes. In this instance ver y little empirical anal ysis was undertaken to determine
the correct antitrust market. Nestle notified the Commission of its intention to bu y Perrier and
cede Volvic, a Nestle mineral water brand, to BSN, the second biggest competitor. This was
desi gned to pre-empt an y involvement b y the Commission on the basis of concerns about
Nestle’s market position. Nestle and Perrier together had 75%, b y volume, of the ‘market for
mineral waters’. Nestle was claiming that the relevant market was the ‘non-alcoholic refreshin g
drinks’ market, which would include colas and all other soft drinks. To determine the relevant
market for still and sparkling mineral waters the Commission used surve ys and comparisons
supplied b y consumers, trade associations and supermarkets. There appears to have been
some emphasis on price correlation, and graphs showin g parallel price movements over time
for all mineral water.
Secondly , the Nestle-Perrier case provides a good example of barriers to entr y and the
conclusions of the European Commission as to their relevance in mer ger cases. In the Nestle-Perrier case the Commission pointed to the hi gh degree of brand reco gnition in the mineral
water industry. This brand reco gnition was due to intensive advertisin g campai gns that the three
major firms (Nestle, Perrier and BSN) had undertaken over several years. New entrants to the
market would have faced similar expenditure requirements to attract and retain customers. The
Commission concluded that a new brand would require a long lead-time and heav y investment
in advertisin g and promotion to compete in the market, and would have difficult y establishin g a
presence in the market due to the large number of brands alread y introduced b y the top three
firms. In its jud gment, the Commission implicitly appealed to the theory that advertisin g is a
barrier to entr y because it is a sunk cost that cannot be recovered nor transferred to other uses.
Schmalensee, R., 1978, Entry deterrence in the ready-to-eat breakfast cereal industry, Bell Journal of Economics,
19
9:305-27 in Office of Fair Trading Research Paper 2 1994, Barriers to entry and exit in UK competition.

The other important feature of the case was that the Commission for the first time investigated the matter not as
20
a single firm dominance case (monopoly) but multiple firm dominance case (oligopoly).
18
It is also usin g the brand proliferation argument of Schmalensee. Both of these factors have
19
been recognised as potential barriers to entry in modern IO literature. However, both are difficult
to appl y and the brand proliferation argument, in particular, has been criticised.
Subsequent analysis showed both the pre- and post-mer ger market shares of Nestle and BSN
to be ver y high. So, althou gh Perrier had chosen to divest Volvic to BSN, the market positions
of the two were effectivel y made more s ymmetric without their combined market share fallin g at
all. In other words, the divestiture would stren gthen the duopolistic structure of the market.
Despite this, the Commission would not block the merger outright, instead ne gotiatin g a remed y
with Nestle and Perrier. Nestle was allowed to keep Perrier, but had to sell eight of its lesser
brands of mineral water to another compan y, which was not in the market at that time, to create
competition in the market.
20
The relevant geographic market
2.23 The relevant geographic market is the area over which demand-side and supply-side
product substitution takes place. Of particular importance in defining the geographic
market is the degree to which chains of substitution extend the market, and the role
played by imports in conditioning the ability of local suppliers to raise prices.
2.24 The type of evidence that can be used to determine the extent of a geographic market
includes surveys of consumer and competitor behaviour; estimates of price elasticities
in different areas; and analysis of price changes across contiguous geographic areas.

The latter can provide reasonable evidence that two areas are in the same market if the
prices for the product under examination move together in the two areas for reasons
unrelated to changes in the costs of production.
Sheffman, D.T. and P.T. Spiller, 1987, Geographic market definition under the US Department of Justice Merger
21
Guidelines, Journal of Law and Economics, 30: 123-47.
The vector contains crude oil price, energy use, transport costs for crude oil, refining capacity, and a weather
22
variable. See Chapter 9 for a description of residual demand analysis.
The vector contains per capita income, industrial production, and seasonal factors.
23
This result is confirmed by Stigler, G.J. and R.A. Sherwin, 1985, The Extent of the Market, Journal of Law and
24
Economics, 28: 555-85. See paragraph 5.8 below for a more detailed discussion.
19
CASE STUDY 2: DEFINING THE GEOGRAPHICAL EXTENT OF US PETROL MARKETS
During the 1980s a number of mergers occurred between petrol producers in the US, and the
issue of the determination of the relevant geographic markets for wholesale fuel became a
heavil y contested issue. There is ver y little doubt that the area west of the Rock y Mountains
constitutes an isolated geographic market, as no petrol is transported there from the rest of
the countr y. All petrol consumed on the West Coast is either imported or refined west of the
Rockies. It is more difficult to establish in which way the other areas of the countr y are
connected.

Refineries located in the Gulf Coast, which produces about half of the total US production,
provide virtually all the petrol sold in the South-East. The petrol flows to the re gion via two
pipelines, the Colonial and the Plantation. Terminals are clustered along these pipelines,
usuall y close to main urban areas, and petrol is transported from these terminals to the final
destination b y lorr y. North-eastern bu yers are supplied with petrol b y three main sources:
local refineries located near the lar ger cities (the North-East produces about 15% of the total
US output); the Gulf Coast refineries via the Colonial pipeline; and, foreign refineries. The
existence of two different and one common source of supply (the Colonial pipeline) make it
impossible to determine, without a detailed investi gation, whether the North-East and the
South-East of the US are in the same geographic market.
In a leadin g article on the use of quantitative techniques in market definition, Sheffman and
Spiller used residual demand anal ysis to determine whether the relevant antitrust market for
21
gasoline refining in the eastern United States covers the whole area east of the Rocky
Mountains, or whether the Gulf Coast and the North-East together, or the North-East alone,
form an antitrust market. This anal ysis used monthl y data for the period April 1981 to
February 1985 in order to estimate residual demand functions for wholesale gasoline; the
re gressors include a vector of cost shift variables for potential competitors, to account for
22
supply-side substitution; and a vector of demand shift variables to account for demand-side
23
substitution.
The results showed that there were two relevant antitrust markets east of the Rocky
Mountains relevant for mer ger analysis: the Gulf Coast alone, for mer gers that happened
between refineries within this area, and the area that is comprised of the North-East plus the

Gulf Coast for mergers that included the North-East. The results obtained with residual
demands differed from those from correlation tests that show hi ghl y correlated prices across
the whole area east of the Rockies leadin g to a wide market definition. In other words, the
24
economic market was larger than the antitrust market. To be more specific, while ‘historical’
Bain, J.S., 1956, Barriers to New Competition: Their Character and Consequences in Manufacturing
25
Industries, Cambridge: Harvard University Press.; and Bain, J.S., 1951, Relation of Profit Rates to
Industry Concentration: American Manufacturing, 1936-1940, Quarterly Journal of Economics, 65:
293-324.
20
petrol prices tend to converge across the area west of the Rockies, refineries in the Gulf
Coast have the potential power to promote a long-lastin g price increase b y cuttin g capacit y in
the Gulf area alone. Such a price increase cannot travel be yond the regional boundaries of
the Gulf Coast, which makes that area an antitrust market.
Quantitative tests for market definition
2.25 There are a number of quantitative tests available to help market definition, and there is
much debate on which is the most adequate. In Chapters 5 to 8 we review tests that are
based on the analysis of price trends as well as the more sophisticated test of demand
(Chapter 9) or a system of demand equations (Chapter 15). Generally, tests based on price
trends alone should be treated with caution, as they do not allow an assessment of
whether prices could be profitably raised by market participants. However, the paucity
of the data available often prevents the analyst from estimating more appropriate demand

models, so that antitrust markets are defined on the basis of price tests alone. The two
examples in this chapter on the definition of the relevant market for radio advertising and
the relevant market for petrol highlight some of the techniques used in the definition of
the relevant product market and the geographic market respectively.
Analysis of market structure
2.26 The traditional analysis of antitrust is firmly rooted in the structure-conduct-performance
paradigm developed by Bain. According to this view, it is the structure of the market
25
that determines its performance, via the conduct of its participants. Performance is
measured by the ability to charge a price above the competitive level, thereby earning a
positive mark-up. In line with this paradigm the degree of concentration in a market has
long been considered one of its major structural characteristics and analysis of market
structure then becomes a key indicator of actual or potential market power.
2.27 It is now recognised at both a theoretical and empirical level that the structure-conduct-performance approach is overly simplistic and that matters are more complex.
Nevertheless, considerable emphasis in antitrust cases does still seem to be put on
structural data, perhaps partly because it is relatively easy to collect.
Concentration indices
2.28 Here, market shares are calculated for all firms identified as participants in the market.
They may be calculated on the basis of a firm’s sales or shipments or capacities,
There are other indices that provide a measure of market concentration. The HHI is simply the one that
26
is used most widely.
HHI levels of 1000 and 1800 correspond to a four-firms concentration ratio of 50-70% respectively.
27
See also paragraphs 3.2 to 3.6 for a further discussion of HHI.

Farrell , J. and C Shapiro, 1990, Horizontal Mergers: An Equilibrium Analysis , American Economic
28
Review , 80: 107-26
21
depending upon the nature of the market. Note that total sales (or capacity) include those
that are likely to arise in response to a small, non-transitory increase in price. So, even
firms not currently producing for, or selling in, the market are assigned ‘hypothetical’
market shares. As already noted, the simple market share held by a firm, or a merged
firm, may be used to trigger an investigation.
2.29 The He rfindahl-Hirschman Index (HHI) is also used, for example, by the US competition
authorities to measure market concentration. The HHI is simply the sum of squares of
26
individual market shares (and so it gives proportionately greater weight to larger firms).
According to the FTC/DOJ Merger Guidelines, an ‘unconcentrated market’ has an HHI
less than 1000, a ‘moderately concentrated market’ has an HHI between 1000 and 1800,
and a ‘concentrated market’ an HHI greater than 1800, while a pure monopoly would
have an HHI of 10,000. Any merger which would leave the HHI below 1000 is
27
considered unlikely to raise concerns that it will significantly reduce competition. A
merger leading to an increase in the HHI of less than 100 points, when HHI is between
1000 and 1800, will also not normally be investigated. When the HHI exceeds 1800 and
a proposed merger leads to an increase of more than 50 points, serious competitive
concerns are deemed to be raised.
2.30 Measures of market concentration are only as good as the implied definition of the
market. Even when that is deemed to be unproblematic however, market concentration

measures are economically difficult to interpret, and the connection between market share
and market power is far from clear. Farrell and Shapiro have argued that the HHI is a
28
poor reflector of the welfare consequences which flow from a merger, and that ‘increases
in the HHI are not associated with a lessening of economic welfare’. In fact, in some
simple Cournot models, ‘more concentration amongst the non-merging firms makes it
more likely that the merger will be welfare enhancing.’
2.31 Further:
‘Implicitly the guidelines assume a reliable (inverse) relationship
between market concentration and market performance. In particular
the entire approach presumes that a structural change, such as a
merger, that increases the equilibrium value of [the] HHI also
symmetrically reduces equilibrium welfare defined as the sum of
producer and consumer surplus. Is there in fact such a reliable
relationship between changes in market concentration and changes in
economic welfare? In some very special circumstances there is…, but
London Economics, 1997, Competition in Retailing, Office of Fair Trading Research Paper 13
29
discusses the analysis of competition in retail markets
Frankel, A. And J. Langenfeld, 1997, Sea Change or Submarkets?, Global Competition Review, June/July: 29-30
30
22
if the competing firms are not equally efficient, or there are economies
of scale, there is no reason to expect that concentration and welfare
will move in opposite directions.’

2.32 Here the now familiar objections to an overly deterministic and structuralist
approach to competition are being made. Concentration indices, like all indices ,
are at best rough measures of the quantities of interest – in this case market power
– and must be used with care. Analyses relying exclusively on such measures are
likely to be led into error.
Price-concentration analysis
2.33 A frequently-used test to assess the impact of concentration in an industry
(market) is to compare a number of local markets in terms of their supply
characteristics. The hypothesis is that higher degrees of concentration go hand-in-hand with higher prices and price-cost margins. Such tests are sometimes used in
retailing markets that are local. The SCI/Plantsbrook (1995) case outlined in
paragraphs 13.14 to 13.18 and the case study below on the US merger of two
office supply chains give examples of this analysis. Other examples are the petrol
enquiry by the MMC in 1989 and the merger of betting shop chains, Grand Met
and William Hill, also in 1989. The MMC found that the merger of Grand Met
and William Hill bookmakers would create a number of local monopoly
situations leading to reduced competition in off-course betting at a local level,
and that Grand Met should therefore divest certain betting offices. Offices should
be divested where former Mecca betting offices (belonging to Grand Met) and
William Hill betting offices were within quarter of a mile of each other, and,
where there were no other betting offices within a quarter of a mile of one of
these offices. There was some debate however, over whether the divestiture went
far enough. The existence of barriers to entry at the local level as well as at the
national level, where the two chains of bookmakers compete in terms of
advertising and promotion, would suggest that the merger needed to be examined
more closely with regard to its negative effect on competition.

29
CASE STUDY 3: STAPLES AND OFFICE DEPOT
30
Following industry consolidation Staples and Office Depot are two of the three remainin g
office supply ‘superstore’ chains in operation in the US - the other bein g Office Max. In
September 1996 Staples Inc agreed to acquire rival Office Depot in an acquisition valued
23
at $3.4 billion. Prior to the emer gence of superstores in the mid-1980s, businesses and
consumers typically purchased office supplies through dealers that offered items listed
in a catalo gue published b y one of several office supply wholesalers. The superstore
chains followed a different strate gy. The y constructed lar ge, efficient warehouse-st yle
stores where a variety of items were offered. Although this fell far short of the variet y
offered by traditional wholesalers with their immense catalogues, the cost savings on
popular items were passed on to consumers in the form of lower prices. Most
consumable office supplies are still however sold through other channels, includin g
traditional distributors and their dealers, contract stationers, mass merchandisers and
others.
In April 1997 the FTC rejected an offer b y Staples to divest up to 63 stores to Office Max
as a condition for permitting the acquisition to proceed. This was unusual for a US
antitrust a genc y that often settles merger challen ges with this t ype of consent
agreement.
The FTC argued that the companies’ documents and statistical evidence demonstrated
that Staples and Office Depot are particularl y close competitors. That is, in geographic
markets (metropolitan areas) in which two firms compete with one another, office supply
prices are significantly lower than in metropolitan areas in which onl y one or the other is

present. The FTC further concluded that the relevant product market includes onl y ‘the
sale of office supplies through office superstores’ and that Staples’ acquisition would
lessen competition in violation of antitrust le gislation.
Staples and Office Depot rejected the FTC’s statistical study of the relationship between
price and head-to-head superstore competition on two grounds. First, the y claimed that
the FTC’s results were unrepresentative because of the particular set of office suppl y
products analysed. Secondl y, they argued that the FTC’s results did not take proper
account of the fact that hi gher prices were found in the cities which generall y have hi gher
costs for doing business. Furthermore, Staples and Office Depot to gether account for
only 5% of total annual sales of office suppl y products in the US.
Both the FTC and the parties seem to agree that the advent of superstores has brou ght
systematicall y lower prices to office suppl y consumers. Staples and Office Depot ar gued
that the mer g er would allow more of the same, while the FTC maintained that it is this
very cost and price reduction caused b y the formation of superstores that has effectivel y
turned them into their own relevant market. This case was interestin g in that it showed
the FTC’s general tendency towards focusing on anti-competitive effects involving either
narrow markets or small parts of larger markets. It also hi ghlighted their increasin g
reliance on sophisticated economic theories and statistical techniques to define these
narrow markets and estimate the likely competitive effects of mer gers.
Barriers to entry
2.34 Increases in concentration do not necessarily result in higher prices. If market entry is
easy, the threat of entry by potential competitors reduces the ability to exercise market
Martin Graham and Anthony Steele, 1997, The Assessment of Profitability by Competition Authorities, OFT
31
Research Paper 10

Harbord, D. and T. Hoehn, 1994, Barriers to Entry and Exit in European Competition Policy,
32
International Review of Law and Economics : 411-35.
Baumol, W. J., J.C. Pauser and R.D. Willig, 1982, Contestable Markets and the Theory of Industrial
33
Structure , NY: Hartcourt Brace Jovanovich. The other side of this problem is that sunk costs also
constitute a barrier to exit for the incumbent firms.
Paragraph 122 of the decision in the ECJ case 27/76
34
24
power. The prevalence of barriers to entry has been a long-standing issue of debate
among economists. Barriers to entry can be detected and their magnitude assessed by
examining the profitability of firms from their activities in the relevant market. This is
often done by comparing the Accounting Rate of Return (ARR) with the risk adjusted
cost of capital. Martin Graham and Anthony Steele have described a superior technique
in which the Certainty Equivalent Accounting Rate of Return (CARR) is compared with
the risk free rate. Recent, largely theoretical, work in industrial organisation has greatly
31
clarified the approach that should be taken to the analysis of entry conditions and barriers
to entry. The so-called ‘new industrial organisation’ economics (‘the new IO’) has
32
brought strategic issues to the fore and has contributed greatly to our understanding.
2.35 In particular the new IO allows us to isolate a small number of factors of crucial
importance in assessing barriers to entry, and questions concerning market power, and
so directs attention towards particular aspects of the firm’s technology, market structure

and firm behaviour. To be more specific, the new IO has revealed the fundamental
importance of sunk costs, the nature of post-entry competition and strategic interaction
between incumbents and entrants as being crucial to any analysis or case study of entry
conditions in particular markets.
2.36 Against this background it is surprising to find that so much analysis of mergers is based
on the structure-conduct-performance paradigm. The MMC, DOJ as well as the
European Commission’s DGIV, put a lot of emphasis on the analysis of market structure
and concentration ratios.
2.37 For example, the existence of high economies of scale is the typical Bainian ba rrier – the
incumbents can set pre-entry output at such high levels that new entrants would be forced
to sell at below cost. In a number of cases the MMC or the European Court of Justice
(ECJ) have concluded that economies of scale deter potential competitors. Although it
is unusual to find significant economies of scale without associated sunk costs, it is
nevertheless important to make the distinction between economies of scale that involve
sunk costs and those which do not. The existence of sunk costs which are irrecoverable
33
if entry is unsuccessful is clearly recognised in United Brands:
34
‘The particular barriers to entry to competitors entering the market are the
exceptionally large capital investments required for the creation and running
[1991] OJ L 334/42.
35
London Economics, 1994, The Assessment of Barriers to Entry and Exit in UK Competition Policy,
36
OFT Research Paper 2.

25
of a banana plantation, …and the actual cost of entry made up inter alia of
all the general expenses incurred in penetrating the market such as the setting
up of an adequate commercial network, the mounting of very large scale
advertising campaigns, all those financial risks, the costs of which are
irrecoverable if the attempt fails.’
2.39 The view that sunk costs are a barrier to entry is also argued by the Commission in the
de Havilland case . Aerospatiale and Alenia, who control the largest European and
35
worldwide producer of regional aircraft, proposed to acquire the second largest producer,
de Havilland. The aircraft industry is characterised by high sunk costs in both plant and
equipment, and in the costs of changing designs, which deter post-design alterations. The
Commission found that a time-lag of two to three years for market research was required
to determine the type of plane a market needed, and that the total lag time was six to
seven years from initial research to point of delivery. Potential entrants from around the
world were identified, but the Commission concluded that the additional investment
required in research and development, and in design changes, made entry unlikely.
2.40 In their research report for the OFT, London Economics recommend a seven-step
procedure to assess the existence of barriers to entry. The US approach is similar in that
36
the DOJ focuses on the history of entry as well as the cost conditions under which viable
entry is expected to occur. The US approach outlines three ways to deal with barriers to
entry:
Assess actual experience with entry into the market under investigation. The
turnover of firms in the industry can be taken as an indication of ease of entry and

exit. The higher the turnover, the easier is entry.
Estimate the ‘minimum viable scale’ (MVS). The US DOJ Merger Guidelines
provide an heuristic test for assessing entry into markets for homogenous goods:
if a firm can profitably enter the market with a market share of less than 5%, then
entry can be assumed to be likely. The reasoning for the 5% benchmark is as
follows. Assuming a unit price elasticity of demand, if the market price is raised
by 5% due to a merger or other anti-competitive act, market demand will decrease
by 5%. This creates an opportunity for entry, because it frees 5% demand
capacity. The test consists of determining whether there could be a firm that
would enter the market, produce that extra 5% and still be in business when the
price goes down by 5% and back to its original level, as a result of the increased
supply due to the new entry. Historical data on entry patterns in the market under
investigation can be used as evidence for this test; the analyst will look at the size
Hayek’s dictum that all relevant economic information is contained in a product’s price dates from his
37
classic article and remains, despite its oversimplification, a powerful statement today. Hayek, F., 1945,
The Use of Knowledge in Society, American Economic Review, 35: 519-30.
26
of entrants in terms of market share at the time of entry, and at the size they
reached after one or two years. In the absence of historical data, a less preferred
alternative would be to look at the size and profitability of current firms. This
way of proceeding will give the analyst an idea of whether entry could be
possible, but it will not shed light on whether some new firm could actually enter
the market: that depends on sunk costs. However, in the absence of information
on sunk costs, this methodology might be the only one available to the analyst.

Undertake pro forma calculations in a business-type analysis. The analyst
who has information on the current market price, variable cost and initial
investment will calculate whether it would be profitable to enter the market.
From these calculations one can assess how large the company would have to be
in order to be profitable, and so estimate the minimum viable scale.
2.41 The London Economics approach is more wide-ranging and includes the analysis of
strategic behaviour which could also be considered to be part of the assessment of
competition and anti-competitive behaviour.
Analysis of competition and the scope for market power
Analysis of prices and price trends
2.42 The analysis of prices, price trends and relative price levels can be an important part of
a competition investigation. Price analyses are particularly useful in investigations of
alleged price fixing and bid rigging during procurement auctions, and can contribute to
market definition analysis (as indicated above). The simple analysis of prices already
provides a significant amount of information and once prices of products are analysed
together with the respective quantities sold in the market then additional information is
generated. More generally, prices are the main element in competition (although non-37
price factors can also be important) and so price levels directly affect consumer welfare.
Problems in competition normally manifest themselves in non-competitive price levels.
2.43 Below are just a few exa mples of instances in the past ten years where competition issues
were raised on price grounds. Typically the public or some public watchdog argued that
price was too high and that competition was in danger of malfunctioning unless the
authorities intervened.
Monopoly and Mergers Commission, 1994, The Supply of Recorded Music. A Report on the Supply in the UK

38
of Pre-recorded Compact Discs, Vinyl discs and tapes containing music.
27
CASE STUDY 4: THE SUPPLY OF RECORDED MUSIC
The 1993 MMC inquiry into the supply of recorded music was prompted b y the concern
38
about the prices of compact discs (CDs), with particular emphasis on the difference in prices
between the UK and the US. The Consumers’ Association presented the MMC with a body of
evidence gathered durin g their on- going observation of CD prices. The y highlighted that CD
prices had remained high since their introduction into the UK market while the price of CD
players had fallen substantially; that the production costs for CDs had fallen; and, that there
was widespread consumer dissatisfaction with the level of CD prices in the UK compared to
the US.
For the purposes of investi gation, the MMC commissioned a surve y that compared the retail
prices of pre-selected, full price album titles, for both CDs and cassettes, across the UK,
USA, Germany, France and Denmark. The avera ge prices for the pre-selected CDs, without
tax and adjusted to pound sterlin g equivalents, were then compared across the five
countries. The results of the survey are presented in the table below. The results show that
the average CD was priced 8% lower in the US than the UK and that average prices in the
other countries were higher than the UK. Cassette prices exhibited a similar pattern with the
US being 12.9% lower than the UK.
One of the record companies, Sony, carried out its own surve y on the prices of a lar ger
sample of titles in the UK and US. Looking at wei ghted avera ge prices of full price titles, the y
found that prices in the US were 5.8% lower than in the UK, for CDs, and 11% lower than in
the UK, for cassettes. These results are similar to the MMC’s results. However, because of

the lar ger sample the statistical significance of the smaller difference in the Son y surve y
could be confirmed. Furthermore Son y found - from an analysis of the avera ge retail prices
(unwei ghted) of Sony CDs in different US cities - that the price ran ge was actuall y greater
within the US than between the US and the UK.
Table 1: Cost in Pounds Sterlin g of Pre-selected CD Titles in Europe and the US
Pre-selected Titles UK US F* G* Denmark
Diva – Annie Lennox 11.78 10.21 13.03 11.23 11.38
Soul Dancing – Taylor Da yne 11.25 9.83 12.87 11.19 11.58
Zooropa – U2 10.22 9.85 11.88 10.72 11.33
Keep the Faith – Bon Jovi 10.56 10.53 12.81 10.89 11.50
River of Dreams – Bill y Joel 10.33 9.45 11.74 10.75 11.28
Timeless – Michael Bolton 11.26 10.45 12.41 11.00 11.28
Tubular Bells II – Mike Oldfield 11.71 10.21 12.71 10.92 11.25
What’s Love Got to Do With It?
– Tina Turner 10.06 9.67 13.12 11.15 11.44
Column Average 10.90 10.03 12.57 10.98 11.38
Monopoly and Mergers Commission, 1989, The Supply of Petrol.
39
28
* F is France
* G is Germany
Source: BMRB International Survey of retail prices, September 1993
Given the consistent findings of lower prices for recorded music in the US than in the UK, the
MMC asked a specialist retail consultancy to assess whether the differences in CD and
cassette prices between the US and the UK were reflected b y similar differences in prices of

other products. A price audit on a carefully matched basket of manufactured leisure goods,
sold at similar prices to recorded music, was undertaken in late 1993. The audit found that on
average the US prices (using the same exchan ge rate as the ori ginal MMC surve y and
without tax) were 8% lower than the same goods in the UK. This result was in line with the
results of the price surve ys for CDs indicating that there was nothin g unusual or atypical
about this market. These findin gs contributed to the MMC’s conclusion that the complex
monopoly in the suppl y of recorded music did not act a gainst the public interest.
2.44 In the petrol enquiry the MMC report discussed at some length and summarised empirical
evidence regarding the transmission of price changes for crude oil to prices at the petrol
station. This involved the analysis of long-term price trends through dynamic regression
analysis. The justification of this analysis was the apparent uniformity of prices at petrol
stations in local areas on the one hand and the speed at which prices were adjusted
upwards when the price for crude oil rises on the Rotterdam spot market. The MMC
investigated the supply of petrol in the UK and in its report cleared the industry of any
anti-competitive practices.
39
Carton board, 1994, Case IV/33833, OJ L243.
40
29
2.45 The analysis of competition in antitrust investigations often takes the form of seeking to
establish the effects of a particular set of actions or a change in behaviour. This is the case
when the formation of a cartel is said to have led to higher prices than otherwise would
have been the case. Similarly the merger of two companies active in the same market is
an event that may lead to a change in output, quality or price, to the detriment of
consumers. While in the case of a notification of a merger the event is in the future, in

many cases there is a historical event that can be evaluated in an empirical fashion.
2.46 There is no single quantitative technique that is designed to capture the historical impact
of an event. Rather, event analysis or impact analysis, is an element in most quantitative
techniques. For example, the analysis of price trends mentioned above could entail the
statistical test for a structural break of the time series. Did the break up of the
international coffee cartel lead to change in green coffee bean prices traded on the
international commodity markets? Did the ending of anti-dumping duties on soda ash
lead to a decrease in soda ash prices in the European Union? Did the co-ordinated price
announcement of the European carton board producers lead to higher prices than the free
interaction of supply and demand would lead us to expect? More generally, events can
be analysed in a number of ways:
Time series of prices can be evaluated in terms of structural breaks (for example,
standard tests exist in most econometric packages; dummy variables that relate
to the event can be included in regression equations).
Actual price trends can be compared with what a model of competition in the
absence of an event would predict (bidding models, for example, or oligopoly
models where the number and identity of players are changed).
The counterfactual can be empirically established in some instances (stock market
reactions to news of a merger or price announcement can be compared to an
index).
2.47 Event analysis – or impact analysis – played an important part in the Carton board case .
40
Here the European Commission imposed heavy fines on companies who had formed a
cartel, which among others co-ordinated regular price announcements over a period of
five years. The decision was recently confirmed in an appeal at the Court of First

Instance (the decision of May 14 1998). As part of their defence to argue mitigating
circumstances a study of actual price trends was commissioned by a group of companies
and submitted to the Commission. This study analysed the actual behaviour of prices as
against the trend of prices implied by the series of price announcements and showed a
major divergence of these two price series. The study showed how the prices achieved
Sources include Werden, G.J. and L.M. Froeb, 1994, The Effects of Mergers in Differentiated Products
41
Industries: Logit Demand and Merger Policy, Journal of Law, Economics, and Organization; 10(2):
407-26.
A leading example is Hausman, J.J., G. Leonard, and J. D. Zona, 1994, Competitive Analysis with
42
Differentiated Products, Annales d'Economie et de Statistique,, 34: 159-80.
30
in the market place only followed the price announcements initially and even then only
to a small degree. The Court noted the lack of any verification by the Commission of the
actual effect of the cartelistic practice but this did not affect the decision to uphold the
Commission’s findings.
Models of competition
2.48 A number of empirical approaches and simulation models have been developed with the
aim to assess directly the scope for market power following a merger between producers
of differentiated products. Similarly, existing rather than potential market power may
manifest itself through anti-competitive behaviour which limits the extent to which a
leading firm will lose sales to close competitors. One technique that seeks to quantify
these effects is the so-called ‘diversion ratio’ which measures the degree to which a firm
is subject to loss of sales to competitors who provide many customers’ first and second

preferred choices (with an homogenous, or identical, product market any price differences
should, all other factors being equal, lead to full and immediate substitution to a rival).
2.49 With the same objective (to establish the scope for independent behaviour), the
Department of Justice has employed statistical estimation of the demand for the
differentiated products of competing firms, and then simulated potential price increases
based on models in which consumers’ rankings of goods are independent of prices—in
technical terms, logit demand models. Such or related methods have been used in cases
41
concerning fragrances, desk-top publishing software, wholesale bread bakers, and many
others.
2.50 Other empirical and simulation approaches follow a similar approach to the logit model,
but are less restrictive in their assumptions. They also use data on prices, quantity of
sales, margins, and costs in attempts to estimate the full system of demand equations for
competing differentiated products. Then, the effects of a merger (or other practice) on
42
price is simulated from the elasticities and other relations from these estimated equations.
Such methods have been used in presentations to the US enforcement agencies, most
often for consumer products for which scanner-based price data is available. In Europe
such techniques have been little used. One notable exception is the case of Kimberley
Clark/Scott where such techniques were employed. Another case where the nature of
competition was modelled explicitly is the Boeing/McDonnell Douglas merger. There an
interested third party provided empirical evidence of the bidding process in the sale of
civilian aircraft.
Bishop, B., 1997 The Boeing/McDonnell Douglas Merger, European Competition Law Review,
43

18(7): 417-19.
31
CASE STUDY 5: THE BOEING/MCDONNELL DOUGLAS MERGER
This mer g er between two of the three main suppliers of civil aircraft, has been the cause of
43
much debate. In normal circumstances a merger that reduced the number of firms in an industr y
from three to two, and saw a lar ge increase in the HHI would have provoked an antitrust suit by
the FTC and have faced stiff resistance from the European Commission. Instead the mer ger was
allowed to proceed with the European Commission imposing the relativel y weak remed y of
accounting separation for the militar y and civil side of the combined Boein g/McDonnell Douglas
Corporation.
One of the arguments used b y Airbus, the main competitor to Boeing and the McDonnell
Dou glas Corporation (MDC), to influence this decision was a biddin g study. This stud y revealed
that in 54 ‘campai gns’ or bidding procedures, the presence of the MDC as a bidder played a vital
role in reducing the prices paid b y airlines. On avera ge, prices were 7.6% hi gher when the MDC
did not bid. The result was the same, regardless of whether the size of the sale and other
factors, were statistically controlled. These results would suggest that the mer ger might be anti-competitive as competition in the civil aircraft market was likel y to be reduced, so increasing the
prices paid b y airlines and the fares subsequently paid b y consumers.
The obvious conclusions that were drawn from the biddin g study assumed that the future would
be similar to the past in the absence of the merger. Boein g, however, ar gued that the MDC was
a failing firm (an argument often used in antitrust cases) and that no-one would bu y MDC
products a gain. The ar gument succeeded even though there was evidence to su ggest that the
MDC was not a failing firm in the classical sense. Indeed, for its newest aircraft there is an
orders backlo g for years of production work, and even as a spares business the MDC would be
profitable for several years.

It is interestin g that Airbus was the only part y to oppose the merger. Even the US customers of
Boeing, did not question the amal gamation of the two suppliers. This lack of involvement by US
airlines was used to support the decision to allow the merger. Airbus on the other hand,
Similar tests have been proposed, and used, by the UK’s Office of Fair Trading, see G. Myers, 1994,
44
Predatory Behaviour in UK competition policy, OFT Research Paper 5 which adds to the analysis of
predation with an assessment of intent as well as a discussion of the cost tests that can be applied. See
also Judge Easterbrook in A.A. Poultry Farms Inc. v. Rose Acre Farms Inc. F.2d 1396 (7 Cir. 1989),
th
and Klevorick (1993).
Areeda, P. and D. Turner, 1975, Predatory Pricing and Related Practices Under Section 2 of the
45
Sherman Act, Harvard Law Review, 88: 697-33.
Areeda, P. and D. Turner, 1975, op. cit.
46
Areeda, P. and H. Hovenkamp, 1992, Antitrust Law: An Analysis of Antitrust Principles and Their
47
Application, 1992 Supplement. Boston: Littlebrown.
32
which,based on the results of the bidding study was set to benefit from increased prices,
opposed the mer ger. It feared that Boeing would use its new market power in a predator y
manner, using offset deals on militar y aircraft produced b y the militar y unit of MDC.
Predatory pricing
2.51 In contrast to concerns that prices are too high, prices that are too low may also be
troublesome. As an empirical matter it is very hard to determine when pricing is

predatory. The offence – low pricing – is also a prime virtue of the competitive process.
Distinguishing predatory from normal competitive behaviour is therefore a subtle task.
Among others, London Economics (1994) proposed a two-part test for predatory
pricing. The first step is an analysis of market structure to determine whether predatory
44
behaviour is potentially a rational strategy. The crucial question is whether the alleged
predator, if successful in deterring entry or inducing exit, could recover the short-term
losses incurred. The second step is an examination of conduct or market behaviour using
a price-cost test, such as the one suggested by Areeda and Turner which seeks to
45
establish whether prices are below variable costs. In addition it is useful to investigate
the history of entry-deterring behaviour in the market and evidence of intent. Modern
theory also suggests that capital market imperfections, for example, information
asymmetries and financial constraints, can be important in supporting predatory
behaviour.
2.52 Areeda and Turner’s price-cost test excludes only the following from variable costs: (i)
46
capital costs, (ii) property and other taxes, and (iii) depreciation. It is important is to
determine which costs were truly ‘avoidable’ in the sense that they would not have been
incurred otherwise, that is, if prices had not been lowered and output or sales thereby
increased. As stated by Areeda and Hovenkamp:
47
‘Which costs are to be considered variable and fixed is a function of the time
period and how large a range of output is being considered. All costs are variable
in the long run...A predatory pricing rule should focus on those costs which are

Phlips, L. And I.M. Moras, 1993, The AKZO Decision: A Case of Predatory Pricing?, Journal of Industrial
48
Economics, 41: 315-21.
AKZO’s market share in the EC market for organic peroxides in 1981 was 50%.
49
In 1982 AKZO’s market share in the UK flour additives market was 52%, followed by ECS with a market share
50
of 35%, and Diaflex with 13%. Diaflex purchased its raw materials from AKZO. There were three large buyers
of roughly comparable size with a combined market share of 85%, plus a number of smaller independent flour
mills.
Diaflex followed suit and offered prices similar to those quoted by AKZO to two large independent customers
51
of ECS. Price cutting continued until 1983 when ECS was grated interim measures by the Commission.
33
variable in the relevant time period. ...The cost-based rules must focus on costs
which the defendant should have considered when setting the allegedly predatory
price.’
So, the distinction between fixed and variable costs will depend upon the range of output
and the time period involved, the nature of the firm’s contracts with its input suppliers,
whether or not it has excess capacity, etc. The important point is the identification of the
avoidable costs upon which economic decisions are based.
CASE STUDY 6: AKZO

The classic finding of predation in EU competition law is the AKZO case. AKZO Chemie was
48
the major European producer of organic peroxides, one of which, benzo yl-peroxide, was used
in flour additives in the UK and Ireland. Most sales of or ganic peroxide however were in the
European plastics market, where AKZO was a dominant supplier. ECS, a UK producer of flour
49
additives, began to produce benzo yl-peroxide for its own use in 1977 after a series of price rises
b y its main supplier, AKZO. When ECS started to expand into the more lucrative European
50
plastics market in 1979, AKZO responded with direct threats of overall price reductions in the
UK flour additives market and price cuts tar geted at ECS’s main customers, if ECS did not
withdraw from the plastics sector. In December 1979, ECS was granted a Hi gh Court injunction
in the UK to prevent AKZO from implementin g its threats. An out-of-court settlement was
subsequently reached in which AKZO undertook not to reduce its selling prices in the UK or
elsewhere ‘with the intention of eliminating ECS as a competitor’.
Prior to the dispute AKZO re gularl y increased its prices to its UK customers b y increments of
10%. ECS tended to follow AKZO’s UK price increases whilst maintainin g its own prices
approximatel y 10% below AKZO’s. In March 1980, followin g the out-of-court settlement, AKZO
a g ain increased its UK prices b y 10%, but on this occasion ECS did not follow, increasin g the
normal price gap between the two companies. Some of AKZO’s large customers subsequentl y
approached ECS for price quotations. AKZO responded by matchin g or betterin g ECS price
offers, and undercutting ECS’s prices to its own customers. This resulted in AKZO gaining
51
market share at the expense of ECS.
The price histor y as described b y the Commission would appear to be consistent with vi gorous

price competition following a breakdown of previousl y co-ordinated pricin g strate gies, or with
See Phlips, L. And I.M. Moras, 1993, op. Cit., who interpret the price history as evidence of ‘the reaction of a
52
dominant firm that lost its price leadership and tries to discipline a deviant’, the result being a shift from ‘a price
leadership situation towards a more competitive one ’. We are not unsympathetic to this interpretation, although
their argument that the market was characterised by ‘ complete information’, making predation a non-credible
strategy, strikes us as far-fetched.
The Advocate-General disagreed with the Commission’s approach to market definition, and argued that, in any
53
case, it was not sufficiently proved that AKZO held a dominant position in the relevant market. He also found
insufficient evidence of abuse of dominant position.
34
predation. The Commission concluded in favour of predation on the basis of internal AKZO
52
documents which indicated that eliminatin g ECS was its strate gy, and internal mana gement
documents apparently demonstrating the AKZO prices for selected customers were less than
average variable, or mar ginal, costs. The Commission ar gued that AKZO’s predatory behaviour
was creating a barrier to entry, and pointed to evidence of other predator y episodes as well as
evidence of financial difficulties at ECS which limited its ability to sustain a prolon ged price war.
This case contains practically all of the in gredients required for successful predation. AKZO had
si gnificant market power in each of the markets in question (that is, large market shares in both
the UK flour additives market and the EU plastics market), evidence of predator y intent was

g iven, as well as evidence of previous predator y episodes. Prices were found to be below
averag e variable cost in tar geted market segments and ECS was found to be financiall y
constrained. In addition, AKZO was apparentl y tar getin g a market of minor importance to protect
its more lucrative European plastics market, so minimisin g the costs of predation, while inflictin g
maximum damage on its competitor.
The case has received widespread attention. On appeal the ECJ supported the main findings
of the Commission, despite a dissenting opinion b y the Advocate-General, and AKZO was
53
fined ECU 7,500,000.
Evaluation of efficiency defences
2.53 A major area of economic antitrust analysis that requires quantification is the so-called
‘efficiency defence’. This relates to claims of efficiency gains from certain restrictive
practices between firms and proposals for establishing joint ventures or full-blown
mergers. Economics distinguishes three types of efficiency and each presents a number
of problems when it comes to empirical verification:
allocative efficiency , which means that prices reflect costs such that firms
produce relatively more of what people want and are willing to pay for. As a
result, resources are allocated within the economy in such a way that the output
most valued by consumers is produced;
Bork, R., 1978, The Antitrust Paradox , Maxwell Macmillan: Oxford
54
35
productive (internal) or technical efficiency, which means that, given output,
production takes place in practice using the most effective combination of inputs:

so productive efficiency implies that internal slack is absent; and
dynamic efficiency, which means that there is an optimal trade-off between
current consumption and investment in innovation and technological progress.
2.54 The role of antitrust legislation is to improve allocative efficiency without restricting the
productive and dynamic efficiency of firms to the extent that there is no gain, or a net
loss, in consumer welfare.
54
Allocative efficiency
2.55 Traditionally, the economic literature has put particular emphasis on how competition
might promote allocative efficiency. This mechanism is easier to understand and study
empirically than other notions of efficiency. Quite simply, competitive pressures tend to
push prices towards marginal costs by eroding market power. Given a certain number of
firms in a market, the alignment of prices with marginal costs generates allocative
efficiency. In this perspective, collaboration between independent firms or mergers that
reduce the number of firms are unlikely to promote allocative efficiency. The verification
or falsification of this hypothesis is the subject of the price-cost margin and concentration
ratio analysis discussed above in paragraphs 2.42 to 2.52. Such a test is designed to
support or reject the hypothesis that allocative efficiency is being impaired by a merger
proposal.
2.56 However in some circumstances marginal cost pricing may conflict with other objectives.
In particular in the presence of increasing returns to scale, increasing the competitive
pressures on prices may not give the optimal incentive for market entry. More
competition (in the sense of more firms) causes prices to fall towards marginal costs, but
at the same time less advantage is taken of scale economies related to fixed entry costs,
and so average cost rises. Under fairly general conditions, the negative externality that

an additional entrant imposes on existing firms, by taking business from them, may
outweigh the positive externality to consumers in terms of lower price.
2.57 In this perspective the assessment of economies of scale and, in particular, their empirical
verification becomes central to an antitrust assessment. The measurement of economies
Not least because many production processes are multi-product and not simple single production
55
processes. See Baumol W. J., J. C. Panzar and R. D. Willig (1982), Contestable markets and the theory
of industry structure. Harcourt Brace Jovanovich: New York.
See, for example, the overview by Schmalensee, R., (1989) Inter-Industry Studies of Structure and
56
Performance, in R. Schmalensee and R.D. Willig (eds.), The Handbook of Industrial Organisation
Volume II , North Holland: New York.
Davies S. and B. Lyons, 1996, Industrial organisation in the European Union: Structure, strategy and
57
competitive mechanism, Clarendon press: Oxford.
Sutton, J., 1991, Sunk Costs and Market Structure: price competition, advertising and the evolution
58
of concentration, MIT Press: Cambridge
Monopoly and Mergers Commission, 1989, The Supply of Beer
59
Monopoly and Mergers Commission, 1986, White Salt.
60
The European Commission has undertaken several antitrust investigations including Irish Sugar case
61
97/624, Sugar Beet, case 90/45, and Napier Brown/British Sugar case 88/518.

36
of scale is, however, not a trivial task. While it is in general possible to use accounting
55
data to derive point estimates of costs at different levels of output it is only through a
proper econometric estimation of cost functions that more reliable estimates can be
obtained. Numerous empirical studies of economies of scale have been undertaken at the
industry level. In the European context the study by Davies and Lyons is a good
56 57
example. Another excellent study that goes beyond cross-sectional analysis of industries
and tries to explore the way unique cost structures govern the performance of selected
industries is Sutton. In his path-breaking study he deals with, among others, the salt,
58
sugar, soft drinks and beer industries and shows how the existence of exogenous sunk
cost (technological) and endogenous sunk costs (advertising) interact with economies of
scale and determine minimum boundaries of concentration of a specific industry.
2.58 In the context of antitrust proceedings the estimation of economies of scale is very time-consuming and cannot usually be undertaken in merger investigations that are subject to
tight deadlines. However, major industry investigations allow room for more in-depth
research. In the UK the beer industry, and the salt industry, for example, have been
59 60
extensively investigated. In Europe, the sugar industry has been investigated by the
European Commission on a number of occasions.
61
2.59 Another area of antitrust where cost structures and, in particular economies of scale, are
absolutely central to the considerations of an investigating authority is the failing
company defence. Only if economies of scale exist and are very large with respect to the

size of a market, can this argument for a merger be made. The acquisition of British
Caledonian by British Airways in 1987 was such a case, albeit controversially so. The
failing company defence was also used in the Boeing/McDonnell Douglas merger, a
summary of which can be found on page 30. In the European Union the issue of unviable
cost structures and the need to achieve efficient levels of production is the key element
For a review of the state aid system see Hancher, L.T., T. Ottervanger and P.J.Slot, 1994, Chancery
62
Law publishing and Chapter 12 in London Economics, 1997, Competition Issues, Volume 3, Subseries
V, Single Market Review 96. Office for Official Publications of the European Communities.
Caves, R. , 1990, Industrial Organisation, corporate strategy and structure, Journal of Economic
63
Literature, 64-92
Caves,R. and D.E. Barton, 1990, Efficiency in US Manufacturing Industries , MIT Press: Cambridge.
64
Caves, 1992, Productivity dynamics in manufacturing plants, Brookings papers on Economic Activity ,
65
187-267
Nickell, 1992, Productivity Growth in UK Companies, 1975-86, European Economic Review, Vol 36,
66
1055-91.
37
in State Aid proceedings under Article 92 of the Treaty of Rome. Typically the
Commission undertakes an industry and cost analysis before deciding whether or not to
allow state support to an individual company.
62

Productive efficiency
2.60 The causality between competition and productive efficiency is deeply rooted in
economic folklore: starting from Hicks’ notion that ‘the best of all monopoly profits is
a quiet life’, economists have always had a ‘vague suspicion that competition is the
enemy of sloth’. The theoretical literature is not in agreement on the exact nature of this
63
relationship. However the empirical literature provides a relative wealth of evidence to
support the notion that competition enhances productive efficiency. To mention but a
few, Caves and Barton, and Caves use frontier production function techniques to
64 65
estimate technical efficiency indices in a number of industries, and relate these to
concentration (as a proxy for competition). They find that increases in concentration
beyond a certain threshold tend to reduce technical efficiency. Nickell finds that market
66
concentration has an adverse effect on the level of total factor productivity. This means
that, all other factors being equal, an increase in market concentration should be followed
by a fall in productivity.
2.61 The MMC has not relied on such techniques very often. The major exception is the
assessment of mergers in the utility sector where the justification depended on claims of
significant productive efficiency gains. Two parallel merger references to the MMC in
1996 are good examples: Severn Trent/South West Water and Wessex Water/South West
Water. Both relied on extensive empirical analysis of expected efficiency gains with
several consultant studies being submitted to the MMC.
Monopoly and Mergers Commission, 1995, South West Water Services Ltd: A report on the
67

determination of adjustment factors and infrastructure charges for South West Water Services Ltd.
38
CASE STUDY 7: SOUTH WEST WATER SERVICES LTD
In the South West Water Services Ltd (SWWS) case of 1995, the MMC was required to
67
determine the adjustment factor (K), and the standard amounts char ged for infrastructure as
calculated for SWWS from 1995 to 2005. The adjustment factor is the percentage by which the
weighted avera ge char ges for the suppl y of water and sewerage services is allowed to chan ge
relative to the retail price index. Infrastructure char ges are a way of recoverin g the costs of
making new water and sewera ge connections. SWWS’s adjustment factors and infrastructure
char ges were significantly greater than those calculated by the Director of Water Services.
The Office of Water Services (OFWAT) commissioned an anal ysis of the efficiency of the
various companies providing water and sewera ge services throughout En gland and Wales.
Several regressions were then undertaken for water and sewera ge services. These re gressions
were to explain some of the variation between different companies in the costs of carr yin g out
certain activities, in terms of ph ysical or demographic variables not directl y under mana gerial
control. Once the appropriate variables were accounted for, an y remaining variation was then
attributed to errors in the data, the fit of the model or the greater/lesser efficienc y of the
compan y . The results of these regressions were then used to rank the companies into ten
efficienc y bands in order of the difference between their actual operatin g expenditure and the
operatin g expenditure predicted b y the re gression equation.
OFWAT also commissioned Data Envelopment Analysis (DEA). Separate DEA runs were
carried out for water distribution and treatment. The sum of the expected costs for each
compan y from these two runs was then added to overall avera ge water business activities costs
and the result divided by actual distribution, treatment and business activities costs to give an

overall efficienc y ratio. For most of the companies the results of the DEA runs were similar to
those of the re gressions. Where they were si gnificantly better, that particular compan y was
raised an efficiency band. The same methods were then used to anal yse sewera ge service.
The MMC mentioned that the use of DEA in this context was relativel y novel and that it requires
more development. Presently it is used to test and confirm the results produced b y other, less
formal, analysis.
On the basis of this and other evidence, the MMC’s findings broadl y followed those of OFWAT
althou g h the MMC did allow a slightly lar ger adjustment factor to account for the substantial
investment pro gram bein g undertaken by SWWS to meet environmental standards. Generall y
however, the MMC felt that SWWS’s rate of return is well in excess of the cost of this capital and
that there is scope for reducing rates of return to the benefit of customers without hinderin g the
compan y’s ability to finance its investment pro gram.
Dynamic efficiency
It is worth pointing out that there is, in principle, a trade-off between allocative and dynamic efficiency:
68
costs might fall as a result of competition in technological innovation, yet this may actually lead to
increased market concentration. Prices in excess of marginal costs might also be necessary in order to
give firms a suitable return on their R & D effort, see von Weizsäcker, C.C., 1980, A Welfare analysis
of Barriers to Entry, Bell Journal of Economics , Vol. 11: 399-420.
Arrow, K. J., 1962, Economic Welfare and the Allocation of Resources for Invention, in NBER, The
69
Rate and Direction of Inventive Activity: Economic and Social Factors , Princeton University Press:
609-25
39

2.62 Dynamic efficiency is defined as the optimal trade-off between current consumption and
investment in technological progress. The intensity of competition may be expected to
affect the incentive to undertake research and development, since it will condition the
firm’s rewards from innovation. Early discussions of the relationship between product-68
market competition and innovation (for example, that of Schumpeter) held that the
driving force in the process were firms with ex-ante market power, rather than just the
prospect of market power. In this Schumpeterian view, as the product market becomes
more competitive, the payoff to innovation would become lower, and the incentive for
research and development would be blunted.
2.63 However this conjecture has been extensively challenged. More product market
competition could lead to stronger incentives to innovate, since a potential benefit of
innovation is escape from tough competition, by earning a monopoly right to an invention
protected by a patent. The more recent theoretical literature on the subject has treated
69
innovation as a patent race between firms, where the ‘prize’ for being first (and so being
able to appropriate the profits from the innovation) is the incentive spurring firms along.
These micro models of research and development investments actually suggest that
competitive pressures typically boost, rather than dampen, innovation. The optimal
innovation pace will accelerate under the threat that actual (or potential) competitors may
register the patent first.
2.67 These models are predicated on the existence of patents and other intellectual property
rights (IPRs) to provide the necessary reward function for research and development. If
these are missing, too narrowly defined or, are costly to enforce, then achieving the
correct trade-off between allocative and dynamic efficiency becomes an issue for antitrust
authorities. Similarly, there may be cases where IPRs are too widely defined or are used

to leverage legally protected market power into other markets where these do not have
any justification.
2.68 In the US the recognition of the importance of dynamic efficiency has led to a debate over
the best ways of incorporating these considerations into competition policy practice.
Various proposals have been put forward. The two most relevant approaches are (i) to
extend the time scale for considering potential entry within the traditional analytical
framework from the usual two years to four years and (ii) to separately identify so-called
innovation markets and analyse the nature of competition within them.
Gilbert, R.J., 1995, The 1995 Antitrust Guidelines for the Licensing of Intellectual Property: New
70
Signposts for the Intersection of Intellectual Property and Antitrust Laws, Paper given at the ABA
section of antitrust law spring meeting, Washington DC.
Temple Lang, J., 1996, Innovation markets and high technology industries, Paper presented at the
71
Fordham Corporate Law Institute.
Twenty-fifth Report on Competition Policy, European Commission, 1995
72
Monopolies and Mergers Commission, 1995, Video Games, and Monopolies and Mergers Commission,
73
1995, Telephone Number Portability.
Monopolies and Mergers Commission, 1995, The General Electricity Company plc and VSEL plc
74
40
2.69 An innovation market is a term capturing the research and development activity that
occurs, normally within a company, which provides the springboard for future generation

products and processes. ‘Future generation products’ are products that do not presently
70
exist but will result from current, or proposed, research and development. While it is
relatively easy to talk about these different markets conceptually, as one moves from the
first to the third market the uncertainties of analysis rapidly increase. These uncertainties
are associated both with data availability and one’s ability to analyse the interaction of
technology, competitive behaviour and market structure. This makes the application of
the innovation market concept difficult in practice and in the US, the debate about its
applicability is still ongoing.
2.70 In Europe, innovation markets have not been explicitly recognised. However, according
to John Temple Lang, in a number of cases involving high tech industries the
71
Commission has arrived ‘at much the same results by using the more traditional concept
of competition by two companies in research and development directed towards the same
goal.’ Cases mentioned by Temple Lang include: Upjohn-Pharmacia, Glaxo-Welcome,
Elf Atochem/Union Carbide, and Enichem Union Carbide. Temple Lang observes that
72
these decisions of the Commission show a willingness to let mergers, joint ventures or
other restrictive agreements go through.
2.71 In the UK, such issues have also played a role in recent cases involving video games and
telephone number portability where an incumbent was found to inhibit innovation by
73
imposing switching costs on entrants and their customers. The GEC/VSEL report also
74
canvassed these ideas with regard to the high tech issues in the defence industries.

41
Conclusions
2.72 In this chapter we have provided an overview of some of the key issues in antitrust with
the aim of showing how empirical economic analysis supports the application of
competition law in practice. Four main areas of antitrust have been covered:
market definition;
market structure analysis;
models of competition; and
efficiency defences.
2.73 This overview has demonstrated that in many cases, it is only by the use of appropriate
statistical and econometric techniques that the case be sensibly progressed and analysed.
This is especially important under a rule of reason approach. Quantification of economic
relationships in antitrust is not all about measuring demand-side substitutability for
market definition purposes. There are many tests that have been applied by antitrust
economists to determine, for example, the effect of a merger on prices, or to understand
the cost savings of a merger in the utility industries. What is equally clear from this
review is that the range of techniques is very wide, both in terms of technical and
economic sophistication. For example, the analysis of price trends ranges from simple
price comparisons across countries to the analysis of structural breaks or co-integration
analysis of time series. Similarly the analysis of demand can become very sophisticated
once the interdependence of a system of demand equations is analysed simultaneously.
2.74 In the following chapters, we describe those statistical and econometric techniques that
are most commonly used in antitrust analysis. The techniques are described in ascending
order of difficulty, from the simplest comparisons of prices, to the estimation of fully-fledged econometric models stemming directly from theoretical economic models.
42

( P
1
P
2
)
Technically, a statistical test is a statistic calculated from a sample in order to test a hypothesis about
75
the population from which the sample is drawn. When testing hypotheses concerning more than one
population, the test statistic is computed from more than one sample.
There are cases when the analyst needs to compare several samples of data. There are several tests
76
available for this task. An excellent exposition can be found in Chapter 12 of Rice, J.A., 1995,
Mathematical Statistics and Data Analysis, 2 Edition. Duxbury Press.
nd
Statistical packages such as SPSS will test the validity of this assumption, and if rejected, will present
77
an alternative, more robust test.
43
PART II: STATISTICAL TESTS OF PRICES
AND PRICE TRENDS
3 CROSS-SECTIONAL PRICE TESTS
3.1 Cross-sectional price tests use hypothesis testing to establish whether two sets of prices
are uniform, taking into account differences in costs or other external forces that could
affect prices. The two sets can pertain to either two geographic areas, or to two products,
or to two periods of time, and support the assessment of market power or the effect of

cartelisation. These tests are based on comparisons of cross-sectional data, and make use
of purely statistical tests, that is, no economic theory or behaviour is explicitly analysed.
75
3.2 The two sets of prices to be compared can be considered as random sampling from two
populations. The test for price uniformity then is a test of the null hypothesis that the
76
distributions of the two price populations are identical. The testing procedures vary
according to the sampling methodology adopted. We will first consider the case where
the two price samples are independent; then we will consider the case of paired samples.
To give an example, if we want to establish whether there is evidence that prices are
higher in one area than in another, due, for instance, to price fixing, then we collect price
samples from the two areas; these samples can be considered independent. If we suspect
that producers have fixed the price of a certain range of products at some point we can
compare two sets of prices before and after the alleged fixing has taken place; these
samples cannot be considered as being independent of each other and will be paired.
Description of the technique: case of independent samples
3.3 Consider first the case of two independent samples. Two sets of prices, P and P , are
1 2
drawn from two normal distributions with means µ and µ and identical variance .
1 2
77
The average prices in the two samples are unbiased estimates of the population means
and . The pooled sample variance S is an unbiased estimate of the population
2
t [( P

1
P
2
)/S (1/n 1/ m )] [ EQUATIO N 1]
( P
1
P
2
)
( P
1
P
2
)
See case study, page 30, for a more detailed exposition of the MMC enquiry.
78
44
variance. A test statistic of the hypothesis µ=µ when the sample sizes are n and m is
12
given by:
which is distributed as a Student’s t -statistic with degrees of freedom equal to the total
number of observations minus 2. If the means of the two populations are the same, the
estimated t has to be smaller than the tabulated critical values for those degrees of
freedom and a significance level of 10% or less. As a rule of thumb, estimated t values
of less than or equal to two supports the hypothesis that prices are uniform across two

populations.
Description of the technique: case of matched samples
3.4 We now consider the case of so-called paired samples. These samples are not
independent because they consist of matched observations, often ‘before’ and ‘after’
measurements on the same set of prices. The set of prices, P and P , are drawn from two
1 2
normal distributions with means µ and µ and variances and . The test of the
1 2 1 2
2 2
hypothesis that the two population means are the same is equivalent to a test of µ-µ =0.
12
The average prices in the two samples and are unbiased estimates of the
population means, and the pooled sample variances (S and S ) are unbiased estimates
1 2
2 2
of the population variances. Then the unbiased sample estimates of (µ -µ ) and of its
12
variance are D = and S = (S + S - 2S ) . A test statistic of the hypothesis
D 1 2 12
2 2 2
µ -µ =0 is given by:
12
t = [(D)/S (n)] [EQUATION 2]
D
which is distributed as a Student’s t -statistic with degrees of freedom equal to the total

number of pairs minus one. Once the test statistic has been computed, the testing
procedure proceeds as above.
3.5 Where possible, paired samples should be used. Since S < S the paired-sample test is
D
potentially a more powerful discriminator. So, for example, when analysing the supply
of recorded music, the MMC compared prices of paired samples of CDs across various
countries.
78
When data is not normal, alternative non-parametric testing procedures (like the Wilkoxon test statistic)
79
are available. See Rice, J.A. (1995), op. cit. , for a discussion.
45
Data and computational requirements
3.6 The implementation of this test is quite straightforward and does not require sophisticated
computer packages or computational skills, although a dedicated statistical package such
as SPSS or SAS will often be convenient. It should be noted, however, that at least 20
observations (as a rough guide) are needed in order to apply this test. A problem can
arise if the distribution of the price data is not normal but shows some degree of
skewness. In such a case, the theory of normal distributions cannot be applied. Then
79
it is advisable to transform the data before performing the t -test. The most popular
transformations to solve the problem of skewness are taking the logs or the squared roots.
3.7 With SPSS the user is prompted as to whether the test is used on paired or matched
samples. If using a spreadsheet the implementation of the relevant hypothesis test
involves creating a new variable equal to the difference between each pair of matched

prices. Then, the mean and standard deviation of the new variable are computed: the test
statistic is simply the ratio between these two values.
Interpretation
3.8 As with all techniques, the data must be able to inform the analysis and be capable of
rejecting a given hypothesis. In international price comparisons in particular, there are
complications arising from the different treatment of taxes (in the US, for example, local
sales taxes are added to the indicated price where European prices might include VAT)
and the use of an appropriate exchange rate. The actual rate of exchange between two
currencies does not make allowances for the different purchasing power that a unit of
each of the currencies possesses. This suggests the use of an exchange rate that reflects
the purchasing power parity (PPP) between the two currencies. While the use of PPP
adjusted exchange rates may in theory improve the usefulness of international price
comparisons they introduce a degree of uncertainty into the analysis as the calculation of
PPPs is not straightforward. Many a formula has been developed to calculate PPP rates,
and it is a matter of wide debate which one is the best, if any. Selection problems also
arise when using actual exchange rates; the choice between spot rates and averages over
the relevant period has to be informed by a deep understanding by the analyst of the data.
3.9 Provided the data is appropriate the testing procedures we have just described lead to
unequivocal conclusions about whether the means of the two distributions are statistically
the same. However, if the two means turn out to be different, but their difference is very
small, the analyst will have to use her/his judgement to decide how large a mean
difference is needed to, say, unequivocally establish that differences in product prices
across the two sets are economically significant. Also, the fact that the average prices
Supra, footnote 38.
80

Ashworth, M.H., J.A. Kay and T.A.E. Sharpe, 1982, Differentials Between Car Prices in the United
81
Kingdom and Belgium, IFS Report Series No 2, Institute for Fiscal Studies.
European Commission, 1995, Car Price Differentials in the European Union on 1 May 1995,
82
IP/95/768.
Monopoly and Mergers Commission, 1992, New Motor Cars. A Report on the Supply of New Motor
83
Cars Within the United Kingdom.
46
turn out to be different in two countries can be ascribed to many different causes, as the
MMC has found for instance in its investigations.
Application: international comparison of prices
3.10 In 1993 there was a press campaign about prices of CDs in the UK being up to 50%
higher than in the US. This case is more thoroughly discussed in the boxed case study on
page 30. The following is a summary of the events that took place.
3.11 After a highly charged public debate and a parliamentary investigation by the Trade and
Industry Committee of the House of Commons the competition authorities were asked
to investigate whether the record companies were preventing the parallel imports of CDs
to the disadvantage of UK consumers.
3.12 In the subsequent enquiry the MMC commissioned market research into relative prices
of a range of consumer goods in the US and the UK and received other evidence of the
distribution of prices of recorded music across different categories, types of outlets and
geographical areas. Note that in this case establishing a price difference was not
80

sufficient. The overall difference in prices across countries was also deemed relevant.
3.13 The UK tended to be cheaper than France, Germany, or Denmark but dearer than the
USA (after taking account of taxes). As may be expected, this was found to be sensitive
to the exchange rate used. The report noted the difficulties of interpretation when using
international price comparisons (see paragraph 7.105 of the report). However, this may
be because no clear conclusions of excessive pricing were demonstrated.
3.14 Another frequent complaint of discriminatory pricing which adversely affects UK
consumers concerns the pricing of motor cars in Europe. Large price differentials have
been observed between prices of cars sold in Belgium and the UK. The European
81
Commission regularly publishes a report on price differentials across the EU. Both the
82
MMC and the European Commission’s DGIV have undertaken major investigations into
car pricing. The MMC reported its findings in a 1992 report and the European
83
47
Commission recently fined the Volkswagen Group for distribution agreements and
practices that were held to be anti-competitive because they stopped consumers from
exploiting international price differentials.
3.15 In the motor cars enquiries of the MMC and the European Commission’s DGIV it was
necessary to undertake price surveys across different countries. These surveys had to deal
with the problem of price comparisons of models that are not sold to the same
specification and therefore differ in terms of their characteristics. To deal with these
problems of comparability, hedonic price indices had to be employed.
48

For an excellent exposition of this technique, see Chapter 4 in Berndt, E.R., 1991, The Practice of
84
Econometrics: Classic and Contemporary . Addison Wesley.
49
4 HEDONIC PRICE ANALYSIS
4.1 Hedonic price analysis is used to compare the price of products whose quality changes
over time or over product space, due to either technological or subjective factors, or other
services and optional equipment. Typical examples of products whose quality differs at
one point in time, or whose quality varies dramatically over time, are cars and computers.
In such circumstances, price analysis has to be adjusted to account properly for quality
differences or quality changes. Hedonic price analysis is a particular kind of regression
analysis that has been developed to purge prices of the effect of quality differences, so
that the pure price difference between ‘standardised’ products can be isolated. Purged
prices can then be used to carry out other price tests.
Description of the technique
84
4.2 We consider a product W with, say, three distinctive characteristics, (X,Y,Z); for example,
if W were cars, the characteristics could be horsepower, weight, luxury or basic, etc.
There are many brands of W, and each brand supplies more than one version of W. How
do we compare the prices of the different versions of W for sale, and how do we compare
the price of W over time, let us say over three years, if ( X,Y,Z) tend to change quickly.
The price of W can be expressed as:
log P(W )= + D + D + b X + b Y + b Z + u [EQUATION 3]
i 1 22 33 1i 2i 3i i
where the subscript i denotes one of the many brands or versions of W available for sale.

D is a dummy variable equal to one in period 2 and to zero in the other two periods.
2
Likewise, D is equal to one in period 3 and to zero in the other two periods. U is a
3 i
random error term with mean zero and constant variance. After data on price, and on
characteristics X, Y, and Z are gathered for many brands and versions of W for the three
periods, Equation 3 is estimated by OLS. Quality-adjusted price indices for the years 1,
2, and 3 can be obtained very simply by taking anti-logarithms of the estimated
coefficients of the dummy variables, a and a . Normalising the base year value to unity
2 3
in year 1, the hedonic price index will be 1 in period 1, exp( ) in period 2 and exp( )
2 3
in period 3. So, if the hedonic price index is 1 in period 1 and 0.87 in period 2 the
quality-adjusted average price of W has gone down by 13% between periods 1 and 2. If
the non-adjusted price of W had actually gone up substantially, prompting allegations of
price fixing or monopolistic abuse, hedonic price analysis would show that all the price
increase was due to changes in the quality mix of the product, not necessarily to anti-competitive behaviour by the producers or retailers.
The R measure the percentage of the variability in the dependent variable which is ‘explained’ by the
85 2
regression. An R of 0 means that the regression does not have any explanatory power, while with an
2
R of 1, 100% of the variability is explained by the regression (‘perfect fit’). It should be noted that
2
the R tends to be quite low when the estimation is carried out with cross-sectional data, and this should
2

be taken into account when interpreting the results.
Ashworth, M.H., J.A. Kay and T.A.E. Sharpe, 1982, op. cit.
86
50
Data and computational requirements
4.3 The implementation of this technique, for the above example, requires a combination of
time series and cross-sectional data on the product price and its characteristics. Data will
be needed on a range of prices over a number of years. It is advisable to have a large
enough number of observations for the results to be meaningful; the analysis should be
carried out with at least 20 to 30 observations plus as many observations as the number
of regressors in the estimated equation. The estimation of hedonic price regression can
be carried out using all econometric packages and those spreadsheets that have a built-in
routine to run multivariate regressions.
Interpretation
4.4 The computation of hedonic price indices requires a detailed knowledge of the demand
and supply of the product for which the index is calculated, as it is of crucial importance
to the unbiasedness of the results that no significant quality variable is omitted from the
regression. The quality of the results, as with all empirical analyses, depends crucially
on how well the model explains the variability of the dependent variable (here, prices).
This is measured by the R of the regression. Another problem that is often encountered
2 85
when dealing with cross-sectional data is that of heteroscedasticity, that is, non-constancy
of the error term variance. Although heteroscedasticity does not affect the unbiasedness
of the results, it invalidates the significance tests. Heteroscedasticity can be dealt with
using weighted rather than Ordinary Least Squares regression: the procedure is available

in most econometric packages.
Application: car price differentials
4.5 One of the most common tests of progress towards European Union market
integration is the trend towards price convergence. The question is whether the
prices charged in national markets for similar products differ significantly, and
if so, whether prices are converging. In the case of cars, models differ widely
across countries and their characteristics change substantially over time. Hence
this particular nature of the market makes the hedonic price analysis the best
methodology to carry out comparisons of prices between national markets.
4.6 For the UK, the first available study is a 1982 IFS report analysing car prices in
86
Monopoly and Merger Commission, 1992, op. cit.
87
Euromotor, 1991, Year 2000 and Beyond – The Car Marketing Challenge in Europe, Euromotor
88
Reports.
BEUC, 1989, EEC Study on Car Prices and Progress Towards 1992 , BEUC/10/89.
89
Flam, H. and H. Nordstrom, 1995, Why Do Pre-Tax Car Prices Differ So Much Across European
90
Countries?, CEPR Discussion Paper No 1181.
European Commission, 1995, op. cit.
91
51
the UK and Belgium. The report showed that the average price differential, at

39%, underestimated the quality-adjusted differential, which was 44%. Ten years
later the MMC compared car prices in the UK, Germany, France, the Netherlands
and Belgium. The study sought to control for differences in characteristics, but
87
not all specification differences were eliminated. Also, comparisons referred to
the year 1990, when the UK and the other countries were at very different phases
of the economic cycle. Surprisingly, the MMC report found no significant
differentials in general, and only significant differences in the prices of smaller
models. The conclusions reached by the MMC report were not substantiated by
further studies: a report by LAL found quality-adjusted differentials between the
88
UK and other countries ranging from 13.8 to 35% for four models. All of the UK
studies have used the hedonic price analysis. The variation in their results may
be due to the incorrect filtering of the effect of the varying characteristics, which
would lead to the results being somewhat biased.
4.7 At the European level, a report by the BEUC on behalf of the European
89
Commission’s DGXI estimated differentials of between 12% to 50% for UK cars
compared to Belgium, Germany, Greece, Spain, France, Ireland and Luxembourg
and the Netherlands. The results of the study are unreliable, as they were not
quality-adjusted. Flam and Nordstrom found price differences as high as 50%,
90
averaging at around 12%. Model comparisons carried out in 1995 by the
European Commission showed differentials in excess of 20%. Although cars
91

were compared by model, the specifications of each model tend to vary across
countries and we expect the estimated differentials to be biased.
Table 2 Estimated Differentials UK – Other Countries
Study Reference Countries Used in the Estimated Difference
Year Comparison
IFS 1981 B 44%
BEUC 1989 B, DK, G, GP, E, F, Irel, Lux, N 12-50%
MMC 1990 G, F, B, NL None Significant
LAL 1991 n.a. 13.8-35%
52
4.8 Hedonic price adjustment is therefore an important tool to deal with the prices of
differentiated products, but results are dependent on model specification of the
quality attributes.
53
5 PRICE CORRELATION
5.1 Price correlation is frequently used to determine whether two products or two geographic
areas are in the same economic market. It is also often used to measure the degree of
interdependence between prices and market shares or the concentration of sellers.
Correlation analysis does not allow the analyst to make an inference on the causation of
the relationship between the two variables being examined, but only on their degree of
association. As with other techniques, this provides one piece of evidence in a case.
Description of the technique
5.2 Correlation analysis is a statistical technique used to measure the degree of
interdependence between two variables. Two variables are said to be correlated if a
change in one variable is associated with a change in the other. This need not imply a

causal relationship between the two since the movement in both variables can be
influenced by other variables not included in the analysis. Correlation is positive when
the changes in the two variables have the same sign (that is, they both become larger or
smaller), and negative otherwise (that is, one becomes larger while the other becomes
smaller). Variables that are independent do not depend upon each other and will only be
correlated by chance (‘spurious correlation’).
5.3 The degree of association between two variables is sometimes measured by a statistical
parameter called covariance, which is dependent on the unit of measurement used. The
correlation coefficient between two variables, x and x , is, however, a standardised
1 2
measure of association between two variables:
= /
12 12
where is the covariance between x and x , and and are the square roots of the
12 1 2 1 2
variances of x and x respectively. The correlation coefficient is a number ranging
1 2
between -1 and 1. A coefficient of -1 implies perfect negative correlation, a coefficient
of 1 implies perfect positive correlation, and a coefficient of zero implies no correlation
(although it does not necessarily imply that they are independent).
Computing correlation coefficients with less than 15 observations is meaningless from a statistical point
92
of view.
Stigler, G.J. and Sherwin, R.A., 1985, op. cit.
93

See Waverman, L., 1991, Econometric Modeling of Energy Demand: When are Substitutes Good
94
Substitutes, in D. Hawdon (ed.), Energy Demand: Evidence and Expectations. Academic Press.
ibid , p 562.
95
Stigler G.J. and R.A. Sherwin, 1985, op. cit. , are aware of this problem, and discuss the possible
96
solutions.
54
Data and computational requirements
5.4 The implementation of price correlation tests requires time series of data which have at
least 20 observations. It is customary to compute the correlation coefficient using the
92
natural logarithm (log) of the price series, both due to efficiency reasons and because the
first log difference is an approximation of the growth rate. Equal changes in the log
represent equal percentage changes in price. Correlations should always be computed
both between levels and differences in the log prices. The computational requirements
to carry out the test are minimal; all statistical and econometric packages and most
spreadsheets have in-built routines to compute correlation coefficients. Packages such
as SPSS also provide results from significance tests on the estimated correlation
coefficients.
Interpretation
5.5 Stigler and Sherwin argued that given time series price data for two products or areas,
93
the correlation coefficients between their levels and first differences can be used to

determine whether these products or areas are in the same market. Prices can differ
94
because of transport and transaction costs or because of temporary demand or supply
shocks, so that the correlation coefficients will be less than 1 even in a perfect market.
It is however impossible to determine how big the correlation coefficient needs to be in
order for the analysis to conclude that two areas or products are in the same market.
Stigler and Sherwin ‘... believe that no unique criterion exists, quite aside from the fact
95
that the degree of correspondence of two price series will vary with the unit and duration
of time, the kind of price reported, and other factors’. In other words, even if the
estimated correlation coefficient is statistically different from zero, the economic
interpretation of the test is not straightforward. This is due to the lack of an obvious cut-off point where it can be decided whether the estimated degree of interdependence
between the prices can be taken as an indication of price uniformity.
5.6 A further problem with the use of the correlation coefficient is that if there are common
factors influencing prices this statistic can lead to erroneous conclusions. To see why,
96
consider the case of two producers using the same input, so that the prices of their
products are highly correlated with the input price. The analyst will find a high
Ibid.
97
Ibid.
98
55
correlation coefficient between the prices of the two products: that is because both their
prices are influenced by the input price, not because they are interdependent. Unless the

influence of common factors is purged, the use of the correlation coefficient as a test of
price interdependence leads to wrong conclusions, regardless of the size or the statistical
significance of the estimate. This is especially the case when the series cover periods of
high inflation and are therefore trended, or when the data is seasonal. The influence of
common factors can be purged by de-trending all the variables first or by using regression
analysis: the price is regressed on the influencing factor (input price, or a time trend, or
seasonal dummies, etc), and the residuals from that regression are taken to represent the
purged series.
5.7 A further problem with using correlation analysis lies in the fact that price responses for
some products, and in some areas, might be delayed. This would be the case when, for
instance, prices are negotiated at discrete time intervals which are not synchronised: the
analyst could find a very low correlation when in fact the series are highly correlated in
the long run. A visual inspection of the plotted price series can be of help in such cases.
Another instance when prices of products that are closely related have low correlation is
when the products are good substitutes and their supply is elastic.
Application: wholesale petrol markets in the US
5.8 Stifler and Sherwin have used correlation analysis to test whether the cities of
97
Chicago, Detroit and New Orleans are in the same market for wholesale petrol.
They correlate monthly fuel prices in the three cities during the period 1980-82
inclusive. Stigler and Sherwin eliminate the effect of serial correlation by taking
98
the first difference on every third price. They also remove the effect of common
factors, which is a very important step in the analysis of petrol prices, as
fluctuations in the price of crude oil tend to influence the price of refined petrol

quite heavily. The results are taken by the authors as indicating that the
correlation coefficients are very high: the coefficient between New Orleans and
Chicago is 0.792; that between New Orleans and Detroit is 0.967; and that
between Chicago and Detroit is 0.77. These results indicated to the authors, that
the three cities are in the same economic market. However, correlation analysis,
as the sole means of reducing market breadth, is no longer considered a
sufficiently robust approach.
56
The test was developed in Horowitz, I., 1981, Market Definition in Antitrust Analysis: A Regression
99
Approach, Southern Economic Journal, 48: 1-16.
Note that it is common practice to use the log form when running regressions involving rates of growth,
100
or when estimating demand functions. This has desirable properties for interpretation. However, it is
an empirical matter and whether the functional relationship is better estimated by levels or logs, can
be tested.
A time series is said to be stationary if the properties (that is, mean and variance) of its elements do not
101
depend on time. This requires the mean and variance to be constant over time. If the absolute value
of the auto-regressive parameter, , is equal or bigger than one, the series is non-stationary because its
variance becomes infinite over time.
57
6 SPEED OF ADJUSTMENT TEST
6.1 In this and the following two chapters we review quantitative techniques based on
dynamic models. Economic theories tell us what happens in equilibrium; for example,

economic theory predicts that if two homogeneous products are in the same market their
prices have to be the same, making due allowances for transportation costs. Reality is
however different. When shocks happen, there are adjustment lags before the system
returns to equilibrium. Dynamic models account for this. The speed of adjustment test
is a market definition test which is based on the idea that if two products are in the same
market the difference in their prices are stable over time, so that relative prices tend to
99
return to their equilibrium value after a shock. The variable of interest here is the price
difference, and the underlying dynamic assumption is that the current difference between
two prices is a fraction of the past difference observed in the last period. This technique
has been hardly ever used, however, as it is fundamentally flawed.
Description of the technique
6.2 The test is carried out by estimating a linear relationship between current and past price
differences:
100
(log P - log P ) = + (log P - log P ) + u [EQUATION 4]
1 2 1 2t-1 t
where 1 and 2 are the two products or regions; is a parameter measuring the speed of
adjustment to the equilibrium; and u is a random error term with mean 0 and constant
t
variance. Equation 4 represents a first order auto-regressive process as the current value
of the price difference is a function of its past value plus a random element with mean
zero and constant variance. is the long-run price difference. In order for this process
to be stationary the absolute value of has to be less than one. If is equal to zero in
101

Equation 4 adjustment is instantaneous. The larger the estimate of , the slower the
adjustment process.
See Stifler and Sherwin, op.cit. , p. 583 for a discussion.
102
Although we should expect this result, it sometimes turns out that is similar with different time
103
frames. This makes interpretation difficult, and suggests that the estimate is not robust.
For further discussion, see Werden, G.J. and L.M. Froeb, 1993, Correlation, Causality and All that
104
Jazz: The Inherent Shortcomings of Price Tests for Antitrust Markets, Review of Industrial
Organization, 8: 329-53, p. 341.
58
Data and computational requirements
6.3 To carry out this test, time series of price data is needed. The series are first transformed
into logs and the price difference variable is created. Using linear regression analysis
(OLS) this variable is regressed on a constant and on its lagged value. All statistical and
econometric packages and most spreadsheets have in-built routines to estimate OLS
regressions.
Interpretation
6.4 A simple t-statistic is used to test the hypothesis that is equal to zero; the t-statistic will
be automatically supplied with the regression output. If turns out to be bigger than
zero, the analyst is faced with the same problem mentioned in relation to the correlation
test, that is, to determine the critical value of in economic terms. Again, there is no
predetermined rule.
6.5 The speed of adjustment test has serious drawbacks. First of all, it is sensitive to the

frequency of observation: a slow adjustment with daily data might appear as
102
instantaneous with quarterly or annual data, for example, a 5% adjustment on a daily
basis implies adjustment within a month. Secondly, the above model assumes that the
103
u are serially independent. This would be violated if each price series itself follows a
t
first order auto-regressive process, the estimated measures the degree of dependence
of each price on its past value, not whether the price difference is constant or not. So, if
the price series are highly auto-correlated the estimated will be overestimated and the
analyst will draw the erroneous conclusion that the speed of adjustment is slow. Similar
104
problems arise if the price series are trended or follow a seasonal pattern. As it is quite
likely for price data to exhibit these characteristics, the use of this technique is not
advisable. Finally, this technique is overly restrictive because it imposes a particular
pattern to the dynamic adjustment process.
t
T
s
s t s
T
s
s t s
u P P P + + = ∑ ∑
=

−
=
−
1
2
1
1 1
γ β
Granger causality is a specific econometric concept which does not necessarily imply causality in the
105
normal sense of the word.
59
7 CAUSALITY TESTS
7.1 Rather than looking at the degree of interdependence between two prices, causality tests
seek to determine if there is causation from one series to the other, or if they mutually
determine each other. Although the definition of causality is not a straightforward matter,
one econometric testing procedure has gained considerable success in recent years:
Granger causality testing.
105
Description of the technique
7.2 The idea behind Granger causality is simple: consider two time series of price data, P
1
and P . P is said to Granger-cause P if prediction of the current value of P is enhanced
2 2 1 1
by using past values of P . This can be shown using Equation 5:

2
[EQUATION 5]
where u is a random error term with mean 0 and constant variance. The empirical
t
implementation of the test proceeds as follows. P in Equation 5 is regressed on its past
1
values and on past values of P . Although the choice of lags is arbitrary, in order to avoid
2
omitted variable bias it is customary to start with a high number of lags, choosing the
same number of lags for both price series, and then reduce the number of lags by
dropping those that are not significant. The analyst will have to keep in mind, however,
that the lagged price variables typically tend to be highly correlated. This creates
multicollinearity, resulting in very high standard errors, and therefore low t-ratios. The
choice of the number of lags has to be made bearing this problem in mind. If past levels
of P have no influence in determining the current value of P , then all the coefficients
2 1
on the lagged values of P in Equation 5 have to be equal to zero. This hypothesis is
2
tested by means of an F-test. The same method is followed to test whether P Granger-2
causes P .
1
Data and computational requirements
7.3 The computational requirements to perform causality testing are pretty much the same
as those for the speed of adjustment test. It is, however, advisable to have a substantially
longer time series of data. This is because for each additional lag, two extra right-hand

See Kennedy, P., 1993, A Guide to Econometrics, 3 Edition. Oxford:Basil Blackwell, page 68 for a
106 rd
discussion of this issue, and of this technique in general.
60
side variables are introduced into the equation and one additional observation is lost. For
instance, if there are five lags in the regression, five observations are lost and there are
ten regressors in the equation. A sample of about 50 observations would be the minimum
requirement. To perform the estimation and testing it is preferable to use econometric
packages rather than spreadsheets, because packages such as Microfit and PC-Give have
built-in routines to perform the F-test for causality.
Interpretation
7.4 Causality testing is an atheoretical method and does not require assumptions on the
dynamic properties of the price adjustment mechanism. As noted above, Granger
causality is not causality in the normal sense of the word. At best it may provide
circumstantial evidence. As with many statistical tests a negative result may be easier to
interpret then a positive one. Because of the nature of the possible spurious correlations,
it is important to purge the price data from the effect of common factors. This can be
done in two ways. First, the series can be purged independently by regressing each of
them on the vector of common factors and using the residuals from those regressions as
the purged variables. Secondly, the common factors can be added to the estimated
Equation 5. If the influence of common factors is not eliminated, the results will be
misinterpreted.
7.5 One major drawback associated with the use of this methodology is that the presence of
auto-correlation in the error term attached to Equation 5 invalidates the F-test. In time
series data, random shocks have effects that often persist for more than one time period;

also, owing to inertia, past actions often influence current actions. In these cases it is said
that the disturbances are auto-correlated, and their covariance is different from zero. The
presence of serial correlation in the error term does not affect the unbiasedness of the
estimated parameters, but invalidates the F-test. In order to solve this problem it is
customary, before running the regression, to transform the data series, so as to eliminate
the auto-correlation in the errors. There is, however, great debate among
econometricians as to how to transform the data and, more worryingly, the extent to
which the test results change as a consequence of the transformation used.
106
7.6 Finally, the results obtained from this exogeneity test are not always clear-cut, and there
is one problem that analysts often have to face. Suppose that the F-test results suggest
that the coefficients on past values of P in Equation 5 are simultaneously equal to zero
2
and that the t -tests on the individual coefficients show that one (or more) of them is
Slade, M.E., 1986, Exogeneity Tests of Market Boundaries Applied to Petroleum Products, The
107
Journal of Industrial Economics , 34: 291-302
Slade added a vector of common factors to each regression in order to eliminate the effect of common
108
factors. Such vector contained quadratic functions of time. The length of the lags to be added to each
equation was set at five, as the addition of five lags eliminated all traces of autocorrelation.
61
significantly different from zero. How to interpret this result? It is up to the analyst’s
experience and wisdom to decide whether the size of the impact of such variables is
economically significant.

Application: US petrol markets
7.7 Margaret Slade has used causality tests to determine whether the north-eastern,
107
south-eastern and western regions of the US are in the same market. Using
weekly data on wholesale prices for the year from March 1981 to February 1982
(that is, 52 observations), Slade chose two cities for each region, namely
Greensboro and Spartanburg for the South-East; Baltimore and Boston for the
North-East; and Los Angeles and San Francisco for the West Coast. Causality
tests were performed between each pair of cities, both within and across
regions. The tests for exogeneity between each pair of cities lead to the
108
following conclusions. The South-East represents one geographic market. There
is some evidence of interrelation between city pairs in the North-East and South-East, but it is weak and therefore inconclusive. The West Coast and the South-East form quite distinct markets, as might be expected.
62
The interested reader will find an excellent exposition of time series techniques in Charemza, W.W.,
109
and D.F. Deadman, 1997, New Directions in Econometric Practice, 2 edition. Edward Elgar.
nd
63
8 DYNAMIC PRICE REGRESSIONS AND
CO-INTEGRATION ANALYSIS
8.1 Dynamic price regressions and co-integration analysis techniques are used to determine
109
the extent of the market and to analyse the mechanisms by which price changes are

transmitted across products or geographic areas. Price adjustments across markets may
take place over a period of time rather than instantaneously, so that assessing whether
markets are integrated can depend critically on the length of the price adjustment. The
reactive adjustment process to changes in one price through a set of products or
geographic areas can be represented by a class of econometric models called error
correction models (ECM). ECM can be used to test whether two or more series of price
data exhibit stable long-term relationships and to estimate the time required for such
relationships to be re-established when a shock causes them to depart from equilibrium.
Although the analysis of prices alone is not sufficient to establish whether a market is not
an antitrust market, it is often the case that no other data but time series of prices are
available to the analyst. In that case, the techniques developed in this chapter should be
used, as they are the most correct ones from a statistical point of view.
Description of the technique
8.2 Consider the following general-lag model, where capital letters indicate natural
logarithms:
P = + P + P + P + u [EQUATION 6]
1t 0 02t 12t-1 1t-1 t
Subtracting P from both sides of the equation, and adding and subtracting P from
1t 1 2t-1
the right-hand side, after simple manipulations we obtain:
P = + P - (1-) {P - [( + ) / (1-)] P } + u [EQUATION 7]
1t 0 02t 1t-1 0 1 2t-1 t
where P = (P - P ); P = ( P - P ) and u is a random error term with mean 0 and
1t 1t 1t-1 2t 2t 2t-1 t
constant variance. is the long term difference between the two prices . Equation 7 is

0
called the Error Correction representation of Equation 6. The last term, (1-) {P - [(
1t-1 0
+ ) / (1- )] P }, is called the error-correction term because it reflects the current
1 2t-1
‘error’ in attaining long-run equilibrium: it measures the extent to which the two prices
have diverged. The parameter has to be less than one for the system to be stable, that
is, to ensure convergence towards the equilibrium. Then - (1-) is negative, which
implies that the deviation from the long-run equilibrium is corrected during the next
periods. If were equal to zero, the adjustment would be instantaneous. Another
Engle, R.F. and C.W.J. Granger, 1987, “Co-integration and Error Correction: Representation,
110
Estimation and Testing”, Econometrica, 55: 251-76.
Op. cit. page 251
111
Ibid.
112
Consider the simplest example of a I(1) series, a random walk. Let x =x +u where u is a stationary
113
t t-1 t
t
error term. We can see that x is I(1) as x =u which is I(0). Now let us consider a more general form
tt
x =ax +u . If the absolute value of a is equal to 1 then x is I(1), that is, non-stationary. If the
t t-1 t t

absolute value of a is less than 1 then x is I(0), that is, stationary. Formal tests for stationarity are tests
t
of the null hypothesis that a=1, and so the name unit root test. There is a wide variety of unit root tests
64
advantage of using Equation 7 rather than 6 is that by regressing P on P and the
1t 2t
levels we have less multicollinearity, and therefore more precise estimates.
8.3 Error correction models are a powerful tool in econometrics, as they allow the estimation
of equilibrium relationships using time series of data that are non-stationary. Generally
speaking, a stationary series has a mean to which it tends to return, while non-stationary
series tend to wander widely; also, a stationary series always has a finite variance (that
is, shocks only have transitory effects) and its autocorrelations tend to die out as the
interval over which they are measured widens. These differences suggest that when
plotting the data series against time, a stationary series will cut the horizontal axis many
times, while a non-stationary series will not. Econometricians have discovered that many
time series of economic data are non-stationary, more precisely that they are integrated
of order 1. A series is said to be integrated of order 1 if it can be made stationary by
taking its first difference. Two non-stationary time series are said to be co-integrated if
they have a linear combination that is stationary. Engle and Granger have supplied
110
many examples of non-stationary series that might have stationary linear combinations.
Among them, they cited the prices of ‘close substitutes in the same market’. Engle and
111
Granger also showed that integrated series whose relationship can be expressed in the
112

form of an ECM are co-integrated. So, rather than having to estimate statistical models
using differenced data, and losing valuable economic information in the process, the
problem of non-stationarity can be solved by estimating an ECM, from which we can
estimate directly, the speed of adjustment of price movements to their equilibrium
relationship after a shock has taken place. That is, we can use price levels that contain
more information than price differences to measure the reactive adjustment of prices
between regions.
Data and computational requirements
8.4 Although the empirical implementation of the convergence test in Equation 7 does not
appear difficult as it involves running an OLS regression and using a t -test for the null
hypothesis that is equal to zero, the situation can become complicated. This happens
if the estimated is positive or greater than one in absolute value. Then there is evidence
of non-stationarity and new solutions need to be found. The correct way of proceeding
is as follows. First, the analyst has to test for stationarity in the two price series via a unit
root test. If, and only if, the test results show that the data is non-stationary, then the
113
available. The critical value for establishing whether the results of the test imply a unit root differ
however according to what kind of integrated process is assumed, that is, a random walk, or a random
walk with drift, or a random walk with drift and added time trend, etc. The setting up and interpretation
of these tests require an experienced practitioner.
If two I(1) variables are co-integrated, then the regression of one on the other produces I(0) residuals.
114
Most tests for co-integration are unit root tests applied to the residuals.
65
analysis requires testing whether they are co-integrated. Testing for co-integration implies

testing whether there exists a linear combination of the two series that is stationary.
114
If evidence of co-integration is found, then the conclusion can be drawn that the
relationship between price movements tends to equilibrium in the long run. So, if a
simple ECM representation cannot be found, co-integration analysis becomes more
sophisticated and needs to be carried out by experienced analysts. Moreover, if the
analysis involves more than two prices, it can only be performed using specialist
software. This technique requires the availability of long time series of data, with at least
50 observations.
Interpretation
8.5 There are some caveats that need to be carefully considered before drawing any
conclusions from Equation 7, even when the estimated has the correct value and sign.
First, it is advisable to account for the influence of common factors in much the same
way as when using causality tests or correlation analysis. Secondly, the lag structure of
the model may be more complex than in Equation 7. It is advisable to introduce more lags
and test for their significance before discarding them. Thirdly, if the error term is auto-correlated this invalidates the significance test. To test for auto-correlation, the residuals
from Equation 7 are regressed on their lagged values and on the regressors of Equation
7. An F -test is then used to test the joint significance of the coefficients of the lagged
residuals.
8.6 The estimated speed of adjustment in Equation 7 might be too slow to make any
economic sense. This problem is even more severe when co-integration tests are used to
determine convergence. This is because co-integration is a long-run concept, and a co-integrating relationship will be found even when one price changes and it takes several
years for the other price(s) to adjust.
8.7 All techniques based on the analysis of prices alone, including co-integration techniques,

are very useful to define economic markets, but they should be used with care when
establishing relevant antitrust markets. The fact that prices in one area are found to
affect prices in another area is not sufficient proof of the existence of a wider antitrust
market. What needs to be determined in defining an antitrust market is whether two areas
that are in the same market at historical prices would still be in the same market if the
producers in one area would increase their price by some significant and non-transitory
amount. This question cannot be answered by looking at price movements alone.
Monopolies and Mergers Commission, 1991, Soluble Coffee, A Report on the Supply of Soluble coffee
115
for Retail Sale in the UK.
Similar studies were undertaken in the course of the MMC’s investigation into the supply of petrol in
116
1989 (Monopoly and Mergers Commission, 1989, The Supply of Petrol). One study was undertaken,
by the Department of Energy and the other by economic consultants on behalf of the Petrol Retailers’
Association (PRA). The Department of Energy study examined the relationship between UK retail
petrol prices and spot petrol prices in the Rotterdam market. It found that pump prices adjusted to spot
prices, over the long run, in similar ways across the six markets investigated (Belgium, France, West
Germany, Italy, Netherlands and the United Kingdom) . There was also evidence that the UK prices
were more responsive than elsewhere. The study also found that pump prices in all six countries
followed movements in spot prices with a short lag.
The study on behalf of the RPA looked at the relationship between crude oil prices and retail petrol
prices in the UK. This study found that retail prices rose following a rise in crude prices in the period
1977 to 1984 but did not experience an equivalent fall when crude prices dropped during 1985 to 1988.
The consultants also looked at the relationship between retail prices and the Rotterdam price for the
same two periods. They concluded that margins between crude, Rotterdam petrol and UK retail prices

had widened since 1985.
66
Application: the supply of soluble coffee
8.8 In 1990 the MMC was asked to investigate and report on the sale of soluble coffee in
115
the UK retail market. The Director General of Fair Trading was concerned that The
Nestle Company Ltd (Nestle) was in a dominant position, given that it supplied 48% of
the volume and 56% of the value of soluble coffee for retail sale in the UK. Nestle’s
profitability was also found to be higher than the majority of other firms in the industry.
The MMC confirmed that a scale monopoly existed with respect to Nestle (whose main
brand is Nescafe) but did not find any behaviour that operated against the public interest.
8.9 Of particular interest to the Commission was the slow adjustment of soluble coffee prices
to changes in the prices of coffee beans which, just prior to the time of the enquiry, had
experienced major fluctuations. This can be seen in the graph overleaf. Nescafe was
particularly slow to adjust to these price changes. Nestle claimed that several factors
influenced their decision whether or not to transmit the frequent changes in green coffee
bean prices to consumers. First, the level of price volatility would be confusing to the
customer and be difficult for the trade as a whole to manage. Secondly, in order to
maintain consumer confidence Nestle avoided sharp price changes by smoothing out
price increases. The MMC considered the following two studies of the price transmission
mechanism that applied quantitative techniques.
116
67

Figure 1: The Nescafe Wholesale List Price and the Green Bean Price Lagged
8.10 An internal study by the Ministry of Agriculture, Fisheries and Food (MA FF) comparing
the prices of instant and ground coffee with changes in green coffee bean prices between
1979 and 1989 was based on quarterly data from the National Food Survey. MAFF
analysed the correlation of retail prices of ground and instant coffee with the level of the
raw bean equivalent price based on the sub-group indices of the Producer Price Index.
The results from this analysis showed that a closer relationship between ground coffee
prices and raw bean prices than between soluble coffee prices and raw bean prices. The
correlation became stronger if the price of ground coffee was lagged two quarters, while
the instant coffee price was best correlated after one quarter. Furthermore the study
found that, on average, both instant and ground coffee prices respond more to raw bean
price rises than price falls.
8.11 GFL, the second largest supplier of soluble coffee in the UK market, submitted a study
undertaken by economic consultants which analysed the relationship between input and
output prices of soluble coffee. The analysis focused particularly on how the price
changes in the green coffee bean market fed through to retail prices and the extent to
which this transmission explained changes in retail coffee prices. The econometric
estimation showed that an increase in the cost of beans for delivery led to an almost exact
Langenfeld, J.L. and G.C. Watkins, 1998, Geographic Oil Product Market Test: An Application Using
117
Pricing Data, Mimeo: LECG Inc.
68
increase in retail selling prices. Furthermore, estimations of the relationship between
green coffee bean prices and wholesale realisations (1981-90) found that these prices also

moved closely together. Over 50% of the change in the purchase cost of beans fed
through to wholesale realisations within three months, and 75% of any change in
wholesale realisations were transmitted to retail prices in the same quarter. When testing
for asymmetry in the relationship between green bean and output prices for periods of
green bean price rises against price falls, the consultants found no asymmetry – both
increases and decreases were reflected in output prices to a similar extent and within
similar time periods. The price of Maxwell House (GFL’s leading brand) was found
largely to follow movements in the price of Nescafe.
Application: petrol markets in Colorado
8.12 Langenfield and Watkins use co-integration analysis to test whether petrol
117
prices in Denver are linked with those in the neighbouring towns of Tulsa, Kansas
City, Cheyenne and Billings. They use weekly price series for the period from
January 1992 to July 1997 inclusive, purged of the common effect of the price of
crude oil. They find that Denver petrol prices have an equilibrium relationship
with those in Tulsa, Kansas City, Cheyenne and Billings, although the
relationship with Billing is somewhat weaker. The evidence therefore shows that
these five towns are part of the same market for wholesale petrol.
See Carlton, D.W. and J.M. Perloff, 1994, Modern Industrial Organization, New York: Harper Collins,
118
for an excellent exposition of the theory of residual demand.
69
PART III: DEMAND ANALYSIS
9 RESIDUAL DEMAND ANALYSIS
9.1 The residual demand facing a firm or a group of firms is the demand function specifying

the level of sales made by the firm or group as a function of the price they charge. The
118
estimation of the residual demand allows the analyst to understand the competitive
behaviour of a firm or group of firms, by accounting for supply substitution effects. In
the discussion below, the term ‘firm’ is used, but it can be substituted with ‘a group of
firms’ without loss of generality.
9.2 A firm operating in a competitive environment does not have the power to raise the price
above the competitive level. Let us define own-price elasticity as the percentage decrease
in any product’s demand due to a percentage increase in its price given that the prices of
other products remain unchanged. Accordingly, the own-price elasticity will always be
negative, although it is often discussed in terms of the absolute value. Any segment of
a demand curve is said to be elastic if, when the price rises by x% the quantity demanded
decreases by more than x%. This corresponds to an absolute value of the elasticity larger
than one. A firm operating in a perfectly competitive market faces an infinitely elastic
residual demand curve. This is because if the firm raises the price of its product even
slightly, it will lose all its customers to the competition. The fewer the competitive
constraints from other products or firms, the less elastic the residual demand curve faced
by the firm. What this implies is that, by reducing the quantity it supplies, the firm could
cause a long-lasting price increase. So, the elasticity of the residual demand curve
conveys invaluable information on the competitive situation of a firm. In general, the
higher the elasticity, the lower is the potential power of the firm to force a significant and
non-transitory price increase in the market for its product.
9.3 Formally, the residual demand faced by any firm is that part of the total demand which
is not met by the other firms in the industry:
D ( p) = D ( p) - S ( p) [EQUATION 8]

r o
where D ( p) is the residual demand; D ( p) is total demand and S ( p) is the supply of the
r o
Carlton and Perloff (1994 p102) calculate the elasticity of residual demand facing a firm operating in
119
a market with increasing numbers of firms. Assuming that the elasticity of supply of firms is zero, they
present three scenarios. In the first, the total demand is inelastic (elasticity = 0.5) the elasticity of
residual demand varies between –5 (with no firms in the market) and –500 (with 1,000 firms). When
the elasticity of total demand is unitary, that of the residual demand rests between –10 (n=10) and
–1000 (n=1000). Finally, with a moderately elastic total elasticity of –5, the effect of residual demand
varies from –50 (n=10) to –5000 (n=1000). To show that the elasticity of residual demand depends
crucially on the number of competitors, Carlton and Perloff, 1994, p.103, compute it for US
agricultural markets where the elasticity of supply is 0. The demand for many crops is fairly inelastic
but farmer numbers are high. For instance, the elasticity of demand for apples is –0.21 but with 41187
farmers in the market each farm faces an elasticity of –8,649. The sweet corn market discussed has
unitary elasticity (-1.06), but with 29,260 producers each farmer has an elasticity of –31,353! What
this implies is that if a single farmer increases its price by one thousandth of one percent, his demand
would fall by 31%. This is evidence enough to show that farmers are price-takers.
Werden, G.J. and L.M. Froeb, 1993, op. cit.
120
A model to analyse residual demand in markets with differentiated products was developed in Baker,
121
J.B. and T.F. Bresnahan, 1985, The Gains from Mergers or Collusion in Product Differentiated
Industries, Journal of Industrial Economics , 35: 427-44.
70

other firms in the industry; all three are a function of own and competitors’ prices, p.
Equation 8 shows that the residual demand also depends on the supply response of the
other firms. As with demand, supply is said to be elastic when a price increase of x %
causes an increase in supply of more than x%. If there are n identical firms in the market,
the demand elasticity for any of the n firms is given by:
= n- ( n-1) <0 ; <0; >0 [EQUATION 9]
r o r
where is the price elasticity of residual demand, is the elasticity of total demand for
r
the (homogeneous) product, and
is the supply elasticity of the other firms in the
0
industry. So, if n=1 the economic market is a monopoly, and the residual and total
demand elasticities coincide. The larger n, the larger in absolute value will be even if
r
and are small, in simple economic models.
o
119
9.4 As pointed out by Werden and Froeb, in homogeneous product markets the elasticity
120
of the residual demand conveys all the information that is needed to define an antitrust
market, as defined through the hypothetical monopolist test. From an estimate of such
elasticity, the analyst can infer whether a firm or a group of firms could cause a
significant and long-lasting price increase. If that is the case, then the product sold by the
firms, or the geographic area in which they operate, constitutes an antitrust market.
Residual demand analysis is so powerful because it can be applied to any kind of market,
and with due modifications it can be widened to allow for the analysis of markets with
differentiated products. In what follows we discuss how residual demand analysis can
121
be implemented empirically.
Description of the technique
71
9.5 The objective of residual demand analysis, applied to antitrust problems, is to obtain an
unbiased estimate of the own-price elasticity of the residual demand curve. In general,
this can be done by using Instrumental Variables (IV) or other simultaneous equations
techniques or simply a ‘reduced form’ simple regression. The empirical test revolves
around finding an answer to the following question. Assume a group of firms have the
following residual demand function:
G = f ( P , X , Y) [EQUATION 10]
i i
where the subscript i identifies the group of firms, P is the price they charge, which
i
subsumes their cost structure, X is a vector of cost shift variable affecting the groups’
rivals, and Y is a demand shift variable affecting the behaviour of consumers (such as
income, for instance). The problem with the formulation above is that the quantity sold
and the price charged by group i are simultaneously determined. In order to obtain an
unbiased estimate of the residual demand the analyst needs to reformulate the problem
in the following way. The price charged by group i depends on the costs its members
face. Assume that there is a cost shift variable, Z, that only affects the costs of the firms
in the group, not their rivals’ costs. If the members of group i were able to transfer an

increase in the price of Z directly onto the customers, then they would form an antitrust
market. As G and P are simultaneously determined, and they are both a function of the
i i
cost shift variable Z, we can express the so-called reduced-form price and quantity
equations as:
G = G ( Z,X ,Y)
i
P = P( Z, X , Y) [EQUATION 11]
i
where ‘reduced-form equation’ means an equation in which all the right-hand side
variables are not influenced by the left-hand side variable. Technically speaking, a
reduced-form equation is one with no endogenous (simultaneous) variables on its right-hand side and its estimation yields unbiased parameter estimates. It is customary in the
literature to estimate the reduced-form price equation, rather than the quantity equation.
There are two main reasons for this. First, it can be shown that a test of the null
hypothesis that P / Z =0 is all that is needed to test for market power. If P / Z = 0
i i
the group of firms under investigation do not form an antitrust market because they
cannot pass on price increases unique to the group to their customers, due to competition
from other firms. Secondly, data on prices is often more precise than data on quantities,
and this affects the precision of the estimates.
A good example of this test can be found in Scheffman, D.T. and P.T. Spiller, 1987, op. cit. , Table 5,
122
p. 144.
72
9.6 To implement the test, the analyst must proceed as follows. First, data is gathered on the

price, quantity sold and cost shift variable for the group of firms under analysis; on cost
shift variables for rival firms in the industry; and on the demand shift variable. Secondly,
the price equation is estimated by instrumental variable techniques. This requires
regressing the quantity sold by the group of firms on ( Z, X , Y):
G = a + aZ + aY + a´X + u [EQUATION 12]
i 0 1 2 i
Then using the estimated parameters, the fitted values for G are calculated as:
i
= â +â Z +â Y + â´X [EQUATION 13]
i 01 2
Finally, the price equation is estimated as the last step of the instrumental variable (IV)
regression procedure:
P = b + b + bY + b´X + e
i [EQUATION 14] 0 1 i 2 i
This procedure provides the estimated price elasticity of the residual demand equation,
which is given by 1/ b . The estimate can be used to test for the null hypothesis that such
1
an elasticity be equal to any pre-specified value; the test statistic used will be a simple
122
t-test. If the analyst is not interested in the estimated price elasticity, but only in whether
this is perfectly elastic, that is, if costs limited to the group cannot be passed on because
of competition from others, a simpler procedure can be followed. This involves
estimating the reduced-form price equation:
P = c + c Z + cY + c´X + v
i 0 1 2 i
[EQUATION 15]
and testing, by means of a t -test, the null hypothesis that c =0.
1
Data and computational requirements
9.7 The implementation of this technique requires the use of a time series of data on prices,
quantities, cost and demand-shift variables. The analyst should make sure that there are
enough observations for the results to be meaningful: a minimum of about 50
observations could suffice, but it is strongly recommended to use longer series, especially
lagged values. The dependent variables also need to be added to the regression to model
price dynamics. The estimation of residual demand regressions can be carried out using
any econometric package. The most user-friendly packages, such as Microfit, contain in-built routines to automatically perform IV estimation.
Baker, J.B., 1987, Why Price Correlations Do Not Define Antitrust Markets: On Econometric
123
Algorithms for Market Definition, Working Paper No 149, Washington DC: Bureau of Economics
Federal Trade Commission.
73
Interpretation
9.8 The estimation of the elasticity of residual demand requires an in-depth knowledge of the
production process for the product or service under study. It is of crucial importance that
the cost shift variable for the group of firms under analysis be chosen correctly: if the
instrumental variable is poorly chosen, the estimated elasticity will be misleading. Also,
it is crucial for the unbiasedness of the result that no important cost or demand shift
variable be omitted from the analysis. One problem that is often encountered by analysts

wanting to use this technique is the lack of data on cost shifters; more precisely, it is often
very difficult to identify a variable that is a cost shifter only to the firm(s) of interest. In
the particular case when a merger is investigated between a home producer and a
producer abroad, the exchange rate can be used as a cost-shift variable. However, if there
are many competitors in the home and abroad markets the costs are different and the
estimation becomes extremely difficult.
9.9 Moreover, as pointed out by Baker, there are some technical problems associated with
123
the use of this technique that have to be carefully addressed and solved before
conclusions can be drawn from the results. These problems relate to aggregation across
the firms in the group under analysis; and to the dynamic specification of the price
regression (especially error auto-correlation).
9.10 In contrast to the empirical analysis of price movements, the analysis of residual demand
stems from theoretical economic models: the estimated own-price elasticity is directly
derived from an equilibrium model of supply, demand, and behavioural assumptions.
Based on behavioural assumptions, residual demand analysis allows the analyst to draw
conclusions on whether a group of firms could impose a non-competitive price for its
product. If the answer is positive, then the analyst concludes that those firms represent
an antitrust market. So, while price analysis is a useful tool in the definition of an
economic market, that is, a market within which the law of one price holds, and can offer
significant insights into antitrust markets, residual demand analysis is the technique that
has to be used to define an antitrust market directly.
9.11 The defin ition of an antitrust market is a fundamental issue in merger analysis, where the
ability of two merging firms to generate a significant and non-transitory price increase
is the first and foremost indication of a likely anti-competitive outcome from a merger.

However, it is important to notice that if the analysis reveals that the firm or group of
74
firms under scrutiny have the ability to exercise some degree of market power, it is the
analyst who has to determine whether such market power is large enough to generate
concern.
Application: National Express Group plc and Midland Main Line Ltd
9.12 In 1996 the MMC investigated the National Express Group plc (NEL) and Midland Main
Line Ltd (MML) case. In this instance the MMC was asked to examine the extent to
which competition between NEL’s coach services and MML’s rail services were affected
by the merger of these two companies. The quantitative evidence in the case centred
around cross-price and own-price elasticities.
9.13 One study looked at the cross-price elastic ities between coach and rail. The results of the
study showed that there were positive and significant cross-price elasticities for rail travel
with respect to coach prices. Another study examining the determinants of rail demand
found a smaller relationship between the extent of coach competition and demand for rail
services. These results may, however, be explained by a more aggressive pricing policy
by rail companies in response to coach deregulation.
9.14 Several studies were also conducted on the own-price elasticities of rail. One study on
second class journeys between Nottingham and London found an own-price elasticity
of –1.48, implying that a 10 % reduction in rail fares would increase demand by 14.8 %.
The MMC commissioned its own study to analyse elasticities for leisure passengers on
this same route. Own-price elasticities were closer to zero than the above studies,
suggesting more inelastic demand for rail journeys into London. The demand for coach
travel was found to be more sensitive to price changes. The cross-price elasticities found
in the MMC-commissioned study indicate that there is some degree of substitution

between rail and coach travel, and so demand for rail travel is to some extent responsive
to coach fares.
9.15 The various parties to the merger also commissioned studies based on cross-price and
own-price elasticities. The results of these studies were different to those reached by the
MMC-commissioned study. Many criticisms centred on the routes that the MMC-commissioned study analysed, in particular the use of data from regional railways to draw
conclusions about routes that included London as their origin or destination. There was
also dispute about elasticities that included all travel, and not just leisure or business
travel. These are just some of the factors that will affect the results of elasticity studies.
75
9.16 The MMC, in deciding on the case, accepted that rail services provided stronger
competition to coach then coach services to rail. However, the MMC felt that the
evidence also suggested that coach services do provide a degree of competition to rail
services, and that joint ownership of rail and coach services dilutes this competition.
76
For residual demand analysis and survey techniques, see Chapter 9.
124
Harris, B.C. and J.J. Simons, 1989, Focusing Market Definition: How Much Substitution is Necessary?,
125
Research in Law and Economics, 12: 207-226.
Harris B.C. and J.J. Simons, 1989, op. cit. , page 211.
126
77
10 CRITICAL LOSS ANALYSIS
10.1 Critical loss analysis is a necessary complement to residual demand analysis and survey
techniques, as it supplies the critical value of the elasticity of residual demand to be

124
used in antitrust analysis.
10.2 Firms operating in markets where there is some degree of market power will experience
a loss in sales if they unilaterally raise the price for their product. This technique
estimates the ‘critical’ loss in sales that would render unprofitable a unilateral price
increase on behalf of a firm or group of firms. We can identify two effects on profits
resulting from a unilateral price increase. On the one hand, as the price goes up some
consumers switch to competitive or substitute products, and sales decline. On the other
hand, profits on those sales that are retained increase. Any price increase therefore is
only profitable if the second effect outweighs the first. Once the antitrust authorities have
determined the size of the price increase, the investigator proceeds to establish whether
such a price increase would, in fact, be profitable.
10.3 Critical loss analysis was developed by Harris and Simons who define the critical loss
125
‘for any given price increase, (as) the percentage loss in sales necessary to make the
specified price increase unprofitable.’ After having assessed the critical loss, it is
126
possible to determine whether it is likely to occur as a result of a merger or other
potentially anti-competitive agreement. If the results show that the actual loss in sales
caused by the price increase will be less than the critical loss, then that price increase
would be profitable and the investigation will proceed further.
Description of the technique
10.4 This technique relies on the use of simulation rather than econometric methods to assess
the critical loss. The empirical test is aimed at finding the answer to the following two
questions. (i) Assume that a firm raises its price by Y%, and loses some customers as a

result. What would be the loss in sales that would leave profits unchanged and so cause
the firm (or group of firms) to be indifferent between raising the price or not? Such loss
in sales represents a critical value because for any larger loss, it will be unprofitable to
increase the price; and for any smaller loss increasing the price will be profitable.
(ii) What would be the actual loss in sales that resulted from the price increase?
This is Equation 13 in Harris, B.C. and J.J. Simons, 1989, op. cit. The reader is referred to the original
127
article for the derivation of the formula.
An antitrust market is defined as that set of product or geographical area where a hypothetical
128
monopolist could impose a profitable ‘small but significant and non-transitory price increase’ (US DOJ
Merger Guidelines). Such price increase is often taken to be 5% (so Y=0.05).
78
10.5 Under the assumptions that before the price increase the market is competitive, and
therefore the price equals marginal cost; and that fixed and average variables costs remain
unchanged after the price increase, the critical loss in percentage terms is equal to:
Critical Loss = [Y/(Y + PCM)]*100 [EQUATION 16]
127
where Y is the proportional hypothesised price increase and PCM is the price–cost
128
margin, equal to [(Initial Price - Average Variable Cost)/ Initial Price ]. For example,
assuming that the initial price for the product of interest is 100 and that the average
variable cost is 60, the PCM is 0.4; if the hypothesised price increase is 5% (Y=0.05),
then the critical loss is 11.1%.
10.6 The second step in the analysis is the assessment of the actual loss in sales due to the

price increase. How many sales will be lost depends on the residual demand elasticity
facing the firm or group under investigation. To each critical loss corresponds a critical
elasticity, computed by dividing the critical loss by the assumed percentage increase in
price. For the above example, the critical elasticity is 2.2. If the estimated residual
elasticity is larger than this critical value, the actual loss will be larger than the critical
loss, and the price increase will be unprofitable. We have discussed the estimation of
residual demand elasticity in Chapter 9. This estimation is often difficult due to data
limitations. In such a case, proxies for residual elasticity can be obtained by using the
results from consumer surveys, described in Chapter 12, although this can be expensive
and time-consuming.
Data and computational requirements
10.7 The estimation of the critical loss requires amazingly little information. The only two
data points needed are the initial price and average variable cost, and these are very easily
obtainable. As for computational requirements, all that is needed is pen and paper, or a
pocket calculator. The estimation of the actual loss is much more difficult requiring
estimation of the residual demand elasticity as in Chapter 9, or survey data as in
Chapter 12.
Interpretation
10.8 Critical loss analysis provides a reliable rule upon which the profitability of price
increases can be assessed. It provides a much needed benchmark for decision making in
the definition of an antitrust market. This technique cannot be used on its own because,
79
while it provides a yardstick, it does not tell us anything about the actual loss in sales
which is likely to occur as a result of the hypothesised price increase.
10.9 The estimated critical loss is a function of the price increase and price-cost margin. As

shown in the table below, for a given price increase, the higher the price-cost margin, the
lower the critical loss. For a given price-cost margin, the higher the price increase, the
higher the critical loss. This sensitivity of the critical loss to the assumed price increase
makes it very important that the hypothesised price increase is correctly chosen.
Table 3 Critical Losses in Sales Necessary to Make a Price Increase Unprofitable
under Various Assumptions
Price-Cost Margin
Assumptions Price Increase Assumptions
5% 10% 15%
20% 20% 33% 43%
30% 14% 25% 33%
40% 11% 20% 27%
50% 9% 17% 23%
60% 8% 14% 20%
70% 7% 13% 18%
10.10 For instance, say that a newspaper has 100 customers to whom it sells one newspaper
each at $1, earns advertising revenues of $3 per customer and is earning a variable margin
(over variable costs) of $3 per customer (that is, its variable costs are $1 per subscriber).
If it raises price by $0.05 and loses only one customer, its profit gain is $0.05 * 99
(=$4.95) and its loss is $3 * 1 (=$3) and so this increase would be profitable. However,
if it loses two customers, its profit gain is now $0.05*98 (=$4.90) and its losses are now
$3*2 (=$6) and the price change is unprofitable. So, in this simple model, if the variable
margin were 75%, and the price increase were 5%, a loss of more than 1% of customers
would make the price increase non-profitable (assuming no impact on marginal costs
from the customer loss). By contrast, if the only revenue the newspaper received per

reader were $1 for the price of the newspaper and the variables margin still equalled 75%,
a 5% increase in price would require a 6% decline in subscribers to be unprofitable.
Table 3 shows the minimum customer loss required for a price increase to be unprofitable
for various assumptions on percentage price increases and variable margins (assuming
no impact on marginal cost). Table 3 considers two situations: (i) the impact on profits
without considering the impact on advertising revenues; and (ii) the impact on profits
So, each lost subscriber results in lost advertising revenues equal to the original advertising revenue
129
per subscriber. For example, if subscription prices are $1, we assume that advertising revenues per
subscriber equal $3 (consistent with the ratio of advertising to subscriber revenues). If subscription
prices increase to $1.05, we assume that advertising revenues per subscriber remain at $3. Each
customer who stops subscribing due to the price increase results in lost revenues of $1 for the
subscription and $3 for the advertising revenue and lower costs in the amount of the marginal cost of
producing a paper for that subscriber.
80
assuming that advertising revenue per subscriber is three times the original subscription
price and advertising revenue per subscriber does not change as a result of the price
increase.
129
10.11 There are two circumstances in which critical loss analysis requires adjustments. First,
the technique has to be modified if the firm(s) produce(s) more than one product and the
reduction in the sales of one product allows the firm(s) to produce and sell more of
another product. Then the computations have to take into account the increase in profits
generated by these extra sales. Secondly, adjustments are required if the firm(s) sell(s)
products that are production complements, so that the reduction in the sales of one

product will force the firm(s) to produce, and sell, less of the other product as well. Then
the computations have to take into account the decrease in profits stemming from the
additional loss in sales.
For the use of this variable see, for example, Jacquemin, A. and A. Sapir, 1988, International Trade and
130
Integration of the European Community: An Econometric Analysis, European Economic Review, 31:
1439-49.
81
11 IMPORT PENETRATION TESTS
11.1 How foreign competition is treated is an important issue in antitrust analysis. The main
question is whether foreign producers could thwart any attempt by domestic producers
to raise prices. If that were the case, domestic producers could not effectively exercise
market power. Import penetration tests may be used to assess whether imports are highly
sensitive to variations in domestic prices, or better, to relative domestic and foreign
prices. If imports are sensitive to domestic prices, and if there are no quotas or other
restrictive trade practices, supply substitution is high. Consequently, the likelihood that
a domestic firm or group of firms exercises market power is quite low.
Description of the technique
11.2 Formally, the sensitivity of imports to domestic prices is measured by the price elasticity
of imports. Much the same as with domestic supply, import supply is said to be elastic
if, when the domestic price rises by x% the quantity imported rises by more than x%. Of
course, a rise in domestic, relative to foreign, prices does not necessarily have to be
caused by domestic producers; domestic prices rise relative to foreign prices due to
appreciation in the exchange rate of the domestic currency. Import elasticities estimated
in the context of exchange rate fluctuations can then be used as proxies to analyse the

effect of a potential price increase by a set of domestic producers on foreign suppliers.
11.3 The responsiveness of imports to price changes is estimated by regression methods. The
logarithm of the quantity imported ( X ) is regressed upon a constant term ( ), the log of
t
the price of the product - or better, of the price relative to foreign prices, that is, the price
expressed in a common foreign currency ( P ), and the log of the importing country’s per-t
capita income (Y ). Often a variable to proxy world demand conditions (such as the
t
growth rate of consumption in OECD countries) is added to the regression ( d ), as
130
t
well as a time trend (t ) to pick up the effects of capacity and productivity growth:
X = + P + Y + d + t + u
t 1 t 2 t 3t 4 t
[EQUATION 17]
Where u is an error term with usual properties. The estimated coefficient on the price
t
variable measures the price elasticity of imports; if the estimated elasticity is higher than
one, then import demand is elastic and there is limited room to exercise market power by
the local producers.
See Chapter 8 for a discussion of co-integration.
131
82
Data and computational requirements
11.4 The estimation of the imports demand equation requires the use of a time series

of data on all the relevant variables; there should be at least 35 to data points to
estimate the simple equations described above, but longer series are strongly
recommended. Any econometric package can be used to run the regression. Data
on commodities imports, as on the other variables needed in the estimation, is
readily available from official statistical sources.
Interpretation
11.5 The problems arising from the estimation of imports equations are mainly econometric
in nature. The equation described above has no dynamic component. However, auto-correlation in the error term is a likely problem. Also, it would be advisable to test for
co-integration, and if evidence is found for the existence of a co-integrating
131
relationship, the equation should be modified accordingly.
11.6 One main problem with estimating import elasticity using single equation methods is that
of simultaneity bias: are we estimating the demand or the supply of imports? Can we
really distinguish between the two? This problem can be serious and can invalidate the
results. For this reason, it is preferable to estimate import elasticities within a well-defined model of supply and demand.
These techniques are discussed in Chapters 3 and 4 respectively.
132
The estimation of demand equations using survey techniques is discussed in Chapter 14.
133
83
12 SURVEY TECHNIQUES
12.1 There are many situations in which raw price, quantity or other data, both on a cross-sectional and time series basis, is not available. In this case techniques of the type
outlined so far cannot be applied. One solution to this predicament is to create an ad hoc
data set, from which the likely behaviour of consumers and market participants could be

inferred. As data on the whole population of consumers and/or producers is generally not
available, this is usually done through a survey, which can then be used to carry out
national or international price comparisons, using cross-sectional price tests and hedonic
price analysis; to estimate consumer demand functions; or to infer market definition.
132 133
In this chapter we discuss the use of surveys for direct inference on market definition.
Description of the technique
12.2 To carry out a survey, it is first necessary to consider what information is required for the
investigation being carried out, including some indication on the accuracy of the results.
This information will guide the analyst in the selection of the sample, which has to be
representative of the population the analyst wishes to investigate. Such a population
could either be that of the actual consumers of a product, or that of the actual rivals in the
production of such a product. The definition of the population under investigation is
crucial, especially in situations were products are differentiated.
12.3 Secondly, a questionnaire has to be devised in such a way as to minimise the likelihood
of obtaining biased responses. This should be piloted on a small sub-sample to identify
ambiguities and other problems with the draft questionnaire. Thirdly, the questionnaires
have to be mailed to the individuals in the samples, or interviews have to be conducted.
Fourthly, the data has to be transferred into files and cleaned. If individuals or companies
with certain characteristics have been over-sampled (for instance, consumers with higher
incomes, or larger firms), weights have to be calculated at this stage.
12.4 Finally, the answers must be counted, and frequency counts and other statistical methods
applied to make inference from the data. For instance, the proportion of customers that
will switch product for a given price increase can be computed, and the relative demand
elasticity calculated.

Shull, B., 1989, Provisional Markets Relevant Markets and Banking Markets: The Justice Department’s
134
Merger Guidelines in Wise County, Virginia, Antitrust Bulletin , 34: 411-428.
84
Data and computational requirements
12.5 Carrying out a survey can be a very expensive undertaking, and in general it should only
be done if no other appropriate technique is available. The sampling, questionnaire-devising and analysis phases all require the use of professional statisticians and it is best
to consult them as soon as the possibility of a survey becomes apparent. Biased results
are worse than useless since they can be seriously misleading. Generally speaking, the
sample size has to be large, if it is to be representative of the population. For example,
in the investigation of a merger between Virginia National Bank and the First State Bank
of Wise County, Virginia, a questionnaire was mailed to 750 households and over
134
1,400 companies in the County.
12.6 S urveys can also be informal in nature. In the US, expert economists will often interview
customers, for example, to determine their likelihood of switching in the face of a price
increase limited to products being considered for a hypothetical market definition. If
such data is accurate, then they would help an economist answer the key questions in
defining an antitrust market. However, one should be very careful in considering the
views of a small number of people in a sector as representative: informal surveys are not
statistically valid.
12.7 A representative survey usually results in a large dataset, which requires the use of a good
statistical package, such as SAS or SPSS for the handling phases.
Interpretation
12.8 Using survey data, of the kind described above, to define markets can be misleading, as

it elicits only information on what people say they did or would do, rather than what they
would actually do in response to economic incentives or competitive pressures. In other
words, the results depend heavily on the way the questions are phrased, and they are at
best hypothetical. Given the nature of the analysis, the questions asked are necessarily
of the kind ‘what would you do if...’. The answer to that question does not actually shed
light on what the individual will necessarily do when faced with the situation.
12.9 It is also very important to ask the right question. In the Wise County case, they asked
the question, ‘what would you have done if a bank in a specified town, or a bank in the
next town, would have offered a 1% lower interest rate on a loan?’ This question poses
two problems. First, the right question would have been about a response to a 1% price
increase by the local bank. This way, the respondent would have defined his geographic
See Shull, B., 1989, op. cit.
135
Langenfeld, J., 1998, The Triumph and Failure of the US Merger Guidelines in Litigation, The Global
136
Competition Review, December 1997 January 1998: 36-37.
85
market, rather than the questionnaire suggesting it. Secondly, one would expect that the
answer would be yes to a question about whether the person would go to the next town
to shop. So, the question allows the creation of a chain of substitution that would set too
large a geographic market.
135
Application: the Engelhard/Floridin merger
136
12.10 In the Engelhard case, the District Court for the Middle District of Georgia, US disagreed

with the US Department of Justice, who sought to block the acquisition of Floridin by
Engelhard. Such a merger would have reduced the number of competitors in the market
for the US gel clay (GQA) from three to two. The issue of whether the market for GQA
was the relevant antitrust market was hotly debated.
12.11 One of the DOJ’s expert witnesses interviewed many existing customers of Engelhard
and Floridin, asking whether they would switch for a 5 or 10% price increase in GQA.
In addition, a number of customers were questioned directly. In general, the customers
said that they would not switch to other products for a 5 to 10% price increase in GQA.
12.12 The Court explicitly disagreed with the DOJ and its’ experts use of the 5 to 10% price
increase test for determining whether customers would substitute other products in
sufficient numbers to make such a price increase unprofitable and, so, excluding other
products from the relevant product market definition.
12.13 The Court noted that GQA accounted for less than 10% of the total cost of the final
production, so that a 5 to 10% price increase would raise the final production cost by very
little. Moreover, changing GQA supplier is costly, as it requires product testing and
potential reformulation. So it is not surprising that some customers stated that they would
not switch from Engelhard GQA to Floridin’s. Therefore, a higher price increase test
would be necessary to establish the product market.
12.14 After considering all the evidence produced, the Court concluded that the evidence did
not support the claim that GQA was the relevant product market. The Court concluded
that there was insufficient evidence to define the market, and that the DOJ had therefore
failed to carry its burden of persuasion for an essential element of the case.
86
Bain, J.S., 1951, op. cit.
137

See Fairburn, J. and P. Geroski, 1993, The Empirical Analysis of Market Structure and Performance,
138
in Bishop, M. and J. Kay, eds., European Mergers and Merger Policy . Oxford: Oxford University
Press, pp. 217-238 for a discussion of the market power hypothesis.
Lerner, A., 1934, The Concept of Monopoly and the Measurement of Monopoly Power, Review of
139
Economic Studies, 1: 157-75.
87
PART IV: MODELS OF COMPETITION
13 PRICE-CONCENTRATION STUDIES
13.1 Frequently applied in merger cases in the UK, price-concentration studies are based on
the structure-conduct-performance paradigm developed by Bain. According to this
137
well known theory, market structure influences the performance of market participants
via their conduct. Market concentration is the most commonly used proxy for market
structure; and the so-called ‘market power hypothesis’ implies that concentration
138
affects market performance (that is, profit margins) via its effect on pricing. In merger
cases, the market power hypothesis translates into the following testable proposition. If
higher concentration is associated with higher prices/profits in the relevant market, then
a merger that has a significant impact on concentration in a particular market raises anti-competitive concerns.
Description of the technique
13.2 The theoretical underpinning of the structure-market-performance paradigm can be traced
to the Lerner index of monopoly power, that for any firm i can be written as:
139

[(P – MC ) / P] = [ + (1 – )s ] / [EQUATION 18]
i i ii dp
Where P represents the market price; MC the marginal cost; s the share of firm i in total
industry output; the (absolute) industry price elasticity of demand; and the
dp
conjectural variation term. The conjectural variation term is a measure of the percentage
change in output that firm i expects other firms in the industry to undertake in response
to a 1% change in its own output. If = 0, the firm expects no reaction on behalf of
other firms to an increase in its own output: the firm operates in a Cournot oligopoly. If
= 1, the firm expects its rivals to, say, decrease their output by 1% in response to a 1%
decrease in its own output; this implies that the other firms behave so as to make it
See Martin, S., 1993, Advanced Industrial Economics, Oxford: Blackwells, Chapters 16 and 17 for an
140
in-depth discussion of the issue.
Martin, S., 1993, op. cit. page 547
141
Usually the concentration measure enters the regression linearly. However, if the degree of collusion
142
is greater, the higher the market concentration, then the latter could influence prices in a non linear
fashion. This could result in insignificant estimates for the coefficient of the concentration measure,
and to the wrong inference being drawn. This problem can easily be solved by entering both the level
and the square of the concentration variable as regressors; or by the use of dummy variables for
different levels of concentration.
Bain, J.S., 1956, op. cit.
143

88
possible to restrict market output (thereby causing a price increase). Finally, if = - 1,
the firm expects its rivals to offset its, say, 1% output reduction by a 1% increase in their
own output.
13.3 If we assume that / and (1 – )/ in Equation 18 are parameters to be estimated,
idp idp
the empirical test of the structure-conduct-performance paradigm at the industry level
can be carried out by testing whether the price-cost margin increases with the degree of
concentration in the industry. At the firm level, price-cost margins depend on both
industry concentration and the firm’s market share. The degree of concentration is the
variable used to proxy market structure. The most common measures of concentration
are the k -firm concentration ratio, CRk , and the HHI. The CR k index measures the
proportion of the market sales accounted for by the largest k firms, where k is normally
taken as 4, 5, or 8, CR4, CR5, CR8. The HHI is the sum of the squared individual market
shares for all the firms in the industry.
13.4 Price-cost margins are defined in terms of marginal costs. Unfortunately, marginal costs
are not often observable, and various proxies have been used in the empirical literature
for the degree of profitability. Accounting measures of profits (the rate of return on
sales), the Tobin’s q (the ratio of the stock market value of a company to the replacement
cost of its assets), and the rate of return on equity holdings have all been used as proxies
for the price-cost margins. Martin shows ‘there is a one-to-one mapping between
140 141
price models and price-cost margin models …In principle, if one has a model of
profitability, one also has a model of price’ . So the market power hypothesis, that is, the
ability to impose prices that are above the competitive level, can be tested using either

prices or one of the above profitability measures as the dependent variable in a regression
model.
13.5 Price-concentration studies are carried out at either industry or firm level by running a
regression with price levels as the dependent variable, and a concentration measure and
other variables as regressors, usually all in levels. As market power in concentrated
142
industries cannot be exercised unless there are barriers to entry, such barriers have to
143
be accounted for in the price regressions. Product differentiation, economies of scale and
absolute cost advantages all represent barriers to entry. Product differentiation can be
Bain, J.S., 1956, op. cit.
144
89
proxied by using the advertising-to-sales ratio; while economies of scale can be proxied
by using an estimate of the minimum efficient scale of production. The level of imports,
or the imports-to-sales ratio, is also added as a regressor to account for the effect of
foreign competition on market power.
13.6 From the regression results the analyst learns the degree to which prices, or profits, are
dependent upon industry concentration. If the coefficient is high and significant, this can
be taken as an indication that any further increase in market concentration, due to a
merger for instance, would significantly increase market power and therefore the price
that consumers of the product have to pay.
Data and computational requirements
13.7 The data requirements for this technique depend on whether the study is carried out at
industry or firm level. Industry-level analyses require time series data, while firm-level

analyses utilise either cross-sectional or - preferably - panel data. For time series
analysis, a sufficiently long time series of data is necessary, and this can create problems
for some of the variables. For cross-sectional analysis, data on single firms within the
market of interest is required; a sample of around 40 firms should be sufficient - using
less is not advisable. Smaller samples of firms can be used if observations on each firm
are available for more than one time period, that is, if the data is in the form of a panel.
13.8 Time series and cross-sectional regressions can be carried out using most available
econometrics packages, while panel data analysis requires specialised software packages,
such as Limdep.
13.9 In the absence of information on the other variables, the correlation coefficient between
price and concentration can be considered, but such practice should be avoided whenever
possible, as omitting the effects of entry, foreign competition and/or product
differentiation would lead to biased estimates.
Interpretation
13.10 The empirical analysis of the relationship between price and concentration relies on the
assumption that marginal costs are constant: according to economic theory, in the
presence of market power the price will be raised relative to marginal costs; therefore the
analyst should look at the relationship between price and concentration, while holding
marginal costs constant. The regression of concentration on prices yields biased results
144
Geroski, P., 1982, Simultaneous Equation Models of the Structure-Performance Paradigm, European
145
Economic Review, 19: 145-58.
Demsetz, H., 1973, Industry Structure, Market Rivalry and Public Policy, Journal of Law and
146

Economics, 11: 55-65; and Demsetz, H., 1974, Two Systems of Belief about Monopoly, in
Goldschmid, H.J., H.M. Mann, and J.F. Weston, eds, Industrial Concentration: The New Learning,
Boston: Little Brown.
See Baker, J.B. and T.F. Bresnahan, 1992, Empirical Methods of Identifying and Measuring Market
147
Power, Antitrust Law Journal, 61: 3-16, for a discussion.
90
if marginal costs are not constant and correlated with concentration. This is a major
problem with the use of this technique, especially when industry rather than firm level
data is used.
13.11 The implementation of this technique relies on the assumption that prices are influenced
by concentration and by the other right hand side variables without influencing them in
turn. Technically speaking, the regressors are assumed to be exogenous. However, a
high price could result in new entry and more imports into the market, and ultimately lead
to lower concentration. Therefore, concentration, imports and entry could themselves be
influenced by price. In a detailed empirical investigation, however, Geroski found
145
supporting evidence only for the endogeneity of the trade variable. Imports or imports-to-sales ratio then should be instrumented; their lagged values can be used to get around the
problem.
13.12 The market power hypothesis has been criticised by the economists of the Chicago
school. Demsetz argued that if large firms are more efficient, then a positive
146
relationship between concentration and profitability will be due to higher efficiency, not
to the presence of market power. This argument is, however, only valid if the low-cost
firms operate at full capacity. In such a case, the high-cost firms will supply the market

with the difference between the market demand and the low-cost firms’ supply, and the
market price will be set at the high-cost firms’ level. Then the low-cost firms will earn
an efficiency rent. If the low-cost firms, however, have spare capacity and restrict their
output to keep prices artificially high so that high-cost firms will not be forced to exit the
market, then low-cost firms will earn an economic profit that reflects the exercise of
market power. This would be the typical case if there is collusion in the market.
13.13 Finally, this methodology has been criticised as it does not take into account the fact that
in a market with differentiated products, the existence of substitute products, that are
immediately outside the relevant market, could influence the pricing behaviour of the
firms in the market, again no matter how concentrated the market.
147
Monopoly and Mergers Commission, 1995, Service Corporation International and Plantsbrook Group
148
Plc.
91
Application: the SCI/Plantsbrook merger
13.14 In this case the MMC analysed the degree of competition in the funeral service
148
markets. The investigation was prompted by the proposed merger of Service Corporation
International (SCI) and Plantsbrook Group PLC (Plantsbrook). The Commission
concluded that the market for funeral directing services was local and relatively stable,
and that although there was price competition, there was no consensus as to the strength
of this competition. Several econometric studies were used to influence this conclusion.
13.15 An SCI-commissioned study undertook multiple regression analysis to explain
differences in funeral prices by differences in six chosen variables. Two of these variables

were designed to pick up the effects of local concentration – the level of concentration
and the number of different firms within the areas chosen. Major differences in the
quality of funerals were represented by dummy variables for coffin type, and for other
‘extras’ bought for the funeral. The two remaining variables were funeral costs and
average wages in the locality.
13.16 These regressions concluded that the only significant variable was the one relating to
‘extras’, and therefore, price was not sensitive to the number of competitors. These
results were essentially the same for funeral outlets outside London, and for those of the
London study. The conclusion of the SCI-commissioned study was that there was no
relationship between the price charged and the level of concentration regardless of how
the market was defined (from half a mile to three miles). The study also analysed the
relationship between the number of competitors and price increases, and again found no
relationship.
13.17 An MMC-commissioned study reviewed the dataset used in the regression analysis. This
study found several problems with the dataset and the model used. First, the measure of
concentration used did not provide a good proxy for competitive pressure as differences
between outlets were not considered (for example, larger outlets belonging to major
competitors as opposed to small, independent outlets). Secondly, nearly all the
explanatory power of the model came from the ‘extras’ and the variable for coffin types.
However, these could also be consequences of concentration rather than independent
determinants for price, that is, they could be endogenous to the model. Finally, standard
econometric testing of the model showed it was not robust in that it could not generate
reliable outcomes in terms of specified relationships. The MMC-commissioned study
could not, however, generate an alternative model claiming that the dataset available
made the development of a robust model impossible.

13.18 It seems that the MMC may have concluded that the gathered evidence meant either that
92
funeral markets were extremely localised or that there was no effective price competition
even where there were several competitors. This then led to the recommendation that
SCI divest itself of some funeral parlours where it appeared that the merger had created
a local monopoly. It is interesting to note that FTC economists did the same type of
statistical analysis in the US funeral homes mergers, and found that prices were higher
in markets with few competitors and in rural markets.
See Willig, R.D., 1991, Merger Analysis, Industrial Organisation Theory, and Merger Guidelines,
149
Brookings Papers: Microeconomics, pp. 281-332 for a discussion.
The cross-elasticity of demand between two goods, 1 and 2, is defined as the percentage change in the
150
demand for good 1 when the price of good 2 is raised by x %.
The logit model was developed in McFadden, D., 1973, Conditional Logit Analysis of Qualitative
151
Choice Behavior, in Zarembka, P. ,ed., Frontiers in Econometrics. New York: Academic Press. For
applications to antitrust issues, see the following. Froeb, L.M., G.J. Werden and T.J. Tardiff, 1993, The
Demsetz Postulate and the Effects of Mergers in Differentiated Products Industries, Economic Analysis
Group Discussion Paper 93-5 (August 24, 1993). Werden, G.J. and M.L. Froeb, 1994, op. cit. Willig
R.D., 1991, op. cit.
93
14 ANALYSIS OF DIFFERENTIATED PRODUCTS:
THE DIVERSION RATIO
14.1 Many markets are characterised by differentiated products, which are not perfect

substitutes for one another. In markets with differentiated products, prices are set to
balance the added revenue from marginal sales with the loss that would be incurred by
losing such sales due to a higher price. When producers of two close substitutes merge,
there is a strong incentive to raise unilaterally the price of at least one product above the
pre-merger level. This is because those sales of one product that would be lost due to
149
an increase in its price would be partly or totally recouped with increased sales of the
substitute product. Whether such a price increase is profitable depends crucially on
whether there are enough consumers for whom the two products represent their first and
second consumption choice: the closer substitutes the two products are, the higher is the
likelihood that a unilateral post-merger price increase would be profitable.
14.2 Antitrust authorities dealing with mergers in differentiated product markets need
information about the substitutability of the two products, both between each other and
with other products, in order to assess the likelihood of a price increase. This, and the
following, chapter review the quantitative techniques available to assess the price effect
of a merger in markets with differentiated products. The technique discussed in this
chapter, diversion analysis, allows the analyst to make inferences about sales diversion
between two competing products by using market share data only. This technique relies
on very restrictive assumptions, but it is easy to implement and uses readily available
data.
Description of the technique
14.3 Diversion analysis relies heavily upon the Independence of Irrelevant Alternatives
Assumption (IIAA), which implies that the cross-elasticities of demand between product
1 and all the other products are identical. If the IIAA holds, then the demand for a

150
given product can be analysed using the multinomial logit model, which is an
econometric model that allows the estimation of discrete demand models where
individuals choose one in a set of differentiated, alternative goods. The first step in
151
investigating the effects of a merger between sellers of differentiated goods, say 1 and 2,
Shapiro, C., 1995, Mergers with Differentiated Products, Address before the American Bar Association
152
and International Bar Association program, The Merger Review Process in the US and Abroad,
.Washington DC, November 9, 1995.
Ibid.
153
94
is to assess the proportion of the sales of Good 1 that would be lost to Good 2 following
a given price increase for Good 1. This can be done very simply by dividing the cross-elasticity of demand between Products 1 and 2 by the own-price elasticity of demand for
product 1. This ratio, defined the diversion ratio , can be immediately calculated if
152
estimates of own- and cross-elasticities are available. However, this is not always the
case, due to data and time limitations. A very useful property of the logit model is that
it allows one to express the diversion ratio in terms of market shares. If all the products
in the market are either ‘close’ or ‘distant’ substitutes for each other, then the diversion
ratio between Products 1 and 2 (DR ) is given by:
12
DR = (Market Share of Product 2) / (1- Market Share of Product 1) [EQUATION 19]
12

It is evident from the above formula that, all other factors being equal, the lower the
market share of Product 2, the lower the diversion ratio. Also, all other factors being
equal, the higher the share of Product 1, the higher the diversion ratio. These imply that
the diversion ratio will be higher when one of the merging partners is a dominant firm.
For example, if the market share of Product 2 is 20%, the diversion ratio will be 0.25 if
the market share of Product 1 is 20%, and 0.33 if its market share is 33%. If on the other
hand the market share of Product 2 is lower, say 10%, and that of Product 1 is again 20%,
then the diversion ratio is 0.12.
14.5 Having computed the diversion ratio, the analyst proceeds to estimate the likely price
increase resulting from the merger. Under the assumption that the elasticity of demand
is constant over the price range that includes the pre- and post-merger prices, the formula
to compute the post-merger profit-maximising price increase for Product 1 is:
153
Post Merger Price Increase = (mark-up × DR) / (1 – mark-up – DR) [EQUATION 20]
Where, under the assumption that the merger has no effects on costs, the variable mark-up is the pre-merger mark-up for Product 1: (price – incremental cost) / price.
Continuing with the example above, and assuming a mark-up of 40%, the resulting price
increases will be: 29% for a diversion ratio of 0.25; 49% for a diversion ratio of 0.33;
and 10% for a diversion ratio of 0.12.
See Hausman, J.J. and G.K. Leonard, 1997, Economic Analysis of Differentiated Products Mergers
154
Using Real World Data, George Mason Law Review, 5: 321-46.
The assumption that the price elasticity would go up with the price is quite a reasonable one. Let q be

155
the quantity demanded and p the price; the own price elasticity is then (q/ p)*(p/q). With a linear
demand, the slope coefficient, q/ p, is constant, and if p increases more than q decreases so does the
elasticity.
Diamond, P. and J.J. Hausman, 1994, Contingent Valuation: Is Some Number Better Than No
156
Number?, Journal of Economic Perspectives , 45.
95
Data and computational requirements
14.6 Diversion analysis is a simulation technique that requires the availability of only a few
data points; the market shares of the merging partners, and the price mark-up. All that
is required to compute the diversion ratio and the subsequent price increase is a pocket
calculator.
Interpretation
14.7 Because of its simplicity, diversion analysis provides a very straightforward way to
estimate the likely effects from mergers between producers of substitute products. It has,
however, been fiercely criticised. The problem with using this technique is that it is
154
based on the IIAA assumption which is often not realistic. The IIAA imposes too strong
a set of constraints on the cross-elasticities of demand. For example, if the price of a
certain model of luxury cars went up, we would expect the demand for the other luxury
models to go up, not the demand for, say, small hatchbacks. But the IIAA implies that

the demand for all other cars will go up, with the models that sell most, no matter what
their size, being the ones that receive the largest share of the diverted demand. This is
obviously an untenable assumption.
14.8 Another very strong assumption is the constancy of the own-price elasticity of demand.
If the own price elasticity for Product 1 rises as its price goes up, then the use of the
155
diversion ratio leads to an overestimate of the price increase. This problem is more
serious, the higher the values of the Mark-up and DR. If the demand for the product is
linear, the elasticity rises as the price rises, making the optimal post-merger price increase
smaller. With linear demand, an alternative formula should be used to compute the post-merger price increase: [(Mark-up×DR)/2(1-DR)] .
14.9 Due to the problems that arise with this technique, and reliance on restrictive assumptions
that cannot be tested when data is not available, we advise caution in the use of diversion
ratios. Diamond and Hausman make the very convincing argument that when data is
156
not available, it is better to make no inference than the wrong one. Whenever data is
available, it would be advisable to carry out a full fledged estimation of a demand model
and estimate the elasticities directly.
96
Hausman J.J., G.K. Leonard and J.D. Zona, 1994, Competitive Analysis with Differentiated Products,
157
Annales D’Economie et de Statistique, 34: 159-180.
Hausman J.J. and G.K. Leonard, 1997, op. cit.
158
The model was developed in Deacon, A. and J. Muellbauer, 1980, An Almost Ideal Demand System,
159

American Economic Review, 70: 313-326.
97
15 ANALYSIS OF DIFFERENTIATED PRODUCTS: ESTIMATION
OF DEMAND SYSTEMS
15.1 The diversion analysis described in the last chapter is often used when it is unfeasible to
estimate the matrix of cross-elasticities for a given product market, or when the IIAA
hypothesis is thought to hold. Two recent articles by Hausman, Leonard and Zona and
157
by Hausman and Leonard develop a methodology to compute the likely price increase
158
resulting from a proposed merger using econometric estimates of the matrix of market
elasticities. The econometric estimation is based on supermarket scanner data. As the
analysis is very technical, it should only be carried out by an expert practitioner. Once
the elasticities have been estimated, however, it is very simple to compute the diversion
ratio and then evaluate the price increase. This is a field of research that is developing
rapidly.
Description of the technique
15.2 The econometric analysis of demand for substitute products is based on Gorman’s multi-stage budgeting theory. According to this approach, there are three levels of demand for
a differentiated product, such as bread: (i) the ‘top’ level, at which the overall demand for
the product (that is, bread) is determined; (ii) the ‘middle’ level, at which the demand for
different types of the product (that is, white bread, wholemeal bread etc.) is determined;
and (iii) the ‘bottom’ level, at which the demand for each brand within a type is
determined. The estimation procedure starts at the bottom level, using an econometrics
model known as AIDS:
159

S = + log(y / P ) +

logp + [EQUATION 21]
int in int nt j=1…J ij jnt int
Where the subscript i denotes the brand; t denotes the time period; and n denotes the city
or area representing the sampling unit. S is the share of brand i in the total expenditure
in the type analysed; y is the overall expenditure for that type; P is a price index; and p
is the price for each brand in the segment. The intercept parameters, , measure the
effect of the brand and area; the parameters are brand-specific and measure the extent
to which the expenditure share of brand i in total expenditure for that type depends on the
total expenditure itself. Finally, the parameters measure own and cross price effects
(not elasticities as the dependent variable is not in logs). This system of demand
equations has the very useful characteristic of being quite unrestrictive as to price effects.
It allows one to estimate the whole matrix of price effects without making a priori
assumptions. The econometric estimates of the ‘bottom’ level, which have to be carried
See Chapter 9 on residual demand analysis for a discussion of endogeneity in demand analysis.
160
98
out as usual using instrumental variables due to the likely endogeneity of the
regressors, can then be used to construct price indexes for each of the m product types,
160
for each area n and time t , . Such indices are used as instruments for the different
mnt
types of the product in the estimation of the ‘medium’ level:

logq = + logY + log + [EQUATION 22]
mnt mn mnt m=1…M m mnt mnt
where q is the quantity demanded in the market, the subscript m identifying the different
types of product, and n and t are as defined above. Y denotes total expenditure on the
product under analysis. The intercept terms, , measure the effect of the type and area;
the parameters measure the effect of changes in total product expenditure on the
quantity demanded of each type of the product. Finally, the parameters measure the
own and cross price elasticities of product types, and can be used to estimate a price
index for the product as a whole, . Once the index has been constructed and suitably
deflated, the ‘top’ level equation can be estimated:
logG = + logYD + log +
Z + [EQUATION 23]
t 0 t t t t
where G is total demand for the product, YD is real disposable income, and Z is a vector
of variables affecting the demand for the product (these could be for instance
demographic variables).
15.3 Once the model has been fully estimated, the full set of unconditional elasticities of
demand for each brand in the market can be calculated. These figures will then be used
to estimate the likely unilateral price increases from the merger under investigation.
Assuming that marginal costs are identical pre- and post-merger, the percentage change
in price for the product produced by the merging firms is equal to:
Price Change = (P -P )/P = (1 – w ) / (1-w ) –1 [EQUATION 24]

10 0 0 1
where the superscripts 1 and 0 refer to post- and pre-merger respectively, P is the price
and w is the vector of price-cost mark-ups. The mark-ups have to be computed for the
pre- and post-merger periods, and w can be calculated using the following formula:
w = -(E) R [EQUATION 25]
-1
where E is the matrix of own- and cross-price elasticities for the product of interest,
multiplied by the revenue share for the product (that is, average retail price times the
quantity sold) and R is the vector of revenues.
99
Data and computational requirements
15.4 The data requirements for the analysis described above are demanding. Information is
needed on prices and quantities sold at three levels of aggregation. The potential
endogeneity of prices calls for the availability of appropriate instrumental variables.
Supermarket scanner data can be used to perform the estimation procedures. However,
computational requirements are such that estimation should only be carried out by expert
practitioners.
Interpretation
15.5 Unlike most techniques reviewed in this paper, the interpretation of the coefficients
obtained from the estimation of AIDS models is not straightforward. The coefficients of
the ‘bottom’ level demand equation do not represent elasticities but have to be
manipulated in order to obtain the elasticity matrix. Moreover, manipulations have to be
carried out in order to obtain unconditional elasticities, as the estimated ones are
conditional on the expenditure for a given product type, y .
nt

15.6 Difficulties notwithstanding, this technique is very robust and powerful, and the ready
availability of supermarket scanner data and excellent software should ensure that the
assessment of likely unilateral effects from mergers is carried out using the estimation of
demand system, rather than more mechanic - and often biased - techniques. However,
care needs to be taken in using retail prices to assess markets at stages before retailing,
say, manufacturing. If retail markets are not fully competitive, then retail prices may be
biased and invalid.
Application: the Kimberley-Clark/Scott merger case
15.7 In 1995, Kimberley-Clark (KC) announced the merger of their world-wide operations
with the Scott paper company. The two companies are among the largest world
producers of hygienic paper products, and a merger between them would have resulted
in the creation of the largest company in the world. Both the US DOJ and the European
Commission investigated the merger.
15.8 Jerry Hausman and Gregory Leonard consulted for Kimberley-Clark, and presented very
detailed evidence to the DOJ on the likely price-effects from the merger in the market for
bath tissues in the US. At the time of the merger, KC had just introduced a new product,
Kleenex Bath Tissue, in the ‘premium’ segment on the toilet tissue market. Scott
produced two different brands: Cottonelle, a premium brand, and ScotTissue, an
‘economy’ brand. The issue at hand in the merger case was whether KS and Scott could
Hausman J.J. and G.K. Leonard, 1997, op. cit.
161
Hausman J.J. and G.K. Leonard, 1997, op. cit.
162
Hausman J.J. and G.K. Leonard, 1997, op. cit.
163

100
profitably raise the price of their three products. Using supermarket scanner data from
five cities for the period from January 1992 to May 1995, Hausman and Leonard
161
presented evidence to the contrary.
15.9 The market for premium toilet paper was dominated by Charmin, a Procter & Gamble
brand, with a 31% share of the whole tissue market; the share for the second and third
brands, Northern and Angel Soft, were 12.4% and 8.8% respectively; Kleenex had a
share of 7.5% and Cottonelle of 6.7%. The economy brands were dominated by
ScotTissue, with a 16.7% share of the total market, followed by other brands, with 9.4%,
and private labels with 7.6%.
15.10 Hausman and Leonard estimated a demand system for toilet tissue. They found that
162
the own-price elasticity for Kleenex, Cottonelle and ScotTissue were –3.4, -4.5 and -2.9
respectively, implying sales reduction of 34%, 45% and 29% respectively in response
to a 10% increase in the own-price. The estimated cross-price elasticities were very low.
The largest one was that between Kleenex and Charmin: at 0.68, it implies that sales of
Kleenex would go up by 6.8% in response to a 10% increase in the price of Charmin. All
the other cross-elasticities were lower than that.
15.11 Examining the elasticity matrix for toilet tissue, the following conclusions could be
drawn. First, there was evidence of two separated market segments, the premium market
and the economy market. Secondly, the cross-elasticities were all different from each
other and asymmetric; that is, the elasticity between Kleenex and Charmin was different
than that between Kleenex and Cottonelle, and from that between Charmin and Kleenex.
This is hard evidence for the untenability of the IIAA assumption.
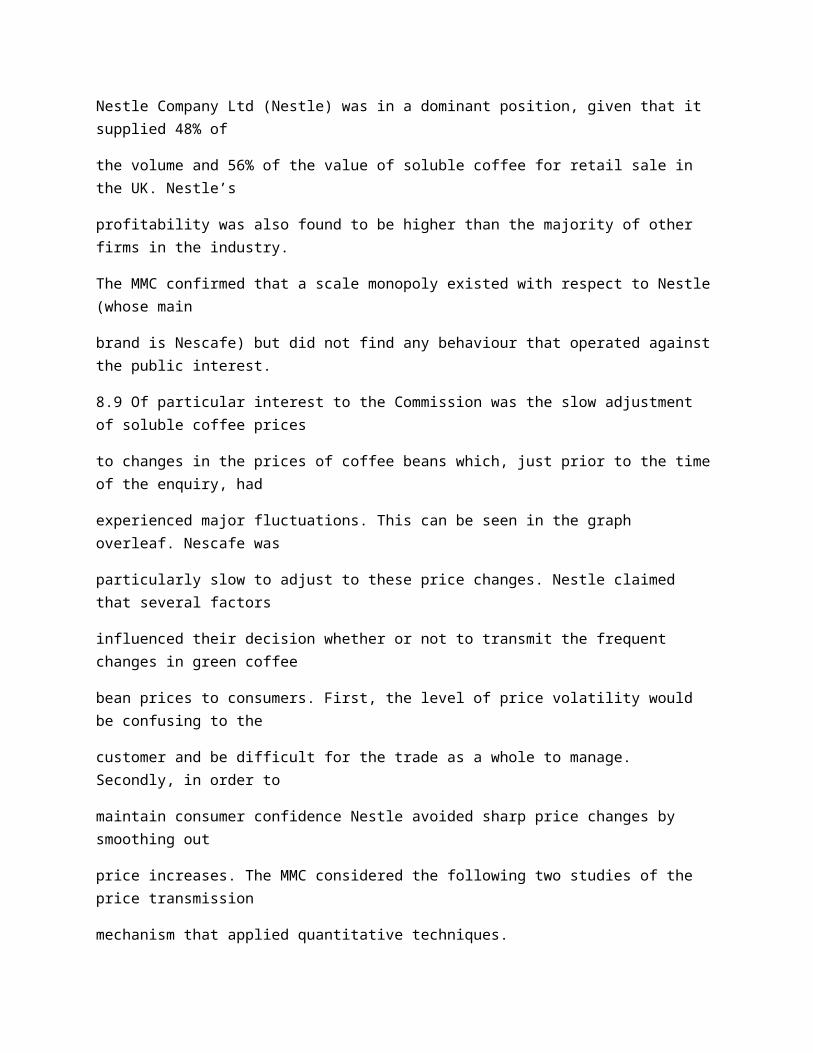
15.12 Using the estimated elasticities of demand, Hausman and Leonard then predicted the
163
price effects from a merger between Kimberley-Clark and Scott. Assuming no cost
efficiencies, the prices of Kleenex, Cottonelle, and ScotTissue would be raised by 2.4%,
1.4% and 1.2% respectively. These are very low values, and the merger was approved.
It is interesting to note that diversion analysis based on share data would predict much
larger price increases; for example, the simulated price increase for Kleenex would be
12.7%, more than five times as large.
Hausman J.J. and G.K. Leonard, 1997, op. cit.
164
101
15.13 As this example indicates, the use of diversion analysis to simulate price increases
resulting from mergers can lead to very biased results when the products in the market
are not perceived by consumers as equally substitutable. The margin of error is quite
large, and this can lead the authorities to reach the wrong conclusions.
15.14 For the econometric estimation of full demand systems, the data requirements are quite
large. Hausman and Leonard have used retailer scanner data in the form of a panel,
164
from which the responsiveness of brand sales to changes in own- and substitute prices
can be inferred. The estimation of demand systems using econometric analysis requires
specialised software, and specialised training in order to program the software and
interpret the results.
102
For an excellent survey of the economic literature on the subject, see McAfee, R.P. and J. McMillan,
165

1987, Auctions and Bidding, Journal of Economic Literature , 25: 699-738. There has been a host of
empirical academic papers on auctions; for a comprehensive survey, see Hendricks, J. and P. Paarsh,
1995, A Survey of Recent Empirical Work Concerning Auctions, Canadian Journal of Economics , 28:
403-26.
Porter R.H. and J.D. Zona, 1993, Detection of Bid Rigging in Procurement Auctions, Journal of
166
Political Economy, 101: 518-38.
103
16 BIDDING STUDIES
16.1 Custom-made or otherwise unusual products, and large orders of a product, are often
bought and sold by formal or informal bidding procedures. The range of products sold
in this manner is extensive and includes contracts for major infrastructure and capital
investment projects (for example, refineries/power plants) including their plant-specific
equipment (for example, gas turbines, pumps). These auctions are characterised by
informational asymmetries, as each bidder does not know what the competitors are
bidding.
165
16.2 This has serious implications for antitrust analysis. In circumstances where there are
repeated bids there is a strong incentive for some of the bidders to collude and form a
cartel. Among bidding studies, of particular importance are those aimed at detecting bid
rigging in order to stop or prevent the anti-competitive behaviour of a cartel of bidders.
Description of the technique when sufficient data is available
16.3 In order to detect bid rigging, the first step is to distinguish between bidders who are
suspected of forming a cartel and bidders who are not. If there is no bid rigging, the
determinants of the bidding price for the two groups will not be very different. The

empirical analysis then seeks to ascertain whether discrepancies can be identified. We
will discuss a methodology introduced by Porter and Zona.
166
16.4 The econometric analysis of bid offers is carried out by running regressions of the bid
price for the auctions to which at least two members of the alleged cartel have taken part:
Log (b ) = a + bX + u [EQUATION 26]
ij j ij ij
Where b is the price bid by bidder i in auction j; a is an auction-specific variable equal
ij j
to 1 for auction j and to zero for any other auction; X is a vector of variables affecting
firm i’s winning chances (like geographic proximity) or its costs; and u is a variable
ij
conveying the information that the firm has at each auction. u is a stochastic term with
ij
104
non-constant variance, as the variance varies with each auction. Due to this property of
the error variance, the model has to be estimated using Generalised Least Squares (GLS)
techniques. Estimation proceeds as follows:
Step 1 Equation 1 is estimated by Ordinary Least Squares, and the residuals
calculated.
Step 2 The mean residual among the bidders participating at each auction is
computed and each data point is divided by the appropriate mean
residual.
Step 3 The model is re-estimated.
Equation 1 has to be estimated over three samples: the whole sample; the sample

including the potential cartel bidders; and the sample of non-colluding bidders. If there
has been bid rigging, the price equation for the cartel will be significantly different from
that of the non-colluding bidders. A simple Chow test is performed at this point to assess
whether the two sets of parameters are the same. Define the whole sample as whole; the
cartel sample as 1; the non-cartel sample as 2; let n be the number of bidders in 1; m the
number of bidders in 2; k the number of regressors; and RSS the residual sum of squares
from the regression. Then:
[RSS – RSS – RSS ) / k] / [(RSS + RSS ) / (n – m – k)] [EQUATION 27]
whole 1 2 1 2
is distributed as a Fisher’s F with k and (n – m – k) degrees of freedom. If the computed
value is higher than the tabulated value, then there is evidence of bid rigging.
Data and computational requirements
16.5 The es timation of this technique requires data on successive bids for a number of bidders.
The GLS method described above can be performed by using a good econometric
package. The estimates can then be carried out quite easily, and the parameters, t-ratios
and other statistics will all be correct.
16.6 Data on costs, however, might be difficult to come by, and less sophisticated, but still
valid methods can be used to determine whether bid rigging has occurred. They will be
discussed below.
Porter, R.H.and J.D. Zona, 1993, op. cit. , page 518.
167
105
Description of the technique when sufficient data is not available
16.7 Using data on market shares for the alleged cartel bidders, the analyst will investigate
whether the distribution of market shares (as represented, say, by the numbers of bids

submitted) has remained constant over the period when the cartel was supposedly in
force. If the distribution has remained stable, this is an indication that the bidders might
have been colluding, because by keeping shares stable the cartel removes the incentive
for cheating.
16.8 An alternative methodology to test for the presence of a bidding cartel is by assessing
whether the distribution of cartel bids is more concentrated than that of non-cartel bids.
By using a simple test for the equality of means such as those described in Chapter 3, the
analyst will discover whether the ratio between the lowest and second lowest bid for the
cartel and non-cartel bidders is the same. If it is not, there is some evidence of bid
rigging.
Interpretation
16.9 Bid rigging is a serious problem. Porter and Zona report that ‘between 1982 and 1988
167
more than half of the criminal cases filed by the Antitrust Division of the Department of
Justice involved bid rigging or price fixing in auction markets…’. The techniques we
have discussed provide one formal and two informal tests to detect such behaviour.
16.10 One of the main problems associated with these techniques is that they rely heavily on
the distinction between cartel members and other bidders. It is therefore very important
that the samples are separated correctly. This requires that the analyst has an in-depth
knowledge of the industry under investigation, especially its history.
16.11 A further problem is that bids may be different because the members of the alleged cartel
are larger, more efficient firms, and therefore have lower costs. This allows them to bid
lower than the competition, but this is due to their efficiency, not their anti-competitive
behaviour. This suggests that costs should be looked at whenever possible when
investigating alleged anti-competitive behaviour.

106
Application: paving tenders in Suffolk and Nassau Counties,
New York
16.12 This case relates to procurement contracts, namely paving contracts awarded by the
Department of Transportation in Suffolk and Nassau counties, New York, between 1979
and 1985. Five firms were suspected of colluding, by designating a serious bidder for the
contract and how much it would bid. In 1984, one of these five firms was convicted of
bid ridding, and the other four listed as conspirators on a bid which resulted in a contract
to build a motorway on Long Island. The five firms were sued repeatedly in various other
instances. Using data on 75 auctions for paving contracts, in which there were 319 non-cartel bids and 157 cartel bids, and applying the GLS methodology, Porter and Zona
found convincing evidence that the bidding behaviour of cartel firms was different from
that of non-cartel firms, and that therefore there was evidence of bid rigging.
For a more exhaustive analysis of the subject, see Stillman, R., 1983, Examining Antitrust Policy
168
Towards Horizontal Mergers, Journal of Financial Economics, 11: 225-40; and Eckbo, B.E., 1983,
Horizontal Mergers and Collusion, Journal of Financial Economics , 11: 241-73.
107
PART V: OTHER TECHNIQUES AND
CONCLUSIONS
17 TIME SERIES EVENT STUDIES OF STOCK MARKETS’
REACTIONS TO NEWS
17.1 The use of financial analysis in competition policy is outside the terms of reference of
this project. For this reason, we provide here only a brief summary of the hypotheses
underlying the time series analysis of stock markets’ reactions to news.
17.2 Stock markets’ reactions to news can be a particularly valuable source of information that

may lead to inferences about the nature of a merger or a take-over. The rationale behind
the analysis of stock markets’ reactions is quite simple, and stems from financial theory.
The stock market is assumed to be efficient, so that asset prices reflect the true underlying
value of a company. When a merger between two companies takes place, there are two
possible outcomes in the product market. First, if market power increases substantially
168
after a merger, the product price will increase and so will profits for both the merger
partners and the other firms operating in the market, at least in the short run (that is, prior
to entry by new players). This implies that, on the assumption that the stock market is
efficient, both the merging firms and horizontal rival firms in the industry should earn
positive abnormal returns when the anti-competitive merger is announced. Also, when
steps are taken by the authorities to investigate the merger, negative abnormal returns
should be observed.
17.3 Secondly, if the merger generates cost efficiencies, then the merged firm will be more
profitable, than the sum of the pre-merger entities, all other factors being equal; such
higher profitability, however, will not extend to other firms in the industry. This implies
that the merging partners should gain positive abnormal returns around the date of the
merger announcement, and negative abnormal returns around the date when antitrust
investigations are announced. The situation for rival firms is, however, more complex.
If the market expects the cost efficiencies to be easily passed along to other players in the
industry, then rival firms should also earn positive abnormal results when the merger is
108
announced, and negative returns when legal proceedings are announced by the
authorities. Otherwise, negative abnormal returns can be expected for the rivals at the
time the merger is announced and positive returns when the investigation is announced.

17.4 Summarising, observing positive abnormal returns for the merging partners at the time
of the merger announcement does not allow the analyst to distinguish between a merger
which is expected to raise prices and one which is expected to lower costs. Likewise,
observing positive abnormal returns for the horizontal rivals does not make it possible
to discriminate between the two hypotheses of a price-increasing versus cost-reducing
merger. However, observing insignificant or negative abnormal returns for the rivals
around the announcement date is a sufficient condition to conclude that the market
expects the merger to be cost-reducing, not price-increasing.
17.5 The above-mentioned hypothesis is tested by using time series stock-price data for rival
firms, and comparing their actual stock price returns around the announcement date with
a counterfactual measure of what the return would have been had the merger not taken
place, and summing over to obtain the cumulative abnormal returns. The counterfactual
return for an asset can be calculated based either on the mean-adjusted return model
(MARM); or on the market model; or the capital asset pricing model (CAPM); or the
market index model. According to the MARM, the counterfactual return from an asset
is simply the average return over a specified period. The market model return is the
predicted value from a regression of actual returns on an intercept and the returns on a
market index. The CAPM requires estimating the predicted values from a regression of
actual returns on the returns on a risk-free asset and on the difference between the return
on a market index and on the risk free asset. Finally, the counterfactual return for the
market index model is simply the market index itself.
17.6 The implementation of this technique is simple, and it requires readily available data.
However, it has to be borne in mind that unless the abnormal returns for the rival firms
turn out to be negative or insignificantly different from zero, this technique does not lead

to unambiguous conclusions. Similarly, the assumption of (strong form) capital market
efficiency is not justified. Most studies show only weak form, or semi-strong, form
efficiency. In these circumstances stock market data may not fully capture the truth about
market power or cost reduction possibilities.
109
18 CONCLUSIONS
18.1 In this report we have investigated the use of quantitative techniques in antitrust analysis.
This includes a review of the role of collecting and analysing empirical evidence in cases
dealt with by antitrust authorities in the UK, US and the EC. The largest part of the
report is devoted to a systematic survey of 15 techniques. Each technique is described
in terms of the main characteristics it uses and its data requirements. A critical evaluation
is provided through illustrative case summaries and in a discussion of the problems of
interpreting the statistical and economic significance of each technique.
Role of quantitative techniques in antitrust analysis
18.2 Empirical analysis of economic issues is increasingly becoming an essential feature of
any major antitrust investigation, whether it be a merger which gives rise to complaints
of monopolisation, the abuse of a dominant position, a review of the compatibility of
a joint venture, or other co-operative agreements between firms.
18.3 This trend is almost universal and particularly pronounced regarding the definition of the
relevant markets in merger enquiries. Here the recent European Commission Notice on
market definition from December 1997 (see paragraph 2.5) has marked a watershed. Like
the US Merger Guidelines (see paragraph 2.9), which over the last 15 years have led to
the development of a more consistent and empirically based approach to market
definition, the Commission Notice can be expected to lead to similar changes in antitrust
analysis in Europe.

18.4 Market definition is, however, not the only area of antitrust analysis that relies on
quantification and the use of quantitative techniques. The analysis of market structure has
regularly been subject to empirical analysis in a number of cases in the UK and the US.
Usually it is the link between profit margins and levels of concentration across different
geographic (local) markets that are studied through econometric analysis. Another area
of antitrust analysis that calls for increased use of empirical analysis is the competitive
behaviour of firms. With the advances in industrial economics, more and more models
of competition are being applied empirically to study among other things, the effect of
a merger between firms supplying similar but not identical goods (key techniques used
in this context are diversion rations and demand analysis for differentiated products).
18.5 Finally, quantitative techniques can be used for the analysis of costs. While outside the
terms of reference of this study, economic analysis of cost functions is nevertheless
110
useful for the assessment of economies of scale and the assessment of possible efficiency
gains in a merger. It is here that economics and accounting come together to inform
antitrust analysis.
18.6 While very data intensive and requiring sophisticated econometric techniques, the above
models meet the main criteria for the appropriate use of quantitative techniques in
antitrust analysis, namely that they are capable of providing statistical results that have
an economic meaning. The same is true for bidding models, residual demand analysis,
time series studies of stock market reactions to news and, to a lesser extent, co-integration
analysis.
18.7 Quantitative techniques are only tools which are of assistance in assessing the structure
and conduct of an industry. These tools can, and should be, used to give an answer to
well-defined economic questions; these answers will be more accurate if the questions

are properly framed; if the data is reliable; and if the statistical tests are strong.
18.8 In order to frame the question correctly, the analyst has to become familiar with the
industry under investigation, and the behaviour of the main players within it. Only with
an in-depth knowledge of the industry will the analyst be able to ask the right questions.
Therefore one cannot begin with the use of these tools. They can only be employed after
the analyst already has a good understanding of the background to the case, but is seeking
specific answers to crucial questions - what is the exact market, what role does price
formation play, what is likely to occur if the firms X and Y merge? Public sources, and
interviews with businessmen and other parties involved in the investigation, will take the
analyst a long way in understanding both the functioning and the focal points that
characterise the case under investigation.
18.9 The process of translating this knowledge into an analytical framework allows the main
issues to be targeted by the relevant empirical tests. The key issues in antitrust analysis
are clearly market definition, market structure, and the nature of competition and
efficiency effects. Each one of these issues should be analysed within a well-defined
theoretical framework, from which hypotheses can be derived and be tested empirically.
18.10 The actual implementation of the empirical test should always be carried out using the
best statistical techniques given the available data and the question to which an answer
is sought. Therefore, the analyst must assess the reliability and suitability of the available
data before implementing any empirical test. Statistical data is subject to sampling errors,
biases, and changing definitions which have to be understood. The importance of this
rather pedantic part of the investigation cannot be stressed enough. By simply plotting
the different data series and computing basic statistics such as means, standard
deviations, measures of skewness, or frequency counts, it is possible to gain a good
111

feeling for the quality of the data and the basic underlying facts. It is very important not
to fall into the obvious temptation of trying to infer the hypothesis to be tested from what
appears to be the answer in the data. The hypothesis has to come from economic theory.
18.11 In carrying out the empirical tests, the analyst should follow the golden rule - stick to the
formulated hypothesis. Data mining especially, should be scrupulously avoided. By data
mining we mean that procedure where, for example, dozens of different regressions are
run with as many variables as possible expressed in as many forms, in the hope of
obtaining statistically significant results. The truth is that if the data is ‘tortured’ hard
enough, we are quite likely to obtain at least one significant result. For instance, if we
run ten regressions with the same dependent variable but different regressors we have a
40% probability of obtaining at least one regression with a significant coefficient, even
though none of the regressors are related to the dependent variable. Significance obtained
by mining the data is meaningless, and would not stand up to a thorough investigation.
18.12 When quantitative techniques are used correctly and rigorously, in the fashion described
above, they can be helpful tools. They are not, however, magic bullets. All empirical
analysis performed during an investigation has to be weighted before it is used to derive
public policy. Obviously, the weaker the data, or the more primitive or potentially
misleading the statistical technique used, the less weight the empirical analysis should
receive.
18.13 With these preliminary observations about the preparation for, and the undertaking of,
quantitative tests, we draw the following conclusions from our survey of 16 quantitative
techniques.
Statistical tests of prices and price trends (Part II)
18.14 Chapters 3 to 8 above describe quantitative techniques used in antitrust analysis to
analyse single variables, namely prices. Apart from hedonic analysis, these techniques
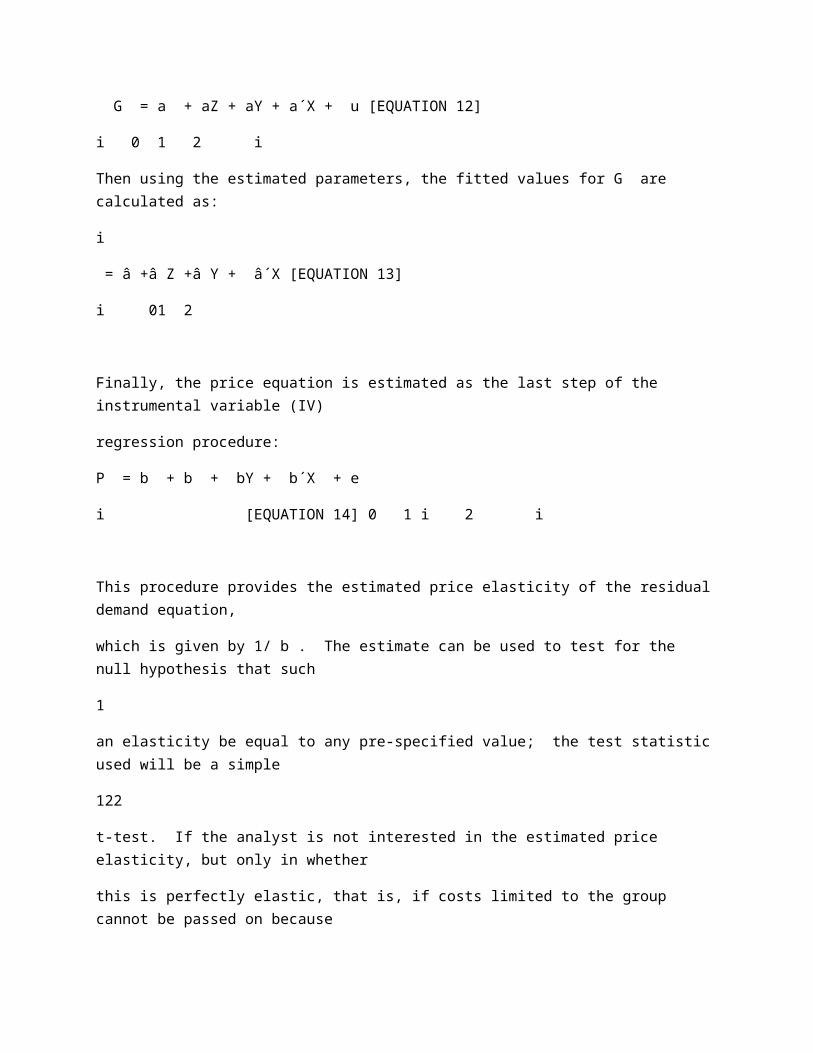
are all geared to test whether there are systematic differences between the prices of two
or more products or services, or between a product’s price across different areas or time
periods.
18.15 Cross-sectional price tests are very simple statistical tests that are not based on any
economic hypothesis. For this reason, they should be given little weight in the context
of an antitrust investigation. More specifically, although these tests allow the analyst to
establish whether two products or services have the same mean price across regions, or
before and after an alleged anti-competitive event has taken place, they do not provide
112
any explanation as to why it is so. These tests are often used as a first step in an analysis
or as the only step when no other data but price data is available. It is important to
emphasise that price data has to be carefully examined before it is used. Questions to be
considered here include: is the data actually in the form of transaction prices and not list
prices; are all characteristics of prices known (for example, warranty terms); are the
goods for which price data exists homogeneous?
18.6 The common price tests when time series data is available are listed below.
18.7 Hedonic price analysis is a good tool to be used as an intermediate step during an
investigation into markets where product characteristics vary frequently. This technique
allows the analyst to ‘deflate’ the prices due to the effect of qualitatively different
characteristics, thereby obtaining price series that are comparable. However, caution is
important. The results obtained with hedonic price analysis are very sensitive to the
correct specification of the product’s characteristics, so that an in-depth knowledge of the
product qualities is required to obtain meaningful results.
18.8 Price correlation is a weak test, which should be used as a starting point in an
investigation, but never as the sole piece of evidence. In too many analyses price

correlations appear to be the end rather than the beginning of statistical analysis.
Spurious correlation is a serious problem that can lead the analyst to conclude that two
series of prices are associated to one another while in reality they are related to some
other variable that is influencing them both.
18.9 Speed of adjustment tests and Granger causality are techniques that were used in
antitrust analysis for a short time. They have since been subsumed by co-integration
analysis. We have included these techniques because they represent important steps
towards the production of a statistically correct methodology that is aimed at testing
whether price series tend to move together.
18.10 Co-integration analysis is a very robust methodology. When used properly with
adequate data, this test does provide statistically meaningful results, unbiased by
problems such as spurious correlation. It is therefore one of our preferred tests. It does,
however, require a highly skilled analyst for this test to carried out properly. It should
therefore, only be undertaken by expert statisticians or econometricians trained in time
series analysis.
113
18.11 All statistical tests of price homogeneity, no matter how sophisticated, supply weak
evidence in antitrust analysis as they are only capable of providing information on
whether price series are related to each other. The fact that the price of a certain product
or area is found to affect prices of other products or areas is not sufficient proof that those
products or areas are in the same antitrust market. What needs to be determined is
whether areas or products that are in the same market at historical prices will still be in
the same market if prices in one area, or for one set of products, were increased by a
significant and non-transitory amount.
18.12 We conclude that quantitative techniques based on the analysis of prices alone are, aside

from co-integration analysis, relatively weak tests and should only be used if no other
data is available. When these techniques are used, they should carry a lighter weight in
the context of an antitrust investigation as compared to techniques based on tests of well-defined economic hypotheses.
Analysis of demand (Part III)
18.13 The techniques discussed in the report dealing with demand analysis have been developed
as quantitative tests of well-defined economic models. Since these tests derive from a
theoretical structure they do not have some of the statistical and interpretation problems
which exist with simpler price analyses described above.
18.14 Residual demand analysis is theoretically ideal, as it allows the direct estimation of
supply substitution effects in the market for a product or service. It is a preferred
technique. In a perfectly competitive market, a single firm does not have the power to
raise its price beyond the market price, because it will lose its customers to the
competition: hence the demand elasticity facing the firm is infinite. Residual demand
analysis provides a test for this hypothesis of perfect competition. Unfortunately there is
rarely enough information available to estimate a residual demand model correctly, as
data is needed on cost shifting variables of the firms operating in the industry - both those
under investigation and their competitors.
18.15 One interesting exception is when the market under investigation includes foreign
competitors. In that case exchange rates can be used as cost shifters and the model
estimated.
18.16 Residual demand analysis supplies the value of the elasticity of residual demand for the
firm under investigation. The antitrust analyst is, however, concerned about whether –
One paper is Waverman, L., 1991, Econometric Modelling of Energy Demand: When are Substitutes
169
Good Substitutes, Energy Demand: Evidence and Expectations , in D. Hawdon (ed.), Academic Press.

114
given such an elasticity - the firm can profitably raise the price by a significant amount.
Economic theory provides no guide as to when the residual elasticity is big enough to
infer effective competition.
169
18.17 Critical loss analysis provides an answer to whether competitive constraints are strong
enough to consider a range of products in the same market. In this respect, critical loss
analysis is a second-tier technique, used to calculate the change in the quantity sold that
for a given level of price-cost margin and price increase, makes that price increase
unprofitable. This technique is useful but cannot be used on its own; it has to be used as
a complement to residual demand estimation. This is because critical loss analysis
provides an estimate, for a given price-cost margin and a given price increase, of the
critical value of the elasticity of demand. If the actual value - obtained with econometric
analysis or other means - is larger than this critical value, then that price increase will be
unprofitable.
18.18 Import penetration tests are a useful tool to measure the constraint imposed on local
producers by foreign competition. How to treat foreign competition in antitrust analysis
is a question that should be answered within a theoretical model of demand. The first
step in the analysis of foreign competition should be a careful examination of what the
imports are, and what proportion of sales they represent. Then, if it is found that the
market has a strong foreign presence, and if sufficient data is available, the constraining
impact of foreign competition has to be assessed. This can be done either by a direct
estimate of the import elasticity with respect to domestic prices, or by incorporating the
effect into a residual demand model.
18.19 Survey techniques should be used when sufficient data is not available to carry out

fully-fledged demand estimation, provided the survey is carried out correctly. So,
although surveys can provide a valuable insight into the questions being investigated,
they should be designed and used carefully.
Models of competition (Part IV)
18.20 Within the structure-conduct-performance paradigm, price-concentration studies can
be helpful in assessing the impact of market structure (that is, concentration) on the
pricing behaviour of market participants. The appropriate test of the underlying
economic theory requires the use of price-cost margins as a dependent variable in the
econometric analysis. The hypothesis to be tested is that higher concentration leads to
higher price-cost margins. The use of price data alone instead of margins relies on the
rather restrictive assumption that marginal costs are constant. Price-concentration analysis
can be carried out by calculating the correlation coefficient between the two variables.
115
That is, however, not an advisable practice. Information about why the two variables are
related is required and that cannot be achieved by using correlation analysis. Note that the
underlying theory is the relationship at the individual firm level.
18.21 Often industry-wide rather than firm-specific tests are used. We would not recommend
this approach. Industry-level analysis of price-concentration relationships using time
series data should only be performed if firm-level data is not available. And if industry
data is used, great care should be taken with the ensuing interpretation. One of the main
problems with industry-level data is that market shares tend to be stable over time, so that
the concentration measure varies very little. Variability is higher in firm-level data with
a cross-sectional element. Also, the use of industry-level data does not allow for a
distinction to be made between the market power and the efficiency hypotheses, which
represents a serious drawback.

18.22 In recent years, the scope for abusing market power in differentiated product markets
by merging competitors, has come to the forefront in antitrust analysis. Techniques have
therefore been developed to test whether the merger between producers of competing
products is likely to lead to an increase in the price of their product(s). Diversion
analysis is a simulation technique that can be used for this purpose; it is very easy to
carry out and requires very little data, but it has been strongly criticised, as the underlying
economic assumptions are too restrictive. It is common to assume that the lost sales are
diverted equally across all competitors, an assumption which is simply incorrect for any
differentiated good industry. As supermarket scanner data on prices and quantities of
products sold becomes increasingly available, we believe that the estimation of demand
systems should become common practice. This technique is based on sound economic
theory, and it is also econometrically sound. Demand system estimation is, however, a
sophisticated analysis requiring the use of simultaneous equation techniques and may
take the competition policy analyst far afield.
18.23 In Chapter 16 we have reviewed techniques aimed at detecting bid-rigging and cartel
behaviour in procurement auctions. As investigations into these kinds of actions
represent a good proportion of the activity of antitrust authorities, these techniques are
important. They are also quite reliable, and easy to apply.
18.24 Finally, the anti-competitive effects of a merger can also be investigated using time series
event data of stock markets’ reactions to news . We have discussed this technique very
briefly, as the OFT has developed in-house literature on the subject. This type of analysis
is quite useful as data is readily available and the technique is valuable. The main
problem with this technique is that it is not easy to define when the new information was
generally available and so the technique does not always provide unambiguous
conclusions.

116
Concluding remarks
18.25 From this brief review of the strong points and pitfalls of the various techniques covered
in this report, we arrive at the following conclusions. First and foremost, it is very
important to correctly specify the hypothesis being tested and to ensure that it is in line
with the underlying economic assumptions, that is, in line with a well-defined economic
model. Secondly, there is no substitute for a good understanding of firm activities in the
industry under investigation. Thirdly, care must be taken to obtain sufficient data, capable
of being subjected to statistical tests. These aspects of any empirical investigation are
interdependent. The empirical results obtained have to be analysed in light of the
strength of the data and techniques used. Results derived using first class data and
powerful empirical techniques should be given a heavier weight in the context of an
investigation than results obtained using poor data and/or weak tests.
117
APPENDICES
A GLOSSARY OF TERMS
The glossary of terms starting overleaf explains some of the main statistical terms used in the
text. The following references provide a more complete explanation of the underlying theory
and concepts.
Fisher, F., 1980, Multiple regression in legal proceedings, in J. Monz (ed.), Industrial
Organisation, Economics and the Law, The MIT Press: Cambridge, Mass.
Kaye, D. and D. Freedman, 1994, Reference Guide on Statistics, Reference Manual on
Scientific Evidence , Federal Judicial Centre.
Wonnacott, T. and R. Wonnacott, 1990, Introductory Statistics for Business and Economics ,
4 edition, John Wiley & Sons: New York

th
Term Explanation
Autocorrelation
(serial correlation)
Bias
In regression analysis, there is autocorrelation when the
covariance of the error term is not constant, that is, each
observation is statistically dependent on the previous ones .
The vast majority of cases arise in the context of time series
data. Correlation between the time series residuals at different
points in time is called autocorrelation. Correlation between
neighbouring residuals (at times t and t+1) is called first-order
autocorrelation. In general, correlation between residuals at
times t and t+d is called dth-order autocorrelation. When
Least Squares techniques are being used to estimate the
parameters of the regression, the estimates will be unbiased
but inefficient in the presence of autocorrelation.
Autocorrelation casts doubt on results of Least Squares and
any inferences drawn from them. However, techniques are
available to improve the fit of the model and the reliability of
inferences and forecasts, for example, autoregressive models.
A systematic tendency for an estimate to be too high or too
low.
Term Explanation
118

Coefficient of
Determination (R )
2
In regression analysis, the coefficient of determination (R2) is
a measure of the proportion of the total variation in the
dependent variable that can be explained by the regression
equation. R varies between 0 and 1.
2
An R with a value of zero implies that movements in the
2
independent variable (X) do not explain any of the movement
in the dependent variable (Y). The higher the R , the greater
2
the association between movements in the dependent and
independent variables. Obviously, an R of unity implies that
2
the entire variation of the dependent variable can be explained
by the model. R is sometimes used as a measure of the
2
strength of a relationship that has been fitted by Least Squares.
R tends to be larger when the regression involves time series
2
data, and lower where cross-sectional data is used. This is
because in cross-sectional data, individual effects are more
important. Where two regression models have the same

dependent variables their explanatory power can be compared
by using the adjusted coefficient of determination, which
corrects for differences in the number of the regressors. When
the dependent variables are different (for example, one
regression uses price levels as the dependent variable and
another uses log prices) then the explanatory power of the two
regressions cannot be compared by using R .
2
Term Explanation
119
Confidence Interval An estimate, expressed as a range, for a quantity in the
population. For example, a 95% Confidence Interval is the
interval between which one can be 95% confident that the true
population value lies. If an estimate from a large sample is
unbiased, a 95% confidence interval is the range from two
standard errors below to two standard errors above the
estimate. Intervals obtained in this way cover the true value
about 95% of the time.
Put another way the Confidence Interval can be considered as
simply the set of acceptable hypotheses. It reflects ones
confidence in the estimation process of the population value.
Therefore any hypothesis that lies outside the confidence
interval may be judged implausible.
Covariance Used to measure how two variables, say X and Y, vary
together, that is, the extent of joint variability or association.

The covariance will be positive when both X and Y are large,
or both are small. When the covariance is negative one will be
large, while the other tends to be small.
Dummy variable These are variables usually assigned a value of 1 or 0. They
can be used to assign values to categories, such as male or
female, thereby transforming them into numerical terms
amenable to statistical tools. Dummy variables can also be
used in regression analysis.
Efficient Estimator Among all the possible unbiased estimators, the efficient
estimator is the one with the minimum variance or
equivalently, standard error. If the estimator is not efficient,
inferences based on the t and F tests will be incorrect.
Term Explanation
120
Fisher’s F -Test When more than two population means have to be compared,
the two-sample t -test can no longer be used. An extension is
then provided by the F-test, which compares the variance
explained by the difference between the sample means, with
the unexplained variance within the sample means. An
ANOVA (analysis of variance) table provides an orderly way
to calculate F , to test whether there is a statistically significant
difference between the populations.
Heteroscedasticity One of the assumptions of the standard Least Squares model
is that the variance of the errors is constant and does not

depend on the variation of X (the independent variable).
Errors with this property are said to be homoscedastic. If the
variance of the errors is not constant, the errors are said to be
heteroscedastic. There are many statistical tests to detect
heteroscedasticity. When Least Squares techniques are being
used to estimate the parameters of the regression, the
estimates will be unbiased but inefficient in the presence of
heteroscedasticity.
Heteroscedasticity tends to be a problem when cross-sectional
data is estimated. Most computer packages contain a routine
that enables the analyst to correct the covariance matrix
thereby solving the heteroscedasticity problem.
Hypothesis See Statistical Test.
Independence Two variables, say X and Y, are independent if the value of X
is not in any way affected by the value of Y.
Term Explanation
121
Least Squares Consider the simple case where there are only two variables,
such that Y depends on the value of X, and that the
relationship between X and Y is a straight line. In this case
the equation which best fits the data is of the form
= a + bX. A formula to calculate a (the intercept) and b (the
slope) then have to be found. The least square method
calculates a and b so as to minimise the sum of the squares of
the differences between the estimates ( ) and the actual

observations (Y). The differences are squared because some
of the deviations (Y– ) will be positive and some will be
negative, that is, some estimates will lie above the fitted line,
others below.
Null Hypothesis See Statistical test.
Outlier An observation that is far removed from the majority of the
data in a sample. Outliers may indicate an incorrect
measurement (for example, the information was incorrectly
entered into a spreadsheet), and may exert undue influence on
a summary statistics such as the mean, and on statistical tests
that incorporate these statistics such as regressions. As a
general rule any observation that is more than three standard
deviations from the mean needs to be treated with suspicion.
Population The total collection of objects or people to be studied, from
which a sample is drawn. The population can be of any size.
Term Explanation
122
Random sample A sample drawn from a population where each observation is
equally likely to be chosen each time an observation is drawn;
by extension each of the possible samples of a given size have
an equal probability of being selected. Random samples do
not ensure that survey results are accurate but they do enable
an assessment of the degree of accuracy of the results to be
made using statistical techniques.
Regression In its simplest terms a regression is designed to show how one

variable effects another. If there is more than one explanatory
variable, then the regression is called ‘multiple’. This is the
most common form of regression in economic applications.
There are two main uses of multiple regression. In the first
use, ‘testing hypotheses’, the aim is to state whether or not a
particular relationship is true. In the second use, ‘parameter
estimation’, the interest is to establish the precise magnitude
of the effects involved. There is a third use, which is not so
widespread, and that is forecasting the values of some
variable.
Residuals The difference between an actual and a predicted value
typically drawn from a regression equation.
Term Explanation
123
Standard Error A statistic is simply a function of the variables in the sample.
Through repeated sampling it would be possible to calculate
all the possible values of the statistic that one could observe.
These possible values constitute the sampling distribution of
the statistic. The standard deviation of the sampling
distribution for a statistic is often called the standard error of
the statistic.
Associated with the estimated value of each regression
coefficient ( a and b as mentioned above) is a figure known as
the standard error of the coefficient. The standard error is a
measure of the coefficient’s reliability. Generally, the larger

the standard error, the less reliable or accurate is the estimated
value of the coefficient.
In large samples, it is generally the case that the true
population mean is within approximately two standard errors
of the estimated mean 95% of the time.
Stationary Process A process whose statistical properties do not vary over time,
that is, a series which has a constant mean and variance over
time.
Term Explanation
124
Statistical Test Using sample data, a statistical test is a procedure performed
to estimate the probability that a hypothesis about the
population from which the sample was drawn is true. This
involves testing a null hypothesis against an alternative
hypothesis. The null hypothesis is often the hypothesis that
there is no difference between the population parameters, or
that the population parameter equals zero. The alternative
hypothesis is the converse of the null hypothesis. An
appropriate test statistic is chosen to evaluate the null
hypothesis and calculated for the sample of data. The
probability (significant level) is judged small enough, the null
hypothesis is rejected. There is a wide range of statistical tests
available. Among the most commonly used test statistics are
the Student’s t, the , and the Fisher’s F.
2

Student’s t-statistic A statistical test used to determine the probability that a
statistic obtained from sample data is merely a reflection of a
chance variation in the sample(s) rather than a measure of a
true population parameter.
In regression analysis the standard error of an estimated
coefficient is used to make a statistical test of the hypothesis
that the true coefficient is actually zero, that is, that the
variable to which it corresponds has no impact on the
dependent variable. The ratio of the estimated coefficient to
its standard error is the t -statistic.
In large samples, a t -statistic of approximately 2 means that
there is less than a 1 in 20 chance that the true coefficient is
actually 0 and that the larger coefficient is observed by
chance. In this case the coefficient is said to be ‘significant at
the 5% level’. A t -statistic of approximately 2 ½ means that
there is only a 1 in 100 chance that the true coefficient is 0,
that is, the coefficient is significant at the 1% level. In smaller
samples the t -statistics need to be larger for any given
significance level.
Term Explanation
125
Unbiased Estimator An estimate of a parameter is said to be unbiased when there
is no systematic error in the estimation procedure used. If an
estimate is unbiased, the expected value of the parameter

estimate is equal to the expected value of the (unknown)
population parameter. Put more simply, U is an unbiased
estimator of G if the expected value of U is equal to G. For
example, if is, on average, equal to µ then it is an unbiased
estimate of µ. Note that a systematic error is not a random
error.
126
B BIBLIOGRAPHY
Areeda, P. and H. Hoverkamp, 1992, Antitrust Law: An Analysis of Antitrust Principles and
their Application, 1992 Supplement, Boston: Little Brown
Areeda, P. and D. Turner, 1975, Predatory Pricing and Related Practices under Section 2 of
the Sherman Act, Harvard Law Review, 88: 697-733
Arrow, K., 1962, Economic Welfare and the Allocation of Resources for Invention, in NBER,
The Rate and Direction of Inventive Activity: Economic and Social Factors, Princeton
University Press: 609-25
Ashworth, M.H., J.A. Kay and T.A.E. Sharpe, 1982, Differentials Between car Prices in the
United Kingdom and Belgium , IFS Report Series No 2. London: Institute for Fiscal Studies
Bain, J.S., 1956, Barriers to New Competition: Their Character and Consequences in
Manufacturing Industries, Cambridge: Harvard University Press
Bain, J.S., 1951, Relation of Profit Rates to Industry Concentration: American
Manufacturing, 1936-1940, Quarterly Journal of Economics, 65: 293-324
Baker, J.,1997, Econometric Analysis in FTC. v. Staples, prepared remarks before the
Economics Committee, Section of Antitrust Law, American Bar Association, Washington,
DC, 18 July, 1997
Baker, J.B., 1987, Why Price Correlations Do Not Define Antitrust Markets: On Econometric

Algorithms for Market Definition, Working Paper No 149, Bureau of Economics, U.S.
Federal Trade Commission
Baker, J.B. and T.F. Bresnahan, 1992, Empirical Methods of Identifying and Measuring
Market Power, Antitrust Law Journal , 61: 3-16
Baker, J.B. and T.F. Bresnahan, 1985, The Gains from Mergers or Collusion in Product
Differentiated Industries, Journal of Industrial Economics , 35: 427-44
Baumol, W. J., J.C. Pauser and R.D. Willig, 1982, Contestable Markets and the Theory of
Industrial Structure , NY: Hartcourt Brace Jovanovich
Berndt, E.R., 1991, The Practice of Econometrics: Classic and Contemporary. Addison
Wesley
127
BEUC, 1989, EEC Study on Car Prices and Progress Towards 1992 , BEUC/10/89
Bishop, B., 1997, The Boeing/McDonnell Douglas Merger, European Competition Law
Review , 18 (7): 417-19
Bork, R., 1978, The Antitrust Paradox , New York: Basic Books
Bresnahan, T. , 1989, Empirical Studies of Industries with Market Power, in Schmalensee, R.
and R. Willig, eds., Handbook of Industrial Organisation , Volume 2. Amsterdam: North
Holland
Carleton, W.T., R.S. Harris and J.F. Stewart, 1980, An Empirical Study of Merger Motives.
Washington, D.C.: Federal Trade Commission
Carlton, D.W. and J.M. Perloff, 1994, Modern Industrial Organisation , New York: Harper
Collins
Carton board, 1994, Case IV/33833, OJ L243
Caves, R., 1992, Productivity Dynamics in Manufacturing Plants, Brookings Papers on
Economic Activity: 187-267

Caves, R., 1990, Industrial Organisation, corporate strategy and structure, Journal of
Economic Literature: 64-92
Caves, R. and D.R. Barton, 1990, Efficiency in US Manufacturing Industries, MIT Press:
Cambridge
Charemza, W.W., and D.F. Deadman, 1997, New Directions in Econometric Practice, 2
nd
edition. Edward Elgar
Commission Notice on the Definition of the Relevant market for the Purposes of Community
competition law, 1997, OJ C372/5
Davies, S. and B. Lyons, 1996, Industrial Organisation in the European Union: Structure,
strategy, and competitive mechanism , Clarendon Press: Oxford
Deaton, A. and J. Muellbauer, 1980, An Almost Ideal Demand System, American Economic
Review , 70: 313-326
Demsetz, H., 1973, Industry Structure, Market Rivalry and Public Policy, Journal of Law and
Economics, 11: 55-65
128
Demsetz, H., 1974, Two Systems of Belief about Monopoly, in Goldschmid, H.J., H.M.
Mann, and J.F. Weston, eds, Industrial Concentration: The New Learning, Boston: Little
Brown
Department of Justice and Federal Trade Commission, 1992, Horizontal Merger Guidelines,
Antitrust and Trade Regulation Report, 69 (1559), Washington D.C
Diamond, P. and J.J. Hausman, 1994, Contingent Valuation: Is Some Number Better Than
No Number?, Journal of Economic Perspectives , 45
Doern, G.B. and S. Wilks (eds.), 1996, Comparative Competition Policy: National Institutions
in a Global Market . Oxford: Clarendon Press

Easterbrook, Judge, A.A. Poultry Farms Inc. V. Rose Acre Farms Inc. F.2d 1396 (7th Cir. 1989)
Eckbo, B.E.,1983, Horizontal Mergers and Collusion, Journal of Financial Economics , 11: 241-73
Engle, R.F. and C.W.J. Granger, 1987, “Co-integration and Error Correction: Representation,
Estimation and Testing”, Econometrica , 55: 251-76
Euromotor, 1991, Year 2000 and Beyond - The Car Marketing Challenge in Europe, Euromotor
Reports: 183-84
European Commission, Irish Sugar case 97/624, Sugar Beet, case 90/45, and Napier
Brown/British Sugar case 88/518
European Commission, 1992, Case IV/M.0291, 1992, Torras/Sarrio
European Commission, 1995, Car Price Differentials in the European Union on 1 May 1995,
IP/95/768
European Commission, 1995, Twenty-fifth Report on Competition Policy
Fairburn, J. and P. Geroski, 1993, The Empirical Analysis of Market Structure and Performance,
in Bishop, M. and J. Kay, eds., European Mergers and Merger Policy. Oxford: Oxford
University Press, pp. 217-238
Farrell J. and C. Shapiro, 1990, Horizontal Mergers: An Equilibrium Analysis, American
Economic Review, 80: 107-26
129
Flam, H. and H. Nordstrom, 1995, Why Do Pre-Tax Car Prices Differ So Much Across European
Countries?, CEPR Discussion Paper series No. 1181
Frankel, A. and J. Langenfeld, 1997, Sea change or Sub-markets?, Global Competition Review ,
June/July: 29-30
Froeb, L.M., G.J. Werden and T.J. Tardiff, 1993, The Demsetz Postulate and the Effects of
Mergers in Differentiated Products Industries, Economic Analysis Group Discussion Paper 93-5
(August 24, 1993)

Geroski, P., 1982, Simultaneous Equation Models of the Structure-Performance Paradigm,
European Economic Review, 19: 145-58
Gilbert, R.J., 1995, The Antitrust Guidelines for the Licensing of Intellectual Property: New
signposts for the intersection of intellectual property and antitrust laws , American Bar
Association Antitrust Law Spring Meeting, Washington D.C
Graham, M. and A. Steele, 1997, The Assessment of Profitability by Competition Authorities,
OFT Research Paper 10
Harbord, D. and T. Hoehn, 1994, Barriers to Entry and Exit in European Competition Policy,
International Review of Law and Economics
Harris, B.C. and J.J. Simons, 1989, Focusing Market Definition: How Much Substitution is
Necessary? Research in Law and Economics, 12: 207-226
Hausman, J.J. and G.K. Leonard, 1997, Economic Analysis of Differentiated Products Mergers
Using Real World Data, George Mason Law Review, 5: 321-46
Hausman, J.J., G.K. Leonard, and J. D. Zona, 1994, Competitive Analysis with Differentiated
Products, Annales d'Economie et de Statistique,, 34: 159-80
Hayek, F., 1945, The Use of Knowledge in Society, American Economic Review; 35: 519-30
Hendricks, J. and P. Paarsh, 1995, A Survey of Recent Empirical Works Concerning Auctions,
Canadian Journal of Economics , 28: 403-26
Horowitz, I., 1981, Market Definition in Antitrust Analysis: A Regression Approach, Southern
Economic Journal, 48: 1-16
Jacquemin, A. and A. Sapir, 1988, International Trade and Integration of the European
Community: An Econometric Analysis, European Economic Review, 31: 1439-49
130
Kennedy, P., 1993, A Guide to Econometrics, 3 Edition. Oxford: Basil Blackwell
rd

Klass, M. W. and G. I. Rosenberg, 1985, Economic Analysis of the Proposed Acquisition of
Assets by Lafarge Corporation From National Gypsum Company, Glassman-Oliver Economic
Consultants, November 8, 1985
Klevorick, A., 1993, The Current State of the Law and Economics of Predatory Pricing,
American Economic Review, 83: 162-167
Kim, E.H. and V. Singal, 1993, Mergers and Market Power: Evidence from the Airline Industry,
American Economic Review, 83:549-569
Lande, R. and J. Langenfeld, 1997, From Surrogates to Stories: The Evolution of Federal Merger
policy, Antitrust Magazine , Spring: 5-9
Landes, W.M. and R.A. Posner, 1981, Market Power in Antitrust Cases, Harvard Law Review,
94:937-96
Langenfeld, J.L. and G.C. Watkins, 1998, Geographic Oil Product Market Test: An Application
Using Pricing Data , Mimeo: LECG Inc
Langenfeld, J.L., 1998, The Triumph and Failure of the US Merger Guidelines in Litigation, The
Global Competition Review, Dec 1997/Jan 1998: 36-37
Langenfeld, J.L., 1996, The Merger Guidelines as Applied, in Coate, M. and A. Kleit, 1996, The
Economics of the Antitrust Process
Lerner, A., 1934, The Concept of Monopoly and the Measurement of Monopoly Power, Review
of Economic Studies, 1: 157-75
Liebowitz, S.J., 1987, The Measurement and Mis-measurement of Monopoly Power,
International Review of Law and Economics , 7: 89-99 for an interesting discussion
London Economics, 1997, Competition in Retailing , Office of Fair Trading Research Paper 13.
London Economics, 1997, Competition Issues, Vol. 3, Sub-series V, Single market review 96,
Office for Official Publications of the European Communities
London Economics, 1994, The Assessment of Barriers to Entry and Exit in UK Competition

Policy, OFT Research Paper 2
131
McAfee, R.P. and J. McMillan, 1987, Auctions and Bidding, Journal of Economic Literature ,
25: 699-738
McFadden, D., 1973, Conditional Logit Analysis of Qualitative Choice Behaviour, in Zarembka,
P. ,ed., Frontiers in Econometrics. New York: Academic Press
Monopoly and Mergers Commission, 1986, White Salt
Monopoly and Mergers Commission, 1989, The Supply of Petrol. A Report on the Supply in the
United Kingdom of Petrol by Wholesale
Monopoly and Mergers Commission, 1989, The Supply of Beer
Monopoly and Mergers Commission, 1991, Soluble Coffee. A Report on the Supply of Soluble
Coffee for Retail Sale with the United Kingdom
Monopoly and Mergers Commission, 1992, Bond Helicopters Ltd and British International
Helicopters Ltd
Monopoly and Mergers Commission, 1992, New Motor Cars. A Report on the Supply of New
Motor Cars within the United Kingdom
Monopoly and Mergers Commission, 1994, The Supply of Recorded Music. A Report on the
Supply in the UK of Pre-recorded Compact Discs, Vinyl discs and tapes containing music
Monopoly and Mergers Commission, 1995, Service Corporation International and Plantsbrook
Group plc
Monopoly and Mergers Commission, 1995, South West Water Services Ltd
Monopoly and Mergers Commission, 1995, Telephone Number Portability
Monopoly and Mergers Commission, 1995, The General Electricity Company plc and VSEL plc
Monopoly and Mergers Commission, 1995, Video Games
Monopoly and Mergers Commission, 1996, National Express Group plc and Midland Mainline

Limited
Monopoly and Mergers Commission, 1998, Capital Radio plc and Virgin Holdings Limited
Mueller, D.C., 1985, Mergers and Market Share, Review of Economics and Statistics , 47: 259-67
132
Murray J. and N. Sarantis, , Price-Quality Relations and Hedonic Price Index for Cars in the UK
Myers, G., 1994, Predatory Behaviour in UK Competition Policy , Office of Fair Trading
Research Paper 5
Nickell, R., 1992, Productivity Growth in UK companies, 1975-86, European Economic Review,
Vol. 36: 1055-91
NERA, 1993, Market Definition in UK Competition Policy, Office of Fair Trading Research
Paper 1
Official Journal, 1991, Aerospatiale/Alenia/De Havilland, M. 53
Official Journal, 1992, NestlePerrier, 92/553/ CEE, 5-12 vol. L356
Official Journal, 1994, Carton board Case IV/33833, L243
OFT, 1999, The Competition Act 1998: OFT 400, The Major Provisions; OFT 401, The Chapter
1 Prohibition; OFT 402, The Chapter II Prohibition ; OFT 403, Market Definition ; OFT 404,
Powers of Investigation; OFT 405, Concurrent Application to Regulated Industries; OFT 406,
Transitional Arrangements ; OFT 407, Enforcement ; OFT 408, Trade Associations, Professions
and Self-Regulating Bodies
Pantler, P.A., 1983, A Guide to the Herfindahl Index for Antitrust Attorneys, Journal of Law and
Economics, 22: 209-11
Phlips, L. and I.M. Moras, 1993, The AXZO decision: a case of predatory pricing?, Journal of
Industrial Economics , 41: 315-21
Porter R.H. and J.D. Zona, 1993, Detection of Bid Rigging in Procurement Auctions, Journal
of Political Economy, 101: 518-38

Posner, R., 1979, The Chicago School of Antitrust Analysis, University of Pennsylvania Law
Review , 127: 159-83
Rice, J.A., 1995, Mathematical Statistics and Data Analysis, 2 Edition, Duxbury Press
nd
Shapiro, C., 1995, Mergers with Differentiated Products, Address before the American Bar
Association & International Bar Association program, The Merger Review Process in the U.S.
and Abroad , Washington, D.C., November 9, 1995
133
Scheffman, D.T. and P.T. Spiller, 1987, Geographic market definition under the US Department
of Justice Merger Guidelines, Journal of Law and Economics , 30: 123-47
Schmalensee, R., 1989, Inter-industry Studies of Structure and Performance, in R. Schmalensee
and R.D. Wiilig, (eds.), The Handbook of Industrial Organisation, Vol. II, North Holland: New
York
Schmalensee, R., 1978, Entry deterrence in the ready-to-eat breakfast cereal industry, Bell
Journal of Economics , 9:305-27 in Office of Fair Trading Research Paper 2, 1994, Barriers to
entry and exit in UK competition
Shull B., 1989, Provisional Markets, Relevant Markets and Banking Markets: The Justice
Department’s Merger Guidelines in Wise County, Virginia, Antitrust Bulletin , 34: 411-428
Slade, M.E., 1986, Exogeneity Tests of Market Boundaries Applied to Petroleum Products,
Journal of Industrial Economics , 34: 291-302
Stewart, J.F., W.T. Carleton and R.S. Harris, 1984, The Role of Market Structure in Merger
Behaviour, Journal of Industrial Economics , 32: 293-312
Stigler, G., 1968, The Organisation of Industry , Homewood: Richard D. Irwin Inc
Stigler, G. and R.A. Sherwin, 1985, The Extent of the Market, Journal of Law and Economics,
28: 555-85

Stillman, R., 1983, Examining Antitrust Policy Towards Horizontal Mergers, Journal of
Financial Economics, 11: 225-40
Sutton, J., 1991, Sunk costs and market structure: price competition, advertising and the
evolution of concentration , MIT Press: Cambridge
Temple Lang, J., 1996, Innovation Markets and High Technology Industries , Paper presented at
the Fordham Corporate Law Institute
Utton, M.A., 1986, Profits and the Stability of Monopoly, Cambridge: Cambridge University
Press
Von Weizsäcker, C.C., 1980, A Welfare Analysis of Barriers to Entry, Bell Journal of
Economics, Vol. 11: 399-420
Waverman, L., 1991, Econometric Modelling of Energy Demand: When are Substitutes Good
Substitutes, in D. Hawdon (ed.), Energy Demand: Evidence and Expectations. Academic Press
134
Werden, G.J. and L.M. Froeb, 1994, The Effects of Mergers in Differentiated Products
Industries: Logit Demand and Merger Policy, Journal of Law, Economics, and Organisation, 10:
407-26
Werden, G.J. and L.M. Froeb, 1993, Correlation, Causality and All that Jazz: The Inherent
Shortcomings of Price Tests for Antitrust Markets, Review of Industrial Organisation, 8: 329-53
Willig, R.D., 1991, Merger Analysis, Industrial Organisation Theory, and Merger Guidelines,
Brookings Papers: Microeconomics: 281-332
135
136
C LIST OF CASE SUMMARIES
Case study 1: Nestle-Perrier merger following paragraph 2.22
Case study 2: defining the geographical following paragraph 2.24

extent of US petrol markets
Case study 3: Staples and Office Depot following paragraph 2.33
Case study 4: the supply of recorded music following paragraph 2.43
Case study 5: the Boeing/McDonnell following paragraph 2.50
Douglas merger
Case study 6: AKZO following paragraph 2.52
Case study 7: South West Water following paragraph 2.61
Services Ltd
Application of cross-sectional price tests: paragraphs 3.10 to 3.15
international comparison of prices -
CDs and motor cars
Application of hedonic price analysis : paragraphs 4.5 to 4.8
car price differentials
Application of price correlation : paragraph 5.8
wholesale petrol markets in the US
Application of causality tests: paragraph 7.7
US petrol markets
Application of dynamic price regressions: paragraphs 8.8 to 8.11
the supply of soluble coffee
Application of co-integration analysis: paragraph 8.12
petrol markets in Colorado
Application of residual demand analysis: paragraphs 9.12 to 9.16
National Express Group plc and Midland
Main Line Ltd
Application of survey techniques: paragraphs 12.10 to 12.14

the Engelhard/Floridin merger
Application of price-concentration studies : paragraphs 13.14 to 13.18
the SCI/Plantsbrook merger
137
Application of analysis of differentiated paragraphs 15.7 to 15.14
products - estimation of demand systems:
the Kimberley-Scott/Clark merger case
Application of bidding studies: paragraph 16.12
paving tenders in Suffolk and Nassau
Counties, New York
Related Documents