Quantification of lubrication and particle size distribution effects on tensile strength and stiffness of tablets Sonia M. Razavi a , Marcial Gonzalez *b , and Alberto M. Cuiti ˜ no a a Department of Mechanical and Aerospace Engineering, Rutgers, The State University of New Jersey, Piscataway, NJ 08854, USA b School of Mechanical Engineering, Purdue University, West Lafayette, IN 47907, USA January 9, 2018 Abstract We adopt a Quality by Design (QbD) paradigm to better control the mechanical prop- erties of tablets. To this end, the effect of particle size distribution, lubricant concentra- tion, and mixing time on the tensile strength and elastic modulus of tablets is studied. Two grades of lactose, monohydrate and spray-dried, are selected. Tablets are compressed to different relative densities ranging from 0.8 to 0.94 using an instrumented compaction simulator. We propose a general model, which predicts the elastic modulus and tensile strength envelope that a specific powder can obtain based on its lubrication sensitivity for different particle size distributions. This is possible by introducing a new dimensionless parameter in the existing tensile strength and elastic modulus relationships with relative density. A wide range of lubrication conditions is explored and a predictable model is callibrated. The mechanical properties of lactose monohydrate tablets are noticeably de- pendent on particle size, unlike spray-dried lactose where little to almost no sensitivity to particle size is observed. The model is designed in a general fashion that can capture mechanical quality attributes in response to different lubrication conditions and particle size, and it can be extended to powders than undergo different deformation mechanisms, complex mixtures, and doubly convex tablets. Therefore, the model can be used to map the achievable design space of any given formulation. Keywords: Tensile strength; Elastic modulus; Tablet compaction; Particle size distribution; Lubricant sen- sitivity * Corresponding author at: School of Mechanical Engineering, Purdue University, West Lafayette, IN 47907, USA. Tel.: +1 765 494 0904. Fax: +1 765 496 7537 E-mail address: [email protected] (M. Gonzalez) arXiv:1801.02577v1 [cond-mat.mtrl-sci] 8 Jan 2018

Welcome message from author
This document is posted to help you gain knowledge. Please leave a comment to let me know what you think about it! Share it to your friends and learn new things together.
Transcript

Quantification of lubrication and particle sizedistribution effects on tensile strength and stiffness of
tablets
Sonia M. Razavia, Marcial Gonzalez∗b, and Alberto M. Cuitinoa
aDepartment of Mechanical and Aerospace Engineering, Rutgers, The State University of New Jersey,Piscataway, NJ 08854, USA
bSchool of Mechanical Engineering, Purdue University, West Lafayette, IN 47907, USA
January 9, 2018
Abstract
We adopt a Quality by Design (QbD) paradigm to better control the mechanical prop-erties of tablets. To this end, the effect of particle size distribution, lubricant concentra-tion, and mixing time on the tensile strength and elastic modulus of tablets is studied. Twogrades of lactose, monohydrate and spray-dried, are selected. Tablets are compressed todifferent relative densities ranging from 0.8 to 0.94 using an instrumented compactionsimulator. We propose a general model, which predicts the elastic modulus and tensilestrength envelope that a specific powder can obtain based on its lubrication sensitivity fordifferent particle size distributions. This is possible by introducing a new dimensionlessparameter in the existing tensile strength and elastic modulus relationships with relativedensity. A wide range of lubrication conditions is explored and a predictable model iscallibrated. The mechanical properties of lactose monohydrate tablets are noticeably de-pendent on particle size, unlike spray-dried lactose where little to almost no sensitivityto particle size is observed. The model is designed in a general fashion that can capturemechanical quality attributes in response to different lubrication conditions and particlesize, and it can be extended to powders than undergo different deformation mechanisms,complex mixtures, and doubly convex tablets. Therefore, the model can be used to mapthe achievable design space of any given formulation.
Keywords: Tensile strength; Elastic modulus; Tablet compaction; Particle size distribution; Lubricant sen-sitivity
∗Corresponding author at: School of Mechanical Engineering, Purdue University, West Lafayette, IN 47907,USA. Tel.: +1 765 494 0904. Fax: +1 765 496 7537
E-mail address: [email protected] (M. Gonzalez)
arX
iv:1
801.
0257
7v1
[co
nd-m
at.m
trl-
sci]
8 J
an 2
018

S.M. Razavi et al. 2
1 IntroductionLubricants are one of the key ingredients in the pharmaceutical formulations to improve flowa-bility, increase bulk powder density, and reduce die wall friction and ejection forces (Lachmanet al., 1976; Moody et al., 1981; Hirai and Okada, 1982; Dansereau and Peck, 1987; Millerand York, 1988; Sheskey et al., 1995; Podczeck and Mia, 1996; Faqih et al., 2007). Magne-sium stearate (MgSt) is the most frequently used lubricant (Shangraw and Demarest, 1993);typically added to the formulation in small amounts (0.25% − 1.0% (w/w)) (Lindberg, 1972;Miller and York, 1988). It has been shown that MgSt can adversely affect the physical andchemical properties of tablets (Johansson, 1984; Wang et al., 2010). Hypothetically, MgStforms a layer on the host particles weakening the interparticle bonding (Bolhuis et al., 1975;De Boer et al., 1978; Hussain et al., 1990). The lubricant type and concentration, type of mixerand its operation method, and mixing time are all important processing variables that affect thepowder compactibility, interparticle bonding and thus, final mechanical properties of tablets(Asker et al., 1975; Shah and Mlodozeniec, 1977; Bossert and Stains, 1980; Dansereau andPeck, 1987; Otsuka et al., 1993; Kikuta and Kitamori, 1994; Otsuka et al., 2004). However,the deformation mechanism of host particles also play a role (Bolhuis et al., 1975). For ex-ample, brittle materials that undergo fragmentation are said to be unaffected by MgSt due tothe creation of unexposed surfaces during compression (De Boer et al., 1978; Jarosz and Par-rott, 1984). In contrast, plastically deformable powders are significantly impacted by lubricantmixing (Doelker et al., 1987; Bolhuis and Chowhan, 1995; Mitrevej et al., 1996). Mollan andCelik (1996) ascribed the reduction in the total work of compaction by increasing the lubricantconcentration to decreased particle cohesiveness. Zuurman et al. (1999) argued that the de-crease in tablet strength of pharmaceutical powders such as microcrystalline cellulose mixedwith MgSt is caused by a more extensive relaxation of the lubricated tablets corresponding toa weaker interparticle bonding.Over the past decade there has been growing interest in quantifying what the powder experi-ences in mixing with lubricant to enable a more robust prediction of tablet quality attributes.The blender parameters were translated to a more relevant and fundamental variables, strainand shear rate, using a modified Couette shear cell to better quantify lubrication effect (Mehro-tra et al., 2007; Llusa et al., 2010). Shear rate is proportional to the energy input rate per unitmass and total strain is proportional to the total energy input per unit mass. Narang et al.(2010) derived a dimensionless equation to quantify total shear imparted by the force feederon the granulation in terms of a shear number, which provides guidance to the scale-up andinterchangeability of tablet presses. Kushner and Moore (2010) proposed an empirical model,which can describe the impact of both formulation and process parameters on the extent oflubrication in a pharmaceutical powder blend.Particle size distribution (PSD) also plays an important role on the compaction and tabletproperties (Roberts and Rowe, 1986). A decrease in particle size of the powdered material hasbeen shown to increase tablet porosity (McKenna and McCafferty, 1982; De Boer et al., 1986).Smaller particles are inclined to be more cohesive since the interparticle cohesive forces arecomparable to the weight of the particles making them more compressible (Castellanos, 2005;Faqih et al., 2006). Reduction in particle size typically results in an increase in the mechanical

S.M. Razavi et al. 3
strength of tablets (Shotton and Ganderton, 1961; Hersey et al., 1967; McKenna and McCaf-ferty, 1982; Ragnarsson and Sjogren, 1985). This is attributed to a greater packing densityafter the particle rearrangement and an increase in the surface area available for interpartic-ulate attractions (Rhines, 1947; Vromans et al., 1985; De Boer et al., 1986). Attempts weremade to correlate specific surface area to the mechanical strength of tablets and a linear rela-tionship was found for different types of lactose (Vromans et al., 1985; De Boer et al., 1986).However, Nystrom et al. (1993) suggested that the intermolecular forces are the dominatingmechanism in the compactibility of powders and only in some cases the available surface areacould be used to establish a model to correlate with mechanical strength of tablets. On thecontrary, sodium chloride tablets have been reported to become stronger as their particle sizeincreased associated to more bonding between particles through solid bridges (Alderborn andNystrom, 1982).Katikaneni et al. (1995) investigated the tableting properties and predominant consolidationmechanism of ethylcellulose as lubricant concentration and particle size varied individually.The concurrent effect of lubrication and particle size on mechanical properties of pharmaceu-tical tablets during and after compaction has also been explored. Van der Watt (1987) was thefirst to show that tablet properties change after the same MgSt mixing time for different par-ticle sizes of Avicel PH 102. In more recent years, Almaya and Aburub (2008) examined theeffect of particle size on lubricant sensitivity for different types of materials. They concludedthat for MCC (a plastically deforming material) particle size impacts tablet strength only inthe presence of lubricant. For starch (a viscoelastic material) tablet strength is affected by theparticle size with or without added lubricant. Finally, for dibasic calcium phosphate dihydrate(a brittle material) particle size has no effect on tablet strength with or without the lubricant.Nevertheless, there is no previous work that goes beyond the qualitative predictions.The primary goal of the present study is to adopt a Quality by Design (QbD) paradigm tobetter control the mechanical properties of tablets. We aim to quantify the lubrication effectcombined with the particle size on the tensile strength and elastic modulus of tablets. To thisend, the envelope of mechanical quality attributes of two grades of lactose, namely lactoseα-monohydrate (LM) and spray-dried lactose (SDL), caused by different PSD and lubricationconditions was explored. Tablets were compressed to different relative densities ranging from0.8 to 0.94 using an instrumented compaction simulator. We propose a general model forpredicting the elastic modulus and tensile strength spectrum that a specific powder can obtainbased on its lubrication sensitivity for different PSDs. This was possible by introducing a newdimensionless parameter in the existing tensile strength and elastic modulus relationships thatis a non-linear function of the PSD, lubricant concentration and its mixing time with the hostparticles. A wide range of lubrication conditions was explored and the model exhibited a goodpredictability. The mechanical properties of LM tablets were noticeably dependent on particlesize, unlike SDL where little to almost no sensitivity to initial particle size was observed.The model is designed in a general fashion that can capture mechanical quality attributes inresponse to different lubrication conditions and initial particle size.
S.M. Razavi et al. 4
2 Material and methodsThe materials used in this study include α-lactose monohydrate (Foremost Farms, Wisconsin,USA), Spray-dried Fast-Flo lactose monohydrate N.F. (Foremost Farms, Wisconsin, USA)and magnesium stearate N.F. non-Bovine (Mallinckrodt, Missouri, USA) as lubricant.The true density of lactose monohydrate (LM), spray-dried lactose (SDL), and magnesiumstearate (MgSt) powders was measured using an AccuPyc Pycnometer (Accupyc II 1340, Mi-cromeritics) with helium as density medium. The powders were dried at 50◦C for 24 hoursbefore the test.Each powder was sieved through a vibrational sieve shaker (Octagon 2000, Endecotts Ltd.,England) into different particle size distributions. LM was divided into three particle sizefractions 0-75, 75-106, and 106-150 µm. SDL was divided into four particle size fractions 0-75, 75-106, 106-150, and 150-212 µm. The sieve shaker was operated at amplitude of 8. Theas-received powder was poured in the top pan of the clamped sieve stack. The powders on thelower pan (corresponding to 0-75 µm) were collected at an interval of approximately 15 min.This procedure was repeated until the powder in the lower pan was a negligible amount.The particle size distribution (PSD) was measured using a Beckman Coulter LS 13 320 laserdiffraction particle size analyzer to ensure if the desired distribution was achieved. MgStwas pre-sieved through a #50 mesh (300 µm opening) prior to mixing with powders using alaboratory scale resonant acoustic mixer (labRAM) (Resodyn Acoustic Mixers, Butte, Mon-tana, USA). The mixing intensity (0 − 100%) is the parameter that can be controlled in theLabRAM, which determines the amplitude of the mechanical vibration, translating into accel-eration values (0− 100 g’s) depending on the load mass (Osorio and Muzzio, 2015). In all theexperimental work presented here the acceleration of 40 g was used. In other words, for eachblending condition, based on the powder mass and powder properties, the mixing intensitywas adjusted to give the same acceleration. Regardless, the variations in powder mass werekept minimal. Overall, MgSt concentration and mixing time varied from 0.25% to 2% and30 sec to 2400 sec, respectively, aiming to produce tablets with a wide range of mechanicalproperties. Samples were stored in airtight plastic bags until used.The samples were compacted using a Presster tablet press simulator (The Metropolitan Com-puting Corporation of East Hanover, NJ) equipped with an 8 mm flat round face, B-typetooling. A Fette 1200 tablet press with 250 mm compaction roll diameter was emulated at aconstant speed of 25 rpm. A dwell time of 26 ms, corresponding to a production speed of36, 000 tablets per hour, was used. Compression force and punch displacement are measuredvia strain gauges placed on the compression roll pins and a linear variable displacement trans-ducer connected to each punch, respectively. No pre-compression force was applied. Thetotal number of tablets per case varied from 8 to 17. All the compacted tablets were stored atambient room temperature and inside a sealed plastic bag and kept for at least 24 hours priorto any characterization.The mass of tablets was measured with a precision balance (±0.001 g, Adventurer Ohaus).The thickness and diameter of tablets were measured using a MultiTest 50 (MT50) tablethardness tester (Sotax, Allschwil, Switzerland). From these measurements, the relative density

S.M. Razavi et al. 5
of the tablets was calculated
ρ =4mπD2t
ρt(1)
where m, D, and t are the mass, diameter, and thickness of the tablet and ρt is the true densityof the blend determined by
1
ρt=
2∑i=1
niρt,i
(2)
n and ρt represent the concentration on a mass basis and true density of each ingredient.Ultrasound (US) measurements were made using a pulser/receiver unit (Panametrics, 5077PR),a pair of longitudinal wave contact transducers (Panametrics, V606-RB) with a central fre-quency and diameter of 2.25MHz and 13mm, respectively, a digitizing oscilloscope (TektronixTDS3052), and a computer controlling the data acquisition. Parafilm tape was used, suggestedby Hakulinen et al. (2008), to improve the contact between transducers and tablets. From theacquired data, the time of flight (TOF) was obtained using the first peak of the received USsignal. The speed of sound, SOS, was calculated as follows:
SOS =t
TOF, (3)
A delay time of 0.8µs was measured for the US setup independent of the material used. Insubsequent measurements this delay time was subtracted from the measured TOF.The elastic modulus, E, of each tablet was then calculated from the SOS assuming the materialis isotropic (Akseli et al., 2009; Razavi et al., 2016):
E = SOS2ρb. (4)
The tablets were diametrically compressed using an MT50 tablet hardness tester. The tensilestrength of tablets, σt, was computed using Hertz solution (Fell and Newton, 1970)
σt =2F
πDt, (5)
where F is the breaking force.
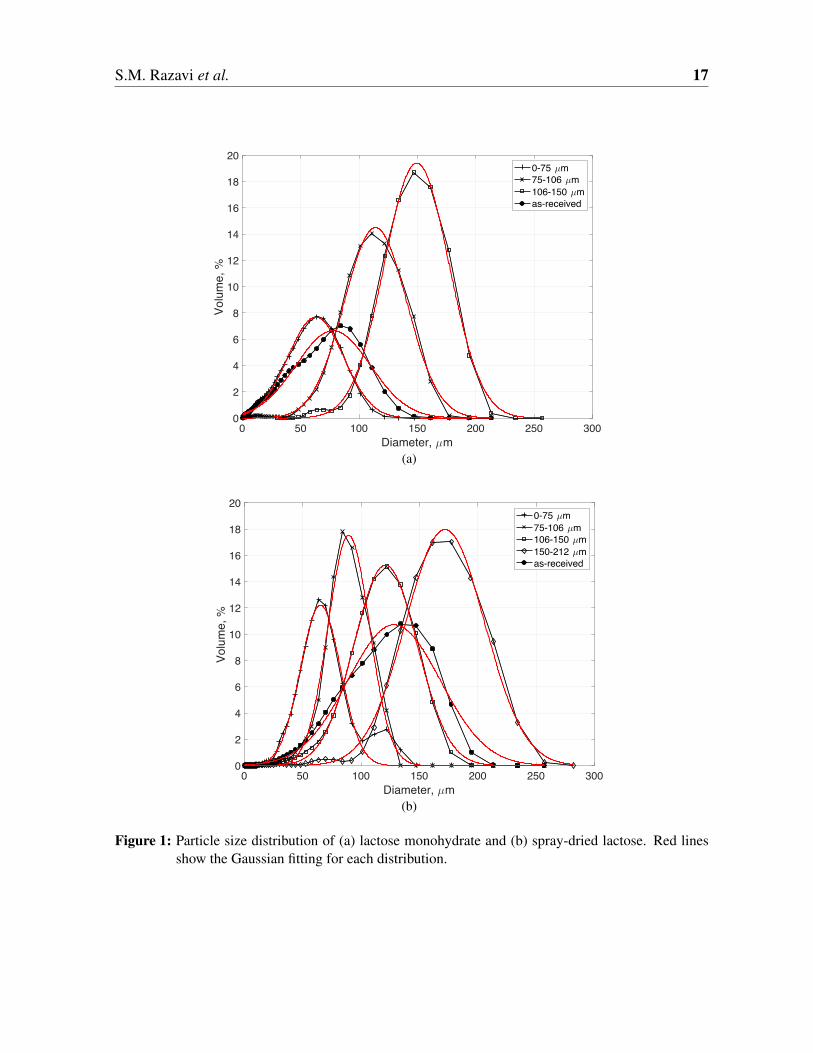
3 Results and discussionThe average true density of LM, SDL, and MgSt was measured to be 1.555, 1.546, and1.040 gcm−3, respectively. According to (Yohannes et al., 2015), the true density of lactoseparticles was found to be independent of the PSD. Thus, the density measurements were onlyconducted on the as-received samples and the changes in the true density of powders withdifferent PSD were assumed negligible. A total of 19 blends of LM and 23 blends of SDLwere prepared varying in MgSt concentration (cl), mixing time (tm), and PSD, listed in Table1.Figs. 1(a) and 1(b) show PSD measured for the sieved and as-received samples of LM andSDL, respectively. A Gaussian distribution was fitted to all the curves using Matlab 2016a

S.M. Razavi et al. 6
(MATLAB, 2016) and the mean (µ) and standard deviation (σ) for each PSD are reportedin Table 1. There is a clear difference between the as-received powders. As-received LMcontains mainly of fine particles, whereas as-received SDL has larger particles. This justfiesthe addition of the fourth PSD (150− 212 µm) selected for SDL. For each PSD sample, thereare particles smaller (except for 0 − 75 µm) and larger than the target PSD. Possible reasonswere mentioned in (Yohannes et al., 2015). Optical microscopy on samples with differentPSD showed insignificant change in particle shape. Thus, particle shape was assumed to be aconstant in this study.Although PSD (in particular, d10) was shown to be increased by the RAM mixing time (Osorioet al., 2016), our goal is to be able to correlate the mechanical strength of tablets to the initialproperties of the powder. Thus, the PSD measurement was only conducted on the unlubricatedsamples.
3.1 Effect of particle size on lubricant sensitivity on compaction proper-ties
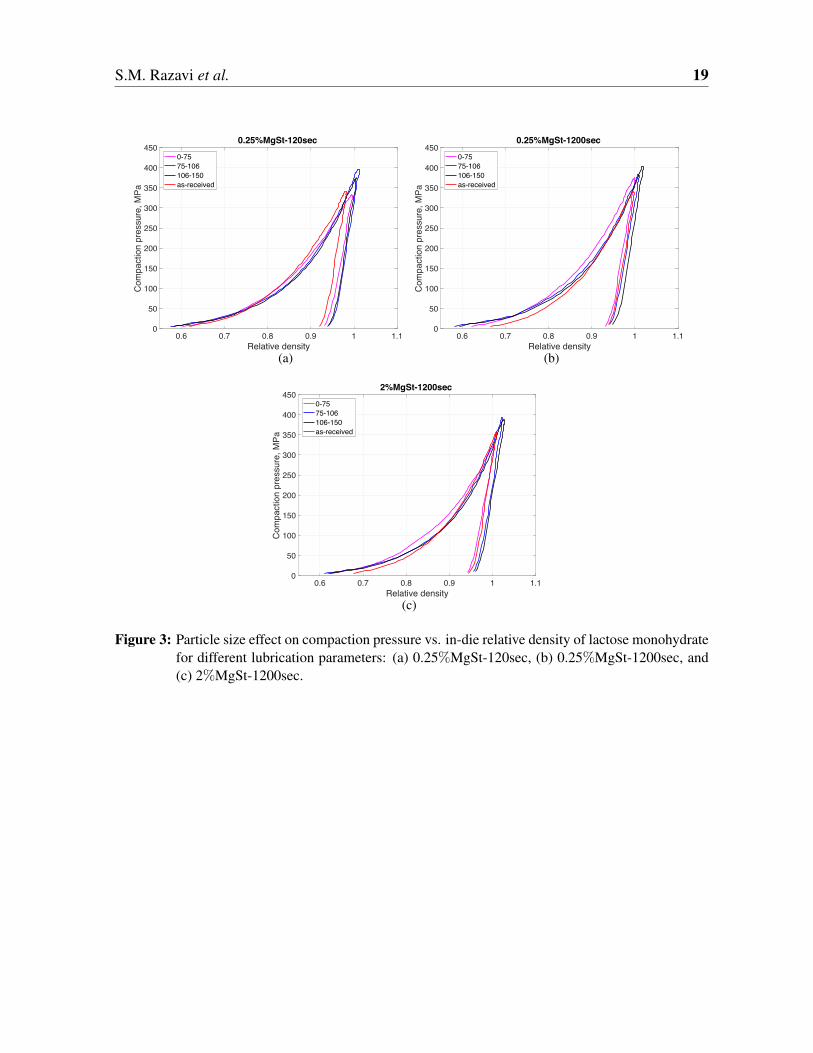
Compaction pressure is calculated by dividing the compaction force over the cross sectionalarea of the tooling used. The in-die relative density is determined by Eq. (1), but t varies asthe gap between the upper and lower punches changes during loading and unloading. Duringloading the punches get closer and the thickness of the powder bed decreases until it reachesits minimum, where the maximum compaction pressure is applied. When the force is released,the unloading stage starts, some of the energy is recovered and the tablet mostly expands axi-ally. The total work input during the compaction process is the area under the loading curve ofa force-displacement profile. In this study, instead of force-displacement, we used compactionpressure versus in-die relative density profiles, which allows for comparison between samplesof different sizes.Fig. 2 compares the axial compaction pressure versus in-die relative density profiles of threesimilar lubrication conditions for as-received and sieved LM powders. It has been reportedthat better packing can be achieved during die filling, in particles exposed to higher shearstrain levels causing higher initial relative densities (i.e., the die-fill relative density) (Mehrotraet al., 2007; Pawar et al., 2016). In this study, this phenomenon was noticeably observed inthe as-received LM. For the sieved samples, by keeping the MgSt concentration constant, themixing time did hardly affect the loading and unloading path as a function of relative density.On the other hand, in all the cases, the increase in MgSt concentration results in a differentcompaction profile, moving toward the right-hand side. This shift is partially caused by thedecrease in the true density of the blend. Fig. 2(b) discernibly shows that the forces evolvedduring compression are slightly lower when more lubrication was used, i.e. less work wasneeded. It has been reported that with increase in lubricant level lower input work is expectedattributing it to reduced particle cohesiveness and decreased frictional effects at the punchfaces and die wall (Mollan and Celik, 1996; Velasco et al., 1997).Fig. 3 was plotted to better compare the compaction profiles for different PSD with the samelubrication history. There is no significant difference among the compaction profiles for eachcondition, indicating that PSD does not affect the deformation behavior of LM with the pres-

S.M. Razavi et al. 7
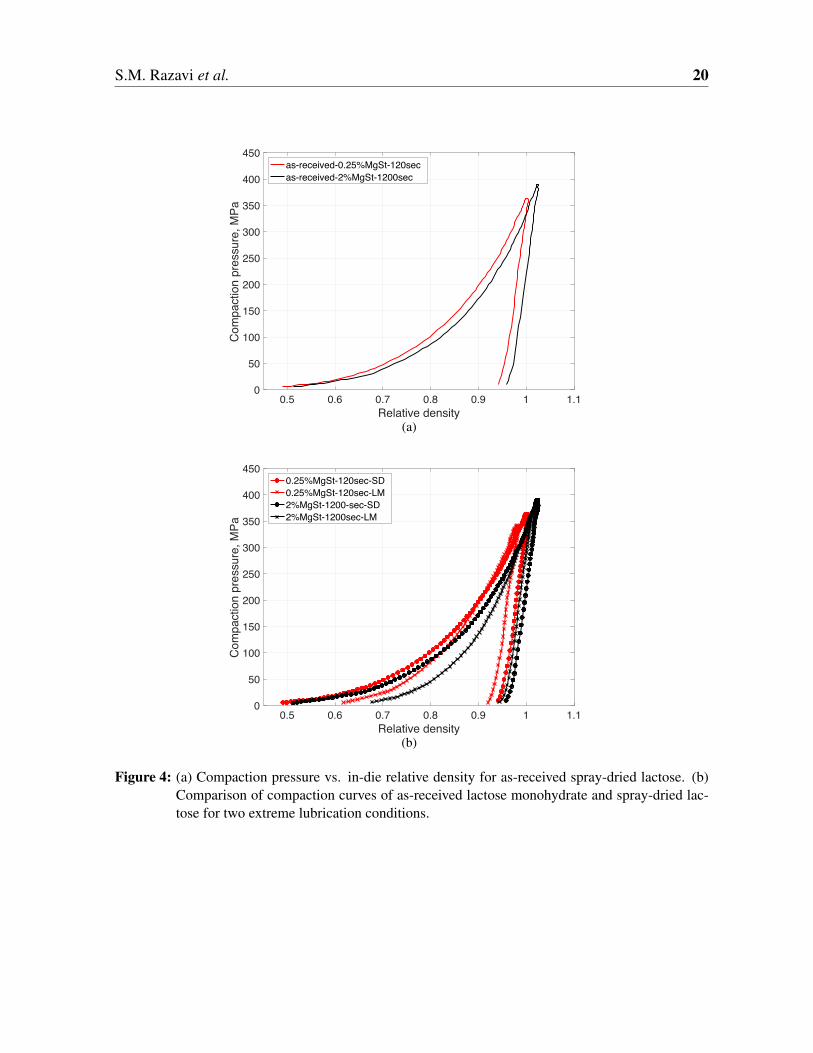
ence of lubrication. The high initial relative density in the as-received sample compared to thesieved samples, may be explained by its relatively larger standard deviation in PSD (31.85 µm)(Table 1). The fine particles fill the voids in between the large particles increasing the bulkdensity of the powder (Yohannes et al., 2015).The compaction pressure- in-die relative density profiles of as-received SDL for two extremelubrication conditions ascertained little lubricant sensitivity of SDL, as depicted in Fig. 4(a).Fig. 4(b) compares the compaction behavior between the two as-received powders. The totalwork input during the compaction process is higher for SDL. Mollan and Celik (1996) arguedthat as the total work input increases, the compacted powder is expected to be stronger as aresult of higher energies used to form bonds between particles. If this hypothesis holds, weexpect SDL tablets to be much stronger than LM tablets. However, we should be mindful thatthe energy of a tablet formation that affects the bond strength, according to the first law ofthermodynamics, is associated with both the work done on the powder to form a tablet and theheat released by the system (Coffin-Beach and Hollenbeck, 1983).It is also interesting to mention that for the same lubrication condition the difference in thecompaction profiles between the two powders almost disappears when it reaches its maximum.This happens at relative densities beyond 0.9, where the area of true contact between particlesis large.
3.2 Effect of particle size on lubricant sensitivity on tensile strength andstiffness of tablets
Elastic modulus and tensile strength versus out-of-die relative density for different PSDs ofLM tablets are depicted in Fig. 5. As was expected, both the elastic modulus and tensilestrength decreased by adding more lubricant and/or mixing time. Although, the effect is moresignificant in smaller PSD compared to large PSD. This can be attributed to smaller particleshaving more available surface area to be covered by MgSt coating for the same tablet weight.For all the PSD levels, the lubrication affects the strength and stiffness level until it reaches asaturation regime, where the powder would no longer be affected with the addition of lubricantconcentration or mixing time, in accordance with (Kikuta and Kitamori, 1994). It should benoted that the lubricant concentration and mixing time do not affect the tensile strength andelastic modulus of tablets by the same rate. The results demonstrate an envelope for tensilestrength and elastic modulus obtainable for tablets with relative densities ranging between 0.8and 0.94 considering different PSDs and lubricant conditions.The initial particle size of LM affects the mechanical strength of tablets, as depicted in Fig. 6.Large mean particle sizes exhibited faster response to tablet strength saturation by increasinglubricant concentration and/or mixing time. The reduction in strength of large particles (106-150 µm), even for the least lubricated tablets (case 13), was to a degree that hardly particlesformed a solid and the tablets were extremely weak. Obviously, in practical purposes thislevel of strength is not desirable but since our goal is to have a model based on lubricationsensitivity we created a vast collection of data.The difference between each PSD is noticeable for the low lubrication condition (i.e., 0.25%MgSt-2min). This may be due to the more available surface area in smaller particles requiring more

S.M. Razavi et al. 8
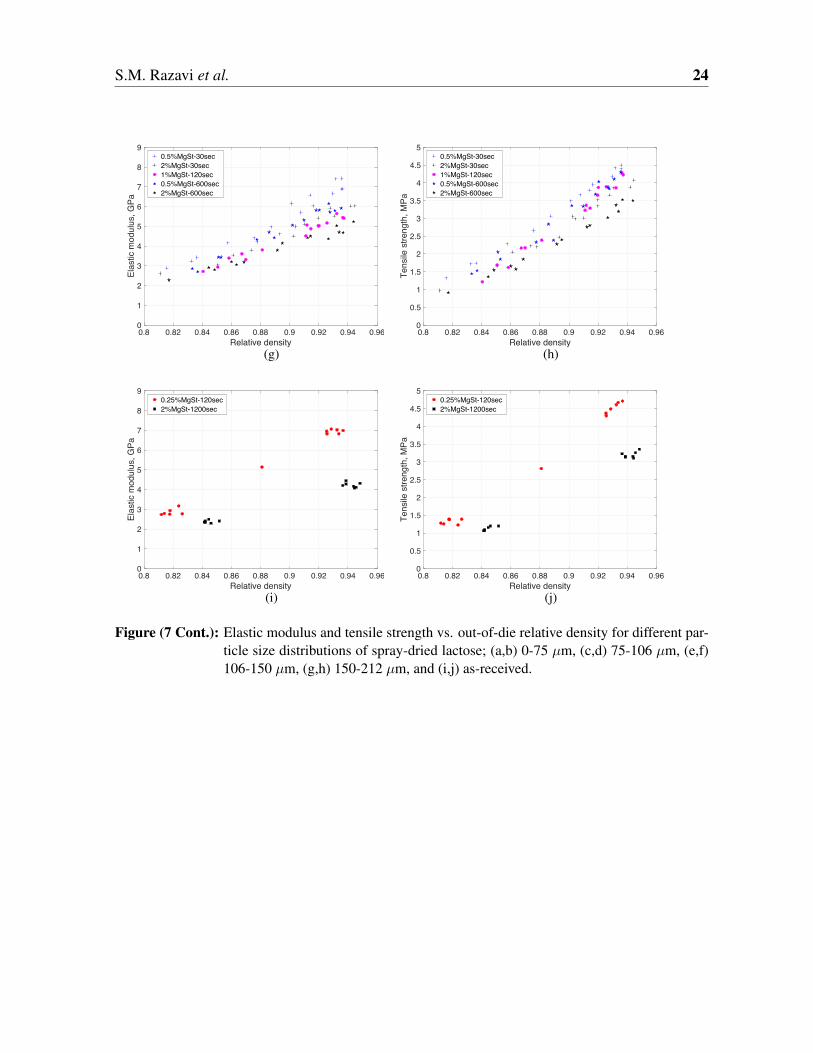
mixing time to fully be coated by MgSt.The as-received tablets in the low lubrication condition show high elastic modulus and tensilestrength because of having a large population of small particles. However, as the shear strainincreases, the larger particles are overlubricated causing a significant drop in the elastic mod-ulus and tensile strength. Altogether, we have observed that the lubricant and PSD sensitivityof LM are more pronounced in the tablet properties than in its deformation behavior duringcompaction.The elastic modulus and tensile strength of all the SDL tablets are plotted against their relativedensities for different PSD levels in Fig. 7. SDL shows a non-negligible sensitivity to lubrica-tion and higher values of elastic modulus and tensile strength compared to LM tablets. Thisdifference is more remarkable between the stiffness of tablets compared to the their tensilestrength.Four different lubrication conditions were selected to compare the PSD effect on the tensilestrength and elastic modulus of SDL tablets. According to Fig. 8, unlike LM, particle sizedoes not affect the tensile strength and elastic modulus of SDL tablets, taking into accountdifferent lubrication conditions.All of the 42 cases (cf. Table 1) were individually fitted to Eqs. (6) (Rossi, 1968) and (7)(Kuentz and Leuenberger, 2000)
E = E0
[1−
(1
1− ρc,E
)(1− ρ)
](6)
σt = σ0
[1−
(1− ρ
1− ρc,σt
)e(ρ−ρc,σt )
](7)
where E0 and σ0 are the elastic modulus and tensile strength at zero-porosity, respectivelyand ρc,E and ρc,σt are the relative density at which E and σt go to zero, respectively. Table2 lists all the fitted parameters and R2 values. A good fit was shown for all the cases (R2
> 0.93), except for the elastic modulus fitting of cases 12 and 16, due to the implications ofacquiring data from these tablets exhibiting low elasticity using the already selected settingson the ultrasound testing.
3.3 Quantitative model of lubrication and particle size distribution ef-fects on tensile strength and stiffness of tablets
Toward quantifying the PSD and lubricant sensitivity effects on mechanical properties oftablets, we introduce a parameter C into the tensile strength and elastic modulus relation-ships with relative density (Eqs. (6) and (7)). For the sake of simplicity and generality, weassume a form for C that captures the leading order term of the variables, that is
C =clx1 tm
x2 µx3
x4
(8)
where {x1, x2, x3, x4} are the fitting coefficients. The coefficient x4 serves as a scaling param-eter that, in addition, makes C dimensionless. C will depend on the response variable (i.e.,
S.M. Razavi et al. 9
tensile strength and elastic modulus) and material properties. Thus, we define four distinctC parameters, referred to as CE,LM and Cσ,LM for lactose monohydrate and redCE,SDL andCσ,SDL for spray-dried lactose.In order to introduce C into Eqs. (6) and (7), we need to find a relationship between C andE0, σ0, ρc,E, and ρc,σt . Figs. 5 and 7 show that the data points converge as ρ decreases, inagreement with what authors observed in (Razavi et al., 2016). Thus, to keep the optimizationproblem simpler and mathematically less complex, we assume constant ρc,E and ρc,σt for eachpowder, regardless of its PSD, lubricant concentration or/and mixing time. Thus, as a firstorder approximation only E0 and σ0 are considered as functions of C. We parameterize E0
and σ0 as follows
E0 =E0,∅ − E0,∞
1 + CE+ E0,∞, where CE =
clb1 tb2m µb3
b4
(9)
σ0 =σ0,∅ − σ0,∞
1 + Cσ+ σ0,∞, where Cσ =
cld1 td2m µd3
d4
(10)
where {b1, b2, b3, b4} and {d1, d2, d3, d4} are the fitting parameters presented in function C forE0 and σ0, respectively. (E0,∅ and E0,∞) and (σ0,∅ and σ0,∞) correspond to properties for whenC = 0 and C =∞, respectively. Thus, E0,∅ and E0,∞ are the maximum and minimum valuesE0 can obtain, which are determined by fitting the experimental data to the above equation.The same holds for σ0. For most materials and lubricants, E0,∞ (or σ0,∞) will go to zerobecause the lubricants prevent the formation of solid bridges. However, it has been reportedthat materials, which experience significant fracture may develop some tablet strength evenif they are fully lubricated (Kikuta and Kitamori, 1994). Therefore, the minimum valuesfor E0 and σ0 does not need to be zero for “infinite” lubrication. It is worth to emphasizethat the functionality of E0 and σ0 is in fact unknown. In this study, we parameterized thesetwo functions only in the interest of simplicity and generality. Other functionalities may beexplored, which falls outside the scope of this paper.E0 and σ0 were predicted from experimental results by solving the following general optimiza-tion problems
min{b1,...,E0,∞,ρc,E}
[∑i∈P
(E(ρi)− E0{b1,...,b4,E0,∅,E0,∞}
(1− 1− ρi
1− ρc,E
))2]1/2
min{d1,...,σ0,∞,ρc,σt}
[∑i∈Q
(σt(ρi)− σ0{d1,...,d4,σ0,∅,σ0,∞}
[1−
(1− ρi
1− ρc,σt
)e(ρi−ρc,σt )
])2]1/2
where P and Q are a set of experimental points obtained from ultrasound and diametricalcompression tests, respectively. In this study, P and Q consisted of 316 points for SDL and204 points for LM, respectively. It is noted that case 16 (see Table 2) was removed from theoptimization. Case 5 from LM dataset and cases 24 and 33 from SDL dataset were randomlytaken out and adopted later to validate the model.

S.M. Razavi et al. 10
The solution to the optimization problems forced E0,∞ and σ0,∞ to go to zero for both materi-als. Thus, Eqs. (9) and (10) were reduced to
E0 =E0,∅
1 + clb1 t
b2m µb3
b4
σ0 =σ0,∅
1 + cld1 t
d2m µd3
d4
The optimal values together with the residual errors for the optimization problems are in Ta-bles 3 and 4. For LM, b3 and d3 values indicate that changes in PSD result in more drasticchanges in elastic modulus and tensile strength of tablets compared to the lubricant concen-tration and mixing time. On the other hand, cl seems to be the most influential variable on themechanical properties of SDL (see, b1 and d1 values in Tables 3 and 4). E0,∅ of SDL resultedin an unrealistic prediction. Hence, we attempted to produce tablets of SDL with no lubri-cation, but the compaction was not successful due to extremely high frictional and ejectionforces. Caution must be taken in interpreting E0,∅ and σ0,∅, since the proposed model does notconsider other physical mechanisims that prevent the formation of a tablet.In summary, our proposed strategy shows that elastic modulus (or, tensile strength) is inverselyproportional to a non-linear function of material and blending properties and can be presentedas follows
E =E0,∅
1 + clb1 t
b2m µb3
b4
(1− 1− ρ
1− ρc,E
)(11)
σt =σ0,∅
1 + cld1 t
d2m µd3
d4
[1−
(1− ρ
1− ρc,σt
)e(ρ−ρc,σt )
](12)
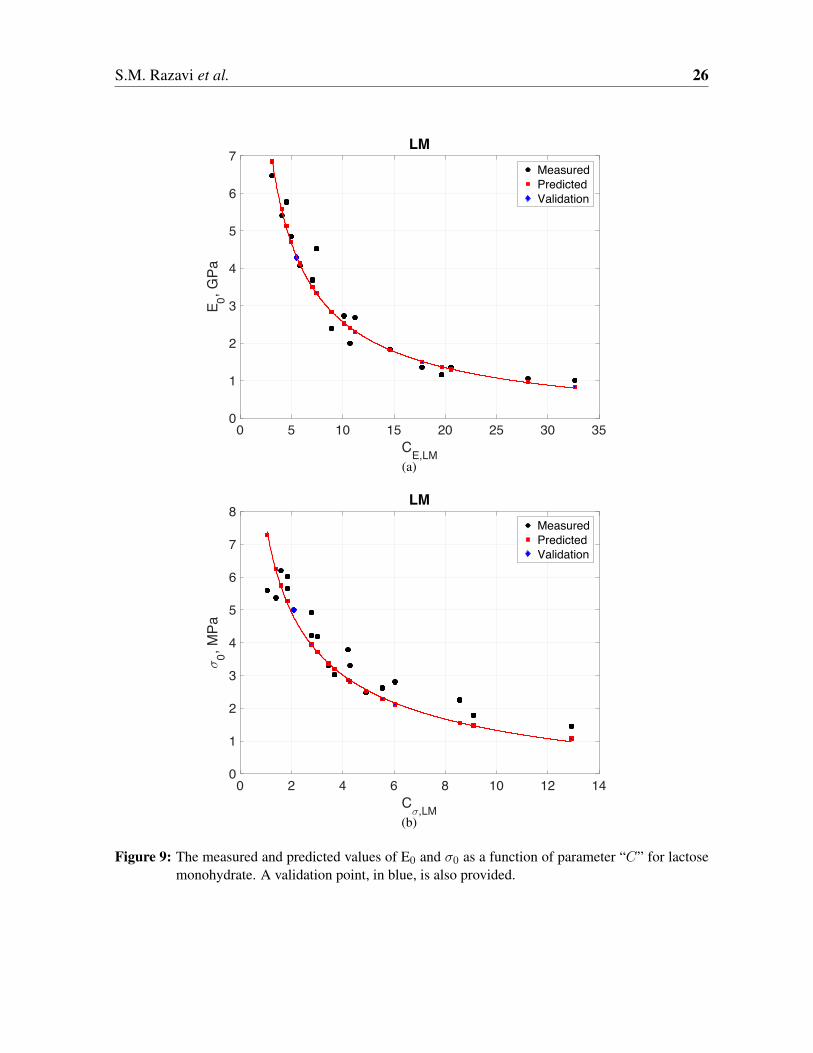
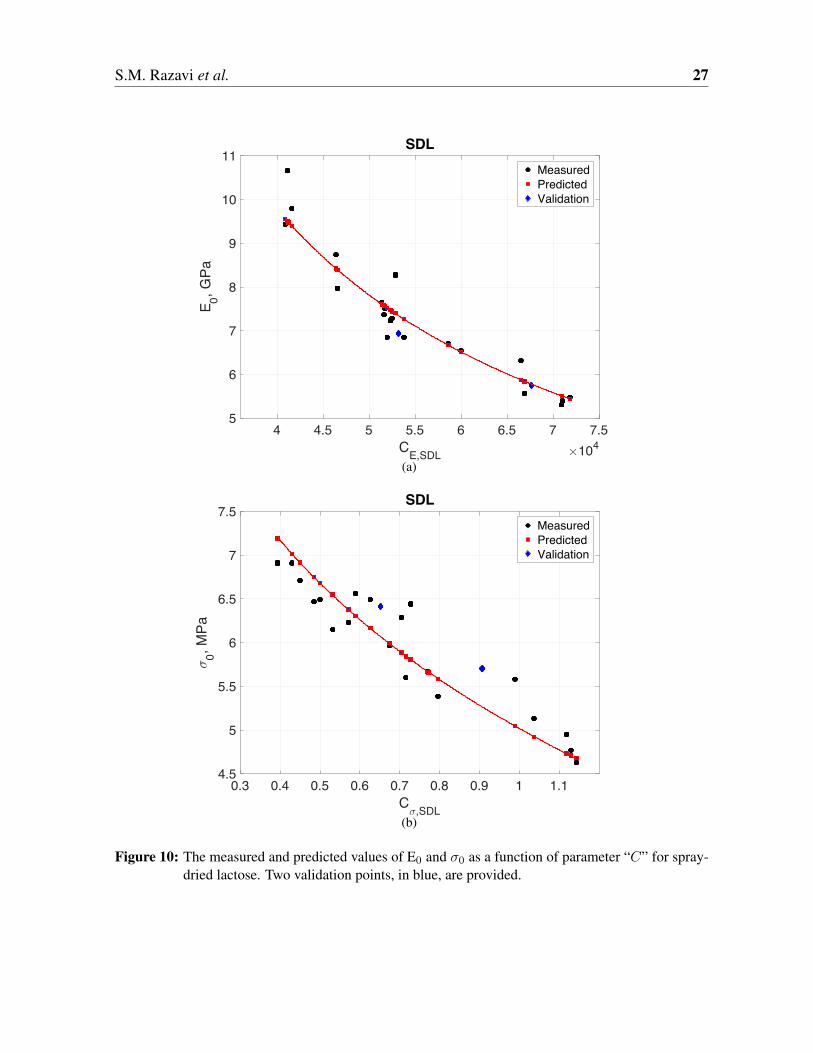
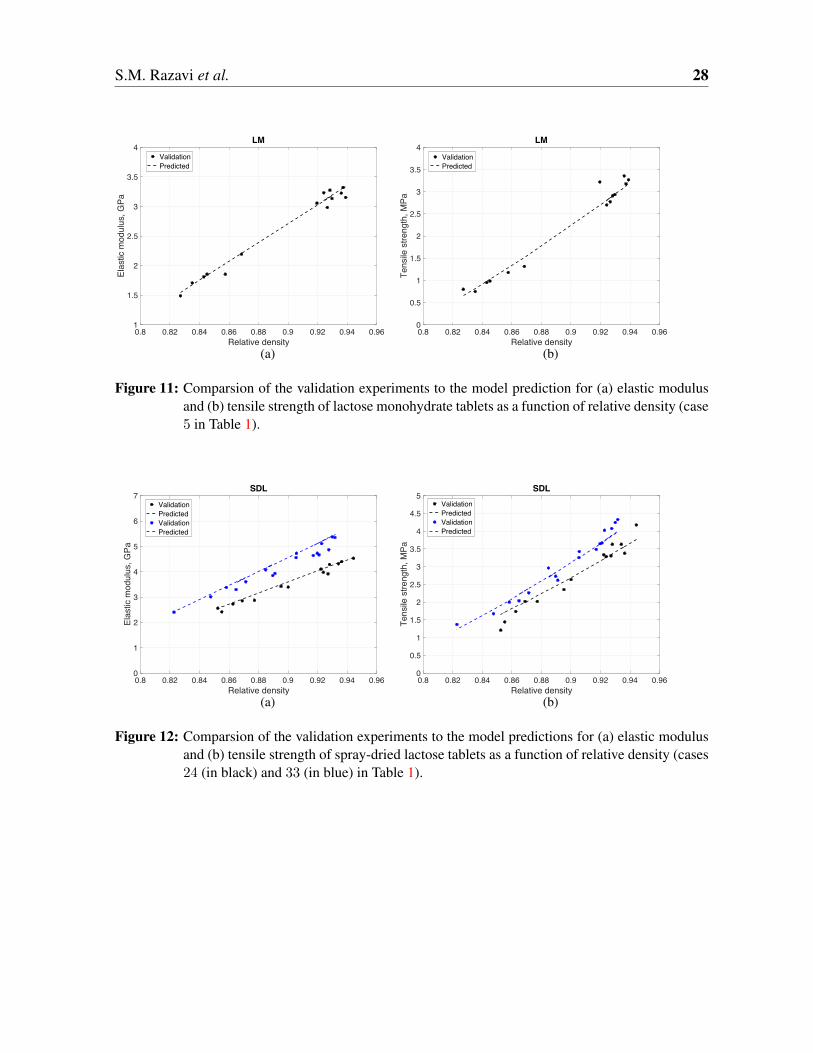
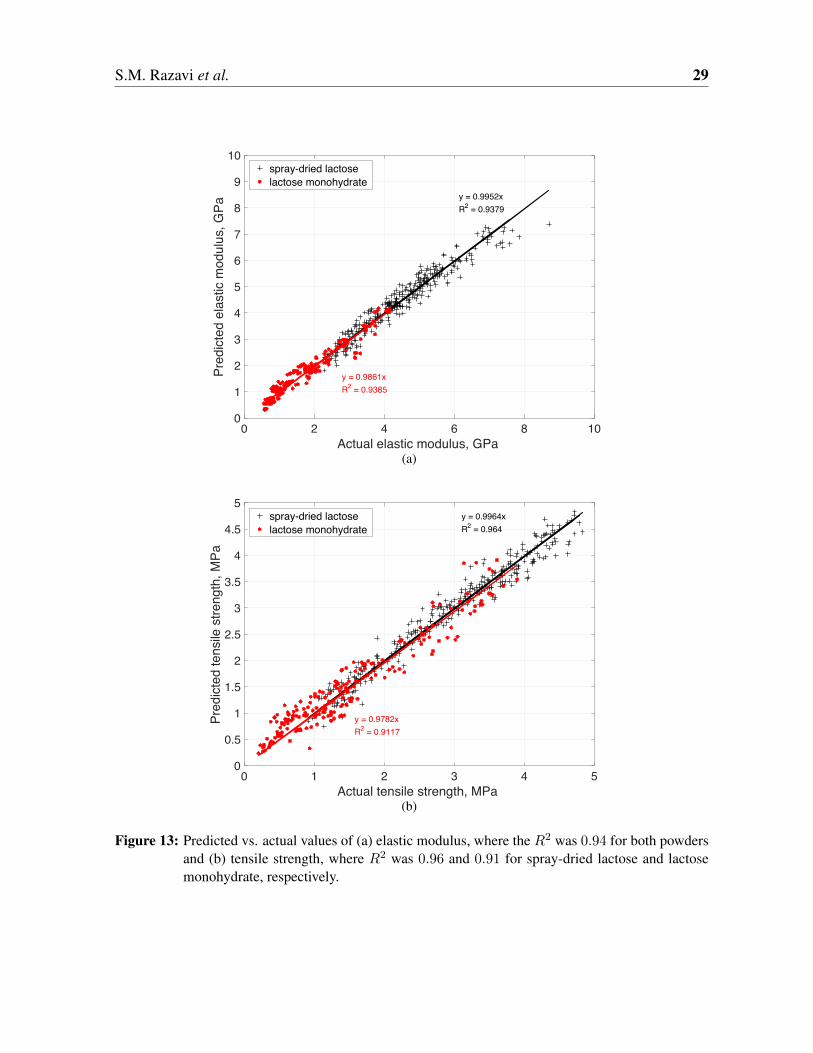
The groundwork of our model was to relate the variables that contribute to parameter C, toE0 and σ0. Figs. 9 and 10 demonstrate the functionality of the proposed relationship. Themodel fitted the data well for both materials. The validation points were in good agreementwith the predicted curves. It should be noted that our optimization problems were constructedto minimize the sum of squared residuals between the experimental and predicted values ofelastic modulus and tensile strength of tablets. Thereby, the fitting coefficients presented inTables 3 and 4 are not the optimal values for predicting E0 and σ0.Figs. 11 and 12 compare the validation measurements with model predictions for elastic mod-ulus and tensile strength of LM and SDL tablets, respectively (case 5 for LM and cases 24 and33 for SDL). The agreement between the validations and model predictions are very promis-ing.Figs. 13(a) and 13(b) show the relationship between actual (measured) and predicted elasticmodulus and tensile strength for all the LM and SDL tablets. Good correlations were observedbetween the predicted and actual values. For elastic modulus predictions, R2 of 0.94 for bothpowders was found and for tensile strength predictions R2 was 0.96 and 0.91 for SDL andLM, respectively.Overall, our proposed model can be successfully adopted to predict the mechanical strengthof tablets capturing the lubricant sensitivity and PSD effects. Contour plots of elastic modulus

S.M. Razavi et al. 11
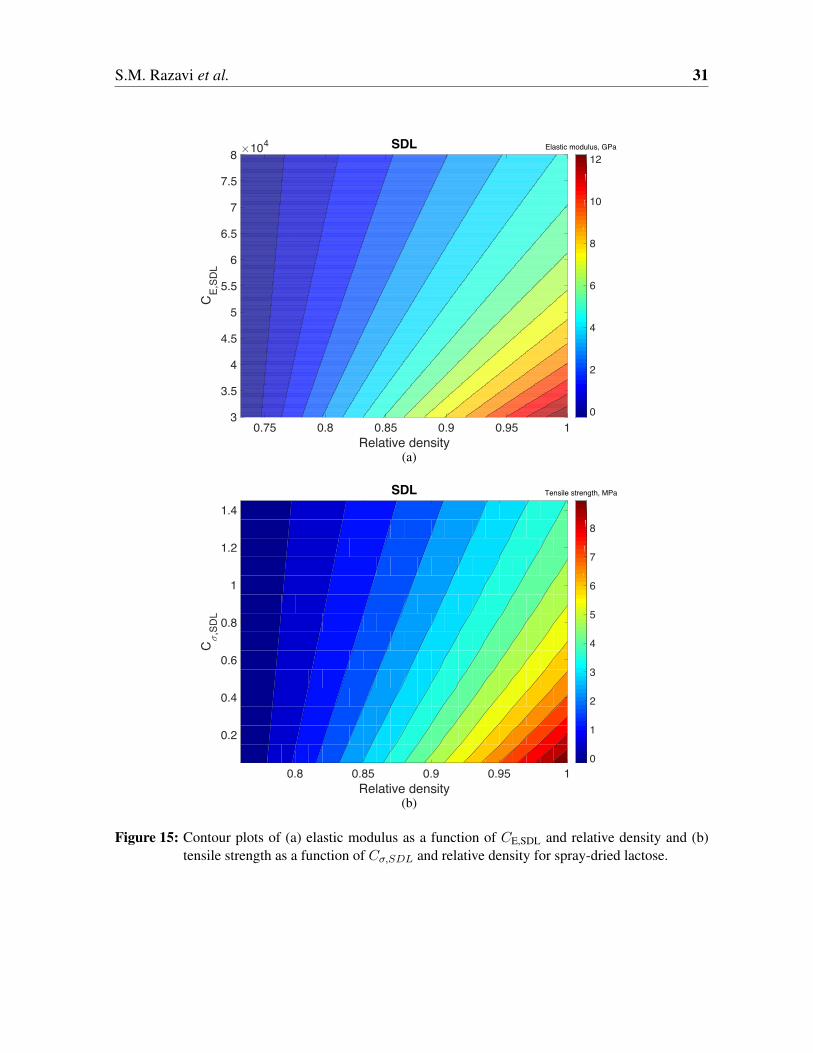
and tensile strength as a function of C and relative density for the materials studied are pre-sented in Figs. 14 and 15. Establishing such plots assist to scan through the design space andsystematically optimize the formulation and process. The model can be expanded to includeother blend properties or processing parameters effects.
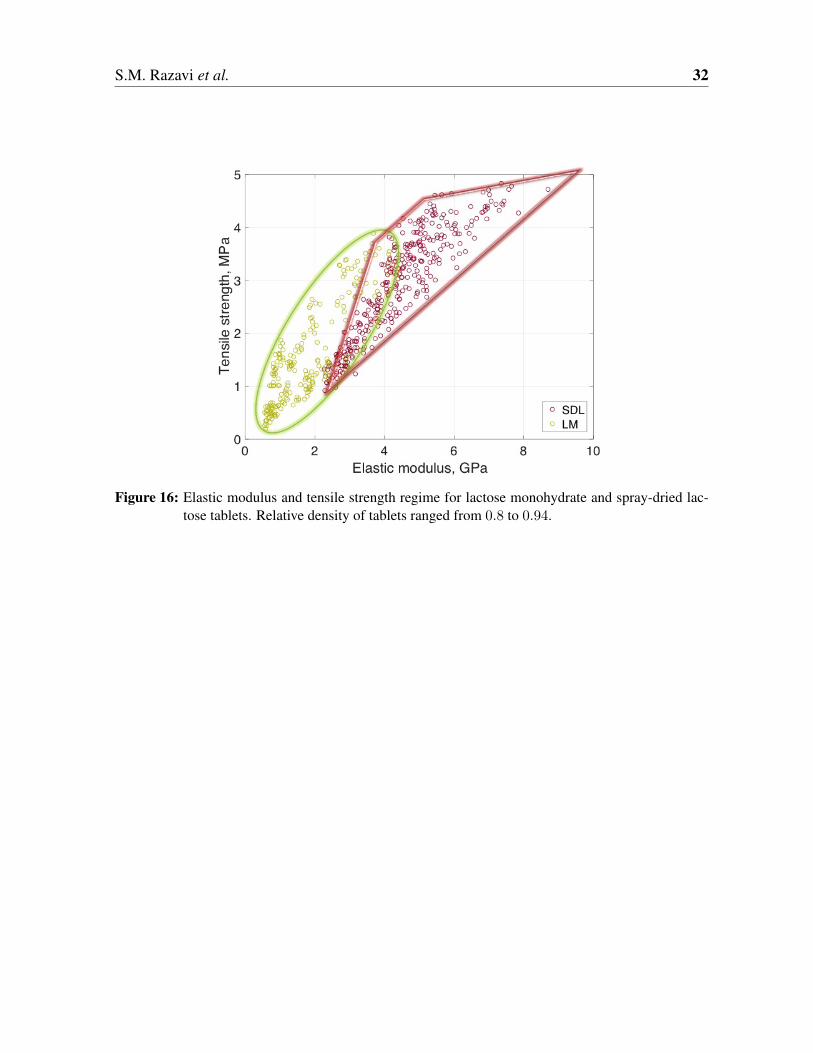
4 Summary and conclusionWe have proposed a general framework for predicting a wide range of elastic modulus and ten-sile strength that a specific powder can attain based on its lubricant sensitivity and consideringdifferent particle size distributions. This was possible by introducing a new dimensionlessparameter in the existing tensile strength and elastic modulus models of porous materials.Specifically, we propose that the elastic modulus and tensile strength at zero-porosity are afunction of MgSt concentration, mixing time and mean PSD, while the relative densities atzero tablet stiffness and strength are not. The model showed good predictability for two gradesof lactose, namely monohydrate and spray-dried grades. Possible avenues for extension of theproposed model is studying the applicability to powders that undergo different deformationmechanisms, the generalization to ternary or more complex mixtures, and the integration withoptimal relationships for tensile strength of doubly convex tablets (see, e.g., Razavi et al.(2015)). Establishing such predictive models helps drug formulators and manufacturers tooptimize lubricant concentration and mixing conditions according to the desired mechanicalstrength and stiffness of tablets.We have covered a wide, if not the widest reported in the literature, strength level of lactosemonohydrate and spray-dried lactose tablets with respect to particle size distributions andlubrication conditions. Fig. 16 depicts the tensile strength as a function of elastic modulusof all the lactose monohydrate and spray-dried lactose tablets tested in this study. The datapoints show a pattern with identifiable zones which provide the achievable design space, i.e.,an elliptic space for lactose monohydrate and a trapezoidal space for spray-dried lactose. For acertain formulation, mapping the achievable design space allows for optimizing the processingvariables for the desirable table mechanical properties.We close by discussing opportunities and future work. It is clear that the proposed nonlin-ear functions for the elastic modulus and tensile strength at zero-porosity are not the onlyfunctions of lubrication and particle size parameters that exhibit the experimentally observedbehavior. The systematic investigation of these functions is worthwhile directions of futureresearch. Furthermore, the elusidation of the mechanistic basis of these relationships and howlubrication conditions affect particle properties and solid brigde formation during compactionare desirable for fundamentaly understanding the achievable design space map. Thus, parti-cle mechanics simulations capable of describing strength formation and evolution during thecompaction process are desirable Gonzalez and Cuitino (2012, 2016); Yohannes et al. (2016,2017); Gonzalez (2017), if beyond the scope of this paper.
S.M. Razavi et al. 12
AcknowledgementsThe authors gratefully acknowledge the support received from the NSF ERC grant numberEEC-0540855, ERC for Structured Organic Particulate Systems. M.G. also acknowledgessupport from the NSF under grant number CMMI-1538861.
ReferencesAkseli, I., Hancock, B., and Cetinkaya, C. (2009). Non-destructive determination of
anisotropic mechanical properties of pharmaceutical solid dosage forms. International jour-nal of pharmaceutics, 377(1):35–44.
Alderborn, G. and Nystrom, C. (1982). Studies on direct compression of tablets. iv. the ef-fect of particle size on the mechanical strength of tablets. Acta Pharmaceutica Suecica,19(5):381.
Almaya, A. and Aburub, A. (2008). Effect of particle size on compaction of materialswith different deformation mechanisms with and without lubricants. AAPS PharmSciTech,9(2):414–418.
Asker, A., Saied, K., and Abdel-Khalek, M. (1975). Investigation of some materials as drybinders for direct compression in tablet manufacture. part 5: Effects of lubricants and flowconditions. Die Pharmazie, 30(6):378–382.
Bolhuis, G., Lerk, C., Zijlstra, H., and De Boer, A. (1975). Film formation by magnesiumstearate during mixing and its effect on tabletting. Pharm. Weekbl, 110:317–325.
Bolhuis, G. K. and Chowhan, Z. T. (1995). Materials for direct compaction. In PharmaceuticalPowder ComPattion Technology, pages 419–500. CRC Press.
Bossert, J. and Stains, A. (1980). Effect of mixing on the lubrication of crystalline lactose bymagnesium stearate. Drug Development and Industrial Pharmacy, 6(6):573–589.
Castellanos, A. (2005). The relationship between attractive interparticle forces and bulk be-haviour in dry and uncharged fine powders. Advances in Physics, 54(4):263–376.
Coffin-Beach, D. P. and Hollenbeck, R. G. (1983). Determination of the energy of tabletformation during compression of selected pharmaceutical powders. International journalof pharmaceutics, 17(2-3):313–324.
Dansereau, R. and Peck, G. E. (1987). The effect of the variability in the physical and chemicalproperties of magnesium stearate on the properties of compressed tablets. Drug Develop-ment and Industrial Pharmacy, 13(6):975–999.
De Boer, A., Bolhuis, G., and Lerk, C. (1978). Bonding characteristics by scanning electronmicroscopy of powders mixed with magnesium stearate. Powder Technology, 20(1):75–82.

S.M. Razavi et al. 13
De Boer, A., Vromans, H., Leur, C., Bolhuis, G., Kussendrager, K., and Bosch, H. (1986).Studies on tableting properties of lactose. Pharmacy World & Science, 8(2):145–150.
Doelker, E., Mordier, D., Iten, H., and Humbert-Droz, P. (1987). Comparative tableting prop-erties of sixteen microcrystalline celluloses. Drug Development and Industrial Pharmacy,13(9-11):1847–1875.
Faqih, A., Chaudhuri, B., Alexander, A. W., Davies, C., Muzzio, F. J., and Tomassone, M. S.(2006). An experimental/computational approach for examining unconfined cohesive pow-der flow. International journal of pharmaceutics, 324(2):116–127.
Faqih, A. M. N., Mehrotra, A., Hammond, S. V., and Muzzio, F. J. (2007). Effect of moistureand magnesium stearate concentration on flow properties of cohesive granular materials.International journal of pharmaceutics, 336(2):338–345.
Fell, J. and Newton, J. (1970). Determination of tablet strength by the diametral-compressiontest. Journal of Pharmaceutical Sciences, 59(5):688–691.
Gonzalez, M. (2017). Generalized loading-unloading contact laws for elasto-plastic sphereswith bonding strength. to be submitted.
Gonzalez, M. and Cuitino, A. M. (2012). A nonlocal contact formulation for confined granularsystems. Journal of the Mechanics and Physics of Solids, 60(2):333–350.
Gonzalez, M. and Cuitino, A. M. (2016). Microstructure evolution of compressible granularsystems under large deformations. Journal of the Mechanics and Physics of Solids, 93:44–56.
Hakulinen, M., Pajander, J., Leskinen, J., Ketolainen, J., van Veen, B., Niinimaki, K., Pirska-nen, K., Poso, A., and Lappalainen, R. (2008). Ultrasound transmission technique as apotential tool for physical evaluation of monolithic matrix tablets. AAPS PharmSciTech,9(1):267–273.
Hersey, J. A., Bayraktar, G., and Shotton, E. (1967). The effect of particle size on the strengthof sodium chloride tablets. The Journal of pharmacy and pharmacology, 19:Suppl–24S.
Hirai, Y. and Okada, J. (1982). Effect of lubricant on die wall friction during the compactionof pharmaceutical powders. Chemical and Pharmaceutical Bulletin, 30(2):684–694.
Hussain, M., York, P., Timmins, P., and Humphrey, P. (1990). Secondary ion mass spectrom-etry (sims) evaluation of magnesium stearate distribution and its effects on the physico-technical properties of sodium chloride tablets. Powder Technology, 60(1):39–45.
Jarosz, P. J. and Parrott, E. L. (1984). Effect of lubricants on tensile strengths of tablets. DrugDevelopment and Industrial Pharmacy, 10(2):259–273.
Johansson, M. E. (1984). Granular magnesium stearate as a lubricant in tablet formulations.International journal of pharmaceutics, 21(3):307–315.

S.M. Razavi et al. 14
Katikaneni, P., Upadrashta, S., Rowlings, C., Neau, S., and Hileman, G. (1995). Consolidationof ethylcellulose: effect of particle size, press speed, and lubricants. International journalof pharmaceutics, 117(1):13–21.
Kikuta, J.-I. and Kitamori, N. (1994). Effect of mixing time on the lubricating properties ofmagnesium stearate and the final characteristics of the compressed tablets. Drug develop-ment and industrial pharmacy, 20(3):343–355.
Kuentz, M. and Leuenberger, H. (2000). A new model for the hardness of a compacted particlesystem, applied to tablets of pharmaceutical polymers. Powder technology, 111(1):145–153.
Kushner, J. and Moore, F. (2010). Scale-up model describing the impact of lubrication ontablet tensile strength. International journal of pharmaceutics, 399(1):19–30.
Lachman, L., Lieberman, H. A., Kanig, J. L., et al. (1976). The theory and practice of indus-trial pharmacy. Lea & Febiger Philadelphia.
Lindberg, N. (1972). Evaluation of some tablet lubricants. Acta Pharmaceutica Suecica,9(3):207–214.
Llusa, M., Levin, M., Snee, R. D., and Muzzio, F. J. (2010). Measuring the hydrophobicity oflubricated blends of pharmaceutical excipients. Powder Technology, 198(1):101–107.
MATLAB (2016). version 9.0.0.341360 (R2016a). The MathWorks Inc., Natick, Mas-sachusetts.
McKenna, A. and McCafferty, D. (1982). Effect of particle size on the compaction mechanismand tensile strength of tablets. Journal of Pharmacy and Pharmacology, 34(6):347–351.
Mehrotra, A., Llusa, M., Faqih, A., Levin, M., and Muzzio, F. J. (2007). Influence of shear in-tensity and total shear on properties of blends and tablets of lactose and cellulose lubricatedwith magnesium stearate. International journal of pharmaceutics, 336(2):284–291.
Miller, T. and York, P. (1988). Pharmaceutical tablet lubrication. International journal ofpharmaceutics, 41(1-2):1–19.
Mitrevej, A., Sinchaipanid, N., and Faroongsarng, D. (1996). Spray-dried rice starch: compar-ative evaluation of direct compression fillers. Drug development and industrial pharmacy,22(7):587–594.
Mollan, M. J. and Celik, M. (1996). The effects of lubrication on the compaction and post-compaction properties of directly compressible maltodextrins. International journal ofpharmaceutics, 144(1):1–9.
Moody, G., Rubinstein, M., and FitzSimmons, R. (1981). Tablet lubricants I. theory andmodes of action. International Journal of Pharmaceutics, 9(2):75–80.
S.M. Razavi et al. 15
Narang, A. S., Rao, V. M., Guo, H., Lu, J., and Desai, D. S. (2010). Effect of force feeder ontablet strength during compression. International journal of pharmaceutics, 401(1):7–15.
Nystrom, C., Alderborn, G., Duberg, M., and Karehill, P.-G. (1993). Bonding surface area andbonding mechanism-two important factors fir the understanding of powder comparability.Drug development and industrial pharmacy, 19(17-18):2143–2196.
Osorio, J. G. and Muzzio, F. J. (2015). Evaluation of resonant acoustic mixing performance.Powder Technology.
Osorio, J. G., Sowrirajan, K., and Muzzio, F. J. (2016). Effect of resonant acoustic mixingon pharmaceutical powder blends and tablets. Advanced Powder Technology, 27(4):1141–1148.
Otsuka, M., Gao, J. I., and Matsuda, Y. (1993). Effects of mixer and mixing time on the phar-maceutical properties of theophylline tablets containing various kinds of lactose as diluents.Drug development and industrial pharmacy, 19(3):333–348.
Otsuka, M., Yamane, I., and Matsuda, Y. (2004). Effects of lubricant mixing on compressionproperties of various kinds of direct compression excipients and physical properties of thetablets. Advanced Powder Technology, 15(4):477–493.
Pawar, P., Joo, H., Callegari, G., Drazer, G., Cuitino, A. M., and Muzzio, F. J. (2016). Theeffect of mechanical strain on properties of lubricated tablets compacted at different pres-sures. Powder Technology, 301:657–664.
Podczeck, F. and Mia, Y. (1996). The influence of particle size and shape on the angle ofinternal friction and the flow factor of unlubricated and lubricated powders. InternationalJournal of Pharmaceutics, 144(2):187–194.
Ragnarsson, G. and Sjogren, J. (1985). Force-displacement measurements in tableting. Jour-nal of pharmacy and pharmacology, 37(3):145–150.
Razavi, S. M., Callegari, G., Drazer, G., and Cuitino, A. M. (2016). Toward predicting tensilestrength of pharmaceutical tablets by ultrasound measurement in continuous manufacturing.International journal of pharmaceutics, 507(1):83–89.
Razavi, S. M., Gonzalez, M., and Cuitino, A. M. (2015). General and mechanistic optimalrelationships for tensile strength of doubly convex tablets under diametrical compression.International Journal of Pharmaceutics.
Rhines, F. (1947). Seminar on pressing of metal powders. AIME Trans., 171:518–534.
Roberts, R. and Rowe, R. (1986). The effect of the relationship between punch velocity andparticle size on the compaction behaviour of materials with varying deformation mecha-nisms. Journal of pharmacy and pharmacology, 38(8):567–571.

S.M. Razavi et al. 16
Rossi, R. (1968). Prediction of the elastic moduli of composites. Journal of the AmericanCeramic Society, 51(8):433–440.
Shah, A. and Mlodozeniec, A. (1977). Mechanism of surface lubrication: Influence of durationof lubricant-excipient mixing on processing characteristics of powders and properties ofcompressed tablets. Journal of pharmaceutical sciences, 66(10):1377–1382.
Shangraw, R. and Demarest, D. (1993). A survey of current industrial practices in the formu-lation and manufacture of tablets and capsules. Pharmaceutical technology, 17(1):32–32.
Sheskey, P. J., Robb, R. T., Moore, R. D., and Boyce, B. M. (1995). Effects of lubricant level,method of mixing, and duration of mixing on a controlled-release matrix tablet containinghydroxypropyl methylcellulose. Drug development and industrial pharmacy, 21(19):2151–2165.
Shotton, E. and Ganderton, D. (1961). The strength of compressed tablets. Journal of Phar-macy and Pharmacology, 13(S1):144T–152T.
Van der Watt, J. (1987). The effect of the particle size of microcrystalline cellulose on tabletproperties in mixtures with magnesium stearate. International journal of pharmaceutics,36(1):51–54.
Velasco, V., Munoz-Ruiz, A., Monedero, C., and Jimenez-Castellanos, R. (1997). Force-displacement parameters of maltodextrins after the addition of lubricants. Internationaljournal of pharmaceutics, 152(1):111–120.
Vromans, H., De Boer, A., Bolhuis, G., Lerk, C., Kussendrager, K., and Bosch, H. (1985).Studies on tableting properties of lactose. Pharmacy World & Science, 7(5):186–193.
Wang, J., Wen, H., and Desai, D. (2010). Lubrication in tablet formulations. European Journalof Pharmaceutics and Biopharmaceutics, 75(1):1–15.
Yohannes, B., Gonzalez, M., Abebe, A., Sprockel, O., Nikfar, F., Kang, S., and Cuitino, A.(2015). The role of fine particles on compaction and tensile strength of pharmaceuticalpowders. Powder Technology, 274:372–378.
Yohannes, B., Gonzalez, M., Abebe, A., Sprockel, O., Nikfar, F., Kiang, S., and Cuitino, A.(2016). Evolution of the microstructure during the process of consolidation and bonding insoft granular solids. International journal of pharmaceutics, 503(1):68–77.
Yohannes, B., Gonzalez, M., Abebe, A., Sprockel, O., Nikfar, F., Kiang, S., and Cuitino, A.(2017). Discrete particle modeling and micromechanical characterization of bilayer tabletcompaction. International journal of pharmaceutics, 529(1-2):597–607.
Zuurman, K., Van der Voort Maarschalk, K., and Bolhuis, G. (1999). Effect of magnesiumstearate on bonding and porosity expansion of tablets produced from materials with differentconsolidation properties. International journal of pharmaceutics, 179(1):107–115.
S.M. Razavi et al. 17
0 50 100 150 200 250 300Diameter, µm
0
2
4
6
8
10
12
14
16
18
20
Volu
me,
%
0-75 µm75-106 µm106-150 µmas-received
(a)
0 50 100 150 200 250 300Diameter, µm
0
2
4
6
8
10
12
14
16
18
20
Volu
me,
%
0-75 µm75-106 µm106-150 µm150-212 µmas-received
(b)
Figure 1: Particle size distribution of (a) lactose monohydrate and (b) spray-dried lactose. Red linesshow the Gaussian fitting for each distribution.

S.M. Razavi et al. 18
0.6 0.7 0.8 0.9 1 1.1Relative density
0
50
100
150
200
250
300
350
400
450
Com
pact
ion
pres
sure
, MPa
as-received-0.25%MgSt-120secas-received-0.25%MgSt-1200secas-received-2%MgSt-1200sec
(a)
0.6 0.7 0.8 0.9 1 1.1Relative density
0
50
100
150
200
250
300
350
400
450
Com
pact
ion
pres
sure
, MPa
0-75-0.25%MgSt-120sec0-75-0.25%MgSt-1200sec0-75-2%MgSt-1200sec
(b)
0.6 0.7 0.8 0.9 1 1.1Relative density
0
50
100
150
200
250
300
350
400
450
Com
pact
ion
pres
sure
, MPa
75-106-0.25%MgSt-120sec75-106-0.25%MgSt-1200sec75-106-2%MgSt-1200sec
(c)
0.6 0.7 0.8 0.9 1 1.1Relative density
0
50
100
150
200
250
300
350
400
450C
ompa
ctio
n pr
essu
re, M
Pa106-150-0.25%MgSt-120sec106-150-0.25%MgSt-1200sec106-150-2%MgSt-1200sec
(d)
Figure 2: Lubrication effect on compaction pressure vs. in-die relative density of lactose monohydratefor different particle size distributions: (a) as-recieved, (b) 0-75 µm, (c) 75-106 µm, and (d)106-150 µm.
S.M. Razavi et al. 19
0.6 0.7 0.8 0.9 1 1.1Relative density
0
50
100
150
200
250
300
350
400
450C
ompa
ctio
n pr
essu
re, M
Pa0.25%MgSt-120sec
0-7575-106106-150as-received
(a)
0.6 0.7 0.8 0.9 1 1.1Relative density
0
50
100
150
200
250
300
350
400
450
Com
pact
ion
pres
sure
, MPa
0.25%MgSt-1200sec
0-7575-106106-150as-received
(b)
0.6 0.7 0.8 0.9 1 1.1Relative density
0
50
100
150
200
250
300
350
400
450
Com
pact
ion
pres
sure
, MPa
2%MgSt-1200sec
0-7575-106106-150as-received
(c)
Figure 3: Particle size effect on compaction pressure vs. in-die relative density of lactose monohydratefor different lubrication parameters: (a) 0.25%MgSt-120sec, (b) 0.25%MgSt-1200sec, and(c) 2%MgSt-1200sec.
S.M. Razavi et al. 20
0.5 0.6 0.7 0.8 0.9 1 1.1Relative density
0
50
100
150
200
250
300
350
400
450
Com
pact
ion
pres
sure
, MPa
as-received-0.25%MgSt-120secas-received-2%MgSt-1200sec
(a)
0.5 0.6 0.7 0.8 0.9 1 1.1Relative density
0
50
100
150
200
250
300
350
400
450
Com
pact
ion
pres
sure
, MPa
0.25%MgSt-120sec-SD0.25%MgSt-120sec-LM2%MgSt-1200-sec-SD2%MgSt-1200sec-LM
(b)
Figure 4: (a) Compaction pressure vs. in-die relative density for as-received spray-dried lactose. (b)Comparison of compaction curves of as-received lactose monohydrate and spray-dried lac-tose for two extreme lubrication conditions.

S.M. Razavi et al. 21
0.8 0.82 0.84 0.86 0.88 0.9 0.92 0.94 0.96Relative density
0
0.5
1
1.5
2
2.5
3
3.5
4
4.5
5El
astic
mod
ulus
, GPa
0.5%MgSt-30sec0.25%MgSt-120sec0.5%MgSt-120sec1%MgSt-120sec2%MgSt-120sec2%MgSt-300sec0.25%MgSt-1200sec0.25%MgSt-2400sec2%MgSt-1200sec
(a)
0.8 0.82 0.84 0.86 0.88 0.9 0.92 0.94 0.96Relative density
0
0.5
1
1.5
2
2.5
3
3.5
4
Tens
ile s
treng
th, M
Pa
0.5%MgSt-30sec0.25%MgSt-120sec0.5%MgSt-120sec1%MgSt-120sec2%MgSt-120sec2%MgSt-300sec0.25%MgSt-1200sec0.25%MgSt-2400sec2%MgSt-1200sec
(b)
0.82 0.84 0.86 0.88 0.9 0.92 0.94 0.96Relative density
0
0.5
1
1.5
2
2.5
3
3.5
4
4.5
5
Elas
tic m
odul
us, G
Pa
0.25%MgSt-120sec0.25%MgSt-1200sec2%MgSt-1200sec
(c)
0.82 0.84 0.86 0.88 0.9 0.92 0.94 0.96Relative density
0
0.5
1
1.5
2
2.5
3
3.5
4
Tens
ile s
treng
th, M
Pa
0.25%MgSt-120sec0.25%MgSt-1200sec2%MgSt-1200sec
(d)
0.82 0.84 0.86 0.88 0.9 0.92 0.94 0.96Relative density
0
0.5
1
1.5
2
2.5
3
3.5
4
4.5
5
Elas
tic m
odul
us, G
Pa
0.25%MgSt-120sec0.5%MgSt-120sec0.25%MgSt-1200sec2%MgSt-1200sec
(e)
0.82 0.84 0.86 0.88 0.9 0.92 0.94 0.96Relative density
0
0.5
1
1.5
2
2.5
3
3.5
4
Tens
ile s
treng
th, M
Pa
0.25%MgSt-120sec0.5%MgSt-120sec0.25%MgSt-1200sec2%MgSt-1200sec
(f)
0.82 0.84 0.86 0.88 0.9 0.92 0.94 0.96Relative density
0
0.5
1
1.5
2
2.5
3
3.5
4
4.5
5
Elas
tic m
odul
us, G
Pa
0.25%MgSt-120sec0.25%MgSt-1200sec2%MgSt-1200sec
(g)
0.82 0.84 0.86 0.88 0.9 0.92 0.94 0.96Relative density
0
0.5
1
1.5
2
2.5
3
3.5
4
Tens
ile s
treng
th, M
Pa
0.25%MgSt-120sec0.25%MgSt-1200sec2%MgSt-1200sec
(h)
Figure 5: Elastic modulus and tensile strength vs. out-of-die relative density for different PSDs oflactose monohydrate; (a, b) 0-75 µm, (c, d) 75-106 µm, (e, f) 106-150 µm, and (g, h) as-received.

S.M. Razavi et al. 22
0.82 0.84 0.86 0.88 0.9 0.92 0.94 0.96Relative density
0
1
2
3
4
5
Elas
tic m
odul
us, G
Pa
0.25%MgSt-2min0-7575-106106-150as-received
(a)
0.82 0.84 0.86 0.88 0.9 0.92 0.94 0.96Relative density
0
0.5
1
1.5
2
2.5
3
3.5
4
Tens
ile s
treng
th, M
Pa
0.25%MgSt-2min0-7575-106106-150as-received
(b)
0.82 0.84 0.86 0.88 0.9 0.92 0.94 0.96Relative density
0
1
2
3
4
5
Elas
tic m
odul
us, G
Pa
0.25%MgSt-20min0-7575-106106-150as-received
(c)
0.82 0.84 0.86 0.88 0.9 0.92 0.94 0.96Relative density
0
0.5
1
1.5
2
2.5
3
3.5
4Te
nsile
stre
ngth
, MPa
0.25%MgSt-20min0-7575-106106-150as-received
(d)
0.82 0.84 0.86 0.88 0.9 0.92 0.94 0.96Relative density
0
1
2
3
4
5
Elas
tic m
odul
us, G
Pa
2%MgSt-20min0-7575-106106-150as-received
(e)
0.82 0.84 0.86 0.88 0.9 0.92 0.94 0.96Relative density
0
0.5
1
1.5
2
2.5
3
3.5
4
Tens
ile s
treng
th, M
Pa
2%MgSt-20min0-7575-106106-150as-received
(f)
Figure 6: Partile size effect on elastic modulus and tensile strength of lactose monohydrate tablets atdifferent lubrication conditions (a, b) 0.25%MgSt-2min, (c, d) 0.25%MgSt-20min, and (e, f)2%MgSt-20min.

S.M. Razavi et al. 23
0.8 0.82 0.84 0.86 0.88 0.9 0.92 0.94 0.96Relative density
0
1
2
3
4
5
6
7
8
9
Elas
tic m
odul
us, G
Pa
0.5%MgSt-30sec2%MgSt-30sec1%MgSt-120sec0.5%MgSt-600sec2%MgSt-600sec2%MgSt-1200sec
(a)
0.8 0.82 0.84 0.86 0.88 0.9 0.92 0.94 0.96Relative density
0
0.5
1
1.5
2
2.5
3
3.5
4
4.5
5
Tens
ile s
treng
th, M
Pa
0.5%MgSt-30sec2%MgSt-30sec1%MgSt-120sec0.5%MgSt-600sec2%MgSt-600sec2%MgSt-1200sec
(b)
0.8 0.82 0.84 0.86 0.88 0.9 0.92 0.94 0.96Relative density
0
1
2
3
4
5
6
7
8
9
Elas
tic m
odul
us, G
Pa
1%MgSt-30sec0.5%MgSt-120sec2%MgSt-120sec1%MgSt-600sec
(c)
0.8 0.82 0.84 0.86 0.88 0.9 0.92 0.94 0.96Relative density
0
0.5
1
1.5
2
2.5
3
3.5
4
4.5
5Te
nsile
stre
ngth
, MPa
1%MgSt-30sec0.5%MgSt-120sec2%MgSt-120sec1%MgSt-600sec
(d)
0.8 0.82 0.84 0.86 0.88 0.9 0.92 0.94 0.96Relative density
0
1
2
3
4
5
6
7
8
9
Elas
tic m
odul
us, G
Pa
0.5%MgSt-30sec2%MgSt-30sec1%MgSt-120sec0.5%MgSt-600sec2%MgSt-600sec2%MgSt-1200sec
(e)
0.8 0.82 0.84 0.86 0.88 0.9 0.92 0.94 0.96Relative density
0
0.5
1
1.5
2
2.5
3
3.5
4
4.5
5
Tens
ile s
treng
th, M
Pa
0.5%MgSt-30sec2%MgSt-30sec1%MgSt-120sec0.5%MgSt-600sec2%MgSt-600sec2%MgSt-1200sec
(f)
Figure 7: Elastic modulus and tensile strength vs. out-of-die relative density for different particle sizedistributions of spray-dried lactose; (a,b) 0-75 µm, (c,d) 75-106 µm, (e,f) 106-150 µm, (g,h)150-212 µm, and (i,j) as-received.
S.M. Razavi et al. 24
0.8 0.82 0.84 0.86 0.88 0.9 0.92 0.94 0.96Relative density
0
1
2
3
4
5
6
7
8
9
Elas
tic m
odul
us, G
Pa
0.5%MgSt-30sec2%MgSt-30sec1%MgSt-120sec0.5%MgSt-600sec2%MgSt-600sec
(g)
0.8 0.82 0.84 0.86 0.88 0.9 0.92 0.94 0.96Relative density
0
0.5
1
1.5
2
2.5
3
3.5
4
4.5
5
Tens
ile s
treng
th, M
Pa
0.5%MgSt-30sec2%MgSt-30sec1%MgSt-120sec0.5%MgSt-600sec2%MgSt-600sec
(h)
0.8 0.82 0.84 0.86 0.88 0.9 0.92 0.94 0.96Relative density
0
1
2
3
4
5
6
7
8
9
Elas
tic m
odul
us, G
Pa
0.25%MgSt-120sec2%MgSt-1200sec
(i)
0.8 0.82 0.84 0.86 0.88 0.9 0.92 0.94 0.96Relative density
0
0.5
1
1.5
2
2.5
3
3.5
4
4.5
5Te
nsile
stre
ngth
, MPa
0.25%MgSt-120sec2%MgSt-1200sec
(j)
Figure (7 Cont.): Elastic modulus and tensile strength vs. out-of-die relative density for different par-ticle size distributions of spray-dried lactose; (a,b) 0-75 µm, (c,d) 75-106 µm, (e,f)106-150 µm, (g,h) 150-212 µm, and (i,j) as-received.

S.M. Razavi et al. 25
0.8 0.82 0.84 0.86 0.88 0.9 0.92 0.94 0.96Relative density
0
1
2
3
4
5
6
7
8
9
Elas
tic m
odul
us, G
Pa
0.5%MgSt-30sec0-75106-150150-212
(a)
0.8 0.82 0.84 0.86 0.88 0.9 0.92 0.94 0.96Relative density
0
1
2
3
4
5
Tens
ile s
treng
th, M
Pa
0.5%MgSt-30sec0-75106-150150-212
(b)
0.8 0.82 0.84 0.86 0.88 0.9 0.92 0.94 0.96Relative density
0
1
2
3
4
5
6
7
8
9
Elas
tic m
odul
us, G
Pa
1%MgSt-2min0-75106-150150-212
(c)
0.8 0.82 0.84 0.86 0.88 0.9 0.92 0.94 0.96Relative density
0
1
2
3
4
5
Tens
ile s
treng
th, M
Pa
1%MgSt-2min0-75106-150150-212
(d)
0.8 0.82 0.84 0.86 0.88 0.9 0.92 0.94 0.96Relative density
0
1
2
3
4
5
6
7
8
9
Elas
tic m
odul
us, G
Pa
2%MgSt-20min0-75106-150as-received
(e)
0.8 0.82 0.84 0.86 0.88 0.9 0.92 0.94 0.96Relative density
0
1
2
3
4
5
Tens
ile s
treng
th, M
Pa
2%MgSt-20min0-75106-150as-received
(f)
Figure 8: Particle size effect on elastic modulus and tensile strength of spray-dried lactose tablets atdifferent lubrication conditions (a, b) 0.5%MgSt-30sec, (c, d) 1%MgSt-2min, and (e, f)2%MgSt-20min.
S.M. Razavi et al. 26
0 5 10 15 20 25 30 35CE,LM
0
1
2
3
4
5
6
7
E 0, GPa
LMMeasuredPredictedValidation
(a)
0 2 4 6 8 10 12 14Cσ,LM
0
1
2
3
4
5
6
7
8
σ0, M
Pa
LMMeasuredPredictedValidation
(b)
Figure 9: The measured and predicted values of E0 and σ0 as a function of parameter “C” for lactosemonohydrate. A validation point, in blue, is also provided.
S.M. Razavi et al. 27
4 4.5 5 5.5 6 6.5 7 7.5CE,SDL ×104
5
6
7
8
9
10
11
E 0, GPa
SDLMeasuredPredictedValidation
(a)
0.3 0.4 0.5 0.6 0.7 0.8 0.9 1 1.1Cσ,SDL
4.5
5
5.5
6
6.5
7
7.5
σ0, M
Pa
SDLMeasuredPredictedValidation
(b)
Figure 10: The measured and predicted values of E0 and σ0 as a function of parameter “C” for spray-dried lactose. Two validation points, in blue, are provided.
S.M. Razavi et al. 28
0.8 0.82 0.84 0.86 0.88 0.9 0.92 0.94 0.96Relative density
1
1.5
2
2.5
3
3.5
4
Elas
tic m
odul
us, G
Pa
LM
ValidationPredicted
(a)
0.8 0.82 0.84 0.86 0.88 0.9 0.92 0.94 0.96Relative density
0
0.5
1
1.5
2
2.5
3
3.5
4
Tens
ile s
treng
th, M
Pa
LM
ValidationPredicted
(b)
Figure 11: Comparsion of the validation experiments to the model prediction for (a) elastic modulusand (b) tensile strength of lactose monohydrate tablets as a function of relative density (case5 in Table 1).
0.8 0.82 0.84 0.86 0.88 0.9 0.92 0.94 0.96Relative density
0
1
2
3
4
5
6
7
Elas
tic m
odul
us, G
Pa
SDL
ValidationPredictedValidationPredicted
(a)
0.8 0.82 0.84 0.86 0.88 0.9 0.92 0.94 0.96Relative density
0
0.5
1
1.5
2
2.5
3
3.5
4
4.5
5
Tens
ile s
treng
th, M
Pa
SDLValidationPredictedValidationPredicted
(b)
Figure 12: Comparsion of the validation experiments to the model predictions for (a) elastic modulusand (b) tensile strength of spray-dried lactose tablets as a function of relative density (cases24 (in black) and 33 (in blue) in Table 1).
S.M. Razavi et al. 29
0 2 4 6 8 10Actual elastic modulus, GPa
0
1
2
3
4
5
6
7
8
9
10
Pred
icte
d el
astic
mod
ulus
, GPa
spray-dried lactoselactose monohydrate
y = 0.9952xR2 = 0.9379
y = 0.9861xR2 = 0.9385
(a)
0 1 2 3 4 5Actual tensile strength, MPa
0
0.5
1
1.5
2
2.5
3
3.5
4
4.5
5
Pred
icte
d te
nsile
stre
ngth
, MPa
spray-dried lactoselactose monohydrate
y = 0.9782xR2 = 0.9117
y = 0.9964xR2 = 0.964
(b)
Figure 13: Predicted vs. actual values of (a) elastic modulus, where the R2 was 0.94 for both powdersand (b) tensile strength, where R2 was 0.96 and 0.91 for spray-dried lactose and lactosemonohydrate, respectively.

S.M. Razavi et al. 30
LM
0.75 0.8 0.85 0.9 0.95 1Relative density
5
10
15
20
25
30
35
40
45
CE,
LM
0
1
2
3
4
5
6
Elastic modulus, GPa
(a)
LM
0.8 0.85 0.9 0.95 1Relative density
2
4
6
8
10
12
Cσ
,LM
0
1
2
3
4
5
6
Tensile strength, MPa
(b)
Figure 14: Contour plots of (a) elastic modulus as a function of CE,LM and relative density and (b)tensile strength as a function of Cσ,LM and relative density for lactose monohydrate.
S.M. Razavi et al. 31
SDL
0.75 0.8 0.85 0.9 0.95 1Relative density
3
3.5
4
4.5
5
5.5
6
6.5
7
7.5
8
CE,
SDL
×104
0
2
4
6
8
10
12Elastic modulus, GPa
(a)
SDL
0.8 0.85 0.9 0.95 1Relative density
0.2
0.4
0.6
0.8
1
1.2
1.4
Cσ
,SD
L
0
1
2
3
4
5
6
7
8
Tensile strength, MPa
(b)
Figure 15: Contour plots of (a) elastic modulus as a function of CE,SDL and relative density and (b)tensile strength as a function of Cσ,SDL and relative density for spray-dried lactose.
S.M. Razavi et al. 32
Figure 16: Elastic modulus and tensile strength regime for lactose monohydrate and spray-dried lac-tose tablets. Relative density of tablets ranged from 0.8 to 0.94.

S.M. Razavi et al. 33
Table 1: Mean (µ) and standard deviation (σ) for each particle size distribution, MgSt concentration(Cl), and the mixing time (tm) for all the cases studied.
Powder Cases PSD (µm) µ (µm) σ (µm) cl (%) tm (sec)Lactose monohydrate 1 0-75 62.83 22.87 0.5 30
2 0-75 62.83 22.87 0.25 1203 0-75 62.83 22.87 0.5 1204 0-75 62.83 22.87 1 1205 0-75 62.83 22.87 2 1206 0-75 62.83 22.87 2 3007 0-75 62.83 22.87 0.25 12008 0-75 62.83 22.87 0.25 24009 0-75 62.83 22.87 2 1200
10 75-106 114 26.89 0.25 12011 75-106 114 26.89 0.25 120012 75-106 114 26.89 2 1200
13 106-150 149.3 25.6 0.25 12014 106-150 149.3 25.6 0.5 12015 106-150 149.3 25.6 0.25 120016 106-150 149.3 25.6 2 1200
17 as-received 77.72 31.85 0.25 12018 as-received 77.72 31.85 0.25 120019 as-received 77.72 31.85 2 1200
Spray-dried lactose 20 0-75 65.14 17.15 0.5 3021 0-75 65.14 17.15 2 3022 0-75 65.14 17.15 1 12023 0-75 65.14 17.15 0.5 60024 0-75 65.14 17.15 2 60025 0-75 65.14 17.15 2 1200
26 75-106 89.39 17.74 1 3027 75-106 89.39 17.74 0.5 12028 75-106 89.39 17.74 2 12029 75-106 89.39 17.74 1 600
30 106-150 120.9 27.04 0.5 3031 106-150 120.9 27.04 2 3032 106-150 120.9 27.04 1 12033 106-150 120.9 27.04 0.5 60034 106-150 120.9 27.04 2 60035 106-150 120.9 27.04 2 1200
36 150-212 171.9 33.91 0.5 3037 150-212 171.9 33.91 2 3038 150-212 171.9 33.91 1 12039 150-212 171.9 33.91 0.5 60040 150-212 171.9 33.91 2 600
41 as-received 128.3 39.5 0.25 12042 as-received 128.3 39.5 2 1200

S.M. Razavi et al. 34
Table 2: Tensile strength at zero porosity (σ0), critical relative density (ρc,σt), elastic modulus at zeroporosity (E0), and critical relative density (ρc,E) together with theirR2 values for all the cases.
Powder Cases σ0 (MPa) ρc,σt (%) R2(%) E0 (GPa) ρc,E (%) R2(%)
Lactose monohydrate 1 5.6 76.16 98.07 6.47 72.93 96.302 5.36 77.27 98.57 5.4 71.29 97.623 6.19 78.07 98.18 5.77 73.7 94.704 5.64 79.61 98.90 4.86 74.42 98.635 4.99 79.7 97.34 4.28 73.14 98.146 4.21 82.47 99.47 3.69 75.3 95.327 4.92 80.08 98.28 4.52 75.12 97.188 3.31 81.26 96.98 2.4 75.68 98.379 3.79 82.9 98.45 2.73 76.68 96.3
10 4.18 82.13 98.40 2.69 76.82 96.3811 2.81 81.9 99.11 1.36 68.71 96.2612 1.78 83.72 99.42 1.06 70.27 52.66
13 3.3 82.78 99.35 1.36 69.58 93.1314 2.47 82.34 97.24 1.16 72.02 96.7315 2.26 81.22 97.83 1.01 61.14 97.3116 1.45 84.28 98.03 - - -
17 6.01 81.05 99.03 4.07 74.52 96.6018 3.02 83.38 97.84 2 75.6 98.0519 2.62 85.1 96.90 1.84 78.37 93.57
Spray-dried lactose 20 6.91 74.65 96.21 9.8 72.78 96.5121 6.49 77.13 96.37 7.23 74.09 95.8722 6.56 76.89 95.70 7.29 72.45 97.2123 6.23 76.76 95.84 6.85 73.55 96.9724 5.7 79.32 97.42 5.76 74.42 98.3325 5.58 79.22 98.46 5.48 70.42 96.24
26 6.15 75.09 95.24 8.74 72.71 97.4527 6.49 76.39 94.93 7.98 74.2 97.0328 5.39 76.86 94.93 6.7 74.06 97.1929 5.67 76.87 97.79 6.54 72.75 97.32
30 6.71 75.2 96.60 10.66 76.53 96.1831 5.6 76.17 94.68 7.5 72.96 96.6732 5.97 76.19 98.73 6.85 73.25 96.7633 6.42 77.87 96.75 6.94 73.27 96.1534 5.13 77.73 96.52 5.57 72.62 97.0735 4.77 77.87 99.22 5.39 71.23 98.72
36 6.47 75.51 99.62 9.43 74.48 96.4437 5.66 76.74 98.25 7.65 73.37 96.3338 6.44 79.05 98.52 7.37 74.81 97.5039 6.29 77.22 96.61 8.27 74.77 97.7740 4.95 76.83 98.84 6.31 71.99 96.65
41 6.91 76.36 99.54 9.47 73.97 99.3042 4.63 78.08 99.53 5.3 71.68 98.06

S.M. Razavi et al. 35
Table 3: Optimal coefficients and their residual error of elastic modulus optimization problem for lac-tose monohydrate and spray-dried lactose.
Powder E0,∅ (GPa) b1 b2 b3 b4 ρc,E E-normLactose monohydrate 28.1221 0.1491 0.2645 1.7082 841.377 0.7316 3.31Spray-dried lactose 390932.897 0.1654 0.0859 -0.0179 0.0000266 0.7354 5.529
Table 4: Optimal coefficients and their residual error of tensile strength optimization problem for lac-tose monohydrate and spray-dried lactose.
Powder σ0,∅ (MPa) d1 d2 d3 d4 ρc,σt σ-normLactose monohydrate 14.9186 0.1982 0.301 1.2984 498.924 0.7924 3.739Spray-dried lactose 10.0276 0.3342 0.1237 0.2154 7.5374 0.7653 3.31
Related Documents