- 1 - Quantifying thresholds for native vegetation to salinity and waterlogging for the design of direct conservation approaches Tara Kathleen Horsnell This thesis is presented for the degree of Master of Engineering Science At The University of Western Australia School of Environmental Systems Engineering 2008

Welcome message from author
This document is posted to help you gain knowledge. Please leave a comment to let me know what you think about it! Share it to your friends and learn new things together.
Transcript
- 1 -
Quantifying thresholds for native vegetation to salinity and waterlogging
for the design of direct conservation approaches
Tara Kathleen Horsnell
This thesis is presented for the degree of Master of Engineering Science
At The University of Western Australia
School of Environmental Systems Engineering
2008

2

Statement of Contribution
Horsnzll, *P,K,, Reynolds, D. A., Smertcm, K.R.. Mattiske, E. submitted 2008. Composition and relative health of remnant vegetation fringing lakes along a salinity and waterlogging grad icnt. Subrni tred to IYeilund.~ Ecology ~ n d Managemenr 2008
I-iorsnell, 'l'.K., Reynolds, D.A. , Smettem, K.K., Hydroperiod lhresholds Car the fringing vegetation of playa lakes in south-wesl Ausiralia. In prep.
On both papers 1 cantributed 10 85% o f the work including f eld work. data anuiysis and writing.
'l'ara K. Hotsnell coordlneting supervisor
12/02 ' O H TlTE 1 2 i . 7 6 [TI/RS NO 79891 m 0 0 1
- -- -- - - - - . .. -. -..
wu
Highlight
wu
Text Box
wu
Text Box


3
Abstract
A field-based project was undertaken to develop and test a mechanism which would allow
for the correlation of the health of vegetation surrounding playa lakes in south-west
Australia with the natural variation in salinity and waterlogging that occurs spatially and
temporally in natural systems.
The study was designed to determine threshold ranges of vegetation communities using
moderately extensive data over short temporal periods which will guide the design of
potential engineering solutions that manipulate hydrological regimes to ultimately conserve
and protect native vegetation.
A pair of playa lake ecosystems, surrounded by primary production land, was modelled with
hydro-geological data collected from March 2006 to March 2007. The data was used to
determine the hydroperiods of vegetation communities fringing playa lakes and provide
insight into the areas and species that are most affected by extreme rainfall events which are
hypothesised to have a significant, rapid deleterious effect on the ecosystems.
The methodology was multi-faceted and included;
• a detailed topographical survey;
• vegetation surveys;
• hydrological and hydro-geological monitoring over a 12 month period.
4
The hydro-geological data and vegetation data was linked with the topographical survey at a
high resolution for spatial analysis in a Geographic Information System (GIS) to determine
the degree of waterlogging experienced by vegetation communities over the monitoring
period.
The study has found that the spatial and temporal variability of hydroperiods has been
reduced by rising groundwater levels, a result of extensive clearing of native vegetation.
Consequently populations are becoming extinct locally resulting in a shift in community
composition. Extreme summer rainfall events also have a significant impact on the health
of vegetation communities by increasing the duration of waterlogging over an annual cycle
and in some areas expanding the littoral zone.
Vegetation is most degraded at lower positions in the landscape where communities are
becoming less diverse and dominated by salt tolerant halophytic species as a result of
altered hydrological regimes. Some species appear to be able to tolerate groundwater
depths of less than 2.0 m from the surface, however there are thresholds related to the
duration at which groundwater is maintained at this depth.
Potential engineering solutions include groundwater pumping and diverting water through
drains to maintain sustainable hydroperiods for vegetation in areas with conservation value.
The effectiveness and efficiency of the engineering solutions can be maximised by
quantifying thresholds for vegetation that include sustainable durations of waterlogging.
The study has quantified tolerance ranges to salinity and waterlogging with data collected
over 12 months but species may be experiencing a transition period where they have

5
sustained irreversible damage that will result in their eventual mortality. With long-term
monitoring, the methodology developed and tested in the study can be used to quantify the
long-term tolerance ranges that are important for the application of conservation approaches
that include engineering solutions.

6

7
Dedication
To my late grandfather Laurrence, for his love, support and enthusiasm.

8

9
Table of Contents
ABSTRACT...........................................................................................................................................3
DEDICATION.......................................................................................................................................7
ACKNOWLEDGEMENTS ...............................................................................................................13
LIST OF FIGURES ............................................................................................................................15
LIST OF TABLES ..............................................................................................................................17
CHAPTER 1. INTRODUCTION ......................................................................................................19
1.1 Research Objective................................................................................................... 24 1.2 Background Information .......................................................................................... 25 1.3 References ................................................................................................................ 32
CHAPTER 2. LITERATURE REVIEW..........................................................................................37
2.1 Remnant vegetation in south-western Australia....................................................... 37 2.2 Altered hydrological regimes ................................................................................... 39 2.3 Extent of salinity and waterlogging.......................................................................... 40 2.4 Indirect versus Direct Conservation of Remnant vegetation.................................... 40 2.5 Research into the tolerance of native vegetation to salinity and waterlogging ........ 44 2.6 Experimental Design and Limitations ...................................................................... 46 2.7 Interspecific variation............................................................................................... 51 2.8 Intraspecific variation............................................................................................... 53 2.9 Tolerance of Eucalyptus species to salinity and waterlogging................................. 54 2.10 Tolerance of Melaleuca species to salinity and waterlogging................................ 55 2.11 Tolerance of Acacia species to salinity and waterlogging ..................................... 56 2.12 Tolerance of Casuarina species to salinity and waterlogging................................ 57 2.13 Conclusion.............................................................................................................. 59 2.14 References .............................................................................................................. 60
10
CHAPTER 3. COMPOSITION AND RELATIVE HEALTH OF REMNANT
VEGETATION FRINGING LAKES ALONG A SALINITY AND
WATERLOGGING GRADIENT..................................................................................................... 69
Abstract ..............................................................................................................................71 3.1 Introduction ...............................................................................................................73 3.1 Site Characteristics and Methodology.......................................................................76 Trends in groundwater levels since clearing......................................................................76 Vegetation surveys.............................................................................................................77 Hydrogeology and Salinity ................................................................................................80 3.2 Results .......................................................................................................................82 Hydrology ..........................................................................................................................82 Salinity ...............................................................................................................................86 Vegetation ..........................................................................................................................88 Health of classes ................................................................................................................90 Health of melaleucas, eucalypts and halosarcias ...............................................................97 3.3 Conclusions ...............................................................................................................98 3.4 References ...............................................................................................................100
CHAPTER 4. HYDROPERIOD THRESHOLDS FOR THE FRINGING
VEGETATION OF PLAYA LAKES IN SOUTH-WEST AUSTRALIA ................................... 107
4.1 Introduction .............................................................................................................109 4.2 Material and Methods..............................................................................................115 4.3 Results .....................................................................................................................119 Groundwater ....................................................................................................................119 Rainfall.............................................................................................................................120 Salinity .............................................................................................................................121 Vegetation ........................................................................................................................122 4.4 Discussion and Conclusion .....................................................................................134 4.5 References ...............................................................................................................137
CHAPTER 5. GENERAL DISCUSSION & CONCLUSIONS.................................................... 143
5.1 References ...............................................................................................................147
11
APPENDIX A - SPECIES LIST AND CLASSIFICATION
APPENDIX B – VEGETATION TRANSECT COORDINATES
APPENDIX C - GROUNDWATER AVERAGE, MAXIMUM AND MINIMUM FOR
CLASSES OF VEGETATION IN THE ONLINE AND OFFLINE SYSTEM
APPENDIX D –DAILY AVERAGE GROUNDWATER DEPTHS
APPENDIX E - DAILY AVERAGE GROUNDWATER DEPTHS (M BELOW THE
SURFACE) FOR OFFLINE WELLS
APPENDIX F – DAILY AVERAGE (M) SURFACE WATER DEPTHS

12

13
Acknowledgements
Firstly I would like to thank my supervisors Dr. David Reynolds and Professor Keith
Smettem for their invaluable guidance and support. Their technical expertise and advice are
greatly appreciated. I am indebted to Dr. Elizabeth Mattiske and her staff for field
assistance, taxonomy, experimental design and analytical ideas.
Field work was a major component of this project and I am grateful to a number of people
who have assisted in field projects including Tilo Massenbauer, Daniel Winton, Nikki
Cowcher and Emily Palmquist from the Department of Environment and Conservation and
Dr. David Reynolds and Dr. Katie Hill from SESE. A special thanks to Daniel and Emily
from the Department of Environment and Conservation in Esperance for their perseverance
and dedication to the regular maintenance and monitoring of equipment.
Thanks to the Bureau of Meteorology for providing me with long-term rainfall datasets for
the Esperance region.
Special thanks to my friends and colleagues from SESE especially Dyah, Katie, Ming and
Saskia for sharing ideas and making my research more enjoyable. Thanks also to the staff
at the School of Environmental Systems Engineering for providing a stimulating work
environment.

14
I gratefully acknowledge the scholarship provided by the Water Corporation and a
supplementary stipend from the Centre for Groundwater Studies. Thanks to the Department
of Conservation and Environment for providing logistic support and funding for field work.
Thanks to all my friends for their support over the years. Finally, I would like to thank my
family for their unwavering support and encouragement throughout my studies.
15
List of figures
Figure 1-1 Site Location ..................................................................................................... 25 Figure 1-2 Aerial Photograph.............................................................................................. 28 Figure 1-3 Vegetation prior to European settlement........................................................... 30 Figure 3-1 Soil-landscape Zones and location of EDRS, Bureau of Meteorology station 12075, and study site............................................................................................................ 76 Figure 3-2 Site Map... ......................................................................................................... 78 Figure 3-3 Long-term monthly average rainfall and monthly totals................................... 83 Figure 3-4 Monthly hydrographs for groundwater depth below ground (DBG) ................ 84 Figure 3-5 Groundwater saturated areas for winter and summer snapshots ....................... 89 Figure 3-6 Vegetation Distribution along a transect profile ............................................... 91 Figure 4-1 Site location map............................................................................................. 111 Figure 4-2 DEM of lakes and position of vegetation transects, observation wells and standing pipes..................................................................................................................... 117 Figure 4-3 Estimated depth versus actual groundwater depth (m below the surface) ...... 120 Figure 4-4 Depth to groundwater distribution range for species. ..................................... 125 Figure 4-5 Depth to groundwater distribution range for each vegetation class in the online and offline systems............................................................................................................. 126 Figure 4-6 Presence of classes where the y axis shows the number of days that a particular groundwater depth has been exceeded............................................................................... 129

16

17
List of tables
Table 3-1 Species Classification ......................................................................................... 79 Table 3-2 Average depth to groundwater (gw) and salinity levels for classes where they occur along transects 1-9...................................................................................................... 94 Table 4-1 Seasonal average, maximum and minimum depths to groundwater under vegetation quadrats in the online and offline lakes............................................................ 124

18
19
Chapter 1. Introduction
South-west Australia has 4,331 endemic vascular plants (comprising 1.4% of the worlds
total) and the region is recognised as one of the worlds twenty-five ‘biodiversity hotspots’
based on its exceptional number of endemic plants and the rate of loss due to clearing
(Myers et al. 2000). Conservation of the worlds twenty-five biodiversity hotspots would
save 44% of the worlds plants on just 1.4% of the earths land.
Despite the significant conservation value of the region, in the wheatbelt of south-west
Australia 1,500 of the 4,000 plant species are threatened with extinction by rising saline
groundwater and altered hydrological regimes primarily due to their low positions in the
landscape (Keighery et al. 2001). Populations of eucalypts, casuarinas and melaleucas
could become extinct at local and regional levels (George et al. 1997).
More than 93% of the wheatbelt has been cleared for agriculture (Cramer et al. 2004) and
the fringing vegetation of playa lakes often contain species with conservation priority status,
representing important remnants of a biologically diverse region that has largely been
cleared.
20
The hydrological regimes of playa lakes have been altered as a result of clearing native
perennial vegetation and replacing it with shallow-rooted annual agricultural crops.
Increased recharge under crops has lead to rising groundwater levels and has altered the
water balance of wetlands, changing the flooding regime as well as the degree and rate of
salinization (George and Coleman 2001). The vegetation fringing playa lakes is degraded
by rising groundwater and salinity levels and is vulnerable to further hydrological alteration.
In addition to altered hydrological regimes resulting in seasonal waterlogging and increased
salinity, anticipated climate change scenarios include long periods of drought followed by
extreme summer rainfall events. The vegetation of south-west Australia must also be able
to withstand the extremities of drought conditions and summer flood events that are
predicted by climate change models.
Despite often containing species with conservation priority status, there is no
comprehensive approach to maintain the biodiversity and ecosystem functions of threatened
remnant vegetation in agricultural areas (Cramer & Hobbs 2002).
Management options for the anticipated changes in precipitation levels can involve the use
of playa lakes as natural storage basins. The playa lakes may receive water diverted from
other areas to protect priority assets by reducing hydroperiods and thereby flood damage.
Conversely, engineering solutions may be designed to manage the hydrological conditions
of the playa lakes to protect species within the playa lake ecosystem.
The effectiveness of ‘indirect’ conservation practices which attempt to restore water
balances through reforestation is variable between sites (George et al 1999). The estimated

21
area that would need to be reforested in order to have a significant impact on the watertable
is very large therefore it is not practical or feasible in many catchments (Hatton and Nulsen
1999; George et al 1999).
In some situations a direct conservation approach is necessary to protect priority areas and
vulnerable species from immediate threats posed by salinity, waterlogging and extreme
events. ‘Direct’ conservation entails managing local hydrological regimes with engineering
solutions to provide hydroperiods and water quality conditions that mimic the natural
conditions native vegetation have adapted to.
To mitigate the effects of salinity and waterlogging at the internationally significant,
Toolibin Lake, a major rehabilitation program has been undertaken. The objective of the
program is to restore the hydrological system to more closely mimic its historical regime.
The strategy includes management at a catchment level which is essential for a sustainable
solution and long-term success, and emergency actions to provide immediate relief.
Immediate, emergency actions were included as part of the management strategy to
maintain and improve the lake until the longer term actions could take effect (Toolibin Lake
Recovery Team and Toolibin Lake Technical Advisory Group 1994). The emergency
actions include groundwater pumping and surface water drainage and the long-term
catchment management actions include revegetation (Toolibin Lake Recovery Team and
Toolibin Lake Technical Advisory Group 1994).
The recovery plan for Lake Toolibin and other catchment plans can also improve social
values through the improvement of agricultural land. Local costs of salinity and
waterlogging include damage to roads, bridges and houses (Hajkowicz and Young 2002).
22
In a report edited by Hajkowicz and Young (2002) the impact of water table rise and
dryland salinity in rural Australia was estimated to be between $30 million and $125 million
with a best-bet estimate of $89 million, a cost expected to rise. It is important to consider
the costs of damage caused by salinity and waterlogging when evaluating the costs of
remediation and recovery programs.
Creek flow into Lake Toolibin is only diverted away from the lake when salinity reaches a
threshold value and groundwater pumps drawdown the watertable to a critical depth
(Toolibin Lake Recovery Team and Toolibin Lake Technical Advisory Group 1994).
Despite a high awareness of the cause and effects of dryland salinity and waterlogging,
research thus far has not quantified a tolerance range for native flora species to the
combined effect of salinity and waterlogging.
To quantify tolerance ranges and subsequently determine natural hydroperiods for
vegetation communities, vegetation health should be correlated with varying degrees of
salinity and waterlogging in field experiments. Knowledge of hydroperiods and tolerance
ranges to salinity and waterlogging can guide the design of ‘direct’ conservation approaches
such as surface drainage and groundwater pumping schemes and enable managers to:
(1) assess the risk to priority species or areas;
(2) protect priority species or areas by controlling hydrological processes to manage
hydroperiods and water quality;
(3) improve the design of drainage or pumping schemes;

23
(4) minimize the impact on the vegetation of natural storage basins where water is
diverted to.
This thesis has been organised as a series of papers. Chapter 1 contains a general
introduction, background information and objectives of the research. Chapter 2 reviews
literature on the threat of salinity and waterlogging to remnant vegetation; research into
tolerance of native vegetation to salinity and waterlogging; and a comparison of the merits
of indirect and direct approaches for the conservation of remnant vegetation. Chapter 3
addresses the second objective of this thesis; to assess the health of the native vegetation in
relation to salinity and waterlogging. Chapter 4 addresses the first and third objective of
this thesis, to develop a methodology to determine sustainable hydroperiods and tolerance
ranges for vegetation to salinity and waterlogging; and to establish short-term tolerance
ranges for vegetation. Chapters 3 and 4 have been written as self-contained manuscripts
that have been submitted to scholarly journals for publication. Chapter 5 includes the
general discussion, concluding remarks and recommendations. Additional data,
calculations, and information that were not included in the main body of the thesis have
been provided in appendices.

24
1.1 Research Objective
This research is a field based approach aimed at developing a methodology that can be used
to define hydroperiods and tolerance ranges of species to the spatial and temporal effects of
waterlogging and salinity at a high resolution. In addition, a short temporal dataset has been
collected to test the developed methodology, and to examine the value of various data
sources.
Research objectives include:
(1) develop a methodology that can be used to determine natural hydroperiod
requirements and tolerance ranges for vegetation to salinity and waterlogging;
(2) assess the health of vegetation in relation to varying degrees of waterlogging and
salinity in the field; and
(3) establish tolerance ranges for vegetation.

25
1.2 Background Information
The research site is approximately 600 km south east of Perth near the town of Esperance on
the south coast of Western Australia (Figure 1-1).
Figure 1-1. Site Location Online: 33°30'59.31"S 121°52'41.41"E; Offline: 33°30'57.30"S 121°52'10.70"E
Esperance experiences a typically Mediterranean climate, summers are dry and most of the
annual average rainfall (619 mm) occurs between May and October with July being the
wettest month (Bureau of Meteorology 2008). Evaporation is highest during summer
averaging 240 mm in January (8 mm a day) and 66 mm in June (2 mm a day) (Bureau of
Meteorology 2008). Annual rainfall can be variable, ranging from 1003 mm in 1968, to 404

26
mm in 1994 and with dry periods occurring in 1896, 1914, 1919, 1954, 1969, 1977-78,
1982-83, 1991 and 1994 (Bureau of Meteorology 2008).
Periodic high intensity summer rainfall events, triggered by cyclonic activity originating in
North Western Australia and dissipating south to Esperance through central Western
Australia, can result in markedly higher summer rainfall in some years than the long-term
average (Marimuthu et al. 2005).
In January 1999, 209 mm of rainfall was recorded during a severe summer storm with an
estimated return period of around 200 years, resulting in catastrophic flooding in the
Esperance region (Kusumastuti et al. 2006).
In January 2007, after an extremely dry year in the southwest of Western Australia, 221 mm
of summer rainfall was recorded over a 48 hour period at Esperance Airport (B.O.M.
station) resulting in severe flooding (Bureau of Meteorology 2007). This is a classic climate
change scenario predicted by numerous models of the southwest Australian region in which
severe droughts are followed by extreme rainfall and subsequent floods (pers. comm.
Massenbauer 2007).
The site is located in Coramup Creek, a sub-catchment of the Lake Warden recovery
catchment, listed as a recovery catchment under the state salinity action plan (Short et al.
2000). The Lake Warden wetlands system, recognised as internationally significant for
waterbirds under the Ramsar convention (Robertson and Massenbauer 2005) is situated at
the base of the recovery catchment and acts as an outlet for Melijinup, Coramup, Bandy and
Neridup creeks (Marimuthu et al. 2005).
27
The site consists of two playa lake systems; a chain of lakes on the floodplain of the
Esperance plains and an adjacent lake disconnected from the floodplain by a basement
ridge. These two systems are subsequently referred to as ‘online’ (connected via a
floodplain) and ‘offline’ (no floodplain connection).
The Lake Warden catchment has a very low relief reflected by hydraulic gradients of
generally less than 0.1% (Gee and Simons 1997). The surface elevation at the top of the
catchment decreases from approximately 160 m AHD (approximately 50km inland) to 20 m
AHD at the coastal plain (Short 2000). The coastal plain extends up to 10 km inland and
merges with the Esperance sandplain which extends a further 30 - 40 km inland (Marimuthu
et al. 2005). Upland surface water drains into Melaleuca and Eucalyptus swamps (Short
2000).
The Esperance sandplain is covered with ephemeral swamps and further inland in the upper
reaches of the catchment, chains of salt lakes dominate the landscape (Figure 1-2). Shallow
watertables intersect the surface at topographical lows and in ancient palaeodrainage lines
trending to the north, occupied by chains of salt-lakes aligned on an east-west trajectory
(Gee and Simons 1997).

28
Figure 1-2: Aerial Photograph Courtesy of Google Earth. http://earth.google.com/intl/en/ cited 2007
Palaeodrainage lines and regional depressions in basement rocks are composed of soils from
the Werillup Formation and Pallinup Siltstone deposited during a marine transgression in
the mid to late Eocene (approximately 40 million years ago) (Short et al. 2000). The
Werillup Formation consists of a dark grey siltstone, sand, clay, lignite and limestone and
the Pallinup Siltstone consists of siltstone and spongelite (Short et al. 2000).
Duplex soils with sand overlying clay or ironstone gravels dominate the Esperance plains
(Beard 1990). Typically fine sand (0.3-0.8 m) and ferruginous gravel topsoils overly a
dense sodic clay subsoil prone to annual waterlogging (Short et al. 2000). Further north in
the mallee area, duplex soils dominate with typically less than 0.3 m of sandy, alkaline
topsoil overlying clays (Short et al. 2000).
Site
3.94 km
N
29
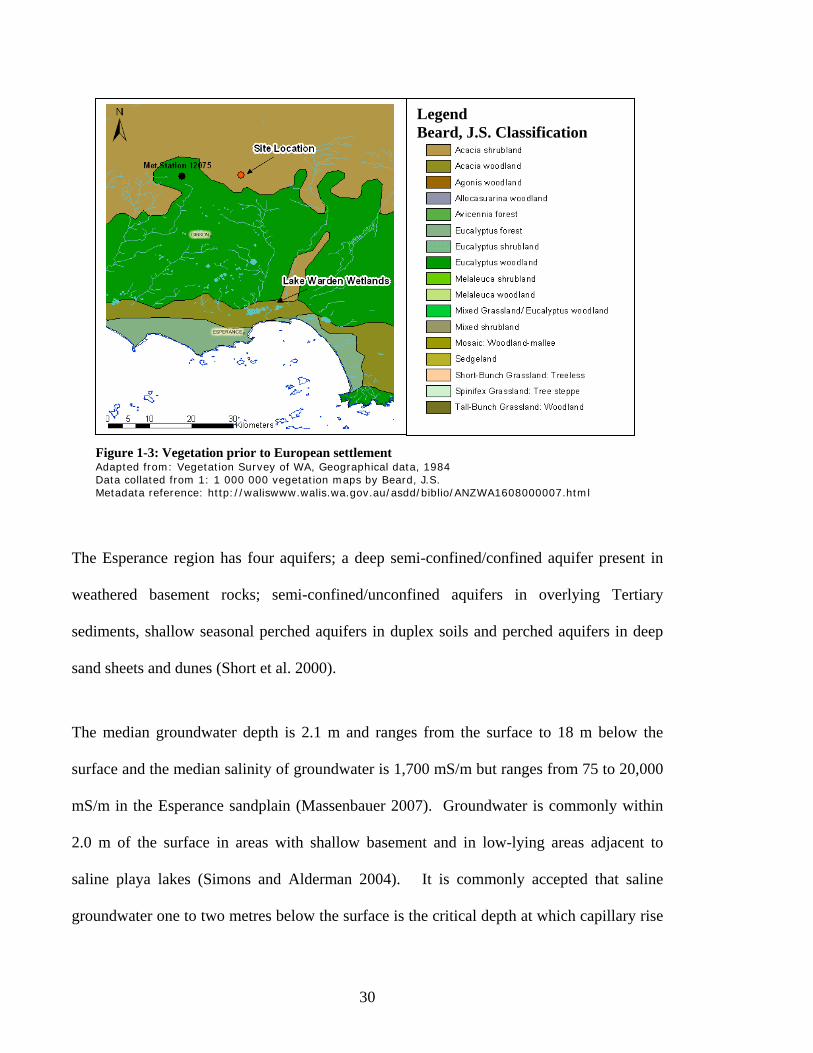
Due to the flatness of the region, the vegetation forms mosaic patches where variable depth
of sands overlying clay leads to variation in community structure and composition with
mallees occurring in areas where the overlying sand layer is shallow (Beard 1990). Native
vegetation is highly adapted to the margins of salt lakes and pans but the hypersaline lake
bed is beyond their tolerance levels (Beard 1990).
The Lake Warden catchment has been heavily cleared for agriculture (Robertson and
Massenbauer 2005). Farmland comprises approximately 30,700 ha of 31,000 ha of land in
Coramup Creek (Gee and Simons 1997). The dominant vegetation of the Esperance Plains
is mallee-heath which covered 58% of the region prior to clearing (Beard 1990). Mallee-
heath communities are composed of short, scattered eucalypt mallees with a dominant heath
understorey (Beard 1990). Dominant mallees include Eucalyptus incrassata, E.tetragona,
E.redunca, E.goniantha, E.spathulata and E.cooperiana. Grevillea, Hakea, Casuarina and
Dryandra species are among the dominant shrubs (Beard 1990). Before clearing vegetation
communities in the upper reaches of Coramup creek consisted of Eucalyptus woodland and
Acacia shrubland (Figure 1-3).
30
Figure 1-3: Vegetation prior to European settlement Adapted from: Vegetation Survey of WA, Geographical data, 1984 Data collated from 1: 1 000 000 vegetation maps by Beard, J.S. Metadata reference: http://waliswww.walis.wa.gov.au/asdd/biblio/ANZWA1608000007.html
The Esperance region has four aquifers; a deep semi-confined/confined aquifer present in
weathered basement rocks; semi-confined/unconfined aquifers in overlying Tertiary
sediments, shallow seasonal perched aquifers in duplex soils and perched aquifers in deep
sand sheets and dunes (Short et al. 2000).
The median groundwater depth is 2.1 m and ranges from the surface to 18 m below the
surface and the median salinity of groundwater is 1,700 mS/m but ranges from 75 to 20,000
mS/m in the Esperance sandplain (Massenbauer 2007). Groundwater is commonly within
2.0 m of the surface in areas with shallow basement and in low-lying areas adjacent to
saline playa lakes (Simons and Alderman 2004). It is commonly accepted that saline
groundwater one to two metres below the surface is the critical depth at which capillary rise
Legend Beard, J.S. Classification

31
transports salts into the root zone resulting in reduced growth for non-salt tolerant plants and
in some instances mortality (Nulsen 1981; Read 1988).
In almost half of the 208 monitoring bores in the Esperance sandplain groundwater levels
are rising from 0.03 to 0.25 m/yr, and in the remainder groundwater levels are static or
declining by <0.03 m/yr (Massenbauer 2007). Groundwater levels are declining in some
areas as a result of below average rainfall from 1994 – 1998 and 2002 and increased water
use by perennial plants. Bores with declining groundwater levels are located throughout the
area and include shallow groundwater levels which respond to seasonal rainfall and slightly
deeper levels that respond to annual and episodic rainfall (Massenbauer 2007). Bores with
rising groundwater levels are located in the Salmon Gums mallee zone and in the southern
part of the Esperance sandplain zone where groundwater is deeper than 5.0 m (Massenbauer
2007). Although groundwater levels are declining in some areas of the Esperance region,
the rate of decline is very slow and extreme summer rainfall events can significantly
increase recharge and reverse the trend.
32
1.3 References
Beard, J. S. 1990. Plant Life of Western Australia. Kangaroo Press, Kenthurst, NSW.
Bureau of Meteorology 2007. Heavy rain breaks records in the southeast of WA. Media
release http://www.bom.gov.au/announcements/media_releases/wa/20070105.shtml. Issued
5 January 2007. [cited 2007 Dec 10].
Bureau of Meteorology 2008. Climate of Esperance. [Internet]
http://www.bom.gov.au/weather/wa/esperance/climate.shtml [cited 2007 Dec 10].
Cramer, V. A., and Hobbs, R. J. 2002. Ecological consequences of altered hydrological
regimes in fragmented ecosystems in southern Australia: Impacts and possible management
options. Austral Ecology, 27, 546-564.
Cramer, V. A., Hobbs, R. J., Atkins, L., and Hodgson, G. 2004. The influence of local
elevation on soil properties and tree health in remnant eucalypt woodlands affected by
secondary salinity. Plant and Soil, 265, 175-188.
Gee, S.T., Simons, J.A. 1997. Catchments of the Esperance Region of Western Australia.
Resource Management Technical Report No. 165. Department of Agriculture, Esperance,
Western Australia. pp 32.
33
George, R, Coleman, M. 2001. Hidden menace or opportunity – Groundwater hydrology,
playas and commercial options for salinity in wheatbelt valleys. In: Dealing with Salinity in
Wheatbelt Valleys: Processes, Prospects and Practical Options Conference, 30 July to 1
August 2001 Merredin. Reviewed August 2006. Available from:
http://portal.water.wa.gov.au/portal/page/portal/WaterManagement/Salinity/ProgramMgtCo
ordination/Content/SALINITY_WHEATBELTVALLEYS.pdf, Merredin.
George, R., D. McFarlane, and B. Nulsen. 1997. Salinity Threatens the Viability of
Agriculture and Ecosystems in Western Australia. Hydrogeology Journal 5:6-21.
Marimuthu, S., D. A. Reynolds, and C. Le Gal La Salle. 2005. A field study of hydraulic,
geochemical and stable isotope relationships in a coastal wetlands system. Journal of
Hydrology:1-24.
Hajkowicz, S.A. and M.D. Young (Eds) 2002. Value of returns to land and water and costs
of degradation, A consultancy report to the National Land and Water Resources Audit,
CSIRO Land and Water, Canberra.
Keighery, G. J., Halse, S., and McKenzie, N. 2001. Why wheatbelt valleys are valuable and
vulnerable: the ecology of wheatbelt valleys and threats to their survival. In Dealing with
Salinity in Wheatbelt Valleys: Processes, Prospects and Practical Options Conference, 30
July to 1 August 2001 Merredin. Reviewed August 2006. Available from:
http://portal.water.wa.gov.au/portal/page/portal/WaterManagement/Salinity/ProgramMgtCo
ordination/Content/SALINITY_WHEATBELTVALLEYS.pdf, Merredin.
34
Kusumastuti, D. I., Struthers, I., Sivapalan, M., and Reynolds, D. A. 2006. Threshold effects
in catchment storm response and the occurrence and magnitude of flood events:
Implications for flood frequency. Journal Hydrology and Earth System Sciences, 3, 3239-
3277.
Massenbauer, A. 2007. Esperance Lakes Catchment Appraisal 2007. Resource
Management Technical Report 316. Esperance Catchment Support Team - Department of
Agriculture and Food, pp. 1-67.
Myers, N., R. A. Mittermeier, C. G. Mittermeier, G. A. B. da Fonseca, and J. Kent. 2000.
Biodiversity hotspots for conservation priorities. Nature 403:853 - 858.
Nulsen, R. A. 1981. Critical Depth to Saline Groundwater in Non-irrigated Situations.Aust.
J. Soil Res., 19, 83-86.
Read, V. 1988. Salinity in Western Australia - A Situation Statement. Resource
Management Technical Report No.81. ISSN: 0729-3135. Department of Agriculture
Western Australia.
Robertson, D., and Massenbauer. T. 2005. Applying hydrological thresholds to wetland
management for waterbirds, using bathymetric surveys and GIS. In Zerger, A. and Argent
R. M., editors. MODSIM 2005. International Congress on Modelling and Simulation.
Modelling and Simulation Society of Australia and New Zealand, December 2005, pp
2407–2413. ISBN: 0-9758400-2-9.
35
Short, R., Salama, R., Pollock, D., Hatton, T., Bond, W., Paydar, Z., Cresswell, H.,
Gilfedder, M., Moore, A., Simpson, R., Salmon, L., Stefanski, A., Probert, M., Huth, N.,
Gaydon, D., Keating, B., Coram, J., and Please, P. 2000. Assessment of Salinity
Management Options for Lake Warden catchments, Esperance, WA: Groundwater and Crop
Water Balance Modelling. Technical Report 20/00, CSIRO Land and Water, Perth
Simons, J., and Alderman, A. 2004. Groundwater trends in the Esperance Sandplain and
Mallee sub-regions. Miscellaneous Publication 10/2004. Department of Agriculture.
Toolibin Lake Recovery Plan. Prepared by the Toolibin Lake Recovery Team and Toolibin
Lake Technical Advisory Group 1994. Endorsed by the Corporate Executive of the
Department of Conservation and Land Management and the National Parks and Nature
Conservation Authority in September 1994.

36
37
Chapter 2. Literature Review
This review evaluates the threat salinity and waterlogging poses to remnant vegetation in
south-western Australia. It includes an assessment of the threat to remnant vegetation; a
comparison of the merits of indirect and direct approaches for the conservation of remnant
vegetation; limitations involved in extrapolating results from experiments not specifically
designed for the application of direct conservation approaches; and a synopsis of the
tolerance of native species, specifically eucalypts, casuarinas, melaleucas and acacias to
salinity and waterlogging from published literature.
2.1 Remnant vegetation in south-western Australia
South-west Australia is one of the worlds twenty-five ‘biodiversity hotspots’ based on the
exceptional number of endemic plants per area ( 4,331 endemic plants or 1.4% of global
plants in an area 10.8% of its original extent) and the rate of loss due to clearing in the
region (Myers et al. 2000). The fringing vegetation of playa lakes contain important
remnants of the south-west region but are sensitive to altered hydrological regimes, a
consequence of the large-scale clearing of deep-rooted native perennial vegetation and its
replacement with shallow-rooted annual crops.
38
In a study of wheatbelt vegetation, Keighery et al. (2001) found at least 64 threatened and
priority taxa restricted to naturally saline areas are at risk from rising groundwater and
altered hydrological regimes. George and Coleman (2001) estimate as many as 450
wheatbelt species could become extinct as a result of increased groundwater and salinity
levels.
More than 93% of the native vegetation of the wheatbelt has been cleared for agriculture
and remaining remnants are highly fragmented (Cramer et al. 2004). Wetlands have been
severely degraded and populations of eucalypts, casuarinas and melaleucas are threatened
with extinction at local and regional levels (George et al. 1997).
On the Esperance plains Melaleuca communities, mallee woodlands and shrublands, and
eucalyptus open woodlands are among the most degraded vegetation groups in terms of the
extent these groups were cleared post European settlement (Cofinas and Creighton 2001).
Restricted distribution in combination with a small number of individuals or populations
makes the flora of the Esperance plains extremely vulnerable (Cofinas and Creighton 2001).
Regional threats to flora include vegetation clearing and fragmentation for agriculture,
hydrological changes and salinity, feral predators and herbivores, grazing by stock, and
weeds (Cofinas and Creighton 2001). There are sixteen plant species that have been
declared as critically endangered, twenty-one declared endangered, and twenty-eight plants
declared as vulnerable under WA state legislation (Cofinas and Creighton 2001).
39
2.2 Altered hydrological regimes
In Australian catchments, prior to clearing native vegetation maintained a water balance by
transpiring and intercepting most of the annual rainfall (Bell 1999). After clearing,
increased runoff and groundwater discharge in wheatbelt catchments has resulted in
salinization as atmospheric salts that have accumulated in the soils over millions of years
have been bought to the surface by rising groundwater levels (Hatton et al. 2003).
Under shallow-rooted annual agricultural crops, recharge to groundwater is higher because
crops are dormant in summer and are therefore unable to transpire and intercept summer
rainfall or access the deeper groundwater stores (Farrington and Salama 1996; Hatton et al.
2003; Stolte et al. 1997). Rising groundwater mobilizes salt stored in the unsaturated zone
and brings it to the surface (Bell 1999; Farrington and Salama 1996) resulting in the
expansion of groundwater discharge areas with high salt loads (Hatton et al. 2003).
Rising groundwater alters the water balance of wetlands, changing the flooding regime, as
well as the degree and rate of salinization (George and Coleman 2001). Vegetation in
groundwater discharge areas throughout Western Australia is showing signs that it is unable
to cope with the current, rapid changes in hydrology (George et al. 1999).
Altered hydrological regimes can lead to a loss of biological diversity and changes in plant
species composition (Davis and Froend 1999; George and Coleman 2001). Most plants
have a very specific threshold to temporal inundation otherwise known as hydroperiod
(George and Coleman 2001). Changes in hydroperiods can cause death of species (George
and Coleman 2001), or favour others leading to a change in the composition of

40
communities. Plant species distribution in a wetland is primarily determined by
environmental characteristics of a site such as water chemistry and hydroperiod (flooding
depth, frequency, duration and seasonality) (Goslee et al. 1997).
2.3 Extent of salinity and waterlogging
Salinity and waterlogging have long been recognized as a serious land degradation problem
in Australia with reports of salinity recorded as early as the 18th century (George et al.
1997). The Land Monitor Project, which according to McFarlane et al. (2004) has produced
the most accurate estimate of salinity extent thus far, estimated 1 million hectares of land in
Western Australia was affected by salinity in 1996, increasing annually since 1989 by
approximately 14,000 hectares (McFarlane et al. 2004). The Land Monitor Project also
estimated a further 5.4 million hectares of land in Western Australia is a salinity hazard
(areas with groundwater within 2.0 m of the surface), 81% of which occurs on agricultural
land but also includes some areas of remnant vegetation (McFarlane et al. 2004).
2.4 Indirect versus Direct Conservation of Remnant vegetation
Conservation efforts seem to be focused on indirect conservation by restoring the
hydrological equilibrium through reforestation.
In a survey of recharge and discharge sites in Western Australia, George et al. (1999) found
that in all but 3 of 80 sites tree plantations had little or no effect on groundwater levels more
than 10-30 m from the plantations and the effect was smaller in discharge areas. The
success of reforestation schemes is variable between sites according to rainfall distribution
and on a local scale, water quality and groundwater depth. George et al. (1999) estimated

41
reforestation of up to 70-80% of a catchment may be required for a significant reduction in
the water table at a catchment scale. Hatton and Nulsen (1999) estimate to restore the water
balance that existed pre-clearing, revegetation of most or all parts of the catchment with
trees or plants is necessary. Even at the largest scale, according to Hatton et al. (2003)
revegetation is unlikely to be capable of restoring all hydrological functions.
According to Pannell and Ewing (2004) trees and shrubs are not profitable over large areas
in grain growing regions, and for the large scale reforestation required to lower or maintain
groundwater levels, the plantations need to be profitable for farmers. Profits from
plantations generally can not offset the loss of productive land. Profits from plantations are
only collected every 8-10 years (Bell 1999) and plantations are considered to be only
commercially viable in catchments with a minimum of 600 mm annual rainfall (Pannell and
Ewing 2004; Schofield 1992) and possibly under specific soil conditions (Schofield 1992).
Most species tolerant of salinity and waterlogging have little commercial value (Niknam
and McComb 2000) and more commercially viable species are better suited to recharge
areas (George et al. 1999). In Western Australia E.globulus has a very high commercial
potential and moderately high water use potential and has therefore been widely used for
planting of recharge areas in higher rainfall areas (Pannell and Ewing 2004; Schofield
1992). However its effectiveness is limited to upland recharge sites because E.globulus is
sensitive to waterlogging and salinity (Bell 1999). To lower the watertable and reclaim salt
affected areas, planting of the less profitable species may be necessary (Schofield 1992).
Discharge areas are less productive and therefore less valuable than recharge areas to
farmers because crops are usually intolerant of waterlogging and salinity (Bell 1999).

42
Successful reforestation of discharge areas is attractive because the land is usually less
valuable for traditional agriculture therefore the cost of lost agricultural land is less,
however commercial species are difficult to establish in discharge areas and the effect on
the watertable is reduced under saline and waterlogged conditions. Reforestation of
discharge areas has a localized effect and may not be sustainable but is still valuable for
other reasons such as reduced visual impact of salinity; increased pasture and crop
production; increased biomass; shade and shelter; and erosion control (George et al. 1999).
Thorburn et al. (1995) modelled the uptake of saline groundwater by plants and found that
uptake of saline groundwater resulted in salt accumulation in the root zone and eventually
complete salinization of soil profiles which would cause plant mortality. Where plants do
have a high groundwater uptake, salt accumulation around the root zone and increased
groundwater salinity can prohibit growth and sustainability of plantations (Niknam and
McComb 2000; Stolte et al. 1997). Leaching of salts from the soil profile is critical for tree
growth and survival in saline, discharge areas (Thorburn et al. 1995). Matching species in
terms of specialised functions such as water uptake capability to sites with suitable
conditions can improve the success of revegetation projects (Bell 1999; Marshall et al.
1997).
According to George et al. (1997) non-commercial tree planting on the scale required to
solve salinity is not economically viable for farmers, therefore resources should be directed
towards protecting priority assets. Plantations take time to establish and may take a long
time to have an effect on the watertable, however groundwater pumping can quickly reduce
shallow saline watertables and be used as a short term solution (Farrington and Salama
1996). To protect priority areas from immediate threat or in catchments where reforestation
43
is not appropriate or successful in recharge reduction, engineering solutions involving
pumping and drainage need to be implemented to quickly lower water tables (Farrington
and Salama 1996).
To protect Lake Toolibin, an internationally significant wetland in south-west Australia,
engineering solutions involving drainage to divert surface water and groundwater pumping
were recommended as short term solutions for salinization and waterlogging while large
scale planting was recommended as a long-term solution (Froend et al. 1997). Engineering
solutions are expensive and require on-going maintenance and were therefore recommended
as a short-term solution and planting to reverse the rising groundwater trend and salinity
was recommended as a long-term solution because planting will take some time to have an
impact (Froend et al. 1997).
George et al. (1997) observed that although restoring the hydrological equilibrium that
existed pre-clearing or restoring other previous values is the preferred option, it is generally
difficult to achieve therefore salinity management is usually more practical and achievable.
George and Coleman (2001) recommend direct conservation or engineering intervention
such as drains and pumping schemes for discharge areas where salts cannot be seasonally
leached and evaporative fluxes generally prevent plant growth.
An understanding of the interaction between waterlogging and salinity is important for
drainage design criteria (Barrett-Lennard 2003). Lowering of the watertable by just 10-20
cm by drainage or pumping schemes may be sufficient to alleviate waterlogging, and with
knowledge of salt tolerances further lowering of the watertable could be achieved through
revegetation with appropriate species (Barrett-Lennard 2003).

44
Gradual changes in environmental factors may cause a declining trend in vegetation health
until a critical threshold is reached when a large shift can occur and may be difficult to
reverse (Scheffer and Carpenter 2003).
Cramer et al. (2004) found that subtle differences in elevation, in some cases 0.20 m, was
enough to buffer the seasonal effects of salinity and waterlogging in eucalypt woodlands
and noted that salinity and waterlogging caused a decline in tree health, but the critical
threshold for inundation resulting in tree mortality was unknown.
Determining thresholds of species to the effects of waterlogging and salinity will facilitate
adequate design of engineering solutions designed to protect vegetation and assist in
schemes which combine engineering solutions with reforestation.
2.5 Research into the tolerance of native vegetation to salinity and waterlogging
The cause, effects and extent of dryland salinity are well documented (Barrett-Lennard
2003; Bell 1999; Bramley et al. 2003; Cramer and Hobbs 2002; Farrington et al. 1992;
George et al. 1997; George et al. 1999) however there is surprisingly very little field
research into the combined effect of waterlogging and salinity on native vegetation.
Most research into the tolerance of native vegetation to salinity and waterlogging involves
glasshouse experimentation (Niknam and McComb 2000) and is generally designed to find
a tolerant species for propagation that can potentially reclaim salt affected areas by
reinstating the natural hydrological equilibrium that existed pre-clearing (Cramer and Hobbs
45
2002). Glasshouse experiments are usually preferred over field experiments because they
are easier to control, cheaper and generally quicker (Niknam and McComb 2000).
Field based assessments of native species tolerance to salinity and waterlogging often target
the most valuable species or communities. The health of the targeted species is monitored
in conjunction with the hydrological regime and conditions the species experience at
representative sites. The monitoring results are then used to link hydrological regime with
vegetation health. This method of assessment requires knowledge of how vegetation
responds to hydrological regime changes and which parameters can be monitored so the
health of vegetation can be linked to the hydrological changes. Selecting a representative
site or species for monitoring also requires existing knowledge of how quickly species will
respond to hydrological change. Monitoring indicator species or representative sites to
design conservation strategies for systems requires expert knowledge of which species and
sites will be representative of the system and its water requirements.
Knowledge of the thresholds of native species to salinity and waterlogging can guide direct
management of systems and subsequent conservation of species, however most screening
experiments only provide comparative tolerances between species and provenances.
Unfortunately, because the experiments are generally not motivated by the direct
conservation of plants, their design has several limitations which reduce the practical value
of the results for application of direct intervention or conservation approaches.
46
The following section documents some of the limitations involved in extrapolation of results
from experiments not designed specifically for determining a tolerance range of species to
salinity and waterlogging.
2.6 Experimental Design and Limitations
Glasshouse Experiments
Glasshouse experiments usually involve collecting seeds from species with a presumed salt
tolerance from different areas and growing the seedlings to find the most salt tolerant
provenances (Niknam and McComb 2000). Screening species to find the most tolerant is
often the first step in finding a species suitable for breeding to create hybrids or for cloning
and subsequent propagation for the revegetation of salt-waterlogged land (Marshall et al.
1997; van der Moezel et al. 1991; van der Moezel et al. 1989). The identification of highly
tolerant individuals and provenances facilitates the selection of suitable genetic material to
clone (van der Moezel et al. 1991).
While research continues to be principally motivated by reforestation, the focus will remain
on a small group of species with a presumed high tolerance to salinity and of some
commercial value. If more research was motivated by direct conservation of degraded
populations, then presumably species with lower tolerances which are most threatened by
land degradation would be the focus of more studies.
Past research has shown that the species tolerant to salinity and waterlogging generally have
little commercial value in terms of oil, lumber and paper pulp production (Meddings et al.

47
2001; Niknam and McComb 2000). As a result, most research is focused on species with
commercial value which are tolerant to the individual effects of salinity or waterlogging and
therefore suitable for re-vegetating recharge areas, or those with a predicted tolerance to
salinity and waterlogging based on their natural distribution. The tolerant species may be
propagated or used for breeding with another more commercially attractive species before
cloning for propagation and wide-spread planting (Meddings et al. 2001). The objective of
these experiments is not to find a tolerance range for a species but instead to compare
species and individuals to find the most tolerant species likely to be successful in
reclamation of salt-affected areas. For drainage or pumping scheme design, target levels
should be aimed at the tolerance threshold of the least tolerant species.
Many species are only screened for their salinity tolerance rather than for the combined
effect of salinity and waterlogging however physiological and morphological adaptations to
the individual effects may not mitigate the combined effect. Results from experiments
indicate that most species are more severely impacted by the combined effect of salinity and
waterlogging than to the individual effects of salinity (Craig et al. 1990; van der Moezel et
al. 1991; van der Moezel et al. 1988).
Salinity severely limits a plants’ ability to produce adventitious roots, an adaptive
mechanism for waterlogged conditions (Bell 1999; van der Moezel et al. 1988). Plants
adaptations to salinity and waterlogging include avoiding hypoxia by forming aerenchyma
and an endodermis to regulate ion uptake and transport, reducing stomatal conductance and
removing salt by various means (Barrett-Lennard 2003). The combined effect of salinity
and waterlogging is more severe for most plants because it results in a higher concentration

48
of NaCl in the shoots, initially a result of increased uptake of NaCl to the shoot and then
subsequent decreased shoot growth (Barrett-Lennard 2003).
Salinity is commonly caused by rising watertables mobilizing salt and bringing it to the
surface, therefore often a saline site is also waterlogged (Niknam and McComb 2000). An
understanding of the individual effects of salinity and waterlogging on native species is
useful for the selection of species for the re-vegetation of an area subjected to salinity or
waterlogging but not for areas subjected to both (Barrett-Lennard 2003). In areas affected
by both salinity and waterlogging knowledge of tolerance thresholds to the combined effect
is critical to set targets for conservation.
Motivated by revegetation schemes, most research is conducted on juvenile plants at 3-6
months old because this is the age most seedlings are planted in the field (Niknam and
McComb 2000). Differences throughout life stages however, including morphological and
physiological variations, may lead to a species tolerant as a juvenile to be intolerant as a
mature tree (Niknam and McComb 2000).
Clemens et al. (1983) found no clear relationship between the most resistant Casuarina
species as seedlings with the most resistant Casuarina species at seed germination.
Differences in root structure between juvenile and mature trees could be significant, as long-
lived deep sinker roots may be more likely to experience salinity (Niknam and McComb
2000). Knowledge of the effect on adult species is important because as individuals
develop throughout their life cycle, their ability to adapt or avoid stress will be altered
(Niknam and McComb 2000). Successful and sustainable revegetation projects require
knowledge of tolerance ranges of species throughout their development stages.

49
Tolerance to salinity and waterlogging is usually measured by relative growth and mortality
in glasshouse experiments (Niknam and McComb 2000). In a comparative study of the
tolerance of E.camaldulensis clones, Akilan et al. (1997), found one clone was better
adapted to using winter supplies of soil water and therefore suggested that planting of this
clone would be more appropriate in recharge areas where the watertable is usually fresher
because higher water uptake can also results in a high salt uptake in saline areas. Akilan et
al. (1997) also recommended use of the E.camuldulensis clone with a lower water uptake
and hence a lower salt uptake in more degraded environments with saline aquifers where the
survival rate would be higher for trees with low water use.
High growth is generally associated with high water uptake, which is why it is used as a
measure of tolerance in screening experiments designed to find a species capable of
lowering the watertable. High water uptake also often equates to high salt uptake (Stolte et
al. 1997; Thorburn et al. 1995) therefore a species with high growth rate in a short-term
experiment may appear to be tolerant however if the duration of the experiment was
increased the same species may have a high mortality rate. Extrapolation of results from
experiments that use growth as an indicator of tolerance is limited for degraded areas where
high growth leading to high salt uptake is generally not sustainable.
Species tolerance, in terms of the maximum salinity a species can withstand or the period a
species can survive under waterlogged or salt-waterlogged conditions, varies according to
the design of particular experiments (van der Moezel and Bell 1990). Where experimental
variation exists, the tolerance of species to a concentration of salinity or period of
waterlogging is difficult to compare between experiments.
50
Salinity is usually increased gradually to mimic natural seasonal fluctuations (Niknam and
McComb 2000), however the degree and rate of salinization is extremely variable in the
field and difficult to replicate in glasshouse experiments. Comparisons between glasshouse
experiments is also limited by exposure to different rates of salinization which can produce
different results because adaptive responses may be hindered if salinity is increased more
quickly than it would in a real environment (Niknam and McComb 2000).
Glasshouse experiments are short-term, can not mimic all field conditions, and can not
evaluate tolerances of mature plants (Niknam and McComb 2000). Glasshouse experiments
are useful for screening to find the most tolerant species under conditions imposed by that
particular experiment, however the inherent difficulty in mimicking natural conditions and
variation in experiments make them inadequate for the quantification of tolerance thresholds
for the design of direct conservation schemes.
Field Experiments
It is difficult to assess tolerance in field experiments because frequent and spatially
intensive sampling is required to capture the spatial and temporal variability in the field
(Niknam and McComb 2000). In field experiments, environmental factors such as climate,
rainfall, pests and disease also make it difficult to determine thresholds to salinity and
waterlogging because the individual effect these variables have on the health of vegetation
is difficult to quantify. Environmental factors can each have a direct effect on the health of
vegetation or the health of vegetation may be affected by a combination of these factors. It
is possible to quantify tolerance ranges to the individual and combined effect of salinity and
waterlogging in field experiments that have large datasets that are statistically significant.
51
It is difficult to compare tolerance of species in field experiments because different rooting
depths may result in some species avoiding saline groundwater (Niknam and McComb
2000). Control plants or areas are difficult to include in field experiments which makes it
difficult to quantify the effect of salinity and waterlogging (Niknam and McComb 2000).
Comparisons between the most tolerant species from glasshouse experiments with the most
tolerant from field studies is limited and when comparisons have been made conflicting
results are usually explained by researchers as intraspecific variation, inappropriate salinity
levels or poor experimental mimicking of environmental conditions (Niknam and McComb
2000).
Barrett-Lennard (2003) suggested a field approach could define plant zonation in
waterlogged saline environments by correlating plant growth and survival with the inherent
variation in waterlogging and salinity at a site.
Intraspecific and interspecific variation is useful for breeding purposes and to match
tolerances with site conditions for reforestation projects, however the inherent variation
between species as a result of natural selection makes it difficult to determine a definitive
threshold to salinity and waterlogging for managers to work towards for direct conservation.
2.7 Interspecific variation
According to Barrett-Lennard et al. (1986) species least tolerant to the combined effect of
salinity and waterlogging are also sensitive to the individual effect of waterlogging. Results
from an experiment by van der Moezel et al. (1991) supporting this statement, found that
52
the most tolerant Eucalyptus and Melaleuca species to salinity and waterlogging were also
the most tolerant to the individual effect of waterlogging. Melaleuca and Casuarina species
occur naturally in areas subjected to prolonged flooding as a result of their location in the
landscape, often fringing wetlands (Froend et al. 1987).
van der Moezel et al. (1991) concluded from a glasshouse experiment in which 40
Eucalyptus and 20 Melaleuca species were screened for their tolerance levels to salinity and
waterlogging and also from the species natural distribution that the most tolerant Melaleuca
species would be more tolerant to the effects of salinity and waterlogging than the most
tolerant Eucalyptus species. Melaleuca and Casuarina species can tolerate extended
periods of waterlogging but not the effects of increased salinity (Bell 1999).
Although van der Moezel et al. (1991) and van der Moezel and Bell (1990) warned that the
step-wise salinity increment varied between glasshouse experiments which compared
species from different genera, results indicated that the most tolerant Casuarina and
Melaleuca species were significantly more tolerant than the most tolerant Eucalyptus
species to the combined effect of salinity and waterlogging. The most tolerant Casuarina
and Melaleuca species tolerated waterlogging up to approximately 400 mM NaCl
(approximately 4,177 EC mS/m) while the most tolerant Eucalyptus species tolerated
waterlogging with 300 mM NaCl (approximately 3,133 EC mS/m) (van der Moezel and
Bell 1990).
In a field study of the salinity and waterlogging damage to vegetation of Lake Toolibin,
Western Australia, death of C.obesa and M.strobophylla was attributed to salinity
concentration rather than increased frequency and duration of flooding (Bell and Froend
53
1990; Froend et al. 1987). Populations of C.obesa, M.strobophylla and most significantly
E.rudis, the dominant species on the bed of Lake Toolibin, have declined since monitoring
began in 1977, however occurrence on the lake bed indicates these species can tolerate
seasonal waterlogging with brackish water (Froend et al. 1997). E.rudis death at Lake
Toolibin was considered to be caused by the combined effect of increasing salinities and
duration of inundation (Bell and Froend 1990; Froend et al. 1987). C.obesa was the most
tolerant species to high soil salinities and was relatively tolerant of prolonged inundation,
however mortality did occur in areas probably as a result of prolonged exposure to high soil
salinities during periods of drought when salts were not flushed from the species shallow
rooting zone (Froend et al. 1987). A species can be tolerant to the individual or combined
effects of salinity and waterlogging, however most will have a tolerance threshold.
2.8 Intraspecific variation
As a result of natural selection, species have interspecific and intraspecific variation as they
adapt to their environment through the course of evolution, therefore natural distribution is
usually related to tolerance to various stresses (Niknam and McComb 2000).
Intraspecific variation has been established in populations of Casuarina (van der Moezel et
al. 1989), Melaleuca (van der Moezel et al. 1991) and Eucalyptus species (Ladiges and
Kelso 1977; van der Moezel et al. 1991). Thomson et al. (1987) found that in some
Eucalyptus species, intraspecific variation for salt tolerance was so wide that a tolerance
classification at the species level was of doubtful value.
54
2.9 Tolerance of Eucalyptus species to salinity and waterlogging
The Eucalyptus genus includes about 700 species, most of which are only found naturally in
Australia (Brooker and Klenig 1994). Eucalypts have a broad geographic range, and occur
over large environmental gradients, therefore many eucalypts are highly adapted to specific
environments (Williams and Woinarski 1997). In south-western Australia, Eucalyptus
distribution on a site-scale is primarily correlated with variation in soil characteristics and
on a larger scale by climatic differences (Wardell-Johnson et al. 1997).
Eucalypts have adapted to a wide range of climatic and edaphic conditions, however no
species appear to be able to tolerate permanent waterlogging (Ladiges and Kelso 1977). van
der Moezel et al. (1991) found that eucalypts were more sensitive to waterlogging than
salinity but the combination of salinity and waterlogging had a much more severe effect
than the individual effect of waterlogging. In a field survey, Mattiske Consulting (2005)
found Eucalyptus species were distressed and declined in abundance in areas when salinities
reached 500-1000 ECe mS/m.
In a glasshouse study which compared the tolerance levels of 40 Eucalyptus species for the
individual and combined effects of salinity and waterlogging, van der Moezel et al (1991)
found that E.occidentalis, E.sargentii and E.spathulata were the most tolerant to the
combined effect of salt and waterlogging. Intraspecific variation was significant between
12 provenances of E.occidentalis and 9 provenances of E.sargentii for the tolerance to salt-
waterlogging treatment (van der Moezel et al. 1991). When the experimental design was
changed, so that the same maximum salinity was reached over the same time period but
55
maintained for 2 weeks instead of 1 week the most tolerant species to the combined effect of
salt-waterlogging were E.intertexta, E.microtheca, E.raveretirana, E.striaticalyx and
E.tereticornis (van der Moezel et al. 1991). The mixed result demonstrates the complexities
involved with mimicking field conditions and extrapolating findings from general research
for practical application at a site.
E.camaldulensis, the most widespread Australian eucalypt (Bell 1999), is known for its
ability to tolerate saline and waterlogged conditions (Sun and Dickinson 1993). Marshall et
al. (1997) identified E.camaldulensis as one of the most effective native species for
reclaiming agricultural land affected by waterlogging and salinity because of its ability to
tolerate these conditions. Akilan et al. (1997) compared two clones of E.camaldulensis and
found one clone to be more tolerant of waterlogging with freshwater based on the
production of adventitious roots, however neither clone produced adventitious roots under
waterlogging with saline water. Akilan et al. (1997) suggested that both clones could
experience reduced growth, water use and perhaps mortality in highly saline discharge
areas.
2.10 Tolerance of Melaleuca species to salinity and waterlogging
Mattiske Consulting (2005) observed 50% death of Melaleuca species at 2000 ECe mS/m in
a field survey at Lake Bryde and observed that between 1000-3000 ECe mS/m melaleucas
began to disappear from communities.

56
van der Moezel et al. (1991) compared twenty Melaleuca species for tolerance to the
individual and combined effects of salinity and waterlogging and found M.sp.aff.lanceolata,
M.lateriflora and M.thyoides to be the most tolerant to the combined effects of salinity and
waterlogging based on their relative growth. Salter et al. (2007) found M.ericifolia could
tolerate waterlogging at low salinities, however seedlings died rapidly when exposed to the
combined stress of high salinity levels and waterlogging. van der Moezel et al. (1991) also
found M.ericifolia was intolerant to the effects of high levels of salinity and waterlogging.
The natural range of the species van der Moezel et al. (1991) found to be highly tolerant are
not surprisingly associated with saline conditions. M.lanceolata is typically found along
limestone ridges, coastal cliffs and dunes, salt flats and near salt lakes (Western Australian
Herbarium 1998). M.thyoides occurs along the margins of salt lakes, floodplains, river
banks and M.lateriflora is distributed through winter-wet flats, floodplains, creek-lines,
swampy and saline flats (Western Australian Herbarium 1998).
2.11 Tolerance of Acacia species to salinity and waterlogging
In a glasshouse experiment Craig et al. (1990) found acacias were generally highly tolerant
to salt but sensitive to waterlogging and most sensitive to the combined effect of salinity
and waterlogging. A.aff.lineolata and A.mutabilis subsp. stipulifera were the most tolerant
of the combined effect of salinity and waterlogging (Craig et al. 1990). Craig et al. (1990)
collected seeds of A.redolens and A.patagiata from different provenances of varying soil
salinities and found that growth and mortality was not correlated with provenance, however
the concentration of Na+ accumulated by plants was much higher in plants from areas with
lower salinity. Craig et al. (1990) explained Acacia species in the field most likely
57
maximize growth under suitable conditions and survive unsuitable conditions by limiting
growth or through other adaptations, therefore individuals would be able to survive given
the natural spatial and temporal variation of salinity in the field. This finding highlights the
limitations of glasshouse experiments which use growth and mortality to measure tolerance
of species over a short period of time.
2.12 Tolerance of Casuarina species to salinity and
waterlogging
Casuarinas are among the most tolerant native species to the effects of waterlogging and
salinity (Bell 1999). Casuarinas are quick-growing and are valued for their timber
properties, as windbreaks, for erosion control and landscaping and they are capable of
tolerating extreme stresses such as waterlogging and salinity (Subbarao and Rodriguez-
Barrueco 1995). C.equisetifolia has been planted extensively in China since 1954 to
stabilize sand dunes and provide windbreaks and timber used for house construction, boats,
furniture and fuel (Turnbull 1981).
van der Moezel et al. (1989) screened seven Casuarina species for their tolerance to the
combined effect of salinity and waterlogging and found C.obesa was the most tolerant
species followed by C.glauca, C.equisetifolia var. equisetifolia, C.equisetifolia var. incana,
C.cristata and C.cunninghamiana. Clemens et al. (1983) found that C.cunninghamiana
had the highest rate of germination at concentrations of 20 m mol dm-3 NaCl (approximately
2 EC mS/m), when compared to 6 other Casuarina species, however experimentation did
not attempt to mimic natural salinity fluctuations which would presumably be more gradual.
At three months old, seedlings of C.cunninghamiana were one of the most sensitive
58
Casuarina species to the combined effect of salinity and waterlogging (van der Moezel et
al. 1989).
El-Lakany and Luard (1982) found C..glauca, C.equisetifolia var incana and C.obesa could
tolerate up to 550 m mol dm-3 NaCl (approximately 5740 EC mS/m), C.cunninghamiana
could tolerate up to 450 m mol dm-3 (approximately 4700 EC mS/m) and the least tolerant
species, C.decaisneana tolerated up to 50 m mol dm-3 NaCl (approximately 520 mS/m).
van der Moezel et al. (1988) found that the growth of 3 month old seedlings of C.obesa
decreased under saline waterlogged conditions but had 100% survival. At Lake Toolibin,
C.obesa death was attributed to salinity rather than waterlogging (Froend et al. 1987).
Intraspecific variation is significant in casuarinas which may be explained by their wide
distribution (El-Lakany and Luard 1982). Significant variation has been found in C.glauca
(El-Lakany and Luard 1982; Shepard and El-Lakany 1983; Subbarao and Rodriguez-
Barrueco 1995), C.cunninghamiana (van der Moezel et al. 1989) and C.cristata (van der
Moezel et al. 1989).
Results from experiments which found C.obesa and C.glauca (El-Lakany and Luard 1982;
van der Moezel et al. 1989) to be highly tolerant to salinity and waterlogging are supported
by their natural distribution. C.obesa is mainly found in south-western Australia in flats
near high tide limits, river banks, the edges of salt lakes and on a wide range of sands and
silts (Doran and Hall 1981). C.glauca is distributed along a narrow coastal belt in eastern
Australia and is typically found on swampy flats with shallow watertables, near estuaries
and along tidal reaches of rivers (Doran and Hall 1981).
59
2.13 Conclusion
The majority of research into the tolerance of native species to salinity and waterlogging is
designed to find the most tolerant species for propagation and large-scale planting to restore
the natural water balance that existed pre-clearing. Restoration of the natural water balance
through reforestation has varying success and may not be suitable or practical for all areas
therefore other management options such as drainage and pumping may be required for
areas that require immediate management.
Knowledge of the thresholds of species to waterlogging and salinity is important for the
design of engineering solutions, for example to determine the depth to lower groundwater
levels to through pumping and the timing and frequency of flooding for surface drainage.
Due to large temporal and spatial variation of salinity and waterlogging in a natural setting,
field experiments can be expensive and difficult to control therefore glasshouse experiments
are usually preferred because they are cheaper and easier to manage (Niknam and McComb
2000). Extrapolation of results from glasshouse experiments designed to find the most
tolerant species has limited value for application of direct conservation approaches. Instead
experiments should be designed to quantify tolerance ranges to salinity and waterlogging for
species.
Results of screening experiments find the most tolerant species under the specific conditions
imposed in a particular experiment, but experimental variation such as the rate of
salinization or duration of inundation may suppress a species adaptive ability or temporally

60
enhance it producing conflicting tolerance ranges depending on experimental parameters
(Niknam and McComb 2000).
Without direct intervention, species listed as conservation priorities may be lost as a result
of altered hydrological regimes. There are significant management implications for playas
because they have the potential to be used as storage basins or receiving basins for water
diverted from priority assets. The playas hydrological regimes may also be manipulated to
protect the vegetations ecological water requirements. Management implications involve
uncertainty of exactly what hydrologic conditions or regimes should be restored to maintain
ecological function in the systems where water is being diverted out of and the requirements
of systems where water is being diverted into. The expense of engineering solutions can be
minimized with knowledge of the minimum requirements necessary for efficient and
effective results.
To protect conservation priorities, knowledge of their tolerance range can be acquired in
field experiments which link site specific conditions such as degree of waterlogging and
salinity to relative vegetation health. Tolerance ranges will help to identify species that
require direct conservation and guide management decisions when setting conservation
priorities.
2.14 References
Akilan, K., R. C. C. Farrell, D. T. Bell, and J. K. Marshall. 1997. Responses of clonal river
red gym (Eucalyptus camaldulensis) to waterlogging by fresh and salt water. Australian
Journal of Experimental Agriculture 37:243-248.
61
Barrett-Lennard, E. G. 2003. The interaction between waterlogging and salinity in higher
plants: causes, consequences and implications. Plant and Soil 253:35-54.
Barrett-Lennard, E. G., P. D. Leighton, I. R. McPharline, T. Setter, and H. Greenway. 1986.
Methods to Experimentally Control Waterlogging and Measure Soil Oxygen in Field Trials.
Aust. J. Soil Res. 24:477-483.
Bell, D. T. 1999. Australian Trees for the Rehabilitation of Waterlogged and Salinity-
damaged Landscapes. Australian Journal of Botany 47:697-716.
Bell, D. T., and R. H. Froend. 1990. Mortality and growth of tree species under stress at
Lake Toolibin in the Western Australian Wheatbelt. Journal of the Royal Society of Western
Australia 72:63-66.
Bramley, H., J. Hutson, and S. D. Tyerman. 2003. Floodwater infiltration through root
channels on a sodic clay floodplain and the influence on a local tree species Eucalyptus
largiflorens. Plant and Soil 253:275-286.
Brooker, M. I. H and Klenig, D. A. 1994. Eucalypts: an introduction. In Woinarski, J.,
Williams, J. editors. Eucalypt ecology: Individuals to ecosystems. Cambridge University
Press, 1-15.

62
Clemens, J., L. C. Campbell, and S. Nurisjah. 1983. Germination, growth and mineral ion
concentrations of Casuarina species under saline conditions. Australian Journal of Botany
31:1-9.
Cofinas M, Creighton C (2001) Australian Native Vegetation Assessment: Biodviersity and
Vegetation - Esperance Plains. In: National Land and Water Resources Audit, Department
of the Environment and Water Resources, Australian Government, Canberra, ACT.
Available via
http://www.anra.gov.au/topics/vegetation/pubs/native_vegetation/nat_veg_appendix7.
html. Accessed 15 Jan 2008
Craig, G. F., D. T. Bell, and C. A. Atkins. 1990. Response to salt and waterlogging stress of
ten taxa of Acacia selected from naturally saline areas of Western Australia. Australian
Journal of Botany 38:619-630.
Cramer, V. A., and R. J. Hobbs. 2002. Ecological consequences of altered hydrological
regimes in fragmented ecosystems in southern Australia: Impacts and possible management
options. Austral Ecology 27:546-564.
Cramer, V. A., R. J. Hobbs, L. Atkins, and G. Hodgson. 2004. The influence of local
elevation on soil properties and tree health in remnant eucalypt woodlands affected by
secondary salinity. Plant and Soil 265:175-188.
Davis, J. A., and Froend, R. 1999. Loss and degradation of wetlands in southwestern
Australia: underlying causes, consequences and solutions. Wetlands Ecology and
63
Management, 7, 13-23.
Doran, J. C., and N. Hall. 1981. Notes on Fifteen Australian Casuarina Species. In S. J.
Midgley, Turnbull, J.W. and Johnston, R.D., editors. Casuarina Ecology, Management and
Utilization. CSIRO, Melbourne, Canberra pp 19-52.
El-Lakany, M. H., and E. J. Luard. 1982. Comparative Salt Tolerance of Selected
Casuarina Species. Australian Forestry Research 13:11-20.
Farrington, P., and R. B. Salama. 1996. Controlling dryland salinity by planting trees in the
best hydrogeological setting. Land Degradation & Development 7:183-204.
Farrington, P., R. B. Salama, G. D. Watson, and G. A. Bartle. 1992. Water use of
agricultural and native plants in a Western Australian wheatbelt catchment. Agricultural
Water Management 22:357-367.
Froend, R. H., Halse, S . A. and Storey, A. W. 1997. Planning for the recovery of Lake
Toolibin, Western Australia. Wetlands Ecology and Management, 5, 73-85.
Froend, R. H., E. M. Heddle, D. T. Bell, and J. McComb. 1987. Effects of salinity and
waterlogging on the vegetation of Lake Toolibin, Western Australia. Australian Journal of
Ecology 12:281-298.
George, R, Coleman, M. 2001. Hidden menace or opportunity – Groundwater hydrology,
playas and commercial options for salinity in wheatbelt valleys. In: Dealing with Salinity in

64
Wheatbelt Valleys: Processes, Prospects and Practical Options Conference, 30 July to 1
August 2001 Merredin. Reviewed August 2006. Available from:
http://portal.water.wa.gov.au/portal/page/portal/WaterManagement/Salinity/ProgramMgtCo
ordination/Content/SALINITY_WHEATBELTVALLEYS.pdf, Merredin.
George, R., D. McFarlane, and B. Nulsen. 1997. Salinity Threatens the Viability of
Agriculture and Ecosystems in Western Australia. Hydrogeology Journal 5:6-21.
George, R. J., R. A. Nulsen, R. Ferdowsian, and G. R. Raper. 1999. Interactions between
trees and groundwaters in recharge and discharge areas- A survey of Western Australian
sites. Agricultural Water Management 39:91-113.
Goslee, S. C., R. P. Brooks, and C. A. Cole. 1997. Plants as indicators of wetland water
source. Plant Ecology 131:199-206.
Hatton, T. J., and R. A. Nulsen. 1999. Towards achieving functional ecosystem mimicry
with respect to water cycling in southern Australian agriculture. Agroforestry Systems
45:203-214.
Hatton, T. J., J. Ruprecht, and R. J. George. 2003. Preclearing hydrology of the Western
Australia wheatbelt: Target for the future? Plant and Soil 257:341-356.
Keighery, G. J., S. Halse, and N. McKenzie. 2001. Why wheatbelt valleys are valuable and
vulnerable: the ecology of wheatbelt valleys and threats to their survival. In: Dealing with
Salinity in Wheatbelt Valleys: Processes, Prospects and Practical Options Conference, 30

65
July to 1 August 2001 Merredin. Reviewed August 2006.
http://portal.water.wa.gov.au/portal/page/portal/WaterManagement/Salinity/ProgramMgtCo
ordination/Content/SALINITY_WHEATBELTVALLEYS.pdf, Merredin.
Ladiges, P. Y., and A. Kelso. 1977. The Comparative Effects of Waterlogging on two
Populations of Eucalyptus viminalis Labill. and one Population of E.ovata Labill. Australian
Journal of Botany 25:159-169.
Marshall, J. K., A. L. Morgan, K. Akilan, R. C. C. Farrell, and D. T. Bell. 1997. Water
uptake by two river red gum (Eucalyptus camaldulensis) clones in a discharge site
plantation in the Western Australian wheatbelt. Journal of Hydrology 200:136-148.
Mattiske Consulting Pty. Ltd. 2005. Review of risks associated with environmental impact
assessment of the surface water management proposal for the Lake Bryde Recovery
Catchment. report to Department of Conservation and Land Management.
Meddings, R. L. A., McComb, J.A. and Bell, D. T. 2001. The salt-waterlogging tolerance
of Eucalyptus camaldulensis x E.globulus hybrids. Australian Journal of Experimental
Agriculture, 41: 787-792.
McFarlane, D., R. J. George, and P. A. Caccetta. 2004. The extent and potential area of salt-
affected land in Western Australia estimated using remote sensing and digital terrain
models. in 1st National Salinity Engineering Conference, Perth, Western Australia.

66
Myers, N., R. A. Mittermeier, C. G. Mittermeier, G. A. B. da Fonseca, and J. Kent. 2000.
Biodiversity hotspots for conservation priorities. Nature 403:853 - 858.
Niknam, S. R., and J. McComb. 2000. Salt tolerance screening of selected Australian woody
species - a review. Forest Ecology and Management 139:1-19.
Pannell, D. J., and M. A. Ewing. 2004. Managing secondary dryland salinity: Options and
challenges. In New directions for a diverse planet. Proceedings of the 4th International
Crop Science Congress. Published on CDROM, Brisbane, Australia.
Salter, J., K. Morris, P. C. E. Bailey, and P. I. Boon. 2007. Interactive effects of salinity and
water depth on the growth of Melaleuca ericifolia Sm. (Swamp paperbark) seedlings.
Aquatic Botany 86 (3): 213-222.
Scheffer, M., and S. R. Carpenter. 2003. Catastrophic regime shifts in ecosystems: linking
theory to observation. Trends in Ecology and Evolution 18:648-656.
Schofield, N. J. 1992. Tree planting for dryland salinity control in Australia. Agroforestry
Systems 20:1-23.
Shepard, K. R., and M. H. El-Lakany. 1983. A provenance trial of Casuarina glauca and
C.cunninghamiana. In S. J. Midgley, Turnbull, J.W. and Johnston, R.D., editors. Casuarina
Ecology, Management and Utilization pp 122-125. Proceeding of an international
workshop, Canberra, Australia, 17-21 August 1981. CSIRO Division of Forest Research,
Canberra.
67
Stolte, W. J., D. J. McFarlane, and R. J. George. 1997. Flow systems, tree plantations, and
salinization in a Western Australian catchment. Australian Journal of Soil Research
35:1213-1229.
Subbarao, N. S., and C. Rodriguez-Barrueco. 1995. Casuarinas. Science Publishers, Inc. 52
LaBombard Road, North Lebanon, NH 03766, USA.
Sun, D., and G. R. Dickinson. 1993. Responses to salt stress of 16 Eucalyptus species,
Grevillea robusta, Lophostemon confertus and Pinus caribaea var hondurensis. Forest
Ecology and Management 60:1-14.
Thomson, L. A. J., Morris, J. D., and Halloran G. M. 1987. Salt tolerance in eucalypts. In
Rana R.S. (ed.), Afforestation of Salt-Affected Soils. Proceedings International Symposium,
Volume 3. Central Soil Salinity Research Institute, Karnal, India 3: pp. 1–12.
Thorburn, P. J., G. R. Walker, and I. D. Jolly. 1995. Uptake of saline groundwater by plants:
An analytical model for semi-arid and arid areas. Plant and Soil 175:1-11.
Turnbull, J. W. 1983. The use of Casuarina equisetifolia for protection forests in China. In
Midgley, S. J., Turnbull, J.W. and Johnston, R.D., editors. Casuarina Ecology, Management
and Utilization. pp 55-57. Proceeding of an international workshop, Canberra, Australia,
17-21 August 1981. CSIRO Division of Forest Research, Canberra.
van der Moezel, P. G., and D. T. Bell. 1990. Saltland reclamation: selection of superior
Australian tree genotypes for discharge sites. Proc. Ecol. Soc. Aust. 16:545-549.
68
van der Moezel, P. G., G. V. N. Pearce-Pinto, and D. T. Bell. 1991. Screening for salt and
waterlogging tolerance in Eucalyptus and Melaleuca species. Forest Ecology and
Management 40:27-37.
van der Moezel, P. G., C. S. Walton, G. V. N. Pearce-Pinto, and D. T. Bell. 1988. The
Response of Six Eucalyptus Species and Casuarina obesa to the combined effect of salinity
and waterlogging. Aust. J.Plant Physiol. 15:465-474.
van der Moezel, P. G., C. S. Walton, G. V. N. Pearce-Pinto, and D. T. Bell. 1989. Screening
for salinity and waterlogging tolerance in five Casuarina Species. Landscape and Urban
Planning 17:331-337.
Wardell-Johnson, G. W., J. E. Williams, K. D. Hill, and R. Cumming. 1997. Evolutionary
biogeography and contemporary distribution of Eucalypts. In J. Williams and J. Woinarski,
editors. Eucalypt Ecology: Individuals to Ecosystems. Cambridge University Press, 92-128.
Western Australian Herbarium 1998–. FloraBase - The Western Australian Flora.
Department of Environment and Conservation. [Internet] http://florabase.dec.wa.gov.au.
[cited 2007 Oct 10].
Williams, J., and J. Woinarski. 1997. Eucalypts: an introduction. In J. W. Williams, J.,
editors. Eucalypt Ecology: Individuals to ecosystems. Cambridge University Press, 1-15.
69
Chapter 3. Composition and relative health of remnant vegetation fringing lakes along a salinity and waterlogging gradient

70
71
Abstract
Extensive land clearing for agriculture in south-west Western Australia has led to highly
fragmented patches of remnant vegetation. In this landscape, the fringing vegetation of lakes
has an important conservation value in a biologically diverse region but is vulnerable to
altered hydrological regimes and easily degraded by waterlogging and salinity. Protection of
the fringing vegetation with direct intervention approaches such as drainage or pumping
schemes requires knowledge of the tolerance or ‘coping’ range of species targeted for
conservation. To obtain this information the health of vegetation in relation to waterlogging
and salinity is assessed in two lake systems north of Esperance in south-western Australia.
The lower reaches of both systems are dominated by healthy halophytic species.
Mesophytes, phreatophytes, xerophytes and combinations of these classes dominate the
upper reaches but are mostly degraded. There are unhealthy and healthy pockets of
mesophytic, phreatophytic and xerophytic species, together with combinations of these
classes occurring at similar elevations above shallow groundwater, indicating that temporal
hydroperiod thresholds are important for these species.

72
73
3.1 Introduction
In Australia, secondary dryland salinity has resulted from extensive clearing of native perennial
vegetation and subsequent replacement with shallow-rooted annual crops, causing the
watertable to rise, mobilizing salts stored in the unsaturated zone and bringing them to the
surface, particularly in low-lying locations (Bell 1999; Stolte et al. 1997; Farrington and Salama
1996).
Native vegetation of Western Australia is generally more salt tolerant than recently introduced
species, but in groundwater discharge areas throughout Western Australia there are signs that
many native species are unable to cope with increased salinity and waterlogging brought about
by land clearing (George et al. 1999).
Most wetlands in the West Australian wheatbelt have been severely degraded and populations
of Eucalyptus, Casuarina and Melaleuca species could become extinct at local and regional
levels (George et al. 1997). More than 93% of native vegetation in the wheatbelt has been
cleared (Cramer et al. 2004), so the fringing vegetation of playa lakes are important remnants of
a biologically diverse region that are now threatened by altered hydrological regimes.
In a wetland, community composition and plant distribution are primarily determined by site
environmental characteristics such as water chemistry and hydroperiod (flooding depth,
frequency, duration and seasonality) (Goslee et al. 1997). Rising groundwater alters the water
balance of wetlands, changing the flooding regime as well as the degree and rate of salinization
(George and Coleman 2001). Altered hydrological regimes can lead to a loss of biological
diversity and changes in plant species composition (Davis and Froend 1999; George and

74
Coleman 2001). Most plants have very specific hydroperiod thresholds, which if crossed can
result in mortality and lead to changes in the composition of communities (George and Coleman
2001).
Subtle differences of less than 0.2 m in topography can buffer the seasonal effects of salinity
and waterlogging, but vegetation can be severely impacted by extreme and episodic events
(Cramer et al. 2004). There has been a significant decline in annual rainfall in south-west
Western Australia and more intense summer rainfall events from 1911 to 1990 (Yu and Neil
1993). Heavy summer rainfall has reportedly caused rapid expansion of salinity the following
year in some areas of the north-eastern wheatbelt (McFarlane and Ruprecht 2005). Although
extreme events are difficult to predict, most Global Climate Models forecast an increase in
extreme daily rainfall (in response to rising atmospheric temperatures) as a broad global trend
(Ruprecht et al. 2005).
Post-clearing groundwater rise has diminished the storage capacity of the unsaturated zone,
particularly in valley areas. This reduction in storage leads to more severe flooding and a longer
period of inundation and waterlogging following intense rainfall events. The region of
Esperance on the southern coast of south-west Australia experienced two extreme summer
rainfall events in 1999 and 2007 leading to regional flooding and in effect, a second winter in
terms of the watertable response after the intense rainfall event in 2007. The 2007 event was
triggered by cyclonic activity in North Western Australia, with the dissipating cyclone tracking
south to Esperance through central Western Australia (Bureau of Meteorology 2007).
Within the coastal catchments of south-west Australia factors such as position in the
landscape, topographical location and hydrogeological setting influence the susceptibility of

75
vegetation communities to extreme events and require consideration when designing
conservation plans. More intense events and longer dry periods between rainfall events will
alter the pattern of inundation and waterlogging spatially and temporally for the fringing
vegetation of lakes.
Predicted climate change scenarios have serious implications for the management of playa
lakes and their hydrological regimes. In the event of more extreme rainfall events and long
dry periods playa lakes could be used as storage basins to protect other assets from flood
damage. However, altering hydrological regimes for storage could lead to degradation of the
fringing vegetation. The hydrological regimes of playa lakes could alternatively, be
managed to restore previous conditions required by ecosystems or conservation priorities.
At present, the conditions that can be withstood by playa lake vegetation are largely
unknown.
If conservation priorities are to be protected with direct management approaches (such as
drainage or pumping schemes), then knowledge of the tolerance ranges of the species
targeted for conservation is required. Such information can be acquired from field studies
that link site specific conditions such as degree of waterlogging and salinity to relative
vegetation health.
The objectives of this study are to assess the health of vegetation in relation to the degree of
waterlogging and salinity in two adjacent lake systems in order to improve understanding of
the risks to vegetation posed by salinity and waterlogging.
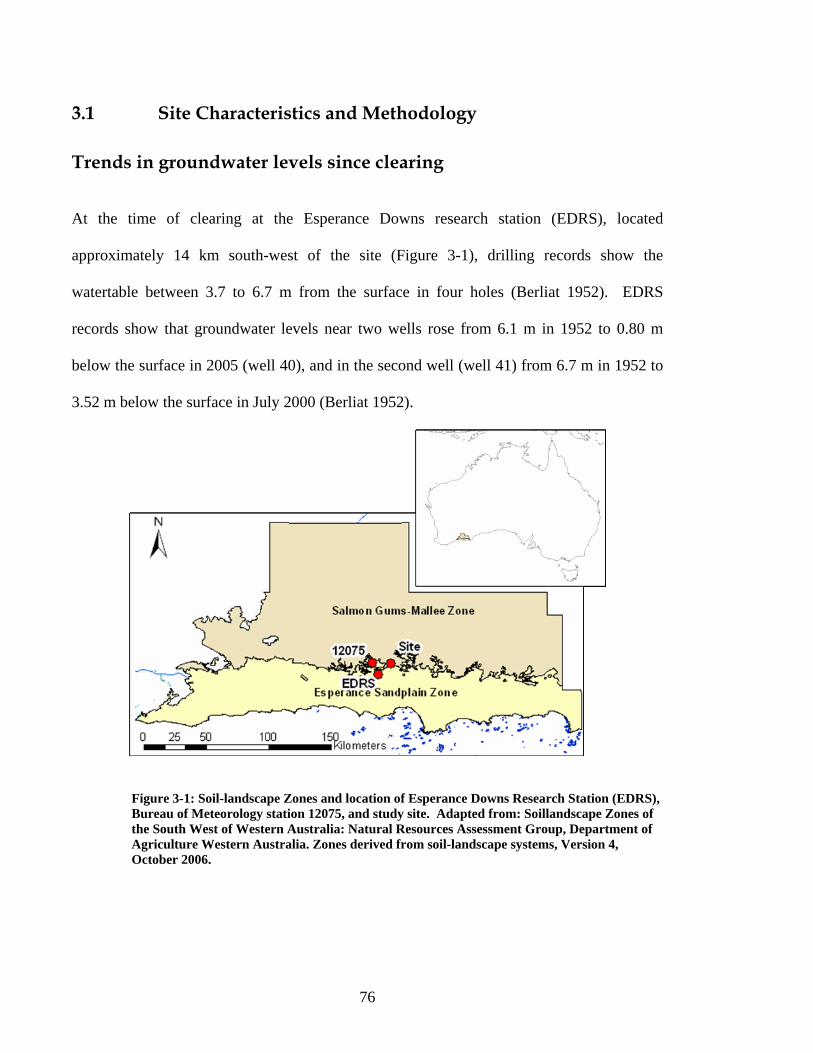
76
3.1 Site Characteristics and Methodology
Trends in groundwater levels since clearing
At the time of clearing at the Esperance Downs research station (EDRS), located
approximately 14 km south-west of the site (Figure 3-1), drilling records show the
watertable between 3.7 to 6.7 m from the surface in four holes (Berliat 1952). EDRS
records show that groundwater levels near two wells rose from 6.1 m in 1952 to 0.80 m
below the surface in 2005 (well 40), and in the second well (well 41) from 6.7 m in 1952 to
3.52 m below the surface in July 2000 (Berliat 1952).
Figure 3-1: Soil-landscape Zones and location of Esperance Downs Research Station (EDRS), Bureau of Meteorology station 12075, and study site. Adapted from: Soillandscape Zones of the South West of Western Australia: Natural Resources Assessment Group, Department of Agriculture Western Australia. Zones derived from soil-landscape systems, Version 4, October 2006.

77
In the Esperance sandplain the median groundwater depth is 2.1 m but groundwater ranges
from the surface to 18 m below the surface (Massenbauer 2007) (Figure 3-1). The median
salinity of groundwater in the Esperance sandplain is 1,700 mS/m but ranges from 75 to
20,000 mS/m (Massenbauer 2007). Groundwater levels in almost half of the 208
monitoring bores in the Esperance sandplain are rising at a rate of 0.03 to 0.25 m/yr, and in
the remainder, groundwater levels are static or declining by <0.03 m/yr (Massenbauer
2007). Bores with rising groundwater levels are located in the Salmon Gums mallee zone
and in the southern part of the Esperance sandplain zone where groundwater is deeper than
5 m (Massenbauer 2007) (Figure 3-1).
Declining groundwater levels as a result of below average rainfall from 1994 to 1998 and
2002 or because of increased water use by perennial plants, occur throughout the area.
Declining groundwater levels are observed in bores with shallow groundwater levels which
respond to seasonal rainfall and slightly deeper levels that respond to annual and episodic
rainfall (Massenbauer 2007). Although a declining trend has been observed in some bores
throughout the region the rate of decline is very slow. Extreme summer rainfall events can
significantly increase recharge and without intervention areas currently affected by salinity
and waterlogging will not recover.
Vegetation surveys
Two vegetation surveys were undertaken to assess the health of vegetation fringing a chain
of lakes on the floodplain of the Esperance plains and an adjacent lake disconnected from
the floodplain by a road and from the regional groundwater system by a basement sill.
These two systems are subsequently referred to as ‘online’ (connected via a floodplain) and

78
‘offline’ (no floodplain connection) as displayed in the digital elevation model (DEM) in
Figure 3-2.
Figure 3-2: Site Map. Easting: 395800; Northing: 6290800 Coramup Creek Catchment. Observation wells (A-N) and Standing Pipes (SP) are symbolized as black circles and the red lines are the vegetation transects.
The number alive, number dead, percentage of alive cover and percentage of dead cover
was measured in 1 m by 1 m quadrats along transects varying from 20 m to 200 m in length
and covering 2.92 km in total. The transects were orthogonal to the flowline and
encompassed a range of surface elevations north and south of the lakes. The quadrats were
measured 1 m north and 1 m south of each main transect so transects are referred to as the
number of the transect with the suffix N or S. All of the transects were continuous, except
for 2 and 3 in the offline system which were disconnected over the offline lake (Figure 3-2).
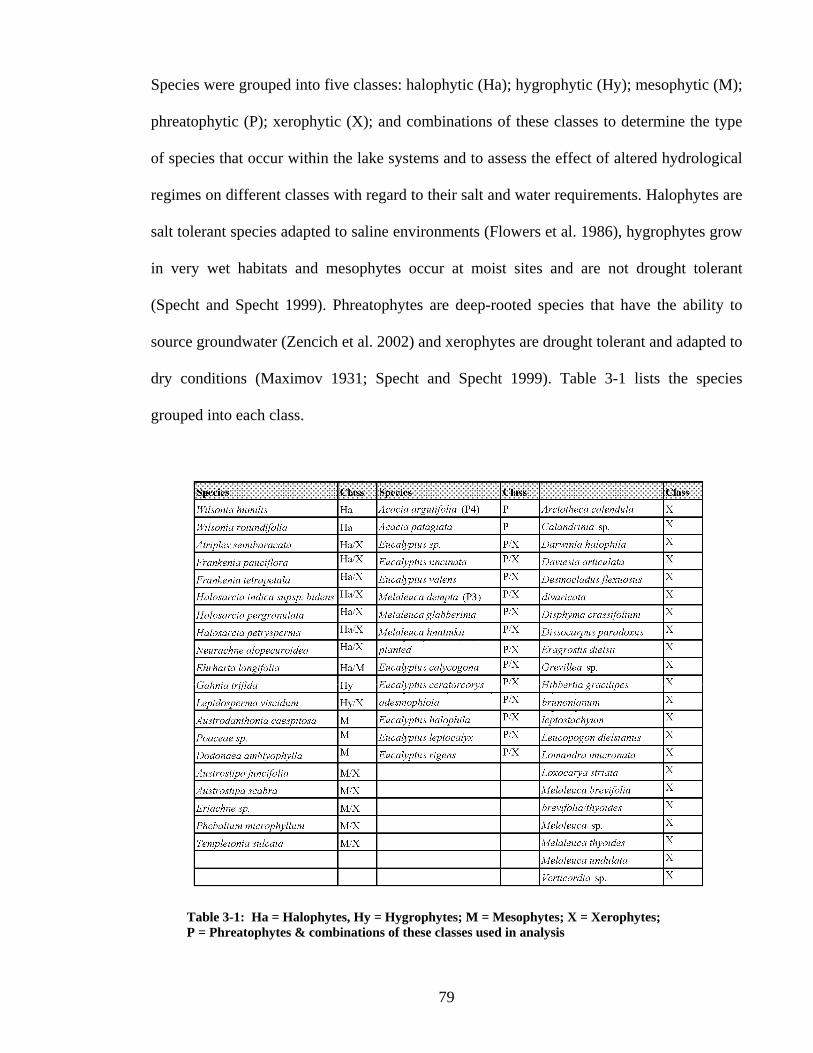
79
Species were grouped into five classes: halophytic (Ha); hygrophytic (Hy); mesophytic (M);
phreatophytic (P); xerophytic (X); and combinations of these classes to determine the type
of species that occur within the lake systems and to assess the effect of altered hydrological
regimes on different classes with regard to their salt and water requirements. Halophytes are
salt tolerant species adapted to saline environments (Flowers et al. 1986), hygrophytes grow
in very wet habitats and mesophytes occur at moist sites and are not drought tolerant
(Specht and Specht 1999). Phreatophytes are deep-rooted species that have the ability to
source groundwater (Zencich et al. 2002) and xerophytes are drought tolerant and adapted to
dry conditions (Maximov 1931; Specht and Specht 1999). Table 3-1 lists the species
grouped into each class.
Table 3-1: Ha = Halophytes, Hy = Hygrophytes; M = Mesophytes; X = Xerophytes; P = Phreatophytes & combinations of these classes used in analysis

80
A second survey of Eucalyptus species was performed along the same transect lines using
larger (10 m) quadrats north and south of the transect line. The position of each tree was
recorded according to its distance along the transect and bearing (east or west of the main
transect). The health of each Eucalypt was assessed by the condition of foliage and cover.
Each stem was rated individually on a scale of 1 to 5 ranging from healthy (1) to dead (5).
Digital elevation models were constructed of the two lake areas with approximately 7000
GPS points taken with Sokkia Radian IS RTK equipment (horizontal accuracy of 10 mm
and a vertical accuracy of 20 mm). The points were interpolated using the triangulated
irregular network (TIN) method. The TINs were then converted to raster grids and the
surface elevation for each quadrat was extracted from the grids.
Hydrogeology and Salinity
Twenty six shallow observation wells were installed along three parallel transects, through
the middle of the online and offline lakes and north and south of the flowline (Figure 3-2).
The wells were 3 m deep and screened 2.5 to 3 m below the surface with a gravel filter
pack. Four deeper wells were drilled to 6 m and screened 5.5 to 6 m below the surface with
a gravel filter pack. Four piezometers were installed in the lakes and screened from
approximately 0.1 to 1.0 m above the surface to record surface water levels. Each
piezometer and observation well was fitted with automated Odyssey data loggers
programmed to record water levels at 30 minute intervals over a 12 month period. A
tipping bucket raingauge, located in the online lake system was also fitted with an Odyssey
data logger and recorded rainfall in 2 mm increments.
81
After establishing that the water table beneath the site is relatively flat the groundwater level
beneath the vegetation transects was approximated with the following planar equation:
(1) ax + by + c = d
where x, y (m) are the easting and northing coordinates of three wells used in the
planar equation;
a, b and c (m) are temporally variant coefficients (daily time-step)
and d (m) is the groundwater datum
The online wells used in the planar equation, J, B and H were chosen based on their position
around the lakes and their similar response to the rainfall signal. The offline wells chosen
for the same reason were C, G and A. The daily average depth to groundwater underneath
the vegetation transects were calculated using equation (1) and by subtracting the
groundwater level from the ground surface extracted from the raster.
Groundwater salinity for the vegetation quadrats was approximated using data collected
from the deep observation wells, and shallow observation wells E and K in the online
system and A and E in the offline system. Using ArcGIS, salinity transects were created
between the well locations where samples were taken and a salinity gradient was calculated
assuming the salinity varied linearly between points. Data collected on the 18th of August
2006 was used as a representative snapshot of salinity for winter when it is at its lowest over
an annual cycle. The precise easting and northing position was recorded where the salinity
transects intersected vegetation transects and a salinity value for each intersection point was
interpolated from the salinity surface. Where a vegetation transect only intersected two
salinity transects, salinity or vegetation transects were extended in the same direction using
82
ArcGIS until they crossed to achieve a minimum of three intersection points. The r2 for the
intersection points along each vegetation transect (calculated with different salinity
gradients) varied from 0.74 – 0.99. Salinity was approximated for each vegetation quadrat
using linear regression on the intersection points.
For analysis of the average groundwater and salinity levels for vegetation classes the
combined averages (N and S) were calculated for the continuous vegetation transects (1, 4,
5, 6, 7, 8 and 9) (Table 3-2). For the broken transects, averages (N and S) were calculated
for each transect north of the lake (2N and 3N) and each transect south of the lake (2S and
3S) (Table 3-2). Each transect was analyzed separately for the distribution of vegetation
classes along an elevation gradient and transect (Figure 3-6).
In this study we did not measure redox potential. However, pH was high (basic) across both
systems (groundwater pH ranged from 6.1 - 8 in the online system and 6 - 7.8 in the offline
system) and previous studies have reported a negative correlation between redox potential
and pH (Bohrerova et al. 2004; Yli-Halla et al. 1999). This simplified our analysis to a
consideration of waterlogging (hydroperiod) and salinity impacts.
3.2 Results
Hydrology
Since 1950 on average the Esperance Bureau of Meteorology station 12075 (located
approximately 12 km from the site) has received most of its annual rainfall during the
winter months (Figure 3-1; Figure 3-3). January is typically a dry summer month receiving

83
an average 18 mm (B.O.M. data from 1950 to 1997). Two extreme summer rainfall events
in 1999 and 2007 resulted in severe flooding. In January 1999, 204 mm of rainfall was
recorded over two days at B.O.M. station 12075 and in January 2007, 121 mm was recorded
over 3 days at the site rain-gauge. The 1999 and 2007 events comprised most of the January
total recorded for the respective years and stations.
Figure 3-3: Long-term monthly average rainfall and monthly totals for 1999, 2006 and 2007 (Long-term rainfall data and 1999 data courtesy of Esperance BOM- station 12075) (Latitude 33° 31'02"S Longitude 121°45'00"E).
In 2006 the site rain-gauge recorded a total winter rainfall of 158 mm. In comparison, the
Esperance Airport B.O.M. station recorded a total of 141.8 mm of winter rainfall (Bureau of
Meteorology station 009542: Latitude: 33.68 °S Longitude: 121.83 °E). Unfortunately
station 12075 stopped recording in 1998 and the records are sporadic from 1999-2004,
however continuous data from 1987-1997 shows the average winter rainfall at station 12075
is 174.74 mm. The average winter rainfall recorded at Esperance Airport from 1996-2005 is
226 mm and ranged from 160 mm in 2000 to 275 mm in 2003. Based on these averages the

84
degree of waterlogging estimated with data recorded during the winter of 2006 is
conservative compared to the conditions the vegetation would have experienced over the
last twenty years.
Groundwater monitoring shows that groundwater levels usually rise after the onset of winter
rains, and fall later in the season as rainfall diminishes and evaporation increases. After the
extreme storm event on the 5th January 2007 the lakes effectively experienced a second
winter in terms of groundwater rise, with monthly hydrographs (Figure 3-4) showing the
groundwater recession after the extreme summer event was similar to the winter recession.
The monthly average groundwater levels in Figure 3-4 represent the depth below the
ground (DBG) in metres for each well. The extreme summer rainfall resulted in both
systems, but more significantly the offline system (Figure 3-4b), experiencing an increased
hydroperiod over an annual cycle. In the offline system the magnitude of the summer event
resulted in a significantly higher rise in groundwater levels during summer compared to the
rise during winter and in contrast to the rise in the online system (Figure 3-4a), after the
summer event.
Figure 3-4: Monthly hydrographs for groundwater depth below ground (DBG) in the online (left graph) and offline (right) observation wells from March 31st 2006 to 21st March 2007

85
The online lakes flow in a north-west to south-east direction and consist of approximately 1
km of chain lakes (Figure 3-2). Separated from the online lakes by a basement high, the
offline lake has a different hydrological setting. Located off the floodplain, the offline lake
has a bathymetry resembling a shallow bowl. Bathymetry is the term used to describe the
topography of a lakebed. A bedrock sill disconnects the offline lake from the regional
groundwater system, restricting lateral groundwater movement and causing a significant rise
in the watertable after extreme summer events. Excess rainfall leads to an expansion of the
offline lake margins and ponded water from subsurface saturation does not trigger runoff
even after extreme events; instead excess water is evaporated over time. In the online
system the degree of inundation, temporally and spatially is inferior to the offline lakes
because after ponded water reaches a threshold depth, water spreads out onto the floodplain.
The shallow wells recorded the rise and fall of a shallow unconfined aquifer responding to
rainfall events and fluctuating seasonally. Well G in the online system does not exhibit the
strong seasonal signal exhibited by the other wells and also has a piezometric level that
remains above the surface for the year. Well G was screened through a perched aquifer into
a clay lens. Local groundwater confinement at this well could explain the positive
piezometric head. Groundwater depth in each of the shallow wells was estimated with
equation (1) for snapshots in time and compared to the actual groundwater depth. These
snapshots were selected to compare the waterlogging during a wet period in winter
(24/08/06) and summer (06/01/07) and also during a dry period in summer (01/01/07). With
the exception of wells N and A in the online system the groundwater depth was reasonably
well estimated. Good estimations of groundwater depths were obtained for online wells L
and M, closest to well N, giving confidence in the general watertable approximation. The
underestimated depth of well N (online) is a result of local soil heterogeneity, given that the
86
nearby wells were reasonably well estimated. The poor estimation for well A can be
explained by its position along the flow-line. Interaction between surface water and
groundwater was not accounted for in the one-dimensional model and can explain the
higher approximation error for well A. Since the main objective is the approximation of the
superficial aquifer depth that affects the rooting zone of fringing vegetation, it is the wells
around the lake margins that are of particular interest and estimation of water depths in
these wells was good. The critical depth for groundwater is generally accepted as within 2
m of the surface. At depths less than 2 m capillary rise of saline water results in vegetation
mortality. However, some species may tolerate shallow watertables if salt is flushed
seasonally or if it is not waterlogged (Nulsen 1981; Hodgson et al. 2004).
Salinity
Surface water salinity is reasonably constant through time in the offline lake, averaging
23,800 EC mSm-1. The lowest salinity was recorded after the extreme rainfall event on the
11th January when it was diluted to 17,200 EC mSm-1. Surface water salinity in the online
lake was generally lower than the offline lake by between 2,600- 10,570 EC mSm-1. During
winter rainfall dilutes the surface water in the online system so the difference in salinities
between the lakes is greatest during winter. In the online lake when the surface water levels
rose by 0.23 m the salinity dropped from 23,400 EC mSm-1 on the 15/6/06 to 14,700 EC
mSm-1 on the 05/07/06.
The offline system remained shallow and consequently the salinity remained high, however
water levels did rise to 0.46 m on the 09/09/06 so salinity may have briefly dropped as a
result of dilution but when next sampled on the 27/09/06 the surface water had receded to a
87
depth of 0.22 m and salinity remained high (24,000 EC mSm- 1). After the extreme
summer rainfall event there is no evidence that salts were diluted in either of the main lakes
in both systems, however salinity in the second lake in the online system dropped
significantly. Due to equipment failings there was a data gap preceding the summer storm
from September in the online lake and from October in the offline lake so although the
salinity recorded in January was not low, salinity may have increased over this gap period
and dropped down close to the average when next sampled. Surface water salinity levels
recorded on the 11th January 2007 were close to the average recorded throughout the year in
both lakes.
Groundwater discharge may have negated the dilution of the surface water by rainfall as
salts were carried to the surface via subsurface saturation. Groundwater salinity was higher
on average in the online lake, remaining reasonably stable throughout the year. The
summer rainfall event significantly reduced groundwater salinity in both lakes. Data
collected from the groundwater observation wells in the middle of the lakes dropped from
approximately 21,600 to 2,090 mSm-1 EC (online) and from 17,000 to 5,760 mSm-1
(offline). Throughout the year, groundwater salinity ranged from 11,420 - 17,630 EC mSm-
1 below the online lake and from 4,120 – 19,570 mSm-1 below the offline lake. The drop
in groundwater salinity after the extreme summer rainfall event indicates that salts are
discharged at the surface through subsurface saturation in both lakes but the drop is more
pronounced in the online system.
88
Vegetation
Vegetation communities on the upper slopes range from open mallee woodland with grasses
to grassland communities and at lower positions in the landscape open and closed samphire
communities with clumps and isolated mallees and trees (NVIS classification) (Cofinas and
Creighton 2001). Under the Wildlife Conservation Act 1950, species are listed as priority
flora if they are rare or require special protection (Western Australian Herbarium 1998).
Acacia argutifolia (priority four) and Melaleuca dempta (priority three) were identified in
the survey. Approximately 11% of the vegetation surveyed throughout both lakes was dead.
The vegetation in the offline lake was more degraded than that of the online lake with 19%
and 6% death recorded respectively. The average surface elevation relative to groundwater
is higher for vegetation in the offline lake for the winter snapshot (24/08/06) so the higher
death rate can not be attributed to a higher degree of seasonal waterlogging.
Although the degree of seasonal waterlogging and salinity is lower for the offline system
(with more degraded vegetation) it is more vulnerable to extreme events based on the lakes
hydrogeological setting. Both systems have limited vertical drainage capacity, a
consequence of high watertables and low relief; however vegetation in areas off the
floodplain is subjected to the additional stress of a higher degree of waterlogging temporally
and spatially after extreme events. The offline system is disconnected from the floodplain
and lateral groundwater movement is restricted so in this case, excess water ponds and
slowly evaporates, precipitating salt on the surface in the process.
Areas where groundwater has risen to or above the surface, completely saturating the soil
profile, are defined as saturated areas for the 6th of January 2007 (shown in black) and the
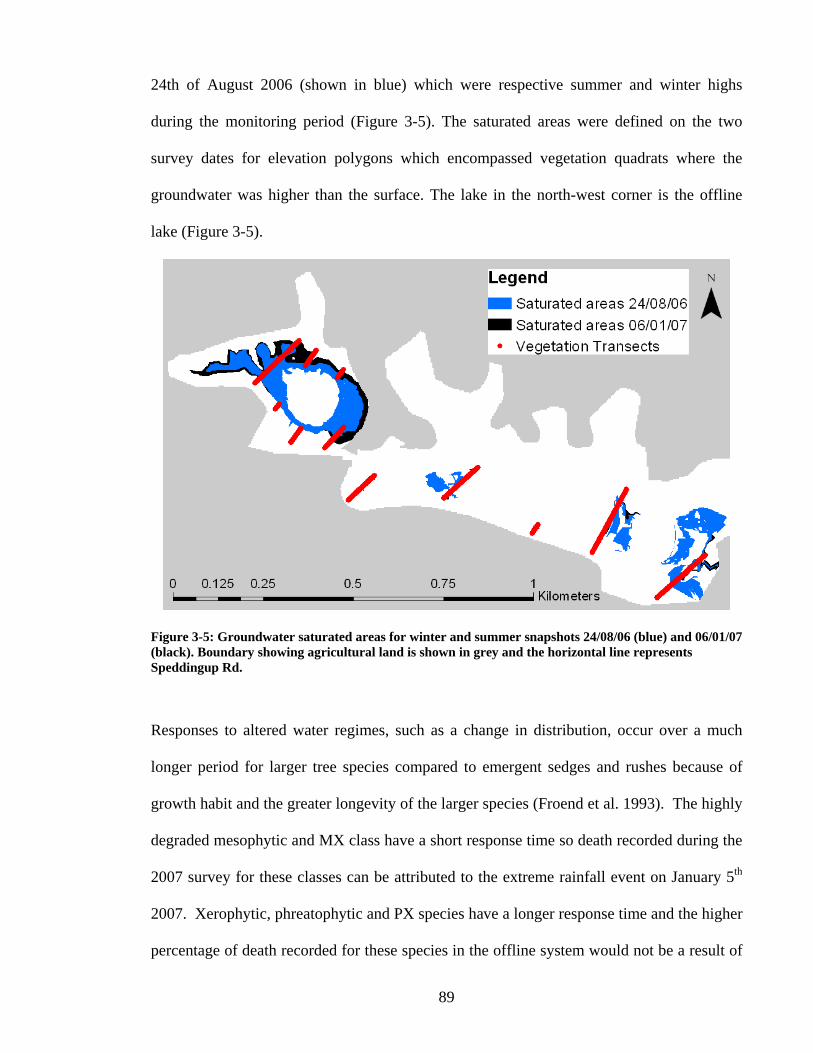
89
24th of August 2006 (shown in blue) which were respective summer and winter highs
during the monitoring period (Figure 3-5). The saturated areas were defined on the two
survey dates for elevation polygons which encompassed vegetation quadrats where the
groundwater was higher than the surface. The lake in the north-west corner is the offline
lake (Figure 3-5).
Figure 3-5: Groundwater saturated areas for winter and summer snapshots 24/08/06 (blue) and 06/01/07 (black). Boundary showing agricultural land is shown in grey and the horizontal line represents Speddingup Rd.
Responses to altered water regimes, such as a change in distribution, occur over a much
longer period for larger tree species compared to emergent sedges and rushes because of
growth habit and the greater longevity of the larger species (Froend et al. 1993). The highly
degraded mesophytic and MX class have a short response time so death recorded during the
2007 survey for these classes can be attributed to the extreme rainfall event on January 5th
2007. Xerophytic, phreatophytic and PX species have a longer response time and the higher
percentage of death recorded for these species in the offline system would not be a result of

90
the 2007 event but could be a result of the extreme event in 1999. It is unlikely that the
initial impact of extreme events caused the higher percentage of death in the offline system
but rather the increased period of waterlogging as a result of the events. The extreme event
in 1999 would have extended hydroperiods more significantly in the offline system. Both
systems experience seasonal waterlogging but extreme events are more severe in the offline
system where the lake margin expands causing hypersaline water to expand the littoral zone,
moving into typically dry areas and increasing the duration of waterlogging.
Health of classes
Diversity in classes increases with elevation. Where some classes are relatively healthy
other classes occupying the same position along a transect and elevation profile have poor
health in terms of the ratio of alive to dead cover. The distribution of classes and their
relative health along an elevation profile is shown for transect 1N in relation to surface
elevation and groundwater depth for winter and summer highs, and a summer low snapshot
(Figure 3-6). The health of each class along an elevation profile is represented by the % of
alive cover and dead cover (%AC/DC). The average salinity for transect one was 6609 EC
mSm-1 and varied from 3918 – 8810 EC mSm-1 from the first quadrat to the last (left to
right) (Figure 3-6).

91
Figure 3-6: Black dots represent presence of a species and hollow black circles represent absence of species for each quadrat along the surface elevation profile recorded in metres, Australian Height Datum (AHD) corresponding to the left y axis and shown as distance along transect 1 on the x axis. For each quadrat the % of alive cover (green bars) and % of dead cover (red bars) is shown for all classes and corresponds to the right y axis. The blue lines represent groundwater levels estimated underneath each quadrat in m (AHD) and correspond to the left y axis. The upper dotted line represents summer high groundwater levels (6/01/07), the blue lower dashed line represents the summer low (01/01/07) and the intermediate blue line represents the winter high (24/08/06).

92
On transect 1 where 21% of all species were dead the MX class are the most degraded class
followed by xerophytes (Figure 3-6e; Figure 3-6h). Halophytes and the HaX class occur at
low elevations on transect 1 and across the landscape and have very healthy cover at low
elevations while mesophytes and the MX class have mostly dead cover in the same areas
(Figure 3-6b; 3-6c; 3-6d; 3-6e).
Mesophytes are confined to higher elevations on transect 1 (Figure 3-6d) but occur at lower
elevations across the landscape and are degraded across their range making the data
inconclusive. More data is required to eliminate the possibility of another factor not
accounted for in this study causing mesophyte degradation. High degradation of the MX
class at low elevations suggests a hydroperiod threshold may have been exceeded, rendering
these areas intolerable for these species (Figure 3-6e). In some areas subtle increases in
elevation buffers the effects of salinity and waterlogging for the MX class. Where
populations of the MX class have varying levels of health at similar elevations, the duration
of waterlogging is critical.
Phreatophytes are comparatively healthy in areas where the MX class is unhealthy (Figure
3-6e; 3-6f). Xerophytes are healthy at the top of their range but very degraded at the lower
end of their range (Figure 3-6h). In the lower reaches of transect 1N the presence of
degraded and dead populations of xerophytes and the MX class indicate the lake area has
expanded, and groundwater has risen resulting in areas with conditions previously suitable
for these species becoming uninhabitable.
Transect 8 is dominated by the HaX class where it is relatively healthy at low elevations
where other classes are absent except for one xerophyte. The lower reaches of transect 8 are
93
waterlogged for all snapshots, varying from approximately 0.30 m between the summer low
and the winter and summer highs. This could explain the absence of other classes. Dead
tree stumps, stripped of bark and therefore assumed to be old, fringe the lakes and occur in
areas now dominated by halophytic and HaX species or devoid of vegetation. This
indicates the degree to which changing hydrological regimes and patterns of waterlogging
and inundation have resulted in a shift in community composition. Halophytes and the HaX
class may replace other classes of vegetation as they disappear from lower positions.
Table 3-2 shows the average depth to groundwater and salinity of the quadrats where the
different classes occurred (where the class was not present along a transect, ‘A’ signifies
their absence). Groundwater and salinity levels for each vegetation quadrat are
approximations so thresholds and tolerance ranges should also be considered as
approximations.

94
Table 3-2: Average groundwater (gw) and salinity levels for classes where they occur along transects 1-9
Halophytes dominate both systems and had a low percentage of death and dead cover cross
all transects. This indicates that salinity levels and depths to groundwater are within their
tolerance range (Table 3-1; Table 3-2). The HaX class also had a relatively low percentage

95
of death across both systems and included the dominant Halosarcia species (Table 3-1;
Table 3-2). Degradation of the HaX class is highest in areas that experienced an extended
period of waterlogging with saline water in the offline system.
Mesophytic species had a very high percentage of death across both systems. Mesophytes
on transect 7 had relatively deep groundwater levels for both snapshots compared to other
transects and the third lowest salinity yet 45% death was recorded on this transect indicating
that salinity and groundwater depth at all sites where mesophytes occur exceed their
tolerance range to salinity and waterlogging (Table 3-2). More data is required to eliminate
other causes of mesophyte degradation because they are degraded across their range in areas
with varying degrees of salinity and waterlogging.
Death of the MX class, consisting of grasses, was approximately 6 times higher in the
offline system (Table 3-1; Table 3-2). On transect 5 (11 % dead) the average salinity level
for the MX class is slightly lower but comparable to the salinity levels where they occur on
2N (90 % dead) (Table 3-2). Groundwater is relatively close to the surface on both
transects 2N and 5, indicating a temporal hydroperiod threshold may be critical for species
in the MX class, where the duration of waterlogging is important. In the offline system (and
on transect 2N) groundwater took longer to recede after the extreme event than it did in the
online system. Lepidosperma viscidium, a grass-form species with a low percentage of death
was the only species classed as hygrophytic & xerophytic (Table 3-1). Hygrophytic species
can tolerate waterlogged conditions, adapted to growing on anoxic soils. Abundance of
Lepidosperma viscidium (hygrophytic & xerophytic) was significantly higher in the online
system.

96
Distribution of Ehrharta longifolia, the only species classed as HaM, was restricted to
transect 3 and 5 so more data is required to interpret the higher death recorded in the online
system (Table 3-2). Phreatophytes consisting of Acacia argutifolia (conservation priority
four) and Acacia patagiata occupied high positions in the landscape and although the
number captured in the survey was low it is encouraging to note there was no death
recorded for this class (Table 3-2).
Species in the PX class occupied high positions in the landscape and therefore had a deeper
watertable on average than other species (Table 3-2). Death of the PX class was highest in
the offline system where on average they occurred at higher groundwater and salinity levels
than where they occurred in the online system (Table 3-2). On transects 1, 2N and 5 a high
percentage of death was recorded for the PX class where salinity levels were relatively low
and groundwater levels were high so these species appear to be sensitive to waterlogging
even at low salinities, however due to a small sample size, thresholds to salinity and
waterlogging could not be quantified.
The abundance of xerophytes is comparable between the systems but death is more than
three times higher in the offline system. Death of xerophytic species occurred in areas over
a range of groundwater depths and salinities (Table 3-2). A temporal effect related to the
duration of inundation and waterlogging can explain the heightened degradation of
xerophytes in the offline system. A low percentage of death on transect 9 where xerophytes
were abundant suggests that the average depth to groundwater and salinity levels on transect
9 are within the tolerance range for xerophytes (Table 3-2).

97
Given the low relief of both systems, with the declining health of mesophytes and species in
the MX class, the halophytes may increase their range and move into areas where they may
not have previously been able to compete for resources. Succession will only be possible if
suitable conditions facilitate germination and the seedbank is healthy.
Health of melaleucas, eucalypts and halosarcias
The natural pattern of flood zone distribution indicates that melaleucas are generally more
tolerant to the combined effect of waterlogging and salinity than eucalypts (Bell 1999).
Death of melaleucas in Lake Toolibin in south-west Australia was attributed to salinity
rather than increased frequency and duration of flooding (Froend et al. 1987). Salinity was
also attributed to the death of melaleucas in the Gippsland lakes region (Ladiges and Foord
1981).
Melaleuca death was greater in the offline system where they occurred in areas with slightly
higher groundwater and salinity levels than where they were observed in the online system.
A high percentage of dead melaleucas across all transects indicates that the salinity and
groundwater levels where melaleucas occur has exceeded their tolerance range. Death of
melaleucas was high (84%) on transect 1 where the average groundwater salinity was
relatively low (7164 EC mSm-1) but groundwater levels for both snapshots were high (0.31
and 0.24 m below the surface) therefore death is attributed to waterlogging where temporal
effects are important.
Halosarcia death was very low across both systems despite commonly occurring in areas
with very shallow watertables subject to subsurface saturation. This finding indicates that
98
halosarcias are tolerant of waterlogging and inundation at relatively high salinities. 86% of
halosarcias were found on transects 4 and 8 where groundwater salinity ranged from 12,536
– 16,468 EC mSm-1 and the average groundwater depth after the extreme summer event
ranged from above the surface to 0.02 m below the surface and was 0.19 - 0.55 m below the
surface for the winter wet snapshot.
In additional vegetation survey of eucalypts, where health was estimated from the cover and
foliage condition of each stem, poorer health of the eucalypt populations in the online
system may be attributed to higher groundwater salinities and seasonal waterlogging.
The eucalypt populations are generally found in more topographically elevated positions
than melaleuca populations that often fringe the lakes in lower positions in the landscape.
As a result, the eucalypts are less likely to be subject to periods of inundation. Planted
eucalyptus foliosa (P3) trees were dead or severely stressed in the online system.
3.3 Conclusions
The extreme summer rainfall events of 1999 and 2007 were both triggered by cyclone
activity in north-western Australia. These events are expected to increase in frequency,
resulting in higher rainfall in the summer months and a shift from the precipitation pattern
typical of a Mediterranean climate which includes a low average summer rainfall.
Coramup Creek catchment is approximately 31,000 ha of which 30,700 ha is farmland (Gee
and Simons 1997). The vegetation communities fringing playa lakes contain conservation
99
priorities and important remnants largely lost from a region described as a biodiversity
hotspot (Myers et al. 2000).
It is difficult to differentiate between major stresses because plants have a threshold for the
individual effects of waterlogging and salinity and an additional, lower threshold for the
combined effect. Results from experiments indicate that most species are more severely
effected by the combined effect of salinity and waterlogging than to the individual effects of
salinity (van der Moezel et al. 1991; van der Moezel et al. 1988; Craig et al. 1990). The
combined effect of salinity and waterlogging is generally more severe because it results in a
higher concentration of NaCl in the shoots, initially a result of increased uptake of NaCl to
the shoot and then subsequent decreased shoot growth (Barrett-Lennard 2003). With more
data that included vegetation with varying levels of health across sites with different levels
of salinity and waterlogging, this methodology could be used to quantify the individual
tolerance ranges to salinity and waterlogging.
Mesophytes, phreatophytes and the MX class are the most degraded classes according to the
percentage of dead species and dead cover. Halophytes and the HaX class dominate lower
positions in the landscape but given the low relief of the area they could increase their range
and move into more elevated areas. The range for halophytes may have previously been
limited by interspecies competition. Death of mesophytes could result in their replacement
by halophytes. Germination of mesophytic and phreatophytic species may be restricted by
high salinities leading to the pioneering halophytes achieving dominance in a much less
diverse system.

100
Temporal effects of waterlogging and inundation at high salinities appear to be very
significant for some species. Varying health of populations of mesophytes and the MX
class, present at similar elevations relative to the watertable, can be explained by temporal
effects where the degree of waterlogging and inundation occurs over a longer period past a
threshold tolerance range. Quantifying the temporal effects are beyond the scope of this
study but will be examined in future research.
3.4 References
Barrett-Lennard EG (2003) The interaction between waterlogging and salinity in higher
plants: causes, consequences and implications. Plant and Soil 253: 35-54
Bell DT (1999) Australian trees for the rehabilitation of waterlogged and salinity damaged
Landscapes. Aust. J. Bot. 47: 697-716
Berliat K (1952) Report on exploratory drilling for water, Esperance Plain; Western
Australian Geological Survey, Annual Report
Bohrerova Z, Stralkova R, Podesvova J et al (2004) The relationship between redox
potential and nitrification under different sequences of crop rotations. Soil Till. Res. 77: 25-
33
Bureau of Meteorology (2007) Heavy rain breaks records in the southeast of WA. In
Western Australian Media Releases.
Available via: http://www.bom.gov.au/announcements/media_releases/wa/20070105.shtml.
Accessed 20 Feb 2007

101
Craig GF, Bell DT, Atkins CA (1990) Response to salt and waterlogging stress of ten taxa
of Acacia selected from naturally saline areas of Western Australia. Aust. J. Bot. 38: 619-
630
Cramer VA, Hobbs RJ, Atkins L et al (2004) The influence of local elevation on soil
properties and tree health in remnant eucalypt woodlands affected by secondary salinity.
Plant and Soil 265: 175-188
Cofinas M, Creighton C (2001) Australian Native Vegetation Assessment. Appendix 7:
NVIS classification information: National Vegetation Information system structural
formation nomenclature. In: National Land and Water Resources Audit, Department of the
Environment and Water Resources, Australian Government, Canberra, ACT. Available via
http://www.anra.gov.au/topics/vegetation/pubs/native_vegetation/nat_veg_appendix7.
html. Accessed 15 Jan 2008
Davis JA, Froend R (1999) Loss and degradation of wetlands in southwestern Australia:
underlying causes, consequences and solutions. Wetl. Ecol. Manag. 7: 13- 23
Farrington P, Salama RB (1996) Controlling dryland salinity by planting trees in the best
hydrogeological setting. Land Degrad. Dev. 7: 183-204
Flowers TJ, Hajibagheri MA, Clipson NJW (1986) Halophytes. The Q. Rev. of Biol. 61(3):
313-337

102
Froend RH, Farrell RCC, Wilkins CF et al (1993) The Effect of Altered Water Regime on
Wetland Plants. Vol. 4, Wetlands of the Swan Coastal Plain, Water Authority of Western
Australia and the Environmental Protection Authority, Perth.
Froend RH, Heddle DM, Bell DT et al (1987) Effects of salinity and waterlogging on the
vegetation of Lake Toolibin, Western Australia. Aust. J. Ecol. 12: 281-298
Gee ST, Simons JA (1997) Catchments of the Esperance Region of Western Australia Tech.
Rep. 165, Department of Agriculture, Esperance, Western Australia.
George R, Coleman M (2001) Hidden menace or opportunity – Groundwater hydrology,
playas and commercial options for salinity in wheatbelt valleys. In: Proceedings of the
Wheatbelt Valleys Conference, 30 July to 1 August 2001 Merredin. Reviewed August 2006
George R, McFarlane D, Nulsen B (1997) Salinity threatens the viability of agriculture and
ecosystems in Western Australia. Hydrogeol. J. 5(1): 6-21
George RJ, Nulsen RA, Ferdowsian R et al (1999) Interactions between trees and
groundwaters in recharge and discharge areas - A survey of Western Australian sites. Agric.
Water Manag. 39: 91-113
Goslee SC, Brooks RP, Cole CA (1997) Plants as indicators of wetland water source. Plant
Ecol. 131: 199-206
103
Hodgson G, Hatton T, Salama R (2004) Modelling rising groundwater and the impacts of
salinization on terrestrial remnant vegetation in the Blackwood River Basin. Ecol. Manage.
Restor. 5(1): 52-60
Ladiges PY, Foord PC (1981) Salinity and waterlogging tolerance of some populations of
Melaleuca ericifolia Smith. Aust. J. Ecol. 6: 203-215
Massenbauer A (2007) Esperance Lakes Catchment Appraisal 2007. Tech. Rep. 316,
Esperance Catchment Support Team - Department of Agriculture and Food.
Maximov NA (1931) The physiological significance of the xeromorphic structure of plants.
The J. Ecol. 19(2): 273-282
McFarlane D, Ruprecht J (2005) How salinity has changed. In: Climate Note Series
11/05 (August) IOCI. Available via:
http://www.ioci.org.au/publications/pdf/IOCIclimatenotes_11.pdf. Accessed 24 Jan
2008
Myers N, Mittermeier RA, Mittermeier CG, et al (2000) Biodiversity hotspots for
conservation priorities. Nat. 403: 853 – 858
Nulsen RA (1981) Critical depth to saline groundwater in non-irrigated situations.
Aust. J. Soil Res. 19: 83-86
Ruprecht J, Li Y, Campbell E, et al (2005) How extreme south-west rainfalls have changed.
Climate Note Series 6/05 (August) IOCI. Available via:
104
http://www.ioci.org.au/publications/pdf/IOCIclimatenotes_6.pdf. Accessed 24 Jan
2008
Specht RL, Specht A (1999) Australian plant communities: dynamics of structure, growth
and biodiversity. Oxford University Press, South Melbourne, Australia
Stolte WJ, McFarlane DJ, George RJ (1997) Flow systems, tree plantations, and salinization
in a Western Australian catchment. Aust. J. Soil Res. 35: 1213-1229
van der Moezel PG, Pearce-Pinto GVN, Bell DT (1991) Screening for salt and waterlogging
tolerance in Eucalyptus and Melaleuca species. For. Ecol. Manag. 40: 27-37
van der Moezel PG, Walton CS, Pearce-Pinto GVN et al (1988) The Response of Six
Eucalyptus Species and Casuarina obesa to the Combined Effect of Salinity and
Waterlogging. Aust. J.of Plant Physiol. 15: 465-474
Western Australian Herbarium (1998–) FloraBase - The Western Australian Flora.
Department of Environment and Conservation. Available via:
http://florabase.dec.wa.gov.au. Accessed 20 Aug 2007
Yli-Halla M, Puustinen M, Koskiaho J (1999) Area of cultivated acid sulfate soils in
Finland. Soil Use and Management 15: 62-67

105
Yu B, Neil DT (1993) Long-term variations in regional rainfall in the south-west of Western
Australia and the difference between average and high intensity rainfalls. Int. J. Climatol.
13: 77-88
Zencich SJ, Froend RH, Turner JV et al (2002) Influence of groundwater depth on the
seasonal sources of water accessed by Banksia tree species on a shallow, sandy coastal
aquifer. Oecologia 131: 8-19

106
107
Chapter 4. Hydroperiod thresholds for the fringing vegetation of playa lakes in south-west Australia

108
109
4.1 Introduction
In Western Australia, vegetation fringing wetlands has been degraded by altered
hydrological regimes and increased nutrient loads (Davis and Froend 1999; Froend and van
der Moezel 1994). Prior to extensive land clearing almost all of the annual rainfall was
evaporated or transpired by native vegetation and a natural water balance was maintained
resulting in minimal recharge to the regional water table (Hatton and Nulsen 1999). Dryland
salinity and waterlogging is a consequence of clearing native perennial vegetation and
replacing it with shallow rooted agricultural crops (Hatton and Nulsen 1999; Peck and
Hatton 2003; Peck and Williamson 1987; Stolte et al. 1997). Shallow-rooted agricultural
crops are unable to access deep groundwater stores and are dormant during summer and
thus unable to transpire summer rainfall (Peck and Williamson 1987).
The highly fragmented remnant vegetation in the wheatbelt of Western Australia occupies a
landscape with low relief, vulnerable to shallow watertables and salinity. As many as 450
extinctions could result from increased groundwater levels and salinity in the West-
Australian wheatbelt (George and Coleman 2001). To remain healthy, vegetation must be
able to withstand not only the altered hydrological regime that has resulted from land
clearing, but also anticipated climate change scenarios including long periods of drought
followed by intense rainfall events.
The low relief of landscapes in south-west Australia is reflected by low groundwater
gradients. In the Esperance region on the south coast of Western Australia, groundwater
gradients are less than 0.1% and groundwater is commonly within 2 m of the surface in
110
areas with a shallow basement and in low-lying areas adjacent to saline playa lakes (Simons
and Alderman 2004).
The median groundwater depth is 2.1 m in the Esperance sandplain but groundwater ranges
from the surface to 18 m below the surface (Massenbauer 2007) (Figure 4.1). The median
salinity of groundwater is 1,700 mS/m but ranges from 75 to 20,000 mS/m (Massenbauer
2007). Groundwater levels in almost half of the 208 monitoring bores in the Esperance
sandplain are rising from 0.03 to 0.25 m/yr, and levels in the remainder are static or
declining by <0.03 m/yr (Massenbauer 2007).
Bores with rising groundwater levels are located in the Salmon Gums mallee zone and in
the southern part of the Esperance sandplain zone where groundwater is deeper than 5 m
(Massenbauer 2007) (Figure 4.1). Bores with declining groundwater levels are located
throughout the area and include shallow groundwater levels which respond to seasonal
rainfall and slightly deeper levels that respond to annual and episodic rainfall (Massenbauer
2007). A declining trend is caused by below average rainfall from 1994 to 1998 and 2002
and in some bores by increased water use by perennial plants (Massenbauer 2007).
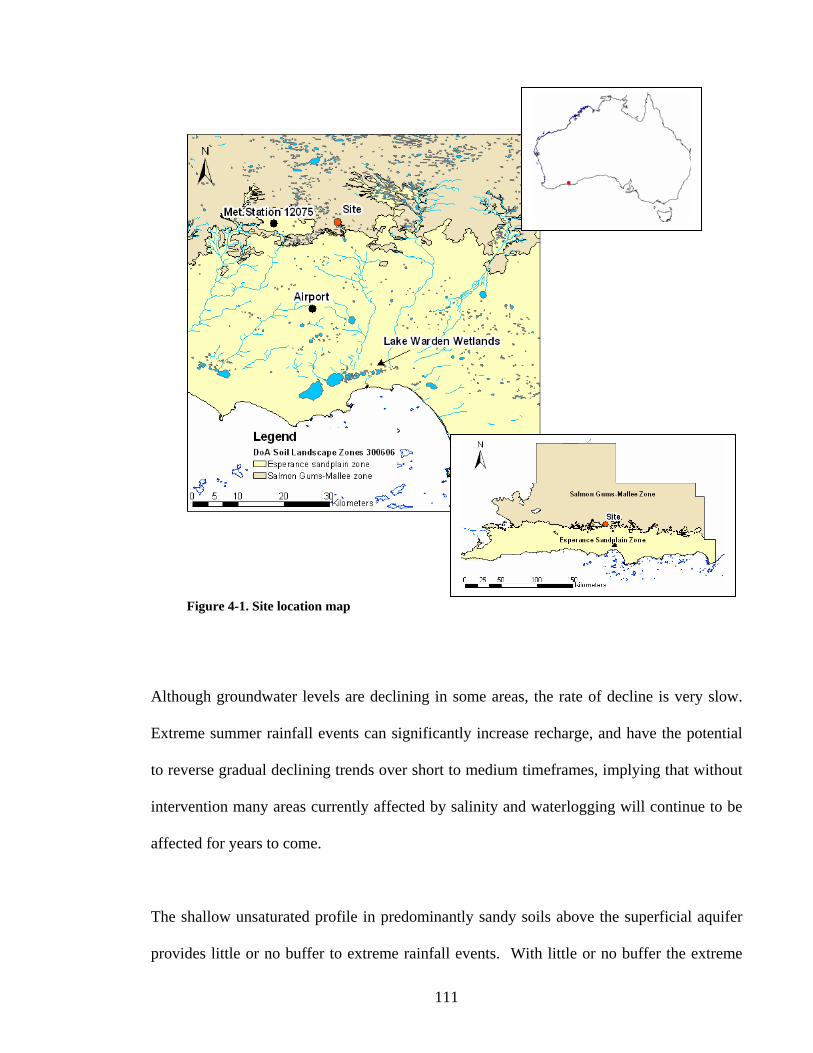
111
Figure 4-1. Site location map
Although groundwater levels are declining in some areas, the rate of decline is very slow.
Extreme summer rainfall events can significantly increase recharge, and have the potential
to reverse gradual declining trends over short to medium timeframes, implying that without
intervention many areas currently affected by salinity and waterlogging will continue to be
affected for years to come.
The shallow unsaturated profile in predominantly sandy soils above the superficial aquifer
provides little or no buffer to extreme rainfall events. With little or no buffer the extreme

112
rainfall events may trigger subsurface saturation, leading to discharge of increased salt loads
at the surface with groundwater, the expansion of lake margins, and altered hydroperiods.
Native vegetation of Western Australia is usually more salt tolerant than introduced species
which may be a result of adaptations developed over thousands of years to natural cycles of
waterlogging and salinity, however native vegetation appears to be unable to adapt to the
current changes (George et al. 1999). During previous natural cycles of waterlogging and
salinity, vegetation communities would have been more diverse and covered a much larger
region encompassing different positions within the landscape. While previous cycles may
have resulted in the loss of some species, the main effect was probably a change in
community composition as species from less degraded areas were able to gradually move
into lower positions in the landscape where other species had been lost (George et al. 1999).
Due to fragmentation, communities are less capable of withstanding and adapting to altered
hydrological regimes. More than 93% of native vegetation in the wheatbelt has been
cleared for agriculture and remaining remnants are highly fragmented (Cramer et al. 2004).
To mitigate the effects of salinization, surface drainage and groundwater pumping were
recommended as short-term solutions to protect internationally significant Lake Toolibin
(Froend et al. 1997). To protect priority areas from waterlogging and salinity, groundwater
pumping and surface water drains are used to divert and discharge excess water into other
storage basins or lakes used as sacrificial areas because they are perceived to have a lower
conservation value (Farmer et al. 2004; Williams 1999).
While recognizing that altered hydrological regimes can lead to a change in vegetation
communities or even extinction of species, George and Coleman (2001) acknowledged that

113
playa lakes have the potential to store water from episodic events and receive drainage
waters but also that the impact this would have on groundwater and surrounding areas is not
well understood. While the impact has not been quantified, it is known that reducing the
spatial and temporal variability of hydrological regimes leads to loss of biodiversity (Davis
and Froend 1999).
In the past, salt lakes in the wheatbelt have been poorly regarded in terms of conservation
status but attitudes have changed and they are now seen as important ecosystems
warranting protection (George and Coleman 2001). The fringing vegetation of playa lakes
in the Lake Warden Catchment has conservation value as it contains important remnants of
a biologically diverse region that has largely been cleared for agriculture.
This research is a field-based approach to provide data to help define the tolerance range of
species to the spatial and temporal effects of waterlogging and inundation. Knowledge of
tolerance ranges can guide the design of surface drainage and groundwater pumping
schemes and enable land managers to;
• assess the risk to priority species or areas;
• improve the design of drainage or pumping schemes;
• minimize the impact on the vegetation of natural lakes and depressions used to store
saline water diverted to protect other areas.
A field-based approach to defining tolerance levels is not constrained by the limitations
typical of glasshouse experiments. Glasshouse experiments are predominantly one-
dimensional however field experiments that have a large enough dataset can capture the
114
effects of environmental factors. The environmental factors can be interrelated and
combine to have a more or less severe effect on vegetation health. Glasshouse experiments
can not capture the interaction between environmental factors but in field experiments with
large enough datasets statistics can be used to determine the tolerance ranges for the
individual environmental factors and also the combined effect.
The general findings of this research provide a tolerance range that has practical value for
extrapolation and application to sites with similar conditions in the region and could form
the foundation of a larger database.
The research site is located approximately 40 km north of the town of Esperance on the
south-west coast of Western Australia (Figure 4.1). To correlate vegetation health with
waterlogging and salinity the health of vegetation fringing lakes situated on the Esperance
plains was assessed in conjunction with a detailed hydrological investigation.
The Esperance region experiences a typically Mediterranean climate, with hot dry summers
and most of the annual rainfall occurring during the winter months (Marimuthu et al. 2005).
From 1911 to 1990 annual rainfall has significantly declined in south-west Western
Australia and there have been more intense summer rainfall events (Yu and Neil 1993). The
monthly daily rainfall maximum for summer has increased by 0 - 5% and in some areas by
5 - 10% per decade from 1910 - 2005 in south-west Western Australia and the mean winter
rainfall has declined (Alexander et al. 2007). The broad global trend predicted by most
Global Climate Models is more intense daily rainfall events associated with rising
atmospheric temperatures (Ruprecht et al. 2005).
115
During the summer months of 1999 and 2007 extreme rainfall events resulted in severe
flooding of the Esperance region. The 2007 event was recorded during the hydrological
investigation providing insight into the type of conditions imposed by intense events that are
predicted to increase in frequency.
Previous work (Horsnell et al. in press 2009) has examined the effects of the intense, short
term extreme rainfall events on the vegetation communities surrounding the playa lakes in
the Lake Warden catchment on the south coast of Western Australia. Based on the
fieldwork conducted for that study, the potential for the existence of two differing impacts
being superimposed upon each other was identified. The longer term (decadal) cycle of
water table rise impacts hydroperiods in a different way than the short term (daily to
monthly) signals imposed by extreme events. This work attempts to resolve the longer term
signal through extrapolation of the vegetation health surveys conducted during the
fieldwork.
4.2 Material and Methods
Spatial and temporal analysis of the depth to groundwater across two lake systems was
evaluated in relation to the health of vegetation fringing two lake systems. The health of
was assessed in two vegetation surveys. The health of vegetation fringing a chain of lakes
on the floodplain of the Esperance plains and an adjacent lake disconnected from the
floodplain by a road and from the regional groundwater system by a basement ridge was
assessed. These two systems are subsequently referred to as ‘online’ (connected via a
floodplain) and ‘offline’ (no floodplain connection).

116
The number alive, number dead, percentage of alive canopy and percentage of dead canopy
was measured in 1 m by 1 m quadrats along transects varying from 20 m to 200 m in length,
with a total length of 2.92 km. The vegetation transects were orthogonal to the flow-line
and encompassed a range of surface elevations north and south of the lakes. All vegetation
transects were continuous, except for 2 and 3 in the offline system which were disconnected
over the offline lake (Figure 4.2).
To provide a foundation for the study, digital elevation models were constructed of the two
lake areas with approximately 7000 GPS points taken with Sokkia Radian IS RTK
equipment with a horizontal accuracy of 10 mm and a vertical accuracy of 20 mm. The
points were interpolated using the triangulated irregular network (TIN) method. The TINs
were then converted to raster grids and the vegetation transects were used as an overlay to
extract the surface elevation of each quadrat.
Twenty six shallow observation wells were installed along three parallel transects, through
the middle of the online and offline lakes and north and south of the flow-line (Figure 4.2).
The wells were 3 m deep and screened at 2.5 to 3 m below the surface with a gravel filter
pack. Four deeper wells were drilled to 6 m and screened across the bottom 0.5 m with a
gravel filter pack. Four piezometers were installed in the lakes and screened from
approximately 0.1 m to 1.0 m above the surface to record surface water levels. Each
piezometer and observation well was fitted with automated Odyssey data loggers
programmed to record water levels at 30 minute intervals over a 12 month period. A
tipping bucket rain-gauge, located in the online lake system, was also fitted with an Odyssey
data logger and recorded rainfall in 2 mm increments.

117
Figure 4-2. DEM of lakes and position of vegetation transects, observation wells and standing pipes. Easting: 395800; Northing: 6290800. Coramup Creek Catchment. Observation wells (A-N) and Standing Pipes (SP) are symbolized as black circles and the red lines are the vegetation transects
Hydraulic head observations throughout the program indicated that the water table beneath
the site is relatively flat for the majority of the year, with exceptions immediately following
large recharge events. Given the minimal curvature of the water table, the groundwater
level beneath the vegetation transects could be approximated with the following planar
equation:
(1) ax + by + c = d
where x, y (m) are the easting and northing coordinates of three wells used in the
planar equation;
a, b and c are temporally variant coefficients (daily time-step) (m)
and d (m) is the groundwater datum
118
The online wells used in equation (1), J, B and H (Figure 4.2) were chosen based on their
position around the lakes and their similar response to the rainfall signal. The offline wells
used in equation (1), C, G and A (Figure 4.2) were chosen based on the same criteria.
The groundwater level (AHD) underneath the vegetation transects was approximated with
the planar equation for each day of the year. The groundwater levels were calculated with
the easting and northing coordinates of the centre of each vegetation quadrat and the daily
coefficients, calculated with the average daily groundwater level (AHD) in the three wells.
The depth to groundwater for the vegetation over the study period was calculated by
subtracting the approximated groundwater depth (AHD) from the surface elevation (AHD)
of each quadrat using the DEM.
Groundwater salinity for each vegetation quadrat was also approximated using data
collected from the deep observation wells, E and K in the online system and A and E in the
offline system. Using ArcGIS, salinity transects were created between the well locations
where samples were taken and a salinity gradient was calculated assuming the salinity
varied linearly between points. Data collected on the 18th of August 2006 was used as a
representative snapshot of salinity for winter when it is at its lowest over an annual cycle.
Where a vegetation transect only intercepted two salinity transects, salinity or vegetation
transects were extended in the same direction using ArcGIS until they crossed to achieve a
minimum of three interception points along each vegetation transect. Salinity was
approximated for each quadrat using linear regression on the interception points on each
vegetation transect. The approach generated r2 values for the fits ranging between 0.74 –
0.99.
119
4.3 Results
Groundwater
To check on the approximation of groundwater levels underneath the vegetation quadrats
equation (1) was used to approximate the depth to groundwater in the shallow observation
wells and the approximated depth was compared to the actual depth to groundwater in the
wells (daily average). The estimated groundwater depths were more accurate for the offline
wells than the online wells but in general the approximation was deemed adequate for
assessing the hydroperiods of both lakes (Figure 4-3). The error for the estimated average
groundwater depth for all seasons in both lakes was within 0.16 m except for autumn 2007
(21 days at the end of the monitoring period) in the online lake where the error was slightly
higher (0.24 m). Estimated groundwater depths for the online wells were least accurate
during winter, however the estimated average was only 0.09 m smaller (closer to the
surface) than the actual maximum groundwater depth and the estimated maximum was
conservative in terms of waterlogging with an average 0.05 m larger groundwater depth
estimated. Estimations of groundwater depth were accurate for all seasons in the offline
system.
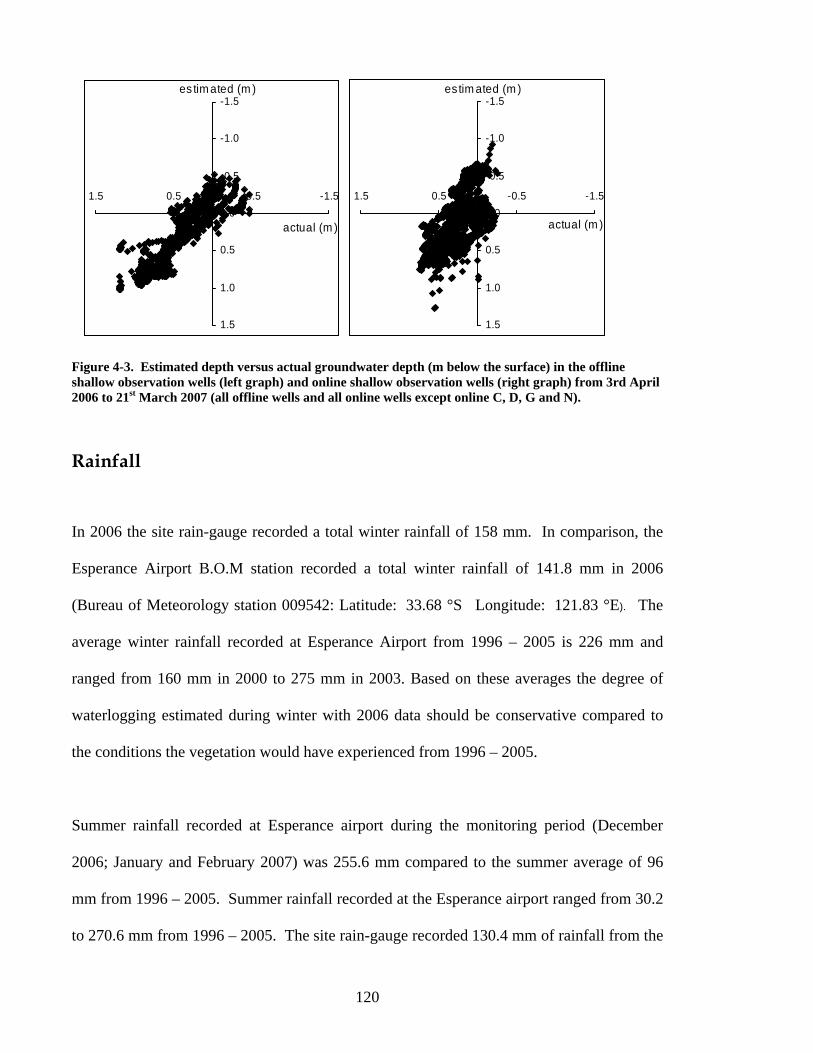
120
Figure 4-3. Estimated depth versus actual groundwater depth (m below the surface) in the offline shallow observation wells (left graph) and online shallow observation wells (right graph) from 3rd April 2006 to 21st March 2007 (all offline wells and all online wells except online C, D, G and N).
Rainfall
In 2006 the site rain-gauge recorded a total winter rainfall of 158 mm. In comparison, the
Esperance Airport B.O.M station recorded a total winter rainfall of 141.8 mm in 2006
(Bureau of Meteorology station 009542: Latitude: 33.68 °S Longitude: 121.83 °E). The
average winter rainfall recorded at Esperance Airport from 1996 – 2005 is 226 mm and
ranged from 160 mm in 2000 to 275 mm in 2003. Based on these averages the degree of
waterlogging estimated during winter with 2006 data should be conservative compared to
the conditions the vegetation would have experienced from 1996 – 2005.
Summer rainfall recorded at Esperance airport during the monitoring period (December
2006; January and February 2007) was 255.6 mm compared to the summer average of 96
mm from 1996 – 2005. Summer rainfall recorded at the Esperance airport ranged from 30.2
to 270.6 mm from 1996 – 2005. The site rain-gauge recorded 130.4 mm of rainfall from the
-1.5
-1.0
-0.5
0.0
0.5
1.0
1.5
-1.5-0.50.51.5
actual (m )
es tim ated (m )-1.5
-1.0
-0.5
0.0
0.5
1.0
1.5
-1.5-0.50.51.5
actual (m )
es tim ated (m )
121
beginning of December 2006 to the end of February 2007.
Summer rainfall for 1999 (December 1998, January and February 1999) was 263.8 mm at
Esperance airport BOM station with 166.8 mm falling on the 6th and 7th January 1999. The
intense event recorded during January 2007 is similar in magnitude to the summer event of
1999 with 184.2 mm of rainfall recorded at the Esperance airport on the 4th and 5th January
2007. The intense event captured during the monitoring period for this research provides
insight into other intense events the vegetation has recently been subjected to.
Salinity
Groundwater salinity is higher on average beneath the online lake, remaining reasonably
stable throughout the year. The summer rainfall event significantly reduced groundwater
salinity beneath both lakes. Salinity readings from the observation wells in the middle of the
lakes dropped from approximately 21,600 to 2,090 mSm-1 EC (online) and from 17,000 to
5,760 mSm-1 (offline). Salts are carried to the surface via subsurface saturation resulting in a
significant drop in the salt content of the groundwater as the groundwater breaches the
surface before receding or evaporating and precipitating salt at the surface in the process.
The difference between the surface water salinities in the online and offline lakes is greatest
in the winter months because winter rainfall dilutes the surface water in the deeper, online
lake. Surface water salinity in the online lake was generally lower than the surface water
salinity in the offline lake by between 2,600 – 10,570 EC mSm-1 over the monitoring period.
Surface water salinity in the offline lake averaged approximately 23,800 EC mSm-1 with the
122
lowest salinity recorded after the extreme rainfall event on the 11th January, when it dropped
to 17,200 EC mSm-1.
There was no evidence that rainfall significantly diluted either system after the summer
rainfall event in January 2007 when surface water was at its highest in the online lake (0.79
m) and also high in the offline lake (0.43 m). Groundwater discharge may have negated any
dilution of the surface water after the summer rainfall event however there was a data gap
preceding the events so surface water salinity could have risen over the gap period and then
fallen again when sampled.
Vegetation
Vegetation communities on the upper slopes of both systems range from open mallee
woodland with grasses to grassland communities (NVIS classification) (Cofinas and
Creighton 2001). At lower positions in the landscape open and closed samphire
communities occur with clumps and isolated mallees and trees (NVIS classification)
(Cofinas and Creighton 2001). Under the Wildlife Conservation Act, species are listed as
priority flora if they are rare or require special protection (Western Australian Herbarium
1998). Acacia argutifolia (priority four) and Melaleuca dempta (priority three) were
identified in the survey.
Responses to altered water regimes, such as a change in distribution, occur over a much
longer period for larger tree species compared to emergent sedges and rushes because of
growth habit and the greater longevity of the larger species (Froend et al. 1993). To
quantify accurate thresholds to salinity and waterlogging for larger species long-term
123
monitoring is required. The groundwater depths and durations for waterlogging evaluated in
this study are representative of conditions that the vegetation in these systems would have
experienced during the summer of 1999 and are conservative but similar to winter
waterlogging conditions over the last ten years based on rainfall averages.
To identify the natural zonation that occurs in vegetation communities in relation to a
species water requirements and according to waterlogging and salinity tolerances, species
were classified as halophytes (Ha), hygrophytes (Hy) mesophytes (M), phreatophytes (P)
and xerophytes (X) and in the combined classes halophytes and mesophytes (HaM),
halophytes and xerophytes (HaX), hygrophytes and xerophytes (HyX), mesophytes and
xerophytes (MX) and phreatophytes and xerophytes (PX). Grouping species into classes
according to their presumed tolerances and based on their natural distribution, permitted
analysis of the effect of altered hydrological regime on groups of species in relation to their
niche areas. The combined classes of vegetation are subsequently referred to as the
abbreviations denoted above and species classification can be found in (Horsnell et al. in
press 2009).
Vegetation fringing the offline lake (19% dead) is more degraded than the online lake (6%
dead). The range of elevations relative to groundwater levels is larger for vegetation in the
online system, where the maximum depth to groundwater is deeper throughout the year
(Figure 4-4; Figure 4-5;
Table 4-1). Higher diversity in terms of elevation relative to groundwater in the online
system is partially responsible for the lower percentage of death recorded for most classes
because elevation is buffering the effects of seasonal waterlogging and salinity for the
portion of the population that occur at the top of their range.

124
While the range and maximum depth is larger for vegetation in the online system, the
average depth to groundwater in the offline system is deeper than it is in the online system
for autumn and winter 2006 but closer to the surface in summer 2006-07 and autumn 2007
(Table 4-1). These results indicate the online vegetation is more vulnerable to seasonal
waterlogging and the offline vegetation is more vulnerable to waterlogging after extreme
rainfall events.
Table 4-1. Seasonal average, maximum and minimum depths to groundwater under vegetation quadrats in the online and offline lakes
The low relief of the landscape and the magnitude of the summer rainfall event in 2007
meant that the annual range for all genera included negative depths where groundwater was
above the surface (Figure 4-4). The average groundwater depth is comparable between
systems for all genera except acacias which occur at a significantly higher elevation in the
online system relative to groundwater compared to where they occur in the offline system
(Figure 4-4). The sample size for acacias is too small to draw conclusions about the health
of individuals varying along an elevation gradient.
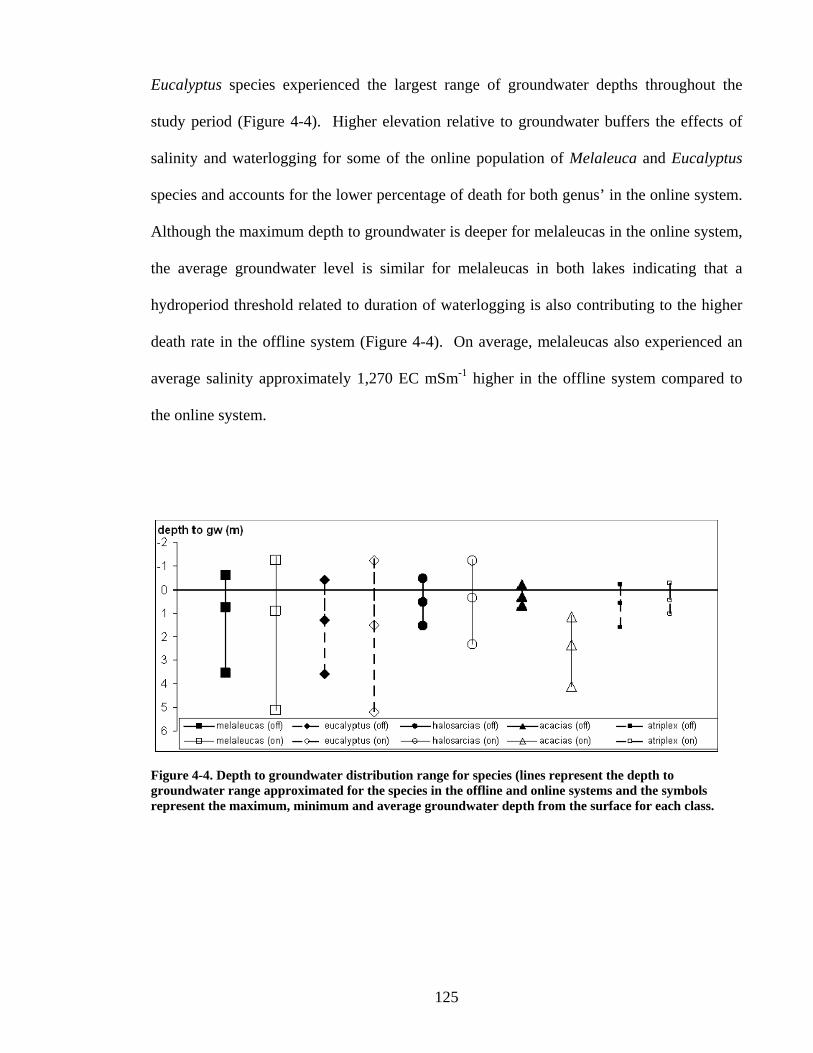
125
Eucalyptus species experienced the largest range of groundwater depths throughout the
study period (Figure 4-4). Higher elevation relative to groundwater buffers the effects of
salinity and waterlogging for some of the online population of Melaleuca and Eucalyptus
species and accounts for the lower percentage of death for both genus’ in the online system.
Although the maximum depth to groundwater is deeper for melaleucas in the online system,
the average groundwater level is similar for melaleucas in both lakes indicating that a
hydroperiod threshold related to duration of waterlogging is also contributing to the higher
death rate in the offline system (Figure 4-4). On average, melaleucas also experienced an
average salinity approximately 1,270 EC mSm-1 higher in the offline system compared to
the online system.
Figure 4-4. Depth to groundwater distribution range for species (lines represent the depth to groundwater range approximated for the species in the offline and online systems and the symbols represent the maximum, minimum and average groundwater depth from the surface for each class.
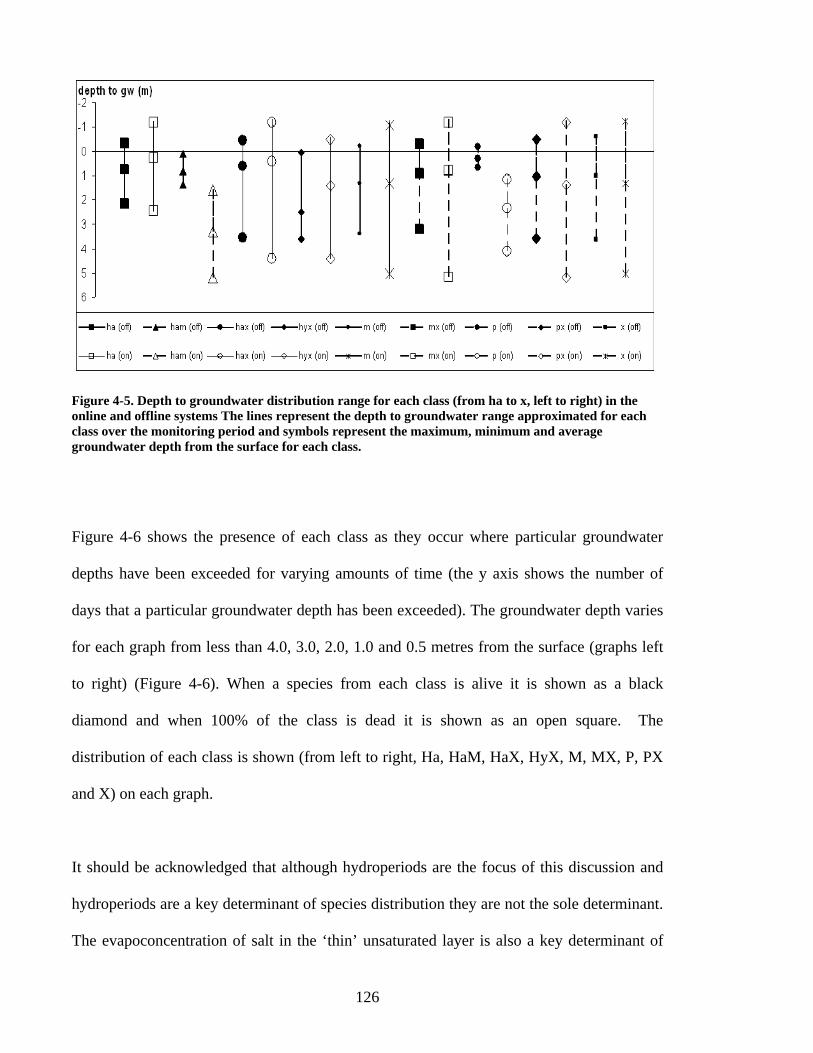
126
Figure 4-5. Depth to groundwater distribution range for each class (from ha to x, left to right) in the online and offline systems The lines represent the depth to groundwater range approximated for each class over the monitoring period and symbols represent the maximum, minimum and average groundwater depth from the surface for each class.
Figure 4-6 shows the presence of each class as they occur where particular groundwater
depths have been exceeded for varying amounts of time (the y axis shows the number of
days that a particular groundwater depth has been exceeded). The groundwater depth varies
for each graph from less than 4.0, 3.0, 2.0, 1.0 and 0.5 metres from the surface (graphs left
to right) (Figure 4-6). When a species from each class is alive it is shown as a black
diamond and when 100% of the class is dead it is shown as an open square. The
distribution of each class is shown (from left to right, Ha, HaM, HaX, HyX, M, MX, P, PX
and X) on each graph.
It should be acknowledged that although hydroperiods are the focus of this discussion and
hydroperiods are a key determinant of species distribution they are not the sole determinant.
The evapoconcentration of salt in the ‘thin’ unsaturated layer is also a key determinant of

127
species distribution. The focus of this study is the tolerance of vegetation to the combined
effect of hydroperiods and water quality and no attempt has been made to determine the
tolerance ranges to the individual effects of the two factors. With a larger dataset the
methodology developed in this research could be used to determine tolerance ranges to
multiple environmental factors. Tolerance ranges could be determined for the individual
and combined effect of environmental factors.

128
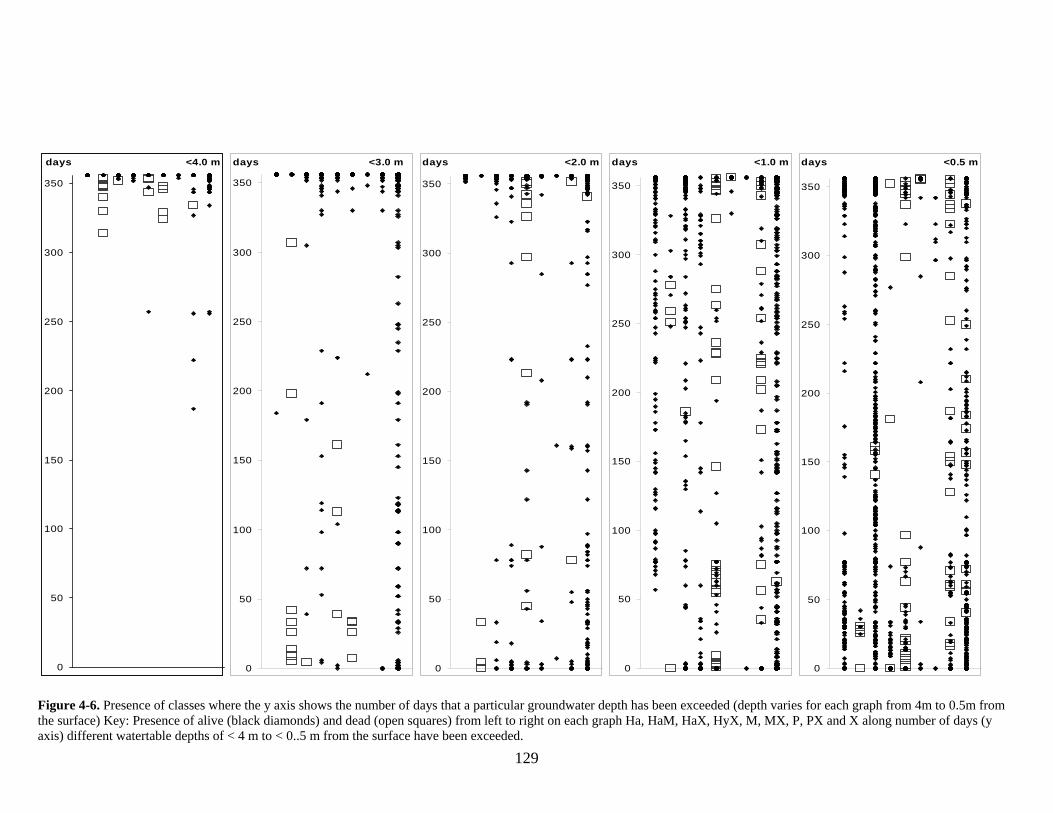
129
<4.0 m
0
50
100
150
200
250
300
350
days <3.0 m
0
50
100
150
200
250
300
350
days <2.0 m
0
50
100
150
200
250
300
350
days <1.0 m
0
50
100
150
200
250
300
350
days <0.5 m
0
50
100
150
200
250
300
350
days
Figure 4-6. Presence of classes where the y axis shows the number of days that a particular groundwater depth has been exceeded (depth varies for each graph from 4m to 0.5m from the surface) Key: Presence of alive (black diamonds) and dead (open squares) from left to right on each graph Ha, HaM, HaX, HyX, M, MX, P, PX and X along number of days (y axis) different watertable depths of < 4 m to < 0..5 m from the surface have been exceeded.

130
131
The salt tolerant halophytes are extremely tolerant of waterlogging with a total of 1% death
recorded over both systems. There is a clear threshold for halophytes in terms of their
range from 1.0 – 2.0 m (Figure 4-6). All of the halophytes occur where groundwater was
less than 2.0 m from the surface for more than 350 days of the year but where groundwater
was less than 1.0 m from the surface they occur over a range of hydroperiods (Figure 4-6).
50% (11) of the dead halophytes recorded occurred where groundwater was less than 0.5 m
from the surface for 356 days of the monitoring period but 1003 individuals or 16% of the
total population were also alive so groundwater maintained at this depth for a year may be
approaching a threshold but appears to be tolerable for halophytes.
Mesophytic species occur at relatively moist sites and are not drought tolerant (Specht and
Specht 1999). Mesophytes had a larger elevation range relative to groundwater depth in the
online system where 63% of 256 plants were dead compared to 56% of 247 plants in the
offline system (Figure 4-5). It is unclear whether a threshold to salinity and waterlogging
has been exceeded for mesophytic species because death is significant across their range
including areas with markedly different hydroperiods. Salinity and waterlogging levels
may have exceeded the tolerance range for mesophytes across both systems and extended
periods of drought or another degradation process not accounted for in this study could be
contributing to degradation at the higher positions in their range.
Low numbers of species occurring where groundwater was within 2.0 m from the surface
makes hydroperiod duration thresholds unclear for the PX class, however death of species
across a range of days when the groundwater was less than 1.0 m from the surface indicates
that these species can not tolerate groundwater within 1.0 m from the surface even for small
amounts of time (Figure 4-6).

132
The narrow elevation range and lack of buffer in the offline system is responsible for the
higher percentage of death for species in the PX class in the offline system (Figure 4-5).
Phreatophytes, deep-rooted species that use groundwater (Bryan 1928), have a longer
response time to altered hydrological regimes so these species may be in a transition period
and hence long-term monitoring is necessary to measure their tolerance to salinity and
waterlogging. Given the narrow range and the high percentage of death where most of the
PX class occurs without intervention there is a high risk that this class will be lost from the
communities fringing playa lakes.
Xerophytic species are adapted to dry conditions (Maximov 1931) and they appear to be
able to tolerate the salinity and waterlogging conditions where they occur in the online
system. Results indicate that groundwater depths between 1.0 - 2.0 m are a threshold depth
for xerophytes for extended periods of time and groundwater levels remaining less than
2.0 m from the surface for the entire year is intolerable.
21% of xerophytes occur where groundwater was less than 2.0 m from the surface for 1 -
355 days with 2% death comprising 5% of the total dead xerophytes recorded across both
systems. Where groundwater was less than 2.0 m from the surface for the entire year 64%
of the xerophytic population was present and 94% of death was recorded. Where the
groundwater was less than 1.0 m from the surface for the entire year 25% of the xerophyte
population was present and 26% of those present were dead, comprising 61% of all death
recorded for xerophytes across both systems. 45% of the population was present where
groundwater was less than 1.0 m from the surface for 1 - 355 days and 9% of these were
dead, comprising 35% of the total number of dead xerophytes recorded.
133
Death was spread across a range of periods when groundwater was less than 0.5 m from the
surface, indicating xerophytes can not tolerate groundwater depths of less than 0.5 m for
any period of (Figure 4-6). Given the relatively low percentage of death recorded
compared to other classes, but the clear thresholds related to hydroperiods at specific
groundwater depths, the xerophytes may be going through a transition period where they
are dying as a result of the extreme event or extended periods of waterlogging and high
salinity levels and their thresholds may be lower than this study indicates.
The most significant difference between the health of vegetation in the two systems was
found in species in the combined class MX despite the class occurring in similar positions
in both systems in relation to groundwater and salinity levels (Figure 4-5). Over the
monitoring period, the average depth to groundwater for species in the MX class was 0.04
m deeper in the offline system where death was significantly higher. On average,
groundwater was also less than 2.0 m from the surface for MX species in the offline and
online system for similar periods of time (340 days in the offline system compared to 329
in the online system) (Appendix C). 72% of the population was present where groundwater
was less than 2.0 m from the surface for the entire year where 84% of the death was
recorded for the MX class, which is a clear indication that groundwater depths maintained
at less than 2.0 m from the surface for the entire year is intolerable for these species.
Plants in the MX class had a larger elevation range relative to groundwater levels in the
online system (Figure 4-5). Over the monitoring period, the maximum depth to
groundwater for the MX class was 5.16 m in the online system compared to 3.05 m in the
offline system so elevation is buffering the effects of waterlogging and salinity for a portion
of the population that occurs at higher elevations in the online system and is partially

134
responsible for the higher degradation in the offline system (Appendix C).
The average depth to groundwater was similar in both systems for species in the MX class
indicating hydroperiod thresholds related to the duration of waterlogging is contributing to
the heightened degradation in the offline system which was more severely affected by the
extreme event. Less temporal variability over the seasons is a major contributing factor to
higher death of the MX class in the offline system with the maximum groundwater depth
only dropping 0.07 m from winter to summer where the MX class occurred. Separation of
the long-term effects of seasonal waterlogging and salinity with the direct impact of
extreme events is not possible with this dataset however the heightened degradation of the
MX species in the offline system appears to be caused by an extended period of
waterlogging over an annual cycle caused by the extreme summer event.
Plants in the HaX class composed 15% of the total plants recorded in the offline system and
18% of plants recorded in the online system.. A low percentage of death was recorded in
the HaX class over both systems indicating that waterlogging and salinity conditions are
within the tolerance range for these species including groundwater depths of less than 0.5 m
over a range of periods (Figure 4-6).
4.4 Discussion and Conclusion
In the wheatbelt of south-west Western Australia, approximately 75% of native vegetation
has been cleared and replaced with agriculture crops (Lyons et al 2007) and, potentially as a
direct result, virtually all wetlands have been severely degraded (George et al 1997). Prior
to clearing, native vegetation maintained a hydrological equilibrium with groundwater

135
levels deep below the surface whereas, post-clearing, increased recharge resulted in the
development of a superficial aquifer (Salama et al. 1993). Increased groundwater and
surface water flow results in a higher salt load and altered hydroperiods in wetlands causing
a change in the composition of vegetation communities or death of species (George and
Coleman 2000).
Management of wetlands, for their conservation or the protection of other assets, requires
knowledge of how they will effected by hydrological alteration. Knowledge of
hydroperiod thresholds to salinity and waterlogging related to the duration at which a
groundwater depth is maintained which can make engineering solutions such as drainage
and pumping schemes more efficient and minimize the impact on areas where the diverted
water is stored.
Nulsen (1981) found the critical depth of saline groundwater for agricultural crops in the
West Australian wheatbelt is between 1.5 -1.8 m. In a report reviewed by Malcolm (1983)
water-tables 2.0 - 3.0 m below the surface were determined to be the critical depth required
to alleviate salinity, however Barrett-Lennard (2003) hypothesized that lowering the
watertable by 10-20 cm to prevent waterlogging with drains could be sufficient and salt
tolerant plants could be used for further lowering.
From this study, it appears that some native species fringing lakes in south-west Western
Australia may be able to tolerate highly saline groundwater less than 2.0 m from the surface
but there is a threshold related to the period at which this groundwater depth can be
tolerated. Distribution of the number of alive and dead individuals along a time varying
gradient at different groundwater depths was used to quantify hydroperiod thresholds. The

136
transition periods for species response to salinity and waterlogging could be quantified with
more data and long-term monitoring.
Large datasets are necessary to determine specific and accurate thresholds for species by
capturing spatial and temporal variability of hydrological parameters and species health for
statistical analysis. Large datasets are also necessary to determine thresholds to individual
environmental factors rather than capturing a decline in health that may be a result of an
interaction between multiple environmental factors that individually would have a far less
severe impact.
Vegetation data was collected in March 2007 at the end of the hydrological investigation
and the degree of waterlogging is representative (albeit likely conservative) of the types of
conditions that the vegetation has been subjected to over the last ten years. The health of
the vegetation is therefore assumed to be related to the degree of waterlogging and salinity
experienced during the monitoring period and over the last ten years. Other degradation
processes such as edge effect or insects have not been accounted for in the study, but it is
assumed that because the two systems surveyed occur within approximately 200 m of each
other they are subjected to the same such degradation processes so vegetative differences
between the sites can be attributed to the effects of varying degrees of waterlogging and
salinity.
Separating the direct impact of extreme events from the seasonal effects of waterlogging
and salinity is not possible with the dataset used for this analysis however some classes of
vegetation were significantly more degraded in the areas most affected by the 2007 extreme
event, experiencing extended periods of waterlogging, highlighting the threat anticipated
137
climate scenarios pose.
This study highlights the threat to the vegetation communities fringing lakes in south-west
Western Australia. Distributed across narrow elevation ranges mesophytic, xerophytic,
phreatophytic and combinations of these classes are at significant risk in light of anticipated
climate change scenarios that include more extreme summer rainfall events. A large
proportion of the vegetation is degraded and there is a significant risk that mesophytic and
phreatophytic species will be lost from these systems and perhaps replaced with more
tolerant halophytes.
The methodology used for this study could be used to establish hydroperiods for different
vegetation communities fringing playa lakes in the wheatbelt. With more data and long-
term monitoring, thresholds to salinity and waterlogging could be identified with greater
accuracy and more confidence to assist managers that are manipulating hydrological
regimes to provide hydroperiods and water quality conditions required for the conservation
of vegetation communities.
4.5 References
Alexander, V. L., Hope, P., Collins, D., Trewin, B., Lynch, A., and Nicholls, N. 2007.
Trends in Australia’s climate means and extremes: a global context. Australian
Meteorology Magazine, 56, 1-18.
Barrett-Lennard, E. G. 2003. The interaction between waterlogging and salinity in higher
plants: causes, consequences and implications. Plant and Soil, 253, 35-54.
138
Bryan, K. 1928. Change in plant associations by change in ground water level. Ecology,
9(4), 474-478.
Cofinas, M. Creighton, C 2001. Australian Native Vegetation Assessment 2001. Appendix
7: NVIS classification information: National Vegetation Information system structural
formation nomenclature. National Land and Water Resources Audit, 2001. ISBN 0 642
37128 8. [Internet] Available from:
http://www.anra.gov.au/topics/vegetation/pubs/native_vegetation/nat_veg_appendix7.html.
Updated 16-Nov-2007. [cited 2007 Dec 06].
Cramer, V. A., Hobbs, R. J., Atkins, L., and Hodgson, G. 2004. The influence of local
elevation on soil properties and tree health in remnant eucalypt woodlands affected by
secondary salinity. Plant and Soil, 265, 175-188.
Davis, J. A., and Froend, R. 1999. Loss and degradation of wetlands in southwestern
Australia: underlying causes, consequences and solutions. Wetlands Ecology and
Management, 7, 13-23.
Farmer, D., Cattlin, T., Stanton, D., and Coles, N. 2004. A revised criteria for runoff
management in south-west WA. In: ISCO 2004 - 13th International Soil Conservation
Organisation Conference: Conserving Soil and Water for Society: Sharing Solutions, July
2004, Brisbane.
Froend, R. H., Halse, S . A. and Storey, A. W. 1997. Planning for the recovery of Lake
139
Toolibin, Western Australia. Wetlands Ecology and Management, 5, 73-85.
Froend, R. H., Farrell, R. C. C., Wilkins, C. F., Wilson, C. C., and McComb, A. J. 1993.
The effect of altered water regimes on wetland plants. Wetlands of the Swan Coastal Plain,
4, report to the Water Authority of Western Australia, Perth.
Froend, R. H., and van der Moezel, P. G. 1994. The impact of prolonged flooding on the
vegetation of Coomalbidgup Swamp, Western Australia. Journal of the Royal Society of
Western Australia, 77, 15-22.
George, R., McFarlane, D., and Nulsen, B. 1997. Salinity Threatens the Viability of
Agriculture and Ecosystems in Western Australia. Hydrogeology Journal, 5(1), 6-21.
George, R, Coleman, M. 2001. Hidden menace or opportunity – Groundwater hydrology,
playas and commercial options for salinity in wheatbelt valleys. In: Dealing with Salinity in
Wheatbelt Valleys: Processes, Prospects and Practical Options Conference, 30 July to 1
August 2001 Merredin. Reviewed August 2006. Available from:
http://portal.water.wa.gov.au/portal/page/portal/WaterManagement/Salinity/ProgramMgtCo
ordination/Content/SALINITY_WHEATBELTVALLEYS.pdf, Merredin.
George, R. J., Nulsen, R. A., Ferdowsian, R., and Raper, G. R. 1999. Interactions between
trees and groundwaters in recharge and discharge areas- A survey of Western Australian
sites. Agricultural Water Management, 39, 91-113.
Hatton, T. J., and Nulsen, R. A. 1999. Towards achieving functional ecosystem mimicry
with respect to water cycling in southern Australian agriculture. Agroforestry Systems, 45,
140
203-214.
Horsnell, T. K., Reynolds, D.A., Smettem, K.R., Mattiske, E. in press 2009. Composition
and relative health of remnant vegetation fringing lakes along a salinity and waterlogging
gradient. Wetlands Ecology and Management.
Lyons, M. N., Halse, S. A., Gibson, N., Cale, D. J., Lane, J. A. K., Walker, C. D., Mickle,
D. A., and Froend, R. H. 2007. Monitoring wetlands in a salinizing landscape: case studies
from the Wheatbelt region of Western Australia. Hydrobiologia, 591, 147-164.
Malcolm, C. V. 1983. Wheatbelt salinity: a review of the salt land problem in south-
western Australia. Department of Agriculture, South Perth, Western Australia.
Marimuthu, S., Reynolds, D. A., and Le Gal La Salle, C. 2005. A field study of hydraulic,
geochemical and stable isotope relationships in a coastal wetlands system. Journal of
Hydrology, 1-24.
Massenbauer, A. 2007. Esperance Lakes Catchment Appraisal 2007. Resource
Management Technical Report 316. Esperance Catchment Support Team - Department of
Agriculture and Food, pp. 1-67.
Maximov, N. A. 1931. The Physiological Significance of the Xeromorphic Structure of
Plants. The Journal of Ecology, 19(2), 273-282.
Nulsen, R. A. 1981. Critical Depth to Saline Groundwater in Non-irrigated Situations. Aust.

141
J. Soil Res., 19, 83-86.
Peck, A. J., and Hatton, T. 2003. Salinity and the discharge of salts from catchments in
Australia. Journal of Hydrology, 272, 191-202.
Peck, A. J., and Williamson, D. R. 1987. Effects of forest clearing on groundwater. Journal
of Hydrology, 94, 47-65.
Ruprecht J, Li Y, Campbell E, Hope P. 2005. How extreme south-west rainfalls have
changed. Climate Note Series 6/05 (August) IOCI. [Internet].
http://www.ioci.org.au/publications/pdf/IOCIclimatenotes_6.pdf. [cited 2008 Jan 24].
Salama, R. B., Farrington, P., Bartle, G. A., and Watson, G. D. 1993. Salinity trends in the
wheatbelt of Western Australia: results of water and salt balance studies from Cuballing
catchment. Journal of Hydrology, 145, 41-63.
Simons, J., and Alderman, A. 2004. Groundwater trends in the Esperance Sandplain and
Mallee sub-regions. Miscellaneous Publication 10/2004, Department of Agriculture.
Specht, R. L., and Specht, A. 1999. Australian Plant Communities. Dynamics of structure,
growth and biodiversity, Oxford University Press, Victoria, Australia.
Stolte, W. J., McFarlane, D. J., and George, R. J. 1997. Flow systems, tree plantations, and
salinization in a Western Australian catchment. Australian Journal of Soil Research, 35,
1213-1229.
142
Williams, W. D. 1999. Salinisation: A major threat to water resources in the arid and semi-
arid regions of the world. Lakes & Reservoirs: Research and Management, 4, 85-91.
Yu, B., and Neil, D. T. 1993. Long-term variations in regional rainfall in the south-west of
Western Australia and the difference between average and high intensity rainfalls.
International Journal of Climatology, 13, 77-88
143
Chapter 5. General Discussion & Conclusions
The objective of this study was to develop and test a mechanism which would allow for
correlation of the health of vegetation with natural variation in salinity and waterlogging
with the ultimate aim of enabling managers to efficiently manage hydrological regimes to
provide the conditions and hydroperiods required by vegetation surrounding lakes.
The composition of vegetation communities is changing as the spatial and temporal
variability of hydroperiods is reduced. Water chemistry and hydroperiod are key
determinants of species distribution in a wetland (Goslee et al. 1997) so when variability in
these key determinants is reduced niche habitats are also reduced causing a loss of
biodiversity (Davis and Froend 1999).
.
At low elevations, xerophytes, phreatophytes and mesophytes are degraded where
halophytes are healthy. Given the low relief of the system studied, halophytes may increase
their range and move into higher areas where other classes of vegetation are being lost and
achieve dominance in a much less diverse system.

144
Species have groundwater depth thresholds at which they can not tolerate a particular depth
for any period of time and a hydroperiod threshold at which they can tolerate a groundwater
depth for a specific but not extended period of time.
.
Long-term monitoring is required to account for the species experiencing a transition period
where they have been severely degraded and irreversibly damaged leading to eventual
mortality as a result of extreme events and the long-term effects of salinity and
waterlogging. This thesis produced a methodology that can be used to determine tolerance
ranges for classes of vegetation classified according to water requirements and salt
tolerances. For a list of species surveyed and their classification see appendix A.
The groundwater pumping program for Toolibin Lake aimed to drawdown the watertable at
least 1.5 m from the surface to alleviate the effects of waterlogging (Toolibin Lake
Recovery Team and Toolibin Lake Technical Advisory Group 1994). In this study,
groundwater levels maintained 1.5 m from the surface for an entire year exceeds the
tolerance levels for most species.
Tolerance ranges established in this study indicate that xerophytes can tolerate groundwater
depths of less than 1.0 - 2.0 m from the surface for an extended period of time but
groundwater less than 2.0 m from the surface for an entire year is intolerable.
In terms of distribution there is a clear threshold for halophytes from 1.0 – 2.0 m however
results indicate that these species are extremely tolerant, withstanding groundwater depths
of less than 0.5 m from the surface for the entire year. Similarly the HaX class can tolerate
groundwater depths of less than 0.5 m for a range of periods over an annual cycle. A small

145
sample size for the PX class at groundwater depths of less than 2.0 m makes hydroperiod
thresholds inconclusive however groundwater depths of less than 1.0 m from the surface is
intolerable for even very small hydroperiods. Groundwater depths maintained less than 2.0
m from the surface for an entire year is intolerable for species in the MX class where a
significant proportion of the population occurred and accounted for most of the death
recorded. There is a high risk that without intervention species from the MX and PX class
will be lost from the communities fringing playa lakes given their narrow elevation range
and the high percentage of death recorded.
The longer term (decadal) cycle of water table rise impacts hydroperiods differently to the
short term (daily to monthly) signals imposed by extreme rainfall events. A long-term
dataset is required to separate the two signals but through the extrapolation of the
vegetation health survey from this study it appears both signals have severe impacts. The
long-term impact of rising groundwater and salinity levels as a result of land clearing has
reduced the spatial variability of hydroperiods and thus diversity in vegetation
communities. The impact of extreme events combined with high groundwater and salinity
levels as a result of clearing, reduces the temporal variability of hydroperiods, pushing
communities past a threshold and resulting in local extinctions.
As groundwater levels drop in some areas the impact of extreme events will be lessened
and could even be reversed if salt is flushed down the soil profile, away from the rooting
zone. The rate of groundwater level decline, duration of dry periods and the frequency and
spacing between extreme events will dictate the impact on vegetation communities.

146
This study illustrates the considerable impact that extreme summer rainfall events can have
on vegetation communities and highlights the risk anticipated climate change scenarios
pose to vegetation surrounding lakes in the Wheatbelt. Direct conservation approaches that
involve modifying hydrological regimes should incorporate extreme rainfall events and
their predicted increased frequency in their design.
This thesis has produced a generic methodology for determining the hydroperiods of
different classes of vegetation surrounding playa lakes in south-west Australia. With long-
term monitoring and a larger dataset, the methodology can be used to determine more
specific thresholds for vegetation to salinity and waterlogging.
This methodology could also be used at multiple sites where vegetation health and
hydroperiods vary, thereby increasing the sample size and the statistical significance of
relationships. Historical hydroperiods could also be established by modelling lakes with
long-term rainfall datasets and historical vegetation surveys to provide insight into previous
conditions that existed when vegetation was healthy.
This thesis has established tolerance ranges for classes of vegetation surrounding lakes in
south-west Western Australia and has improved understanding of the threats to vegetation
147
5.1 References
Goslee, S. C., R. P. Brooks, and C. A. Cole. 1997. Plants as indicators of wetland water
source. Plant Ecology 131:199-206.
Davis, J. A., and Froend, R. 1999. Loss and degradation of wetlands in southwestern
Australia: underlying causes, consequences and solutions. Wetlands Ecology and
Management, 7, 13-23.
Toolibin Lake Recovery Plan. Prepared by the Toolibin Lake Recovery Team and Toolibin
Lake Technical Advisory Group 1994. Endorsed by the Corporate Executive of the
Department of Conservation and Land Management and the National Parks and Nature
Conservation Authority in September 1994.

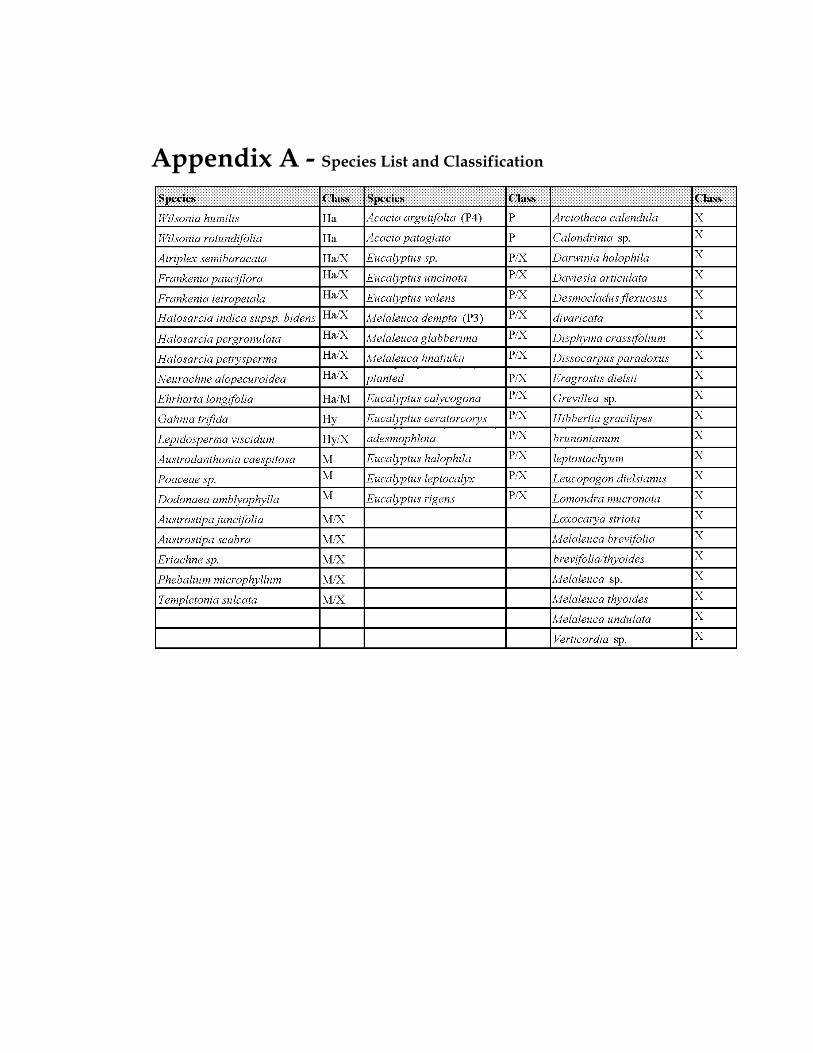
Appendix A - Species List and Classification

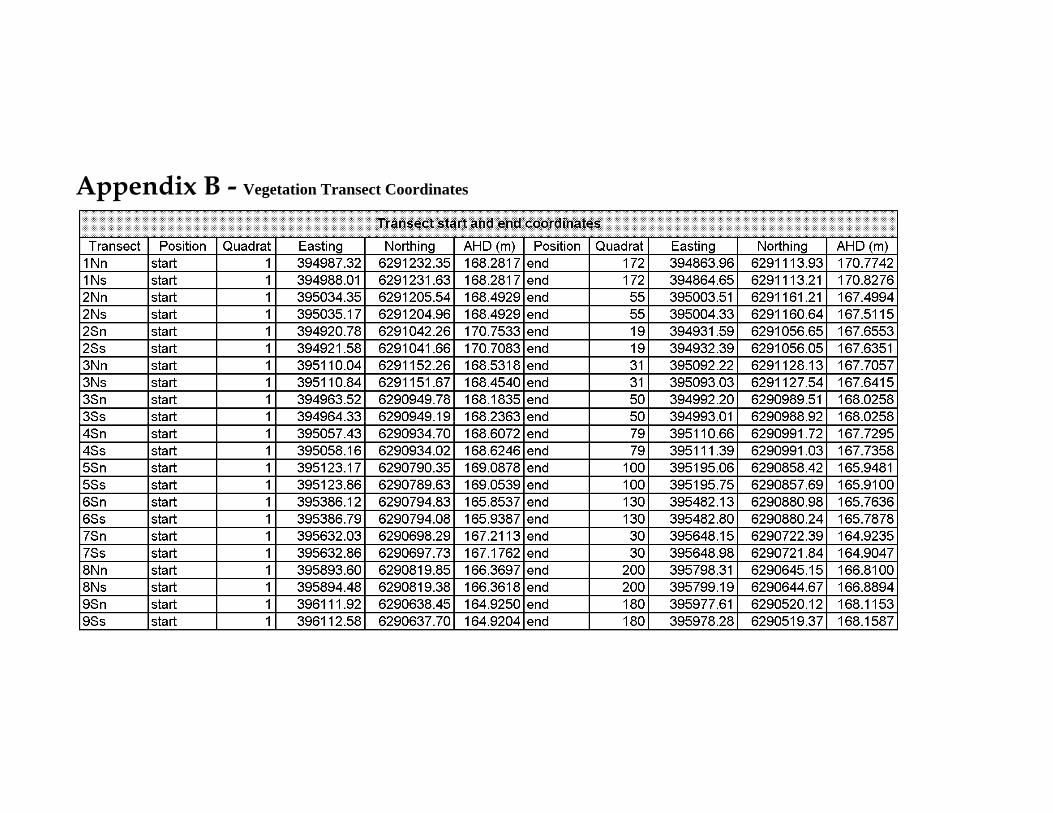
Appendix B - Vegetation Transect Coordinates


Appendix C - Groundwater average, maximum and minimum number of days where groundwater was within a given depth for classes of vegetation in the online and offline system


Appendix D –Daily average groundwater depths (m below the surface) for online wells
ONLINE OBSERVATION WELLS
A
B
C
D
E
F
G
H I
J
K
L
M
N
Main Lake OBS1
2nd Lake OBS2A
easting
396042.17
396135.54
396047.96
396069.47 395843.76 395772.68 395840.50 395662.51
395527.27 395693.12 395441.64 395328.65 395270.88 395146.32
395747.57
395954.91
northing 6290567.32 6290699.18 6290715.21 6290773.37 6290731.74 6290877.00 6290623.20 6290713.01 6290782.05 6290900.32 6290847.31 6290829.24 6290868.24 6290791.73 6290810.44 6290675.90 surface (AHD)
163.80
164.59
164.43
165.02 165.13 165.62 164.42 165.34
165.03 165.30 165.47 165.24 165.83 166.35
164.76
163.99
date daily average groundwater depth (m) below the surface (negative values are groundwater levels above the surface) 31/03/2006 0.37 1.11 1.13 0.45 -0.18 0.75 0.42 0.64 0.69 0.24 0.78 0.51 0.11 0.78
1/04/2006 0.06 1.11 1.11 0.45 -0.22 0.69 0.29 0.24 0.59 0.16 0.73 0.27 0.25 0.78 2/04/2006 -0.07 1.07 1.10 0.44 -0.28 0.57 0.09 0.11 0.45 -0.08 0.54 -0.05 0.30 0.78 3/04/2006 -0.06 1.05 1.09 0.43 -0.28 0.55 0.08 0.12 0.43 -0.15 0.48 0.07 0.32 0.78 4/04/2006 -0.03 0.98 1.08 0.43 -0.25 0.56 0.16 0.14 0.43 0.03 0.50 0.20 0.31 0.78 5/04/2006 -0.01 0.92 1.08 0.43 -0.22 0.57 0.23 0.14 0.44 0.07 0.51 0.23 0.32 0.78 6/04/2006 0.02 0.86 1.08 0.44 -0.21 0.59 0.28 0.15 0.44 0.08 0.53 0.26 0.30 0.78 7/04/2006 0.07 0.81 1.06 0.44 -0.21 0.60 0.34 0.16 0.45 0.08 0.54 0.27 0.29 0.78 8/04/2006 0.11 0.76 1.02 0.43 -0.21 0.61 0.35 0.17 0.45 0.08 0.55 0.29 0.29 0.78 9/04/2006 0.13 0.72 0.97 0.44 -0.21 0.62 0.34 0.17 0.45 0.09 0.54 0.30 0.27 0.78
10/04/2006 0.20 0.69 0.89 0.44 -0.22 0.63 0.31 0.17 0.45 0.08 0.54 0.27 0.27 0.78 11/04/2006 0.14 0.65 0.87 0.45 -0.23 0.63 0.33 0.17 0.45 0.08 0.55 0.29 0.26 0.78 12/04/2006 0.23 0.62 0.84 0.45 -0.23 0.64 0.34 0.17 0.45 0.08 0.55 0.32 0.25 0.78 13/04/2006 0.20 0.60 0.78 0.45 -0.23 0.65 0.36 0.19 0.45 0.09 0.57 0.33 0.25 0.78 14/04/2006 0.17 0.57 0.75 0.45 -0.23 0.66 0.36 0.20 0.46 0.09 0.59 0.35 0.24 0.78 15/04/2006 0.24 0.55 0.73 0.45 -0.23 0.67 0.36 0.21 0.46 0.08 0.59 0.34 0.24 0.78 16/04/2006 0.25 0.53 0.71 0.44 -0.23 0.67 0.36 0.22 0.46 0.08 0.60 0.34 0.24 0.78 17/04/2006 0.16 0.51 0.69 0.45 -0.24 0.68 0.36 0.22 0.46 0.07 0.60 0.34 0.24 0.78

ONLINE OBSERVATION WELLS
A
B
C
D
E
F
G
H
I
J
K
L
M
N
Main Lake OBS1
2nd Lake OBS2A
18/04/2006 0.18 0.50 0.65 0.46 -0.24 0.68 0.36 0.22 0.46 0.07 0.61 0.34 0.24 0.78 19/04/2006 0.18 0.48 0.62 0.47 -0.24 0.69 0.36 0.23 0.46 0.06 0.61 0.34 0.24 0.78 20/04/2006 0.20 0.47 0.60 0.48 -0.24 0.69 0.41 0.23 0.46 0.07 0.61 0.34 0.24 0.78 21/04/2006 0.22 0.46 0.59 0.49 -0.24 0.69 0.41 0.23 0.46 0.06 0.62 0.35 0.24 0.78 22/04/2006 0.21 0.45 0.57 0.48 -0.24 0.69 0.41 0.23 0.46 0.07 0.62 0.35 0.24 0.78 23/04/2006 0.17 0.44 0.53 0.48 -0.24 0.69 0.38 0.23 0.47 0.06 0.62 0.34 0.25 0.78 24/04/2006 0.20 0.43 0.50 0.49 -0.24 0.69 0.38 0.23 0.47 0.06 0.62 0.34 0.24 0.78 25/04/2006 0.24 0.43 0.50 0.49 -0.24 0.69 0.38 0.23 0.47 0.06 0.63 0.34 0.24 0.78 26/04/2006 0.01 0.42 0.48 0.49 -0.25 0.65 0.29 0.15 0.47 0.03 0.57 0.13 0.25 0.78 27/04/2006 -0.05 0.40 0.45 0.47 -0.26 0.60 0.18 0.11 0.46 -0.05 0.48 0.06 0.25 0.78 28/04/2006 -0.03 0.38 0.42 0.45 -0.26 0.60 0.21 0.11 0.46 -0.05 0.47 0.11 0.25 0.78 29/04/2006 -0.07 0.36 0.40 0.44 -0.27 0.58 0.12 0.11 0.44 -0.11 0.44 0.01 0.25 0.78 30/04/2006 -0.01 0.35 0.38 0.43 -0.27 0.59 0.13 0.11 0.44 -0.12 0.46 0.12 0.25 0.78
1/05/2006 0.08 0.33 0.36 0.43 -0.27 0.60 0.20 0.11 0.44 -0.10 0.48 0.17 0.25 0.78 2/05/2006 0.00 0.32 0.33 0.43 -0.27 0.60 0.24 0.11 0.44 -0.10 0.48 0.17 0.25 0.78 3/05/2006 -0.06 0.31 0.32 0.43 -0.27 0.60 0.16 0.11 0.44 -0.12 0.47 0.12 0.25 0.78 4/05/2006 -0.02 0.30 0.31 0.42 -0.27 0.60 0.18 0.11 0.45 -0.12 0.47 0.16 0.35 0.78 5/05/2006 0.03 -1.03 0.29 0.41 -0.27 0.60 0.28 0.11 0.47 -0.11 0.47 0.17 0.51 0.73 6/05/2006 -0.02 -1.03 0.28 0.43 -0.27 0.60 0.27 0.11 0.46 -0.10 0.47 0.17 0.49 0.70 7/05/2006 0.02 -1.03 0.28 0.43 -0.27 0.60 0.26 0.12 0.45 -0.10 0.48 0.20 0.50 0.71 8/05/2006 0.22 0.14 0.27 0.26 0.44 0.58 -0.24 0.62 0.30 0.12 0.45 -0.03 0.49 0.22 0.47 0.57 9/05/2006 0.19 0.15 0.26 0.24 0.46 0.59 -0.24 0.60 0.32 0.12 0.45 0.02 0.49 0.22 0.47 0.57
10/05/2006 0.20 0.15 0.26 0.23 0.47 0.60 -0.23 0.60 0.32 0.13 0.46 0.03 0.49 0.22 0.48 0.58 11/05/2006 0.21 0.16 0.26 0.22 0.48 0.61 -0.22 0.60 0.33 0.14 0.47 0.05 0.50 0.24 0.44 0.58 12/05/2006 0.22 0.17 0.26 0.20 0.48 0.62 -0.22 0.60 0.33 0.14 0.48 0.06 0.51 0.25 0.42 0.59 13/05/2006 0.23 0.18 0.26 0.20 0.49 0.62 -0.21 0.60 0.34 0.15 0.49 0.06 0.52 0.26 0.40 0.58 14/05/2006 0.24 0.18 0.26 0.19 0.49 0.63 -0.21 0.60 0.34 0.15 0.49 0.07 0.52 0.27 0.36 0.59 15/05/2006 0.24 0.18 0.26 0.19 0.50 0.64 -0.19 0.61 0.34 0.15 0.49 0.07 0.53 0.27 0.40 0.60

ONLINE OBSERVATION WELLS
A
B
C
D
E
F
G
H
I
J
K
L
M
N
Main Lake OBS1
2nd Lake OBS2A
16/05/2006 0.22 0.17 0.26 0.18 0.50 0.64 -0.19 0.61 0.33 0.15 0.50 0.07 0.53 0.27 0.42 0.60 17/05/2006 0.22 0.18 0.26 0.17 0.50 0.64 -0.19 0.61 0.34 0.16 0.50 0.08 0.54 0.27 0.42 0.60 18/05/2006 0.22 0.19 0.27 0.17 0.51 0.65 -0.18 0.61 0.34 0.16 0.50 0.08 0.54 0.27 0.42 0.59 19/05/2006 0.20 0.14 0.27 0.17 0.51 0.64 -0.19 0.61 0.35 0.18 0.50 0.08 0.55 0.26 0.41 0.59 20/05/2006 0.19 0.10 0.27 0.16 0.53 0.63 -0.18 0.61 0.32 0.18 0.50 0.04 0.54 0.22 0.41 0.57 21/05/2006 0.19 0.16 0.27 0.15 0.53 0.64 -0.18 0.61 0.33 0.18 0.50 0.05 0.55 0.23 0.40 0.54 22/05/2006 0.20 0.17 0.27 0.14 0.53 0.64 -0.17 0.61 0.34 0.18 0.50 0.06 0.55 0.23 0.38 0.57 23/05/2006 0.21 0.19 0.26 0.12 0.53 0.65 -0.16 0.61 0.35 0.18 0.51 0.07 0.55 0.25 0.41 0.58 24/05/2006 0.17 0.00 0.26 0.12 0.53 0.62 -0.21 0.61 0.31 0.16 0.51 0.02 0.54 0.22 0.44 0.59 25/05/2006 0.17 -0.03 0.26 0.11 0.54 0.60 -0.21 0.60 0.27 0.14 0.50 -0.01 0.54 0.20 0.43 0.58 26/05/2006 0.16 -0.05 0.26 0.10 0.54 0.59 -0.21 0.60 0.27 0.14 0.49 -0.02 0.53 0.20 0.45 0.57 27/05/2006 0.17 -0.01 0.27 0.10 0.54 0.60 -0.21 0.60 0.27 0.14 0.50 -0.02 0.53 0.21 0.44 0.58 28/05/2006 0.18 0.04 0.26 0.10 0.54 0.61 -0.20 0.60 0.28 0.14 0.50 0.00 0.53 0.21 0.43 0.58 29/05/2006 0.16 0.00 0.26 0.10 0.54 0.60 -0.21 0.60 0.28 0.13 0.50 0.00 0.52 0.20 0.44 0.58 30/05/2006 0.13 -0.08 0.26 0.09 0.54 0.53 -0.22 0.60 0.24 0.11 0.48 -0.04 0.50 0.12 0.45 0.57 31/05/2006 0.11 -0.09 0.25 0.09 0.51 0.48 -0.25 0.60 0.18 0.10 0.45 -0.13 0.47 0.02 0.45 0.57
1/06/2006 0.11 -0.10 0.24 0.08 0.50 0.43 -0.27 0.60 0.13 0.08 0.43 -0.18 0.42 -0.05 0.45 0.57 2/06/2006 0.11 -0.08 0.23 0.07 0.47 0.42 -0.27 0.59 0.10 0.07 0.42 -0.20 0.38 -0.04 0.44 0.57 3/06/2006 0.11 -0.03 0.22 0.05 0.45 0.43 -0.26 0.59 0.11 0.08 0.42 -0.16 0.40 0.05 0.42 0.57 4/06/2006 0.12 0.00 0.21 0.05 0.45 0.46 -0.25 0.59 0.14 0.09 0.42 -0.11 0.42 0.11 0.41 0.58 5/06/2006 0.12 0.03 0.20 0.05 0.45 0.49 -0.24 0.59 0.19 0.10 0.42 -0.08 0.43 0.13 0.40 0.57 6/06/2006 0.13 0.06 0.20 0.04 0.45 0.51 -0.24 0.59 0.24 0.10 0.42 -0.05 0.43 0.15 0.41 0.57 7/06/2006 0.12 0.06 0.20 0.03 0.46 0.52 -0.25 0.59 0.27 0.10 0.42 -0.04 0.44 0.16 0.43 0.56 8/06/2006 0.12 -0.01 0.20 0.02 0.46 0.52 -0.26 0.59 0.27 0.10 0.42 -0.04 0.44 0.15 0.42 0.55 9/06/2006 0.12 0.00 0.20 0.01 0.47 0.53 -0.25 0.59 0.28 0.10 0.42 -0.04 0.44 0.15 0.42 0.55
10/06/2006 0.12 0.06 0.20 0.00 0.47 0.55 -0.23 0.60 0.30 0.10 0.42 -0.03 0.44 0.18 0.42 0.55 11/06/2006 0.12 0.09 0.20 0.00 0.48 0.56 -0.22 0.60 0.32 0.10 0.42 -0.02 0.45 0.19 0.41 0.57 12/06/2006 0.12 0.10 0.20 0.00 0.48 0.56 -0.21 0.60 0.32 0.10 0.42 -0.02 0.45 0.20 0.41 0.56

ONLINE OBSERVATION WELLS
A
B
C
D
E
F
G
H
I
J
K
L
M
N
Main Lake OBS1
2nd Lake OBS2A
13/06/2006 0.13 0.13 0.20 0.00 0.49 0.58 -0.20 0.60 0.34 0.10 0.40 0.00 0.46 0.22 0.39 0.57 14/06/2006 0.17 0.15 0.20 0.00 0.50 0.59 -0.19 0.61 0.35 0.10 0.40 0.02 0.48 0.23 0.38 0.58 15/06/2006 0.19 0.19 0.21 0.01 0.49 0.60 -0.14 0.62 0.36 0.10 0.44 0.04 0.50 0.26 0.38 0.59 16/06/2006 0.20 0.20 0.21 0.02 0.42 0.61 -0.11 0.63 0.37 0.09 0.49 0.06 0.50 0.29 0.42 0.61 17/06/2006 0.20 0.20 0.21 0.02 0.45 0.62 -0.10 0.63 0.37 0.10 0.51 0.07 0.51 0.29 0.40 0.60 18/06/2006 0.20 0.20 0.21 0.02 0.44 0.63 -0.10 0.63 0.37 0.10 0.52 0.08 0.51 0.29 0.41 0.60 19/06/2006 0.20 0.20 0.21 0.01 0.45 0.63 -0.17 0.63 0.37 0.10 0.53 0.08 0.51 0.30 0.37 0.60 20/06/2006 0.13 0.08 0.21 0.01 0.48 0.59 -0.20 0.62 0.35 0.10 0.50 0.03 0.51 0.28 0.31 0.60 21/06/2006 0.11 0.15 0.21 0.01 0.50 0.57 -0.17 0.63 0.35 0.10 0.50 0.06 0.52 0.27 0.31 0.60 22/06/2006 0.11 0.15 0.21 0.01 0.50 0.59 -0.15 0.63 0.35 0.10 0.50 0.06 0.52 0.27 0.31 0.60 23/06/2006 0.11 0.14 0.21 0.01 0.49 0.59 -0.17 0.63 0.35 0.10 0.50 0.05 0.52 0.27 0.31 0.59 24/06/2006 0.11 0.15 0.21 0.01 0.48 0.60 -0.16 0.63 0.36 0.10 0.50 0.06 0.52 0.27 0.31 0.59 25/06/2006 0.12 0.17 0.22 0.01 0.50 0.61 -0.09 0.64 0.37 0.11 0.51 0.08 0.53 0.28 0.33 0.59 26/06/2006 0.07 0.14 0.21 0.01 0.50 0.61 -0.16 0.63 0.36 0.11 0.51 0.07 0.52 0.28 0.36 0.59 27/06/2006 0.10 0.08 0.21 0.01 0.50 0.58 -0.18 0.63 0.34 0.11 0.51 0.04 0.52 0.26 0.37 0.59 28/06/2006 0.10 -0.09 0.21 0.01 0.45 0.35 -0.26 0.56 0.21 0.02 0.39 -0.10 0.30 -0.03 0.41 0.57 29/06/2006 0.11 -0.09 0.21 0.01 0.29 0.26 -0.26 0.53 0.10 0.00 0.31 -0.19 0.18 -0.07 0.43 0.56 30/06/2006 0.12 -0.06 0.21 0.01 0.26 0.32 -0.26 0.54 0.11 0.01 0.31 -0.16 0.22 -0.01 0.43 0.55
1/07/2006 0.13 -0.10 0.20 0.01 0.28 0.25 -0.27 0.53 0.11 0.02 0.31 -0.18 0.17 -0.04 0.41 0.56 2/07/2006 0.15 -0.06 0.20 0.01 0.26 0.32 -0.27 0.54 0.10 0.02 0.31 -0.18 0.22 0.04 0.41 0.56 3/07/2006 0.16 0.02 0.19 0.00 0.27 0.35 -0.26 0.54 0.11 0.03 0.31 -0.12 0.26 0.11 0.40 0.56 4/07/2006 0.16 0.02 0.18 0.00 0.30 0.37 -0.26 0.55 0.11 0.04 0.33 -0.08 0.28 0.13 0.39 0.58 5/07/2006 0.17 0.06 0.18 -0.01 0.19 0.38 -0.26 0.57 0.13 0.04 0.35 -0.05 0.31 0.16 0.38 0.57 6/07/2006 0.16 0.11 0.17 -0.02 0.11 0.39 -0.27 0.55 0.16 0.05 0.36 -0.04 0.33 0.17 0.37 0.56 7/07/2006 0.17 0.10 0.17 -0.02 0.13 0.40 -0.26 0.55 0.15 0.05 0.37 -0.03 0.34 0.17 0.39 0.56 8/07/2006 0.17 0.10 0.17 -0.02 0.23 0.41 -0.27 0.55 0.17 0.05 0.37 -0.02 0.36 0.18 0.38 0.55 9/07/2006 0.17 0.12 0.17 -0.02 0.28 0.42 -0.27 0.55 0.19 0.05 0.37 -0.01 0.38 0.18 0.37 0.55
10/07/2006 0.17 0.16 0.17 -0.02 0.29 0.44 -0.27 0.55 0.22 0.05 0.36 -0.01 0.40 0.19 0.37 0.55
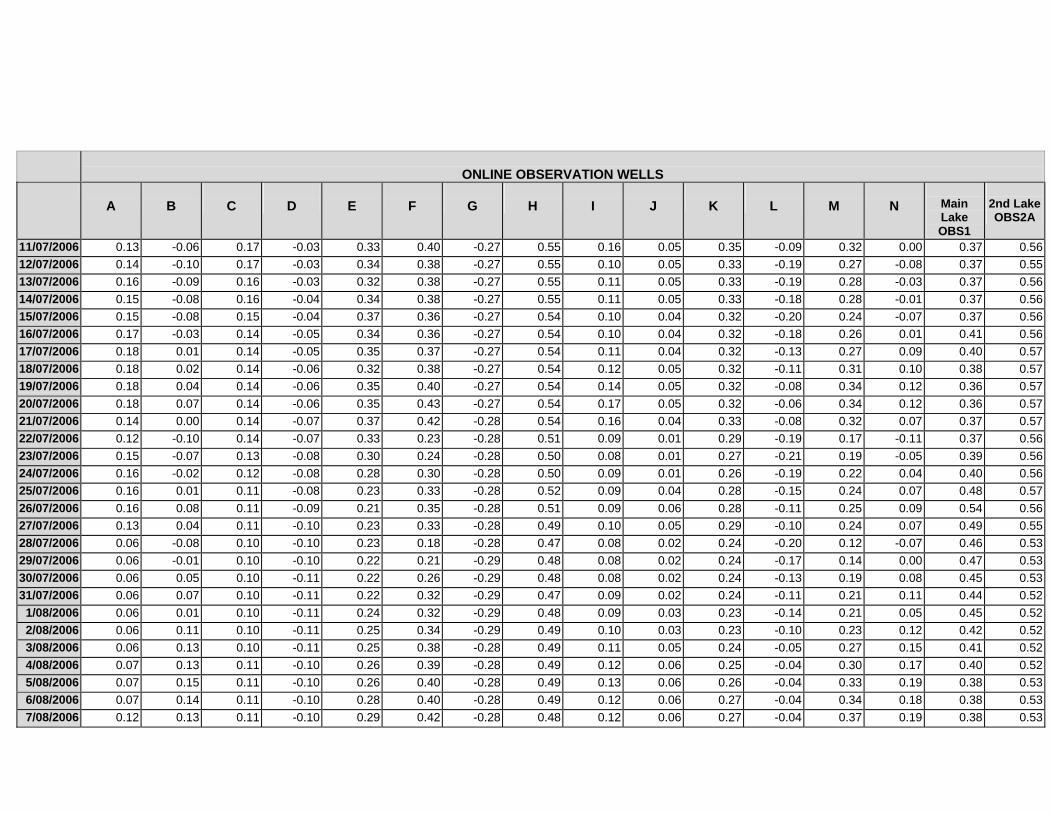
ONLINE OBSERVATION WELLS
A
B
C
D
E
F
G
H
I
J
K
L
M
N
Main Lake OBS1
2nd Lake OBS2A
11/07/2006 0.13 -0.06 0.17 -0.03 0.33 0.40 -0.27 0.55 0.16 0.05 0.35 -0.09 0.32 0.00 0.37 0.56 12/07/2006 0.14 -0.10 0.17 -0.03 0.34 0.38 -0.27 0.55 0.10 0.05 0.33 -0.19 0.27 -0.08 0.37 0.55 13/07/2006 0.16 -0.09 0.16 -0.03 0.32 0.38 -0.27 0.55 0.11 0.05 0.33 -0.19 0.28 -0.03 0.37 0.56 14/07/2006 0.15 -0.08 0.16 -0.04 0.34 0.38 -0.27 0.55 0.11 0.05 0.33 -0.18 0.28 -0.01 0.37 0.56 15/07/2006 0.15 -0.08 0.15 -0.04 0.37 0.36 -0.27 0.54 0.10 0.04 0.32 -0.20 0.24 -0.07 0.37 0.56 16/07/2006 0.17 -0.03 0.14 -0.05 0.34 0.36 -0.27 0.54 0.10 0.04 0.32 -0.18 0.26 0.01 0.41 0.56 17/07/2006 0.18 0.01 0.14 -0.05 0.35 0.37 -0.27 0.54 0.11 0.04 0.32 -0.13 0.27 0.09 0.40 0.57 18/07/2006 0.18 0.02 0.14 -0.06 0.32 0.38 -0.27 0.54 0.12 0.05 0.32 -0.11 0.31 0.10 0.38 0.57 19/07/2006 0.18 0.04 0.14 -0.06 0.35 0.40 -0.27 0.54 0.14 0.05 0.32 -0.08 0.34 0.12 0.36 0.57 20/07/2006 0.18 0.07 0.14 -0.06 0.35 0.43 -0.27 0.54 0.17 0.05 0.32 -0.06 0.34 0.12 0.36 0.57 21/07/2006 0.14 0.00 0.14 -0.07 0.37 0.42 -0.28 0.54 0.16 0.04 0.33 -0.08 0.32 0.07 0.37 0.57 22/07/2006 0.12 -0.10 0.14 -0.07 0.33 0.23 -0.28 0.51 0.09 0.01 0.29 -0.19 0.17 -0.11 0.37 0.56 23/07/2006 0.15 -0.07 0.13 -0.08 0.30 0.24 -0.28 0.50 0.08 0.01 0.27 -0.21 0.19 -0.05 0.39 0.56 24/07/2006 0.16 -0.02 0.12 -0.08 0.28 0.30 -0.28 0.50 0.09 0.01 0.26 -0.19 0.22 0.04 0.40 0.56 25/07/2006 0.16 0.01 0.11 -0.08 0.23 0.33 -0.28 0.52 0.09 0.04 0.28 -0.15 0.24 0.07 0.48 0.57 26/07/2006 0.16 0.08 0.11 -0.09 0.21 0.35 -0.28 0.51 0.09 0.06 0.28 -0.11 0.25 0.09 0.54 0.56 27/07/2006 0.13 0.04 0.11 -0.10 0.23 0.33 -0.28 0.49 0.10 0.05 0.29 -0.10 0.24 0.07 0.49 0.55 28/07/2006 0.06 -0.08 0.10 -0.10 0.23 0.18 -0.28 0.47 0.08 0.02 0.24 -0.20 0.12 -0.07 0.46 0.53 29/07/2006 0.06 -0.01 0.10 -0.10 0.22 0.21 -0.29 0.48 0.08 0.02 0.24 -0.17 0.14 0.00 0.47 0.53 30/07/2006 0.06 0.05 0.10 -0.11 0.22 0.26 -0.29 0.48 0.08 0.02 0.24 -0.13 0.19 0.08 0.45 0.53 31/07/2006 0.06 0.07 0.10 -0.11 0.22 0.32 -0.29 0.47 0.09 0.02 0.24 -0.11 0.21 0.11 0.44 0.52
1/08/2006 0.06 0.01 0.10 -0.11 0.24 0.32 -0.29 0.48 0.09 0.03 0.23 -0.14 0.21 0.05 0.45 0.52 2/08/2006 0.06 0.11 0.10 -0.11 0.25 0.34 -0.29 0.49 0.10 0.03 0.23 -0.10 0.23 0.12 0.42 0.52 3/08/2006 0.06 0.13 0.10 -0.11 0.25 0.38 -0.28 0.49 0.11 0.05 0.24 -0.05 0.27 0.15 0.41 0.52 4/08/2006 0.07 0.13 0.11 -0.10 0.26 0.39 -0.28 0.49 0.12 0.06 0.25 -0.04 0.30 0.17 0.40 0.52 5/08/2006 0.07 0.15 0.11 -0.10 0.26 0.40 -0.28 0.49 0.13 0.06 0.26 -0.04 0.33 0.19 0.38 0.53 6/08/2006 0.07 0.14 0.11 -0.10 0.28 0.40 -0.28 0.49 0.12 0.06 0.27 -0.04 0.34 0.18 0.38 0.53 7/08/2006 0.12 0.13 0.11 -0.10 0.29 0.42 -0.28 0.48 0.12 0.06 0.27 -0.04 0.37 0.19 0.38 0.53

ONLINE OBSERVATION WELLS
A
B
C
D
E
F
G
H
I
J
K
L
M
N
Main Lake OBS1
2nd Lake OBS2A
8/08/2006 0.13 0.14 0.12 -0.09 0.32 0.46 -0.28 0.50 0.15 0.07 0.29 -0.04 0.41 0.23 0.37 0.53 9/08/2006 0.13 0.15 0.12 -0.09 0.30 0.50 -0.28 0.50 0.20 0.07 0.30 -0.03 0.43 0.24 0.37 0.53
10/08/2006 0.12 0.17 0.12 -0.09 0.31 0.50 -0.28 0.51 0.20 0.07 0.30 -0.03 0.43 0.24 0.37 0.53 11/08/2006 0.13 0.17 0.12 -0.08 0.32 0.51 -0.28 0.51 0.19 0.07 0.31 -0.03 0.43 0.24 0.37 0.53 12/08/2006 0.12 0.16 0.12 -0.07 0.33 0.51 -0.28 0.51 0.19 0.08 0.31 -0.03 0.43 0.24 0.37 0.53 13/08/2006 0.11 0.13 0.12 -0.07 0.37 0.50 -0.28 0.51 0.19 0.08 0.31 -0.04 0.43 0.23 0.37 0.53 14/08/2006 0.13 0.18 0.12 -0.07 0.36 0.52 -0.28 0.51 0.20 0.08 0.31 -0.03 0.44 0.23 0.37 0.53 15/08/2006 0.10 0.08 0.13 -0.07 0.37 0.49 -0.28 0.50 0.19 0.07 0.31 -0.03 0.41 0.18 0.38 0.52 16/08/2006 0.03 -0.08 0.13 -0.07 0.36 0.26 -0.28 0.46 0.09 0.03 0.28 -0.15 0.20 -0.06 0.38 0.52 17/08/2006 0.04 -0.01 0.13 -0.07 0.29 0.22 -0.28 0.46 0.08 0.03 0.27 -0.17 0.17 0.01 0.37 0.52 18/08/2006 0.08 0.05 0.12 -0.09 0.31 0.29 -0.28 0.46 0.09 0.02 0.27 -0.10 0.21 0.11 0.38 0.54 19/08/2006 0.09 0.02 0.11 -0.05 0.31 0.32 -0.27 0.45 0.10 0.03 0.26 -0.09 0.26 0.13 0.40 0.56 20/08/2006 0.09 -0.04 0.12 -0.02 0.30 0.27 -0.28 0.45 0.09 0.03 0.24 -0.16 0.23 0.02 0.40 0.56 21/08/2006 0.10 0.07 0.12 -0.02 0.31 0.32 -0.28 0.45 0.12 0.03 0.24 -0.08 0.25 0.16 0.39 0.56 22/08/2006 0.07 0.08 0.13 -0.02 0.31 0.33 -0.28 0.45 0.13 0.03 0.24 -0.05 0.30 0.17 0.39 0.56 23/08/2006 0.01 -0.09 0.13 -0.02 0.31 0.25 -0.28 0.43 0.08 0.03 0.23 -0.07 0.19 -0.02 0.39 0.56 24/08/2006 0.03 -0.09 0.13 -0.02 0.30 0.20 -0.28 0.43 0.04 0.02 0.20 0.13 -0.06 0.39 0.56 25/08/2006 0.04 -0.01 0.12 -0.02 0.28 0.24 -0.28 0.44 0.06 0.02 0.21 0.16 0.06 0.38 0.50 26/08/2006 0.01 -0.01 0.11 -0.03 0.28 0.25 -0.28 0.44 0.07 0.02 0.21 0.20 0.08 0.38 0.49 27/08/2006 0.02 0.04 0.12 -0.03 0.28 0.26 -0.28 0.44 0.08 0.02 0.22 0.22 0.09 0.38 0.48 28/08/2006 0.03 0.08 0.12 -0.03 0.30 0.29 -0.28 0.44 0.10 0.03 0.24 0.25 0.15 0.38 0.50 29/08/2006 0.05 0.10 0.12 -0.03 0.32 0.34 -0.28 0.44 0.12 0.03 0.25 0.28 0.18 0.37 0.52 30/08/2006 0.08 0.13 0.13 -0.04 0.33 0.37 -0.28 0.44 0.15 0.03 0.27 0.33 0.24 0.37 0.54 31/08/2006 0.08 0.13 0.13 -0.04 0.33 0.39 -0.28 0.44 0.16 0.03 0.29 0.35 0.24 0.36 0.53
1/09/2006 0.02 0.02 0.13 -0.03 0.33 0.38 -0.28 0.44 0.16 0.03 0.29 0.34 0.19 0.36 0.53 2/09/2006 0.02 0.01 0.13 -0.04 0.35 0.37 -0.28 0.45 0.13 0.03 0.29 0.32 0.14 0.37 0.51 3/09/2006 0.02 0.09 0.13 -0.04 0.36 0.37 -0.28 0.45 0.13 0.03 0.28 0.32 0.15 0.37 0.49 4/09/2006 0.02 0.09 0.13 -0.04 0.36 0.40 -0.28 0.45 0.14 0.03 0.29 0.33 0.16 0.37 0.48
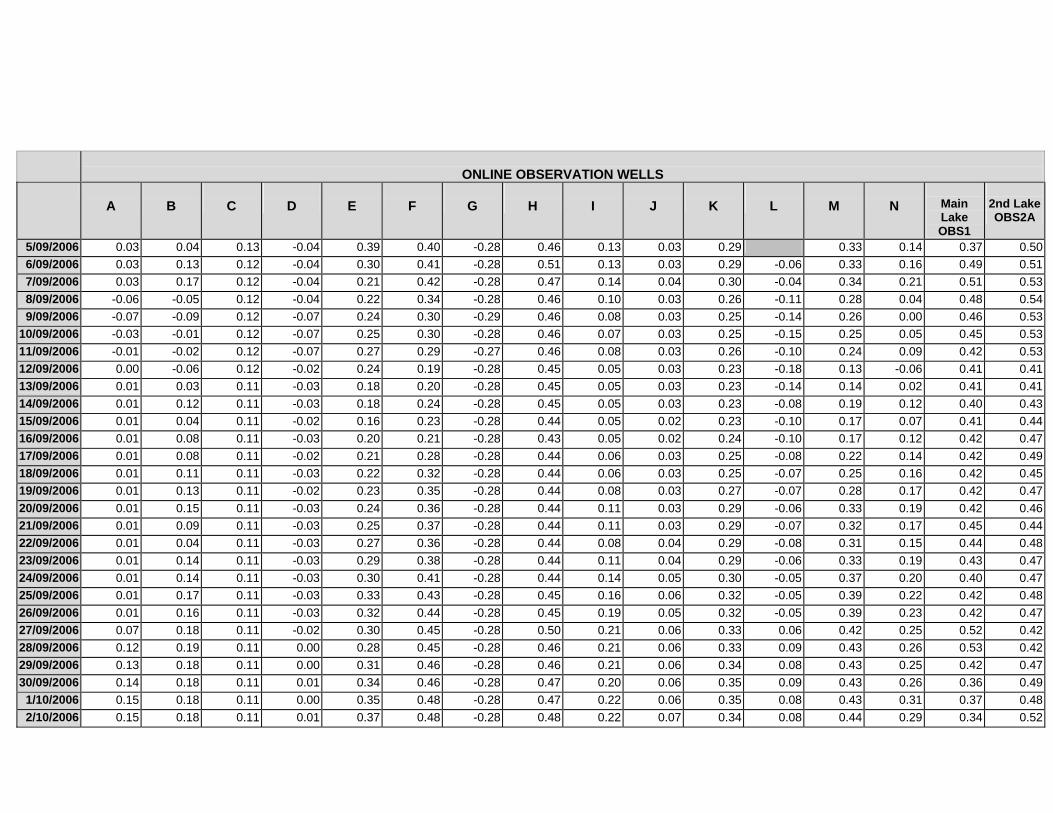
ONLINE OBSERVATION WELLS
A
B
C
D
E
F
G
H
I
J
K
L
M
N
Main Lake OBS1
2nd Lake OBS2A
5/09/2006 0.03 0.04 0.13 -0.04 0.39 0.40 -0.28 0.46 0.13 0.03 0.29 0.33 0.14 0.37 0.50 6/09/2006 0.03 0.13 0.12 -0.04 0.30 0.41 -0.28 0.51 0.13 0.03 0.29 -0.06 0.33 0.16 0.49 0.51 7/09/2006 0.03 0.17 0.12 -0.04 0.21 0.42 -0.28 0.47 0.14 0.04 0.30 -0.04 0.34 0.21 0.51 0.53 8/09/2006 -0.06 -0.05 0.12 -0.04 0.22 0.34 -0.28 0.46 0.10 0.03 0.26 -0.11 0.28 0.04 0.48 0.54 9/09/2006 -0.07 -0.09 0.12 -0.07 0.24 0.30 -0.29 0.46 0.08 0.03 0.25 -0.14 0.26 0.00 0.46 0.53
10/09/2006 -0.03 -0.01 0.12 -0.07 0.25 0.30 -0.28 0.46 0.07 0.03 0.25 -0.15 0.25 0.05 0.45 0.53 11/09/2006 -0.01 -0.02 0.12 -0.07 0.27 0.29 -0.27 0.46 0.08 0.03 0.26 -0.10 0.24 0.09 0.42 0.53 12/09/2006 0.00 -0.06 0.12 -0.02 0.24 0.19 -0.28 0.45 0.05 0.03 0.23 -0.18 0.13 -0.06 0.41 0.41 13/09/2006 0.01 0.03 0.11 -0.03 0.18 0.20 -0.28 0.45 0.05 0.03 0.23 -0.14 0.14 0.02 0.41 0.41 14/09/2006 0.01 0.12 0.11 -0.03 0.18 0.24 -0.28 0.45 0.05 0.03 0.23 -0.08 0.19 0.12 0.40 0.43 15/09/2006 0.01 0.04 0.11 -0.02 0.16 0.23 -0.28 0.44 0.05 0.02 0.23 -0.10 0.17 0.07 0.41 0.44 16/09/2006 0.01 0.08 0.11 -0.03 0.20 0.21 -0.28 0.43 0.05 0.02 0.24 -0.10 0.17 0.12 0.42 0.47 17/09/2006 0.01 0.08 0.11 -0.02 0.21 0.28 -0.28 0.44 0.06 0.03 0.25 -0.08 0.22 0.14 0.42 0.49 18/09/2006 0.01 0.11 0.11 -0.03 0.22 0.32 -0.28 0.44 0.06 0.03 0.25 -0.07 0.25 0.16 0.42 0.45 19/09/2006 0.01 0.13 0.11 -0.02 0.23 0.35 -0.28 0.44 0.08 0.03 0.27 -0.07 0.28 0.17 0.42 0.47 20/09/2006 0.01 0.15 0.11 -0.03 0.24 0.36 -0.28 0.44 0.11 0.03 0.29 -0.06 0.33 0.19 0.42 0.46 21/09/2006 0.01 0.09 0.11 -0.03 0.25 0.37 -0.28 0.44 0.11 0.03 0.29 -0.07 0.32 0.17 0.45 0.44 22/09/2006 0.01 0.04 0.11 -0.03 0.27 0.36 -0.28 0.44 0.08 0.04 0.29 -0.08 0.31 0.15 0.44 0.48 23/09/2006 0.01 0.14 0.11 -0.03 0.29 0.38 -0.28 0.44 0.11 0.04 0.29 -0.06 0.33 0.19 0.43 0.47 24/09/2006 0.01 0.14 0.11 -0.03 0.30 0.41 -0.28 0.44 0.14 0.05 0.30 -0.05 0.37 0.20 0.40 0.47 25/09/2006 0.01 0.17 0.11 -0.03 0.33 0.43 -0.28 0.45 0.16 0.06 0.32 -0.05 0.39 0.22 0.42 0.48 26/09/2006 0.01 0.16 0.11 -0.03 0.32 0.44 -0.28 0.45 0.19 0.05 0.32 -0.05 0.39 0.23 0.42 0.47 27/09/2006 0.07 0.18 0.11 -0.02 0.30 0.45 -0.28 0.50 0.21 0.06 0.33 0.06 0.42 0.25 0.52 0.42 28/09/2006 0.12 0.19 0.11 0.00 0.28 0.45 -0.28 0.46 0.21 0.06 0.33 0.09 0.43 0.26 0.53 0.42 29/09/2006 0.13 0.18 0.11 0.00 0.31 0.46 -0.28 0.46 0.21 0.06 0.34 0.08 0.43 0.25 0.42 0.47 30/09/2006 0.14 0.18 0.11 0.01 0.34 0.46 -0.28 0.47 0.20 0.06 0.35 0.09 0.43 0.26 0.36 0.49
1/10/2006 0.15 0.18 0.11 0.00 0.35 0.48 -0.28 0.47 0.22 0.06 0.35 0.08 0.43 0.31 0.37 0.48 2/10/2006 0.15 0.18 0.11 0.01 0.37 0.48 -0.28 0.48 0.22 0.07 0.34 0.08 0.44 0.29 0.34 0.52
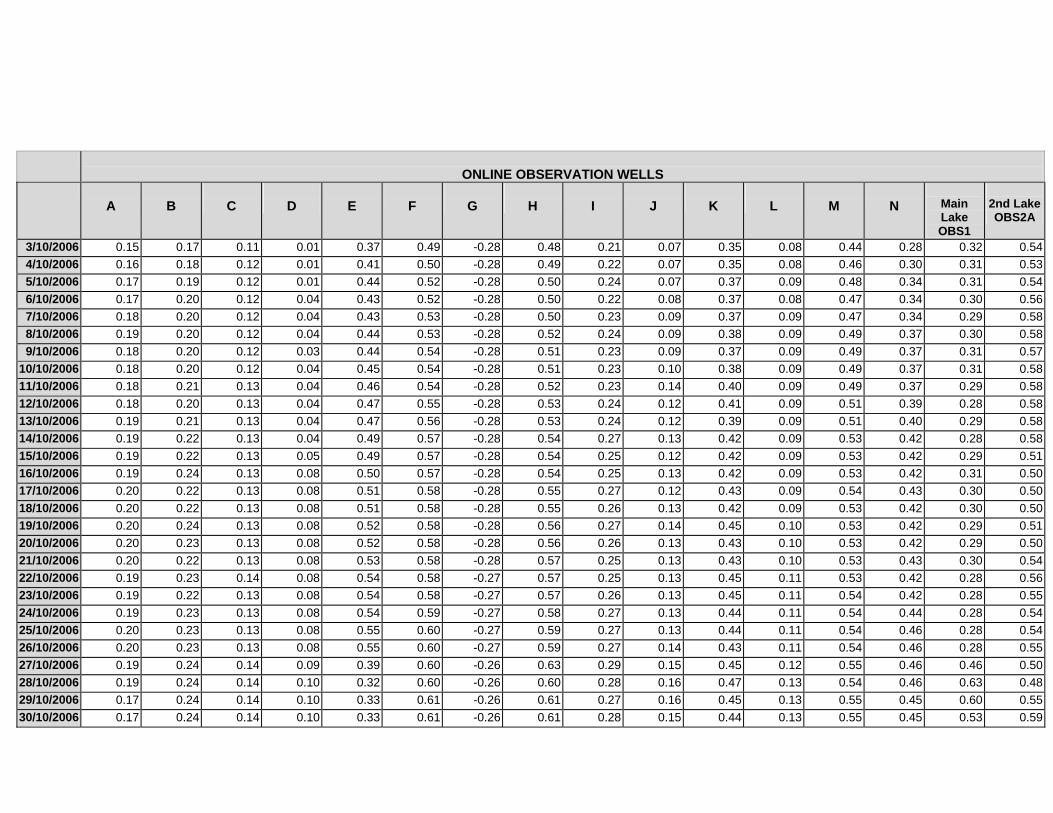
ONLINE OBSERVATION WELLS
A
B
C
D
E
F
G
H
I
J
K
L
M
N
Main Lake OBS1
2nd Lake OBS2A
3/10/2006 0.15 0.17 0.11 0.01 0.37 0.49 -0.28 0.48 0.21 0.07 0.35 0.08 0.44 0.28 0.32 0.54 4/10/2006 0.16 0.18 0.12 0.01 0.41 0.50 -0.28 0.49 0.22 0.07 0.35 0.08 0.46 0.30 0.31 0.53 5/10/2006 0.17 0.19 0.12 0.01 0.44 0.52 -0.28 0.50 0.24 0.07 0.37 0.09 0.48 0.34 0.31 0.54 6/10/2006 0.17 0.20 0.12 0.04 0.43 0.52 -0.28 0.50 0.22 0.08 0.37 0.08 0.47 0.34 0.30 0.56 7/10/2006 0.18 0.20 0.12 0.04 0.43 0.53 -0.28 0.50 0.23 0.09 0.37 0.09 0.47 0.34 0.29 0.58 8/10/2006 0.19 0.20 0.12 0.04 0.44 0.53 -0.28 0.52 0.24 0.09 0.38 0.09 0.49 0.37 0.30 0.58 9/10/2006 0.18 0.20 0.12 0.03 0.44 0.54 -0.28 0.51 0.23 0.09 0.37 0.09 0.49 0.37 0.31 0.57
10/10/2006 0.18 0.20 0.12 0.04 0.45 0.54 -0.28 0.51 0.23 0.10 0.38 0.09 0.49 0.37 0.31 0.58 11/10/2006 0.18 0.21 0.13 0.04 0.46 0.54 -0.28 0.52 0.23 0.14 0.40 0.09 0.49 0.37 0.29 0.58 12/10/2006 0.18 0.20 0.13 0.04 0.47 0.55 -0.28 0.53 0.24 0.12 0.41 0.09 0.51 0.39 0.28 0.58 13/10/2006 0.19 0.21 0.13 0.04 0.47 0.56 -0.28 0.53 0.24 0.12 0.39 0.09 0.51 0.40 0.29 0.58 14/10/2006 0.19 0.22 0.13 0.04 0.49 0.57 -0.28 0.54 0.27 0.13 0.42 0.09 0.53 0.42 0.28 0.58 15/10/2006 0.19 0.22 0.13 0.05 0.49 0.57 -0.28 0.54 0.25 0.12 0.42 0.09 0.53 0.42 0.29 0.51 16/10/2006 0.19 0.24 0.13 0.08 0.50 0.57 -0.28 0.54 0.25 0.13 0.42 0.09 0.53 0.42 0.31 0.50 17/10/2006 0.20 0.22 0.13 0.08 0.51 0.58 -0.28 0.55 0.27 0.12 0.43 0.09 0.54 0.43 0.30 0.50 18/10/2006 0.20 0.22 0.13 0.08 0.51 0.58 -0.28 0.55 0.26 0.13 0.42 0.09 0.53 0.42 0.30 0.50 19/10/2006 0.20 0.24 0.13 0.08 0.52 0.58 -0.28 0.56 0.27 0.14 0.45 0.10 0.53 0.42 0.29 0.51 20/10/2006 0.20 0.23 0.13 0.08 0.52 0.58 -0.28 0.56 0.26 0.13 0.43 0.10 0.53 0.42 0.29 0.50 21/10/2006 0.20 0.22 0.13 0.08 0.53 0.58 -0.28 0.57 0.25 0.13 0.43 0.10 0.53 0.43 0.30 0.54 22/10/2006 0.19 0.23 0.14 0.08 0.54 0.58 -0.27 0.57 0.25 0.13 0.45 0.11 0.53 0.42 0.28 0.56 23/10/2006 0.19 0.22 0.13 0.08 0.54 0.58 -0.27 0.57 0.26 0.13 0.45 0.11 0.54 0.42 0.28 0.55 24/10/2006 0.19 0.23 0.13 0.08 0.54 0.59 -0.27 0.58 0.27 0.13 0.44 0.11 0.54 0.44 0.28 0.54 25/10/2006 0.20 0.23 0.13 0.08 0.55 0.60 -0.27 0.59 0.27 0.13 0.44 0.11 0.54 0.46 0.28 0.54 26/10/2006 0.20 0.23 0.13 0.08 0.55 0.60 -0.27 0.59 0.27 0.14 0.43 0.11 0.54 0.46 0.28 0.55 27/10/2006 0.19 0.24 0.14 0.09 0.39 0.60 -0.26 0.63 0.29 0.15 0.45 0.12 0.55 0.46 0.46 0.50 28/10/2006 0.19 0.24 0.14 0.10 0.32 0.60 -0.26 0.60 0.28 0.16 0.47 0.13 0.54 0.46 0.63 0.48 29/10/2006 0.17 0.24 0.14 0.10 0.33 0.61 -0.26 0.61 0.27 0.16 0.45 0.13 0.55 0.45 0.60 0.55 30/10/2006 0.17 0.24 0.14 0.10 0.33 0.61 -0.26 0.61 0.28 0.15 0.44 0.13 0.55 0.45 0.53 0.59
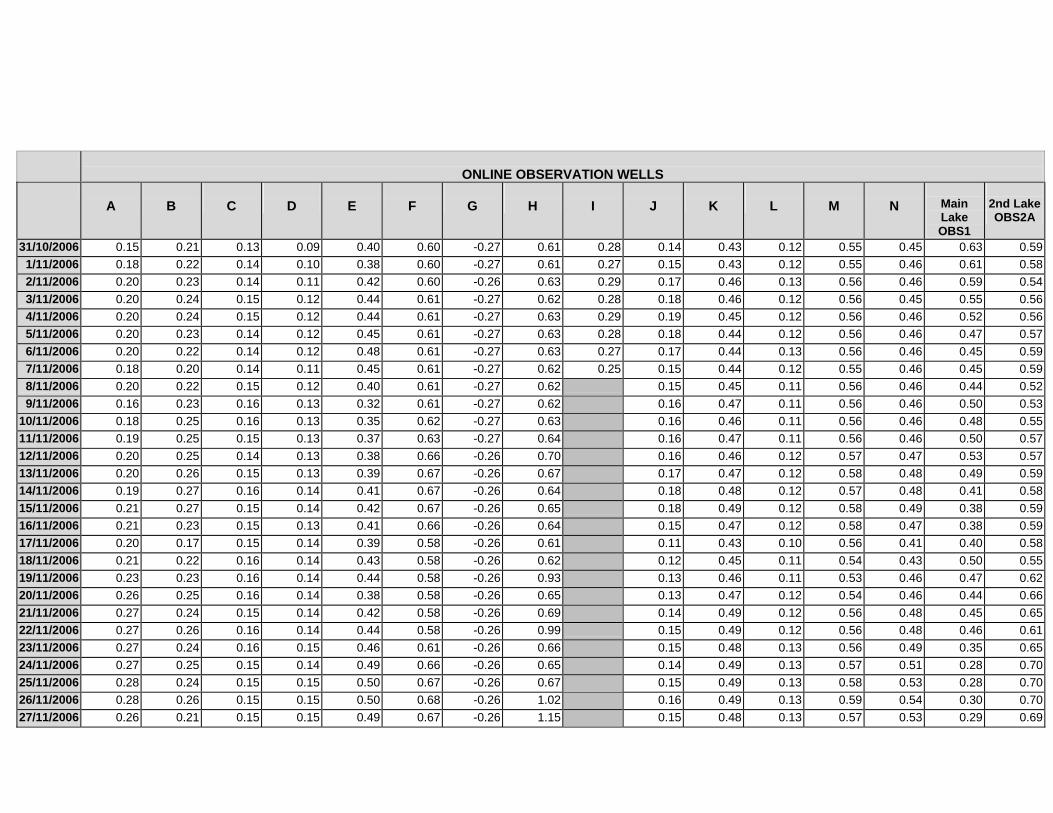
ONLINE OBSERVATION WELLS
A
B
C
D
E
F
G
H
I
J
K
L
M
N
Main Lake OBS1
2nd Lake OBS2A
31/10/2006 0.15 0.21 0.13 0.09 0.40 0.60 -0.27 0.61 0.28 0.14 0.43 0.12 0.55 0.45 0.63 0.59 1/11/2006 0.18 0.22 0.14 0.10 0.38 0.60 -0.27 0.61 0.27 0.15 0.43 0.12 0.55 0.46 0.61 0.58 2/11/2006 0.20 0.23 0.14 0.11 0.42 0.60 -0.26 0.63 0.29 0.17 0.46 0.13 0.56 0.46 0.59 0.54 3/11/2006 0.20 0.24 0.15 0.12 0.44 0.61 -0.27 0.62 0.28 0.18 0.46 0.12 0.56 0.45 0.55 0.56 4/11/2006 0.20 0.24 0.15 0.12 0.44 0.61 -0.27 0.63 0.29 0.19 0.45 0.12 0.56 0.46 0.52 0.56 5/11/2006 0.20 0.23 0.14 0.12 0.45 0.61 -0.27 0.63 0.28 0.18 0.44 0.12 0.56 0.46 0.47 0.57 6/11/2006 0.20 0.22 0.14 0.12 0.48 0.61 -0.27 0.63 0.27 0.17 0.44 0.13 0.56 0.46 0.45 0.59 7/11/2006 0.18 0.20 0.14 0.11 0.45 0.61 -0.27 0.62 0.25 0.15 0.44 0.12 0.55 0.46 0.45 0.59 8/11/2006 0.20 0.22 0.15 0.12 0.40 0.61 -0.27 0.62 0.15 0.45 0.11 0.56 0.46 0.44 0.52 9/11/2006 0.16 0.23 0.16 0.13 0.32 0.61 -0.27 0.62 0.16 0.47 0.11 0.56 0.46 0.50 0.53
10/11/2006 0.18 0.25 0.16 0.13 0.35 0.62 -0.27 0.63 0.16 0.46 0.11 0.56 0.46 0.48 0.55 11/11/2006 0.19 0.25 0.15 0.13 0.37 0.63 -0.27 0.64 0.16 0.47 0.11 0.56 0.46 0.50 0.57 12/11/2006 0.20 0.25 0.14 0.13 0.38 0.66 -0.26 0.70 0.16 0.46 0.12 0.57 0.47 0.53 0.57 13/11/2006 0.20 0.26 0.15 0.13 0.39 0.67 -0.26 0.67 0.17 0.47 0.12 0.58 0.48 0.49 0.59 14/11/2006 0.19 0.27 0.16 0.14 0.41 0.67 -0.26 0.64 0.18 0.48 0.12 0.57 0.48 0.41 0.58 15/11/2006 0.21 0.27 0.15 0.14 0.42 0.67 -0.26 0.65 0.18 0.49 0.12 0.58 0.49 0.38 0.59 16/11/2006 0.21 0.23 0.15 0.13 0.41 0.66 -0.26 0.64 0.15 0.47 0.12 0.58 0.47 0.38 0.59 17/11/2006 0.20 0.17 0.15 0.14 0.39 0.58 -0.26 0.61 0.11 0.43 0.10 0.56 0.41 0.40 0.58 18/11/2006 0.21 0.22 0.16 0.14 0.43 0.58 -0.26 0.62 0.12 0.45 0.11 0.54 0.43 0.50 0.55 19/11/2006 0.23 0.23 0.16 0.14 0.44 0.58 -0.26 0.93 0.13 0.46 0.11 0.53 0.46 0.47 0.62 20/11/2006 0.26 0.25 0.16 0.14 0.38 0.58 -0.26 0.65 0.13 0.47 0.12 0.54 0.46 0.44 0.66 21/11/2006 0.27 0.24 0.15 0.14 0.42 0.58 -0.26 0.69 0.14 0.49 0.12 0.56 0.48 0.45 0.65 22/11/2006 0.27 0.26 0.16 0.14 0.44 0.58 -0.26 0.99 0.15 0.49 0.12 0.56 0.48 0.46 0.61 23/11/2006 0.27 0.24 0.16 0.15 0.46 0.61 -0.26 0.66 0.15 0.48 0.13 0.56 0.49 0.35 0.65 24/11/2006 0.27 0.25 0.15 0.14 0.49 0.66 -0.26 0.65 0.14 0.49 0.13 0.57 0.51 0.28 0.70 25/11/2006 0.28 0.24 0.15 0.15 0.50 0.67 -0.26 0.67 0.15 0.49 0.13 0.58 0.53 0.28 0.70 26/11/2006 0.28 0.26 0.15 0.15 0.50 0.68 -0.26 1.02 0.16 0.49 0.13 0.59 0.54 0.30 0.70 27/11/2006 0.26 0.21 0.15 0.15 0.49 0.67 -0.26 1.15 0.15 0.48 0.13 0.57 0.53 0.29 0.69
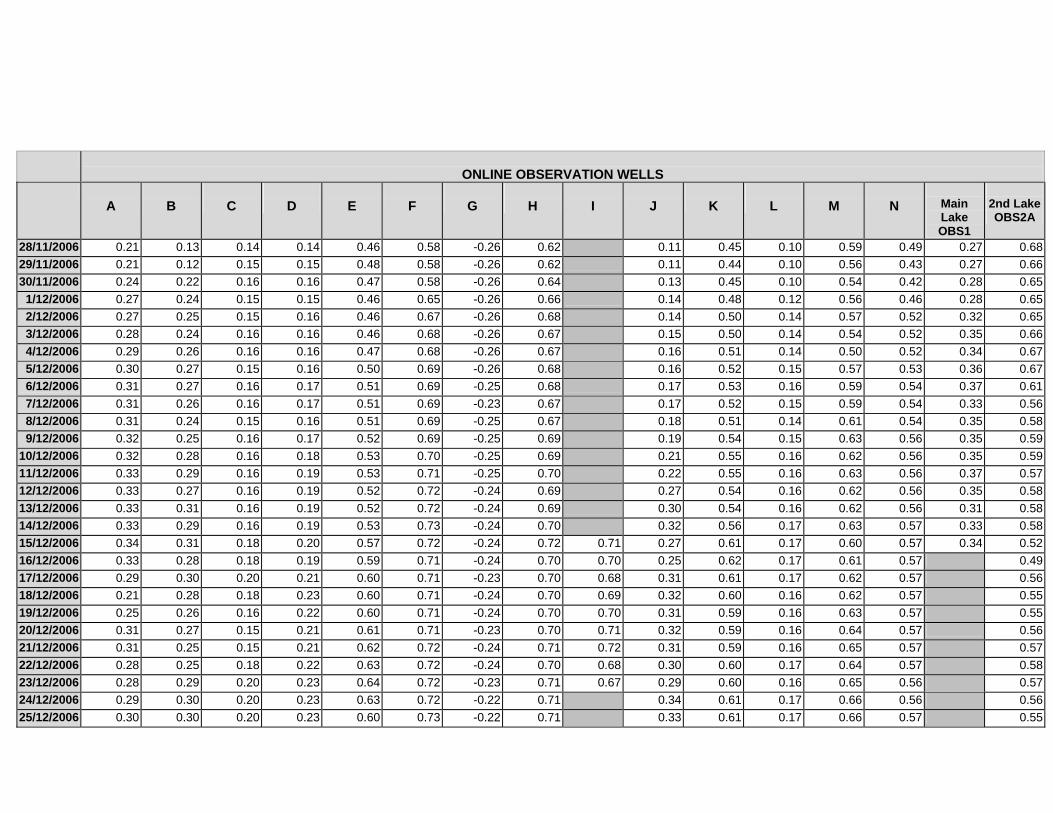
ONLINE OBSERVATION WELLS
A
B
C
D
E
F
G
H
I
J
K
L
M
N
Main Lake OBS1
2nd Lake OBS2A
28/11/2006 0.21 0.13 0.14 0.14 0.46 0.58 -0.26 0.62 0.11 0.45 0.10 0.59 0.49 0.27 0.68 29/11/2006 0.21 0.12 0.15 0.15 0.48 0.58 -0.26 0.62 0.11 0.44 0.10 0.56 0.43 0.27 0.66 30/11/2006 0.24 0.22 0.16 0.16 0.47 0.58 -0.26 0.64 0.13 0.45 0.10 0.54 0.42 0.28 0.65
1/12/2006 0.27 0.24 0.15 0.15 0.46 0.65 -0.26 0.66 0.14 0.48 0.12 0.56 0.46 0.28 0.65 2/12/2006 0.27 0.25 0.15 0.16 0.46 0.67 -0.26 0.68 0.14 0.50 0.14 0.57 0.52 0.32 0.65 3/12/2006 0.28 0.24 0.16 0.16 0.46 0.68 -0.26 0.67 0.15 0.50 0.14 0.54 0.52 0.35 0.66 4/12/2006 0.29 0.26 0.16 0.16 0.47 0.68 -0.26 0.67 0.16 0.51 0.14 0.50 0.52 0.34 0.67 5/12/2006 0.30 0.27 0.15 0.16 0.50 0.69 -0.26 0.68 0.16 0.52 0.15 0.57 0.53 0.36 0.67 6/12/2006 0.31 0.27 0.16 0.17 0.51 0.69 -0.25 0.68 0.17 0.53 0.16 0.59 0.54 0.37 0.61 7/12/2006 0.31 0.26 0.16 0.17 0.51 0.69 -0.23 0.67 0.17 0.52 0.15 0.59 0.54 0.33 0.56 8/12/2006 0.31 0.24 0.15 0.16 0.51 0.69 -0.25 0.67 0.18 0.51 0.14 0.61 0.54 0.35 0.58 9/12/2006 0.32 0.25 0.16 0.17 0.52 0.69 -0.25 0.69 0.19 0.54 0.15 0.63 0.56 0.35 0.59
10/12/2006 0.32 0.28 0.16 0.18 0.53 0.70 -0.25 0.69 0.21 0.55 0.16 0.62 0.56 0.35 0.59 11/12/2006 0.33 0.29 0.16 0.19 0.53 0.71 -0.25 0.70 0.22 0.55 0.16 0.63 0.56 0.37 0.57 12/12/2006 0.33 0.27 0.16 0.19 0.52 0.72 -0.24 0.69 0.27 0.54 0.16 0.62 0.56 0.35 0.58 13/12/2006 0.33 0.31 0.16 0.19 0.52 0.72 -0.24 0.69 0.30 0.54 0.16 0.62 0.56 0.31 0.58 14/12/2006 0.33 0.29 0.16 0.19 0.53 0.73 -0.24 0.70 0.32 0.56 0.17 0.63 0.57 0.33 0.58 15/12/2006 0.34 0.31 0.18 0.20 0.57 0.72 -0.24 0.72 0.71 0.27 0.61 0.17 0.60 0.57 0.34 0.52 16/12/2006 0.33 0.28 0.18 0.19 0.59 0.71 -0.24 0.70 0.70 0.25 0.62 0.17 0.61 0.57 0.49 17/12/2006 0.29 0.30 0.20 0.21 0.60 0.71 -0.23 0.70 0.68 0.31 0.61 0.17 0.62 0.57 0.56 18/12/2006 0.21 0.28 0.18 0.23 0.60 0.71 -0.24 0.70 0.69 0.32 0.60 0.16 0.62 0.57 0.55 19/12/2006 0.25 0.26 0.16 0.22 0.60 0.71 -0.24 0.70 0.70 0.31 0.59 0.16 0.63 0.57 0.55 20/12/2006 0.31 0.27 0.15 0.21 0.61 0.71 -0.23 0.70 0.71 0.32 0.59 0.16 0.64 0.57 0.56 21/12/2006 0.31 0.25 0.15 0.21 0.62 0.72 -0.24 0.71 0.72 0.31 0.59 0.16 0.65 0.57 0.57 22/12/2006 0.28 0.25 0.18 0.22 0.63 0.72 -0.24 0.70 0.68 0.30 0.60 0.17 0.64 0.57 0.58 23/12/2006 0.28 0.29 0.20 0.23 0.64 0.72 -0.23 0.71 0.67 0.29 0.60 0.16 0.65 0.56 0.57 24/12/2006 0.29 0.30 0.20 0.23 0.63 0.72 -0.22 0.71 0.34 0.61 0.17 0.66 0.56 0.56 25/12/2006 0.30 0.30 0.20 0.23 0.60 0.73 -0.22 0.71 0.33 0.61 0.17 0.66 0.57 0.55

ONLINE OBSERVATION WELLS
A
B
C
D
E
F
G
H
I
J
K
L
M
N
Main Lake OBS1
2nd Lake OBS2A
26/12/2006 0.29 0.30 0.21 0.24 0.62 0.73 -0.23 0.71 0.33 0.61 0.17 0.66 0.57 0.56 27/12/2006 0.29 0.31 0.22 0.25 0.65 0.73 -0.21 0.72 0.33 0.61 0.18 0.66 0.57 0.59 28/12/2006 0.30 0.30 0.21 0.25 0.65 0.73 -0.18 0.72 0.33 0.61 0.17 0.66 0.57 0.58 29/12/2006 0.27 0.30 0.21 0.25 0.65 0.73 -0.21 0.72 0.33 0.61 0.18 0.67 0.58 0.57 30/12/2006 0.29 0.30 0.22 0.25 0.66 0.73 -0.23 0.72 0.33 0.61 0.18 0.67 0.58 0.58 31/12/2006 0.32 0.30 0.22 0.25 0.66 0.73 -0.23 0.72 0.33 0.61 0.18 0.68 0.59 0.57
1/01/2007 0.32 0.30 0.23 0.25 0.64 0.73 -0.23 0.72 0.33 0.61 0.18 0.68 0.59 0.59 2/01/2007 0.28 0.30 0.21 0.26 0.65 0.74 -0.23 0.72 0.33 0.61 0.17 0.69 0.62 0.58 3/01/2007 0.19 0.17 0.18 0.25 0.65 0.73 -0.23 0.71 0.24 0.58 0.15 0.68 0.55 0.57 4/01/2007 0.00 -0.09 0.22 0.23 0.27 0.20 -0.27 0.40 -0.01 0.21 -0.06 0.17 -0.03 0.45 5/01/2007 -0.20 -0.11 0.24 0.23 -0.23 -0.10 -0.41 0.04 -0.11 -0.10 -0.23 -0.11 -0.13 0.07 6/01/2007 -0.17 -0.09 0.20 0.21 -0.22 0.05 -0.44 0.08 -0.11 -0.11 -0.25 -0.06 -0.12 0.05 7/01/2007 -0.16 -0.05 0.18 0.18 -0.22 0.12 -0.45 0.13 -0.11 -0.04 -0.15 0.06 -0.11 0.05 8/01/2007 -0.14 0.04 0.17 0.17 -0.20 0.16 -0.45 0.14 -0.10 0.02 -0.12 0.11 -0.07 0.05 9/01/2007 -0.14 0.17 0.16 0.16 -0.17 0.21 -0.45 0.14 -0.10 0.08 -0.10 0.15 -0.04 0.06
10/01/2007 -0.14 0.15 0.15 0.14 -0.17 0.21 -0.45 0.15 -0.10 0.09 -0.09 0.17 -0.06 0.06 11/01/2007 -0.12 0.18 0.14 0.13 -0.15 0.24 -0.45 0.16 -0.09 0.11 -0.09 0.20 -0.05 0.06 12/01/2007 -0.14 0.19 0.13 0.12 -0.14 0.26 -0.45 0.17 -0.09 0.13 -0.09 0.26 -0.06 0.05 13/01/2007 -0.11 0.18 0.13 0.12 -0.10 0.27 -0.45 0.18 -0.06 0.14 -0.09 0.26 -0.06 0.05 14/01/2007 -0.09 0.18 0.13 0.12 -0.06 0.30 -0.45 0.19 -0.05 0.15 -0.09 0.28 -0.02 0.05 15/01/2007 -0.09 0.20 0.13 0.11 -0.06 0.33 -0.45 0.20 -0.03 0.16 -0.09 0.30 0.01 0.05 16/01/2007 -0.09 0.21 0.13 0.11 -0.05 0.35 -0.45 0.23 -0.02 0.18 -0.08 0.34 -0.01 0.05 17/01/2007 -0.07 0.21 0.13 0.10 -0.05 0.35 -0.45 0.22 -0.02 0.19 -0.08 0.37 -0.02 0.05 18/01/2007 -0.05 0.22 0.13 0.10 -0.04 0.36 -0.45 0.23 -0.02 0.21 -0.08 0.39 -0.01 0.06 19/01/2007 -0.05 0.19 0.12 0.10 -0.04 0.36 -0.45 0.23 -0.02 0.20 -0.08 0.39 -0.03 0.06 20/01/2007 -0.05 0.20 0.12 0.10 -0.03 0.37 -0.45 0.24 -0.02 0.20 -0.08 0.39 -0.04 0.05 21/01/2007 -0.03 0.21 0.12 0.09 -0.02 0.37 -0.45 0.23 -0.02 0.22 -0.08 0.41 -0.04 0.06 22/01/2007 -0.02 0.19 0.12 0.09 -0.01 0.38 -0.45 0.23 0.00 0.23 -0.06 0.41 -0.02 0.06

ONLINE OBSERVATION WELLS
A
B
C
D
E
F
G
H
I
J
K
L
M
N
Main Lake OBS1
2nd Lake OBS2A
23/01/2007 -0.06 0.19 0.12 0.09 0.00 0.38 -0.45 0.24 0.02 0.23 -0.03 0.42 -0.02 0.07 24/01/2007 -0.06 0.18 0.12 0.09 0.01 0.38 -0.45 0.24 -0.03 0.24 -0.04 0.42 -0.02 0.07 25/01/2007 -0.06 0.19 0.12 0.09 0.01 0.39 -0.45 0.25 -0.04 0.24 -0.04 0.42 -0.01 0.07 26/01/2007 -0.06 0.19 0.12 0.09 0.02 0.40 -0.45 0.25 0.00 0.25 -0.05 0.43 -0.02 0.07 27/01/2007 -0.06 0.20 0.12 0.09 0.05 0.40 -0.45 0.26 0.02 0.24 -0.05 0.43 0.00 0.07 28/01/2007 -0.01 0.19 0.12 0.09 0.06 0.42 -0.45 0.26 0.02 0.26 -0.05 0.44 0.03 0.07 29/01/2007 0.04 0.19 0.12 0.09 0.06 0.42 -0.45 0.26 0.03 0.28 -0.05 0.45 0.04 0.09 30/01/2007 -0.04 0.20 0.13 0.09 0.08 0.42 -0.45 0.26 0.06 0.29 -0.05 0.45 0.05 0.11 31/01/2007 -0.04 0.20 0.12 0.09 0.09 0.43 -0.45 0.27 0.06 0.30 -0.03 0.46 0.06 0.07
1/02/2007 -0.02 0.20 0.12 0.09 0.09 0.44 -0.45 0.29 0.06 0.31 -0.03 0.46 0.07 0.07 2/02/2007 -0.02 0.20 0.12 0.09 0.12 0.44 -0.45 0.29 0.06 0.32 -0.03 0.47 0.07 0.09 3/02/2007 -0.03 0.19 0.12 0.09 0.16 0.45 -0.45 0.60 0.07 0.31 -0.03 0.47 0.09 0.12 4/02/2007 -0.03 0.26 0.13 0.09 0.19 0.46 -0.45 1.20 0.09 0.37 0.00 0.49 0.11 0.13 5/02/2007 -0.02 0.25 0.13 0.09 0.19 0.47 -0.45 0.92 0.09 0.36 -0.01 0.50 0.13 0.11 6/02/2007 -0.01 0.23 0.13 0.09 0.19 0.48 -0.45 0.30 0.09 0.35 -0.01 0.49 0.13 0.11 7/02/2007 0.00 0.23 0.13 0.09 0.19 0.48 -0.45 0.31 0.09 0.36 -0.01 0.50 0.13 0.12 8/02/2007 0.00 0.23 0.13 0.08 0.22 0.49 -0.45 0.30 0.09 0.37 -0.01 0.50 0.12 0.12 9/02/2007 0.00 0.22 0.13 0.09 0.24 0.50 -0.45 0.31 0.09 0.39 0.00 0.52 0.10 0.12
10/02/2007 0.02 0.20 0.13 0.09 0.25 0.50 -0.45 0.38 0.09 0.37 -0.01 0.51 0.10 0.14 11/02/2007 0.03 0.24 0.13 0.08 0.26 0.50 -0.45 0.72 0.09 0.40 -0.02 0.52 0.10 0.14 12/02/2007 0.05 0.22 0.13 0.09 0.27 0.51 -0.45 0.78 0.09 0.41 -0.02 0.52 0.11 0.14 13/02/2007 0.06 0.22 0.13 0.09 0.29 0.51 -0.45 0.40 0.09 0.43 -0.02 0.52 0.13 0.12 14/02/2007 0.08 0.22 0.13 0.09 0.30 0.52 -0.44 1.00 0.10 0.44 -0.02 0.53 0.13 0.17 15/02/2007 0.08 0.23 0.13 0.09 0.32 0.52 -0.45 1.35 0.11 0.47 -0.02 0.54 0.14 0.23 16/02/2007 0.08 0.22 0.13 0.09 0.33 0.52 -0.44 1.38 0.10 0.47 -0.02 0.55 0.16 0.23 17/02/2007 0.08 0.23 0.13 0.09 0.35 0.53 -0.44 0.73 0.10 0.48 -0.01 0.55 0.16 0.22 18/02/2007 0.09 0.23 0.13 0.09 0.38 0.53 -0.44 0.38 0.10 0.49 -0.01 0.56 0.17 0.22 19/02/2007 0.14 0.23 0.13 0.09 0.40 0.53 -0.44 0.38 0.11 0.50 -0.01 0.56 0.16 0.22
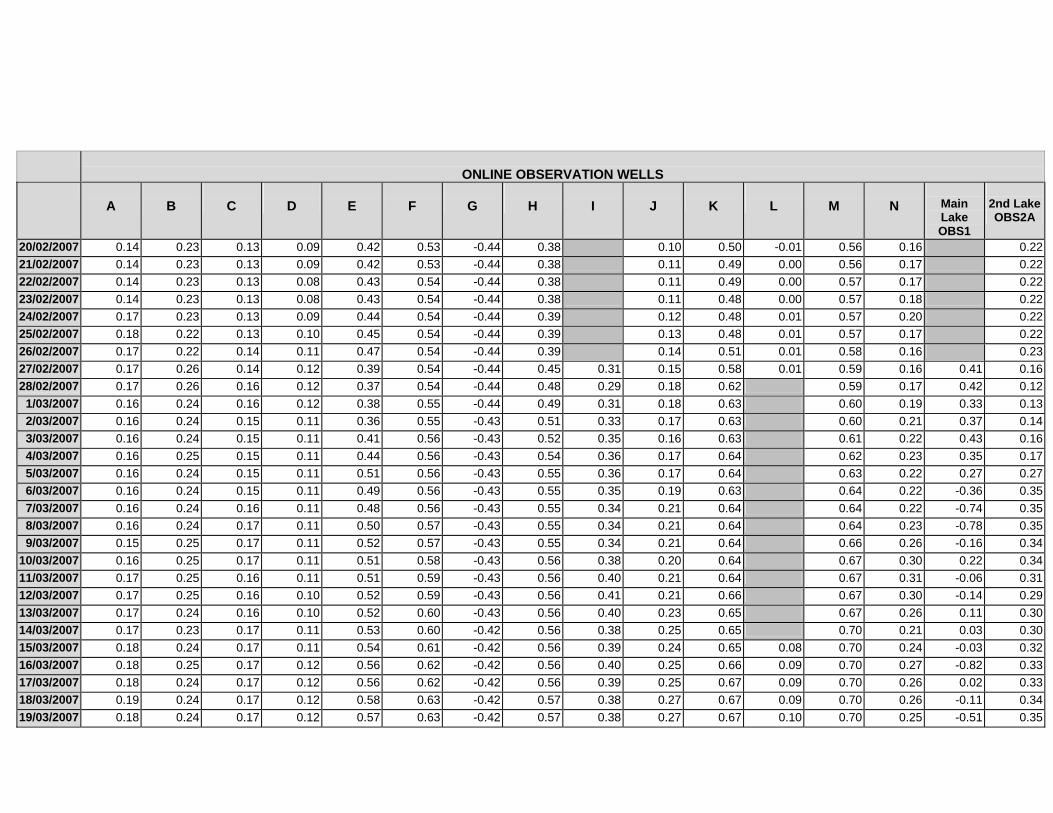
ONLINE OBSERVATION WELLS
A
B
C
D
E
F
G
H
I
J
K
L
M
N
Main Lake OBS1
2nd Lake OBS2A
20/02/2007 0.14 0.23 0.13 0.09 0.42 0.53 -0.44 0.38 0.10 0.50 -0.01 0.56 0.16 0.22 21/02/2007 0.14 0.23 0.13 0.09 0.42 0.53 -0.44 0.38 0.11 0.49 0.00 0.56 0.17 0.22 22/02/2007 0.14 0.23 0.13 0.08 0.43 0.54 -0.44 0.38 0.11 0.49 0.00 0.57 0.17 0.22 23/02/2007 0.14 0.23 0.13 0.08 0.43 0.54 -0.44 0.38 0.11 0.48 0.00 0.57 0.18 0.22 24/02/2007 0.17 0.23 0.13 0.09 0.44 0.54 -0.44 0.39 0.12 0.48 0.01 0.57 0.20 0.22 25/02/2007 0.18 0.22 0.13 0.10 0.45 0.54 -0.44 0.39 0.13 0.48 0.01 0.57 0.17 0.22 26/02/2007 0.17 0.22 0.14 0.11 0.47 0.54 -0.44 0.39 0.14 0.51 0.01 0.58 0.16 0.23 27/02/2007 0.17 0.26 0.14 0.12 0.39 0.54 -0.44 0.45 0.31 0.15 0.58 0.01 0.59 0.16 0.41 0.16 28/02/2007 0.17 0.26 0.16 0.12 0.37 0.54 -0.44 0.48 0.29 0.18 0.62 0.59 0.17 0.42 0.12
1/03/2007 0.16 0.24 0.16 0.12 0.38 0.55 -0.44 0.49 0.31 0.18 0.63 0.60 0.19 0.33 0.13 2/03/2007 0.16 0.24 0.15 0.11 0.36 0.55 -0.43 0.51 0.33 0.17 0.63 0.60 0.21 0.37 0.14 3/03/2007 0.16 0.24 0.15 0.11 0.41 0.56 -0.43 0.52 0.35 0.16 0.63 0.61 0.22 0.43 0.16 4/03/2007 0.16 0.25 0.15 0.11 0.44 0.56 -0.43 0.54 0.36 0.17 0.64 0.62 0.23 0.35 0.17 5/03/2007 0.16 0.24 0.15 0.11 0.51 0.56 -0.43 0.55 0.36 0.17 0.64 0.63 0.22 0.27 0.27 6/03/2007 0.16 0.24 0.15 0.11 0.49 0.56 -0.43 0.55 0.35 0.19 0.63 0.64 0.22 -0.36 0.35 7/03/2007 0.16 0.24 0.16 0.11 0.48 0.56 -0.43 0.55 0.34 0.21 0.64 0.64 0.22 -0.74 0.35 8/03/2007 0.16 0.24 0.17 0.11 0.50 0.57 -0.43 0.55 0.34 0.21 0.64 0.64 0.23 -0.78 0.35 9/03/2007 0.15 0.25 0.17 0.11 0.52 0.57 -0.43 0.55 0.34 0.21 0.64 0.66 0.26 -0.16 0.34
10/03/2007 0.16 0.25 0.17 0.11 0.51 0.58 -0.43 0.56 0.38 0.20 0.64 0.67 0.30 0.22 0.34 11/03/2007 0.17 0.25 0.16 0.11 0.51 0.59 -0.43 0.56 0.40 0.21 0.64 0.67 0.31 -0.06 0.31 12/03/2007 0.17 0.25 0.16 0.10 0.52 0.59 -0.43 0.56 0.41 0.21 0.66 0.67 0.30 -0.14 0.29 13/03/2007 0.17 0.24 0.16 0.10 0.52 0.60 -0.43 0.56 0.40 0.23 0.65 0.67 0.26 0.11 0.30 14/03/2007 0.17 0.23 0.17 0.11 0.53 0.60 -0.42 0.56 0.38 0.25 0.65 0.70 0.21 0.03 0.30 15/03/2007 0.18 0.24 0.17 0.11 0.54 0.61 -0.42 0.56 0.39 0.24 0.65 0.08 0.70 0.24 -0.03 0.32 16/03/2007 0.18 0.25 0.17 0.12 0.56 0.62 -0.42 0.56 0.40 0.25 0.66 0.09 0.70 0.27 -0.82 0.33 17/03/2007 0.18 0.24 0.17 0.12 0.56 0.62 -0.42 0.56 0.39 0.25 0.67 0.09 0.70 0.26 0.02 0.33 18/03/2007 0.19 0.24 0.17 0.12 0.58 0.63 -0.42 0.57 0.38 0.27 0.67 0.09 0.70 0.26 -0.11 0.34 19/03/2007 0.18 0.24 0.17 0.12 0.57 0.63 -0.42 0.57 0.38 0.27 0.67 0.10 0.70 0.25 -0.51 0.35

ONLINE OBSERVATION WELLS
A
B
C
D
E
F
G
H
I
J
K
L
M
N
Main Lake OBS1
2nd Lake OBS2A
20/03/2007 0.18 0.25 0.17 0.12 0.60 0.64 -0.42 0.57 0.38 0.25 0.67 0.10 0.69 0.27 0.08 0.35 21/03/2007 0.18 0.26 0.16 0.12 0.59 0.64 -0.42 0.57 0.38 0.24 0.66 0.10 0.71 0.30 0.32 0.34

Appendix E - Daily average groundwater depths (m below the surface) for offline wells
OFFLINE OBSERVATION WELLS
A B C D E F G H I Offline Lake OBS
easting 395054.71 395095.72 395024.90 394988.85 394878.34 394888.58 394940.79 394946.40 394992.84 395051.42 northing 6290982.53 6291123.51 6291169.73 6291221.13 6291218.51 6291111.79 6291045.22 6290970.66 6290984.93 6291058.76 surface (AHD) 167.92 167.62 168.26 168.20 167.78 167.94 167.59 168.13 167.98 167.21 date daily average groundwater depth (m) below surface (AHD), negative values are groundwater levels above the surface
31/03/2006 1.40 1.27 0.96 0.82 0.39 0.43 0.36 1.06 0.96 0.15 1/04/2006 0.96 1.20 0.93 0.79 0.21 0.29 0.11 1.05 0.96 0.15 2/04/2006 0.98 1.11 0.91 0.66 0.08 0.18 -0.02 1.04 0.96 0.15 3/04/2006 0.97 1.02 0.71 0.57 0.08 0.15 0.02 1.03 0.95 0.15 4/04/2006 0.96 0.94 0.72 0.56 0.09 0.16 0.10 1.00 0.94 0.15 5/04/2006 0.95 0.87 0.75 0.56 0.10 0.14 0.14 0.99 0.94 0.15 6/04/2006 0.95 0.81 0.75 0.56 0.11 0.17 0.17 0.97 0.94 0.15 7/04/2006 0.95 0.76 0.75 0.56 0.11 0.17 0.20 0.96 0.94 0.15 8/04/2006 0.95 0.72 0.75 0.56 0.13 0.18 0.21 0.95 0.94 0.15 9/04/2006 0.94 0.69 0.75 0.56 0.18 0.20 0.22 0.94 0.93 0.15
10/04/2006 0.93 0.66 0.75 0.56 0.17 0.20 0.21 0.93 0.93 0.15 11/04/2006 0.93 0.63 0.75 0.56 0.17 0.20 0.20 0.93 0.93 0.15 12/04/2006 0.93 0.61 0.76 0.56 0.17 0.21 0.21 0.93 0.93 0.15 13/04/2006 0.93 0.59 0.78 0.56 0.21 0.21 0.23 0.93 0.93 0.15 14/04/2006 0.93 0.58 0.80 0.56 0.23 0.22 0.24 0.93 0.93 0.15 15/04/2006 0.93 0.56 0.80 0.56 0.23 0.22 0.24 0.93 0.93 0.15 16/04/2006 0.93 0.55 0.79 0.56 0.22 0.24 0.23 0.93 0.93 0.15 17/04/2006 0.93 0.55 0.78 0.56 0.21 0.23 0.21 0.93 0.93 0.15 18/04/2006 0.93 0.54 0.83 0.56 0.22 0.21 0.22 0.94 0.93 0.15 19/04/2006 0.93 0.53 0.83 0.57 0.22 0.22 0.22 0.94 0.93 0.15 20/04/2006 0.93 0.53 0.85 0.58 0.26 0.23 0.25 0.94 0.93 0.15
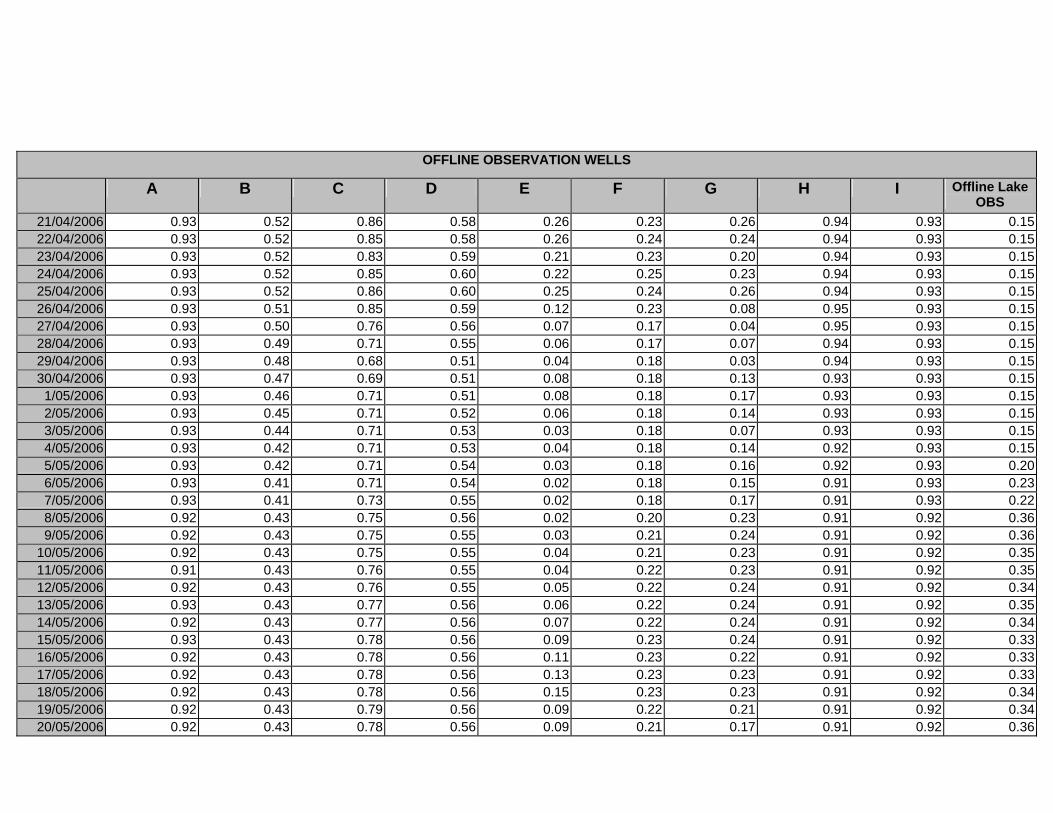
OFFLINE OBSERVATION WELLS
A B C D E F G H I Offline Lake OBS
21/04/2006 0.93 0.52 0.86 0.58 0.26 0.23 0.26 0.94 0.93 0.15 22/04/2006 0.93 0.52 0.85 0.58 0.26 0.24 0.24 0.94 0.93 0.15 23/04/2006 0.93 0.52 0.83 0.59 0.21 0.23 0.20 0.94 0.93 0.15 24/04/2006 0.93 0.52 0.85 0.60 0.22 0.25 0.23 0.94 0.93 0.15 25/04/2006 0.93 0.52 0.86 0.60 0.25 0.24 0.26 0.94 0.93 0.15 26/04/2006 0.93 0.51 0.85 0.59 0.12 0.23 0.08 0.95 0.93 0.15 27/04/2006 0.93 0.50 0.76 0.56 0.07 0.17 0.04 0.95 0.93 0.15 28/04/2006 0.93 0.49 0.71 0.55 0.06 0.17 0.07 0.94 0.93 0.15 29/04/2006 0.93 0.48 0.68 0.51 0.04 0.18 0.03 0.94 0.93 0.15 30/04/2006 0.93 0.47 0.69 0.51 0.08 0.18 0.13 0.93 0.93 0.15
1/05/2006 0.93 0.46 0.71 0.51 0.08 0.18 0.17 0.93 0.93 0.15 2/05/2006 0.93 0.45 0.71 0.52 0.06 0.18 0.14 0.93 0.93 0.15 3/05/2006 0.93 0.44 0.71 0.53 0.03 0.18 0.07 0.93 0.93 0.15 4/05/2006 0.93 0.42 0.71 0.53 0.04 0.18 0.14 0.92 0.93 0.15 5/05/2006 0.93 0.42 0.71 0.54 0.03 0.18 0.16 0.92 0.93 0.20 6/05/2006 0.93 0.41 0.71 0.54 0.02 0.18 0.15 0.91 0.93 0.23 7/05/2006 0.93 0.41 0.73 0.55 0.02 0.18 0.17 0.91 0.93 0.22 8/05/2006 0.92 0.43 0.75 0.56 0.02 0.20 0.23 0.91 0.92 0.36 9/05/2006 0.92 0.43 0.75 0.55 0.03 0.21 0.24 0.91 0.92 0.36
10/05/2006 0.92 0.43 0.75 0.55 0.04 0.21 0.23 0.91 0.92 0.35 11/05/2006 0.91 0.43 0.76 0.55 0.04 0.22 0.23 0.91 0.92 0.35 12/05/2006 0.92 0.43 0.76 0.55 0.05 0.22 0.24 0.91 0.92 0.34 13/05/2006 0.93 0.43 0.77 0.56 0.06 0.22 0.24 0.91 0.92 0.35 14/05/2006 0.92 0.43 0.77 0.56 0.07 0.22 0.24 0.91 0.92 0.34 15/05/2006 0.93 0.43 0.78 0.56 0.09 0.23 0.24 0.91 0.92 0.33 16/05/2006 0.92 0.43 0.78 0.56 0.11 0.23 0.22 0.91 0.92 0.33 17/05/2006 0.92 0.43 0.78 0.56 0.13 0.23 0.23 0.91 0.92 0.33 18/05/2006 0.92 0.43 0.78 0.56 0.15 0.23 0.23 0.91 0.92 0.34 19/05/2006 0.92 0.43 0.79 0.56 0.09 0.22 0.21 0.91 0.92 0.34 20/05/2006 0.92 0.43 0.78 0.56 0.09 0.21 0.17 0.91 0.92 0.36

OFFLINE OBSERVATION WELLS
A B C D E F G H I Offline Lake OBS
21/05/2006 0.92 0.43 0.79 0.56 0.09 0.21 0.21 0.91 0.92 0.39 22/05/2006 0.92 0.43 0.79 0.56 0.11 0.22 0.22 0.91 0.92 0.36 23/05/2006 0.92 0.43 0.80 0.57 0.09 0.24 0.23 0.91 0.92 0.35 24/05/2006 0.91 0.43 0.79 0.57 0.05 0.21 0.12 0.92 0.92 0.34 25/05/2006 0.92 0.43 0.78 0.56 0.05 0.21 0.14 0.92 0.92 0.35 26/05/2006 0.91 0.43 0.78 0.56 0.05 0.20 0.12 0.92 0.92 0.36 27/05/2006 0.92 0.43 0.78 0.56 0.06 0.20 0.16 0.92 0.92 0.35 28/05/2006 0.92 0.43 0.78 0.56 0.07 0.21 0.21 0.92 0.92 0.35 29/05/2006 0.92 0.43 0.78 0.56 0.02 0.21 0.17 0.92 0.92 0.35 30/05/2006 0.92 0.43 0.76 0.55 0.00 0.20 0.07 0.92 0.92 0.36 31/05/2006 0.91 0.43 0.73 0.55 -0.01 0.19 0.02 0.92 0.92 0.36
1/06/2006 0.91 0.43 0.69 0.54 -0.02 0.17 -0.01 0.92 0.92 0.36 2/06/2006 0.91 0.43 0.65 0.49 -0.02 0.18 0.00 0.91 0.92 0.36 3/06/2006 0.91 0.43 0.66 0.48 -0.02 0.19 0.07 0.91 0.92 0.36 4/06/2006 0.92 0.43 0.68 0.49 -0.01 0.20 0.13 0.91 0.92 0.35 5/06/2006 0.91 0.42 0.69 0.50 -0.01 0.20 0.17 0.91 0.92 0.36 6/06/2006 0.90 0.42 0.69 0.50 0.00 0.20 0.19 0.91 0.92 0.36 7/06/2006 0.90 0.42 0.70 0.50 0.00 0.20 0.18 0.91 0.92 0.37 8/06/2006 0.90 0.42 0.70 0.50 0.00 0.20 0.16 0.91 0.92 0.38 9/06/2006 0.90 0.42 0.71 0.50 0.02 0.20 0.17 0.91 0.92 0.38
10/06/2006 0.90 0.42 0.72 0.51 0.03 0.21 0.21 0.91 0.92 0.38 11/06/2006 0.90 0.42 0.73 0.52 0.01 0.21 0.22 0.91 0.92 0.36 12/06/2006 0.90 0.41 0.73 0.53 0.02 0.22 0.20 0.91 0.92 0.37 13/06/2006 0.90 0.42 0.74 0.53 0.03 0.22 0.23 0.91 0.92 0.36 14/06/2006 0.90 0.42 0.75 0.54 0.05 0.22 0.24 0.91 0.92 0.35 15/06/2006 0.88 0.42 0.77 0.57 0.12 0.24 0.26 0.91 0.92 0.34 16/06/2006 0.80 0.40 0.81 0.61 0.08 0.23 0.22 0.91 0.91 0.32 17/06/2006 0.77 0.41 0.81 0.61 0.09 0.25 0.23 0.91 0.91 0.33 18/06/2006 0.80 0.41 0.81 0.61 0.08 0.26 0.24 0.91 0.91 0.33 19/06/2006 0.79 0.41 0.82 0.62 0.07 0.27 0.23 0.91 0.91 0.33

OFFLINE OBSERVATION WELLS
A B C D E F G H I Offline Lake OBS
20/06/2006 0.77 0.41 0.80 0.62 0.07 0.24 0.18 0.91 0.91 0.33 21/06/2006 0.82 0.42 0.79 0.62 0.09 0.23 0.21 0.92 0.91 0.33 22/06/2006 0.83 0.42 0.79 0.62 0.06 0.23 0.22 0.91 0.91 0.33 23/06/2006 0.83 0.42 0.79 0.62 0.07 0.23 0.19 0.92 0.91 0.34 24/06/2006 0.83 0.42 0.80 0.62 0.08 0.24 0.22 0.92 0.91 0.34 25/06/2006 0.82 0.43 0.80 0.62 0.08 0.24 0.26 0.92 0.91 0.34 26/06/2006 0.82 0.43 0.80 0.62 0.04 0.23 0.22 0.92 0.91 0.34 27/06/2006 0.82 0.43 0.80 0.62 0.00 0.21 0.17 0.92 0.91 0.34 28/06/2006 0.80 0.43 0.75 0.47 -0.07 0.14 -0.01 0.83 0.91 0.36 29/06/2006 0.77 0.42 0.62 0.32 -0.09 0.12 -0.03 0.78 0.91 0.37 30/06/2006 0.75 0.41 0.54 0.33 -0.12 0.11 0.01 0.77 0.91 0.38
1/07/2006 0.73 0.39 0.54 0.31 -0.10 0.12 0.00 0.75 0.90 0.37 2/07/2006 0.75 0.38 0.54 0.32 -0.10 0.13 0.08 0.73 0.91 0.37 3/07/2006 0.75 0.36 0.57 0.34 -0.09 0.12 0.10 0.71 0.90 0.37 4/07/2006 0.77 0.33 0.59 0.36 -0.04 0.14 0.10 0.71 0.90 0.35 5/07/2006 0.80 0.31 0.60 0.37 -0.03 0.14 0.10 0.71 0.88 0.36 6/07/2006 0.79 0.30 0.62 0.39 -0.03 0.13 0.11 0.71 0.88 0.37 7/07/2006 0.79 0.29 0.63 0.39 -0.03 0.14 0.12 0.70 0.88 0.37 8/07/2006 0.78 0.28 0.64 0.41 -0.07 0.15 0.12 0.69 0.88 0.38 9/07/2006 0.78 0.27 0.65 0.42 -0.05 0.16 0.12 0.69 0.88 0.38
10/07/2006 0.78 0.27 0.65 0.44 -0.06 0.18 0.12 0.69 0.88 0.38 11/07/2006 0.78 0.27 0.64 0.42 -0.10 0.16 0.04 0.70 0.88 0.37 12/07/2006 0.77 0.26 0.59 0.36 -0.11 0.14 0.00 0.70 0.87 0.38 13/07/2006 0.78 0.26 0.58 0.36 -0.11 0.15 0.03 0.70 0.87 0.37 14/07/2006 0.78 0.24 0.61 0.36 -0.13 0.15 0.03 0.69 0.87 0.37 15/07/2006 0.79 0.20 0.58 0.34 -0.12 0.14 0.00 0.69 0.87 0.37 16/07/2006 0.77 0.21 0.58 0.34 -0.07 0.15 0.04 0.69 0.87 0.37 17/07/2006 0.77 0.21 0.58 0.34 -0.06 0.16 0.07 0.69 0.86 0.36 18/07/2006 0.78 0.22 0.62 0.38 -0.06 0.16 0.11 0.69 0.86 0.36 19/07/2006 0.80 0.22 0.63 0.41 -0.05 0.16 0.12 0.69 0.86 0.36

OFFLINE OBSERVATION WELLS
A B C D E F G H I Offline Lake OBS
20/07/2006 0.79 0.23 0.63 0.43 -0.05 0.16 0.12 0.69 0.85 0.36 21/07/2006 0.79 0.23 0.63 0.43 -0.10 0.16 0.06 0.69 0.85 0.36 22/07/2006 0.79 0.22 0.57 0.29 -0.13 0.13 -0.03 0.69 0.84 0.37 23/07/2006 0.79 0.21 0.54 0.29 -0.13 0.14 0.00 0.67 0.83 0.37 24/07/2006 0.79 0.20 0.54 0.31 -0.13 0.13 0.04 0.64 0.83 0.37 25/07/2006 0.77 0.19 0.55 0.32 0.02 0.15 0.05 0.64 0.83 0.36 26/07/2006 0.77 0.19 0.56 0.32 -0.08 0.15 0.10 0.65 0.82 0.37 27/07/2006 0.77 0.20 0.57 0.32 -0.09 0.16 0.08 0.64 0.82 0.38 28/07/2006 0.77 0.19 0.52 0.26 -0.14 0.15 0.00 0.62 0.82 0.40 29/07/2006 0.77 0.18 0.51 0.28 -0.12 0.15 0.05 0.62 0.82 0.40 30/07/2006 0.75 0.18 0.52 0.30 -0.11 0.15 0.09 0.62 0.81 0.40 31/07/2006 0.76 0.18 0.53 0.30 -0.10 0.16 0.09 0.61 0.81 0.41
1/08/2006 0.76 0.18 0.54 0.31 -0.13 0.16 0.06 0.61 0.81 0.41 2/08/2006 0.76 0.18 0.56 0.31 -0.08 0.17 0.10 0.61 0.81 0.41 3/08/2006 0.77 0.19 0.58 0.35 -0.03 0.18 0.10 0.62 0.81 0.41 4/08/2006 0.77 0.20 0.59 0.39 -0.01 0.19 0.10 0.63 0.81 0.41 5/08/2006 0.75 0.20 0.60 0.42 0.01 0.19 0.11 0.63 0.81 0.40 6/08/2006 0.76 0.21 0.60 0.44 0.00 0.19 0.10 0.63 0.81 0.40 7/08/2006 0.75 0.20 0.60 0.45 0.01 0.21 0.09 0.63 0.81 0.40 8/08/2006 0.75 0.21 0.62 0.47 0.06 0.23 0.11 0.67 0.81 0.40 9/08/2006 0.76 0.22 0.64 0.48 0.07 0.22 0.12 0.70 0.80 0.40
10/08/2006 0.77 0.22 0.64 0.48 0.06 0.23 0.11 0.70 0.80 0.40 11/08/2006 0.77 0.22 0.64 0.49 0.07 0.24 0.10 0.70 0.80 0.40 12/08/2006 0.77 0.23 0.64 0.49 0.07 0.24 0.09 0.70 0.80 0.40 13/08/2006 0.76 0.23 0.64 0.50 0.04 0.23 0.09 0.70 0.80 0.40 14/08/2006 0.76 0.23 0.64 0.50 0.07 0.23 0.12 0.70 0.80 0.40 15/08/2006 0.76 0.23 0.64 0.48 0.04 0.22 0.08 0.70 0.80 0.41 16/08/2006 0.74 0.22 0.60 0.35 -0.04 0.18 -0.02 0.71 0.79 0.41 17/08/2006 0.74 0.21 0.56 0.32 -0.04 0.17 0.03 0.68 0.79 0.41 18/08/2006 0.69 0.17 0.55 0.31 -0.03 0.17 0.10 0.63 0.78 0.39
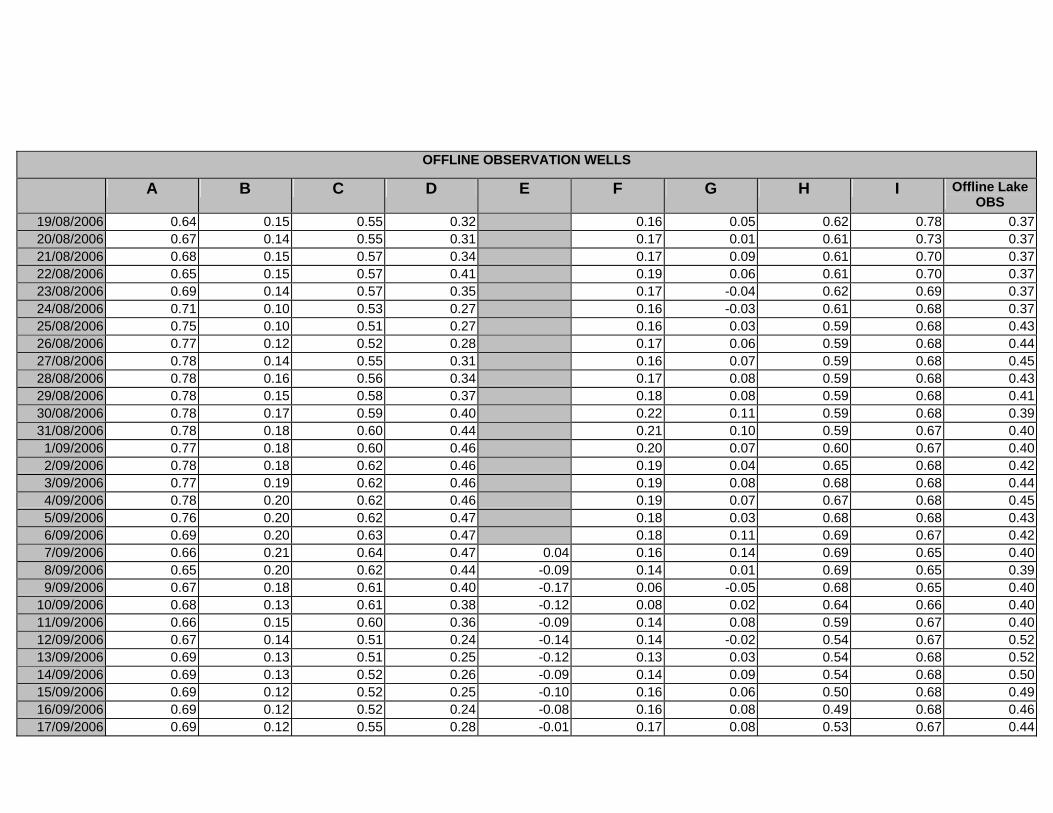
OFFLINE OBSERVATION WELLS
A B C D E F G H I Offline Lake OBS
19/08/2006 0.64 0.15 0.55 0.32 0.16 0.05 0.62 0.78 0.37 20/08/2006 0.67 0.14 0.55 0.31 0.17 0.01 0.61 0.73 0.37 21/08/2006 0.68 0.15 0.57 0.34 0.17 0.09 0.61 0.70 0.37 22/08/2006 0.65 0.15 0.57 0.41 0.19 0.06 0.61 0.70 0.37 23/08/2006 0.69 0.14 0.57 0.35 0.17 -0.04 0.62 0.69 0.37 24/08/2006 0.71 0.10 0.53 0.27 0.16 -0.03 0.61 0.68 0.37 25/08/2006 0.75 0.10 0.51 0.27 0.16 0.03 0.59 0.68 0.43 26/08/2006 0.77 0.12 0.52 0.28 0.17 0.06 0.59 0.68 0.44 27/08/2006 0.78 0.14 0.55 0.31 0.16 0.07 0.59 0.68 0.45 28/08/2006 0.78 0.16 0.56 0.34 0.17 0.08 0.59 0.68 0.43 29/08/2006 0.78 0.15 0.58 0.37 0.18 0.08 0.59 0.68 0.41 30/08/2006 0.78 0.17 0.59 0.40 0.22 0.11 0.59 0.68 0.39 31/08/2006 0.78 0.18 0.60 0.44 0.21 0.10 0.59 0.67 0.40
1/09/2006 0.77 0.18 0.60 0.46 0.20 0.07 0.60 0.67 0.40 2/09/2006 0.78 0.18 0.62 0.46 0.19 0.04 0.65 0.68 0.42 3/09/2006 0.77 0.19 0.62 0.46 0.19 0.08 0.68 0.68 0.44 4/09/2006 0.78 0.20 0.62 0.46 0.19 0.07 0.67 0.68 0.45 5/09/2006 0.76 0.20 0.62 0.47 0.18 0.03 0.68 0.68 0.43 6/09/2006 0.69 0.20 0.63 0.47 0.18 0.11 0.69 0.67 0.42 7/09/2006 0.66 0.21 0.64 0.47 0.04 0.16 0.14 0.69 0.65 0.40 8/09/2006 0.65 0.20 0.62 0.44 -0.09 0.14 0.01 0.69 0.65 0.39 9/09/2006 0.67 0.18 0.61 0.40 -0.17 0.06 -0.05 0.68 0.65 0.40
10/09/2006 0.68 0.13 0.61 0.38 -0.12 0.08 0.02 0.64 0.66 0.40 11/09/2006 0.66 0.15 0.60 0.36 -0.09 0.14 0.08 0.59 0.67 0.40 12/09/2006 0.67 0.14 0.51 0.24 -0.14 0.14 -0.02 0.54 0.67 0.52 13/09/2006 0.69 0.13 0.51 0.25 -0.12 0.13 0.03 0.54 0.68 0.52 14/09/2006 0.69 0.13 0.52 0.26 -0.09 0.14 0.09 0.54 0.68 0.50 15/09/2006 0.69 0.12 0.52 0.25 -0.10 0.16 0.06 0.50 0.68 0.49 16/09/2006 0.69 0.12 0.52 0.24 -0.08 0.16 0.08 0.49 0.68 0.46 17/09/2006 0.69 0.12 0.55 0.28 -0.01 0.17 0.08 0.53 0.67 0.44
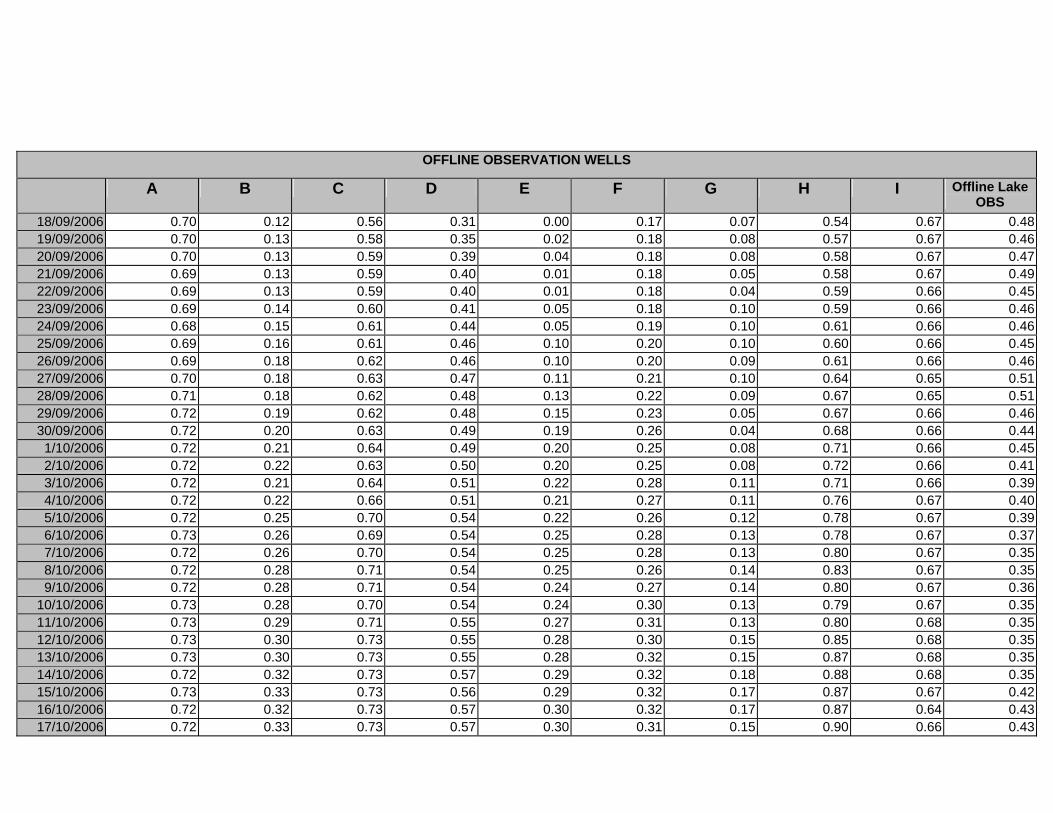
OFFLINE OBSERVATION WELLS
A B C D E F G H I Offline Lake OBS
18/09/2006 0.70 0.12 0.56 0.31 0.00 0.17 0.07 0.54 0.67 0.48 19/09/2006 0.70 0.13 0.58 0.35 0.02 0.18 0.08 0.57 0.67 0.46 20/09/2006 0.70 0.13 0.59 0.39 0.04 0.18 0.08 0.58 0.67 0.47 21/09/2006 0.69 0.13 0.59 0.40 0.01 0.18 0.05 0.58 0.67 0.49 22/09/2006 0.69 0.13 0.59 0.40 0.01 0.18 0.04 0.59 0.66 0.45 23/09/2006 0.69 0.14 0.60 0.41 0.05 0.18 0.10 0.59 0.66 0.46 24/09/2006 0.68 0.15 0.61 0.44 0.05 0.19 0.10 0.61 0.66 0.46 25/09/2006 0.69 0.16 0.61 0.46 0.10 0.20 0.10 0.60 0.66 0.45 26/09/2006 0.69 0.18 0.62 0.46 0.10 0.20 0.09 0.61 0.66 0.46 27/09/2006 0.70 0.18 0.63 0.47 0.11 0.21 0.10 0.64 0.65 0.51 28/09/2006 0.71 0.18 0.62 0.48 0.13 0.22 0.09 0.67 0.65 0.51 29/09/2006 0.72 0.19 0.62 0.48 0.15 0.23 0.05 0.67 0.66 0.46 30/09/2006 0.72 0.20 0.63 0.49 0.19 0.26 0.04 0.68 0.66 0.44
1/10/2006 0.72 0.21 0.64 0.49 0.20 0.25 0.08 0.71 0.66 0.45 2/10/2006 0.72 0.22 0.63 0.50 0.20 0.25 0.08 0.72 0.66 0.41 3/10/2006 0.72 0.21 0.64 0.51 0.22 0.28 0.11 0.71 0.66 0.39 4/10/2006 0.72 0.22 0.66 0.51 0.21 0.27 0.11 0.76 0.67 0.40 5/10/2006 0.72 0.25 0.70 0.54 0.22 0.26 0.12 0.78 0.67 0.39 6/10/2006 0.73 0.26 0.69 0.54 0.25 0.28 0.13 0.78 0.67 0.37 7/10/2006 0.72 0.26 0.70 0.54 0.25 0.28 0.13 0.80 0.67 0.35 8/10/2006 0.72 0.28 0.71 0.54 0.25 0.26 0.14 0.83 0.67 0.35 9/10/2006 0.72 0.28 0.71 0.54 0.24 0.27 0.14 0.80 0.67 0.36
10/10/2006 0.73 0.28 0.70 0.54 0.24 0.30 0.13 0.79 0.67 0.35 11/10/2006 0.73 0.29 0.71 0.55 0.27 0.31 0.13 0.80 0.68 0.35 12/10/2006 0.73 0.30 0.73 0.55 0.28 0.30 0.15 0.85 0.68 0.35 13/10/2006 0.73 0.30 0.73 0.55 0.28 0.32 0.15 0.87 0.68 0.35 14/10/2006 0.72 0.32 0.73 0.57 0.29 0.32 0.18 0.88 0.68 0.35 15/10/2006 0.73 0.33 0.73 0.56 0.29 0.32 0.17 0.87 0.67 0.42 16/10/2006 0.72 0.32 0.73 0.57 0.30 0.32 0.17 0.87 0.64 0.43 17/10/2006 0.72 0.33 0.73 0.57 0.30 0.31 0.15 0.90 0.66 0.43
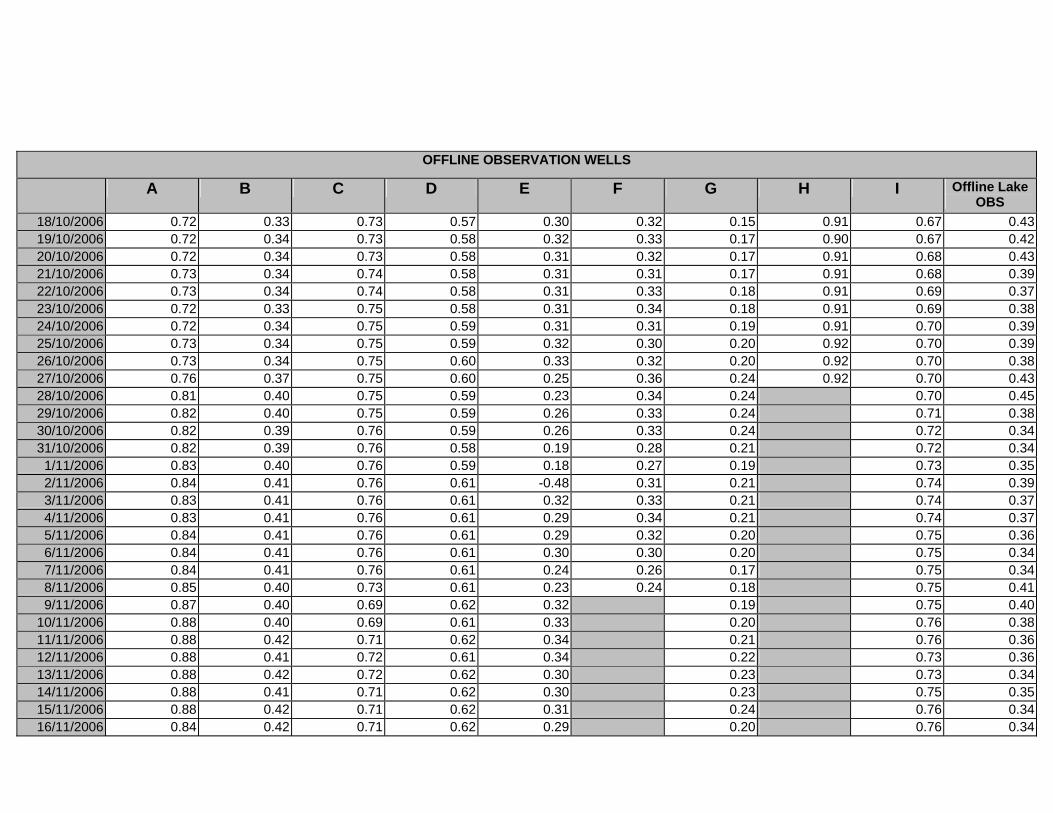
OFFLINE OBSERVATION WELLS
A B C D E F G H I Offline Lake OBS
18/10/2006 0.72 0.33 0.73 0.57 0.30 0.32 0.15 0.91 0.67 0.43 19/10/2006 0.72 0.34 0.73 0.58 0.32 0.33 0.17 0.90 0.67 0.42 20/10/2006 0.72 0.34 0.73 0.58 0.31 0.32 0.17 0.91 0.68 0.43 21/10/2006 0.73 0.34 0.74 0.58 0.31 0.31 0.17 0.91 0.68 0.39 22/10/2006 0.73 0.34 0.74 0.58 0.31 0.33 0.18 0.91 0.69 0.37 23/10/2006 0.72 0.33 0.75 0.58 0.31 0.34 0.18 0.91 0.69 0.38 24/10/2006 0.72 0.34 0.75 0.59 0.31 0.31 0.19 0.91 0.70 0.39 25/10/2006 0.73 0.34 0.75 0.59 0.32 0.30 0.20 0.92 0.70 0.39 26/10/2006 0.73 0.34 0.75 0.60 0.33 0.32 0.20 0.92 0.70 0.38 27/10/2006 0.76 0.37 0.75 0.60 0.25 0.36 0.24 0.92 0.70 0.43 28/10/2006 0.81 0.40 0.75 0.59 0.23 0.34 0.24 0.70 0.45 29/10/2006 0.82 0.40 0.75 0.59 0.26 0.33 0.24 0.71 0.38 30/10/2006 0.82 0.39 0.76 0.59 0.26 0.33 0.24 0.72 0.34 31/10/2006 0.82 0.39 0.76 0.58 0.19 0.28 0.21 0.72 0.34
1/11/2006 0.83 0.40 0.76 0.59 0.18 0.27 0.19 0.73 0.35 2/11/2006 0.84 0.41 0.76 0.61 -0.48 0.31 0.21 0.74 0.39 3/11/2006 0.83 0.41 0.76 0.61 0.32 0.33 0.21 0.74 0.37 4/11/2006 0.83 0.41 0.76 0.61 0.29 0.34 0.21 0.74 0.37 5/11/2006 0.84 0.41 0.76 0.61 0.29 0.32 0.20 0.75 0.36 6/11/2006 0.84 0.41 0.76 0.61 0.30 0.30 0.20 0.75 0.34 7/11/2006 0.84 0.41 0.76 0.61 0.24 0.26 0.17 0.75 0.34 8/11/2006 0.85 0.40 0.73 0.61 0.23 0.24 0.18 0.75 0.41 9/11/2006 0.87 0.40 0.69 0.62 0.32 0.19 0.75 0.40
10/11/2006 0.88 0.40 0.69 0.61 0.33 0.20 0.76 0.38 11/11/2006 0.88 0.42 0.71 0.62 0.34 0.21 0.76 0.36 12/11/2006 0.88 0.41 0.72 0.61 0.34 0.22 0.73 0.36 13/11/2006 0.88 0.42 0.72 0.62 0.30 0.23 0.73 0.34 14/11/2006 0.88 0.41 0.71 0.62 0.30 0.23 0.75 0.35 15/11/2006 0.88 0.42 0.71 0.62 0.31 0.24 0.76 0.34 16/11/2006 0.84 0.42 0.71 0.62 0.29 0.20 0.76 0.34
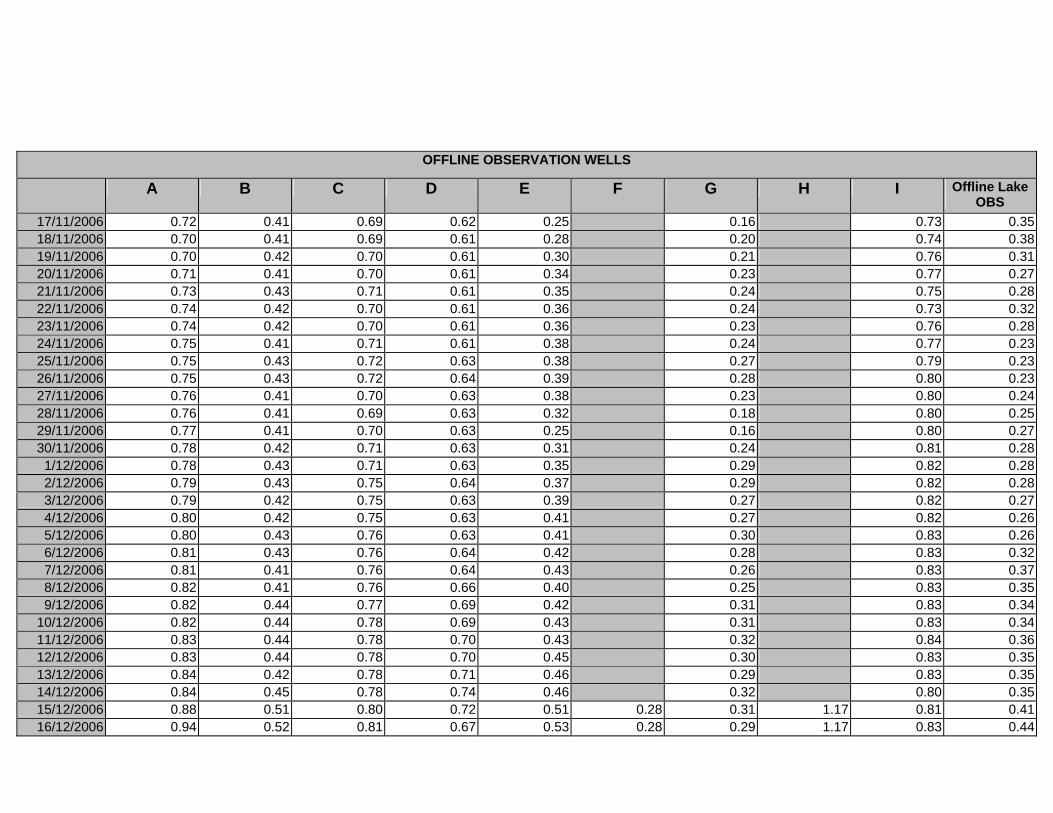
OFFLINE OBSERVATION WELLS
A B C D E F G H I Offline Lake OBS
17/11/2006 0.72 0.41 0.69 0.62 0.25 0.16 0.73 0.35 18/11/2006 0.70 0.41 0.69 0.61 0.28 0.20 0.74 0.38 19/11/2006 0.70 0.42 0.70 0.61 0.30 0.21 0.76 0.31 20/11/2006 0.71 0.41 0.70 0.61 0.34 0.23 0.77 0.27 21/11/2006 0.73 0.43 0.71 0.61 0.35 0.24 0.75 0.28 22/11/2006 0.74 0.42 0.70 0.61 0.36 0.24 0.73 0.32 23/11/2006 0.74 0.42 0.70 0.61 0.36 0.23 0.76 0.28 24/11/2006 0.75 0.41 0.71 0.61 0.38 0.24 0.77 0.23 25/11/2006 0.75 0.43 0.72 0.63 0.38 0.27 0.79 0.23 26/11/2006 0.75 0.43 0.72 0.64 0.39 0.28 0.80 0.23 27/11/2006 0.76 0.41 0.70 0.63 0.38 0.23 0.80 0.24 28/11/2006 0.76 0.41 0.69 0.63 0.32 0.18 0.80 0.25 29/11/2006 0.77 0.41 0.70 0.63 0.25 0.16 0.80 0.27 30/11/2006 0.78 0.42 0.71 0.63 0.31 0.24 0.81 0.28
1/12/2006 0.78 0.43 0.71 0.63 0.35 0.29 0.82 0.28 2/12/2006 0.79 0.43 0.75 0.64 0.37 0.29 0.82 0.28 3/12/2006 0.79 0.42 0.75 0.63 0.39 0.27 0.82 0.27 4/12/2006 0.80 0.42 0.75 0.63 0.41 0.27 0.82 0.26 5/12/2006 0.80 0.43 0.76 0.63 0.41 0.30 0.83 0.26 6/12/2006 0.81 0.43 0.76 0.64 0.42 0.28 0.83 0.32 7/12/2006 0.81 0.41 0.76 0.64 0.43 0.26 0.83 0.37 8/12/2006 0.82 0.41 0.76 0.66 0.40 0.25 0.83 0.35 9/12/2006 0.82 0.44 0.77 0.69 0.42 0.31 0.83 0.34
10/12/2006 0.82 0.44 0.78 0.69 0.43 0.31 0.83 0.34 11/12/2006 0.83 0.44 0.78 0.70 0.43 0.32 0.84 0.36 12/12/2006 0.83 0.44 0.78 0.70 0.45 0.30 0.83 0.35 13/12/2006 0.84 0.42 0.78 0.71 0.46 0.29 0.83 0.35 14/12/2006 0.84 0.45 0.78 0.74 0.46 0.32 0.80 0.35 15/12/2006 0.88 0.51 0.80 0.72 0.51 0.28 0.31 1.17 0.81 0.41 16/12/2006 0.94 0.52 0.81 0.67 0.53 0.28 0.29 1.17 0.83 0.44
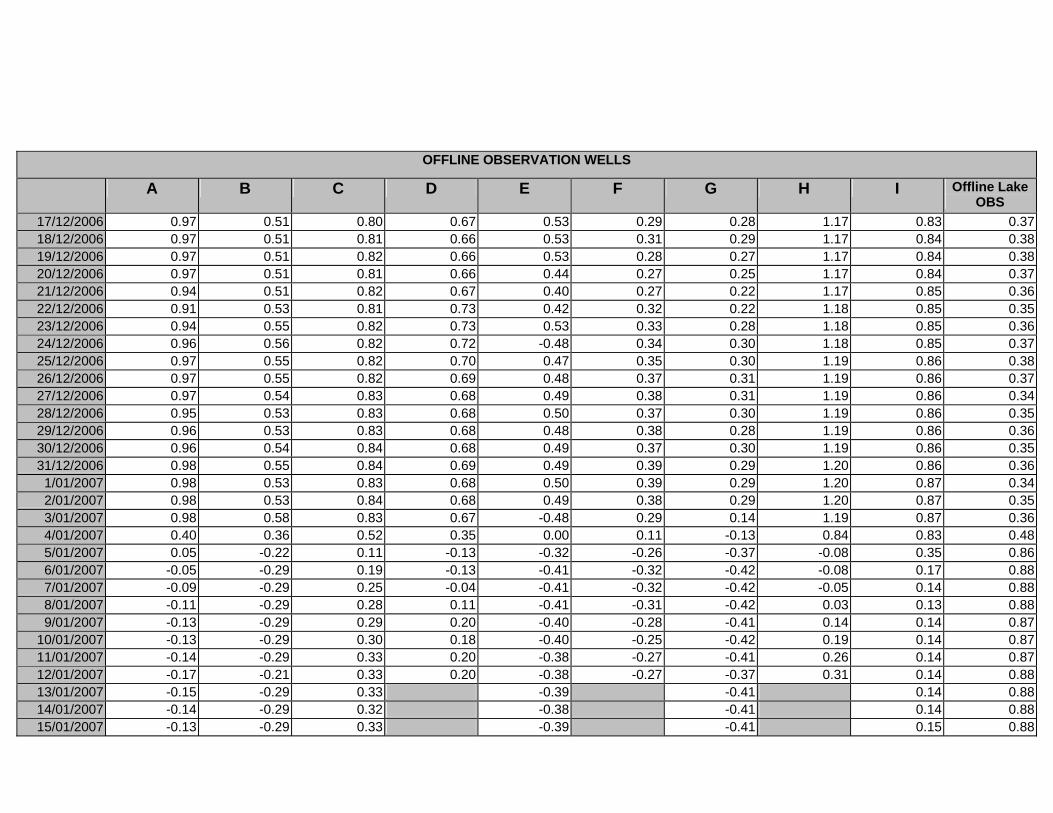
OFFLINE OBSERVATION WELLS
A B C D E F G H I Offline Lake OBS
17/12/2006 0.97 0.51 0.80 0.67 0.53 0.29 0.28 1.17 0.83 0.37 18/12/2006 0.97 0.51 0.81 0.66 0.53 0.31 0.29 1.17 0.84 0.38 19/12/2006 0.97 0.51 0.82 0.66 0.53 0.28 0.27 1.17 0.84 0.38 20/12/2006 0.97 0.51 0.81 0.66 0.44 0.27 0.25 1.17 0.84 0.37 21/12/2006 0.94 0.51 0.82 0.67 0.40 0.27 0.22 1.17 0.85 0.36 22/12/2006 0.91 0.53 0.81 0.73 0.42 0.32 0.22 1.18 0.85 0.35 23/12/2006 0.94 0.55 0.82 0.73 0.53 0.33 0.28 1.18 0.85 0.36 24/12/2006 0.96 0.56 0.82 0.72 -0.48 0.34 0.30 1.18 0.85 0.37 25/12/2006 0.97 0.55 0.82 0.70 0.47 0.35 0.30 1.19 0.86 0.38 26/12/2006 0.97 0.55 0.82 0.69 0.48 0.37 0.31 1.19 0.86 0.37 27/12/2006 0.97 0.54 0.83 0.68 0.49 0.38 0.31 1.19 0.86 0.34 28/12/2006 0.95 0.53 0.83 0.68 0.50 0.37 0.30 1.19 0.86 0.35 29/12/2006 0.96 0.53 0.83 0.68 0.48 0.38 0.28 1.19 0.86 0.36 30/12/2006 0.96 0.54 0.84 0.68 0.49 0.37 0.30 1.19 0.86 0.35 31/12/2006 0.98 0.55 0.84 0.69 0.49 0.39 0.29 1.20 0.86 0.36
1/01/2007 0.98 0.53 0.83 0.68 0.50 0.39 0.29 1.20 0.87 0.34 2/01/2007 0.98 0.53 0.84 0.68 0.49 0.38 0.29 1.20 0.87 0.35 3/01/2007 0.98 0.58 0.83 0.67 -0.48 0.29 0.14 1.19 0.87 0.36 4/01/2007 0.40 0.36 0.52 0.35 0.00 0.11 -0.13 0.84 0.83 0.48 5/01/2007 0.05 -0.22 0.11 -0.13 -0.32 -0.26 -0.37 -0.08 0.35 0.86 6/01/2007 -0.05 -0.29 0.19 -0.13 -0.41 -0.32 -0.42 -0.08 0.17 0.88 7/01/2007 -0.09 -0.29 0.25 -0.04 -0.41 -0.32 -0.42 -0.05 0.14 0.88 8/01/2007 -0.11 -0.29 0.28 0.11 -0.41 -0.31 -0.42 0.03 0.13 0.88 9/01/2007 -0.13 -0.29 0.29 0.20 -0.40 -0.28 -0.41 0.14 0.14 0.87
10/01/2007 -0.13 -0.29 0.30 0.18 -0.40 -0.25 -0.42 0.19 0.14 0.87 11/01/2007 -0.14 -0.29 0.33 0.20 -0.38 -0.27 -0.41 0.26 0.14 0.87 12/01/2007 -0.17 -0.21 0.33 0.20 -0.38 -0.27 -0.37 0.31 0.14 0.88 13/01/2007 -0.15 -0.29 0.33 -0.39 -0.41 0.14 0.88 14/01/2007 -0.14 -0.29 0.32 -0.38 -0.41 0.14 0.88 15/01/2007 -0.13 -0.29 0.33 -0.39 -0.41 0.15 0.88
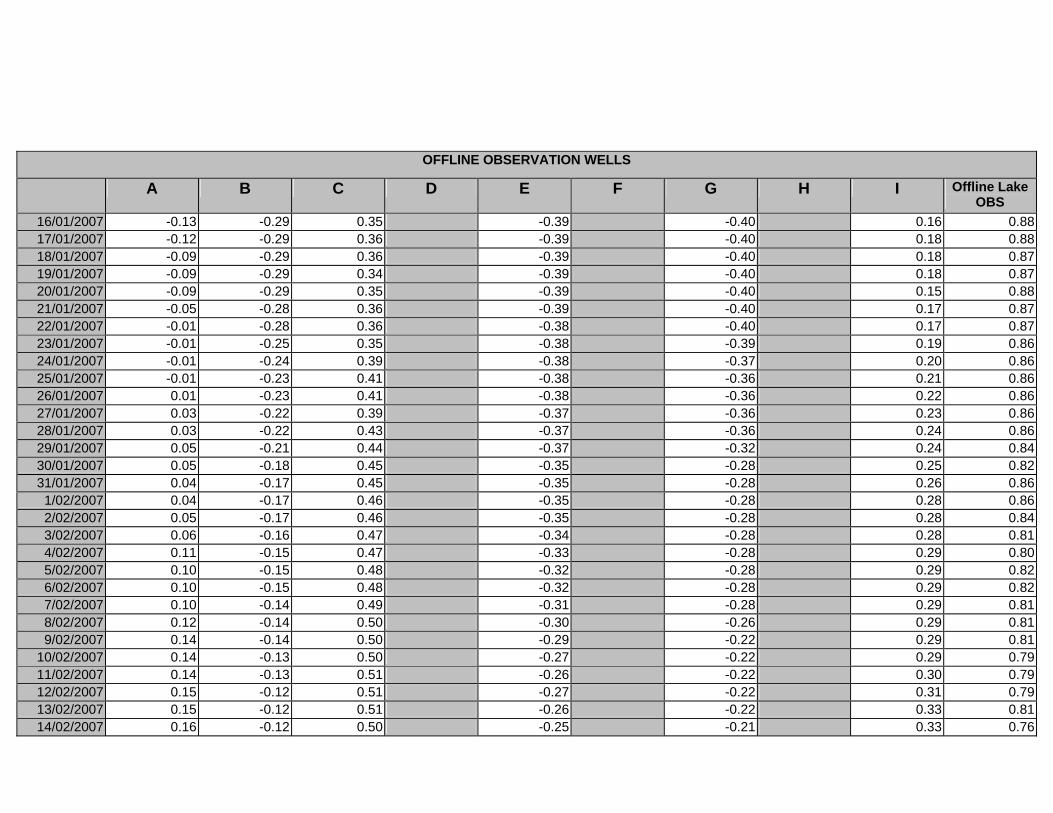
OFFLINE OBSERVATION WELLS
A B C D E F G H I Offline Lake OBS
16/01/2007 -0.13 -0.29 0.35 -0.39 -0.40 0.16 0.88 17/01/2007 -0.12 -0.29 0.36 -0.39 -0.40 0.18 0.88 18/01/2007 -0.09 -0.29 0.36 -0.39 -0.40 0.18 0.87 19/01/2007 -0.09 -0.29 0.34 -0.39 -0.40 0.18 0.87 20/01/2007 -0.09 -0.29 0.35 -0.39 -0.40 0.15 0.88 21/01/2007 -0.05 -0.28 0.36 -0.39 -0.40 0.17 0.87 22/01/2007 -0.01 -0.28 0.36 -0.38 -0.40 0.17 0.87 23/01/2007 -0.01 -0.25 0.35 -0.38 -0.39 0.19 0.86 24/01/2007 -0.01 -0.24 0.39 -0.38 -0.37 0.20 0.86 25/01/2007 -0.01 -0.23 0.41 -0.38 -0.36 0.21 0.86 26/01/2007 0.01 -0.23 0.41 -0.38 -0.36 0.22 0.86 27/01/2007 0.03 -0.22 0.39 -0.37 -0.36 0.23 0.86 28/01/2007 0.03 -0.22 0.43 -0.37 -0.36 0.24 0.86 29/01/2007 0.05 -0.21 0.44 -0.37 -0.32 0.24 0.84 30/01/2007 0.05 -0.18 0.45 -0.35 -0.28 0.25 0.82 31/01/2007 0.04 -0.17 0.45 -0.35 -0.28 0.26 0.86
1/02/2007 0.04 -0.17 0.46 -0.35 -0.28 0.28 0.86 2/02/2007 0.05 -0.17 0.46 -0.35 -0.28 0.28 0.84 3/02/2007 0.06 -0.16 0.47 -0.34 -0.28 0.28 0.81 4/02/2007 0.11 -0.15 0.47 -0.33 -0.28 0.29 0.80 5/02/2007 0.10 -0.15 0.48 -0.32 -0.28 0.29 0.82 6/02/2007 0.10 -0.15 0.48 -0.32 -0.28 0.29 0.82 7/02/2007 0.10 -0.14 0.49 -0.31 -0.28 0.29 0.81 8/02/2007 0.12 -0.14 0.50 -0.30 -0.26 0.29 0.81 9/02/2007 0.14 -0.14 0.50 -0.29 -0.22 0.29 0.81
10/02/2007 0.14 -0.13 0.50 -0.27 -0.22 0.29 0.79 11/02/2007 0.14 -0.13 0.51 -0.26 -0.22 0.30 0.79 12/02/2007 0.15 -0.12 0.51 -0.27 -0.22 0.31 0.79 13/02/2007 0.15 -0.12 0.51 -0.26 -0.22 0.33 0.81 14/02/2007 0.16 -0.12 0.50 -0.25 -0.21 0.33 0.76
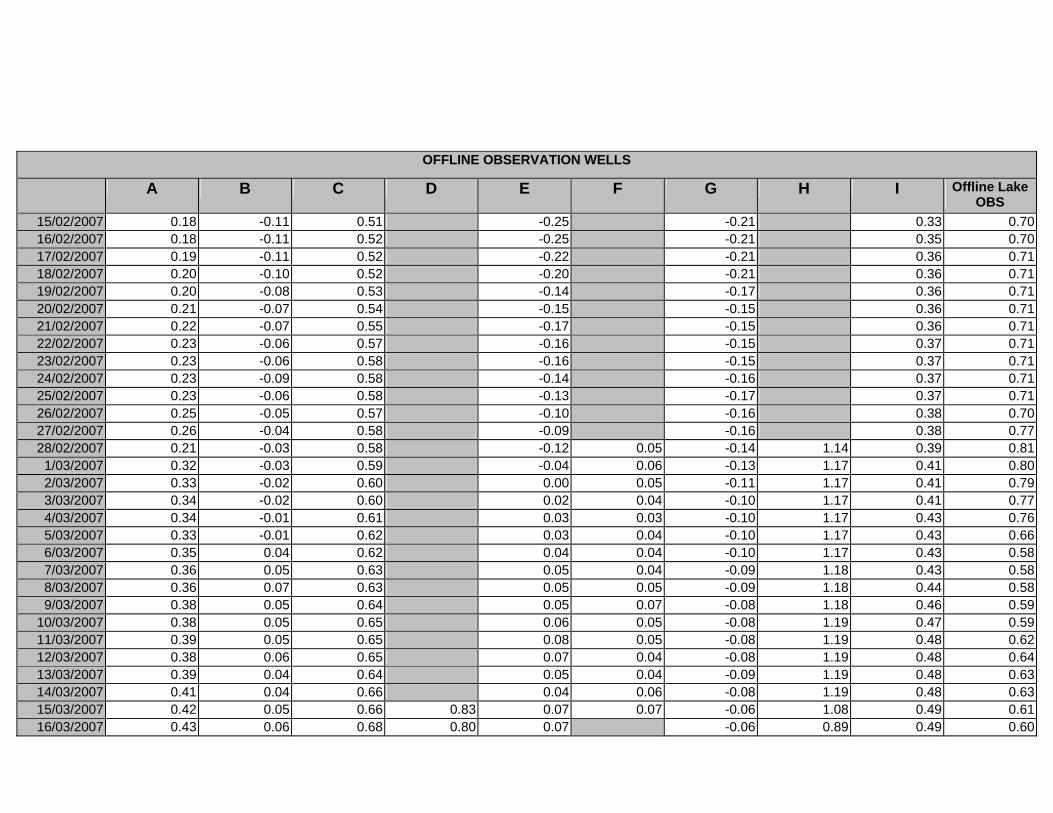
OFFLINE OBSERVATION WELLS
A B C D E F G H I Offline Lake OBS
15/02/2007 0.18 -0.11 0.51 -0.25 -0.21 0.33 0.70 16/02/2007 0.18 -0.11 0.52 -0.25 -0.21 0.35 0.70 17/02/2007 0.19 -0.11 0.52 -0.22 -0.21 0.36 0.71 18/02/2007 0.20 -0.10 0.52 -0.20 -0.21 0.36 0.71 19/02/2007 0.20 -0.08 0.53 -0.14 -0.17 0.36 0.71 20/02/2007 0.21 -0.07 0.54 -0.15 -0.15 0.36 0.71 21/02/2007 0.22 -0.07 0.55 -0.17 -0.15 0.36 0.71 22/02/2007 0.23 -0.06 0.57 -0.16 -0.15 0.37 0.71 23/02/2007 0.23 -0.06 0.58 -0.16 -0.15 0.37 0.71 24/02/2007 0.23 -0.09 0.58 -0.14 -0.16 0.37 0.71 25/02/2007 0.23 -0.06 0.58 -0.13 -0.17 0.37 0.71 26/02/2007 0.25 -0.05 0.57 -0.10 -0.16 0.38 0.70 27/02/2007 0.26 -0.04 0.58 -0.09 -0.16 0.38 0.77 28/02/2007 0.21 -0.03 0.58 -0.12 0.05 -0.14 1.14 0.39 0.81
1/03/2007 0.32 -0.03 0.59 -0.04 0.06 -0.13 1.17 0.41 0.80 2/03/2007 0.33 -0.02 0.60 0.00 0.05 -0.11 1.17 0.41 0.79 3/03/2007 0.34 -0.02 0.60 0.02 0.04 -0.10 1.17 0.41 0.77 4/03/2007 0.34 -0.01 0.61 0.03 0.03 -0.10 1.17 0.43 0.76 5/03/2007 0.33 -0.01 0.62 0.03 0.04 -0.10 1.17 0.43 0.66 6/03/2007 0.35 0.04 0.62 0.04 0.04 -0.10 1.17 0.43 0.58 7/03/2007 0.36 0.05 0.63 0.05 0.04 -0.09 1.18 0.43 0.58 8/03/2007 0.36 0.07 0.63 0.05 0.05 -0.09 1.18 0.44 0.58 9/03/2007 0.38 0.05 0.64 0.05 0.07 -0.08 1.18 0.46 0.59
10/03/2007 0.38 0.05 0.65 0.06 0.05 -0.08 1.19 0.47 0.59 11/03/2007 0.39 0.05 0.65 0.08 0.05 -0.08 1.19 0.48 0.62 12/03/2007 0.38 0.06 0.65 0.07 0.04 -0.08 1.19 0.48 0.64 13/03/2007 0.39 0.04 0.64 0.05 0.04 -0.09 1.19 0.48 0.63 14/03/2007 0.41 0.04 0.66 0.04 0.06 -0.08 1.19 0.48 0.63 15/03/2007 0.42 0.05 0.66 0.83 0.07 0.07 -0.06 1.08 0.49 0.61 16/03/2007 0.43 0.06 0.68 0.80 0.07 -0.06 0.89 0.49 0.60

OFFLINE OBSERVATION WELLS
A B C D E F G H I Offline Lake OBS
17/03/2007 0.43 0.05 0.69 0.80 0.07 -0.06 0.88 0.49 0.60 18/03/2007 0.44 0.04 0.68 0.80 0.08 -0.06 0.88 0.50 0.59 19/03/2007 0.45 0.05 0.68 0.80 0.10 -0.06 0.88 0.50 0.58 20/03/2007 0.45 0.05 0.68 0.80 0.12 -0.05 0.88 0.50 0.58 21/03/2007 0.45 0.06 0.68 0.80 0.12 -0.04 0.88 0.51 0.59

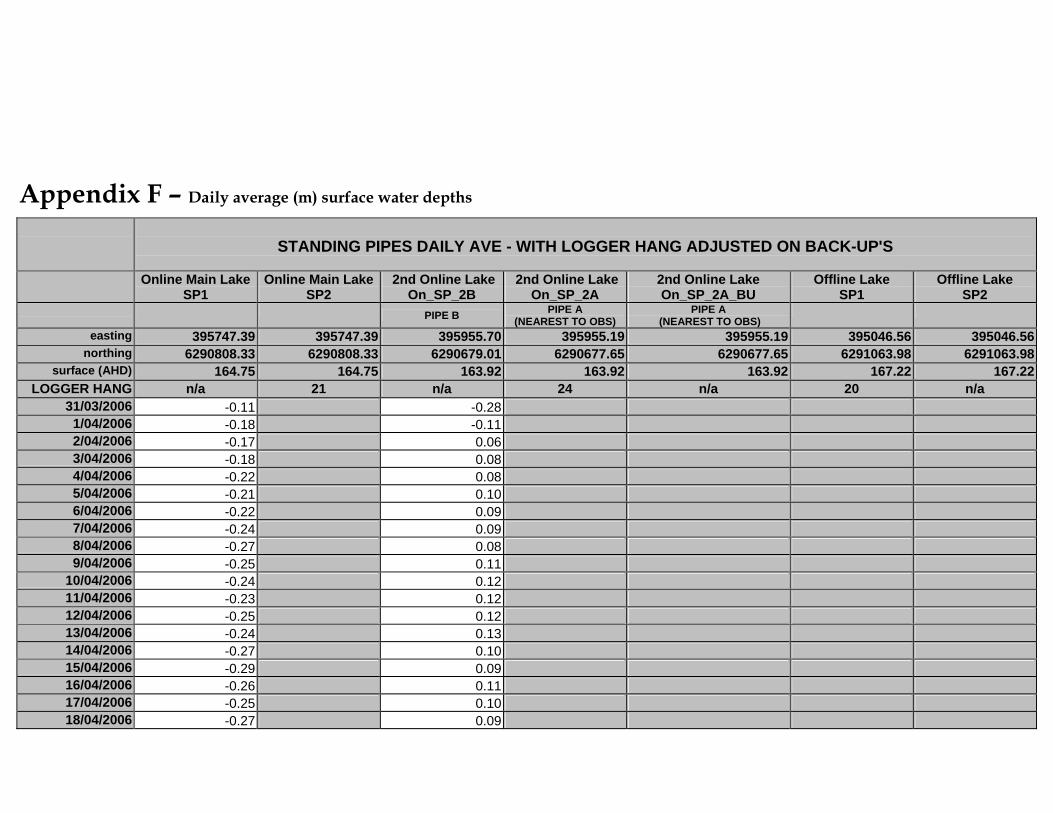
Appendix F – Daily average (m) surface water depths
STANDING PIPES DAILY AVE - WITH LOGGER HANG ADJUSTED ON BACK-UP'S
Online Main Lake SP1
Online Main Lake SP2
2nd Online Lake On_SP_2B
2nd Online Lake On_SP_2A
2nd Online Lake On_SP_2A_BU
Offline Lake SP1
Offline Lake SP2
PIPE B PIPE A (NEAREST TO OBS)
PIPE A (NEAREST TO OBS)
easting 395747.39 395747.39 395955.70 395955.19 395955.19 395046.56 395046.56 northing 6290808.33 6290808.33 6290679.01 6290677.65 6290677.65 6291063.98 6291063.98
surface (AHD) 164.75 164.75 163.92 163.92 163.92 167.22 167.22 LOGGER HANG n/a 21 n/a 24 n/a 20 n/a
31/03/2006 -0.11 -0.28 1/04/2006 -0.18 -0.11 2/04/2006 -0.17 0.06 3/04/2006 -0.18 0.08 4/04/2006 -0.22 0.08 5/04/2006 -0.21 0.10 6/04/2006 -0.22 0.09 7/04/2006 -0.24 0.09 8/04/2006 -0.27 0.08 9/04/2006 -0.25 0.11
10/04/2006 -0.24 0.12 11/04/2006 -0.23 0.12 12/04/2006 -0.25 0.12 13/04/2006 -0.24 0.13 14/04/2006 -0.27 0.10 15/04/2006 -0.29 0.09 16/04/2006 -0.26 0.11 17/04/2006 -0.25 0.10 18/04/2006 -0.27 0.09
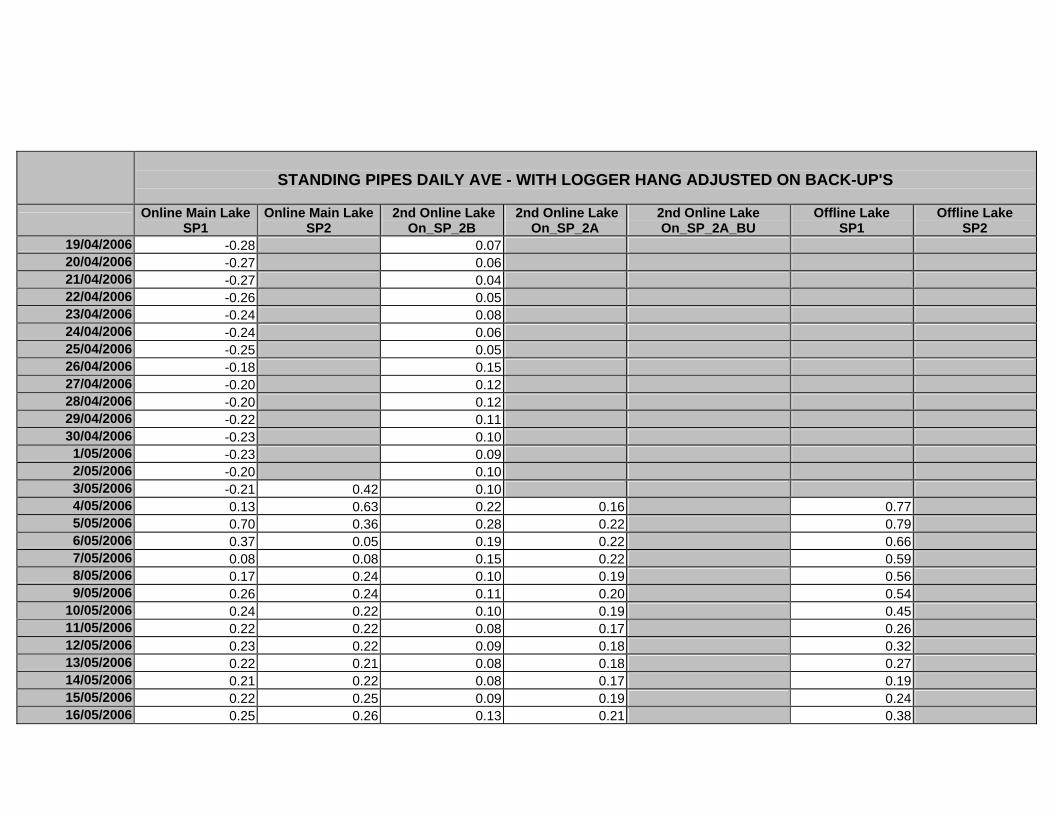
STANDING PIPES DAILY AVE - WITH LOGGER HANG ADJUSTED ON BACK-UP'S
Online Main Lake SP1
Online Main Lake SP2
2nd Online Lake On_SP_2B
2nd Online Lake On_SP_2A
2nd Online Lake On_SP_2A_BU
Offline Lake SP1
Offline Lake SP2
19/04/2006 -0.28 0.07 20/04/2006 -0.27 0.06 21/04/2006 -0.27 0.04 22/04/2006 -0.26 0.05 23/04/2006 -0.24 0.08 24/04/2006 -0.24 0.06 25/04/2006 -0.25 0.05 26/04/2006 -0.18 0.15 27/04/2006 -0.20 0.12 28/04/2006 -0.20 0.12 29/04/2006 -0.22 0.11 30/04/2006 -0.23 0.10
1/05/2006 -0.23 0.09 2/05/2006 -0.20 0.10 3/05/2006 -0.21 0.42 0.10 4/05/2006 0.13 0.63 0.22 0.16 0.77 5/05/2006 0.70 0.36 0.28 0.22 0.79 6/05/2006 0.37 0.05 0.19 0.22 0.66 7/05/2006 0.08 0.08 0.15 0.22 0.59 8/05/2006 0.17 0.24 0.10 0.19 0.56 9/05/2006 0.26 0.24 0.11 0.20 0.54
10/05/2006 0.24 0.22 0.10 0.19 0.45 11/05/2006 0.22 0.22 0.08 0.17 0.26 12/05/2006 0.23 0.22 0.09 0.18 0.32 13/05/2006 0.22 0.21 0.08 0.18 0.27 14/05/2006 0.21 0.22 0.08 0.17 0.19 15/05/2006 0.22 0.25 0.09 0.19 0.24 16/05/2006 0.25 0.26 0.13 0.21 0.38
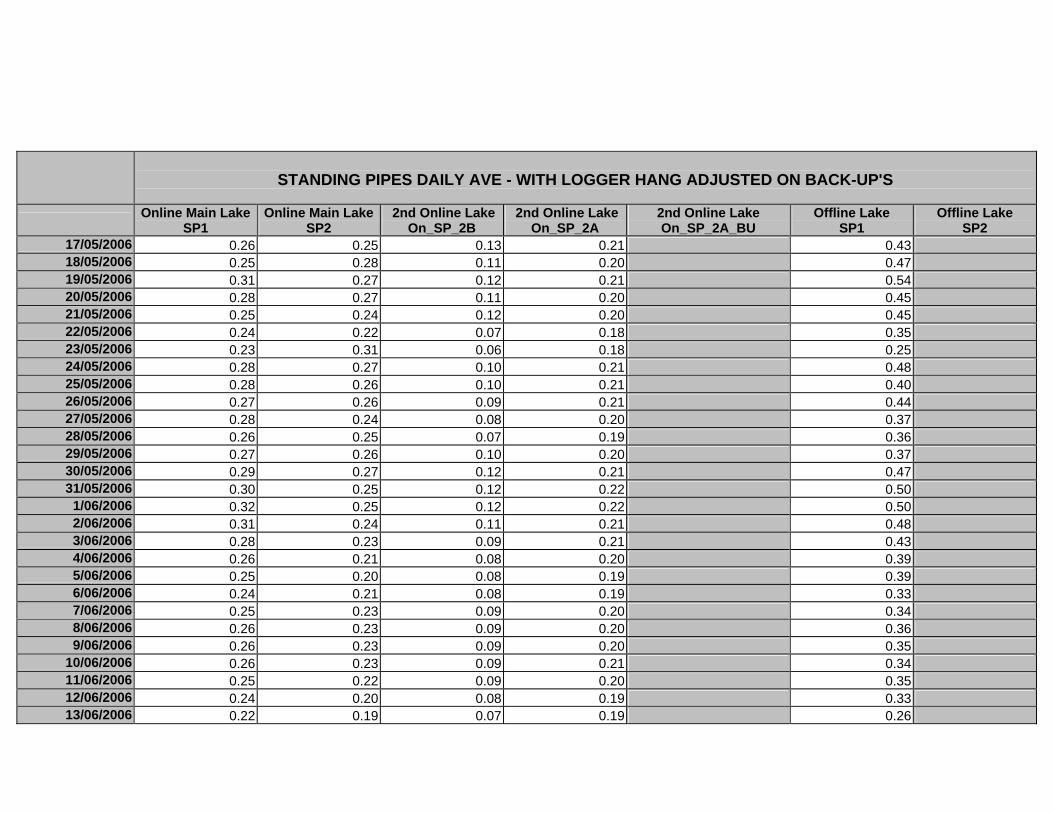
STANDING PIPES DAILY AVE - WITH LOGGER HANG ADJUSTED ON BACK-UP'S
Online Main Lake SP1
Online Main Lake SP2
2nd Online Lake On_SP_2B
2nd Online Lake On_SP_2A
2nd Online Lake On_SP_2A_BU
Offline Lake SP1
Offline Lake SP2
17/05/2006 0.26 0.25 0.13 0.21 0.43 18/05/2006 0.25 0.28 0.11 0.20 0.47 19/05/2006 0.31 0.27 0.12 0.21 0.54 20/05/2006 0.28 0.27 0.11 0.20 0.45 21/05/2006 0.25 0.24 0.12 0.20 0.45 22/05/2006 0.24 0.22 0.07 0.18 0.35 23/05/2006 0.23 0.31 0.06 0.18 0.25 24/05/2006 0.28 0.27 0.10 0.21 0.48 25/05/2006 0.28 0.26 0.10 0.21 0.40 26/05/2006 0.27 0.26 0.09 0.21 0.44 27/05/2006 0.28 0.24 0.08 0.20 0.37 28/05/2006 0.26 0.25 0.07 0.19 0.36 29/05/2006 0.27 0.26 0.10 0.20 0.37 30/05/2006 0.29 0.27 0.12 0.21 0.47 31/05/2006 0.30 0.25 0.12 0.22 0.50
1/06/2006 0.32 0.25 0.12 0.22 0.50 2/06/2006 0.31 0.24 0.11 0.21 0.48 3/06/2006 0.28 0.23 0.09 0.21 0.43 4/06/2006 0.26 0.21 0.08 0.20 0.39 5/06/2006 0.25 0.20 0.08 0.19 0.39 6/06/2006 0.24 0.21 0.08 0.19 0.33 7/06/2006 0.25 0.23 0.09 0.20 0.34 8/06/2006 0.26 0.23 0.09 0.20 0.36 9/06/2006 0.26 0.23 0.09 0.20 0.35
10/06/2006 0.26 0.23 0.09 0.21 0.34 11/06/2006 0.25 0.22 0.09 0.20 0.35 12/06/2006 0.24 0.20 0.08 0.19 0.33 13/06/2006 0.22 0.19 0.07 0.19 0.26
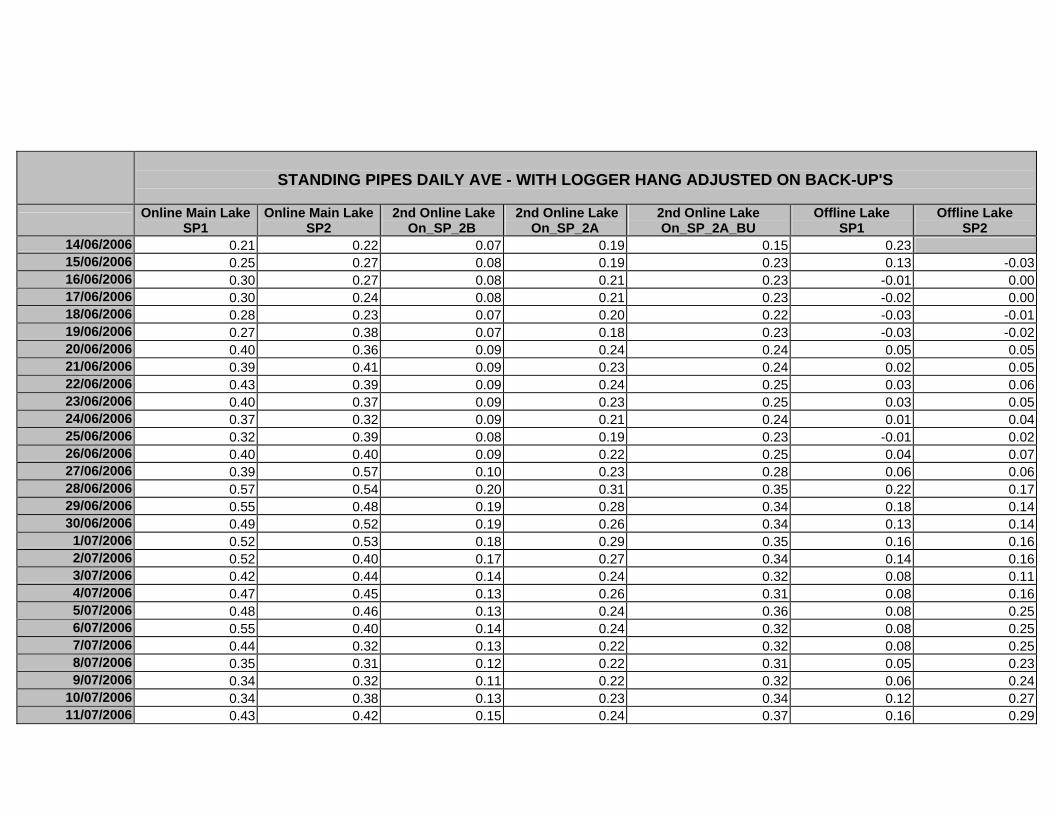
STANDING PIPES DAILY AVE - WITH LOGGER HANG ADJUSTED ON BACK-UP'S
Online Main Lake SP1
Online Main Lake SP2
2nd Online Lake On_SP_2B
2nd Online Lake On_SP_2A
2nd Online Lake On_SP_2A_BU
Offline Lake SP1
Offline Lake SP2
14/06/2006 0.21 0.22 0.07 0.19 0.15 0.23 15/06/2006 0.25 0.27 0.08 0.19 0.23 0.13 -0.03 16/06/2006 0.30 0.27 0.08 0.21 0.23 -0.01 0.00 17/06/2006 0.30 0.24 0.08 0.21 0.23 -0.02 0.00 18/06/2006 0.28 0.23 0.07 0.20 0.22 -0.03 -0.01 19/06/2006 0.27 0.38 0.07 0.18 0.23 -0.03 -0.02 20/06/2006 0.40 0.36 0.09 0.24 0.24 0.05 0.05 21/06/2006 0.39 0.41 0.09 0.23 0.24 0.02 0.05 22/06/2006 0.43 0.39 0.09 0.24 0.25 0.03 0.06 23/06/2006 0.40 0.37 0.09 0.23 0.25 0.03 0.05 24/06/2006 0.37 0.32 0.09 0.21 0.24 0.01 0.04 25/06/2006 0.32 0.39 0.08 0.19 0.23 -0.01 0.02 26/06/2006 0.40 0.40 0.09 0.22 0.25 0.04 0.07 27/06/2006 0.39 0.57 0.10 0.23 0.28 0.06 0.06 28/06/2006 0.57 0.54 0.20 0.31 0.35 0.22 0.17 29/06/2006 0.55 0.48 0.19 0.28 0.34 0.18 0.14 30/06/2006 0.49 0.52 0.19 0.26 0.34 0.13 0.14
1/07/2006 0.52 0.53 0.18 0.29 0.35 0.16 0.16 2/07/2006 0.52 0.40 0.17 0.27 0.34 0.14 0.16 3/07/2006 0.42 0.44 0.14 0.24 0.32 0.08 0.11 4/07/2006 0.47 0.45 0.13 0.26 0.31 0.08 0.16 5/07/2006 0.48 0.46 0.13 0.24 0.36 0.08 0.25 6/07/2006 0.55 0.40 0.14 0.24 0.32 0.08 0.25 7/07/2006 0.44 0.32 0.13 0.22 0.32 0.08 0.25 8/07/2006 0.35 0.31 0.12 0.22 0.31 0.05 0.23 9/07/2006 0.34 0.32 0.11 0.22 0.32 0.06 0.24
10/07/2006 0.34 0.38 0.13 0.23 0.34 0.12 0.27 11/07/2006 0.43 0.42 0.15 0.24 0.37 0.16 0.29
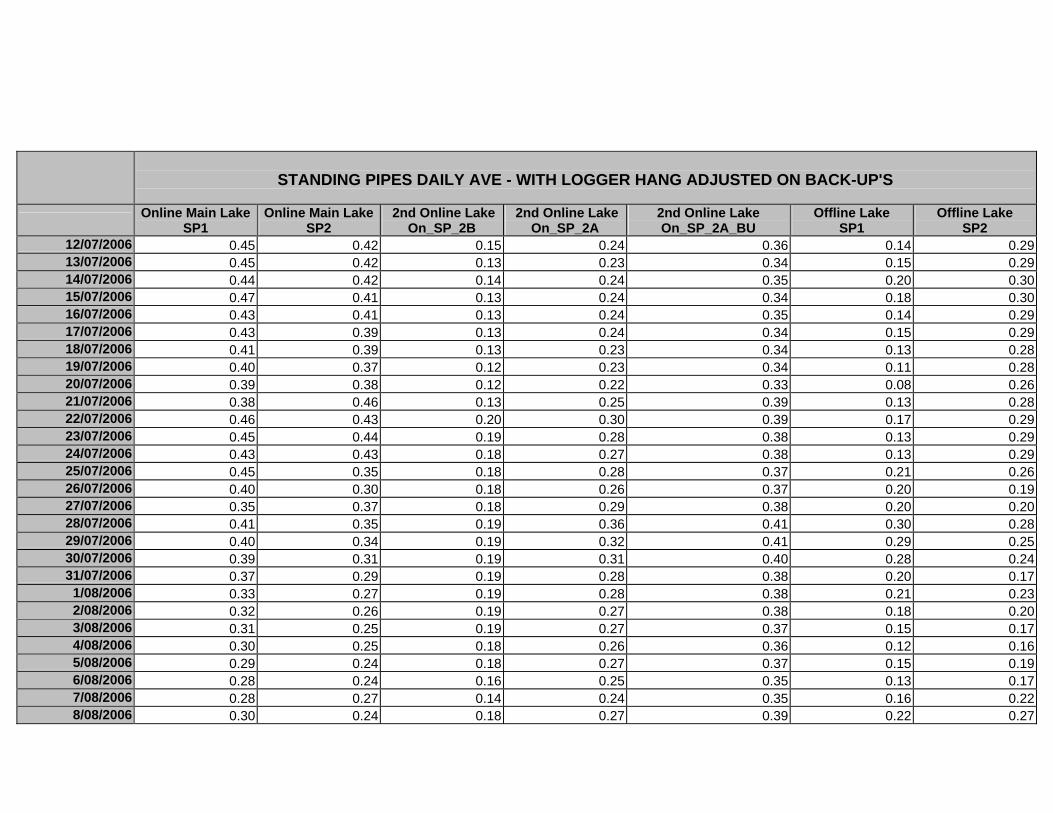
STANDING PIPES DAILY AVE - WITH LOGGER HANG ADJUSTED ON BACK-UP'S
Online Main Lake SP1
Online Main Lake SP2
2nd Online Lake On_SP_2B
2nd Online Lake On_SP_2A
2nd Online Lake On_SP_2A_BU
Offline Lake SP1
Offline Lake SP2
12/07/2006 0.45 0.42 0.15 0.24 0.36 0.14 0.29 13/07/2006 0.45 0.42 0.13 0.23 0.34 0.15 0.29 14/07/2006 0.44 0.42 0.14 0.24 0.35 0.20 0.30 15/07/2006 0.47 0.41 0.13 0.24 0.34 0.18 0.30 16/07/2006 0.43 0.41 0.13 0.24 0.35 0.14 0.29 17/07/2006 0.43 0.39 0.13 0.24 0.34 0.15 0.29 18/07/2006 0.41 0.39 0.13 0.23 0.34 0.13 0.28 19/07/2006 0.40 0.37 0.12 0.23 0.34 0.11 0.28 20/07/2006 0.39 0.38 0.12 0.22 0.33 0.08 0.26 21/07/2006 0.38 0.46 0.13 0.25 0.39 0.13 0.28 22/07/2006 0.46 0.43 0.20 0.30 0.39 0.17 0.29 23/07/2006 0.45 0.44 0.19 0.28 0.38 0.13 0.29 24/07/2006 0.43 0.43 0.18 0.27 0.38 0.13 0.29 25/07/2006 0.45 0.35 0.18 0.28 0.37 0.21 0.26 26/07/2006 0.40 0.30 0.18 0.26 0.37 0.20 0.19 27/07/2006 0.35 0.37 0.18 0.29 0.38 0.20 0.20 28/07/2006 0.41 0.35 0.19 0.36 0.41 0.30 0.28 29/07/2006 0.40 0.34 0.19 0.32 0.41 0.29 0.25 30/07/2006 0.39 0.31 0.19 0.31 0.40 0.28 0.24 31/07/2006 0.37 0.29 0.19 0.28 0.38 0.20 0.17
1/08/2006 0.33 0.27 0.19 0.28 0.38 0.21 0.23 2/08/2006 0.32 0.26 0.19 0.27 0.38 0.18 0.20 3/08/2006 0.31 0.25 0.19 0.27 0.37 0.15 0.17 4/08/2006 0.30 0.25 0.18 0.26 0.36 0.12 0.16 5/08/2006 0.29 0.24 0.18 0.27 0.37 0.15 0.19 6/08/2006 0.28 0.24 0.16 0.25 0.35 0.13 0.17 7/08/2006 0.28 0.27 0.14 0.24 0.35 0.16 0.22 8/08/2006 0.30 0.24 0.18 0.27 0.39 0.22 0.27

STANDING PIPES DAILY AVE - WITH LOGGER HANG ADJUSTED ON BACK-UP'S
Online Main Lake SP1
Online Main Lake SP2
2nd Online Lake On_SP_2B
2nd Online Lake On_SP_2A
2nd Online Lake On_SP_2A_BU
Offline Lake SP1
Offline Lake SP2
9/08/2006 0.26 0.23 0.17 0.27 0.38 0.22 0.26 10/08/2006 0.26 0.22 0.17 0.27 0.38 0.22 0.26 11/08/2006 0.26 0.23 0.16 0.26 0.37 0.22 0.25 12/08/2006 0.29 0.25 0.17 0.27 0.39 0.26 0.28 13/08/2006 0.30 0.24 0.16 0.26 0.37 0.31 0.29 14/08/2006 0.27 0.28 0.16 0.25 0.36 0.25 0.25 15/08/2006 0.33 0.35 0.19 0.32 0.41 0.33 0.30 16/08/2006 0.40 0.28 0.22 0.38 0.45 0.38 0.33 17/08/2006 0.34 0.24 0.18 0.29 0.39 0.22 0.22 18/08/2006 0.29 0.25 0.15 0.27 0.36 0.12 0.14 19/08/2006 0.29 0.28 0.15 0.31 0.40 0.14 0.13 20/08/2006 0.36 0.25 0.17 0.33 0.42 0.23 0.19 21/08/2006 0.30 0.24 0.16 0.31 0.42 0.16 0.14 22/08/2006 0.31 0.35 0.17 0.32 0.41 0.18 0.16 23/08/2006 0.44 0.38 0.19 0.40 0.49 0.37 0.29 24/08/2006 0.44 0.34 0.20 0.36 0.47 0.27 0.21 25/08/2006 0.40 0.33 0.17 0.32 0.43 0.17 0.14 26/08/2006 0.38 0.33 0.16 0.32 0.43 0.19 0.16 27/08/2006 0.38 0.28 0.15 0.32 0.42 0.17 0.15 28/08/2006 0.34 0.22 0.14 0.30 0.41 0.13 0.11 29/08/2006 0.27 0.22 0.12 0.28 0.37 0.08 0.07 30/08/2006 0.26 0.25 0.13 0.27 0.35 0.09 0.08 31/08/2006 0.29 0.30 0.16 0.31 0.41 0.18 0.16
1/09/2006 0.34 0.31 0.17 0.34 0.44 0.31 0.23 2/09/2006 0.34 0.29 0.16 0.32 0.41 0.25 0.20 3/09/2006 0.32 0.28 0.15 0.32 0.41 0.23 0.19 4/09/2006 0.33 0.29 0.15 0.33 0.42 0.25 0.20 5/09/2006 0.35 0.28 0.17 0.34 0.43 0.23 0.19
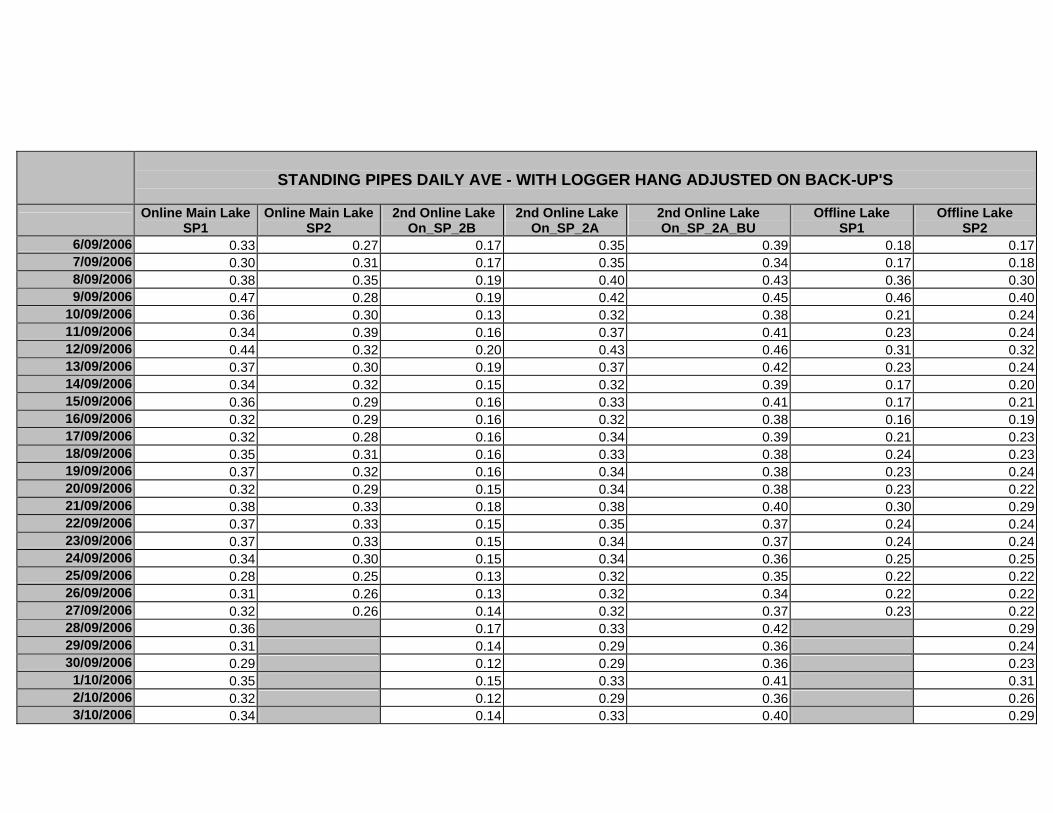
STANDING PIPES DAILY AVE - WITH LOGGER HANG ADJUSTED ON BACK-UP'S
Online Main Lake SP1
Online Main Lake SP2
2nd Online Lake On_SP_2B
2nd Online Lake On_SP_2A
2nd Online Lake On_SP_2A_BU
Offline Lake SP1
Offline Lake SP2
6/09/2006 0.33 0.27 0.17 0.35 0.39 0.18 0.17 7/09/2006 0.30 0.31 0.17 0.35 0.34 0.17 0.18 8/09/2006 0.38 0.35 0.19 0.40 0.43 0.36 0.30 9/09/2006 0.47 0.28 0.19 0.42 0.45 0.46 0.40
10/09/2006 0.36 0.30 0.13 0.32 0.38 0.21 0.24 11/09/2006 0.34 0.39 0.16 0.37 0.41 0.23 0.24 12/09/2006 0.44 0.32 0.20 0.43 0.46 0.31 0.32 13/09/2006 0.37 0.30 0.19 0.37 0.42 0.23 0.24 14/09/2006 0.34 0.32 0.15 0.32 0.39 0.17 0.20 15/09/2006 0.36 0.29 0.16 0.33 0.41 0.17 0.21 16/09/2006 0.32 0.29 0.16 0.32 0.38 0.16 0.19 17/09/2006 0.32 0.28 0.16 0.34 0.39 0.21 0.23 18/09/2006 0.35 0.31 0.16 0.33 0.38 0.24 0.23 19/09/2006 0.37 0.32 0.16 0.34 0.38 0.23 0.24 20/09/2006 0.32 0.29 0.15 0.34 0.38 0.23 0.22 21/09/2006 0.38 0.33 0.18 0.38 0.40 0.30 0.29 22/09/2006 0.37 0.33 0.15 0.35 0.37 0.24 0.24 23/09/2006 0.37 0.33 0.15 0.34 0.37 0.24 0.24 24/09/2006 0.34 0.30 0.15 0.34 0.36 0.25 0.25 25/09/2006 0.28 0.25 0.13 0.32 0.35 0.22 0.22 26/09/2006 0.31 0.26 0.13 0.32 0.34 0.22 0.22 27/09/2006 0.32 0.26 0.14 0.32 0.37 0.23 0.22 28/09/2006 0.36 0.17 0.33 0.42 0.29 29/09/2006 0.31 0.14 0.29 0.36 0.24 30/09/2006 0.29 0.12 0.29 0.36 0.23
1/10/2006 0.35 0.15 0.33 0.41 0.31 2/10/2006 0.32 0.12 0.29 0.36 0.26 3/10/2006 0.34 0.14 0.33 0.40 0.29
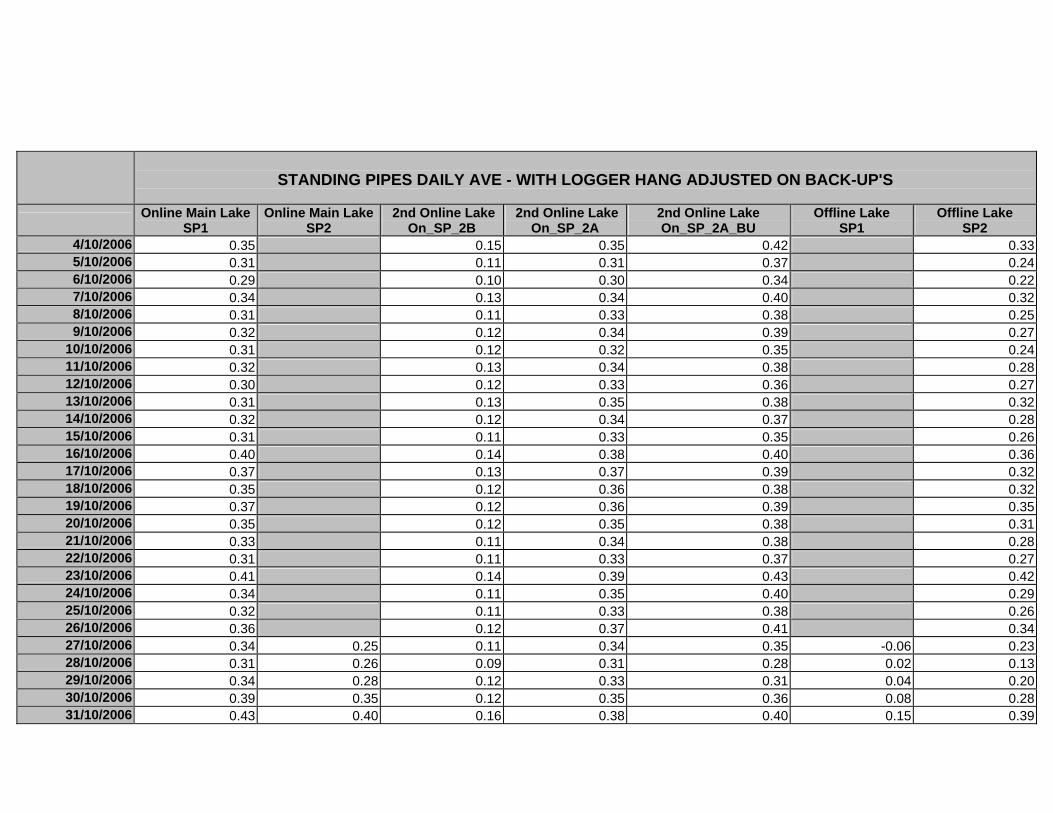
STANDING PIPES DAILY AVE - WITH LOGGER HANG ADJUSTED ON BACK-UP'S
Online Main Lake SP1
Online Main Lake SP2
2nd Online Lake On_SP_2B
2nd Online Lake On_SP_2A
2nd Online Lake On_SP_2A_BU
Offline Lake SP1
Offline Lake SP2
4/10/2006 0.35 0.15 0.35 0.42 0.33 5/10/2006 0.31 0.11 0.31 0.37 0.24 6/10/2006 0.29 0.10 0.30 0.34 0.22 7/10/2006 0.34 0.13 0.34 0.40 0.32 8/10/2006 0.31 0.11 0.33 0.38 0.25 9/10/2006 0.32 0.12 0.34 0.39 0.27
10/10/2006 0.31 0.12 0.32 0.35 0.24 11/10/2006 0.32 0.13 0.34 0.38 0.28 12/10/2006 0.30 0.12 0.33 0.36 0.27 13/10/2006 0.31 0.13 0.35 0.38 0.32 14/10/2006 0.32 0.12 0.34 0.37 0.28 15/10/2006 0.31 0.11 0.33 0.35 0.26 16/10/2006 0.40 0.14 0.38 0.40 0.36 17/10/2006 0.37 0.13 0.37 0.39 0.32 18/10/2006 0.35 0.12 0.36 0.38 0.32 19/10/2006 0.37 0.12 0.36 0.39 0.35 20/10/2006 0.35 0.12 0.35 0.38 0.31 21/10/2006 0.33 0.11 0.34 0.38 0.28 22/10/2006 0.31 0.11 0.33 0.37 0.27 23/10/2006 0.41 0.14 0.39 0.43 0.42 24/10/2006 0.34 0.11 0.35 0.40 0.29 25/10/2006 0.32 0.11 0.33 0.38 0.26 26/10/2006 0.36 0.12 0.37 0.41 0.34 27/10/2006 0.34 0.25 0.11 0.34 0.35 -0.06 0.23 28/10/2006 0.31 0.26 0.09 0.31 0.28 0.02 0.13 29/10/2006 0.34 0.28 0.12 0.33 0.31 0.04 0.20 30/10/2006 0.39 0.35 0.12 0.35 0.36 0.08 0.28 31/10/2006 0.43 0.40 0.16 0.38 0.40 0.15 0.39

STANDING PIPES DAILY AVE - WITH LOGGER HANG ADJUSTED ON BACK-UP'S
Online Main Lake SP1
Online Main Lake SP2
2nd Online Lake On_SP_2B
2nd Online Lake On_SP_2A
2nd Online Lake On_SP_2A_BU
Offline Lake SP1
Offline Lake SP2
1/11/2006 0.39 0.32 0.10 0.32 0.34 0.08 0.19 2/11/2006 0.32 0.28 0.09 0.30 0.32 0.01 0.12 3/11/2006 0.36 0.32 0.12 0.32 0.32 0.07 0.21 4/11/2006 0.47 0.40 0.13 0.34 0.34 0.12 0.24 5/11/2006 0.40 0.34 0.11 0.31 0.34 0.06 0.17 6/11/2006 0.33 0.30 0.10 0.31 0.32 -0.01 0.11 7/11/2006 0.47 0.42 0.11 0.36 0.36 0.14 0.26 8/11/2006 0.32 0.29 0.07 0.30 0.33 0.04 0.12 9/11/2006 0.26 0.24 0.04 0.27 0.33 -0.01 0.02
10/11/2006 0.29 0.24 0.04 0.27 0.33 -0.03 0.01 11/11/2006 0.27 0.24 0.04 0.28 0.34 -0.03 0.02 12/11/2006 0.29 0.28 0.09 0.30 0.41 0.10 0.16 13/11/2006 0.31 0.26 0.06 0.29 0.38 0.07 0.10 14/11/2006 0.31 0.28 0.09 0.30 0.39 0.10 0.15 15/11/2006 0.29 0.27 0.05 0.28 0.36 0.06 0.06 16/11/2006 0.35 0.33 0.11 0.37 0.43 0.15 0.18 17/11/2006 0.40 0.38 0.12 0.36 0.44 0.14 0.16 18/11/2006 0.35 0.31 0.08 0.29 0.37 0.07 0.06 19/11/2006 0.30 0.27 0.04 0.26 0.33 0.01 0.00 20/11/2006 0.31 0.28 0.05 0.29 0.35 0.01 0.01 21/11/2006 0.31 0.28 0.05 0.28 0.35 0.03 0.02 22/11/2006 0.27 0.24 0.04 0.28 0.33 -0.03 -0.03 23/11/2006 0.30 0.27 0.05 0.27 0.32 -0.01 -0.02 24/11/2006 0.36 0.32 0.09 0.33 0.41 0.24 0.24 25/11/2006 0.30 0.27 0.05 0.30 0.35 0.06 0.05 26/11/2006 0.29 0.26 0.03 0.28 0.33 -0.02 -0.03 27/11/2006 0.30 0.27 0.09 0.34 0.33 0.03 0.04 28/11/2006 0.31 0.30 0.14 0.40 0.12 0.15
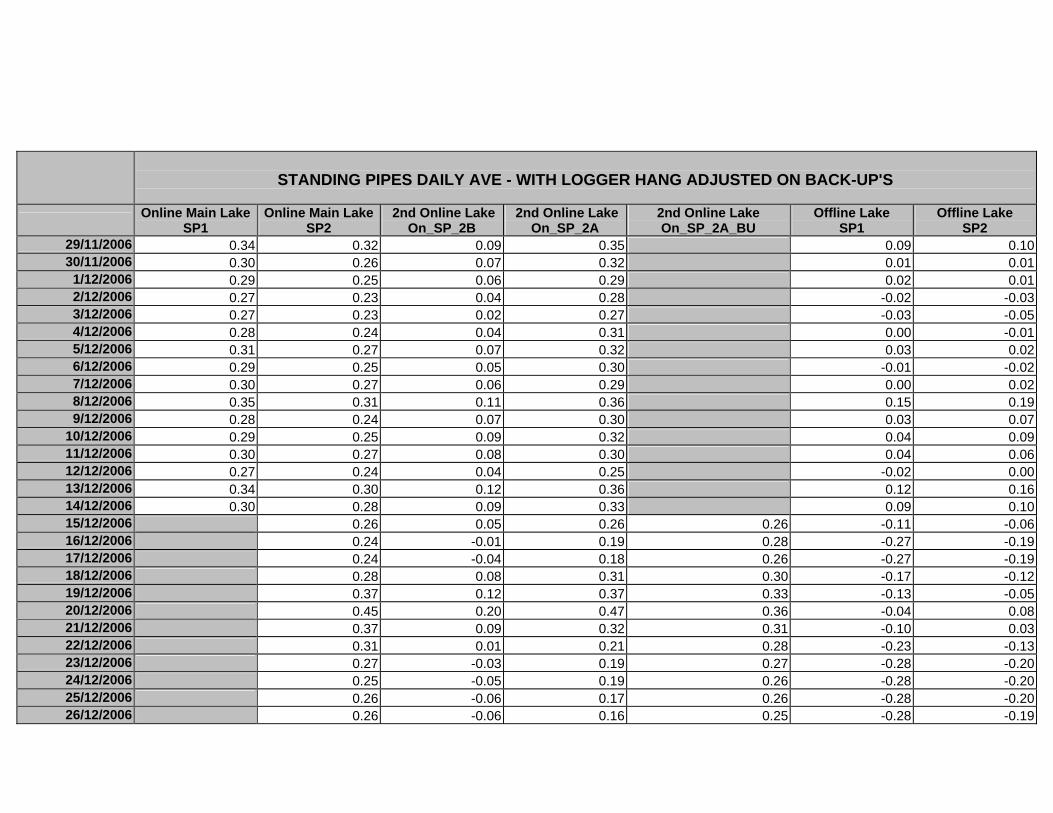
STANDING PIPES DAILY AVE - WITH LOGGER HANG ADJUSTED ON BACK-UP'S
Online Main Lake SP1
Online Main Lake SP2
2nd Online Lake On_SP_2B
2nd Online Lake On_SP_2A
2nd Online Lake On_SP_2A_BU
Offline Lake SP1
Offline Lake SP2
29/11/2006 0.34 0.32 0.09 0.35 0.09 0.10 30/11/2006 0.30 0.26 0.07 0.32 0.01 0.01
1/12/2006 0.29 0.25 0.06 0.29 0.02 0.01 2/12/2006 0.27 0.23 0.04 0.28 -0.02 -0.03 3/12/2006 0.27 0.23 0.02 0.27 -0.03 -0.05 4/12/2006 0.28 0.24 0.04 0.31 0.00 -0.01 5/12/2006 0.31 0.27 0.07 0.32 0.03 0.02 6/12/2006 0.29 0.25 0.05 0.30 -0.01 -0.02 7/12/2006 0.30 0.27 0.06 0.29 0.00 0.02 8/12/2006 0.35 0.31 0.11 0.36 0.15 0.19 9/12/2006 0.28 0.24 0.07 0.30 0.03 0.07
10/12/2006 0.29 0.25 0.09 0.32 0.04 0.09 11/12/2006 0.30 0.27 0.08 0.30 0.04 0.06 12/12/2006 0.27 0.24 0.04 0.25 -0.02 0.00 13/12/2006 0.34 0.30 0.12 0.36 0.12 0.16 14/12/2006 0.30 0.28 0.09 0.33 0.09 0.10 15/12/2006 0.26 0.05 0.26 0.26 -0.11 -0.06 16/12/2006 0.24 -0.01 0.19 0.28 -0.27 -0.19 17/12/2006 0.24 -0.04 0.18 0.26 -0.27 -0.19 18/12/2006 0.28 0.08 0.31 0.30 -0.17 -0.12 19/12/2006 0.37 0.12 0.37 0.33 -0.13 -0.05 20/12/2006 0.45 0.20 0.47 0.36 -0.04 0.08 21/12/2006 0.37 0.09 0.32 0.31 -0.10 0.03 22/12/2006 0.31 0.01 0.21 0.28 -0.23 -0.13 23/12/2006 0.27 -0.03 0.19 0.27 -0.28 -0.20 24/12/2006 0.25 -0.05 0.19 0.26 -0.28 -0.20 25/12/2006 0.26 -0.06 0.17 0.26 -0.28 -0.20 26/12/2006 0.26 -0.06 0.16 0.25 -0.28 -0.19
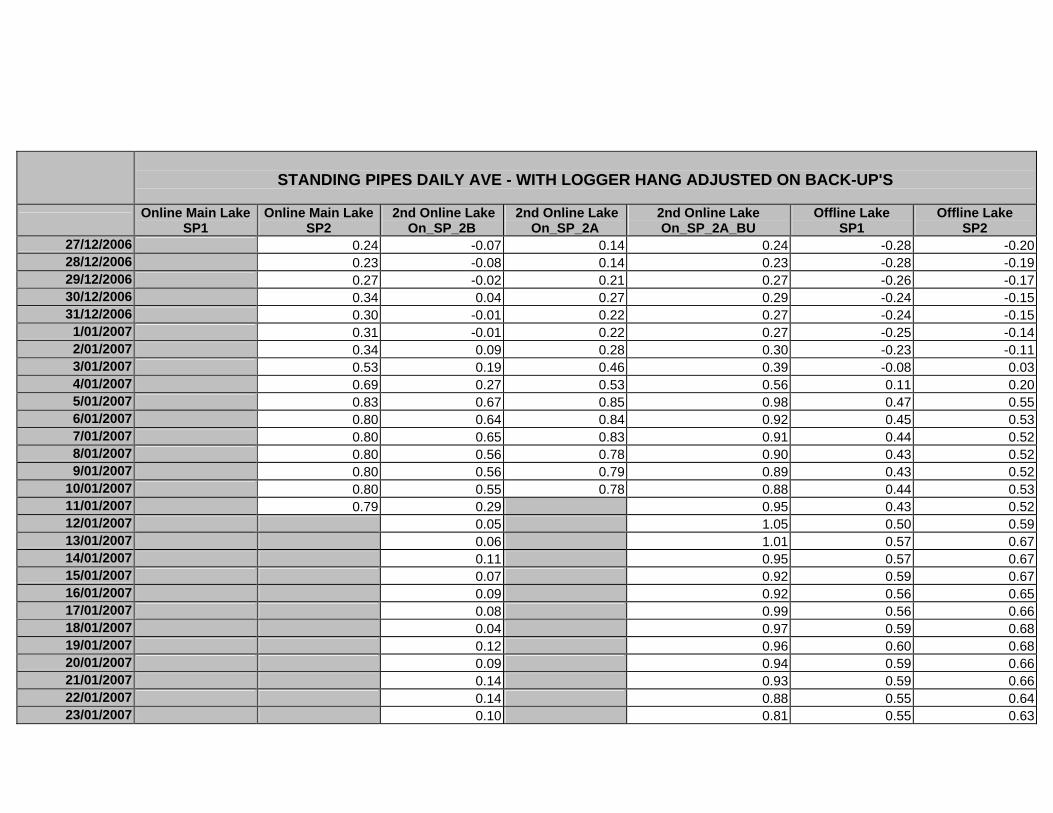
STANDING PIPES DAILY AVE - WITH LOGGER HANG ADJUSTED ON BACK-UP'S
Online Main Lake SP1
Online Main Lake SP2
2nd Online Lake On_SP_2B
2nd Online Lake On_SP_2A
2nd Online Lake On_SP_2A_BU
Offline Lake SP1
Offline Lake SP2
27/12/2006 0.24 -0.07 0.14 0.24 -0.28 -0.20 28/12/2006 0.23 -0.08 0.14 0.23 -0.28 -0.19 29/12/2006 0.27 -0.02 0.21 0.27 -0.26 -0.17 30/12/2006 0.34 0.04 0.27 0.29 -0.24 -0.15 31/12/2006 0.30 -0.01 0.22 0.27 -0.24 -0.15
1/01/2007 0.31 -0.01 0.22 0.27 -0.25 -0.14 2/01/2007 0.34 0.09 0.28 0.30 -0.23 -0.11 3/01/2007 0.53 0.19 0.46 0.39 -0.08 0.03 4/01/2007 0.69 0.27 0.53 0.56 0.11 0.20 5/01/2007 0.83 0.67 0.85 0.98 0.47 0.55 6/01/2007 0.80 0.64 0.84 0.92 0.45 0.53 7/01/2007 0.80 0.65 0.83 0.91 0.44 0.52 8/01/2007 0.80 0.56 0.78 0.90 0.43 0.52 9/01/2007 0.80 0.56 0.79 0.89 0.43 0.52
10/01/2007 0.80 0.55 0.78 0.88 0.44 0.53 11/01/2007 0.79 0.29 0.95 0.43 0.52 12/01/2007 0.05 1.05 0.50 0.59 13/01/2007 0.06 1.01 0.57 0.67 14/01/2007 0.11 0.95 0.57 0.67 15/01/2007 0.07 0.92 0.59 0.67 16/01/2007 0.09 0.92 0.56 0.65 17/01/2007 0.08 0.99 0.56 0.66 18/01/2007 0.04 0.97 0.59 0.68 19/01/2007 0.12 0.96 0.60 0.68 20/01/2007 0.09 0.94 0.59 0.66 21/01/2007 0.14 0.93 0.59 0.66 22/01/2007 0.14 0.88 0.55 0.64 23/01/2007 0.10 0.81 0.55 0.63
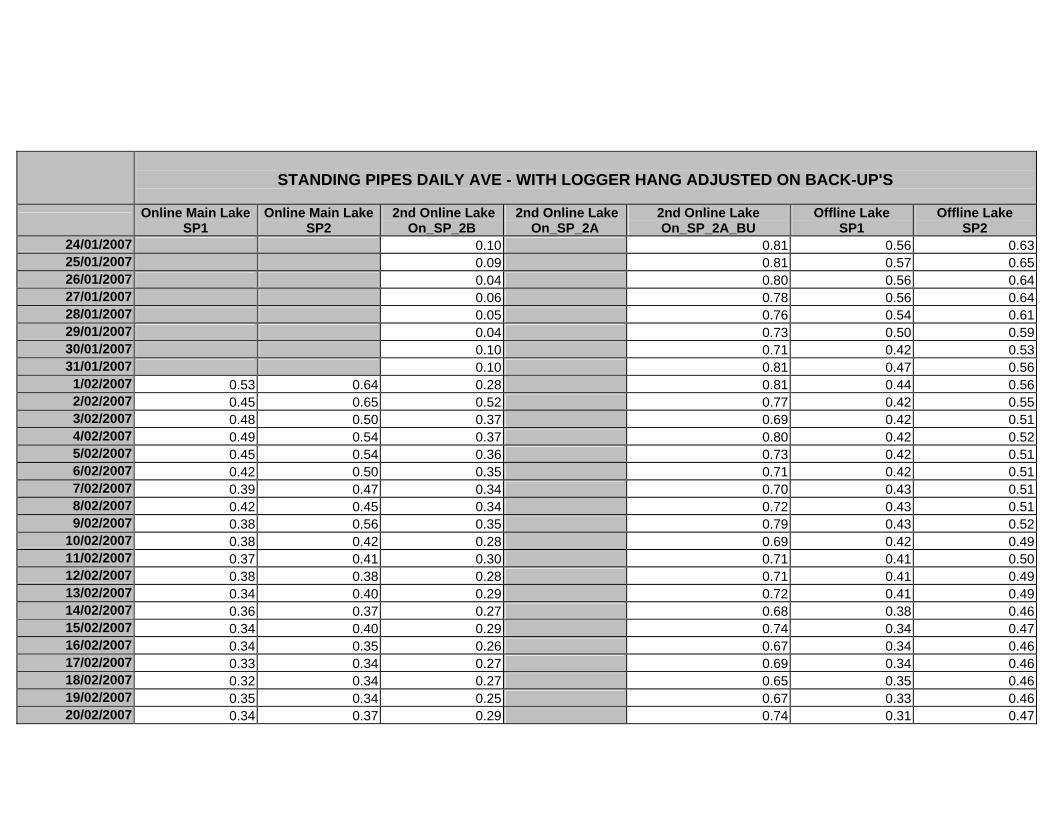
STANDING PIPES DAILY AVE - WITH LOGGER HANG ADJUSTED ON BACK-UP'S
Online Main Lake SP1
Online Main Lake SP2
2nd Online Lake On_SP_2B
2nd Online Lake On_SP_2A
2nd Online Lake On_SP_2A_BU
Offline Lake SP1
Offline Lake SP2
24/01/2007 0.10 0.81 0.56 0.63 25/01/2007 0.09 0.81 0.57 0.65 26/01/2007 0.04 0.80 0.56 0.64 27/01/2007 0.06 0.78 0.56 0.64 28/01/2007 0.05 0.76 0.54 0.61 29/01/2007 0.04 0.73 0.50 0.59 30/01/2007 0.10 0.71 0.42 0.53 31/01/2007 0.10 0.81 0.47 0.56
1/02/2007 0.53 0.64 0.28 0.81 0.44 0.56 2/02/2007 0.45 0.65 0.52 0.77 0.42 0.55 3/02/2007 0.48 0.50 0.37 0.69 0.42 0.51 4/02/2007 0.49 0.54 0.37 0.80 0.42 0.52 5/02/2007 0.45 0.54 0.36 0.73 0.42 0.51 6/02/2007 0.42 0.50 0.35 0.71 0.42 0.51 7/02/2007 0.39 0.47 0.34 0.70 0.43 0.51 8/02/2007 0.42 0.45 0.34 0.72 0.43 0.51 9/02/2007 0.38 0.56 0.35 0.79 0.43 0.52
10/02/2007 0.38 0.42 0.28 0.69 0.42 0.49 11/02/2007 0.37 0.41 0.30 0.71 0.41 0.50 12/02/2007 0.38 0.38 0.28 0.71 0.41 0.49 13/02/2007 0.34 0.40 0.29 0.72 0.41 0.49 14/02/2007 0.36 0.37 0.27 0.68 0.38 0.46 15/02/2007 0.34 0.40 0.29 0.74 0.34 0.47 16/02/2007 0.34 0.35 0.26 0.67 0.34 0.46 17/02/2007 0.33 0.34 0.27 0.69 0.34 0.46 18/02/2007 0.32 0.34 0.27 0.65 0.35 0.46 19/02/2007 0.35 0.34 0.25 0.67 0.33 0.46 20/02/2007 0.34 0.37 0.29 0.74 0.31 0.47

STANDING PIPES DAILY AVE - WITH LOGGER HANG ADJUSTED ON BACK-UP'S
Online Main Lake SP1
Online Main Lake SP2
2nd Online Lake On_SP_2B
2nd Online Lake On_SP_2A
2nd Online Lake On_SP_2A_BU
Offline Lake SP1
Offline Lake SP2
21/02/2007 0.34 0.36 0.25 0.71 0.31 0.46 22/02/2007 0.38 0.37 0.24 0.73 0.31 0.45 23/02/2007 0.37 0.40 0.25 0.79 0.32 0.46 24/02/2007 0.34 0.38 0.23 0.74 0.32 0.47 25/02/2007 0.31 0.36 0.23 0.72 0.32 0.46 26/02/2007 0.34 0.32 0.19 0.51 0.64 0.33 0.43 27/02/2007 0.30 0.15 0.51 0.57 0.31 0.39 28/02/2007 0.33 0.14 0.44 0.54 0.25 0.35
1/03/2007 0.29 0.12 0.45 0.50 0.26 0.36 2/03/2007 0.33 0.17 0.40 0.60 0.27 0.37 3/03/2007 0.33 0.16 0.49 0.58 0.28 0.38 4/03/2007 0.30 0.13 0.48 0.55 0.23 0.39 5/03/2007 0.30 0.10 0.46 0.53 0.19 0.37 6/03/2007 0.30 0.08 0.43 0.50 0.15 0.34 7/03/2007 0.29 0.07 0.39 0.47 0.12 0.33 8/03/2007 0.23 0.00 0.37 0.36 0.07 0.27 9/03/2007 0.27 0.04 0.26 0.45 0.12 0.28
10/03/2007 0.28 0.08 0.35 0.48 0.10 0.26 11/03/2007 0.30 0.09 0.40 0.53 0.20 0.34 12/03/2007 0.38 0.15 0.44 0.64 0.23 0.37 13/03/2007 0.46 0.21 0.56 0.75 0.24 0.38 14/03/2007 0.38 0.12 0.69 0.65 0.19 0.32 15/03/2007 0.39 0.15 0.56 0.67 0.20 0.34 16/03/2007 0.35 0.11 0.58 0.62 0.18 0.31 17/03/2007 0.37 0.10 0.53 0.60 0.17 0.31 18/03/2007 0.33 0.06 0.52 0.52 0.13 0.27 19/03/2007 0.33 0.06 0.43 0.51 0.08 0.23 20/03/2007 0.38 0.10 0.44 0.61 0.13 0.29
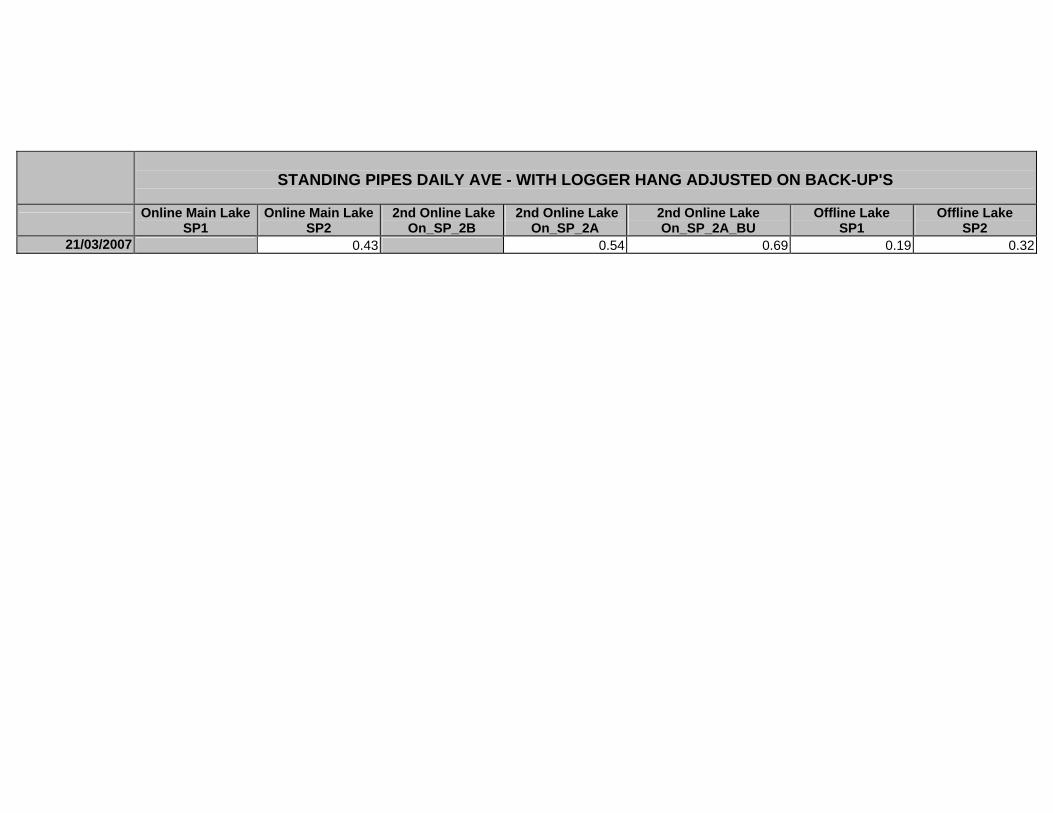
STANDING PIPES DAILY AVE - WITH LOGGER HANG ADJUSTED ON BACK-UP'S
Online Main Lake SP1
Online Main Lake SP2
2nd Online Lake On_SP_2B
2nd Online Lake On_SP_2A
2nd Online Lake On_SP_2A_BU
Offline Lake SP1
Offline Lake SP2
21/03/2007 0.43 0.54 0.69 0.19 0.32
Related Documents