QUANTIFYING THE INTER-INDIVIDUAL VARIATION IN RESPONSE TO EXERCISE INTERVENTIONS Philip James Williamson BSc, MSc A thesis submitted in partial fulfilment of the requirements of Teesside University for the award of the degree of Doctor of Philosophy (PhD) Teesside University Health and Social Care Institute, School of Health and Social Care July 2018

Welcome message from author
This document is posted to help you gain knowledge. Please leave a comment to let me know what you think about it! Share it to your friends and learn new things together.
Transcript
QUANTIFYING THE INTER-INDIVIDUAL VARIATION
IN RESPONSE TO EXERCISE INTERVENTIONS
Philip James Williamson BSc, MSc
A thesis submitted in partial fulfilment of the requirements of Teesside University
for the award of the degree of Doctor of Philosophy (PhD)
Teesside University
Health and Social Care Institute,
School of Health and Social Care
July 2018


i
Acknowledgements
A PhD is often a long and lonely ride, and it is easy to forget those who provide
support, assistance and advice throughout a time when introversion is often the
easiest option.
First and foremost, I would like to thank Professor Alan Batterham. You opened the
door to this research project through your previous work. You have provided me
with a huge amount of advice, direction and expertise throughout my PhD
programme, giving me the opportunity to learn and grow in the academic field. I am
extremely grateful for your support. To Professor Greg Atkinson, in conjunction
with Alan, I cannot thank you enough for your guidance through the world of
statistics. My whole supervisory team have been fantastic, and I was very lucky to
have their support. Few academics would conceptualise a project like the one that I
have completed, driven by the knowledge that whilst challenges may be plenty, the
work is important. The term ‘standing on the shoulders of giants’ could not be more
apt for both of you when I consider the impact of my own research, which is built
upon your solid foundations. I hope to spend the near future continuing to work
together to develop new projects now that this PhD is complete.
Thanks to the friends that I haven’t spent enough time with over the last 3 years –
your patience is appreciated, and I will endeavour to make more time now I am free
of this all-consuming research project.
I would like to acknowledge the Teesside University Physiology Laboratory staff,
for their support and seemingly unlimited advice during data collection to assist in
ensuring (relatively) smooth running of the research project, and also the outstanding
body of postgraduate researchers; you were sometimes a sounding board for ideas,
but more often a social support group that allowed for time to relax and forget about
the research, even for a few minutes at a time.
Most importantly, I would like to thank my family. To mum, dad, Andreas and
Susan, you all believed in me (much more so than I probably believed in myself) and

ii
all helped to get me where I am today. To my wife, Erica, your motivating words
and unwavering support have meant the world to me. To the kids, Joseph, Joshua,
Emily and Rosie, your patience when I was losing mine, and putting up with long
hours working when I should have been spending time with you, is hugely
appreciated. This thesis is dedicated to you, and I hope you can all be as proud of me
as I am of you.

iii
Declaration
I declare that this thesis is entirely my own work and represents the results of my own
research carried out at Teesside University. I declare that no material within this thesis
has been used in any other submission for an academic award.
iv
Contents
Acknowledgements i
Declaration iii
Table of Contents iv
List of Tables x
List of Figures xi
Abstract 1
Chapter 1: Introduction 4
1.1 Background 4
1.1.1 Inter-Individual Variation in Response to Exercise 4
1.1.2 The Concept of ‘Precision’ Medicine 5
1.1.3 Health Implications of Exercise and Physical Activity 6
1.1.4 Current Evidence 7
1.2 Rationale for the Thesis Topic and Research Questions 8
1.3 Aims and Objectives of this PhD and Experimental Approach 9
1.4 Structure of the Thesis 10
1.5 Potential Impact 11
Chapter 2: Literature Review 13
2.1. General Overview 13
2.2. Precision Medicine 13
2.2.1 Definition of ‘Precision Medicine’ 15
2.2.2 Use of Precision Medicine 15
2.2.3 Precision Medicine and Exercise? 16
2.3 Previously Utilised Methodological Approaches 17
2.3.1 Use of Comparator Arm 17
2.3.2 Identifying ‘Responders’ and ‘Non-Responders’ 20
2.3.3 Eliminating ‘Non-Responders’ or Shifts in the Mean? 21
2.3.4 Consideration of Within-Subject Variability 23
2.3.5 The 50% Heritability Claim 24
2.3.6 Partitioning Variance 27
2.4 Genetics, Heritability and Maximal Oxygen Uptake 27
2.4.1 Use of Siblings to Understand Heritability 27
v
2.4.2 Inter-Individual Variability of Maximal Oxygen Uptake in
Response to Exercise 29
2.4.2.1 Initial Claims 30
2.4.2.2 Physiological and Molecular Factors at Play? 30
2.4.2.3 The METAPREDICT Study 31
2.4.2.4 Sprint Interval Training and Inter-Individual Variation
in Response 33
2.4.3 Quantifying Inter-Individual Variation in V̇O2max Response to
Exercise– A Summary 33
2.5 Energy Balance and Body Weight 34
2.5.1 Genetics and Body Weight 35
2.5.2 Inter-Individual Variability in Body Weight Response to
Exercise 36
2.5.2.1 Gender Based Differences in Response 37
2.5.2.2 Other Suggested Mechanisms 37
2.6 Blood Pressure and the Effects of Exercise 39
2.6.1 Blood Pressure Reactivity 39
2.6.1.1 Mechanisms for Gender Differences 41
2.6.2 Heart Rate Response 41
2.6.3 Inter-Individual Variability of Blood Pressure and Heart Rate in
Response to Exercise 41
2.7 True Inter-Individual Variability in Response to Exercise: Does it Exist?
42
2.8 Gaps in the Literature and Rationale for Further Research 43
Chapter 3: Inter-Individual Responses of Maximal Oxygen Uptake to Exercise
Training: A Critical Review 47
3.1 Preface 47
3.2 Introduction 47
3.3 Maximal Oxygen Uptake and Precision Medicine 48
3.4 A Critical Review of the Relevant Studies 50
3.4.1 Pre-HERITAGE Studies 50
3.4.2 Recent Studies 56
3.4.3 Concurrent Training 57
3.4.4 Biological Variability 57
vi
3.4.5 Identifying ‘Responders’ and ‘Non-Responders’ 58
3.4.6 The HERITAGE Family Study 59
3.4.7 Twin Studies 61
3.4.8 Baseline Correlation of Changes 61
3.4.9 Testing Quality Control 62
3.4.10 N-of-1 Trials 63
3.5 A Road Map for Future Study Designs and Analyses 64
3.6 Conclusions 66
Chapter 4: Inter-Individual Differences in Weight Change Following Exercise
Interventions: A Systematic Review and Meta-Analysis of Randomised
Controlled Trials 71
4.1 Preface 71
4.2 Introduction 71
4.2.1 Research Design and Data Analysis Issues 73
4.2.2 Aims of the Review 74
4.3 Methods 74
4.3.1 Study Question 74
4.3.2 Literature Search and Study Selection 74
4.3.3 Study Eligibility 76
4.3.3.1 Inclusion Criteria 76
4.3.3.2 Exclusion Criteria 77
4.3.4 Data Extraction and Synthesis 77
4.3.5 Assessment of Study Quality 78
4.3.6 Meta-Analysis 78
4.4 Results 80
4.4.1 Study Selection 80
4.4.2 Study Outcomes 81
4.4.3 Study Quality and Risk of Bias 82
4.5 Discussion 94
4.5.1 Aerobic Training Interventions 94
4.5.2 Resistance Training Interventions 95
4.5.3 Separate Aerobic and Resistance Training Interventions 96
4.5.4 Combined/Concurrent Training 96
4.5.5 Limitations 98
vii
4.5.6 Findings in Relation to Current Recommendations and Future
Research Directions 100
4.5.7 Conclusions 101
Chapter 5: A Secondary Analysis of Data from the PREMIER Study 102
5.1 Preface 102
5.2 Introduction 102
5.2.1 Elevated Blood Pressure and Cardiovascular Disease Risk 102
5.2.2 Gender Differences in Blood Pressure 103
5.2.3 Impact of Weight Change 103
5.2.4 Use of the DASH Diet 103
5.2.5 Inter-Individual Variation in Response 104
5.3 Methods 105
5.3.1 The PREMIER Trial 105
5.3.2 Statistical Analysis and Results 106
5.3.3 Individual Prediction Interval for a New Participant 109
5.4 Discussion 110
5.4.1 Initial Exploratory Observation of Response Variance 110
5.4.2 Systolic Blood Pressure 111
5.4.3 Diastolic Blood Pressure 112
5.4.4 Weight Loss 112
5.5 Conclusions 113
Chapter 6: Inter-Individual Differences in Acute Blood Pressure and Heart
Rate Response to High Intensity Aerobic Exercise: A Replicate Crossover
Design 115
6.1 Preface 115
6.2 Introduction 115
6.2.1 Post Exercise Hypotension 115
6.2.2 Blood Pressure Reactivity 116
6.2.3 The Mechanisms of Blood Pressure Response 116
6.2.4 Gender Differences in Response 117
6.2.5 Inter-Individual Differences in Response 117
6.2.6 Partitioning Variance Through the Replicate Crossover 118
6.3 Methods 119
6.3.1 Participants 119
viii
6.3.2 Measurement of Peak Oxygen Uptake 120
6.3.3 Research Design 121
6.3.4 Experimental Protocol 122
6.3.5 Blood Pressure Measurements 122
6.3.6 Components of Blood Pressure 123
6.3.6 Heart Rate Monitoring 123
6.3.7 Statistical Analysis 124
6.4 Results 126
6.4.1 Mean Effects 126
6.4.2 Consistent Inter-Individual Variation in Response 127
6.4.3 One-Time Inter-Individual Variation in Response 127
6.4.4 Residual Error 128
6.5 Discussion 128
6.5.1 Key Findings 128
6.5.2 Cardiovascular Reactivity 129
6.5.3 Mechanisms of Response 130
6.5.4 Statistical Model for Analysis of Replicate Crossover Data 131
6.5.5 Limitations 132
6.6 Conclusions 133
Chapter 7: Discussion 134
7.1 Introduction 134
7.2 Brief Overview of Literature 134
7.3 Primary Findings 135
7.4 Thesis Objectives 135
7.4.1 Thesis Objective 1 135
7.4.2 Thesis Objective 2 136
7.4.3 Thesis Objective 3 137
7.4.4 Thesis Objective 4 138
7.5 Methodology in Relation to Current Research 139
7.6 Findings in Relation to Literature 140
7.7 Recommendations to Policy Makers and Practitioners 141
7.8 Strengths of the Thesis 143
7.9 Limitations of the Thesis 144
7.10 Original Contributions to Knowledge 145
ix
7.11 Future Research Considerations 146
7.12 Summary of Evidence 147
Appendices 149
Appendix 1 – Replicate Trial Participant Information Sheet 150
Appendix 2 – Replicate Trial Initial Contact Email 154
Appendix 3 – Replicate Trial Initial Course Lead Contact 155
Appendix 4 – Replicate Trial Initial Invite via Subject Lead 156
Appendix 5 – Replicate Trial Informed Consent 157
Appendix 6 – Replicate Trial Adverse Event 158
Appendix 7 – Replicate Trial Risk Assessment 161
Appendix 8 – Replicate Trial PAR-Q 164
Appendix 9 – Replicate Trial Data Collection Sheet 166
Appendix 10 – Abstract 1 (Conference Abstract) - Inter-Individual Differences in the
Responses of V̇O2max to Physical Activity Counselling. Presented at The
International Sports Science and Sports Medicine Conference, 2016 167
Appendix 11 - Abstract 2 (Conference Abstract) - Inter-Individual Responses of
Maximal Oxygen Uptake to Exercise Training: A Critical Review. Also published in
Sports Medicine. 2017 47 1501-13 168
Appendix 12 - Abstract 3 - Inter-Individual Differences in Weight Change Following
Exercise Interventions: A Systematic Review and Meta-analysis of Randomised
Controlled Trials. Published in Obesity Reviews. 2018 19 960-75 170
Appendix 13 - Abstract 4 (Conference Abstract) - Inter-Individual Differences in
Acute Blood Pressure Response to High Intensity Exercise: A Replicate Crossover
Design. Presented at The European College of Sport Science Congress, 2018 171
Appendix 14 – Peer-Reviewed Paper – Inter Individual Responses of Maximal
Oxygen Uptake to Exercise Training; A Critical Review 173
Appendix 15 – Peer-Reviewed Paper – Inter Individual Differences in Weight
Change Following Exercise Interventions: A Systematic Review and Meta-Analysis
of Randomized Controlled Trials 188
References 204
x
List of Tables
Table 1. Potential sources of variability during exercise trials 45
Table 2. Early studies presenting inter-individual response to exercise interventions
54
Table 3. Twin studies presenting intraclass correlations in analysis of inter-individual
response to exercise interventions 67
Table 4. Studies presenting weight loss response to supervised exercise interventions
83
Table 5. Summary descriptives of risk of bias for each of the included studies, in
accordance with Cochrane guidelines 87
Table 6. Participant characteristics 121
Table 7. Mean and inter-individual variations in response (consistent and one-time),
presented with 90% Confidence Intervals/Limits 127
xi
List of Figures
Fig. 1. Comparison of individual variation in response to exercise, showing similar
responses in control sample 40
Fig. 2. Conceptual framework for the quantification of true inter-individual
differences in response to an intervention 69
Fig. 3. PRISMA flowchart detailing stages of search 76
Fig. 4. Graph (visual summary of Table 4) detailing breakdown of risk of study bias,
stratified by risk category 82
Fig. 5. Graph detailing breakdown of risk of study bias, stratified by study and
specific risk factor 86

1
Abstract
Interest in the concept of ‘precision’ or ‘personalized’ medicine has grown over the
last three decades. While much of the literature published appears to support the
notion that clinically-relevant individual response differences exist in phenotypes
such as maximal aerobic capacity and weight loss, much of this research is based
upon the observed response, as opposed to the ‘true’ inter-individual variation.
In this doctoral research programme, I investigated ‘true’ inter-individual variation
in response to exercise interventions. The difference between observed and ‘true’
individual differences is that measurement error and other sources of random
variation are fully considered in order to quantify ‘true’ individual differences. These
were investigated due to the recent focus on ‘individual responses and precision and
personalised approaches. This was achieved through a number of approaches,
including a critical review of literature, a systematic review and meta-analysis, and
both secondary analysis of randomised controlled trial (RCT) data and primary data
collection through the novel use of a replicate crossover trial.
A critical review of the relevant literature on responses of maximal oxygen uptake
to exercise training revealed that when the correct method for statistical analysis is
utilised on data from published research claiming substantial inter-individual
variability in response, it was actually observed that there was greater variability in
the control sample versus the intervention sample. This finding implies that there is
no substantial true individual training response variance, though the uncertainty in
the estimate of true inter-individual variability in response is marked with the small
sample sizes involved. The review also revealed that the vast majority of published
research purporting to show individual variation in response does not utilise the most
robust trial design (RCT) or statistical methods (comparison of the standard
deviations of the changes in all groups).
A meta-analysis of supervised exercise RCT’s revealed that evidence is limited for
clinically relevant ‘true’ inter-individual variation in weight change in response to an
exercise intervention, once the random variability in weight over time in the control
2
group is accounted for. This was the first systematic review and meta-analysis of
individual response variance. The pooled mean weight loss (-1.4 kg) was much
smaller than a conservative threshold for a clinically important change (2.5 kg), and
inter-individual variation in weight change standard deviation (SD) was only 0.8 kg.
A novel approach using a prediction interval revealed that in a future study in similar
settings, the 95% plausible range for mean weight change vs. control would be -
5.0 to 2.1 kg. The probability that the mean weight change in a future study would be
clinically relevant was 26% (possibly clinically important). For the individual
response variability, the prediction interval ranged from small negative to small
positive, and the probability that the individual response variance was clinically
relevant was 23% (unlikely).
A secondary analysis of data from dietary and lifestyle advice interventions
(PREMIER trial) revealed substantial inter-individual variations in the body weight
and blood pressure responses. Paradoxically, this response variance was not even
partially accounted for by including a sex-by-treatment interaction term in the model,
despite substantial sex differences in mean treatment effect. When analyses were
stratified by sex, much larger true individual response variance for weight loss and
blood pressure changes were observed in men compared to women, explaining the
paradox. The observed effect in women is relatively consistent, whilst in men it is
much more variable, reinforcing the requirement for thorough exploration of data
prior to undertaking full analyses.
In a novel replicate crossover trial designed to properly partition variance and
quantify ‘true’ inter-individual variation in response to acute high intensity aerobic
exercise, results suggest the presence of substantial ‘true’ inter-individual variation
in response. There were large sex differences in mean response, with greater blood
pressure and heart rate response variables in females in comparison to males. This
was the first replicate crossover designed and analysed in this way, using a specific
model to elucidate the acute response to exercise.
Evidence from these studies indicates that, when quantified appropriately, chronic
exercise interventions appear to elicit limited ‘true’ inter-individual variation in
response in peak oxygen uptake and weight loss. Conversely, there appear to
3
substantial inter-individual variations in blood pressure and heart rate responses to
acute, high intensity aerobic bouts of exercise. Furthermore, with multicomponent
interventions there appear to be substantial individual responses for blood pressure
and weight loss in men, based on secondary analysis of existing trial data. It is clear
that much of the research purporting to evidence individual variation in response is
lacking a suitable control sample. To that end, in chronic exercise intervention trials,
it is likely appropriate to focus upon the mean change, whilst for acute exercise
interventions, further quantification of the magnitude of inter-individual variation in
response may well be warranted.
4
Chapter 1: Introduction
1.1 Background
1.1.1 Inter-Individual Variation in Response to Exercise
Within the field of ‘personalised’, ‘precision’, or ‘stratified’ medicine, it is intuitive
to think that different individuals respond to health interventions in different ways. A
given health intervention may be beneficial, ineffective, or even harmful for different
people (Rasool et al., 2015). The issue of inter-individual variation in response to an
exercise intervention is, therefore, very important. Identifying those personal
characteristics that may account for any clinically relevant variation in response may
ultimately allow more efficient and ethical targeting of interventions to different
people.
Interest in the concept of ‘precision’ or ‘personalized’ medicine has grown over the
last three decades (Williamson et al., 2017). My own Scopus search has indicated
that the number of published papers that include the words ‘personalized medicine’
or ‘precision medicine’ in the titles or abstract has risen from 4 in 1999 to 5772 in
2016 and 4747 in 2017. While much of the literature published on this topic over the
last 30 years may appear to support the notion that clinically-relevant individual
response differences exist, some researchers have based their conclusions on
observed rather than ‘true’ individual differences in response. Essentially, the
difference between observed and ‘true’ individual differences is that measurement
error and other sources of random variation are fully considered in order to quantify
‘true’ individual differences.
The individual observed response that is often attributed to the intervention per se
can include numerous sources of sometimes uncontrollable variability such as
random (biological and measurement) variability, between-subject variability (if
unadjusted for baseline), subject-by-treatment interaction and within-subject
variability (Senn, 2016). However, it has previously been suggested that within-
subject random variation can be so substantial that it actually explains all apparent
individual variation in response (Atkinson & Batterham, 2015). Taking these factors
5
into account to derive the ‘true’ individual response difference is vital for robust
inferences, conclusions and recommendations to be made in precision medicine
(Atkinson & Batterham, 2015). Whilst this approach is a robust methodology for the
quantification of the presence of inter-individual variation in response, the field has,
so far, been slow to adopt this approach. This may be due to its novel nature, or its
potential impact upon the findings presented within the literature.
1.1.2 The Concept of ‘Precision’ Medicine
Personalized, or precision, medicine has been forwarded as an alternative approach
to current health models. This approach has the potential to reduce the prevalence of
non-response.
This concept is often called P4 medicine (predictive, preventive, personalized,
participatory). The overarching practical promise of ‘P4’ systems medicine is a
revolutionary paradigm shift leading to a better overall utility of medicine, a better
balance of benefits and harms. If successfully implemented, it could also allow for
precise prescription of interventions to improve outcomes based upon technologies
such as personal DNA–based testing, genotyping, and wearable micro-technologies,
and allow decision making tailored to patients’ individual requirements (Feero, 2007,
Joyner et al., 2016). At the same time, it is envisioned as being based in primary
care, and its promise of a revolution therefore depends on its ability to meet the
challenges of current research, prior to implementation.
In 2015, President Obama launched the Precision Medicine Initiative (NIH, 2015),
funded by an initial budget of $215 million. The initiative was described as having
an ‘innovative approach, that considers individual differences in people’s genes,
lifestyles, and environments’, bringing us ‘closer to curing diseases like cancer and
diabetes’. He went on to describe how this approach would ‘give all of us access to
the personalized information we need to keep ourselves and our families heathier’, in
a ‘new era, of medicine - one that delivers the right treatment at the right time’.
Although precision medicine makes claims of changing the medical landscape, it
currently exists mostly as a vision.
6
Some approaches in precision medicine have also been adopted for exercise research
and prescription, and there have been attempts to quantify the inter-individual
variation in response of human physiology, in order to identify moderators (such as
sex and age) and mediators (changes in status from baseline) governing response
variance. Unfortunately, in the exercise domain, this approach is based upon the as
yet untested claim that clinically relevant ‘true’ inter-individual variation in response
will always exist in an intervention. However, the current lack of robust research and
the cost and highly specific nature of dedicated RCTs aimed at targeting and
confirming intervention strategies mean that it is likely to be premature to state that
precision medicine is the answer, especially given that without variation in
phenotype response, further investigations to identify genetic interactions are
pointless.
1.1.3 Health Implications of Exercise and Physical Activity
For many decades, there has been a public health burden incurred by poor diet,
excess energy intake (EI), and sedentary lifestyles. These factors have been
implicated in the higher risk of developing chronic diseases such as type 2 diabetes,
cardiovascular disease, and an increased incidence of cancers (Alberti et al., 2007,
Deram & Villares, 2009). The impact that these lifestyle-related diseases have on
both society and individual quality of life remains substantial, as does the resulting
financial burden (Douglas et al., 2016).
Physical activity, defined as any bodily movement produced by skeletal muscles that
result in exergy expenditure (Casperson et al., 1985) and exercise – planned,
structured and repetitive and with an objective (Casperson et al., 1985) have wide-
ranging physiological benefits, such as improved maximal aerobic capacity, which
can lead to primary and secondary prevention of a number of chronic diseases such
as cardiovascular disease, diabetes, cancer, hypertension and obesity, and premature
death (Warburton et al., 2006), in addition to decreased symptoms of depression
(Craft & Perna, 2004). Whist the influence of physical activity and exercise is clearly
wide-ranging, much of the focus of research has been on maximal aerobic capacity
and cardiorespiratory fitness, as it is far more prognostic of future all-cause mortality
(Kodama et al., 2009, Imboden et al., 2018).
7
Regular physical activity and exercise are the usually prescribed means of improving
V̇O2max, with improvements recommended for both primary and secondary
prevention of cardiovascular disease. The results of research indicate that a 1-MET
(3.5 mL.kg-1.min-1) increase in cardiorespiratory fitness equates to a 12% reduction
in cardiovascular disease and all-cause mortality risk (Myers et al., 2002). Similarly,
an appropriate minimal clinically important difference (MCID) regarding a change in
cardiorespiratory fitness of 1.1 mL.kg-1.min-1 can confer a 10% relative risk
reduction in mortality (Laukkanen et al., 2016).
Healthcare has previously been delivered with a ‘one-size-fits-all’ approach
(Bouchard & Rankinen, 2001, Pencina & Peterson, 2016), and research has reflected
this approach in terms of the focus on the group mean effect of an intervention
(Bouchard & Rankinen, 2001). Whilst this statistic informs the quantification of the
general effect of an intervention, it may mask a range of responses for different
people (Karavirta et al., 2011). Recent suggestions that traditional therapies may be
ineffective for those with epigenetic causes of disease highlight the requirement for
further study of the concept of inter-individual variation in response, with treatment
for those individuals impacted potentially requiring personalized interventions
(Rasool et al., 2015). The completion of the Human Genome Project has seen
scientists prioritise the requirement to ensuring interventions are personalized,
tailoring medical treatment away from the previously mentioned ‘one-size-fits-all’
towards interventions or treatments more likely to benefit the requirements of the
specific participant.
1.1.4 Current Evidence
There have been reports that training studies consistently report a high variability in
the effects of regular exercise training (Hecksteden et al., 2018), with reports of
inter-individual variation of many physical characteristics, or phenotype, in response
to various forms of exercise, such as aerobic training (Bouchard et al., 1999,
Bouchard et al., 2000, Bouchard & Rankinen, 2001), resistance training (Hubal et
al., 2005) and combined/concurrent training (Hautala et al., 2006); reports that
exercise often results in less than expected weight loss for some individuals, or
ranges of V̇O2max response of no change to 40% improvement (Lortie et al., 1984,
8
Bouchard & Rankinen, 2001). Additionally, researchers present plots and analyses
that suggest large variation in physiological response, even when the magnitude of
response variance is the same for all (Atkinson & Batterham, 2015).
However, there have been concerns raised in regard to the methodological approach
of much of the previous body of research (Hopkins, 2015, Atkinson & Batterham,
2015, Williamson et al., 2017). The identification of factors that may explain inter-
individual response variance should come only after true, substantial inter-individual
differences in response have been demonstrated and quantified properly (Atkinson &
Batterham, 2015, Williamson et al., 2017). This quantification requires an
appropriate control/ comparator group, preferably within a randomised trial design,
and comparison of the standard deviation of the change in outcome (SDchange) for
each relevant group. Much of the published literature claims substantial treatment
response heterogeneity based on analyses of changes in outcome in a single
intervention group, with no inclusion of a comparator sample in the research design.
Even worse is the ignoring the control data when available, when it is the presence of
such that would provide the required counterfactual (Williamson et al., 2017).
Claims that precision medicine is the answer to this current hot topic are likely
premature, based upon the lack of evidence obtained utilising the RCT approach, as
this methodology allows for comparison of the intervention arm with a relevant
control group, over the same time course (Hopkins, 2015, Atkinson & Batterham,
2015). Variability in the responses to exercise exists if the variability in observed
response exceeds the variability in observed responses in a control sample (Atkinson
& Batterham, 2015) However, if, following an RCT, substantial variation in
phenotype response does not exist, it is pointless looking for genetic interactions
(Senn, 2004). Additionally, it could be questioned whether further investigation in
this case would be ethically sound.
1.2 Rationale for the Thesis Topic and Research Questions
Given the claims of inter-individual variation in response in a number of studies, and
the recent criticisms of the analysis of these (Hopkins, 2015, Atkinson & Batterham,
9
2015), it is clear that proper quantification of the ‘true’ inter-individual variation in
response to exercise interventions is required.
Outcomes in maximal aerobic capacity, weight loss and blood pressure are
investigated due to their prognostic value for health. Additionally, the bulk of
published research in this area focus upon maximal aerobic capacity and weight loss.
The primary focus of this research project is to interrogate these claims, and to fully
elucidate the presence of ‘true’ inter-individual variation in response to exercise
interventions, based upon the methods of analysis recently suggested (Hopkins,
2015, Atkinson & Batterham, 2015).
Several common limitations can be identified within many of the studies
investigating the inter-individual variation in response to a chronic exercise
intervention.
Almost exclusively in these studies, a control group is either absent or discarded in
the data analysis (Williamson et al., 2017, Williamson et al., 2018). As is
highlighted in this thesis, the inclusion of data from a comparator group to compare
the inter-individual response to the given intervention is of principal importance in a
chronic response trial. In this thesis I aim to rectify this gap in the literature.
Additionally, in the investigation of acute effects of exercise, no study with a
replicate crossover design has been undertaken in order to elucidate the inter-
individual variation in blood pressure response immediately post-exercise, nor has
any research been undertaken purporting to investigate the inter-individual variation
in acute blood pressure response to exercise. This thesis includes an original study
and a secondary data analysis that applies an appropriate method to achieve this aim
and is accompanied by discussion and practical implications of the findings of this
novel approach.
1.3 Aims and Objectives of this PhD and Experimental Approach
The main aim of this PhD is to investigate the appropriate quantification of inter-
individual differences in the response to exercise interventions, as well as the
exploration of putative moderators and mediators of both the mean intervention
10
effect and the individual response, where appropriate. Approaches to identifying
‘positive responders’, ‘non-responders’ and ‘adverse responders’ to interventions
will also be investigated where appropriate.
Specific objectives:
1. To critically review the literature on inter-individual variation in maximal
aerobic capacity response to exercise.
2. To undertake a systematic review and meta-analysis of weight change
literature, with a focus upon quantifying the inter-individual variation in
weight loss.
3. To conduct detailed and rigorous secondary data analysis of previously
published data set from the PREMIER research project, using state-of-the-art
analysis techniques to identify and quantify ‘true’ inter-individual variation
in weight loss and blood pressure response to the interventions.
4. Design and undertake a pilot/’proof-of-concept’ investigation to investigate
the acute inter-individual variation of blood pressure and heart rate variables
in response to high-intensity aerobic interval training, using a replicate
crossover design, in order to test and validate a statistical model to fully
partition the various sources of variance and to isolate ‘true’ inter-individual
variation in response to high-intensity aerobic interval training, an approach
that has not been previously achieved. Successful partitioning of variance in
the repliucate crossover will provide a model that can be used as a basis for
future research.
1.4 Structure of the Thesis
This thesis consists of eight chapters. This chapter (Chapter 1) constitutes the
introduction, and discusses the background, rationale, and aims and objectives of the
study. Chapter 2 presents a focused literature review, providing a historical
overview, key concepts, a review of previous research, and background to the
utilisation of analysis of the inter-individual variation in response to exercise. The
reader will find a detailed review discussing precision medicine, aerobic capacity
and the investigations carried out in this area, obesity and its genetic base, the effects
of exercise on blood pressure, the underpinning physiology, and outlining the
11
previously published research purporting to investigate the inter-individual
variability in response to exercise interventions upon these variables. Chapters 3 – 7
consist of investigations of the relevant outcome measures that were studied as part
of this doctoral programme. This work includes a critical review of the inter-
individual variation of maximal oxygen uptake in response to exercise training
(Chapter 3), a systematic review and meta-analysis into the exercise and weight loss
literature (Chapter 4), a secondary data analysis of blood pressure and weight loss
variation (Chapter 5), and findings from a proof-of-concept pilot replicate crossover
design study investigating the acute inter-individual variation in blood pressure
response to high intensity aerobic exercise(Chapter 6). Chapter 7 forms the overall
discussion, bringing together the findings of the thesis, as well as strengths of the
findings presented. In this chapter, I also elaborate and critically synthesize the
findings of the thesis and discuss limitations and provide directions for future
research.
Recommendations for both practice and research are provided, in addition to
justification of how this research provided an original contribution to knowledge.
Finally, appendices are attached, including published papers and abstracts from
conference proceedings, with complete details provided of items discussed within
the thesis.
1.5 Potential Impact
Given the stated rationale for this thesis, it is important at this time for the claims of
inter-individual differences in response to an exercise intervention, with a particular
focus on maximal oxygen uptake, weight loss, and blood pressure response, to be
scrutinised in the context of recent criticisms. Identification of the presence of
clinically important inter-individual variation in response would allow for the
development of appropriate research design for investigation of potential moderators
and mediators. Alternatively, confirmation of the absence of such would allow for
research funding to be diverted to more appropriate sources.
The findings from the work presented in this thesis have the potential to increase the
understanding of the methods and statistical approaches that may be employed to

12
correctly quantify the ‘true’ inter-individual variation in response to an exercise
intervention in both acute and chronic training studies. This, in turn, will help to
clarify the classification of ‘non-responders’, and to guard against spurious
assumptions or incorrect methodological approaches. Furthermore, given the focus
upon precision medicine, policy and both applied and academic practice may be
changed based upon the findings of this programme of work. If clinically-relevant
individual response differences are not supported, then the commitment to funding
further research on aspects of this topic may be questionable.
13
Chapter 2: Literature Review
2.1 General Overview
It is generally assumed that individuals respond in a consistent manner to treatment
(Senn, 2004). However, all individuals acquire a variety of characteristics (Hopkins,
2015). The potential that this could lead to gene-polymorphisms accounting for inter-
individual differences in response has been discussed previously (Mori et al., 2009).
Nevertheless, it is important not to overreact to apparent differences (Senn, 2016), as
these may be due to a number of factors, such as random within-subjects’ variation,
from sources such as technical error and random within subjects’ biological
variation. In this literature review I begin by addressing ‘precision medicine’ before
discussing the concept of individual variation of maximal aerobic capacity, body
mass, and blood pressure variables in response to chronic and acute exercise.
2.2 Precision Medicine
Until recently, healthcare interventions such as medication and exercise have been
undertaken with a ‘one-size-fits-all’ approach (Bouchard & Rankinen, 2001, Pencina
& Peterson, 2016). Most researchers focus upon ‘main effects’ and mean group
changes (Bouchard & Rankinen, 2001), without analysis of individual participants.
The focus on individual response may be of benefit (Pencina & Peterson, 2016),
particularly if clear differences in response between an intervention sample and a
comparator sample are evident. This approach is useful but does not allow us to
distinguish between individuals (Senn, 2004), and may hide a wide range of
responses (Karavirta et al., 2011), as effects documented at group level may not
apply equally to every individual within the group. Large amounts of empirical
evidence may have been ignored due to this focus upon mean changes, and it has
been proposed that standard statistical analysis and methodological training has left
researchers unaware of the significance of response heterogeneity (Bryk &
Raudenbush, 1988). Over the last three decades, interest has grown exponentially,
with Scopus searches revealing that papers published including the words

14
‘personalized medicine’ or ‘precision medicine’ have risen from 4 in 1999 to 5772 in
2016.
It has been suggested that traditional therapies may be ineffective for those with
epigenetic causes of disease, and treatment for these individuals may require
personalized or genomic medicine (Rasool et al., 2015). Over the past decade,
following the completion of the Human Genome Project (www.genome.gov), an
international, collaborative research program (Collins & McKusick, 2001) which
entailed the mapping and understanding of all human genes to determine the
sequence of the human genome and identify its components parts, there has been a
move by scientists and officials towards ensuring medicine is more personalized
(Hamburg & Collins, 2010, Blaus et al., 2015, Buford et al., 2013, Collins &
Varmus, 2015). This practice involves tailoring medical treatment away from ‘one-
size-fits-all’ towards treatment strategies most likely to benefit the individual (Blaus
et al., 2015), using the technological and scientific advancements in the fields of
genetics, medicine, science and health care (Marcon et al., 2018).
In his State of the Union address in 2015, President Obama launched the Precision
Medicine Initiative (NIH, 2015, Precision Medicine Initiative Working Group, 2015)
, an “innovative approach, that takes into account individual differences in people’s
genes, lifestyles and environments” to “bring us closer to curing diseases like cancer
and diabetes, and to give all of us access to the personalized information we need to
keep ourselves and our families heathier”, in a “new era, of medicine-one that
delivers the right treatment at the right time”. An initial budget of $215 million was
invested to support these efforts. Similarly, then-Prime Minister of the United
Kingdom, David Cameron, had previously announced the coalition government’s
effort to sequence the 100,000 human genomes (100,000 Genome Project,
genomicsengland.co.uk) by the end of 2017, aimed at making the National Health
Service the world’s first healthcare system to launch a genomics medicine service.
This initiative was then to be built upon and a focus upon permanently embedding
genomics in care was suggested (National Health England, 2015). However, this
approach has numerous obstacles. Scientific challenges, such as the accurate
determination of specific genes with clinical importance, policy challenges such as
15
regulating genetic testing and ensuring rigorous validity and reliability of such tests
are paramount (Hamburg & Collins, 2010).
2.2.1 Definition of ‘Precision Medicine’
The terms ‘precision medicine’ and ‘personalized medicine’ have been used
interchangeably in the US and the UK (McCartney, 2017). Whilst as yet undefined,
the National Institutes of Health currently states that it is ‘an emerging approach for
disease treatment and prevention that considers individual variability in environment,
lifestyle and genes’ (NIH, 2015), whilst a National Research Council report suggests
it ‘refers to the tailoring of medical treatment to the individual characteristics of each
patient’ (NRC, 2011). It has also been described as ‘prevention and treatment
strategies that take individual variability into account’ (Collins & Varmus, 2015).
Precision medicine may allow the combination of components from various
emerging sub-disciplines such as real-time monitoring, diagnostic tests, and data
analytics to improve desired outcomes (Montalvo et al., 2017).
2.2.2 Use of Precision Medicine
Precision medicine has been suggested as an alternative solution to current health
models, under the premise of improved prediction, prevention, diagnosis and
treatment of disease, based upon wearable technology (Feero, 2017), genotyping,
and DNA variants (Joyner, 2016). It is currently claimed that personalized medicine
has improved diagnostics, drug development, and risk assessment and modification
(Chan & Ginsburg, 2011); however, the number of variants and the relative impact
of each of these on disease development is yet to be clearly elucidated, meaning that,
at best, it may be prudent to target groups (stratify) rather than individuals. It has
also been assumed that this approach will reduce the cost of healthcare; however, it
is still an expensive concept (Kittles, 2012) and the cost of screening for specific
genotypes and specialized healthcare cover may, conversely, increase healthcare
costs.
Successful precision medicine, therefore, would allow for the optimization and
customization of health care, using emergent technologies to make decisions tailored
16
to the patients’ individual requirements (Arnason, 2012, Mauri et al., 2014, Jameson
& Longo, 2015, Collins & Varmus, 2015), enabling patients and general public to
participate in both treatment decisions and preventative behaviour (Collins &
Varmus, 2015). If successful identification of a precise biomarker is achieved, those
that may benefit from a specific intervention may be recognised. Tailored
pharmacokinetic (the time course of drug absorption, metabolism and excretion) or
pharmacodynamic (the relationship between drug concentration and the relative
effect) response-based therapies could then be applied (Blaus et al., 2015), if the
drug response of an individual were accurately predicted (Spear et al., 2001). If this
is, indeed, the case, predictive methods of directing individuals towards treatments
with likely higher treatment efficacy could then also be derived, with small increases
in resulting response having dramatic effects upon disease burden.
It has been suggested that precision or personalized medicine claims hint at radical
transformation in medical care and public health (Joyner & Paneth, 2015). This
change would occur through reducing system costs and improving health care
efficiency (Keogh, 2012, Flores et al., 2013, Hood et al., 2015), treatment and
disease prevention programmes developed by the creation of large biobanks, genome
sequencing, and the use of biological information to link to medical records.
Conversely, criticisms of precision medicine question the value of its use in many
contexts (Joyner, 2016, Prasad, 2016). It has been highlighted that inappropriate
shifts in emphasis from public health initiatives to individual focus (Arnason, 2012,
Tedstone, 2016), and the lack of a definition of ‘normality’ (Manrai et al., 2018),
may result in over diagnosis and unnecessary testing (Diamanndis & Li, 2016). A
further drawback is that much of the gene data collected is focused upon individuals
of European ancestry (Kittles, 2012), and it is unknown as the extent of regional
differences in health risk profile.
2.2.3 Precision Medicine and Exercise?
Whilst precision medicine has primarily been concerned with the heterogeneity of
response to medication (Buford et al., 2013), the use of exercise for precision
treatment is a novel concept. As the focus on ‘main effects’ may miss important
individual level information, a focus upon the quantification of inter-individual
17
variation in response has grown in recent years (Williamson et al., 2017). It has been
postulated that precision medicine may be used to personalize training for elite
performance (Montalvo et al., 2017), as several single nucleotide polymorphisms
(SNP) associated with exercise induced muscle damage have been identified; with
knowledge of this, a practitioner could potentially maximise training prescription
and reduce injury risk (Baumert et al., 2016).
The interest in precision medicine has also stimulated attention in the exercise and
public health domain, and the quantification of inter-individual variation in response
of human physiology (Deighton et al., 2017, Hecksteden et al., 2018). The purpose
of research around precision medicine is to identify genetic factors governing
response variance; however, this is founded on fundamentally untested (as yet)
assumptions that ‘true’ inter-individual variation in response exists. Currently, given
the lack of information regarding the impact of genetics on many diseases or
population health outcome variables, the cost and highly specific nature of dedicated
RCTs aimed at targeting and confirming intervention strategies (Pletcher &
McCulloch, 2017), and the incredibly complex nature of disease pathogenesis
(Khoury & Galea, 2016), it is likely to be premature to state the case that precision
medicine is the answer to this current hot topic. Furthermore, if the required
variation in phenotype response does not exist, it is pointless looking for genetic
interactions (Senn, 2004).
2.3 Previously Utilised Methodological Approaches
2.3.1 Use of Comparator Arm
The concept of inter-individual variability in response to exercise was first mooted
during the 1980s (Prud’homme et al., 1984, Despres et al, 1984, Lortie et al., 1984,
Savard et al., 1985, Bouchard et al., 1986, Hamel et al., 1986, Simoneau et al.,
1986), with claims of inter-individual response in cardiorespiratory fitness, lipolysis,
glucose conversion, and fibre-type conversion. These variations were attributed to
genotype dependency. However, despite an apparently growing body of evidence, in
recent years the veracity of the approach to quantifying inter-individual variability in
18
response to exercise has been questioned (Hopkins, 2015, Hecksteden et al., 2015,
Atkinson & Batterham, 2015, Williamson et al., 2017).
Based upon these early studies, it is now assumed that there are considerable inter-
individual differences in response (Bouchard et al., 2015); however, this may or not
be true for any particular study (Atkinson & Batterham, 2015, Williamson et al.,
2017). Previous studies have assumed that the inter-individual variability in response
for a given trait is solely a consequence of exercise interventions. Others maintain
that the presence of inter-individual variation in response to an intervention must be
properly quantified before the exploration of moderators and mediators of variation
in response are investigated (Atkinson & Batterham, 2015). Indeed, the often-
utilised, no-comparator sample approach ignores the random variability (biological
and measurement error) over the time course of the intervention.
Much research has claimed the presence of inter-individual variation in response, by
analysing data from an intervention sample only (Bouchard & Rankinen, 2001,
Sisson et al., 2009, Pandey et al., 2015). This approach is wasteful and likely
misleading (Atkinson & Batterham, 2015). It has been stated that comparison of
intervention group variability with control group variability is necessary to
adequately quantify inter-individual variability in response to exercise (Hopkins,
2015, Hecksteden et al., 2015, Atkinson & Batterham, 2015, Williamson et al.,
2017). For chronic training interventions, it has recently been described how the
most appropriate approach to quantifying the inter-individual variation in response is
by conducting a randomized control trial (RCT), as this methodology allows for
comparison of the intervention arm with a relevant control group, over the same time
course (Hopkins, 2015, Atkinson & Batterham, 2015). Specifically, variability in the
responses to exercise exists if the variability in observed response to exercise
exceeds the variability in observed responses to a control sample (Atkinson &
Batterham, 2015, Williamson et al., 2017). Without the comparator arm, it cannot be
stated with any confidence that any individual in the intervention arm may be a
responder, as what would have happened to that person had they been in the control
sample – the counterfactual -is not known (Williamson et al., 2017).
It has been posited that focusing solely on the intervention arm to determine
responders and non-responders turns a parallel group RCT into a ‘single arm’ study
19
(Norbury & Seymour, 2018). However, the parallel group RCT allows for
interpretation of what would likely happen, on average, to participants in the
intervention arm if, contrary to the fact, they were in the comparator sample
(Atkinson & Batterham, 2015). Exclusively, previous trials have ignored this
comparison and, therefore, have not accounted for the contribution of random
variability over time for the given outcome under study. Thus, whether inter-
individual variability attributed to exercise exists after accounting for random
variability is unknown.
The analytical limitations of prior trials have been addressed by proposing a standard
statistical approach that separates the random variability from the intervention
variability by using standard deviations (SD) of the changes from both the control
and intervention groups (Atkinson & Batterham, 2015). Therefore, to fully
investigate the magnitude of inter-individual response and separate the variation due
to random error (present in both control and intervention) from the variation due
intervention alone, the appropriate method to quantify ‘true’ individual response
variability in a parallel group study involves the application of the following
equation; 𝑆𝐷𝐼𝑅 = √𝑆𝐷𝐼2 − 𝑆𝐷𝐶
2 (Atkinson & Batterham, 2015, Hopkins, 2015). In
this equation, SDIR is the true inter-individual response variability, I is the
intervention sample and C is the comparator (control) sample. The SDIR should be
interpreted as the amount by which the mean effect of the intervention (intervention
minus control) differs between individuals (Hopkins, 2015). The SD describes the
‘typical’ inter-individual variation in response between each participant (Atkinson &
Batterham, 2015), and when SDIR is calculated, it represents the typical ‘true’ inter-
individual variability, adjusted for random biological variation and measurement
error (Hopkins, 2015). This approach controls for regression to the mean (Atkinson
& Taylor, 2011, Atkinson et al., 2015). A larger SD of changes in outcome in the
intervention group would indicate a greater magnitude of inter-individual variation
vs the control sample (Hopkins, 2015), and may therefore indicate further
investigation of the moderators (effect modifiers) and mediators of this variation is
warranted.
The standard analysis of a parallel-arm RCT is an ANCOVA analysis adjusting for
chance imbalances in the outcome at baseline. In this analysis, the SDIR is derived
20
using a linear mixed model, as described in Atkinson & Batterham, 2015. In essence,
in this model the SD of the changes in intervention and control arms are adjusted for
chance imbalances at baseline.
2.3.2 Identifying ‘Responders’ and ‘Non-Responders’
The concept of inter-individual variability creates the issue of how to characterize
‘responsiveness’ in individuals. Dichotomously characterising in such a way is
inherently irrelevant to prognostic risk, as this is most likely continuous, rather than
binary, in nature (Sisson et al., 2009). Furthermore, insufficient information on the
partitioning of variance is elicited (Norbury & Seymour, 2018), meaning
consideration of data presented in this manner may be inappropriate.
Individuals have been described as ‘responders’ or ‘non-responders’ based on the
changes seen in a single phenotype (Mann et al., 2014). This approach may help
identify individuals or ‘sub-groups’ that benefit from an intervention (despite no
apparent mean improvement). However, there is a lack of clarity regarding the
criteria used to categorise individuals. Labelling individuals as ‘non-responders’
based on the change in a single variable can be also misleading, given the various
physiological adaptations often observed in response to acute and chronic exercise.
To that end, the magnitude of response across a range of phenotypes should be
investigated (Mann et al., 2014).
An often-utilised approach to determining non-response to exercise is the setting of a
statistical quantification of test-retest variability, such as 2 x typical error (TE)
(Alvarez et al., 2017, Bonafiglia et al., 2016, Gurd et al., 2016) or technical error of
measurement (TEM) (Bouchard et al., 2012) as a threshold for response. The
proportion of individuals whose response is identified to be below this arbitrary
threshold are then often defined as ‘non-responders’. This sample is then compared
between various intervention groups, instead of a relevant comparator sample taken
over the same duration as the intervention, in the belief that a comparison of inter-
individual responders is being undertaken. Using this test-retest variability is
problematic, as that used is often based upon 3-day variability (Gagnon et al., 1996),
as opposed to the same duration as the training intervention. Random within-
subjects’ variation would be expected to be substantially greater over an intervention
21
lasting, say, 12-24 weeks than over 3 days. Even when this 3-day test-retest technical
error of measurement value has been used to set a threshold, random within-subjects
variability is disregarded when portions of ‘non-responders’ are calculated. There
will naturally be individuals showing changes of lesser magnitude than the test-rest
variability but are not considered when calculating portions of ‘non-responders’. The
TE will also likely not coincide with a threshold for clinical or practical importance.
Ideally, magnitude of response should be compared to a minimal clinically important
difference (MCID), anchored to a clinically relevant risk reduction. This MCID is
often derived from the epidemiological literature, however, if it is not, an acceptable
default approach is to use 0.2SD of the baseline pooled SD is an acceptable approach
for identifying the smallest worthwhile change (SWC) (Hopkins, 2004). Similar
concerns can be raised about other studies (Bonafiglia et al., 2016, Alvarez et al.,
2017) using this approach, or the use of observed changes greater than the coefficient
of variation (CV) for a particular phenotype (Astorino & Schubert, 2014) to
determine ‘responders’ and ‘non-responders’.
It should also be considered that whilst the main outcome of any intervention may
produce some who do not ‘respond’ as much as others, other physiological variables
may well show improvement (Buford et al., 2013). Additionally, response may well
be dose-dependent. Greater intensity (Ross et al., 2015) and volume (Pandey et al.,
2015) have both reduced incidence of ‘non-response’, and these individuals
presenting lower sensitivity or adaptation to an intervention may simply require a
greater stimulus. This may be a further confounding variable to be addressed.
2.3.3 Eliminating ‘Non-Responders’ or Shifts in the Mean?
The effects of exercise training dose in cardiorespiratory fitness responsiveness in
healthy young males after selected repeated 6-week interventions was recently
explored (Montero & Lundby, 2017). These authors reported a decrease in the
incidence of ‘non-response’ to endurance training with higher exercise dose, which
they claimed was completely absent in those undertaking the highest doses of
exercise (240 and 300 minutes per week) after the first 6 weeks. Based upon these
findings, the authors suggested that the lower levels of the current exercise
guidelines may not provide a sufficient stimulus to evoke positive adaptations in all
22
individuals (69%, 40% and 29% respectively classified as ‘non-responders’ for
groups 1, 2 and 3, compared to 0% and 0% for groups 4 and 5 when considering
maximal power output). It was also stated that the incidence of ‘non-response’ to
endurance training was completely eliminated following a second 6-week training
period, therefore concluding that improvements may be elicited in ‘non-responders’
by using higher training stimuli.
However, similarly to many previously reported studies, no control group was
included in the study, instead using data from a short-term test-retest reliability
study; the inclusion of a suitable comparator sample is crucial to separate inter-
individual variability in CRF response to endurance training from the random error
component and, thus, control the sources of variation that may affect the study
results. Indeed, in this case, variation will likely be conflated over time, highlighting
why comparator data collected over the same time period as the intervention in
crucial. Additionally, the self-selecting intervention group removes the highly
important randomization process from the trial design.
Whilst claims for elimination of ‘non-response’ are made, the authors overlook the
fact that the whole distribution of responses changes when the mean response itself
changes, hence the decreasing proportion of non-responders as the mean response
increases. The authors appear to confuse shifts in the whole distribution as exercise
volume increases with true individual differences in the response to a given
intervention. Essentially, as the distribution shifts to the right, everyone becomes a
responder.
Furthermore, the authors appear to have run a ‘replicated’ intervention study to
facilitate eradication of ‘non-response’ in those showing less than 1xTE
improvement in peak power output (without the proper design that would have
allowed them to quantify the subject-by-training interaction (Hecksteden et al.,
2015)). Five intervention groups were included, but, as stated, no control group,
thereby assuming that the threshold concept for individual training response would
have been a valid approach to draw solid conclusions about inter-individual variation
in cardiorespiratory fitness response. This approach to distinguish between
‘responders’ and ‘non-responders’ is clearly flawed, as pre-post design studies
23
require analysis of the SD of the respective change scores in comparison with that of
a suitable comparator sample (Hopkins, 2015, Atkinson & Batterham, 2015), whilst
replicate crossover studies to elucidate inter-individual variation in response require
specific statistical modelling, such as that proposed by Stephen Senn (2016).
Additionally, the study was not actually a replicated crossover designed for the
identification of inter-individual differences, as the different conditions used were at
different exercise intensities rather than the same intensities replicated. It is also
clear that a crossover-based trial cannot be used for chronic training studies, given
participants are starting from a different baseline, due to chronic adaptations
(Williamson et al., 2017). It can, however, be employed in the investigation of acute
responses to exercise.
2.3.4 Consideration of Within-Subject Variability
Although the equation presented by Hopkins (2015) and Atkinson & Batterham
(2015) accounts for random variability, the within-subject variability in treatment
response remains. It is important to note that the implicit assumption for exercise
interventions examining individual response is that the training effects among
individuals are highly reproducible. It is possible that the observed individual
variability is, in fact, due to variable responsiveness to treatment within each
individual. This begs the question - would an individual respond similarly if they
were to repeat the same intervention? This question remains unanswered.
To assess within-subject variability, participants would have to repeat the
intervention after an appropriate washout period to determine whether individuals
would respond in a similar manner. Thus, the proper separation of subject-by-
treatment interaction from within-subject variability can only be achieved through
repeat administrations of the intervention to the same individuals. Furthermore, a
large scale multi-period (replicate) crossover intervention design is, in fact, the only
study design that can adequately identify all forms of variability discussed above
with the addition of treatment variability as well (variability of the differences
between each treatment phase). However, this type of intervention design is not
practical or may not even be feasible to carry out due to high participant burden,
cost, and uncertainty regarding washout periods for training adaptions that may or
may not become permanent. As it stands, it remains difficult to delineate potential
24
within- subject variability from subject-by-treatment variability with current RCT
designs due to the inability of an RCT to fully partition variance.
As an alternative solution, Hecksteden et al. (2015) suggest that repeat testing of
outcome measures throughout the duration of the intervention can help account for
within-subject variability by comparing segmental slopes of change scores for
shorter durations across the treatment period. However, this approach is also limited.
First, the close temporal proximity of the measures may lead to high amounts of
autocorrelation (measure of randomness) and a violation of the assumption of
random errors. Additionally, training adaptions may not necessarily be linear over
the course of the intervention and repeat measures may be expensive and impractical
for some interventions. When this repeated assessment approach was recently
utilised (Hecksteden et al., 2018), the analysis and inferences made appear flawed, as
exercise response at 12 months is compared with control response at six months;
given that the rise in SD from months 6-12 in the exercise is clear, it would be
prudent to suggest that similar increases would therefore also be expected in a non-
exercise control sample during the same period, therefore resulting in an inflated SD
at 12 months. This highlights the folly of attempting to make inferences from
different time points in exercise vs control. The authors also state that that non-
responders are labelled such if they show a response in "an unexpected direction",
when realistically, if non-responders were present, they would be identified by either
not improving as much as a threshold for clinical relevance, or, when using Hopkins’
approach (2015), when a substantially lower probability of being an individual
responder may be assigned. For now, doubts remain over whether this approach
provides a plausible alternative to conducting a repeated cross-over design
intervention or conducting a separate reliability intervention trial. In an applied
setting, practitioners may look to utilise either approach, as long as they are aware
and state the strengths and limitations of the methodology they select, and make
appropriate inferences based upon these strengths and limitations.
2.3.5 The 50% Heritability Claim
There is a growing interest in individual response differences and exploring potential
predictors of these individual responses. A recent opinion piece (Pickering & Kiely,
2017) discussed talent identification, and the ability to adapt to exercise. Key within
25
their discussion was a focus on the inter-individual variation in capacity to improve
physical characteristics as a key to future talent identification programmes. They
went on to discuss genetic profiling which may, in their view, allow identification of
those with the greatest potential for improvement, based upon the assertion that
exercise adaptation is partially genetically driven.
The argument for selecting athletes based upon future athletic potential, rather than
current high-performance, has its merits, given the non-linear nature of maturation.
However, use of genetic profiling and the companies purporting to provide such
information as to predict future athletic development is virtually meaningless. It is
also largely without scientific foundation, and the use of direct-to-consumer (DTC)
genetic testing to define or measure genetic risk for common diseases or developing
personalized diet and lifestyle recommendations (Janssens et al., 2008), alter
training, or for talent identification has previously been warned against due to lack of
evidence on their efficacy and possible commercial misrepresentation (Webborn et
al., 2015). Results from a recent study indicated that 40% of variants used in a
diagnostic approach in a variety of genes reported in DTC raw data were false
positives, whilst some genes classified as ‘increased risk’ were, in fact, benign or
noted to be common variants (Tandy-Connor et al., 2018). Whilst having access to
raw genotyping data may be informative and empowering for individuals, this
information can be misinterpreted, misleading and wholly inaccurate. Those
providing DTC testing also often ignore both the weak predictive power of the tested
genes and the complexity of relevant genetics, with minimal information provided on
how one might use the test results to makes changes to lifestyle or why the testing is
effective. It is clear that this approach adds little in terms of value to individual or
population health at this time.
The claims that "approximately 50% of baseline maximal oxygen uptake (V̇O2max)
is heritable” (Pickering & Kiely, 2017) appear to be re-interpreted to suit the
argument presented by these authors. The study this information is taken from
actually states that "the heritability of V̇O2max among sedentary adults could be as
high as 50% although this value is undoubtedly inflated by non-genetic familial
factor” (Bouchard et al., 2000). Indeed, this study was an ACE gene study in which
it was concluded that there was no association at all between genes and response,
26
concluding that although there is no direct evidence to support the notion that ACE
genes were involved in human trainability, it could be hypothesized that they
contribute to inter-individual variation in training response.
The aforementioned claims are also similar to those made in a recent meta-analysis,
where it was stated that ‘it has been estimated that V̇O2max trainability has a
significant heritable component of around 50%’ (Williams et al., 2017), and which
worryingly have now been progressed to ‘at least 50% of adaptation responses to
endurance training are heritable (Vellers et al., 2018). Conversely, whilst ranges of
44-68% heritability have been described in a recent meta-analysis (Miyamoto-
Mikami et al., 2018), due to the lack of explanation elucidated through analysis of
the studies included in their meta-analysis, these authors suggest further studies are
required in order to clarify this heterogeneity.
I have questioned the findings of much of the published literature from the
HERITAGE Family Study, from which these ‘50%’ claims originate, in regard to
change in V̇O2max in Chapter 3 of this thesis and in a published critical review
(Williamson et al., 2017). Many of the highlighted limitations centre upon the lack
of a control group with which to make comparison of the SDchange, and therefore
elucidation of any inter-individual variation in response to exercise. As is discussed
repeatedly in this thesis, in order to calculate the true inter-individual variation in
response to an intervention, in a parallel group study, true inter-individual difference
in response is only present if the response variance in the intervention group is
substantially larger than that in the control. The square root of the difference in
response variance (intervention minus control) gives the SD of the individual
response, or the variability in response which surpasses expected random within-
subjects variability (Atkinson & Batterham, 2015). If there are no substantial
differences between the two, the observations of inter-individual variation in
response can actually be described as baseline-to-follow-up within-subjects
variability (Atkinson & Batterham, 2015), which may be influenced by growth,
maturation and physical development.
Pickering & Kiely suggest that the magnitude of training response differs greatly
between individuals, and this information can assist in the identification of the
27
‘talent’ of adaptation. Again, this statement is based upon the findings presented in
the HERITAGE Family Study (Skinner et al., 2001) and I discuss how response
should be defined in regard to a minimal clinically worthwhile difference (MCID) in
Chapters 3 and 4. In brief, for a given individual, the observed change in phenotype
following an intervention can be combined with knowledge of the natural random
variation in that phenotype over the same time period (from a control group or
similar reliability study) to derive the probability that this individual’s true response
is greater than the MCID (Atkinson & Batterham, 2015).
Pickering & Kiely also suggest that the X allele of the α-actinin-3 (ACTN3) gene
may be responsible for those with larger adaptations in V̇O2max, whilst Williams et
al., (2017) state that 97 genes are identified as possible predictors of V̇O2max
trainability. However, it is concerning that data mining in this manner, presumption
of this figure of (now ‘at least’) 50% heritability in regard to V̇O2max training
response, and subsequent research into the genetic mediators of this response, may
be unwarranted and potentially misleading. It must also be remembered, that while
genetic factors may influence training response, due to their individual small effect
sizes, any one genetic variant will likely only contribute a tiny amount to any
variability. Rather, further research should be carried out to test the ‘50%’
hypothesis, in the presence of a suitable comparator sample, observed over the same
duration of any intervention group.
Such claims of genetic basis for individual variation in response, or trainability of
phenotypes such as maximal oxygen uptake should be made with caution and based
solely upon research that has reported these findings utilizing suitable research
design. Assumptions of ‘50% of heritability in trainability’ should also be made with
the utmost of caution, and the use of DTC genetic testing for talent identification
should not be recommended at this time.
2.3.6 Partitioning Variance
If we wish to use an individual’s results, such as that seen in an n-of-1 trial, in order
to prescribe an appropriate exercise intervention, response measurement in isolation
is not sufficient. We must first understand the components of variation. The design
28
of a multi-period crossover with a mixed (fixed and random effects) analysis model
would be more suitable for the efficient estimation of treatment effect (Senn, 1993).
This would allow for the partitioning of various components (between treatments,
between patients, patient-by-treatment, within patients) of variance (Senn, 2016).
This approach is also useful for quantifying the inter-individual variation in acute
response to exposure to exercise, and is an approach utilized in Chapter 6 of this
thesis.
2.4 Genetics, Heritability and Maximal Oxygen Uptake
It has been proposed that genetic variations may determine change in aerobic fitness
(Zadro et al., 2017). ACE polymorphisms have been suggested to be linked to elite
aerobic (rowing) performance (Gayagay et al., 1998), whilst SNPs rs2267668 in
peroxisome proliferator-activated receptor- (PPARD) and Gly482Ser in peroxisome
proliferator-activated receptor- coactivator 1 (PPARGC1A) have been claimed to
have independent impacts upon the effectiveness of exercise to improve physical
fitness (Stefan et al., 2007), and PPARGC1A and Gly482Ser have been suggested to
predict exceptional endurance capacity (Lucia et al., 2005).
Recent suggestions include the need for research into the contribution the
mitochondrial genome may have on genetic regulation of the variation in exercise
adaptation (Vellers et al., 2018). Specific genes responsible are yet to be identified,
but Bouchard (2012) suggested that a genomic predictor score based on alleles
carried at 21 single nucleotide polymorphisms may assist in identifying high and low
training responders. However, further confounding these claims, to date, only a few
genome-wide association studies have been published using V̇O2max response as a
trait, and all of these have been based upon the data collected from the HERITAGE
participants (Timmons et al., 2010, Bouchard et al., 2011, Ghosh et al., 2013).
2.4.1 Use of Siblings to Understand Heritability
Studies of siblings have been used to make inferences about the importance of
genetic influence in heritability (Simoneau et al., 1986), where the reported F-ratios
suggested 5-10 times more variance between twin pairs than within pairs. Similarly,
genetic determination has been claimed for several different aerobic performance
29
measures from the results of studies in which brothers, and monozygotic and
dizygotic twins were compared (Bouchard et al., 1986). The heritability for gains in
aerobic capacity elicited during these studies have previously been reported to be
estimated in the region of 50% (Bouchard et al., 1999, Bouchard et al., 2000,
Bouchard & Rankinen, 2001). However, while various polymorphisms are reported
to be associated with a phenotype increase, they account, individually, for only a
small proportion of the observed inter-individual variation in response to exercise
training when added to a working model for V̇O2max trainability (Sarzynski et al.,
2017).
2.4.2 Inter-Individual Variability of Maximal Oxygen Uptake in Response to
Exercise
It has been suggested that training studies consistently report a high variability in the
effects of regular exercise training (Hecksteden et al., 2018). While many
phenotypes have been investigated, V̇O2max response has often been a focus for
studies investigating claims of inter-individual variation in response to exercise.
Wide inter-individual differences in the trainability of the cardiorespiratory system
have been claimed for over 30 years (Lortie et al., 1984, Bouchard, 1995, Feitosa et
al.,2002). Individual differences in the response to standardized regular aerobic
exercise, measured as V̇O2max, have been reported in several studies in healthy
subjects (Lortie et al., 1984, Bouchard & Rankinen, 2001), in which mean changes
ranged from 10-15%, but inter-individual variation in response was reported to range
from no change to 40% (Bouchard, 1995, Bouchard & Rankinen, 2001, Hautala et
al., 2003, Hautala et al., 2006). However, such variation is consistent with the fact
that biochemical and physiological functions vary in all humans (Vollaard et al.,
2009). Nevertheless, these studies almost exclusively lack the crucial comparator
sample, with which to make formal comparison of the SDchange, or disregard the data
from such, therefore limiting the inferences that can be drawn from the pre-post
single group trials. Those that have included a comparator sample (Prud’homme et
al., 1984) have been shown to actually present more variation in the control sample,
in comparison to the intervention (Williamson et al., 2017). Given these
aforementioned claims of genetic background contributing to observed variation in
30
V̇O2max, it has recently been conceded that no specific genetic factors have been
identified that explain the differential response to exercise (Vellers et al., 2018).
2.4.2.1 Initial Claims
Several formative studies on this topic were conducted in the 1980s, with the aim of
identifying the inter-individual response to exercise. A further aim was to elucidate
genotype dependency of the inter-individual variation in response (Prud’homme et
al., 1984, Despres et al., 1984, Lortie et al., 1984, Savard et al., 1985, Bouchard et
al., 1986, Hamel et al., 1986, Simoneau et al., 1986). These studies are discussed at
length in Chapter 3.
2.4.2.2 Physiological and Molecular Factors at Play?
A recent review (Sparks, 2017) sought to provide insight into the physiological and
molecular factors surrounding the inter-individual variation in response to exercise
interventions and provide insight into some of the statistical issues in this area.
However, several inaccuracies can be identified, and these factors are crucial for
answering the fundamental question of whether there are ‘true’ and clinically
important individual differences in the response to exercise.
‘True’ inter-individual differences in response can be defined as inter-individual
variations in response that are not merely random trial-to-trial variability. Instead,
changes must be free of measurement error and random trial-to-trial within-subjects’
variability, and then anchored to a rational and justified threshold for the minimal
clinically important difference (MCID). It is also maintained that, in the ‘roadmap’
for researching this topic, true and clinically relevant individual response differences
should be confirmed empirically before any putative moderators and mediators of
the exercise response are explored (Atkinson & Batterham, 2015). The definition of
‘non-response’ given by these authors as “the lack of a difference between a control
and a treatment condition with respect to a specific variable” (Sparks, 2017) raises
concern, as it implies that non-responders can be identified by observing their data
from a two-condition (control and exercise) experiment and concluding that those
with a treatment-control difference of zero or less are ‘non-responders’. The fallacy
of this approach has been alluded to (Barker & Schofield, 2008), and a full account
31
of the pitfalls in non-responder identification has previously been provided
(Atkinson & Batterham, 2015, Schubert et al., 2014).
The observed response comprises the ‘true’ response in addition random trial-to-trial
within-subjects’ variability and measurement error (Atkinson & Batterham, 2015).
Therefore, observed non-response to exercise does not automatically mean that there
has been a true non-response. Random variability in biological measurements from
day-to-day or week–to-week is always present. It is, unfortunately, also essentially
uncontrollable. This component of variance on its own often appears to provide
evidence of inter-individual variation in exercise response, when in reality this is not
the case.
The optimal approach for quantifying individual response differences in repeated
trial studies has previously been described (Senn et al., 2011). This replicate
crossover design involves control and exercise conditions that are both administered
at least twice to each participant, usually in a balanced randomised sequence. Using
this approach allows the exercise/control x participant interaction term to be derived
from the statistical model (Senn et al., 2011), however this methodology can only be
employed for acute exercise interventions and creates an increased burden on
participants. This is an approach that had not been utilised in the exercise sciences
until the proof-of-concept reported in Chapter 6.
2.4.2.3 The METAPREDICT Study
A recent multi-centre RCT focused on the evaluation of a new time-efficient and
genuinely practical high-intensity interval training (HIIT) protocol in men and
women with pre-existing risk factors for type 2 diabetes in the METAPREDICT
study (Phillips et al., 2017), wherein participants were randomised to one of two
interventions or a control group.
Intervention groups comprised of 7 by 1 (n=31) undertaking three cycling sessions
per week for 6 weeks (2-min warm-u p at 50 W followed by seven sets of 1-min
high-intensity cycling work with 90 s recovery between sets), 5 by 1 (n=129), (2-min
warm-up at 50 W followed by five sets of 1 min high-intensity cycling work with 90
32
s recovery between sets), or a comparator group (n=11), which was described as
“serving to complement the short-term test–retest variability data collected in the
intervention groups at the two baseline sessions with “test–retest” data covering the
full duration of the study”.
Participants who showed responses large enough to surpass certain thresholds were
presented, in addition to the use of a regression model to describe the association
between measurements made at baseline and the magnitude of response. A
comparison of each individual is presented, with a range of apparent ‘true’
responses; however, this is absent the range of responses from the comparator
sample. It has previously been described how this approach fails to accurately
quantify the presence of ‘true’ inter-individual variation in intervention response
(Hopkins, 2015, Atkinson and Batterham, 2015). It is noted that this approach is
alluded to in the ‘Data Processing and Statistical Analysis’ section of the study.
However, the use of a paired t test to further describe p values for a test of statistical
significance is questioned; given these SDs are a single value, and not paired; this
approach is not grounded in statistical rigour, and within-group paired t-tests were
used in intervention(s) and control. This is bad practice in any analysis of trial data.
Additional questions regarding the authors inferences are presented when
considering that baseline data were not corrected for in analysis, where the use of
ANCOVA is preferential, in order to identify differences at baseline which may
account for any observed inter-individual variation.
These control data are reported to be either baseline 7-day variability data (n=201)
OR control data (n=11). Weighting of control data is obviously on the 7-day
reliability data, as only 6.5% of the control ‘cases’ were the comparator group
measured at the same baseline and follow-up (6 weeks). These data are also likely to
be associated with less within-subjects variability than that collected over the same
time frame as the intervention, leading to false impressions of individual variance.
There were substantially fewer subjects in the control sample, and this sample was
not even used in the analysis of group mean differences.
Whilst a meta-analysis is also reported to have been undertaken, involving
comparisons of SDchange with another SDchange from a previously published study,
33
these SDs were compared with a Levene’s test rather than the recently presented
calculation for quantification of inter-individual variation in response (Hopkins,
2015). By definition, this cannot be deemed a true meta-analysis, nor appropriate
comparison of ‘true’ inter-individual variation in response.
2.4.2.4 Sprint Interval Training and Inter-Individual Variation in Response
When comparing sprint interval training (SIT) with traditional endurance training, it
was recently observed that a prevalence of 22% of individuals were ‘non-responders’
to high intensity training protocols (Gurd et al., 2016). However, this combination
study reported on several investigations that were also lacking a control group with
which to compare intervention data. In addition, use of the previously described and
problematic use of 2 x TE as a threshold for ‘non-response’ limit the inferences
drawn from these findings. Similar findings of variability in magnitude of response
were reported following a crossover study comparing the adaptive response of SIT
and endurance training (Bonafiglia et al., 2016), however, it has been discussed how
crossover studies of this design are not without their own limitations, due to
unknown washout periods (Williamson et al., 2017). Whilst some authors have
claimed up to 55% of participants showed no improvements in V̇O2peak (Bakker et
al., 2017), a lack of comparator sample and low adherence to the exercise
intervention cast doubts upon these findings.
Contrastingly, reduced prevalence of ‘non-response’ was also reported following
high-volume interval training when compared to low volume SIT (Astorino &
Schubert, 2014), but use of changes greater than the CV to define response limit
these findings, given the lack of comparator sample and exclusion of random
measurement error from the observed change.
2.4.3 Quantifying Inter-Individual Variation in V̇O2max Response to Exercise –
A Summary
It is clear that concerns raised in regard to the methodological approach of much of
the body previous research have foundation (Hopkins, 2015, Atkinson & Batterham,
2015, Williamson et al., 2017). As is emphasised throughout this thesis, the
34
identification of factors that may explain inter-individual response variance should
come only after true, substantial inter-individual differences in response have been
demonstrated and quantified properly (Atkinson & Batterham, 2015, Williamson et
al., 2017). This quantification requires an appropriate control/ comparator group,
preferably within a randomised trial design. However, it is evident that much of the
published literature claims substantial treatment response heterogeneity based on
analyses of changes in outcome in a single intervention group with no inclusion of a
comparator sample in the research design, which would provide the required
counterfactual (Williamson et al., 2017).
2.5 Energy Balance and Body Weight
Weight loss is a complex trait, depending upon multifactorial influences such as
environmental, behavioural, and genetic factors (Deram & Villares, 2009). Indeed,
bodyweight regulation also been hypothesized to be dependent upon the axis of food
intake, body fat stores, nutrient turnover, and thermogenesis (Martinez & Fruhbeck,
1996, Jequier & Teppy, 1999), whilst also being dependent upon activity levels
(Dokken et al., 2007)
Current assumptions focus upon the genetic background and dietary and activity
habits (Martinez, 2000), such as habitual consumption of a high-fat diet being
associated with obesity. However, some individuals have followed identical diets
and remained lean (Macdiarmid et al., 1996). Diet, aerobic exercise, and a
combination of the two have previously been reported to be successful in producing
clinically worthwhile (>5%) bodyweight reduction (Donato et al. 1998), although
conversely it has been suggested that many studies fail to prescribe sufficient
exercise intensity, frequency, or duration to produce significant weight loss and
subsequently provide no benefit over diet only interventions (Washburn et al., 2014).
Although it has been a heavily promoted public health approach to combat obesity,
the role of exercise in weight management has previously been questioned. Exercise
has beneficial effects on all-cause mortality and cardiovascular disease risk well
above those interventions including nutritional interventions or supplementation
(Fiuza-Luces et al., 2013). While it is generally accepted that exercise is an
35
important factor in weight loss, its exact role in the mechanism of weight control is
still unclear (Myers et al., 2014).
The effect of aerobic exercise without dietary restriction on body mass has been
reported to elicit reductions, with losses of 1.5-3.0 kg typically reported over 3-18
months (Shaw et al., 2006). However, these findings must be taken with caution, due
to variety in study design, unsupervised exercise and self-reported adherence.
Greater reductions in body mass have been reported under controlled (often
laboratory) conditions when the exercise energy expenditure is larger (>2,000
kcal/week), or when exercise is combined with dietary restriction (Ross et al., 2000),
highlighting the importance of distinguishing between efficacy (the ability to bring
about intended change under ideal conditions) and effectiveness (the extent to which
change is achieved under ‘real world’ conditions). Regular aerobic exercise may be
efficacious for weight loss under controlled conditions, but it may not be effective in
the real world (due to poor adherence). This issue is explored further in Chapter 4.
2.5.1 Genetics and Body Weight
Given the prevalence of overweight and obesity, it is no surprise that efforts have
been made to utilise high-tech approaches to elicit answers (Cauldfield, 2015). It has
been suggested that genetic factors may contribute to some of the observed variation
in body fatness (Bouchard et al., 1985, Stunkard et al., 1986a, Stunkard et al.,
1986b, Barsh et al., 2000, Martinez, 2000, Marti et al., 2004), and weight loss in
response to dietary and surgical interventions (Kovolou et al., 2016, Resende et al.,
2018), with the FTO gene being the most predictive (Loos, 2012). However, even
this gene is only associated with a modest amount of increased body fatness. It has
been claimed that moderate to high heritability for obesity has been observed in
family, twin, and adoption studies (Hinney at el., 2010). Between 25-70% of
variation was reported to be hereditary in twin studies (Bouchard et al., 1985,
Cardon et al., 1994), although lower figures of 25-50% in family studies have
previously been reported (Stunkard et al., 1986a, Stunkard et al., 1986b). However,
other data generally do not support these claims, primarily underpinning the notion
that genetic associations generally have small effect sizes in ‘precision medicine’
interventions (Khoury & Galea, 2016). Indeed, all genomic markers identified have
36
only shown very small effects on both BMI and the risk of obesity (Tan et al., 2014).
Given these findings, identification of a highly predictive obesity gene or even a set
of genes has remained elusive. Considering this, monogenic causes of obesity are,
actually, rare (Ells et al., 2018), and it has been stated that decreased physical
activity is more likely to be the major contributing factor (Hill & Melanson, 1999),
with environmental factors likely affecting lifestyle choices, though the search for a
‘obesity gene’ continues (Whalley et al., 2009). The idea that we can blame genetics
for obesity is clearly flawed, as our genes are relatively unchanged for thousands of
years, whereas obesity prevalence has increased dramatically only recently. Rather,
it is likely environmental factors that provide a substantial contribution.
2.5.2 Inter-Individual Variability in Body Weight Response to Exercise
The concept of ‘personalized medicine’ in relation to the treatment of obesity has
been suggested to use genetic information to inform diet, exercise, and other weight
loss strategies (Agurs-Collins et al., 2008). Inter-individual variation in fat loss and
weight loss in response to exercise has previously been reported (Snyder et al., 1997,
Byrne et al., 2006, King et al., 2008, Caudwell et al., 2009, Church et al., 2009,
Barwell et al., 2009), resulting in a prevailing opinion that exercise often results in
less than expected weight loss (Donnelly & Smith, 2005). However, in a similar
approach to those studies previously discussed, these inferences are almost
exclusively drawn from studies lacking a control group.
An early study investigating chronic energy deficit in twins elicited by exercise, over
a four-month period, postulated the presence of large individual differences in
weight loss (Bouchard et al., 1994). These findings were presented in conjunction
with data indicating greater heterogeneity between twin pairs than within pairs.
However, it has previously been discussed how this approach may overestimate
heritability (Heller et al., 1993) and does not separate genetic from environmental
pathways (Maes et al., 1997).
37
2.5.2.1 Gender Based Differences in Response
Sex differences in exercise-mediated weight change have been reported (Ballor &
Keesey, 1991, Donnelly & Smith, 2005), possibly due to exercise-induced EI
suppression in males (Hall et al., 2011, Caudwell et al., 2012), compensatory eating
(Finlayson et al., 2009, Unick et al., 2010, Melanson et al., 2013, Hopkins et al.,
2014), and exercise intensity below that prescribed (Doucet et al., 1999). However,
differences in methods between studies causes problems in interpretation. It has been
cited that the reason for a sex difference is that women are better at defending body
weight and will therefore increase EI in response to EE. However, a recent
systematic review found this not to be the case (Caudwell et al., 2014), with a lack of
robust evidence demonstrating increased compensatory EI in women. In the
HERITAGE Family Study, men were reported to lose more weight than women and
children, and more fat than women, but no other gender differences were observed
(Wilmore et al., 1999). Overall, in studies with no control sample, evidence for a sex
effect on inter-individual variation in response to exercise in short-, medium-, and
long-term exercise trials is weak (Caudwell et al., 2014).
When exercise is matched, and EE is controlled, measured, and the same for both
sexes, similar changes are observed for weight loss (McTiernan et al., 2007, King et
al., 2010, Donnelly et al., 2013, Caudwell et al., 2012, Caudwell et al., 2014),
appetite suppression, and hormone regulation (Hagobian & Braun, 2010), though
large inter-individual variation in exercise-induced weight loss is still reported
(Caudwell et al., 2012). Again, these studies are lacking a control sample; therefore,
knowledge of the counterfactual is absent and these data should be interpreted with
caution. When a control sample is included, although not analysed in direct
comparison to the intervention, similar variation is observed in all conditions (e.g.
Church et al., 2009), (Fig. 1.).
2.5.2.2 Other Suggested Mechanisms
Differences in the response of weight loss among individuals have been reportedly
linked to variability in diet make-up (Senior et al., 2016), baseline respiratory
quotient (the ratio of fat to carbohydrate oxidation). These findings may indicate that
38
fat oxidation or the ability to increase fat oxidation in response to changes in energy
intake may affect individual weight loss (Barwell et al., 2009).
Inter-individual variability in weight loss following an exercise intervention has also
been attributed to sex-based differences in appetite hormones (Hagobain et al., 2008,
Hagobian et al., 2009, Hagobian & Braun, 2010) and the compliance with the
intervention (Manninen et al., 1998, Bruce et al., 2003). However, even with near
perfect compliance, underlying compensatory responses may also affect energy
balance (King et al., 2008), while in children, sex, age and baseline body fat, diet
have been postulated to be possible mechanisms (Barbeau et al., 1999).
For some, exercise is an unsuccessful method of weight control (King et al., 2008),
possibly due to compensatory behaviours counteracting the benefits of exercise
(King et al., 2007a, Finlayson et al., 2009, Rosenkilde et al., 2012), but as the
longer-term habitual day-to-day variability in EI and EE is as yet unclear (Stubbs et
al., 2004), the certainty of this belief could be questioned.
Compensatory adaptive mechanisms opposing negative energy balance (Stubbs et al.
2004) such as reduced metabolic rate or increased appetite (Rosendilke et al., 2012),
reductions in energy expended during spontaneous exercise (Goran & Poehlman,
1992) and partial EI compensation (Blundell et al., 2003, Hopkins et al., 2014) have
previously been noted; immediate compensatory increases in EI in response to EE
have recently been rejected (Hopkins et al., 2016) but persisting with exercise may
drive increased EI (Stubbs et al., 2002a, Stubbs et al., 2002b, Whybrow et al., 2008).
Evidence has been offered of increased motivation to eat following longer-term
energy deficit (Heini et al., 1998, Drapeau et al., 2007, King et al., 2007b). To
investigate this phenomenon, 35 overweight and obese participants undertook 12
weeks of exercise eliciting 500 kcal EE per session, 5 times per week (King et al.,
2008). While wide variability in weight (-14.7 to +1.7 kg) and fat (-9.5 to +2.6 kg)
changes were reported, linked to metabolic and/or behavioural adjustments, no
control sample was included. This key omission renders analysis of the spread of
change inaccurate, due to the lack of presentation of the standard deviation of the
change score for intervention vs control. Classification of ‘responders’ and ‘non-
39
responders’ dependent upon achieving prior weight loss targets is also an unsuitable
approach for quantifying the inter-individual variation in response.
2.6 Blood Pressure and the Effects of Exercise
Blood pressure is the product of cardiac output and total peripheral resistance
(Sabbahi et al., 2018). High blood pressure is a serious public health challenge
(Wolz et al., 2000), given that it affects 25% of the world’s population (Carpio-
Rivera et al., 2015). There is an association between blood pressure and all-cause
and cardiovascular mortality. According to the WHO Global Burden of Disease
report, high blood pressure is the leading single risk factor for global burden of
disease (Lim et al., 2012), although that is now challenged by diseases such as
diabetes (WHO, 2016), which contributed to over 1.5 million deaths in 2012.
2.6.1 Blood Pressure Reactivity
Acute psychological or physiological stress is associated with factors that explain a
number of cardiovascular related comorbidities, such as endothelial dysfunction,
oxidative stress, the development of atherosclerosis and inflammatory reactivity
(Huang et al., 2013). Although an increase in blood pressure is expected and a
normal physiological response to exercise (Yzaguirre et al., 2017), it is hypothesized
that the magnitude of cardiovascular reaction to stress is related to future blood
pressure status and cardiovascular disease (Carroll et al., 2011), with greater
reactivity predicting poor cardiovascular outcomes. An exaggerated systolic blood
pressure response of more than 180 mmHg during moderate submaximal exercise or
diastolic blood pressure of more than 95 mmHg during maximal exercise has been
suggested to be the best predictor of new-onset hypertension at 20 year follow up
(Yzaguirre et al., 2017).
There is currently little empirical research into the inter-individual variation in blood
pressure in response to exercise. However, it has been reported that males and
females, whilst utilising the same pathways for stress response, appear to do so with
a variation in results (Huang et al., 2013). Males often present larger chronic
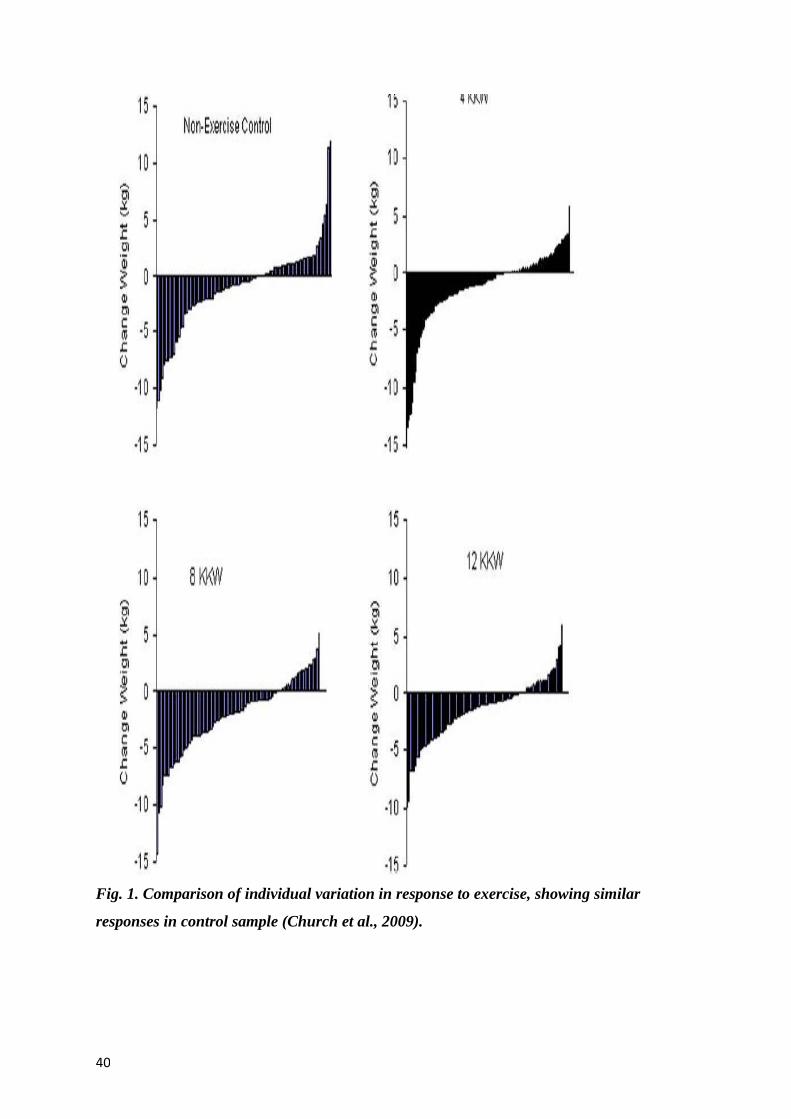
40
Fig. 1. Comparison of individual variation in response to exercise, showing similar
responses in control sample (Church et al., 2009).
41
2.6.1.1 Mechanisms for Gender Differences
diastolic blood pressure responses to acute exercise. This observation supports the
notion that that male responses are ‘vascular’ while female responses are ‘cardiac’
(Allen et al., 1993), though this has recently been countered with reports of
continued diastolic increase throughout life in both sexes. Whereas males show
consistently greater SBP and DBP until the sixth decade before a plateau in DBP by
the seventh, female peak DBP appears to catch up with, and surpass, that of males
(Sabbahi et al., 2018). Given cardiac output decreases with age, it may be that a
blunted vasodilatory response to exercise in females is responsible for this shift in
DBP (Sabbahi et al., 2018). Whilst these suggestions may explain chronic changes
and may be as a result of the ‘last bout’ effect (Plowman & Smith, 2007), no
published research is available regarding the acute inter-individual variation in blood
pressure response to exercise. These outcome measures are addressed in Chapter 5
(chronic blood pressure change) and Chapter 6 (acute blood pressure response to
high intensity aerobic exercise) of this thesis.
2.6.2 Heart Rate Response
Individuals with higher fitness levels appear to present a smaller magnitude of heart
rate reactivity response (Boutcher & Nugent, 1993), though the mechanisms are not
explicitly known at this time (Lambiase et al., 2013). Potential explanations may
come from the fact that exercise elicits noradrenaline release in a curvilinear manner
in response to increased workload and in combination with adrenaline (Rowell &
Shepherd, 1996) may be responsible for the magnitude of observed rise in exercise
heart rate and blood pressure.
2.6.3 Inter-Individual Variability of Blood Pressure and Heart Rate in Response
to Exercise
Little published evidence has alluded to the inter-individual variation in the response
of blood pressure to either acute or chronic exercise. In a short study investigating
the individual blood pressure response of 13 participants with peripheral arterial
disease, it was reported that only 8 patients had increases of greater than 4 mmHg in
at least one of two exercise (aerobic or resistance training) sessions (Lima et al.,
42
2015), suggesting a range of responses to the intervention. The mixture of
medication taken by participants adds a confounding variable not controlled for in
analysis.
It was recently suggested that while exercise may benefit the majority, blood
pressure adaptation may be heterogeneous in nature (Chen, 2010, Loenneke et al.,
2014), although this has been refuted, with a suggestion that the findings were the
result of contamination by the regression to the mean statistical artefact (Atkinson &
Taylor, 2011, Atkinson, 2015). Re-analysis of HERITAGE Family Study data was
also claimed to show 12.2% of the sample presenting adverse resting SBP response
to exercise (Bouchard et al., 2012). It has been proposed that these variations in
response are associated with gene polymorphisms (Mori et al., 2009). Those with
angiotensin-converting enzyme (ACE), apolipoprotein E (apoE), and lipoprotein
lipase (LPL) genotype variants (Hagberg et al., 1999) are likely positive responders
to exercise, possibly due to the role the renin-angiotensin system plays in the
regulation of blood pressure. A more recent genome-wide association study also
suggests thirty loci are responsible for heart rate response to exercise (Ramirez et al.,
2018); however, it is unknown whether these findings would hold true if the
individuals identified were exercised in an RCT-style intervention. There is currently
no empirical evidence regarding inter-individual variation in heart rate response to
acute exercise. Given the lack of research in this area, it is clear that this is a critical
physiological variable that has potential for deeper investigation.
2.7 True Inter-Individual Variability in Response to Exercise: Does it Exist?
Although decades of observations regarding inter-individual variability appear
convincing, superficially, the conclusions of the previously mentioned studies
assume that the variability in response for a trait is solely a consequence of exercise.
However, the individual variability often attributed to the intervention group
(treatment), can include numerous sources of variability such as measurement error,
random (biological and measurement) variability, between-subject variability (if
unadjusted for baseline), subject-by-treatment interaction and within-subject
variability.
43
A summary of the potential sources of variability are given in Table 1. The subject-
by treatment interaction, commonly known as the inter-individual variability in
response to treatment, represents the variability in differences of training response
between individuals. However, to adequately quantify the variability for the subject-
by-treatment interaction, confounding sources of variability should be considered. In
a parallel group RCT, we get the individual response variance by deduction. The
variance of the changes in the control around the mean change are made up of
between- (B) plus within-subjects (W) variance. The variance of the changes in the
treatment arm is given by B+W+R, where R is the true individual response variance.
Therefore, treatment minus control = (B+W+R) – (B + W) = R, by deduction,
assuming that in an RCT B and W are the same between groups. Only a replicate
crossover can fully partition the sources of variance, but that design may only be
applied to acute effects.
For these reasons, the early studies describing individual response to exercise have
been criticized by those who suggest that limitations in study design and analytical
approach confound the interpretation of data and the inferences drawn (Hopkins,
2015, Hecksteden et al., 2015, Atkinson & Batterham, 2015, Williamson et al.,
2017). Of primary concern, from a design perspective, is that these early studies did
not include a control group, and consequently could not account for the random
variability over time for the trait under study.
Furthermore, despite inclusion of a control group in some study designs, many
authors did not consider incorporating the control group data in their analysis
(Prud’homme et al., 1984, Sisson et al., 2009, Church et al., 2009, Ross et al.,
2015); therefore the ‘true’ variability in response is not adequately quantified.
2.8 Gaps in the Literature and Rationale for Further Research
Much attention has been given to the notion of individual responses, but it is clear
that several common limitations can be identified within many of the studies
investigating the inter-individual variation in response to an exercise intervention.
Almost exclusively in these studies, a control group is either absent or discarded in
the data analysis. As highlighted, the inclusion of data from a comparator group to
compare the inter-individual response to the given intervention is of principal
44
importance and has previously been emphasised (Atkinson & Batterham, 2015).
Without this, the resultant data analysis is largely inaccurate and potentially
misleading (Atkinson & Batterham, 2015), with measurement error and random or
biological variation in response to an intervention mistaken for true individual
differences in response (Leifer et al., 2015). Plots of individual differences in the
baseline-to-follow up change are often presented for the exercise training study arm
only (Sparks, 2017). Yet a very similar graph can usually be plotted for the baseline-
to-follow up change in the control group. This has been observed (Church et al.,
2009, Songsorn et al., 2016), but the resultant analysis of the control sample is often
lacking.
In an RCT, true individual differences in exercise response are present only if the SD
of change is substantially larger in the exercise group than the control group. If not,
the apparent individual differences in ‘response’ are nothing but baseline-to-follow
up within-subjects’ variability, which can be large if there are many weeks (>6)
between baseline and follow up in the study. This observation is common in most
studies. In a critical review of a selected sample of exercise training studies with
V̇O2max as the outcome, it was identified that very few studies included data from a
control group in their analyses. For those studies that had a control group, there was
little evidence that the difference in the SD of changes between intervention and
control was clinically important, relative to an MCID of 1 MET (Williamson et al.,
2017).
Determining whether there are true individual differences in the responses to
exercise that are large enough to be clinically relevant is a crucial platform for
precision medicine. If the individual differences in response are found to be not
clinically important, the need to proceed to explore individual moderators and
mediators of response is questioned, as such explorations could be wasteful in terms
of participant time and funding money.
Little research has employed this key aspect of methodology required for the
accurate quantification of inter-individual response. Despite many of the
aforementioned studies’ lack of comparator arm, they have provided the basis for a
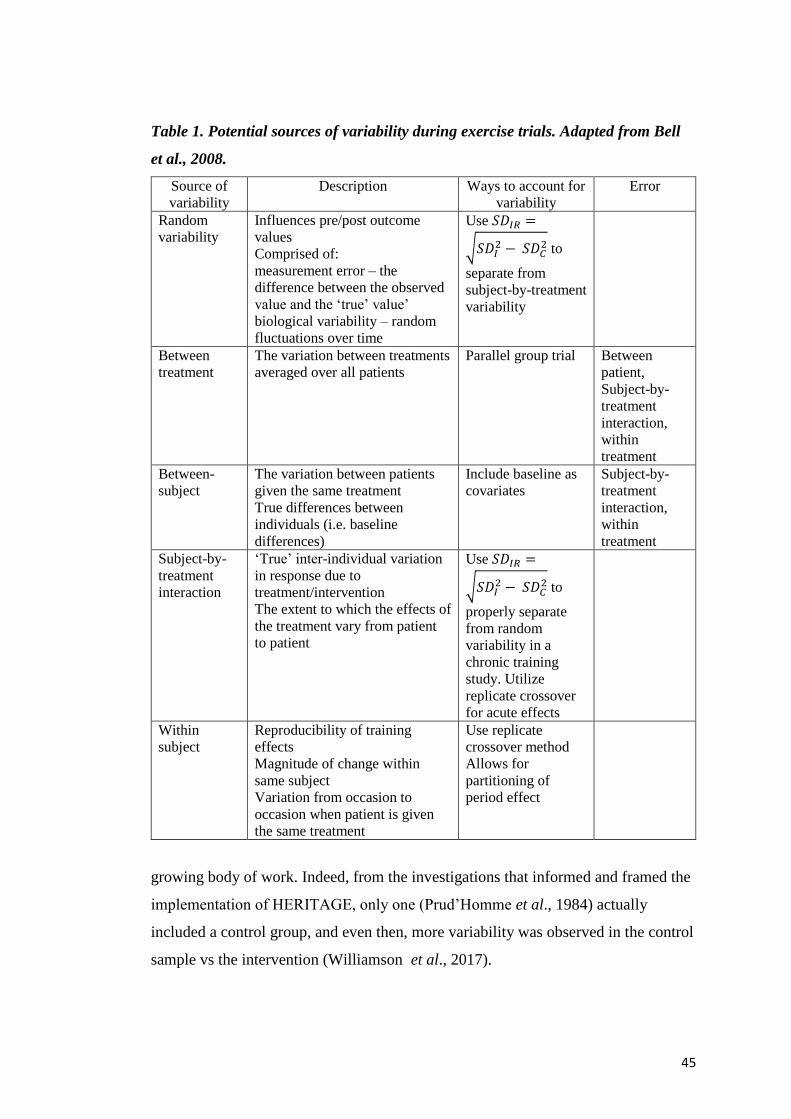
45
Table 1. Potential sources of variability during exercise trials. Adapted from Bell
et al., 2008.
Source of
variability
Description Ways to account for
variability
Error
Random
variability
Influences pre/post outcome
values
Comprised of:
measurement error – the
difference between the observed
value and the ‘true’ value’
biological variability – random
fluctuations over time
Use 𝑆𝐷𝐼𝑅 =
√𝑆𝐷𝐼2 − 𝑆𝐷𝐶
2 to
separate from
subject-by-treatment
variability
Between
treatment
The variation between treatments
averaged over all patients
Parallel group trial Between
patient,
Subject-by-
treatment
interaction,
within
treatment
Between-
subject
The variation between patients
given the same treatment
True differences between
individuals (i.e. baseline
differences)
Include baseline as
covariates
Subject-by-
treatment
interaction,
within
treatment
Subject-by-
treatment
interaction
‘True’ inter-individual variation
in response due to
treatment/intervention
The extent to which the effects of
the treatment vary from patient
to patient
Use 𝑆𝐷𝐼𝑅 =
√𝑆𝐷𝐼2 − 𝑆𝐷𝐶
2 to
properly separate
from random
variability in a
chronic training
study. Utilize
replicate crossover
for acute effects
Within
subject
Reproducibility of training
effects
Magnitude of change within
same subject
Variation from occasion to
occasion when patient is given
the same treatment
Use replicate
crossover method
Allows for
partitioning of
period effect
growing body of work. Indeed, from the investigations that informed and framed the
implementation of HERITAGE, only one (Prud’Homme et al., 1984) actually
included a control group, and even then, more variability was observed in the control
sample vs the intervention (Williamson et al., 2017).
46
Not all inter-individual response may be due to these aforementioned factors. Neither
does it confirm that this assumption of inter-individual difference in response is true
for any particular study (Atkinson & Batterham, 2015). Small day-to-day changes
cannot be classified as a worthwhile change, and the response must be clinically
relevant and more than the natural biological variation between baseline and follow-
up measurements (Scharhag-Rosenberger et al., 2012). Of course, patients differ not
only by genetics, but also by their personal history and environmental circumstances
(Senn, 2001), and this can lead to a multitude of effects on individual response.
There appears to be little doubt that the response to exercise training is influenced by
multiple factors, including those not discussed herein, such as psychosocial and
environmental.
The variability in the changes in an intervention group must be assessed against the
backdrop of this natural variability. In an RCT, the mean effect of the intervention is
given by the mean change in the intervention minus the mean change in the control.
This logic should be extended to the assessment of individual responses.
Therefore, the primary aim of this programme of work is to quantify the clinically
relevant inter-individual differences in the response to exercise training once
appropriate data analysis approaches are employed. It is evident that further research
is required to quantify ‘true’ inter-individual variation in response to exercise
interventions. If such variation is present, and represents a clinically meaningful
difference, identification of potential moderators and mediators would be of great
value to the personalization of exercise prescription. This research is important if we
are to understand the nature of ‘true’ inter-individual response to exercise, and to
further investigate the moderators and mediators of this heterogeneity of response.
47
Chapter 3: Inter-Individual Responses of Maximal Oxygen Uptake
to Exercise Training: A Critical Review
3.1 Preface
Given the review of the literature presented in Chapter 2, it is important that a
deeper, more critical review is undertaken in order to understand, and re-analyse,
previously published literature purporting to show inter-individual variation in the
response of maximal aerobic capacity to chronic exercise interventions. This chapter
takes a contructively critical view of much of the published literature, but also makes
the point that this area is critical for understanding the reasoning for employing a
robust approach to the quantification of inter-individual variation in response. This
chapter is based upon a peer-reviewed research paper, published in Sports
Medicine in (Williamson et al., 2017).
3.2 Introduction
Interest in the concept of individualised responses to an intervention as part of
‘personalised medicine’ and ‘precision care’ has been growing over the last 30 years
(Prud’homme et al., 1984, Despres et al., 1984, Lortie et al., 1984, Savard et al.,
1985, Hamel et al., 1986, Simoneau et al., 1986, Rose & Parfitt, 2007, Senn et al.,
2011, Bouchard, 2012a, Mann et al., 2014, Bouchard et al., 2015). In
pharmacogenetics, there has been particular interest in ‘tailor-made’ drugs and
therapies, based on the individual response of a patient and/or certain moderators and
mediators of that response (Spear et al., 2001, Senn et al., 2011). Personalised
medicine has also been considered in the context of inter-individual differences in
the response of health outcomes to various exercise interventions.
It has been highlighted that the majority of researchers focus upon ‘main effects’ and
mean group changes (Bouchard & Rankinen, 2001). These statistics are useful, but
do not allow us to distinguish between cases (Senn, 2004), may hide a wide range of
responses (Karavirta et al., 2011) and have previously been described as misleading
(Bouchard, 1983, Bouchard & Rankinen, 2001). True inter-individual differences in
48
the response to an intervention are less frequently reported, even though it has been
proposed that there is large inter-individual variability in response to physical
activity interventions (Prud’homme et al., 1984, Despres et al., 1984, Lortie et al.,
1984, Savard et al., 1985, Hamel et al., 1986, Simoneau et al., 1986, Bouchard &
Rankinen, 2001, Hautala et al., 2003)
Importantly, even in the studies in which inter-individual differences in the response
to exercise training are considered, concerns have been levelled at the designs and
analytical approaches in these studies (Hopkins, 2015, Atkinson & Batterham,
2015). Therefore, it is important at this time for the claims of inter-individual
differences in response to an exercise intervention, with a particular focus on
maximal oxygen uptake (V̇O2max), to be scrutinised in the context of these recent
criticisms. Consequently, I undertook this critical review on the HEalth, RIsk factors,
exercise Training And GEnetics (HERITAGE) Family Study, as well as the studies
that preceded it and the more recently published research. I will focus especially on
any apparent limitations of previously adopted data analysis approaches, and how
researchers have investigated potential moderators and mediators of the inter-
individual difference in V̇O2max response to an exercise intervention. Finally, I
present what I consider to be an appropriate trial design and analysis approach in
order to quantify true inter-individual differences in V̇O2max response to exercise
interventions. My focus in this regard is on parallel group randomised controlled
trials, as I believe that this design is more widely applicable to research questions
addressing chronic adaptations to training. Moreover, published chronic training
studies with V̇O2max as the outcome are exclusively before-and-after designs, either
with or without a control group, with a single intervention period. However, it is
acknowledged that other designs and statistical approaches have been proposed for
quantifying individual differences in response to treatments, primarily the
multiperiod (replicate) crossover design (Hecksteden et al., 2015, Senn, 2016).
3.3 Maximal Oxygen Uptake and Precision Medicine
Low cardiorespiratory fitness has been established as an independent predictor of all-
cause mortality and cardiovascular disease (Laukkanen et al., 2004, Sui et al., 2007).
Many researchers have highlighted the favourable changes in risk factors that occur
49
following a period of exercise training (Myers et al., 2002, Church et al., 2007,
Kelley & Kelley, 2008, Church et al., 2010). Given that one metabolic equivalent
(MET) is the amount of oxygen consumed whilst sitting at rest, and is ≈3.5 mL.kg-
1.min-1 (Jette et al., 1990), research that 1-MET increase in cardiorespiratory fitness
translates to a 12% reduction in cardiovascular disease and all-cause mortality risk
has been reported (Myers et al., 2002).
While a multitude of phenotypes have been investigated, V̇O2max response has often
been the focus for authors observing the inter-individual variation in response to
exercise. Wide inter-individual differences in the trainability of the cardiorespiratory
system have been claimed (Lortie et al., 1984, Bouchard, 1995, Feitosa et al., 2002),
with reports that the improvements in V̇O2max range from zero to a 40% increase
(Bouchard, 1995). Such variation is consistent with the fact that biochemical and
physiological functions vary in all humans (Vollard et al., 2009). Several researchers
have also reported that some individuals show little or no improvement in markers
such as lipolytic activity, insulin sensitivity, maximal work rate, submaximal
exercise heart rate and respiratory exchange rate following an exercise intervention
(Despres et al., 1984, Lortie et al., 1984, Savard et al., 1985, Hamel et al., 1986,
Simoneau et al., 1986). Conversely, it has been proposed that physical activity may
increase cardiovascular risk in some individuals, worsening risk factors beyond
measurement error and biological variation (Bouchard et al., 2012b), although this
notion is not consistent with the results of a more recent study, based upon the
cardiovascular markers monitored (Leifer et al., 2015), although differences in
thresholds for adverse response between these studies limit the comparisons that can
be drawn.
Prescription of exercise is often undertaken with a global approach rather than a
personalised one, and as exercise interventions are often utilized to reduce or prevent
age-related reduction in function or lifestyle related diseases, attention should be
paid to the response of each participant within a study (Kainulainen, 2009). If an
individual is likely to respond favourably to a given stimulus, he/she is more likely
to engage with that mode of exercise. Consequently, identifying individuals likely to
gain greatest benefit would allow practitioners to also focus on alternative exercise,
50
dietary or pharmacological options for those that may be less likely to respond
(Rankinen et al., 2010, Timmons et al., 2010).
3.4 A Critical Review of the Relevant Studies
Via a search of the relevant literature databases, I aimed to locate all the studies in
which inter-individual differences in the response of V̇O2max to an exercise
intervention have been considered. I was particularly interested in ascertaining how
many of these studies incorporated a relevant comparator sample into their design.
Data from this sample have been deemed to be important for precise quantification
and interpretation of inter-individual differences in response (Hopkins, 2015,
Atkinson & Batterham, 2015). Without these data, measurement error and random or
biological variation in the study outcome over time can compromise the
quantification of true inter-individual differences in response (Leifer et al., 2015).
Importantly, any physiological outcome can show substantial natural variability over
a 4-6-month follow-up period in a control sample that does not receive the
intervention (Leifer et al., 2015). This variation will also be present in the
intervention group, irrespective of the additional influence of the intervention itself.
3.4.1 Pre-HERITAGE Studies
The seminal studies on this topic were conducted in the 1980s, with the aim of
identifying the inter-individual response to exercise and to clarify the genotype
dependency of the modulation of response (Prud’homme et al., 1984, Despres et al.,
1984, Lortie et al., 1984, Savard et al., 1985, Hamel et al., 1986, Simoneau et al.,
1986) (Table 2). The effects of a 20-week endurance training programme on
maximal aerobic power (MAP), ventilatory aerobic threshold and ventilatory
anaerobic threshold in ten pairs of monozygotic twins were initially investigated
(Prud’homme et al., 1984). Unlike in later studies, a comparator (no-exercise
training) group was included in this study. From the intraclass correlations (ICC)
reported, the authors described a highly variable response to training and concluded
that sensitivity to training is genotype-dependent. The authors estimated that 20-25%
of training-induced variation in MAP was due to within-pair differences.
51
Nevertheless, using the approach recently described (Atkinson & Batterham, 2015),
re-analysis of the data presented in Table 1 of this study revealed that whist the mean
changes were 5.5 mL.kg-1.min-1 in the intervention and -0.6 mL.kg-1.min-1 in the
control, no clinically important differences in the SD of the change scores between
the groups (control ± 5.6 mL.kg-1.min-1, intervention ± 3.7 mL.kg-1.min-1). This
observation indicates that there are no substantial inter-individual differences in
response to the intervention (Atkinson & Batterham, 2015). In fact, these SDs
indicate greater variability in response in the control group versus the intervention
group. It has been previously argued that this phenomenon may be due to
imprecision in the estimation of inter-individual responses with inadequate sample
sizes and/or caused by the intervention having a ‘homogenizing’ effect on the
outcome variable, thus reducing the SD of the changes relative to the control group
(Atkinson & Batterham, 2015).
The point estimate for the true individual response variability (SDIR) for the above
data is -4.2 (90% confidence interval, -6.3 to 2.0) mL.kg-1.min-1 (calculated by
𝑆𝐷𝐼𝑅 = √𝑆𝐷𝐼2 − 𝑆𝐷𝐶
2), with the negative point estimate indicating more response
variability in control versus intervention. Note, however, that the upper limit of the
90% CI, which are calculated using the observed value (-4.2) plus or minus the
standard error times 1.65 (Hopkins, 2015), for the SDIR is 2 mL.kg-1.min-1 (implying
more variability in response in the intervention group). This indicates an
‘homogenising’ effect in the intervention sample. The SDIR should be doubled before
evaluating its magnitude to reflect a comparison between a typically high (mean +
SDIR) and typically low (mean – SDIR) responder (Hopkins, 2015). Modelling the
variances directly (quantifying the area under the curve for the distribution of SDIR
that is beyond 3.5 mL.kg-1.min-1), the probability that the true population effect for 2
x upper limit of the 90%CI of the SDIR (4 mL.kg-1.min-1) is greater than the
minimum clinically important difference (MCID) of 1 MET is only 6% (unlikely to
be clinically important). This analysis shows that, even allowing for the uncertainty
in the estimate of true individual response variability in small samples, the odds
are stacked against meaningful inter-individual differences in the response of
maximal oxygen uptake to exercise training.
52
Further research was undertaken (Despres et al., 1984, Lortie et al., 1984, Savard et
al., 1985, Hamel et al., 1986, Simoneau et al., 1986, Bouchard et al., 1986), with the
study authors claiming there to be large variations in response to exercise for a
number of phenotypes, including adipose tissue, fat cell weight, lipolytic activity,
glucose conversion into fat cell, triglycerides, skinfolds, percentage body fat,
anaerobic, alactic and lactic acid capabilities, fibre type, enzyme activity, sensitivity
of muscle characteristics and aerobic endurance performance. Crucially, no
comparator group was included in these studies.
A variation in improvement in maximal aerobic performance (V̇O2peak) of between
5 and 88% that was not correlated with a similarly wide range of 16-97% increases
in total work output accomplished in a 90-minute ergocycle performance test was
reported in one study (Lortie et al., 1984). Inter-individual responses were concluded
following the observation of greater between-pair variation than within-pair variation
in monozygotic twins, and through sex differences in those studies using mixed-sex
cohorts (Despres et al., 1984). Genotype dependent responses for both maximal
aerobic power and endurance performance were observed in conjunction with
skeletal muscle enzyme changes following a fifteen-week training programme
(Hamel et al., 1986), while inter-individual differences in anaerobic alactacid (ALC)
and lactacid (AAC) response, fibre type changes and enzyme activity were reported
in response to high intensity intermittent training (Simoneau et al., 1986). ALC and
enzyme activity were said to be determined by genotype, although no such
relationship was observed for other measured variables. The use of siblings was used
to make inferences about the importance of genetic influence in heritability, with F-
ratios suggesting 5-10 times more variance between twin pairs than within pairs.
Similarly, genetic determination has been claimed for several different aerobic
performance measures from the results of studies in which brothers, monozygotic
and dizygotic twins were compared (Bouchard et al., 1986). Changes in aerobic
fitness ranging from 0-58% were later reported among adults aged 60-71, where a
trend for older participants improving less than younger subjects was observed
(Kohrt et al., 1991).
The justification for the lack of a non-exercising control in the subsequent
HERITAGE Family Study, which appears to have been continued through
53
subsequent investigations, was an observation of mean values from previously
studied control groups remaining unchanged (Wilmore et al., 2001). However, a
finding of no substantial change in the mean for the control group can occur in the
face of substantial random within-subject variability in the changes in V̇O2max over
the duration of the study. The variability in the changes in the intervention group
must be assessed against the backdrop of this natural variability. In a randomised
controlled trial (RCT), the mean effect of the intervention is given by the mean
change in the intervention minus the mean change in the control. This logic should
be extended to the assessment of inter-individual responses to an exercise
intervention. In a parallel group RCT, one cannot say with 100% certainty whether
or not any specific individual in the intervention group is a positive responder, as
what would have happened to that person if, contrary to the fact, they had been in the
control group is unknown. This is the fundamental counterfactual basis of the RCT,
and whilst V̇O2max will not increase spontaneously, it may be impacted by changes
in body mass in the absence of changes in absolute aerobic capacity. However, if the
variance in the response in the intervention group is substantially greater than that in
the control arm, then true individual responses may be inferred. The control group
variability over the same time period as the intervention effectively provides our best
guess of the counterfactual - what would have happened to individuals in the
intervention group if they had been in the control arm. In parallel group RCTs,
substantially greater response variance in the intervention group versus control is
both necessary and sufficient for inferring true inter-individual differences in
response to the intervention. Assuming that sample estimates are accurate estimates
of the population values, it is incontrovertible that there must be a larger variance in
response in intervention vs. control if true individual differences exist in response to
treatment. Furthermore, although a parallel group RCT cannot isolate variance due to
subject-by-treatment interaction (Senn, 2016), in this design a greater response
variance in intervention vs. control is sufficient to infer inter-individual responses.
As described, for any individual in the intervention arm we can then derive the
probability of being a positive responder/ trivial responder/ or negative responder.

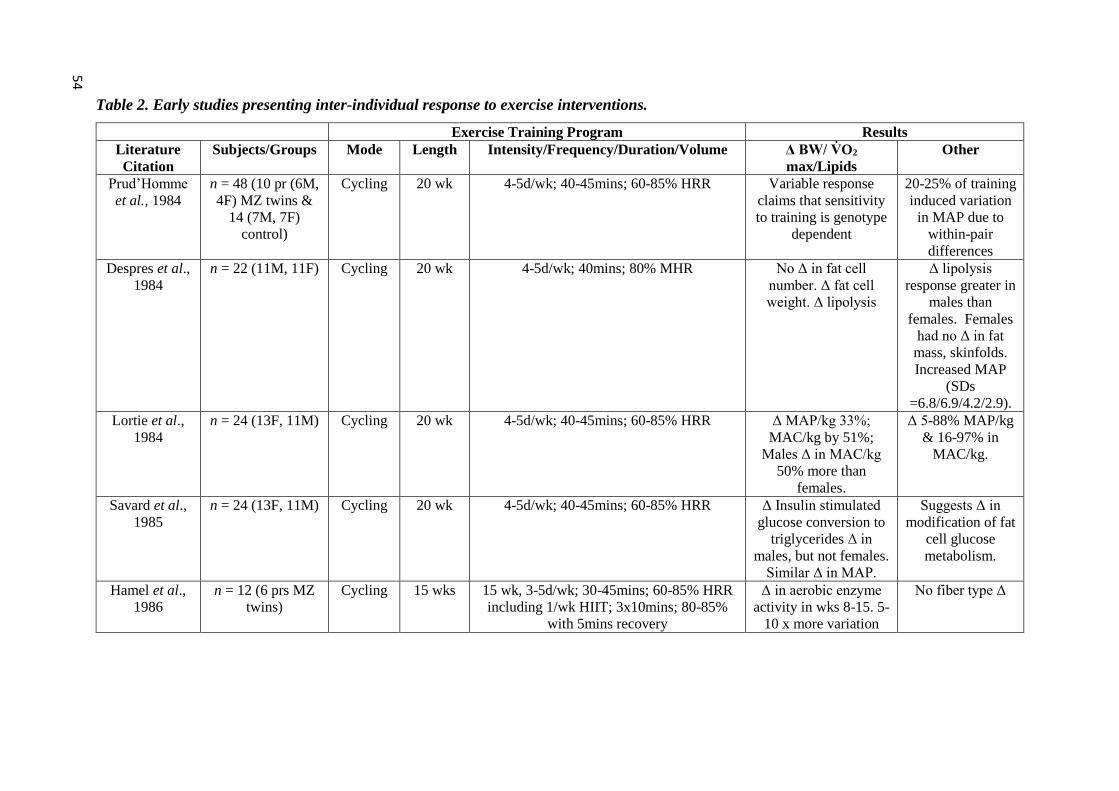
Table 2. Early studies presenting inter-individual response to exercise interventions.
Exercise Training Program Results
Literature
Citation
Subjects/Groups Mode Length Intensity/Frequency/Duration/Volume Δ BW/ V̇O2
max/Lipids
Other
Prud’Homme
et al., 1984
n = 48 (10 pr (6M,
4F) MZ twins &
14 (7M, 7F)
control)
Cycling 20 wk 4-5d/wk; 40-45mins; 60-85% HRR Variable response
claims that sensitivity
to training is genotype
dependent
20-25% of training
induced variation
in MAP due to
within-pair
differences
Despres et al.,
1984
n = 22 (11M, 11F) Cycling 20 wk 4-5d/wk; 40mins; 80% MHR No Δ in fat cell
number. Δ fat cell
weight. Δ lipolysis
Δ lipolysis
response greater in
males than
females. Females
had no Δ in fat
mass, skinfolds.
Increased MAP
(SDs
=6.8/6.9/4.2/2.9).
Lortie et al.,
1984
n = 24 (13F, 11M) Cycling 20 wk 4-5d/wk; 40-45mins; 60-85% HRR Δ MAP/kg 33%;
MAC/kg by 51%;
Males Δ in MAC/kg
50% more than
females.
Δ 5-88% MAP/kg
& 16-97% in
MAC/kg.
Savard et al.,
1985
n = 24 (13F, 11M) Cycling 20 wk 4-5d/wk; 40-45mins; 60-85% HRR Δ Insulin stimulated
glucose conversion to
triglycerides Δ in
males, but not females.
Similar Δ in MAP.
Suggests Δ in
modification of fat
cell glucose
metabolism.
Hamel et al.,
1986
n = 12 (6 prs MZ
twins)
Cycling 15 wks 15 wk, 3-5d/wk; 30-45mins; 60-85% HRR
including 1/wk HIIT; 3x10mins; 80-85%
with 5mins recovery
Δ in aerobic enzyme
activity in wks 8-15. 5-
10 x more variation
No fiber type Δ
54
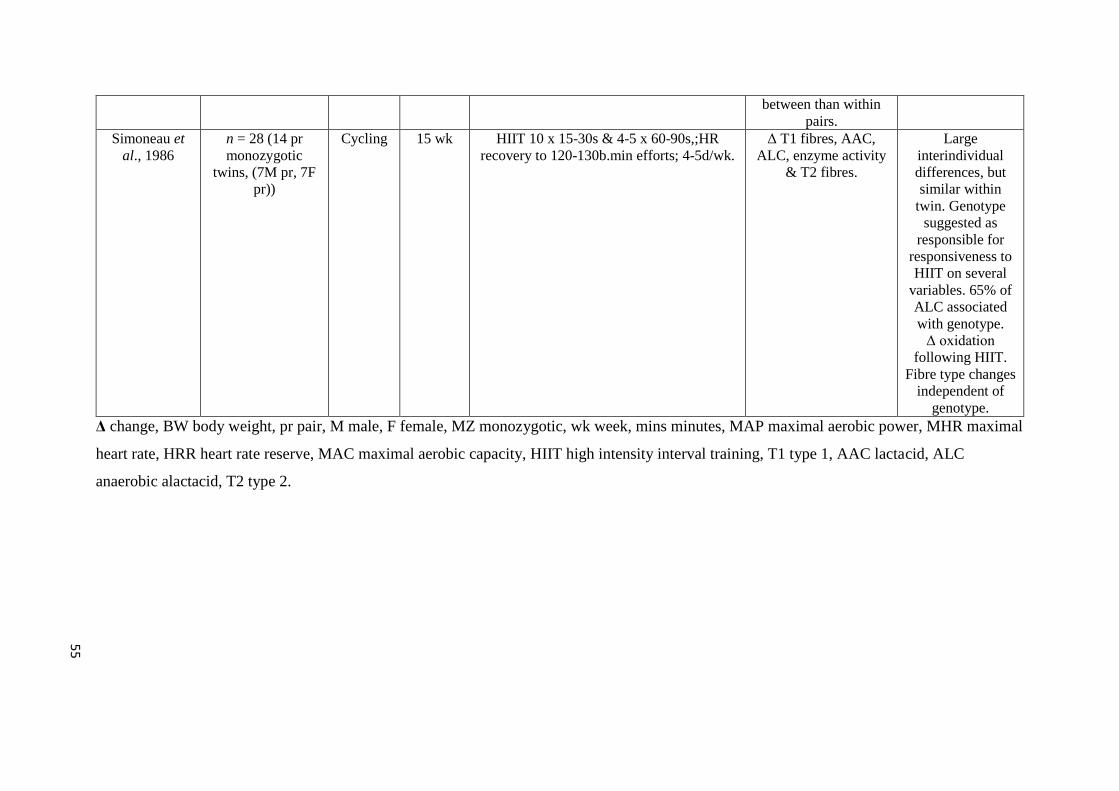
between than within
pairs.
Simoneau et
al., 1986
n = 28 (14 pr
monozygotic
twins, (7M pr, 7F
pr))
Cycling 15 wk HIIT 10 x 15-30s & 4-5 x 60-90s,;HR
recovery to 120-130b.min efforts; 4-5d/wk.
Δ T1 fibres, AAC,
ALC, enzyme activity
& T2 fibres.
Large
interindividual
differences, but
similar within
twin. Genotype
suggested as
responsible for
responsiveness to
HIIT on several
variables. 65% of
ALC associated
with genotype.
Δ oxidation
following HIIT.
Fibre type changes
independent of
genotype.
Δ change, BW body weight, pr pair, M male, F female, MZ monozygotic, wk week, mins minutes, MAP maximal aerobic power, MHR maximal
heart rate, HRR heart rate reserve, MAC maximal aerobic capacity, HIIT high intensity interval training, T1 type 1, AAC lactacid, ALC
anaerobic alactacid, T2 type 2.
55

56
3.4.2 Recent Studies
Six to nine times more variance in V̇O2max response between monozygotic twin
pairs than within pairs has been reported (Bouchard et al., 2000). This and other
studies were described as ‘standardized and carefully monitored’ (Bouchard, 2012a),
with a ‘careful and constant program of quality control and assurance’ (Gagnon et
al., 1996); yet still lack a suitable comparator sample. Nevertheless, RCTs are not
only relevant to the investigation of main effects (Hecksteden et al., 2015). Use of
the intervention-only arm as a basis for analysis is problematic, as similar or even
greater variability of changes may also be observed in a control group, as was the
case when a previous study was re-examined (Prud’homme et al., 1984). I fear that
too much emphasis has been placed on gene relationship statistics without answering
the initial and crucial question of whether clinically-relevant inter-individual
differences in response exist. This question is answered by calculating the difference
in baseline to follow-up variability between intervention and comparator groups and
comparing this difference to a rationalised MCID (Atkinson & Batterham, 2015).
More recently, large variations in V̇O2max response to exercise were reported in the
large-scale Dose-Response to Exercise in Women (DREW) Study (Sisson et al.,
2009). A decrease in the prevalence of non-response with increased training volume
was also observed. The authors reported a large amount of inter-individual
variability (-33.2 to 76.0% change), citing baseline V̇O2max, age and training
volume as predictors of non-response. The study comprised three intervention
groups (4, 8 and 12 kcal/kg per week of exercise) alongside a control group, with a
stated purpose of the analysis to examine the determinants of change in V̇O2max in
response to exercise training. However, the decision to exclude the control group
from the analysis compromised the correct quantification of the true inter-individual
response and missed potentially vital information. Further work from the DREW
study reported that 30% of participants experienced no improvement in V̇O2peak
(Pandey et al., 2015). However, once again, no control group data were studied.
Recent studies have been undertaken to further identify possible genotype or
phenotype interactions responsible for moderating the magnitude of inter-individual
response (Hautala et al., 2003, Karavirta et al., 2011, Ross et al., 2015). Large
57
variation in training response to an eight-week aerobic endurance training
intervention was reported (Hautala et al., 2003). Interestingly, whilst a control group
was used, the baseline to follow-up changes in this group were not used for
comparison at all. Disregarding the control group in this manner, on the basis that
there will be no mean change, and/or the short-term test-retest reliability is high, is
an approach that has limitations. Differences in response were observed by dividing
the intervention group responses by quartile, rather than retaining a continuous
variable; this approach discards information and has previously been reported to be
an inadequate analysis method in epidemiology (Benette & Vickers, 2012). I found
that, during my re-analysis of these data, in contrast to the authors’ assertion of the
differential effects of the sympathetic nervous system on the responses to the training
protocol, it appears that there may be little true difference in the variation (SDchange)
between each of the ‘response’ groups (SDchange range 1-2 mL.kg-1.min-1).
3.4.3 Concurrent Training
Investigations into the inter-individual responses to combined endurance and
strength training in young (Hautala et al., 2006) and older adults (Karavirta et al.,
2011) have also been undertaken. The findings of these studies are in general
agreement with much of the previously published literature, in that a range of
training responses were observed. Nevertheless, as in an earlier study (Prud’homme
et al., 1984), a control group was included in one study (Karavirta et al., 2011) but
no specific comparison was made. It is also apparent from the responses reported in
Figure 1 of this investigation (Karavirta et al., 2011) that similar variation in
response exists in the control group as in the experimental groups, reinforcing the
view that there is similar variability of baseline to follow-up changes across all
groups. The participants in another study acted as their own control in a crossover
trial (Hautala et al., 2006), however, the residual training effect of the intervention
period on the response following the washout period is unknown.
3.4.4 Biological Variability
Not all inter-individual response may be due to the factors postulated in the studies
reviewed within this article. Neither does variation in responses confirm that this
58
assumption of inter-individual difference in response is true for any particular study
(Atkinson & Batterham, 2015). Small day-to-day changes cannot be classified as a
worthwhile change, and the response must be clinically relevant and more than the
natural biological variation between baseline and follow-up measurements
(Scharhag-Rosenberger et al., 2012). Of course, patients differ not only by genetics,
but also by their personal history and environmental circumstances (Senn, 2001), and
this can lead to a multitude of effects on inter-individual response. There appears to
be little doubt that the response to exercise training is influenced by multiple factors.
A new focus on the quantification of true inter-individual differences and the
moderators and mediators responsible may, therefore, have substantial clinical
relevance, with any correctly quantified heterogeneity affording the opportunity to
identify possible molecular determinants (Bouchard et al., 1999). Indeed, RNA
profiling may be a potential methodology for capturing information critical to
informing the integrated physiological response and molecular determinants
(Timmons et al., 2010), once the presence of inter-individual variation in response
has been confirmed.
3.4.5 Identifying ‘Responders’ and ‘Non-Responders’
A further limitation of much of the previous research is the classification of
individuals as ‘non-responders’ (Bouchard et al., 1999, Skinner et al., 2001) without
first defining the term, although this has been partially addressed more recently when
defined as those improving by ‘less than the natural biological variability of the
selected variable’ (Scharhag-Rosenberger et al., 2012). Strictly, a positive response
should be defined as an increase that is greater than the MCID. For V̇O2max, for
example, the MCID could be defined as 1 MET, anchored to a clinically relevant
relative risk reduction for all-cause mortality of around 12% for this value (Myers et
al., 2002). For a given individual, the observed change in V̇O2max after the
intervention can be combined with knowledge of the natural random variation of
V̇O2max over the same time period (from a control group or similar reliability study)
to derive the probability that this individual’s true response is greater than the MCID
(Hopkins, 2015). We can then more properly describe each individual in the
59
intervention as, for example, ‘likely to be a responder’, ‘very unlikely to be a
responder’, ‘possibly negative responder’, and so on.
Similarly to previous reports (Sisson et al., 2009), further argument for the dose-
response to exercise is observed when greater exercise volume (Pandey et al., 2015)
or intensity (Ross et al., 2015) was associated with reduced chances of being
classified as a non-responder. While direct comparison between studies is not
straightforward, these and similar findings suggest that some people may be more
sensitive to dose prescription of exercise, as opposed to being non-responsive. If this
is the case, effective identification of dose requirement or requirement for
multimodal approaches such as concurrent training may provide a capability for
enhancing the efficacy of an intervention (Buford et al., 2013). However, as is
covered in this review, I suggest that an individual cannot be categorically defined as
a ‘responder’ or other such descriptor; merely a probability (percentage chance) that
they are such can be applied to each individual (Hopkins, 2015). Even with this
information, in a single-period before-and-after study design, this process can only
occur in the presence of an appropriate comparator group assessed over the same or
very similar time period as the exercise intervention.
3.4.6 The HERITAGE Family Study
The large-scale, longitudinal, multicentre HERITAGE Family Study was initiated to
investigate and identify the role of genotype in cardiovascular, metabolic and
hormonal responses to a 20-week aerobic exercise training programme (Bouchard et
al., 1995). The contribution of regular exercise to changes in cardiovascular disease
(CVD) and diabetes mellitus risk factors was also investigated (Bouchard et al.,
1995, Gagnon et al., 1996). To date, 186 separate publications have resulted from the
study, with some of these involving the comparison of various familial relationships
to determine the relative importance of genetics (Bouchard et al., 2000, Perusse et
al., 2000, Bouchard et al., 2011). The bulk of the research undertaken during
HERITAGE asserts that there are no genotype-specific covariate effects on V̇O2max
response, such as age, sex or weight (Bouchard & Rankinen, 2001, Skinner et al.,
2001, Feitosa et al., 2002). Familial aggregation was reported in response to
maximal (Lortie et al., 1984, Bouchard et al., 1998, Bouchard et al., 1999) and
60
submaximal (Gaskill et al., 2001, Perusse et al., 2001) aerobic training, with two and
a half times more variance reported between than within families for the V̇O2max
response.
A genetic contribution to this variance of approximately 47% has been reported
(Bouchard et al., 1999, Bouchard et al., 2011). These data were characterized by a
strong maternal aggregation (Bouchard et al., 1998, Bouchard et al., 1999, Perusse et
al., 2001), with shared environmental factors also contributing to the observed
heritabilities. The mechanisms underpinning this variance are unclear, but
suggestions of genetic contribution from mitochondrial DNA (Bouchard et al., 1999)
or expression of genes inherited from the mother have been presented (Perusse et al.,
2001). Correlations between spouses have led to familial environmental factors also
being postulated as responsible for some of the variance observed in response to
exercise (Perusse et al., 2001, Bouchard et al., 1998, Montoye & Gayle, 1978,
Lesage et al., 1985); however, the correlations presented are small (r=0.14-0.26),
therefore posing, rather than answering, further questions on this issue. The crucial
question that is, again, unanswered in the absence of a comparator group is whether
there are genetic influences on individual magnitude of random within-subjects
variability. If this is known, then these genetic influences could be quantified.
In HERITAGE studies, it is claimed that there is considerable variation in response.
Nevertheless, it remains unclear as to whether it was the same individuals that
showed no response for all measures, or if each individual showed differing response
characteristics across the spectrum of physiological markers investigated. Recent
research has attempted to elucidate this issue, observing improvements in at least one
measured variable in every individual (Scharhag-Rosenberger et al., 2012), though
again, this study is limited by the lack of a control group with which to compare the
inter-individual response. Interestingly, despite methodological concerns, individuals
with the highest response to endurance training have also shown high response to
resistance training, but the reverse was not true (Hautala et al., 2006). This area
opens up future avenues in which to investigate the magnitude of response, in the
presence of proper initial quantification through comparison with a suitable
comparator sample.
61
3.4.7 Twin Studies
Previously noted criticisms of twin studies point to the fact that they may not
necessarily separate genetic from environmental pathways (Maes et al., 1997).
Presentation of evidence of genetic variance of numerous phenotypes through greater
between-twin pair variance than within-pair variance is often reported through the
use of ICCs (Prud’homme et al., 1984, Hamel et al., 1985, Timmons et al., 2010,
Poelhman et al., 1986, Bouchard et al., 1986, Heller et al., 1993, Bouchard et al.,
1994, Hong et al., 1997, Tremblay et al., 1997) (Table 3). These observations are
highly sample-specific, and a comparison of the ICC between studies is not without
difficulty, due to the heterogeneity of samples. The potential for ICCs in twin studies
to overestimate heritability has also been highlighted in that genetic and
environmental factors have not been adequately separated (Heller et al., 1993).
It is as yet unknown as to whether any relationship between genes and phenotype is
even linear (Maes et al., 1997) and while genetic variation is not denied in this
review, it is not clear that all observed variance is genetic (Senn, 2001). I believe that
when analysing such a design, it would be more appropriate to use data from a
relevant control (no-exercise) sample and a linear mixed model in order to correctly
quantify the influence of genetics on magnitude of response. Associations could then
be presented as a regression coefficient in the units of measurement, rather than a
comparison of correlation values. In this way, the clinical importance of any
association can be inferred. Common underlying environmental effects have also
been proposed as being underestimated due to study design or low statistical power
(Segal & Allison, 2002). Adoption studies combined with twin studies to compare
identical and fraternal twins and twins reared apart (Heller et al., 1993) and repeated
assessments (Hecksteden et al., 2015) may be required to quantify some of these
issues.
3.4.8 Baseline Correlation of Changes
Several authors of HERITAGE studies correlated each individual’s baseline score
with the follow-up change to attempt to determine the contribution of baseline status
to the inter-individual response to exercise training. From such analyses, it has also
62
been reported that age, sex, fat mass, fat-free mass, weight and race have little or no
impact upon the inter-individual response to training or covariate effect (Bouchard &
Rankinen, 2001, Feitosa et al., 2002), and that the initial level of the phenotype was
a major determinant of the magnitude of response in some cases (Bouchard &
Rankinen, 2001). Nevertheless, this correlation approach has been questioned, due to
regression to the mean and mathematical coupling influences (Chiolero et al., 2013).
Linear mixed effects modelling and other methods such as computing regression to
the mean slopes and then adjusting for the random error in initial measurement, as
previously reported (Blomqvist & Svardsudd, 1978), have been purported to be
superior to this simple correlation approach (Chiolero et al., 2013).
3.4.9 Testing Quality Control
The HERITAGE intervention was described as having a careful and constant
program of quality control and quality assurance (Gagnon et al., 1996).
Nevertheless, this claim was based on the test-retest mean differences being small,
although the selection of either an average of two V̇O2max test scores (where
coefficient of variation (CV) was less than 5% between the two) or the higher score
(if CV was greater than 5% between the two) at both baseline and follow-up
(Shephard et al., 2004) could have led to inconsistent data. To accurately analyse the
data, identical methodology should ideally be used for all participants. Test-retest
reliability was reported to be 4.1-5.0% and ICCs of 0.96 to 0.97 were reported over a
period of two days (Shephard et al., 2004) and two weeks (Skinner et al., 1999),
implying adequate short-term reproducibility. It is my belief that reproducibility
needs to be assessed over a longer period, preferably matching the length of the
intervention, in order to estimate the true extent of longer-term within-subject
variation. A better alternative is to use an RCT design, wherein the control group in
effect acts as the perfect contemporaneous reliability study. Each of the
investigations discussed have contained a single application of an intervention
(single period before-and-after study). It is reiterated that the primary limitation of
the parallel group RCT design in permitting the quantification of inter-individual
variation in treatment response is that it does not allow the isolation of the variance
due to true subject-by-treatment interaction (Senn, 2016). In this design, the SD for
inter-individual responses – although free from random error - includes the subject-
63
by-treatment interaction plus any within-subject variability in treatment response
introduced by the intervention (Hecksteden et al., 2015). Indeed, the multiperiod
(replicate) crossover study, in which participants are randomised to sequences in
which they receive both the intervention and comparator treatments in at least two
periods each, is the only design that can identify variance between-treatments,
between-subjects, and the subject-by-treatment interaction (Hecksteden et al., 2015).
However, the primary limitation of the replicate crossover, in the context of chronic
training studies, is the long and uncertain washout periods required and hence
potentially substantial carryover effects (Hopkins, 2015).
The authors of a recent investigation into the cardiac determinants of individual
response in change in aerobic fitness after a moderate intensity exercise intervention
(Pandey et al., 2015) stated that they incorporated ‘well-controlled exercise trials’ in
keeping with the HERITAGE study. Nevertheless, ‘well-controlled’ appears to refer
to relatively short-term repeatability of measurements (over a few days) rather than
the within-subjects variability in measurements over the duration of the intervention
(a few months). Just because a measurement method has good short-term
repeatability does not rectify the problem of lack of a control group, which must be
employed in order to make a formal comparison of the variability of the change
scores in intervention vs. control groups.
Consequently, the inclusion of data from studies such as these is potentially
misleading, and as such, participants from these studies that have been termed
‘responders’ and ‘non-responders’ may have been selected for further investigation
as to the potential moderators and mediators of the inter-individual response, when it
may be nothing other than their natural biological variation that has been measured.
3.4.10 N-of-1 Trials
In pharmacogenetics, n-of-1 trials have been proposed (Guyatt et al., 1990, Lillie et
al., 2011), but these single-subject trial studies have previously been linked to
controversial issues in clinical investigation, such as carryover effects and the
presupposition of patient-by-treatment interaction, which requires random effects
modelling (Senn, 1993), that may confound the effectiveness of interventions. Of
64
course, if a number of n-of-1 trials are carried out, then the combined data effectively
equates to the repeated period crossover design proposed by Hecksteden et al.
(2015). It has also been proposed that n-of-1 data with a limited observation count
per participant may not be compatible with statistical models that aim to identify the
inter-individual response and may be preferential for estimating the population effect
(Zucker et al., 2010).
3.5 A Road Map for Future Study Designs and Analyses
Recently, for both parallel group and replicate crossover designs, more appropriate
and robust statistical approaches have been forwarded for the quantification of true
inter-individual response to a treatment. Relevant sources of variability must first be
quantified (Hecksteden et al., 2015) before any exploration is undertaken of the true
inter-individual variation in treatment response. Additionally, without knowledge of
the smallest worthwhile change or the MCID, no substantial inter-individual
differences in V̇O2max response to an exercise intervention can be claimed. When
analysing the collected data from a parallel group RCT, it has been proposed that
comparing the standard deviation of the intervention arm of the study against the
standard deviation of the comparator arm, using 𝑆𝐷𝐼𝑅 = √𝑆𝐷𝐼2 − 𝑆𝐷𝐶
2, where IR =
inter-individual responses, I= the intervention sample SD and C = the comparator
sample SD (Hopkins, 2015, Atkinson & Batterham, 2015), provides a more accurate
statistical analysis of the presence of inter-individual differences in response. If
appropriate clinical inferences are to be made about the magnitude of change and
any inter-individual response to the intervention then standard deviations, confidence
intervals, effect sizes and magnitude-based inferences should also be interpreted
(Hopkins, 2015, Batterham & Hopkins, 2006). Using a custom spreadsheet
(Hopkins, 2000), and with knowledge of the typical error over the same timeframe as
the intervention and the smallest worthwhile change, the probability (percentage
chance) of each individual being classified as ‘very likely’, ‘likely’, ‘possibly’,
‘possibly not’, ‘unlikely’ and ‘very unlikely’ to be a responder can be calculated.
This is a more robust approach, as the standard parallel arm study design renders the
definitive identification of specific individuals as non-responders impossible (Leifer
65
et al., 2015) and, despite recent criticisms (Sainani, 2018), magnitude-based
inferences are a valuable advance on hull hypothesis significance testing (Hopkins &
Batterham, 2018). For instance, individuals could be termed likely ‘positive’
responders if the individual probabilities were above 0.75 (75% chance, or odds of
3:1 in favour) and the converse for ‘negative’ responders. A finding of substantial
clinically relevant inter-individual differences in response to the intervention would
justify further investigation of potential moderators and mediators, using more
advanced statistical modelling.
If we consider the original pre-HERITAGE study (Prud’homme et al., 1984), the
mean V̇O2max improvement in the exercise intervention group was
5.5 (± 3.7) mL.kg-1.min-1 and the change in the control group was -0.6 (± 5.6) mL.kg-
1.min-1. The pooled between-subjects SD for V̇O2max at baseline was 5.9 mL.kg-
1.min-1. If we define a ‘responder’ by an improvement of 1 MET, an individual
would be required to improve by 7.4 mL.kg-1.min-1 (i.e. approximately 1.25 SDs) for
the probability of being a true responder to be 0.75. To increase confidence, using a
probability of 0.95 (i.e. ‘very likely’ to be a responder), the individual would be
required to improve by 13.5 mL.kg-1.min-1, or more than 2 SDs. Therefore, an
individual who showed an improvement of, say, 5 mL.kg-1.min-1 (a figure above the
clinically relevant threshold for a responder of 1 MET) would have a probability of
0.60 of being a true responder. Obviously, in this case, this is little better than
chance. These figures demonstrate that an individual would be required to improve
their V̇O2max substantially more than the MCID (i.e. 1 MET) in order to be deemed
likely or very likely to be a responder. This is in stark contrast to the practice of
classification of any individual showing improvement of 3.5 mL.kg-1.min-1 (1 MET)
or more as a definite responder. Assuming normal distribution of the changes in the
control group and a MCID of 1 MET, the mean and SD reveal that 23% of the
control group would be expected to ‘improve’ by more than 1 MET and would be
labelled conventionally as ‘positive responders’. These apparent positive responses
in the control are due to the random variation in V̇O2max over a 20-week period. As
highlighted, the SD of the change scores in each group reveal that there are no
substantial inter-individual responses in the intervention group (vs. control), and any
further investigation of the mechanisms underpinning inter-individual response from
this study is therefore unwarranted.
66
In contrast to my proposed approach, it has been argued that a large-scale
multiperiod crossover training study approach is a more robust method of predicting
training response (Hecksteden et al., 2015). This approach, however, presents a
number of challenges. Given the difficulties of recruiting the sample size required
for a large-scale training study, this type of study is likely to be statistically
underpowered, while the time required to run a training intervention study, complete
with washout periods, is highly restrictive. The crossover trial methodology might
also have less relevance in training studies than in pharmacological research, as the
effectiveness of any washout period is unknown, and may diminish training related
effects. This approach has been previously utilised through the use of a two-month
washout period subsequent to a two-week intervention (Hautala et al., 2006), but the
effects of the previous training intervention cannot be controlled for, and therefore
each participant is potentially beginning from a different baseline. Unlike in
pharmacological studies, where the washout period for specific drugs is defined as
some multiple of the drug’s half-life, it cannot be stated with any certainty that a
previous period of training or an exercise intervention has not changed the individual
at the cellular or neuromuscular level. This problem leads to a sample that is not
acting as its own control, and therefore presents potential differences at baseline for
each intervention period. The multiperiod crossover design might be more applicable
to the investigation of acute effects of short-term interventions (Karavirta et al.,
2011). There are also a multitude of sources of variability that create challenges in
identifying true inter-individual differences in response in any research design, such
as maturation, diet modulation, disease, lifestyle and environment to be accounted
for, further confounding the issue (Buford et al., 2013).
3.6 Conclusions
To date, the investigation of inter-individual differences in V̇O2max response to
exercise training has been conducted almost exclusively without a control group or
comparator arm. While I do not deny that the identification of any inter-individual
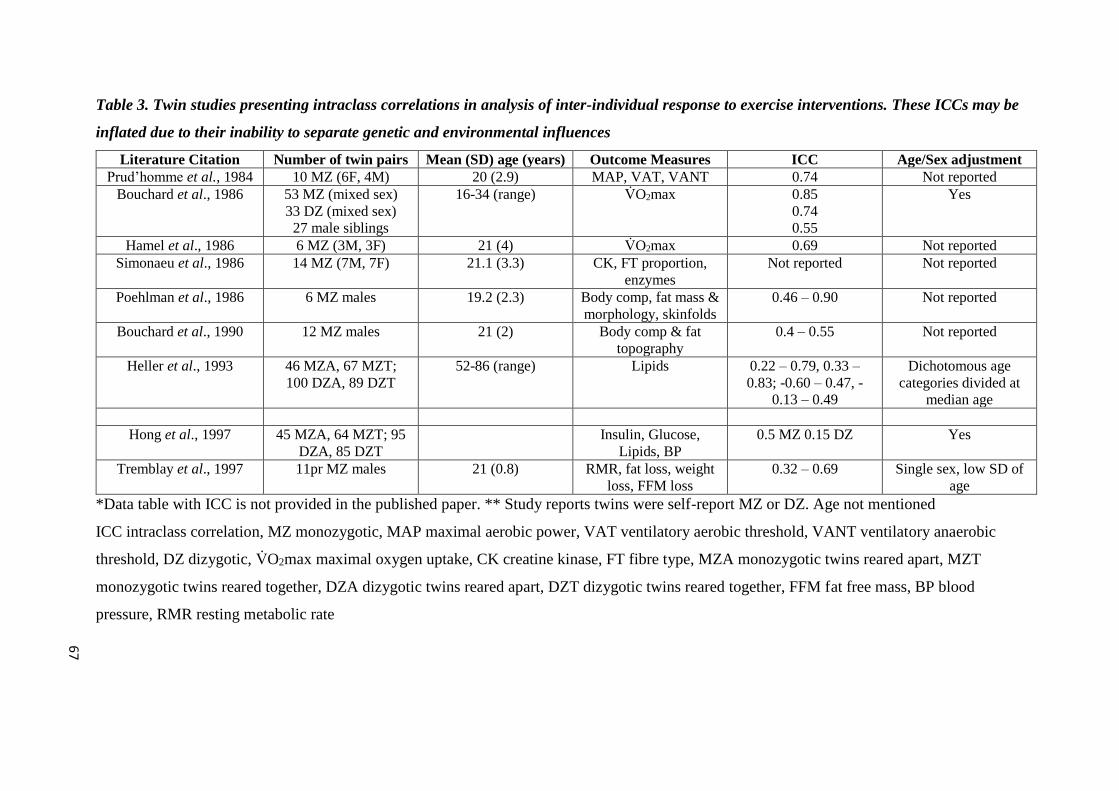
Table 3. Twin studies presenting intraclass correlations in analysis of inter-individual response to exercise interventions. These ICCs may be
inflated due to their inability to separate genetic and environmental influences
Literature Citation Number of twin pairs Mean (SD) age (years) Outcome Measures ICC Age/Sex adjustment
Prud’homme et al., 1984 10 MZ (6F, 4M) 20 (2.9) MAP, VAT, VANT 0.74 Not reported
Bouchard et al., 1986 53 MZ (mixed sex)
33 DZ (mixed sex)
27 male siblings
16-34 (range) V̇O2max 0.85
0.74
0.55
Yes
Hamel et al., 1986 6 MZ (3M, 3F) 21 (4) V̇O2max 0.69 Not reported
Simonaeu et al., 1986 14 MZ (7M, 7F) 21.1 (3.3) CK, FT proportion,
enzymes
Not reported Not reported
Poehlman et al., 1986 6 MZ males 19.2 (2.3) Body comp, fat mass &
morphology, skinfolds
0.46 – 0.90 Not reported
Bouchard et al., 1990 12 MZ males 21 (2) Body comp & fat
topography
0.4 – 0.55 Not reported
Heller et al., 1993 46 MZA, 67 MZT;
100 DZA, 89 DZT
52-86 (range) Lipids 0.22 – 0.79, 0.33 –
0.83; -0.60 – 0.47, -
0.13 – 0.49
Dichotomous age
categories divided at
median age
Hong et al., 1997 45 MZA, 64 MZT; 95
DZA, 85 DZT
Insulin, Glucose,
Lipids, BP
0.5 MZ 0.15 DZ Yes
Tremblay et al., 1997 11pr MZ males 21 (0.8) RMR, fat loss, weight
loss, FFM loss
0.32 – 0.69 Single sex, low SD of
age
*Data table with ICC is not provided in the published paper. ** Study reports twins were self-report MZ or DZ. Age not mentioned
ICC intraclass correlation, MZ monozygotic, MAP maximal aerobic power, VAT ventilatory aerobic threshold, VANT ventilatory anaerobic
threshold, DZ dizygotic, V̇O2max maximal oxygen uptake, CK creatine kinase, FT fibre type, MZA monozygotic twins reared apart, MZT
monozygotic twins reared together, DZA dizygotic twins reared apart, DZT dizygotic twins reared together, FFM fat free mass, BP blood
pressure, RMR resting metabolic rate
67
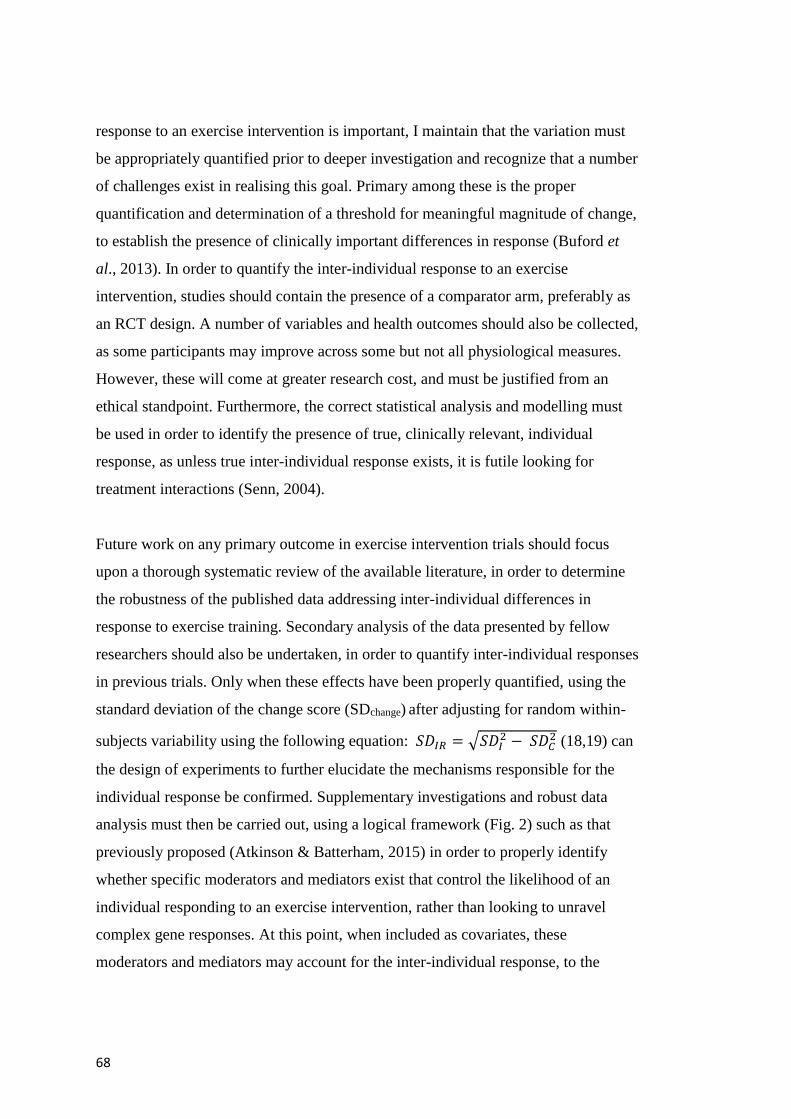
68
response to an exercise intervention is important, I maintain that the variation must
be appropriately quantified prior to deeper investigation and recognize that a number
of challenges exist in realising this goal. Primary among these is the proper
quantification and determination of a threshold for meaningful magnitude of change,
to establish the presence of clinically important differences in response (Buford et
al., 2013). In order to quantify the inter-individual response to an exercise
intervention, studies should contain the presence of a comparator arm, preferably as
an RCT design. A number of variables and health outcomes should also be collected,
as some participants may improve across some but not all physiological measures.
However, these will come at greater research cost, and must be justified from an
ethical standpoint. Furthermore, the correct statistical analysis and modelling must
be used in order to identify the presence of true, clinically relevant, individual
response, as unless true inter-individual response exists, it is futile looking for
treatment interactions (Senn, 2004).
Future work on any primary outcome in exercise intervention trials should focus
upon a thorough systematic review of the available literature, in order to determine
the robustness of the published data addressing inter-individual differences in
response to exercise training. Secondary analysis of the data presented by fellow
researchers should also be undertaken, in order to quantify inter-individual responses
in previous trials. Only when these effects have been properly quantified, using the
standard deviation of the change score (SDchange) after adjusting for random within-
subjects variability using the following equation: 𝑆𝐷𝐼𝑅 = √𝑆𝐷𝐼2 − 𝑆𝐷𝐶
2 (18,19) can
the design of experiments to further elucidate the mechanisms responsible for the
individual response be confirmed. Supplementary investigations and robust data
analysis must then be carried out, using a logical framework (Fig. 2) such as that
previously proposed (Atkinson & Batterham, 2015) in order to properly identify
whether specific moderators and mediators exist that control the likelihood of an
individual responding to an exercise intervention, rather than looking to unravel
complex gene responses. At this point, when included as covariates, these
moderators and mediators may account for the inter-individual response, to the
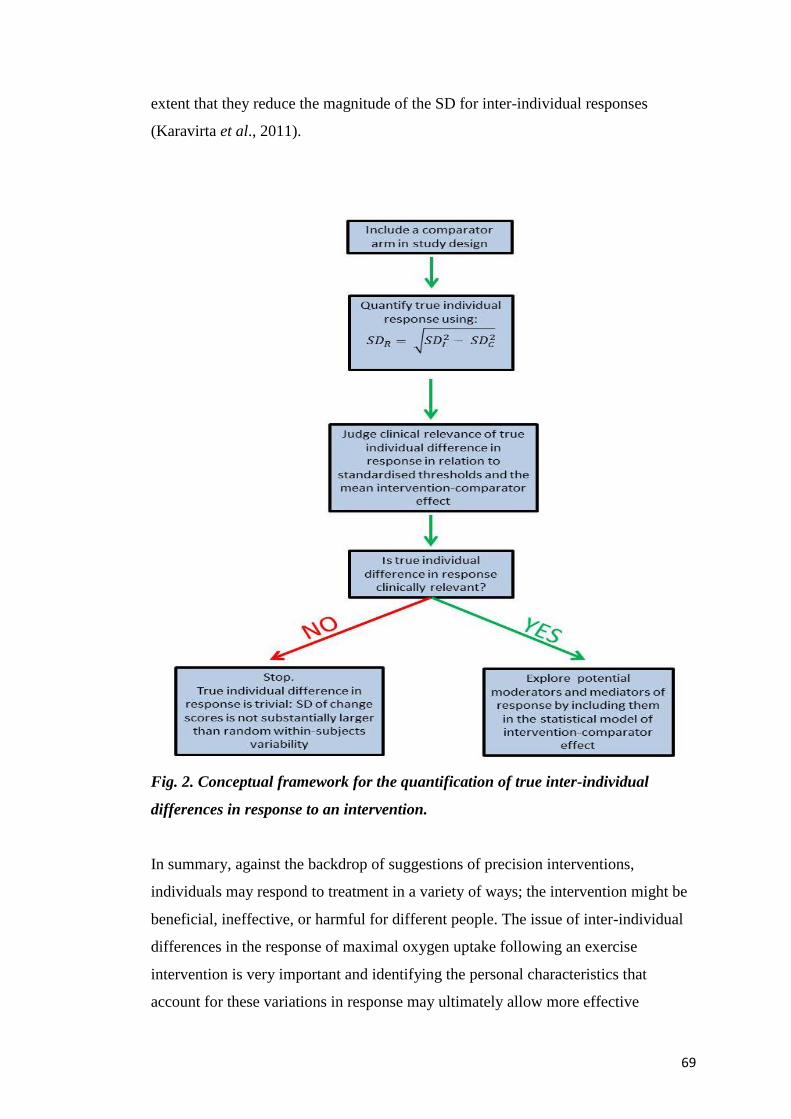
69
extent that they reduce the magnitude of the SD for inter-individual responses
(Karavirta et al., 2011).
Fig. 2. Conceptual framework for the quantification of true inter-individual
differences in response to an intervention.
In summary, against the backdrop of suggestions of precision interventions,
individuals may respond to treatment in a variety of ways; the intervention might be
beneficial, ineffective, or harmful for different people. The issue of inter-individual
differences in the response of maximal oxygen uptake following an exercise
intervention is very important and identifying the personal characteristics that
account for these variations in response may ultimately allow more effective
70
direction of interventions. It is clear that the body of literature purporting to claim
inter-individual variation in response does not, at this time, do so. Common themes
in previous trial design and data analysis are evident, such as a lack of comparator
arm or disregarding data from the control, and the use of ICCs to quantify genotype
dependency of inter-individual difference in the variability of V̇O2max response.
While the subject is an important one, it is crucial that the correct quantification
methodology is employed, together with an understanding of the clinical importance
of any inter-individual response, before suggestions can be made in regard to
potential moderators and mediators responsible for the observed inter-individual
variance of V̇O2max in response to exercise training.
71
Chapter 4: Inter-Individual Differences in Weight Change
Following Exercise Interventions: A Systematic Review and Meta-
Analysis of Randomised Controlled Trials
4.1 Preface
The detailed review presented in Chapter 3 casts doubts upon the claims of inter-
individual variation of maximal uptake in response to exercise training interventions.
With this in mind, it is important to correctly quantify the inter-individual variation
in response to exercise interventions. Whilst claims of individual variation have
previously been made, this chapter presents a detailed systematic review and meta-
analysis of studies aiming to elicit weight loss in response to an exercise
intervention. Inter-individual variation in weight loss will be assessed in relation to a
clinically-determined anchor, to determine whether any observed variation is
clinically important.
Whilst this chapter discusses the findings from a weight loss meta-analysis, it is
based upon a peer-reviewed research paper, published in Obesity Reviews in 2018
(Williamson et al., 2018).
4.2 Introduction
Interest in the individualised response to a treatment intervention, and its
applicability to medical and exercise interventions, has been growing over the last
three decades (Prud’homme et al., 1984, Lortie et al., 1984, Hamel et al., 1986, Rose
& Parfitt, 2007, Senn et al., 2011, Bouchard, 2012, Bouchard et al., 2014, Mann et
al., 2014) There has been specific interest in the inter-individual differences in
weight change in response to exercise training for around 20 years (Snyder et al.,
1997, Barbeau et al., 1999, King et al., 2008, Barwell et al., 2009, Cauldwell et al.,
2009, Cauldwell et al., 2013). Such interest has developed into a dedicated field of
research; precision medicine – encompassing ‘tailor-made’ therapies based on the
individual response of a patient (Senn et al., 2011). It is predicted that this individual
approach to medicine will ultimately reduce costs and improve quality of healthcare
72
(Spear et al., 2001). It has also been suggested that personalized medicine may
revolutionize healthcare through utilization of individual genetic information,
thereby improving drug safety and efficacy (Katsanis et al., 2008). Nevertheless,
associations that have been reported between genotype and treatment responses are
often small (Khoury & Galea, 2016).
A limitation of published research on the efficacy of exercise training has been
reported to be the focus on group mean data, with inter-individual variation in
response often being overlooked (King et al., 2008). Such a focus on mean effects
could obfuscate important individual differences in response (Bouchard, 1983,
Bouchard & Rankinen, 2001, King et al., 2008). If such individual differences are
present, and predictors of individual response are identified, then targeted
intervention strategies could be formulated to maximize weight loss for individuals.
A further limitation of much of the weight loss literature is the common use of
expected weight loss calculations using the ‘3500kcal/lb rule’, whereby an energy
deficit of 3500kcal is predicted to induce a 1lb reduction in body weight, based on
the calculation of body composition energy content (70:30 FM: FFM) (Wishnofsky,
1958). This approach has been criticized due to its erroneous predictions of linear
changes in body weight (Melanson et al., 2013), while Hall et al (2011) identified
that EE- induced rate of weight change slows over time. Therefore, predictions based
on this ‘3500 kcal rule’ may overestimate predicted weight loss. Likewise, models
used to predict weight loss using energy balance based upon the first law of
thermodynamics have been described as simplistic, inconsiderate to changes in in
interactive components (Boutcher & Dunn, 2009) and changes in spontaneous
physical activity (Donnelly & Smith, 2005). It is evident that there is a need to
include body composition data and other markers of health, rather than just assessing
the effectiveness of exercise based exclusively on body weight (King et al., 2009).
The lack of statistical power to detect changes is also an issue, as it is in many RCTs.
Most trials only have sufficient power with which to detect overall main effects
(Egbewahel, 2015), so subgroups such as those required to detect ‘true’ inter-
individual response require even greater sample sizes to reduce the magnitude of the
standard error and increase statistical power.
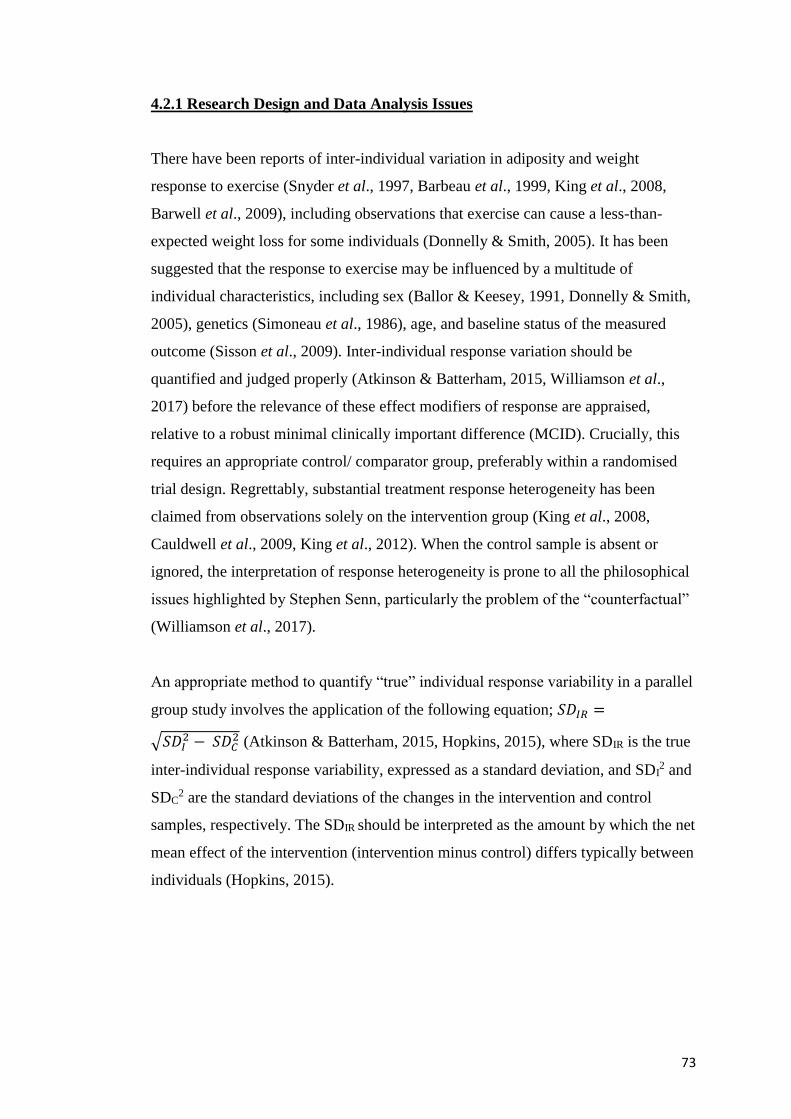
73
4.2.1 Research Design and Data Analysis Issues
There have been reports of inter-individual variation in adiposity and weight
response to exercise (Snyder et al., 1997, Barbeau et al., 1999, King et al., 2008,
Barwell et al., 2009), including observations that exercise can cause a less-than-
expected weight loss for some individuals (Donnelly & Smith, 2005). It has been
suggested that the response to exercise may be influenced by a multitude of
individual characteristics, including sex (Ballor & Keesey, 1991, Donnelly & Smith,
2005), genetics (Simoneau et al., 1986), age, and baseline status of the measured
outcome (Sisson et al., 2009). Inter-individual response variation should be
quantified and judged properly (Atkinson & Batterham, 2015, Williamson et al.,
2017) before the relevance of these effect modifiers of response are appraised,
relative to a robust minimal clinically important difference (MCID). Crucially, this
requires an appropriate control/ comparator group, preferably within a randomised
trial design. Regrettably, substantial treatment response heterogeneity has been
claimed from observations solely on the intervention group (King et al., 2008,
Cauldwell et al., 2009, King et al., 2012). When the control sample is absent or
ignored, the interpretation of response heterogeneity is prone to all the philosophical
issues highlighted by Stephen Senn, particularly the problem of the “counterfactual”
(Williamson et al., 2017).
An appropriate method to quantify “true” individual response variability in a parallel
group study involves the application of the following equation; 𝑆𝐷𝐼𝑅 =
√𝑆𝐷𝐼2 − 𝑆𝐷𝐶
2 (Atkinson & Batterham, 2015, Hopkins, 2015), where SDIR is the true
inter-individual response variability, expressed as a standard deviation, and SDI2 and
SDC2 are the standard deviations of the changes in the intervention and control
samples, respectively. The SDIR should be interpreted as the amount by which the net
mean effect of the intervention (intervention minus control) differs typically between
individuals (Hopkins, 2015).
74
4.2.2 Aims of the Review
In view of the above design and analysis issues, there is uncertainty about
previously-drawn conclusions in weight-loss studies. To date, there has been no
published quantitative synthesis of the evidence for individual response variation in
studies on exercise-mediated weight loss. Therefore, I aimed to conduct a systematic
review and meta-analysis of the available research to allow for quantification of
‘true’ inter-individual variation in weight change in response to an exercise
intervention.
4.3 Methods
This study was undertaken in accordance with the ethics procedures and guidance of
Teesside University. The review is reported according to the Preferred Reporting
Items for Systematic Reviews and Meta-Analyses (PRISMA) statement (Liberati et
al., 2009). The review protocol was registered with PROSPERO, the International
Prospective Register of Systematic Reviews (CRD42016049982). An initial scoping
literature review was undertaken to gauge the likely number of eligible studies for
inclusion in the meta-analysis, with the intention to identify whether there were
sufficient studies to be able to conduct a robust meta-analysis.
4.3.1 Study Question
This systematic review was designed to address the following question:
Across all the relevant studies that include a suitable comparator sample, are there
substantial (i.e. greater than a clinically-anchored MCID) inter-individual differences
in body mass loss in response to an exercise intervention?
4.3.2 Literature Search and Study Selection
This review involved a systematic electronic search of peer-reviewed original
literature using the following commonly used databases: Centre for Reviews and
Dissemination (York), CINAHL, Cochrane Central Register of Controlled Trials
(CENTRAL), Cochrane Database of Systematic Reviews, Cochrane Methodology
75
Register, Database of Abstract Reviews or Effects (DARE), Database of Promoting
Health Effectiveness Reviews (DoPHER), EMBASE, Medline (Ovid), NHS
Economic Evaluation Database (NHS EED), PROSPERO, PubMed, SCOPUS and
Sport Discus. These databases were first searched in December 2016, before a
secondary search in March 2017. The search strategy was designed to include all
articles published in the English language. Search terms comprised of “exerc*” AND
(“train*” OR “condition*”) AND (“structure” OR “supervised”) AND (“weight” OR
“body compos**” OR “BMI*”) AND (“randomi*” OR “RCT”). Subsequently,
additional searches of reference lists, Google Scholar and relevant bibliographic
hand searches with no limit of language or publication date were also completed.
Only studies conducted in humans were considered.
Studies were screened for those that would meet the inclusion criteria. Titles and
abstracts were initially scrutinised to exclude those studies clearly beyond the scope
of this review. For potential studies that appeared to meet the inclusion criteria, or
those for which a decision was unable to be made based upon the title and abstract
alone, full, published articles were obtained for detailed assessment against the
inclusion criteria. Where multiple papers from a single study have been published,
these were treated as a single study. Included studies were randomized intervention
studies, reporting the standard deviation of the change in body mass in both arms.
All studies targeting specific populations (e.g. pregnant women, children, and
individuals suffering from specific diseases) were excluded. The remaining full-text
articles were included in the systematic review and meta-analysis. A complete
overview of the process is presented at Fig. 3 and a comprehensive summary of the
studies reviewed is presented in Table 4.
Two reviewers (myself and Greg Atkinson, PhD supervisor) independently assessed
publications for eligibility. The decision to include studies was hierarchical and
made initially upon the basis of the study title, abstract and presence of keywords.
When a study could not be excluded with certainty, the full text was obtained for
evaluation. Disagreements between reviewers were resolved through discussion with
a third reviewer (Alan Batterham, PhD Director of Studies) and a consensus
approach was used.
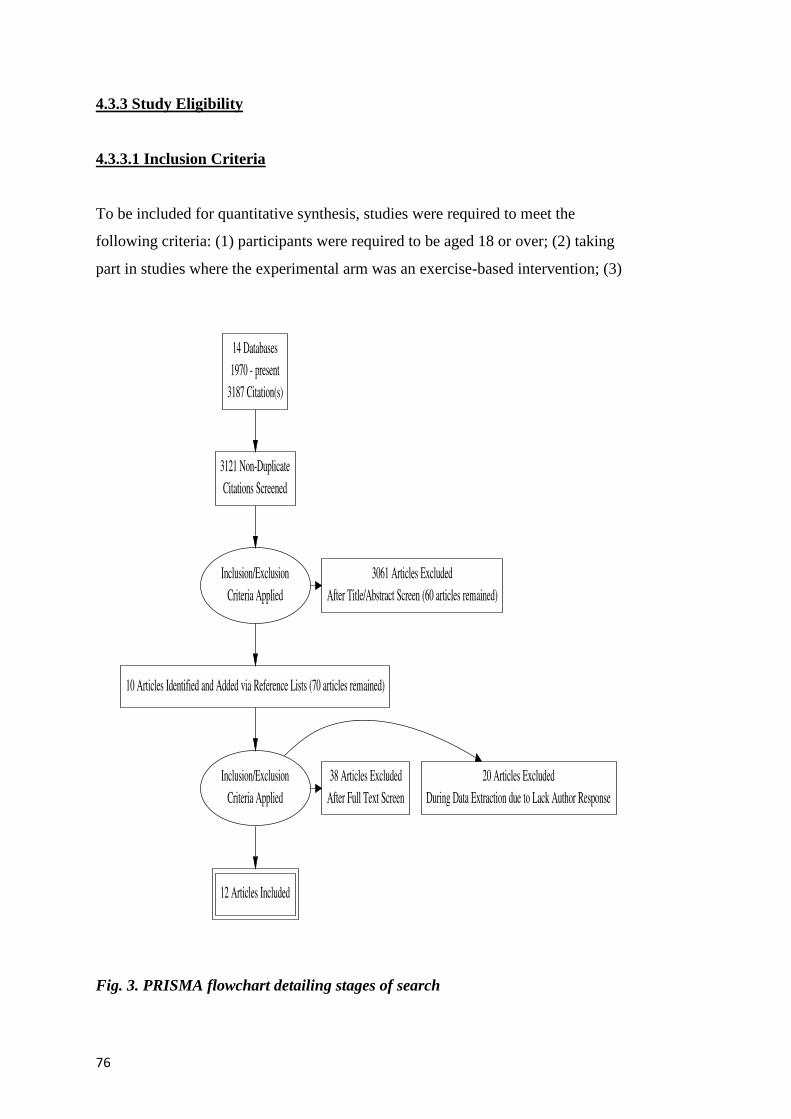
76
4.3.3 Study Eligibility
4.3.3.1 Inclusion Criteria
To be included for quantitative synthesis, studies were required to meet the
following criteria: (1) participants were required to be aged 18 or over; (2) taking
part in studies where the experimental arm was an exercise-based intervention; (3)
Fig. 3. PRISMA flowchart detailing stages of search
77
which was designed to elicit weight loss; (4) reporting change in adiposity indices
(body mass index, body fat or body weight); (5) with no history of diabetes,
metabolic, cardiovascular, musculoskeletal or inflammatory disease; (6) the exercise
intervention was required to be supervised; (7) the investigation had to be an RCT
design; and (8) greater than six weeks in duration. Since the interventions were
exercised-based, participants were not blinded. Studies were included if they were
published in peer-reviewed journals or full manuscripts were available (i.e. theses
and dissertations). Where several intervention arms were present, all data other than
that from the control-only and exercise-only arms were excluded. Where more than
one exercise intervention was present, results were combined to avoid double
counting of the control sample (Ryan, 2013). The same procedure for combining
groups was applied to studies with a single exercise intervention but with results
reported separately for sub-groups.
4.3.3.2 Exclusion Criteria
Studies were excluded if they (1) included unsupervised exercise interventions,
behaviour therapy, dietary modification, health education, surgical, drug or hormone
treatment that did not include exercise; (2) if change in body mass/ composition was
not a primary or secondary aim of the study; (3) if no relevant comparator sample
were present; or (4) the full-text manuscript was written in a language other than
English.
4.3.4 Data Extraction and Synthesis
DigitizeIt (Brunschweig, Germany) graph digitizer software was used to extract
precise data in cases where data were only presented in Figures rather than text.
Study characteristics such as study design, participant characteristics (age, sex,
ethnicity), measurement methods, change scores, SDchange and information to assess
the risk of bias were extracted by myself (see 4.3.5 Assessment of Study Quality).
A standardized data extraction sheet was used to collect data on participants’
characteristics, study methods, sample size, prescribed intervention (frequency,
78
intensity, duration and type), outcomes assessed, loss to follow up and study type.
The data for Table 4 was collected by myself before Professor Greg Atkinson
verified its accuracy and the eligibility of studies for inclusion. Where data were
incompletely or unclearly reported, the lead author contacted study authors for
clarification. Effect sizes were calculated for the relevant measures.
4.3.5 Assessment of Study Quality
Methodological risk of bias was assessed and reported in accordance with the
Cochrane Handbook (Higgins & Green, 2011) and the guidelines of the Cochrane
Consumers and Communication Review Group (Ryan, 2013), which recommend the
explicit reporting of the following elements for RCTs: random sequence generation;
allocation sequence concealment; blinding (participants, personnel); blinding
(outcome assessment); completeness of outcome data; selective reporting; and other
sources of bias. Each item was judged as being at high, low or unclear risk of bias as
set out in the criteria provided (Higgins & Green, 2011). A summary of risk of bias
is presented in Figs 4 and 5, produced using RevMan software (Review Manager.
Version 5.3. Copenhagen: The Nordic Cochrane Centre. The Cochrane
Collaboration, 2014).
Studies were deemed to be at highest risk of bias if they scored as high or unclear
risk of bias for either the sequence generation or allocation concealment domains,
based on growing empirical evidence that these factors are particularly important
potential sources of bias (Higgins & Green, 2011).
In all cases, risk of bias was independently assessed, with any disagreements
resolved by discussion to reach consensus. Risk of bias results were incorporated
into the review using standard tables and commentary about each element, leading to
an overall assessment of the risk of bias of those studies selected for inclusion and a
judgement about the internal validity of results.
4.3.6 Meta-Analysis
First, to put the results for individual response variance in context I conducted a
79
random-effects meta-analysis for the mean difference in weight loss across the
included studies, using a restricted maximum likelihood (REML) model combined
with the Knapp-Hartung method (t-distribution for between-study variance). Second,
for each study I extracted the standard deviation of the changes in body mass for
both control (C) and exercise intervention (I) groups. The true individual response
variance (intervention minus control) was then derived as SDI2 – SDC
2. The standard
error (SE) for this variance was calculated using the following equation:
SE =√ [2(SDExp4/DFExp + SDCon
4/DFCon)], where DFExp and DFCon are the degrees of
freedom of the standard deviations in the exercise and control groups (Liberati et al.,
2009). Note that a negative value for the individual response variance, for either the
point estimate or lower bound of the confidence interval or prediction interval,
implies greater variability in the changes in body mass in the control versus
intervention groups.
The individual response variances with their SEs were meta-analysed using a REML
model combined with the Knapp-Hartung method. It is important to note that the
variances are unbiased, whereas the SD is not, and deriving a SE for the SD for
individual responses is also problematic. Therefore, synthesising the individual
response variances rather than the SDs for individual responses is imperative. I
derived the point estimate for the pooled individual response variance together with
its uncertainty expressed as a 95% Confidence Interval (CI). The point estimate and
confidence limits were then converted to an SD metric by taking the square root. In
the case that the lower limit of the interval was negative, I first ignored the sign, took
the square root, and then re-applied the sign. This approach is consistent with the
‘nobound’ option in SAS/STAT® software, which permits negative variances (SAS
Institute Inc. 2017. SAS/STAT
14.3 User’s Guide. Cary, NC: SAS Institute Inc.).
For both mean and inter-individual variation meta-analyses, between-study
heterogeneity was quantified through the tau statistic () – a SD describing the
typical variability in the mean effect between studies (Higgins, 2008). Using the SE
for the pooled mean effect and the tau, a 95% prediction interval was derived to
quantify the expected range of true effects in future studies in similar settings
(Inthout et al., 2016). For the individual response variability, this prediction interval
was derived for 2 × SDIR, as the SDIR should be doubled before evaluating its
80
magnitude to reflect a comparison between a typically high (mean + SDIR) and
typically low (mean – SDIR) responder (Hopkins, 2015). The magnitude of both the
mean weight loss and the individual response variability (2×SDIR) was evaluated
against a minimum clinically important difference for weight loss of 2.5 kg (Jensen
et al., 2014) by calculating the probability that the effect in a future study in similar
settings would exceed this threshold (Inthout et al., 2016). This probability was
interpreted using the qualitative probabilistic anchors advanced by Hopkins et al.
(Hopkins et al., 2009). Inasmuch as we must work with the response variances,
rather than the SDs, I first halved the minimal clinically important difference
(equivalent to doubling the SD for individual responses), squared it (to express it in
variance metric) and then derived the probability that the response variance in a new
study would be clinically relevant, as described above. The threshold of 2.5 kg for
the MCID was chosen, conservatively, as the lowest value from the range of
clinically relevant effects presented by Jensen et al. By definition, effects smaller
than this threshold are defined as trivial (not clinically relevant). Effects >2.5 kg but
<7.5 kg are defined as ‘small’ (yet clinically important). ‘Moderate’ effects are
defined as >7.5 kg but <15 kg, and ‘large’ effects as >15 kg (Hopkins et al., 2009).
All statistical analyses were conducted using Comprehensive Meta-Analysis
software, version 3 (Biostat Inc., Englewood, NJ, USA).
4.4 Results
4.4.1 Study Selection
The initial search generated 3187 results (Fig. 3). 3061 of these were excluded based
on titles and abstracts alone, and 66 duplicates were rejected. The complete text was
obtained for 60 articles. A further 10 were identified from relevant reference lists and
hand searches. Following examination of these articles, 12 were identified that met
the eligibility criteria and are summarized in Table 4. A further 20 met all selection
criteria, apart from the reporting of SDchange. The authors of these papers were
contacted, but only four responses were received, and full data were not provided in
these instances (Schuit et al., 1998, Maiorana et al., 2001, Donnelly et al., 2003,
Potteiger et al., 2003, Schmitz et al., 2003, Takeshima et al., 2004, Toraman et al.,
81
2004, Shojaee-Moradie et al., 2007, McTiernan et al., 2007, Nalbant et al., 2009,
Coker et al., 2009, Kerksick et al., 2010, Atashak et al., 2011, Sheikholeslami
Vatani et al., 2011, Donges et al., 2012, Tracy & Hart, 2013, Herring et al., 2014,
Kim et al., 2015, Bittari et al., 2016, Tan et al., 2016). Contact was made by email.
If, after four weeks, no response was received, a further email was sent. Following a
further four-week period, papers from these authors were excluded. One paper met
all inclusion criteria (Atlantis et al., 2006), except for the fact that median and
interquartile range values were presented for changes in body mass, rather than
means and SDs. No non-published studies (i.e., dissertations) were found to be
eligible for inclusion.
The included studies encompassed a 17-year publication period between 1999 and
2016. Included studies involved a total of 1500 participants (EX: n=922, CON:
n=578). Three trials involved outcomes of aerobic training interventions (Church et
al., 2009, Tan et al., 2012, Donnelly et al., 2013), three involved the outcomes of
resistance training interventions (Prabhakaran et al., 1999, Schmitz et al., 2002,
Teixeira et al., 2003), one study involved the outcomes on separate aerobic and
resistance training interventions (Donges et al., 2010) and five studies involved the
outcomes of combined/concurrent training (Lockwood et al., 2008, Burtscher et al.,
2009, Vilela et al., 2015, Baillot et al., 2016, Dalager et al., 2016). The duration of
studies ranged from 8 to 52 weeks, study sample sizes ranged from 24 to 411 and
reported pre-intervention mean body mass ranged from 65.5 to 128.0 kg.
4.4.2 Study Outcomes
The pooled mean group difference in pre/post changes in weight (intervention minus
control) was -1.4 kg (95% CI -0.3 to -2.5 kg). Substantial between study
heterogeneity was observed (=1.5 kg: -0.4 to 2.2 kg). The prediction interval
revealed that, were investigators to undertake a future trial, the 95% plausible range
for mean weight change vs. control would be -5.0 to 2.1 kg. The probability (%
chances) that the mean weight loss (intervention minus control) in a future study in
similar settings would exceed the minimum clinically important difference of a
reduction of 2.5 kg was 26% (‘possibly’ clinically important).
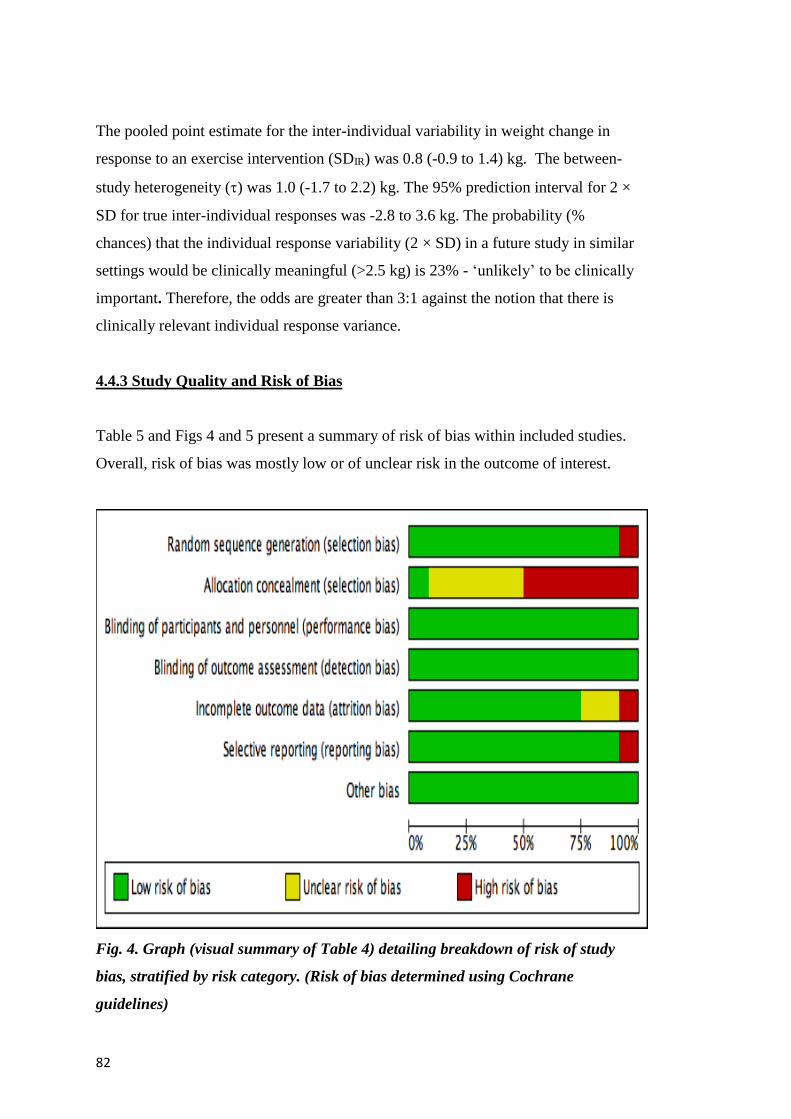
82
The pooled point estimate for the inter-individual variability in weight change in
response to an exercise intervention (SDIR) was 0.8 (-0.9 to 1.4) kg. The between-
study heterogeneity () was 1.0 (-1.7 to 2.2) kg. The 95% prediction interval for 2 ×
SD for true inter-individual responses was -2.8 to 3.6 kg. The probability (%
chances) that the individual response variability (2 × SD) in a future study in similar
settings would be clinically meaningful (>2.5 kg) is 23% - ‘unlikely’ to be clinically
important. Therefore, the odds are greater than 3:1 against the notion that there is
clinically relevant individual response variance.
4.4.3 Study Quality and Risk of Bias
Table 5 and Figs 4 and 5 present a summary of risk of bias within included studies.
Overall, risk of bias was mostly low or of unclear risk in the outcome of interest.
Fig. 4. Graph (visual summary of Table 4) detailing breakdown of risk of study
bias, stratified by risk category. (Risk of bias determined using Cochrane
guidelines)

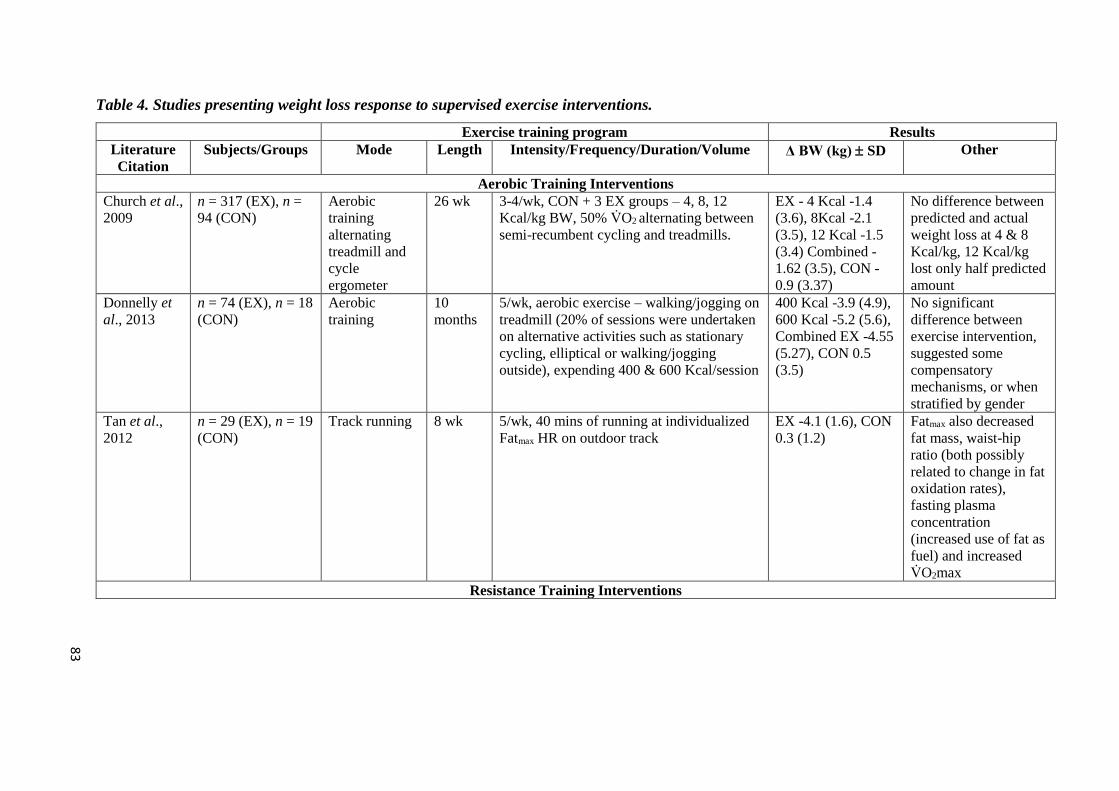
Table 4. Studies presenting weight loss response to supervised exercise interventions.
Exercise training program Results
Literature
Citation
Subjects/Groups Mode Length Intensity/Frequency/Duration/Volume Δ BW (kg) SD Other
Aerobic Training Interventions
Church et al.,
2009
n = 317 (EX), n =
94 (CON)
Aerobic
training
alternating
treadmill and
cycle
ergometer
26 wk 3-4/wk, CON + 3 EX groups – 4, 8, 12
Kcal/kg BW, 50% V̇O2 alternating between
semi-recumbent cycling and treadmills.
EX - 4 Kcal -1.4
(3.6), 8Kcal -2.1
(3.5), 12 Kcal -1.5
(3.4) Combined -
1.62 (3.5), CON -
0.9 (3.37)
No difference between
predicted and actual
weight loss at 4 & 8
Kcal/kg, 12 Kcal/kg
lost only half predicted
amount
Donnelly et
al., 2013
n = 74 (EX), n = 18
(CON)
Aerobic
training
10
months
5/wk, aerobic exercise – walking/jogging on
treadmill (20% of sessions were undertaken
on alternative activities such as stationary
cycling, elliptical or walking/jogging
outside), expending 400 & 600 Kcal/session
400 Kcal -3.9 (4.9),
600 Kcal -5.2 (5.6),
Combined EX -4.55
(5.27), CON 0.5
(3.5)
No significant
difference between
exercise intervention,
suggested some
compensatory
mechanisms, or when
stratified by gender
Tan et al.,
2012
n = 29 (EX), n = 19
(CON)
Track running 8 wk 5/wk, 40 mins of running at individualized
Fatmax HR on outdoor track
EX -4.1 (1.6), CON
0.3 (1.2)
Fatmax also decreased
fat mass, waist-hip
ratio (both possibly
related to change in fat
oxidation rates),
fasting plasma
concentration
(increased use of fat as
fuel) and increased
V̇O2max
Resistance Training Interventions
83
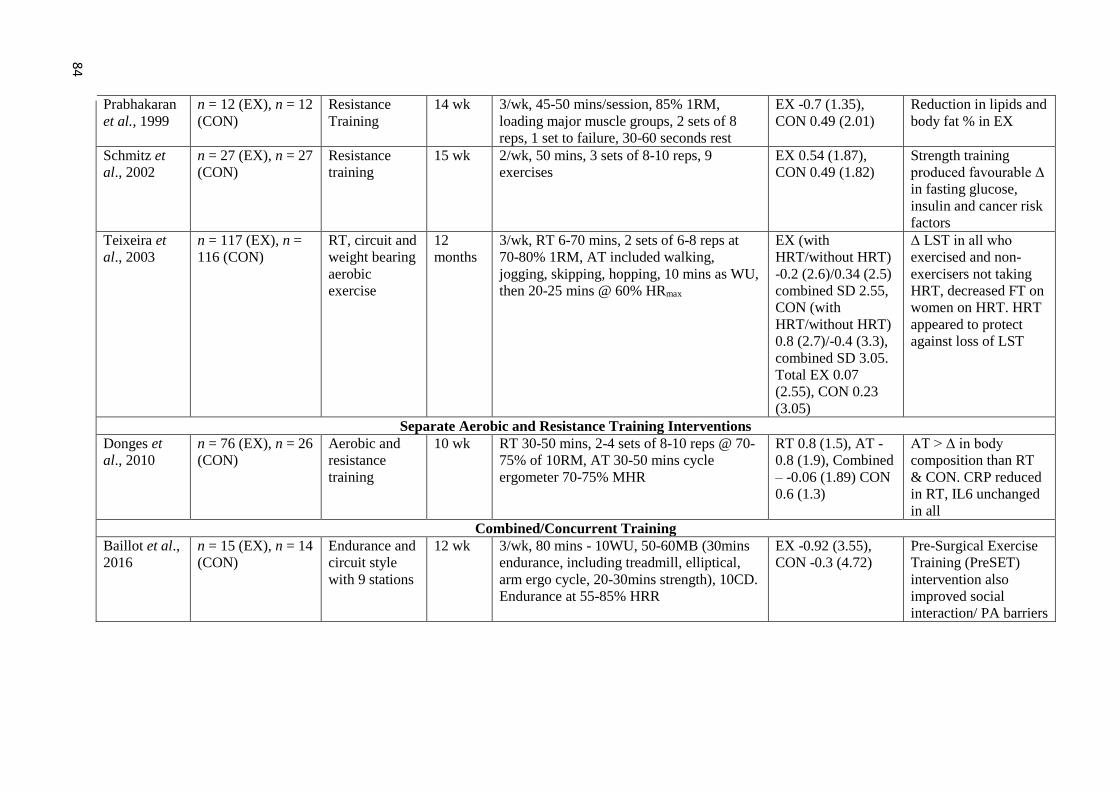
Prabhakaran
et al., 1999
n = 12 (EX), n = 12
(CON)
Resistance
Training
14 wk 3/wk, 45-50 mins/session, 85% 1RM,
loading major muscle groups, 2 sets of 8
reps, 1 set to failure, 30-60 seconds rest
EX -0.7 (1.35),
CON 0.49 (2.01)
Reduction in lipids and
body fat % in EX
Schmitz et
al., 2002
n = 27 (EX), n = 27
(CON)
Resistance
training
15 wk 2/wk, 50 mins, 3 sets of 8-10 reps, 9
exercises
EX 0.54 (1.87),
CON 0.49 (1.82)
Strength training
produced favourable Δ
in fasting glucose,
insulin and cancer risk
factors
Teixeira et
al., 2003
n = 117 (EX), n =
116 (CON)
RT, circuit and
weight bearing
aerobic
exercise
12
months
3/wk, RT 6-70 mins, 2 sets of 6-8 reps at
70-80% 1RM, AT included walking,
jogging, skipping, hopping, 10 mins as WU,
then 20-25 mins @ 60% HRmax
EX (with
HRT/without HRT)
-0.2 (2.6)/0.34 (2.5)
combined SD 2.55,
CON (with
HRT/without HRT)
0.8 (2.7)/-0.4 (3.3),
combined SD 3.05.
Total EX 0.07
(2.55), CON 0.23
(3.05)
Δ LST in all who
exercised and non-
exercisers not taking
HRT, decreased FT on
women on HRT. HRT
appeared to protect
against loss of LST
Separate Aerobic and Resistance Training Interventions
Donges et
al., 2010
n = 76 (EX), n = 26
(CON)
Aerobic and
resistance
training
10 wk RT 30-50 mins, 2-4 sets of 8-10 reps @ 70-
75% of 10RM, AT 30-50 mins cycle
ergometer 70-75% MHR
RT 0.8 (1.5), AT -
0.8 (1.9), Combined
– -0.06 (1.89) CON
0.6 (1.3)
AT > Δ in body
composition than RT
& CON. CRP reduced
in RT, IL6 unchanged
in all
Combined/Concurrent Training
Baillot et al.,
2016
n = 15 (EX), n = 14
(CON)
Endurance and
circuit style
with 9 stations
12 wk 3/wk, 80 mins - 10WU, 50-60MB (30mins
endurance, including treadmill, elliptical,
arm ergo cycle, 20-30mins strength), 10CD.
Endurance at 55-85% HRR
EX -0.92 (3.55),
CON -0.3 (4.72)
Pre-Surgical Exercise
Training (PreSET)
intervention also
improved social
interaction/ PA barriers
84
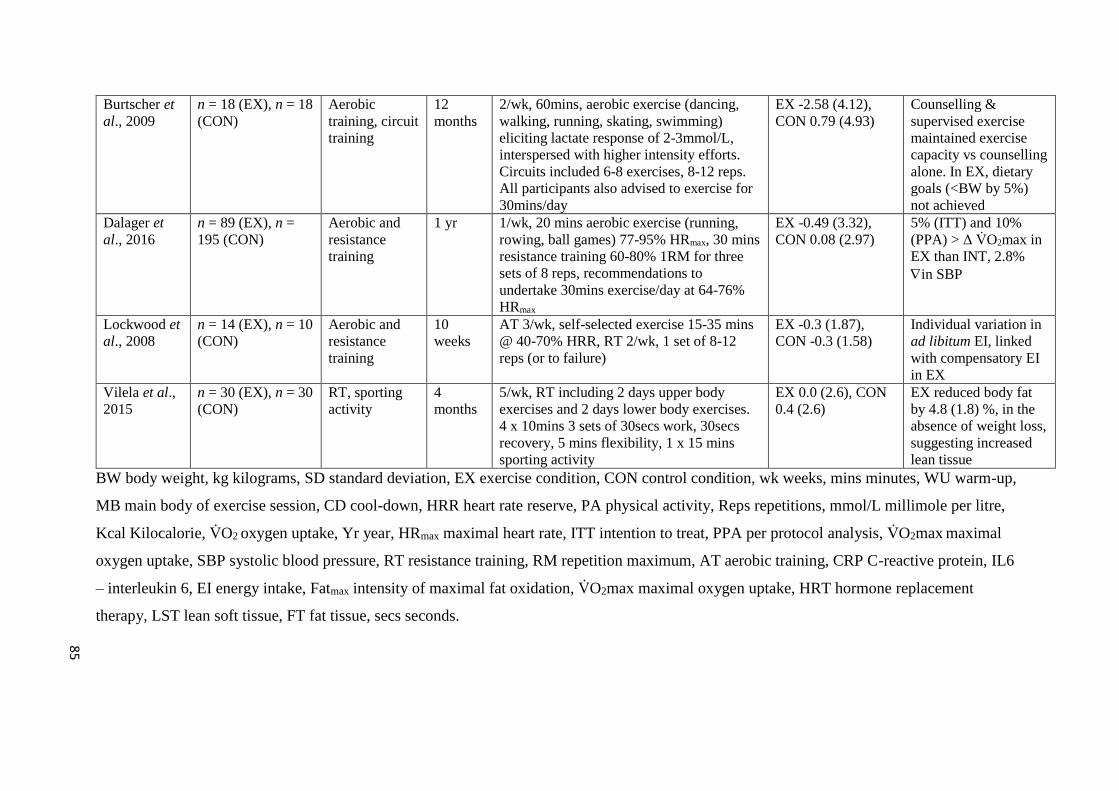
Burtscher et
al., 2009
n = 18 (EX), n = 18
(CON)
Aerobic
training, circuit
training
12
months
2/wk, 60mins, aerobic exercise (dancing,
walking, running, skating, swimming)
eliciting lactate response of 2-3mmol/L,
interspersed with higher intensity efforts.
Circuits included 6-8 exercises, 8-12 reps.
All participants also advised to exercise for
30mins/day
EX -2.58 (4.12),
CON 0.79 (4.93)
Counselling &
supervised exercise
maintained exercise
capacity vs counselling
alone. In EX, dietary
goals (<BW by 5%)
not achieved
Dalager et
al., 2016
n = 89 (EX), n =
195 (CON)
Aerobic and
resistance
training
1 yr 1/wk, 20 mins aerobic exercise (running,
rowing, ball games) 77-95% HRmax, 30 mins
resistance training 60-80% 1RM for three
sets of 8 reps, recommendations to
undertake 30mins exercise/day at 64-76%
HRmax
EX -0.49 (3.32),
CON 0.08 (2.97)
5% (ITT) and 10%
(PPA) > Δ V̇O2max in
EX than INT, 2.8%
in SBP
Lockwood et
al., 2008
n = 14 (EX), n = 10
(CON)
Aerobic and
resistance
training
10
weeks
AT 3/wk, self-selected exercise 15-35 mins
@ 40-70% HRR, RT 2/wk, 1 set of 8-12
reps (or to failure)
EX -0.3 (1.87),
CON -0.3 (1.58)
Individual variation in
ad libitum EI, linked
with compensatory EI
in EX
Vilela et al.,
2015
n = 30 (EX), n = 30
(CON)
RT, sporting
activity
4
months
5/wk, RT including 2 days upper body
exercises and 2 days lower body exercises.
4 x 10mins 3 sets of 30secs work, 30secs
recovery, 5 mins flexibility, 1 x 15 mins
sporting activity
EX 0.0 (2.6), CON
0.4 (2.6)
EX reduced body fat
by 4.8 (1.8) %, in the
absence of weight loss,
suggesting increased
lean tissue
BW body weight, kg kilograms, SD standard deviation, EX exercise condition, CON control condition, wk weeks, mins minutes, WU warm-up,
MB main body of exercise session, CD cool-down, HRR heart rate reserve, PA physical activity, Reps repetitions, mmol/L millimole per litre,
Kcal Kilocalorie, V̇O2 oxygen uptake, Yr year, HRmax maximal heart rate, ITT intention to treat, PPA per protocol analysis, V̇O2max maximal
oxygen uptake, SBP systolic blood pressure, RT resistance training, RM repetition maximum, AT aerobic training, CRP C-reactive protein, IL6
– interleukin 6, EI energy intake, Fatmax intensity of maximal fat oxidation, V̇O2max maximal oxygen uptake, HRT hormone replacement
therapy, LST lean soft tissue, FT fat tissue, secs seconds.
85

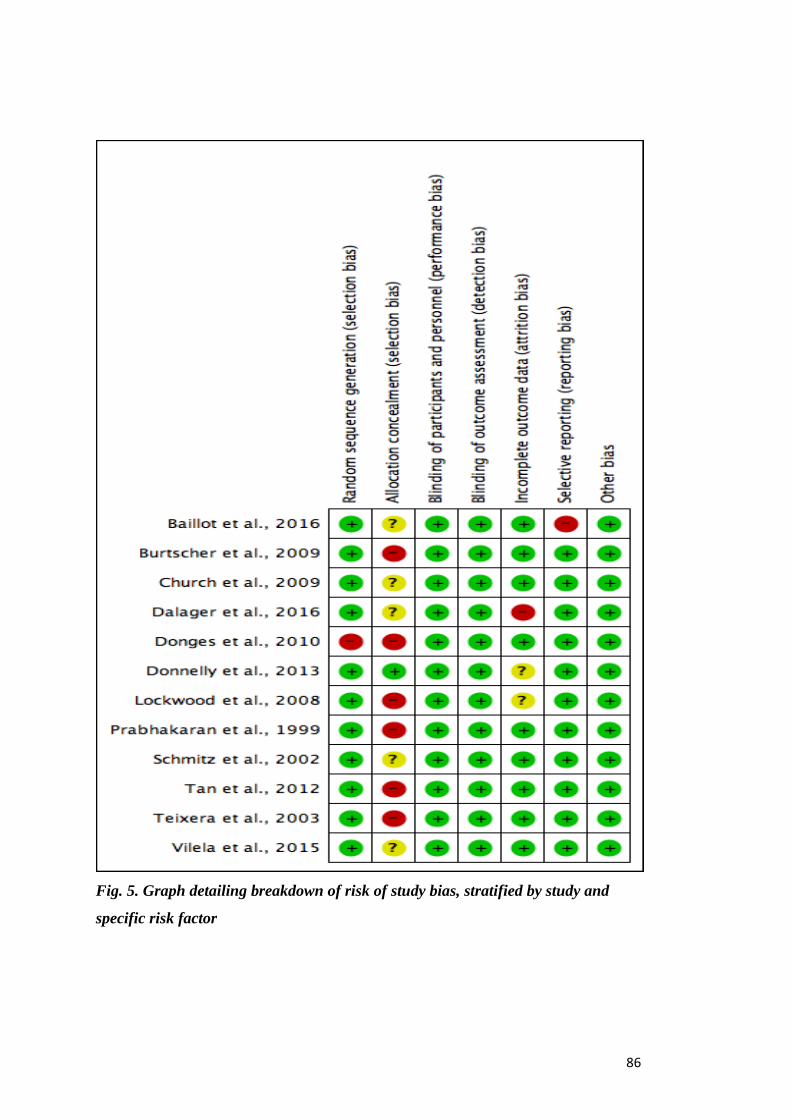
86
Fig. 5. Graph detailing breakdown of risk of study bias, stratified by study and
specific risk factor

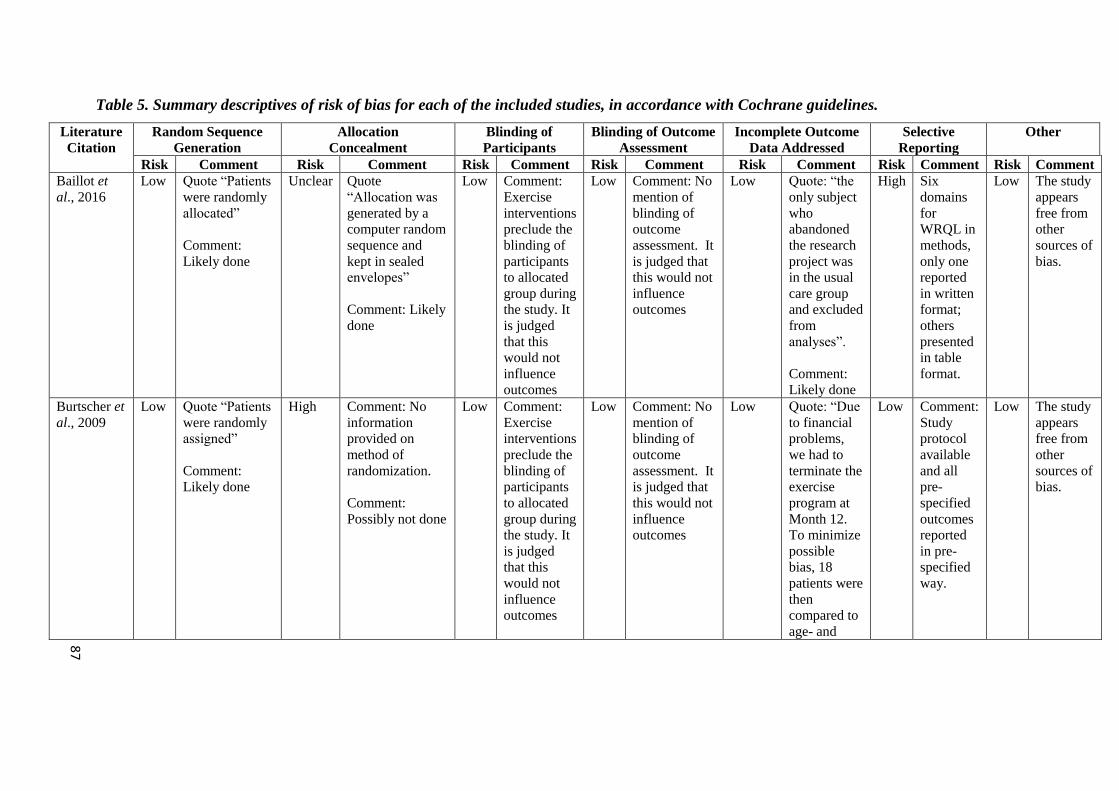
Table 5. Summary descriptives of risk of bias for each of the included studies, in accordance with Cochrane guidelines.
Literature
Citation
Random Sequence
Generation
Allocation
Concealment
Blinding of
Participants
Blinding of Outcome
Assessment
Incomplete Outcome
Data Addressed
Selective
Reporting
Other
Risk Comment Risk Comment Risk Comment Risk Comment Risk Comment Risk Comment Risk Comment
Baillot et
al., 2016
Low Quote “Patients
were randomly
allocated”
Comment:
Likely done
Unclear Quote
“Allocation was
generated by a
computer random
sequence and
kept in sealed
envelopes”
Comment: Likely
done
Low Comment:
Exercise
interventions
preclude the
blinding of
participants
to allocated
group during
the study. It
is judged
that this
would not
influence
outcomes
Low Comment: No
mention of
blinding of
outcome
assessment. It
is judged that
this would not
influence
outcomes
Low Quote: “the
only subject
who
abandoned
the research
project was
in the usual
care group
and excluded
from
analyses”.
Comment:
Likely done
High Six
domains
for
WRQL in
methods,
only one
reported
in written
format;
others
presented
in table
format.
Low The study
appears
free from
other
sources of
bias.
Burtscher et
al., 2009
Low Quote “Patients
were randomly
assigned”
Comment:
Likely done
High Comment: No
information
provided on
method of
randomization.
Comment:
Possibly not done
Low Comment:
Exercise
interventions
preclude the
blinding of
participants
to allocated
group during
the study. It
is judged
that this
would not
influence
outcomes
Low Comment: No
mention of
blinding of
outcome
assessment. It
is judged that
this would not
influence
outcomes
Low Quote: “Due
to financial
problems,
we had to
terminate the
exercise
program at
Month 12.
To minimize
possible
bias, 18
patients were
then
compared to
age- and
Low Comment:
Study
protocol
available
and all
pre-
specified
outcomes
reported
in pre-
specified
way.
Low The study
appears
free from
other
sources of
bias.
87
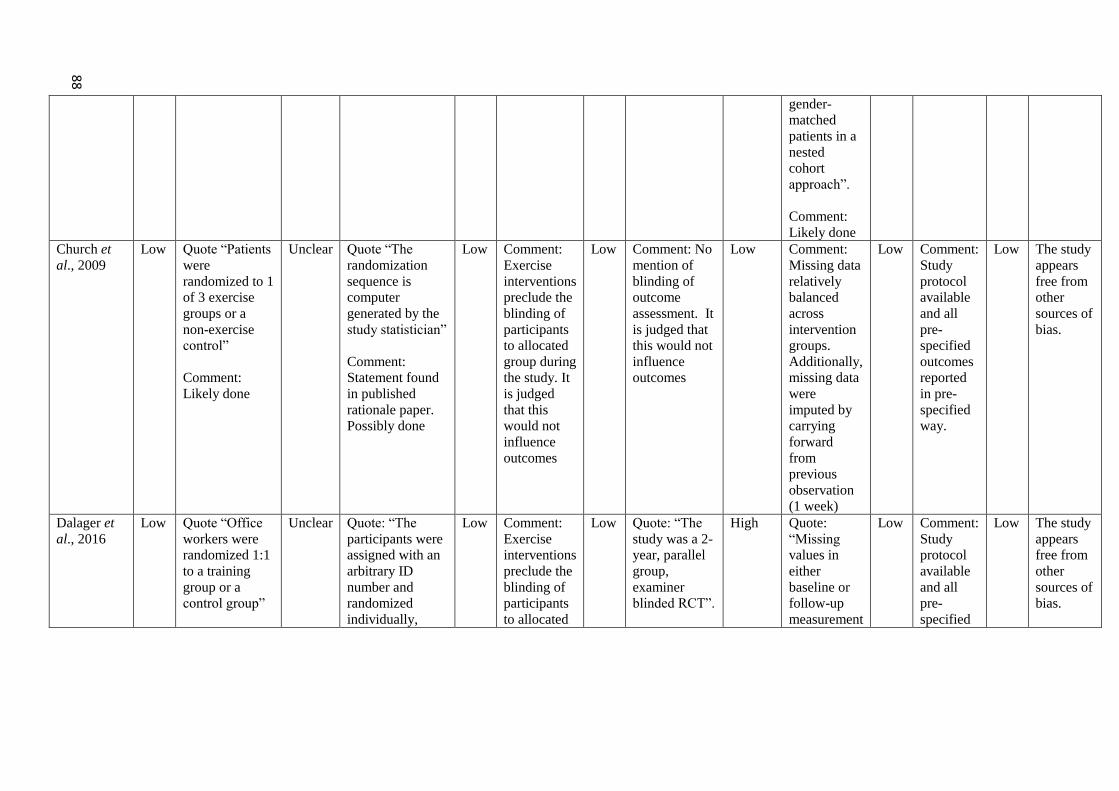
gender-
matched
patients in a
nested
cohort
approach”.
Comment:
Likely done
Church et
al., 2009
Low Quote “Patients
were
randomized to 1
of 3 exercise
groups or a
non-exercise
control”
Comment:
Likely done
Unclear Quote “The
randomization
sequence is
computer
generated by the
study statistician”
Comment:
Statement found
in published
rationale paper.
Possibly done
Low Comment:
Exercise
interventions
preclude the
blinding of
participants
to allocated
group during
the study. It
is judged
that this
would not
influence
outcomes
Low Comment: No
mention of
blinding of
outcome
assessment. It
is judged that
this would not
influence
outcomes
Low Comment:
Missing data
relatively
balanced
across
intervention
groups.
Additionally,
missing data
were
imputed by
carrying
forward
from
previous
observation
(1 week)
Low
Comment:
Study
protocol
available
and all
pre-
specified
outcomes
reported
in pre-
specified
way.
Low The study
appears
free from
other
sources of
bias.
Dalager et
al., 2016
Low Quote “Office
workers were
randomized 1:1
to a training
group or a
control group”
Unclear Quote: “The
participants were
assigned with an
arbitrary ID
number and
randomized
individually,
Low Comment:
Exercise
interventions
preclude the
blinding of
participants
to allocated
Low Quote: “The
study was a 2-
year, parallel
group,
examiner
blinded RCT”.
High Quote:
“Missing
values in
either
baseline or
follow-up
measurement
Low
Comment:
Study
protocol
available
and all
pre-
specified
Low The study
appears
free from
other
sources of
bias.
88
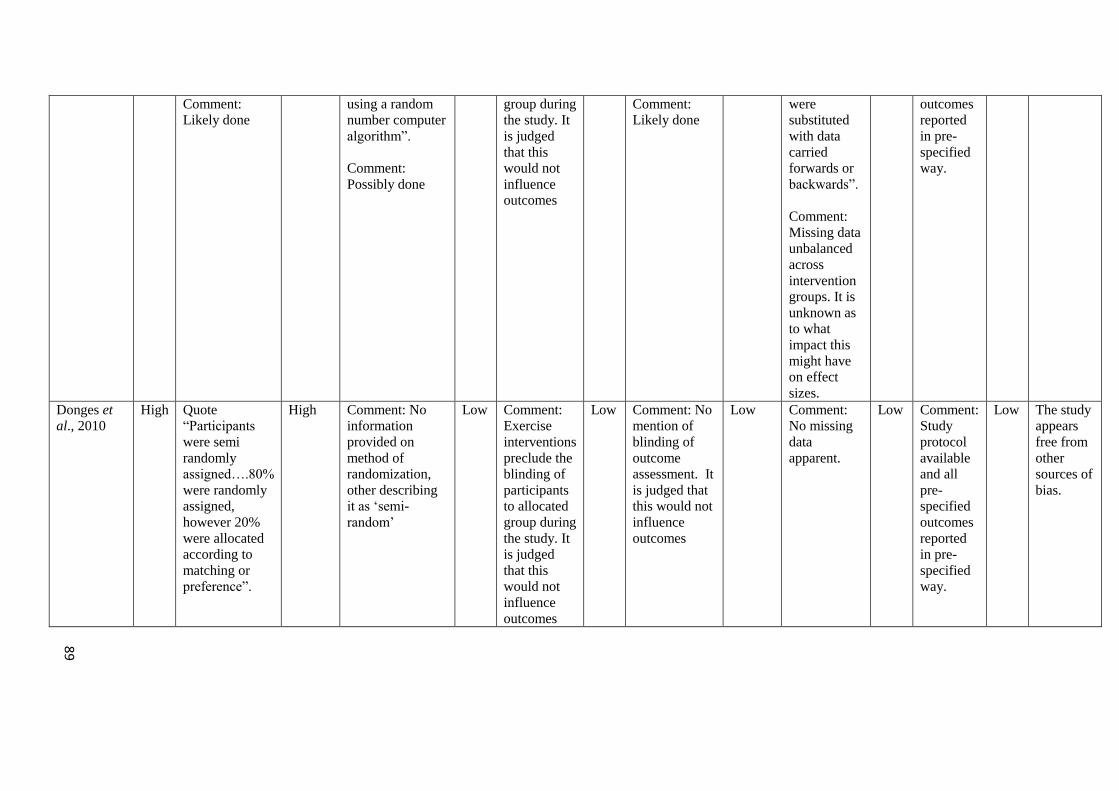
Comment:
Likely done
using a random
number computer
algorithm”.
Comment:
Possibly done
group during
the study. It
is judged
that this
would not
influence
outcomes
Comment:
Likely done
were
substituted
with data
carried
forwards or
backwards”.
Comment:
Missing data
unbalanced
across
intervention
groups. It is
unknown as
to what
impact this
might have
on effect
sizes.
outcomes
reported
in pre-
specified
way.
Donges et
al., 2010
High Quote
“Participants
were semi
randomly
assigned….80%
were randomly
assigned,
however 20%
were allocated
according to
matching or
preference”.
High Comment: No
information
provided on
method of
randomization,
other describing
it as ‘semi-
random’
Low Comment:
Exercise
interventions
preclude the
blinding of
participants
to allocated
group during
the study. It
is judged
that this
would not
influence
outcomes
Low Comment: No
mention of
blinding of
outcome
assessment. It
is judged that
this would not
influence
outcomes
Low Comment:
No missing
data
apparent.
Low
Comment:
Study
protocol
available
and all
pre-
specified
outcomes
reported
in pre-
specified
way.
Low The study
appears
free from
other
sources of
bias.
89
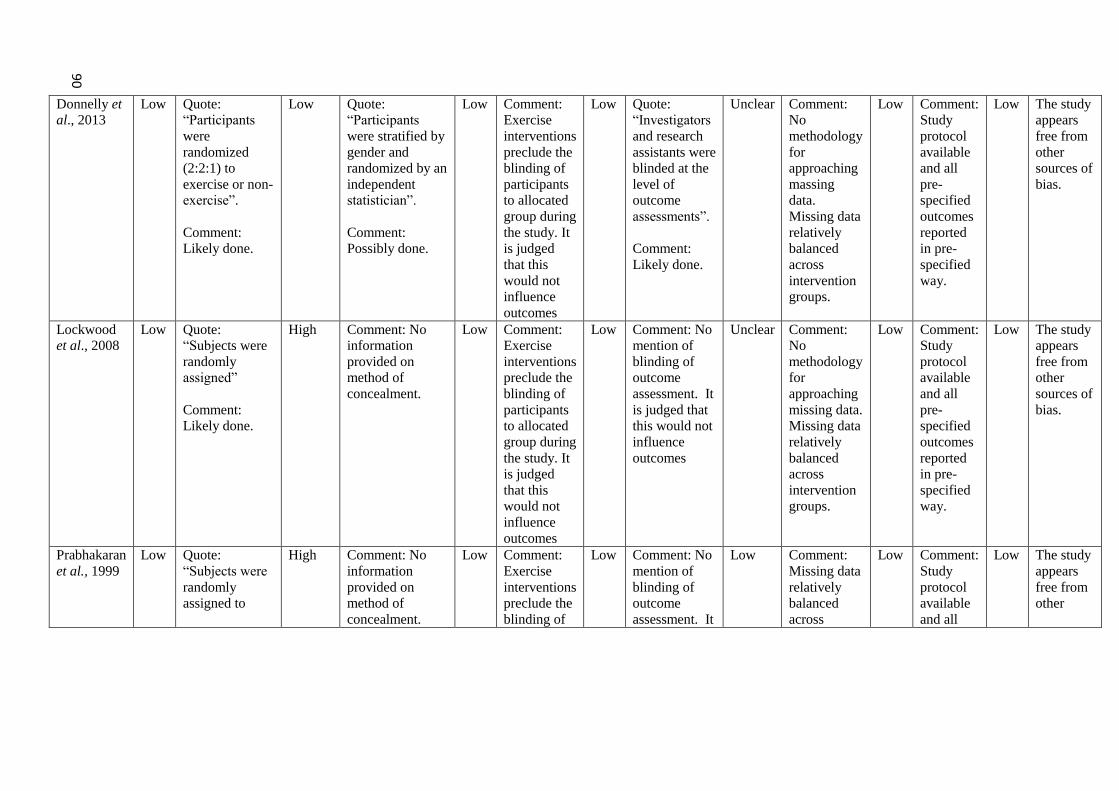
Donnelly et al., 2013
Low Quote:
“Participants
were
randomized
(2:2:1) to
exercise or non-
exercise”.
Comment:
Likely done.
Low Quote:
“Participants
were stratified by
gender and
randomized by an
independent
statistician”.
Comment:
Possibly done.
Low Comment:
Exercise
interventions
preclude the
blinding of
participants
to allocated
group during
the study. It
is judged
that this
would not
influence
outcomes
Low Quote:
“Investigators
and research
assistants were
blinded at the
level of
outcome
assessments”.
Comment:
Likely done.
Unclear Comment:
No
methodology
for
approaching
massing
data.
Missing data
relatively
balanced
across
intervention
groups.
Low
Comment:
Study
protocol
available
and all
pre-
specified
outcomes
reported
in pre-
specified
way.
Low The study
appears
free from
other
sources of
bias.
Lockwood
et al., 2008
Low Quote:
“Subjects were
randomly
assigned”
Comment:
Likely done.
High Comment: No
information
provided on
method of
concealment.
Low Comment:
Exercise
interventions
preclude the
blinding of
participants
to allocated
group during
the study. It
is judged
that this
would not
influence
outcomes
Low Comment: No
mention of
blinding of
outcome
assessment. It
is judged that
this would not
influence
outcomes
Unclear Comment:
No
methodology
for
approaching
missing data.
Missing data
relatively
balanced
across
intervention
groups.
Low
Comment:
Study
protocol
available
and all
pre-
specified
outcomes
reported
in pre-
specified
way.
Low The study
appears
free from
other
sources of
bias.
Prabhakaran
et al., 1999
Low Quote:
“Subjects were
randomly
assigned to
High Comment: No
information
provided on
method of
concealment.
Low Comment:
Exercise
interventions
preclude the
blinding of
Low Comment: No
mention of
blinding of
outcome
assessment. It
Low Comment:
Missing data
relatively
balanced
across
Low
Comment:
Study
protocol
available
and all
Low The study
appears
free from
other
90
either a non-
exercising
control group or
a
resistance
exercise
training group”.
Comment:
Likely done.
participants
to allocated
group during
the study. It
is judged
that this
would not
influence
outcomes
is judged that
this would not
influence
outcomes
intervention
groups.
pre-
specified
outcomes
reported
in pre-
specified
way.
sources of
bias.
Schmitz et al., 2002
Low Quote:
“Randomized to
no-contact
control or
treatment”.
Comment:
Likely done.
Unclear Comment:
Randomization
stratified by
decade (30-39,
40-50) due to
concerns
regarding effects
of hormonal
changes.
Low Comment:
Exercise
interventions
preclude the
blinding of
participants
to allocated
group during
the study. It
is judged
that this
would not
influence
outcomes
Low
Quote: “Body
weight and
height
measurements,
blood draws
and DEXA
(body
composition)
were
performed by
clinical
research
nurses,
blinded to
treatment
groups”.
Comment:
Likely done.
Low Comment:
Missing data
relatively
balanced
across
intervention
groups.
Low
Comment:
Study
protocol
available
and all
pre-
specified
outcomes
reported
in pre-
specified
way.
Low The study
appears
free from
other
sources of
bias.
Tan et al.,
2012
Low Quote:
“Participants
were randomly
High Comment: No
information
provided on
Low Comment:
Exercise
interventions
preclude the
Low Comment: No
mention of
blinding of
outcome
Low Comment:
Missing data
relatively
balanced
Low
Comment:
Study
protocol
available
Low The study
appears
free from
other
91
allocated into
two groups”.
Comment:
Likely done.
method of
randomization.
blinding of
participants
to allocated
group during
the study. It
is judged
that this
would not
influence
outcomes
assessment. It
is judged that
this would not
influence
outcomes
across
intervention
groups.
Additionally,
reasons
unlikely to
affect
outcome
measures.
and all
pre-
specified
outcomes
reported
in pre-
specified
way.
sources of
bias.
Teixeira et
al., 2003
Low Quote:
“Subjects were
randomly
allocated to
assigned to one
year of weight-
lifting and
weight-bearing
exercise or to a
group with no
exercise.”
Comment:
Likely done.
High Comment:
Subjects stratified
by HRT status.
Low Comment:
Exercise
interventions
preclude the
blinding of
participants
to allocated
group during
the study. It
is judged
that this
would not
influence
outcomes
Low Quote:
“DEXA
technicians
were blind to
participants
group
assignments”.
Comment:
Likely done.
Low Comment:
No missing
data
apparent.
Low
Comment:
Study
protocol
available
and all
pre-
specified
outcomes
reported
in pre-
specified
way.
Low The study
appears
free from
other
sources of
bias.
Vilela et al.,
2015
Low Quote:
“Randomly
distributed in
control and
experimental
groups”.
Comment:
Likely done.
Unclear Quote:
“Randomly
assigned drawing
an opaque
envelope”, with
“names written
on them”.
Low Comment:
Exercise
interventions
preclude the
blinding of
participants
to allocated
group during
the study. It
Low Comment: No
mention of
blinding of
outcome
assessment. It
is judged that
this would not
influence
outcomes
Low Comment:
No missing
data
apparent.
Low Comment:
Study
protocol
available
and all
pre-
specified
outcomes
reported
Low The study
appears
free from
other
sources of
bias.
92
Comment: Likely
done.
is judged
that this
would not
influence
outcomes
in pre-
specified
way.
If study methodology did not explicitly state allocation was randomized, then it was deemed ‘high risk’ of bias for allocation concealment. Only
those studies using central randomization, sequentially numbered drug containers or sequentially numbered, opaque, sealed envelopes were
deemed ‘low risk.
93

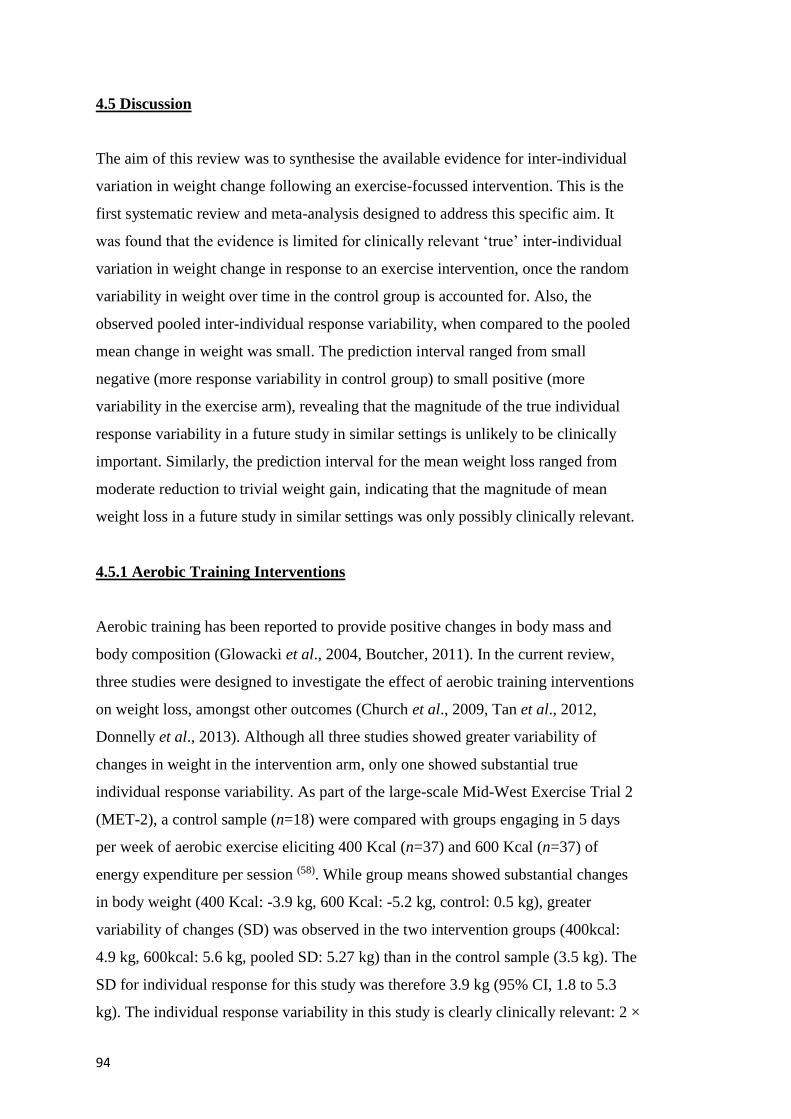
94
4.5 Discussion
The aim of this review was to synthesise the available evidence for inter-individual
variation in weight change following an exercise-focussed intervention. This is the
first systematic review and meta-analysis designed to address this specific aim. It
was found that the evidence is limited for clinically relevant ‘true’ inter-individual
variation in weight change in response to an exercise intervention, once the random
variability in weight over time in the control group is accounted for. Also, the
observed pooled inter-individual response variability, when compared to the pooled
mean change in weight was small. The prediction interval ranged from small
negative (more response variability in control group) to small positive (more
variability in the exercise arm), revealing that the magnitude of the true individual
response variability in a future study in similar settings is unlikely to be clinically
important. Similarly, the prediction interval for the mean weight loss ranged from
moderate reduction to trivial weight gain, indicating that the magnitude of mean
weight loss in a future study in similar settings was only possibly clinically relevant.
4.5.1 Aerobic Training Interventions
Aerobic training has been reported to provide positive changes in body mass and
body composition (Glowacki et al., 2004, Boutcher, 2011). In the current review,
three studies were designed to investigate the effect of aerobic training interventions
on weight loss, amongst other outcomes (Church et al., 2009, Tan et al., 2012,
Donnelly et al., 2013). Although all three studies showed greater variability of
changes in weight in the intervention arm, only one showed substantial true
individual response variability. As part of the large-scale Mid-West Exercise Trial 2
(MET-2), a control sample (n=18) were compared with groups engaging in 5 days
per week of aerobic exercise eliciting 400 Kcal (n=37) and 600 Kcal (n=37) of
energy expenditure per session (58). While group means showed substantial changes
in body weight (400 Kcal: -3.9 kg, 600 Kcal: -5.2 kg, control: 0.5 kg), greater
variability of changes (SD) was observed in the two intervention groups (400kcal:
4.9 kg, 600kcal: 5.6 kg, pooled SD: 5.27 kg) than in the control sample (3.5 kg). The
SD for individual response for this study was therefore 3.9 kg (95% CI, 1.8 to 5.3
kg). The individual response variability in this study is clearly clinically relevant: 2 ×
95
SD for individual response > minimal clinically important difference for the lower
confidence limit. Indeed, the true individual response variance in this study was at
least 7-fold greater than any other included study. Nevertheless, removal of this
study from the meta-analysis had no material effect on the pooled SD for inter-
individual variation in response (0.7 kg, vs. 0.8 kg with all studies included), and a
negligible effect on the heterogeneity. This finding is due in part to the low weight
afforded to this study in the analysis – just 1.03% - primarily due to relatively small
sample size. Similarly, in the large-scale Dose Response to Exercise in Women
DREW study, whilst some individuals did not meet their predicted weight loss
targets, almost identical variation was observed when participants were randomized
to either 4 kcal/kg/week exercise (n=139, 3.6), 8kcal/kg/week (n=85, 3.5) or 12
kcal/kg/week (n=93, 3.4) and when pooled (n= 316, 3.5) when compared to the
control sample (n=139, 3.37) (Church et al., 2009).
4.5.2 Resistance Training Interventions
The effects of concurrent training on body composition are equivocal. Weight gain
(Glowacki et al., 2004, Dolezal & Potteiger, 1998) has been reported, but positive
changes in other measures such as increased fat free mass (Dolzeal & Potteiger,
1998, Binder et al., 2005, Hoffman et al., 2006) and reduced body fat (Dolzeal &
Potteiger, 1998, Glowacki et al., 2004, Hoffman et al., 2006) have also been
described.
Three of the included papers were designed to investigate the effects of resistance
training on body weight (Prabhakaran et al., 1999, Schmitz et al., 2002, Teixeira et
al., 2003). Of these, one study showed a larger SD of body mass changes over 15
weeks of resistance training in intervention versus control (Schmitz et al., 2002).
This study reported trivial increases in mean body mass in both groups (Exercise:
0.54 kg, Control: 0.49 kg). The SD of the changes was 1.87 kg in intervention vs.
1.82 in control, resulting in a trivial SD for individual response of 0.4 kg.
In a similar manner to that reported in the previous chapter, two studies reported
greater variation in the control sample than in the intervention group. One study
investigating the effects of a one year RT intervention on women with and without
hormone replacement therapy reported between group mean differences (Texeira et
96
al., 2003); however, whilst weight change was small (EX (with HRT/without HRT) -
0.2/0.34kg, CON (with HRT/without HRT) 0.8/-0.4kg) analysis of pooled SDs
revealed more variation in the control sample than the intervention (CON - 3.05, RT
- 2.55).
The second study (Prabhakaran et al., 1999), whilst investigating the effects of 3xRT
per week, reported weight gain (0.49 kg) in RT, compared to -0.7 kg in CON.
Analysis of the SD of the change score again revealed more variation in the control
than the intervention sample (CON – 2.01, RT – 1.35). It appears from analysis of
the SD of the change scores that in response to a resistance training intervention,
greater inter-individual variation in the control group than in the intervention group
is apparent. From these studies, it appears that body weight is not a robust outcome
measure for a resistance training. Changes in body composition may be a preferential
approach.
4.5.3 Separate Aerobic and Resistance Training Interventions
A single paper reported upon the impact of separate training modalities (Donges et
al., 2010). Changes in fat mass and lean mass in a control sample (n=26), compared
to two intervention groups comprising of resistance training (RT) (n=35) and aerobic
training (AT) (n=41), were investigated over 10 weeks. Between group differences
in change in body mass were observed, with aerobic training losing body mass (-
0.8kg), while both resistance training (0.8kg) and control samples (0.6kg) both
increased body mass. The SD of the change in body mass was 1.3 kg in control, 1.5
kg in resistance training, and 1.9 kg in aerobic training (pooled intervention SD of
changes = 1.89 kg). The SD for individual response in this study was therefore 1.4
kg, representing small individual response variability.
4.5.4 Combined/Concurrent Training
The effects of concurrent training on body composition are equivocal. Weight loss
(Libardi, 2012) and weight gain (Glowacki et al., 2004) have been reported, but
other health outcomes are often also positively influenced (Dolezal & Potteiger,
1998). Five studies included in the present review were designed to examine the
97
effects of combined or concurrent aerobic and resistance exercise protocols
(Lockwood et al., 2008, Burtscher et al., 2009, Vilela et al., 2015, Baillot et al.,
2016, Dalager et al., 2016).
As part of the Pre-Surgical Exercise Training (PreSET) trial, 30 pre-bariatric surgery
participants were randomized to concurrent training (n=15) and control sample
(n=14) for a twelve-week intervention period (Baillot et al., 2016). Whilst the
intervention group undertook 80 minutes of exercise, three times per week, no
statistically different changes in weight loss were observed (CON -0.3, INT -0.92).
However, greater variance was observed in the control sample change score SD
(4.72) vs the intervention (3.55). Greater mean weight loss was observed in the
intervention group (-2.58 kg) compared to a control group (0.79 kg) in a smaller
study (Burtscher et al., 2009) than added 2 one hour combined aerobic and circuit-
type sessions per week for 12 months. Nevertheless, once again greater variance was
observed in the control sample change score SD (4.93) vs the intervention (4.12).
In a workplace-based study, 60 participants were randomized to control (n=30) or a
Workplace Fitness and Education Program (WFEP), consisting of five fifteen-minute
sessions per week, alternating muscular endurance and sporting activities (n=30)
(Vilela et al., 2015). No change in body mass was reported for the intervention
group, whilst the control group gained a mean weight of 0.4kg. The observed
variance was identical in both groups (2.6)
As part of a larger study, combined resistance and aerobic exercise was compared
with control and exercise over a ten-week period (Lockwood et al., 2008). Whilst a
second exercise condition with supplementation were excluded from my review, the
two observed conditions reported identical body mass changes (-0.3) and slightly
greater SD of the changes (INT 1.9 vs CON 1.6).
Clinically relevant individual response variability was present in just one trial of an
intervention involving 12 months of 1 hour per week combined aerobic and circuit-
style training (n=89), alongside recommendations to undertake 30 minutes of
exercise, 6 days per week, compared to a non-exercise control group (n=194)
(Dalager et al., 2016). Mean weight change was -0.49 kg in the intervention group
98
vs. 0.08 kg in control, with SD of the changes of 3.32 and 2.97 kg, respectively. The
SD for individual response was therefore 1.5 kg.
4.5.5 Limitations
I synthesised 12 studies involving a total of 1500 participants. Small sample size is
common in supervised exercise-based intervention trials (Keating et al., 2017), but
this review included 4 larger (N=>100) studies (Church et al., 2009, Teixeira et al.,
2003, Donges et al., 2010, Dalager et al., 2016). Six studies recruited fewer than 20
participants for one or more of the groups (Prabhakaran et al., 1999, Lockwood et
al., 2008, Burtscher et al., 2009, Tan et al., 2012, Donnelly et al., 2013 Baillot et al.,
2016), and might be prone to small study bias at the individual study level.
I restricted the search to RCTs incorporating exercise-only interventions; included
studies differed by exercise mode, intensity, frequency and duration, and length of
intervention. This intervention heterogeneity might influence mean effects and/ or
individual response variance. There are too few studies to compare the effects in, for
example, aerobic versus resistance versus combined interventions.
Given the substantial heterogeneity of the true individual response variance, I
derived and presented a prediction interval capturing the plausible range for the true
individual response variability, consistent with the data and model, in a future study
in similar settings. The prediction interval has been described as providing
“potentially the most relevant and complete statistical inferences to be drawn from
random effects meta-analyses” (Higgins et al., 2009). However, I must exercise due
caution in inferences drawn from the prediction interval given the coverage issues
identified in the simulations recently conducted (Partlett and Riley, 2017), where
these authors reported that the coverage of the interval was particularly poor in cases
of low effect heterogeneity and/or markedly variable sample size. With the specific
combination of number of studies, between-study heterogeneity of individual
response variance and mixture of study sizes in the current review (with REML and
Knapp-Hartung estimation) these simulations indicate a maximum under-coverage of
the derived prediction interval of 1%. Such under-coverage would have no material
effect on the derived probability of individual response variance in a future trial
99
being clinically relevant. However, I still consider it prudent to view the prediction
interval as approximate, as recommended by Partlett and Riley.
Where multiple exercise arms were present in a study, these were combined to avoid
double counting of the control arm. This may obscure the effect of different exercise
doses; however, analysis of each individual exercise condition vs control, revealed
no material difference in individual response variability.
In advance of the study, I proposed various potential effect modifiers (moderators) to
account for heterogeneity in individual response variance, including baseline body
weight, age, and sex. However, I elected not to conduct any secondary meta
regression analyses, as I only had access to study-level covariates (e.g., mean
baseline weight, mean age, and proportion of males/females). This type of analysis
has been described as ‘daft’(Fisher et al., 2017), as it has a high risk of ecological
bias (Petkova et al., 2013); the ‘deft’ approach advocated by Fisher et al. requires
either study level analysis of the effects of putative effect modifiers (e.g., treatment
interaction effects with sex, age, weight etc.), or an individual-participant data meta-
analysis, with relevant interaction terms included in the model. However, obtaining
individual participant data from study authors would likely prove to be a major
undertaking in this, or indeed any, review. This contention is underscored by the
difficulties I experienced in communicating with authors merely to obtain a simple
standard deviation of change scores from the data.
Additionally, the energy expenditure induced by the exercise interventions
undertaken in the included studies – and whether this would be sufficient, in theory,
to induce weight loss above the minimal clinically important difference – is
unknown. Whilst beyond the scope of this systematic review and meta-analysis, it is
therefore unknown what effects exercise protocols with larger energy expenditures
would elicit.
To make inferences in the current study I adopted a threshold for the minimum
clinically important weight loss of 2.5 kg – the smallest threshold of absolute weight
loss for clinical benefit previously reported (Jensen et al., 2014). Those who disagree
100
with this choice may consider the reported prediction intervals in relation to their
own belief in the minimum clinically important difference to make inferences.
Whilst it is beyond the scope of this study to speculate, given the lack of exercise
training quantification, such as adherence rates and fidelity it is unknown as to what
impact this and other factors such as baseline activity/weight status may have
impacted these findings. Future studies may look to include these outcomes in order
to fully quantify the training response.
I acknowledge that 20 possibly eligible studies were excluded due to their authors
not providing the data requested by e-mail communication. I must, however, assume
that these studies are missing at random, as I have no reason to believe that authors
would withhold data pertaining to response variance.
4.5.6 Findings in Relation to Current Recommendations and Future Research
Directions
This is the first systematic review to focus on the true inter-individual variation in
weight loss in response to exercise interventions. I conducted a comprehensive
literature search over 14 databases. Evidence in relation to the inter-individual
response to various treatments/ interventions is growing rapidly. However, based on
the findings of this systematic review, I find limited evidence for the presence of
clinically important ‘true’ inter-individual variation in body mass in response to
exercise training. Therefore, further investigation of underpinning mechanisms is
likely not warranted, as the prediction interval reveals that individual response
variance in a future study in similar settings is unlikely to be clinically important. A
caveat here, as acknowledged above, is that I only synthesised 12 effects from
heterogeneous exercise interventions. If individual differences in response to
interventions targeting body weight are considered important from a precision
medicine standpoint, then future randomised trials should be sufficiently sized to
afford adequate precision of estimation for both mean intervention effects and the
SD for individual responses. The latter would require at least 4× the sample size
required to define the mean intervention effect with adequate power and precision,
and even larger samples if individual response variance is trivial-small.
101
4.5.7 Conclusions
To date, much of the research claiming to show substantial inter-individual
differences in response to an exercise intervention has been conducted in the absence
of a suitable comparator sample (King et al., 2008, Cauldwell et al., 2009, Cauldwell
et al., 2013). To quantify the true inter-individual response to an exercise
intervention, studies should include a comparator arm, preferably in a randomised
controlled trial. Future work should employ this research design and incorporate
sound statistical quantification of the response variance in each arm, combined with
a threshold for the minimal clinically important difference, to determine the presence
of clinically important individual variation in response. In summary, my findings
constitute limited evidence for the notion of substantial inter-individual differences
in weight loss responses to exercise interventions; individual response variability in a
future trial in similar settings is unlikely to be clinically important. These findings, if
replicated, confirmed, and extended, might prevent researchers wasting valuable
resources searching for explanations of treatment heterogeneity that does not exist or
is clinically trivial.
102
Chapter 5: A Secondary Analysis of Data from the PREMIER Study
5.1 Preface
Elevated blood pressure and increased body mass are important risk factors for
diabetes, cardiovascular disease and some cancers, making lifestyle interventions to
improve these markers especially relevant. There is purported to be substantial inter-
individual differences in how blood pressure and body mass respond to
lifestyle/exercise interventions, but studies often lack the comparator data and
associated analyses necessary for robust inferences. Recently, an appropriate
approach for quantifying these inter-individual differences was described (Atkinson
& Batterham, 2015, Hopkins, 2015). Therefore, I aimed to quantify inter-individual
differences in the responses of weight loss and blood pressure to lifestyle
intervention. Data from the PREMIER Trial were analysed, to quantify the effects of
the DASH diet in combination with established treatment (ED) as well as established
treatment (E) on systolic blood pressure (SBP), diastolic blood pressure (DBP) and
weight loss in comparison to a comparator/advice group.
5.2 Introduction
5.2.1 Elevated Blood Pressure and Cardiovascular Disease Risk
Elevated blood pressure is a common risk factor for cardiovascular disease (Appel et
al., 2003). Lifetime risk of developing hypertension has been reported to be
approximately 90% (Vasan et al., 2002), but even above-optimal blood pressure that
is not classified as hypertensive can increase the risk of cardiovascular disease
(Vasan et al., 2001). Current recommendations for the prevention and treatment of
high blood pressure have placed an emphasis upon lifestyle modification (Whelton et
al., 2002), such as weight loss, reduced sodium intake, increased physical activity
and limited alcohol consumption. Reductions in SBP and DBP of ≥2 mm Hg
can substantially reduce the incidence of CVD in both hypertensive and
normotensive individuals, and therefore small reductions of this magnitude are
considered clinically meaningful (Turnbull et al., 2003), whilst, a 5 mmHg reduction
in systolic BP in the population would be predicted to result in a 14% overall
103
reduction in mortality due to stroke, a 9% reduction in mortality due to coronary
heart disease, and a 7% decrease in all-cause mortality (Whelton et al. 2002). Given
the burden these diseases create upon the healthcare community, it is clear that
interventions to reduce this risk are required.
5.2.2 Gender Differences in Blood Pressure
In general, men are reported to have higher blood pressure than women through
middle age (Burl et al., 1995). Furthermore, the incidence of uncontrolled
hypertension is also greater in men than in women (Anastos et al., 1991), possibly
due to the role played by testosterone (Reckelhoff, 2001).
5.2.3 Impact of Weight Change
Obesity and other comorbidities continue to increase among both sexes (Mokdad et
al., 2003). The impact of obesity remains considerable, with associated health risks
conferring increased likelihood of the development of diabetes (Mokdad et al.,
2003), hypertension (Huang et al., 1998, Mokdad et al., 2003), cardiovascular
disease (Poirier et al., 2006) and metabolic syndrome (Despres et al., 2008). It has
also been suggested that dietary modification by itself reduces the risk of secondary
myocardial infarction by about half in patients with coronary disease (de Lorgeril et
al., 1999). Williamson et al. (2018) adopted a threshold for the minimum clinically
important weight loss of 2.5 kg – the smallest threshold of absolute weight loss for
clinical benefit previously reported (Jensen et al., 2014). Given this information,
further efforts should focus on the prevention and treatment of overweight
individuals through measures to prevent and reduce the burden of ill health, such as
dietary modification and increased physical activity/ exercise.
5.2.4 Use of the DASH Diet
The Dietary Approaches to Stop Hypertension (DASH) trial was a randomized,
multicentre, comparing the effect on blood pressure of 3 dietary patterns: control,
fruits and vegetables, and combination diets, with patterns differing in selected
nutrients hypothesized to alter blood pressure (Karanja et al., 1999). Application of
the DASH diet as an intervention has previously been reported to contribute to
104
reduced blood pressure (Stacks et al., 2001a, Svetkey et al., 2005), with greater
improvements in vascular and autonomic function than advice alone (Blumenthal et
al., 2010) and lowering of both LDL and total cholesterol (Obarzanek et al., 2001).
5.2.5 Inter-Individual Variation in Response
Interest in the concept of individual responses to exercise interventions has been
growing over the last 30 years (Prud’homme et al., 1984, Despres et al., 1984, Lortie
et al., 1984, Rose & Parfit, 2007, Bouchard et al., 2015, Mann et al., 2014) and it has
been postulated, for example, that the benefits of physical activity may vary between
age and gender groups (Peterson, 2007). Most public health and exercise research
focuses upon mean group changes (Bouchard & Rankinen, 2001), but these may hide
a wide range of responses (Karavirta et al., 2011) and do not allow us to distinguish
the inter-individual variation in response (Senn, 2004). ‘True’ inter-individual
differences in the response to an intervention are less frequently reported, even
though it has been proposed that there is large inter-individual variability in response
to physical activity interventions (Prud’homme et al., 1984, Despres et al., 1984,
Lortie et al., 1984, Savard et al., 1985, Hamel et al., 1986, Simoneau et al., 1986,
Bouchard & Rankkinen 2001, Hautala et al. 2003).
Importantly, even in the studies in which inter-individual differences in the response
to exercise training are considered, concerns have been levelled at the designs and
analysis approaches in these investigations (Hopkins, 2015, Atkinson & Batterham,
2016, Williamson et al., 2017). It has recently been described how the key trigger for
further investigation into inter-individual responses is when the standard deviation of
change (SDchange) in the intervention sample is substantially larger than the same
standard deviation derived from a suitable comparator sample (Hopkins, 2015,
Atkinson & Batterham, 2016, Williamson et al., 2017). Only when inter-individual
variations in response are quantified, using the equation
𝑆𝐷𝐼𝑅 = √𝑆𝐷𝐼2 − 𝑆𝐷𝐶
2 (showing larger variation in the SDchange in an intervention
group vs a control group), should further investigations into possible mediators of
response be undertaken.
105
To this end, it was my intention to carry out a detailed and rigorous secondary
analysis, using the methodology recently described (Hopkins, 2015, Atkinson &
Batterham, 2015, Williamson et al., 2017) of the data collected during the
PREMIER Trial, to correctly quantify the ‘true’ inter-individual variation in weight
loss and blood pressure response.
5.3 Methods
5.3.1 The PREMIER Trial
The PREMIER research design and rationale has previously been published (Svetkey
et al., 2003). It was a multicentre randomized study, targeted at generally healthy
adults (n=810), aged 25 years or older, with a body mass index of 18.5 – 45, and
with above optimal blood pressure. The study was aimed at identifying the effect of
an established intervention (a behavioural intervention that implemented traditional
lifestyle recommendations such as weight loss, reduced sodium intake, increased
physical activity and limited alcohol intake, n=268), and established intervention
plus DASH diet (the same as the ‘established’ group, with the addition of dietary
goals and strategies to achieve weight loss through implementation of the DASH
diet, n=269) against an advice only group (who received a single, 30 minute
individual discussion session with an interventionist, typically a registered dietician,
following randomization, n=273). The sample size in the PREMIER trial was large,
and the trial was powered (90%, p=0.05) to detect a difference in blood pressure
between arms of 1.6-1.8 mmHg. However, the trial was not powered to detect
interactions (e.g. sub-group effects) of the same magnitude, as this would require
four times the sample size required to detect the overall main effect (the ‘rule of 4’).
Baseline characteristics including age, blood pressure, height, body mass were all
measured, and no substantial differences between arms were observed at baseline.
Blood pressure was obtained by trained, certified individuals, where, following 5
minutes rest, the observer measured blood pressure in the right arm, with systolic
blood pressure defined as the appearance of the first Korotkoff sound, and diastolic
as the disappearance of the Korotkoff sounds (Appel et al., 2003).
106
5.3.2 Statistical Analysis and Results
The present investigation was run in three parts. The first was determined to be a
reproducibility analysis, whereby I attempted to reproduce the original published
results for systolic blood pressure (SBP), diastolic blood pressure (DBP) and weight
change (Appel et al., 2003), by running the same analysis reported by the authors.
Analyses were conducted using SPSS software (v23, IBM, New York, United
States), with change in outcome from baseline to 6-months as the dependent
variable, and intervention arm, clinical centre/cohort, and the raw baseline
measurement of each variable as independent variables using a linear mixed model
with random intercepts for subject.
The published point estimates and 95% confidence intervals for the differences
between trial arms in the change from baseline to 6 months were reproduced
successfully for all outcomes (Appel et al., 2003). This is a crucial first step in
advance of any more nuanced secondary analysis, as it provides confidence in the
integrity of the raw data.
To investigate the ‘true’ inter-individual variation in response, a linear mixed model
was again used. The advice only group (control) provided the counterfactual for both
men and women, allowing for the observation of response variance in the
intervention over and above that seen in the control.
I derived the SD for true individual responses using an extension of the method
described in Atkinson and Batterham (2015). As there are two intervention arms
(each versus control) two dummy variables are required - XVAR1 and XVAR2 – to
allow for and quantify additional response variance in each intervention versus
control. The XVAR1 variable has a score of ‘1’ when coincident with the
Established group and ‘0’ otherwise, whereas XVAR2 had a score of ‘1’ when
associated with the Established+DASH (ED) arm and ‘0’ otherwise. In a linear
mixed model, the change in outcome from baseline to 6 months was the dependent
variable, with sex, clinical centre/ cohort, and baseline value of the outcome as fixed
effects. The two dummy variables were included as random slopes with no intercept.
Using this approach, for SBP, the mean changes were E -3.7 (90%CI -5.3 to -2.1)
107
mmHg, ED –4.3 (-5.9 to -2.8) mmHg versus advice only. The SDIR for E vs advice
was 4.4 (1.3 to 6) mmHg, compared to ED vs advice of 3.4 (-2.2 to 5.3) mmHg. For
DBP, the mean changes were E -1.7 (-2.8 to -0.6) mmHg, ED –2.6 (-3.7 to -1.5)
mmHg versus advice only. The pooled SDIRs were 2.1 (-1.9 to 3.5) mmHg and 2.6 (-
1.3 to 3.9) mmHg for E vs advice and ED, respectively. Given that we double these
SDIRs before evaluating its magnitude to reflect a comparison between a typically
high (mean + SDIR) and typically low (mean – SDIR) responder (Hopkins, 2015), if
the MCID is 2 mmHg, then a moderate effect is 3x this = 6 mmHg, and a large effect
is 6x this = 12 mmHg. Therefore, when compared to a relevant MCID of a 2-3
mmHg reduction (Turnbull et al., 2003), these results (E 2*SDIR=4.2, ED
2*SDIR=5.2) indicate small-moderate inter-individual variation in response.
For weight change, the mean weight loss was -3.5 kg (90% CI -4.2 to -2.7) kg in E
versus advice only and -4.2 kg (-5.0 to -3.4) in ED versus advice only. The pooled
SDIR for E vs advice was -4.3 (3.7 to 4.8) kg, compared to ED vs advice of -4.5 (4.0
to 5.0) kg.
The second part of the investigation was to investigate the impact of sex on the ‘true’
inter-individual variation in response to the treatments; that is, does sex account for
any of the observed treatment heterogeneity? The linear mixed model approach was
utilised again, although this time a sex-by-treatment interaction was included. This
interaction term quantifies the difference between men and women in the mean
effect of the intervention versus control. For SBP, male SBP reduced in E versus
advice by 4.7 (95% CI -7.3 to -2.1) mmHg and females reduced by 3.1 (-5.1 to -1.2)
mmHg. Men therefore have a greater response in E versus advice than women by 1.6
(-1.7 to 4.8) mmHg. In ED versus advice, males reduced SBP by 5.6 (90%CI -8.1 to
-3.2) mmHg and females reduced by -3.5 (-5.5 to -1.5) mmHg, resulting in a 2.1 (-
1.0 to 5.3) mmHg mean difference in response between men and women following
ED.
The sex-by-treatment interaction would be expected to explain at least some of the
observed individual response variance, leading to a reduction in the SD for
individual responses when the interaction is included in the model. However, this
was not the case. When sex-by-treatment was added to the model, the SDIR for E vs
108
advice remained -4.4 mmHg, compared to ED vs advice of -3.4 mmHg. For DBP,
the SDIRs once again remained essentially unchanged. The SDIR for E vs advice was
-2.0, compared to ED vs advice of -2.6 mmHg. For weight change, a similar
phenomenon was evident. When sex-by-treatment interaction was added to the
model, a difference of 1.8 kg between men and women was observed for ED,
compared to 1.2 kg in E. The SDIR for both intervention arms was effectively
unchanged (4.3 kg vs 4.5 kg).
The fact that sex does not explain any of the observed individual response variance,
even though there is a difference in mean response between the genders, is
paradoxical, as it cannot be the case that a substantial sex-by-treatment interaction
does not account for some of the observed overall treatment heterogeneity. To that
end, further analysis was undertaken, to try to elucidate this paradox. The third part
of the analysis was to model the data separately, with the dataset split by gender. The
same statistical model described above was applied, but of course with the sex-by-
treatment interaction removed. For men, in E, the SDIR was 6.2 (90% CI 2.9 to 8.3)
mmHg, compared to 5.7 (2.4 to 7.7) mmHg in ED. For women, in E, the SDIR was
3.1 (-2.8 to 5.6) mmHg, yet in ED alone, the SD IR was -1.3 (-4.8 to 4.5) mmHg.
This indicates a magnitude of ‘true’ inter-individual variation in response that is
vastly greater in men than that observed in women, and that there is more inter-
individual variation in response in the advice group than ED in women. The SDIR is
also greater than the mean effect. Therefore, it appears that in SBP, the overall SDIR
overestimates female SDIR and underestimated male SDIR.
For DBP, when split by sex, a slightly different trend occurs. In men, in response to
E and ED, SDIRs are 1.5 (90% CI -3.4 to 4.1) mmHg and 3.9 (-0.9 to 5.5) mmHg
respectively, whilst in women, they are 2.2 (-2.2 to 3.9) mmHg and 1.2 (-2.9 to 3.3)
mmHg respectively.
When split by sex, inter-individual variation in weight change followed a similar
trend to SBP. The observed variance was approximately double in men than in
women. For men, in response to E and ED, SDIR was -4.9 (4.0 to 5.7) kg and -5.5
(4.6 to 6.2) kg respectively. This was approximately double the amount presented as
an MCID in Chapter 4. When interpreting the SD for individual responses we double
109
it, therefore these individual responses are classified as moderate. In women, SDIR
was -3.8 (3.1 to 4.5) kg and -3.7 (2.6 to 4.3) kg for E and ED respectively.
5.3.3 Individual Prediction Interval for a New Participant
As a novel method, I propose that the individual response variance derived from an
RCT may be used to construct a 95% individual prediction interval. This interval
provides a plausible range for the response of a new participant undergoing the same
intervention in a similar setting, versus what would have happened to this participant
had they not engaged in the intervention (the counterfactual). The approach I have
taken mirrors the method used to derive a prediction interval for a new study in a
random effects meta-analysis (IntHout et al., 2016). As an example, consider the
effect of the Established plus DASH intervention versus advice only in men. The
mean effect was a reduction in systolic blood pressure of 5.6 mmHg, with a standard
error of 1.235, and a SD for individual responses of 5.7 mmHg. The standard error
(SE) for the individual participant prediction interval is given by:
SE = √(1.2352+5.72) = 5.83.
The next step is to multiply the SE by the appropriate value from the t distribution
(1.971) for a 95% interval for the degrees of freedom (211) for this effect: 5.83 ×
1.971 = 11.5. The 95% prediction interval is then derived as the mean change minus
11.5 to the mean change plus 11.5:
-5.6-11.5 to -5.6+11.5 = -17 to 6 mmHg.
Given the substantial observed treatment heterogeneity in men, the plausible range of
effects for a new male participant undertaking the Established plus DASH
intervention (versus a hypothetical control) spans moderate harmful (+6 mmHg;
increased systolic blood pressure) to a large beneficial effect (-17 mmHg). It is then
straightforward to estimate the probability that a new male participant would benefit
from the intervention by at least the minimum clinically important difference
(MCID) of 2 mmHg. The t value required to derive this probability is given by the
observed mean effect minus the MCID, divided by the SE of the prediction interval:
110
(5.6-2)/5.83 = 0.617. The area under the t-distribution to the left of 0.617 is 0.73.
Therefore, the probability (% chances) that a new male participant undergoing this
intervention would benefit is 73%, or odds in favour of benefit of almost 3:1. Using
the same method, for a new male participant the probability of an increase in blood
pressure post-intervention of >2 mmHg (the MCID) is 10%, and there is a 17%
probability of a trivial change (within ± the MCID). These findings imply that
around 7/10 new individuals would derive beneficial reductions in systolic blood
pressure as a result of such an intervention, 1-in-10 would get worse, and 2/10 would
experience no substantial change. These values are an average, with a confidence
interval, which are subject to the uncertainty in the SDIR. Of course, further research
is required to help explain the marked individual response variance in men and to
identify the characteristics of participants most likely to benefit. For example,
intervention fidelity is probably an important mediator of treatment effect, but no
detailed data are available on this variable.
5.4 Discussion
My aim was to carry out secondary analysis of the data collected during the
PREMIER trial, in order to correctly quantify the ‘true’ inter-individual variation in
weight change and blood pressure response to advice only, established care and
established care plus the DASH diet. The key findings were that there are large SBP
and weight loss individual responses for men but not for women, and that an
interesting paradox regarding the distribution of the ‘true’ inter-individual variation
in responses was observed.
5.4.1 Initial Exploratory Observation of Response Variance
The SD for the raw SBP change scores was 9.9 mmHg in the intervention vs. 9.2
mmHg in advice only. However, it is a flawed approach to think in SD units rather
than variance and therefore assuming trivial IR. To explain fully, SQRT (9.9^2-
9.2^2) is 3.66 mmHg, which is substantial. On initial appraisal, there initially
appears to be a trivial difference in SDs (9.9 vs 9.2). However, when you have SDs
of this magnitude, squaring them magnifies the difference between them (i.e. 98.01
111
vs 84.64), versus the same difference in SDchange of 0.7, with a smaller overall SD,
for example 1.7 (2.89) in one group and 1.0 (1) in the other. This highlights the
additional need to think in terms of differences in response variance, and then
express the individual response variability as an SD.
5.4.2 Systolic Blood Pressure
The original PREMIER trial was reported to reduce blood pressure, thereby reducing
prevalence of hypertension in the cohort (McGuire et al., 2004), suggesting that the
DASH diet had numerous possible health benefits. The DASH diet has also
previously been reported to substantially reduce blood pressure (Stacks et al., 2001a,
Stacks et al., 2001b).
The value of 11.99 mmHg for the individual response variance, calculated from the
original raw PREMIER data, thereby giving an SDIR of 3.4 mmHg, from the full
sample analysis is ‘false’. This led to an inability to explain or account for any of the
variance when a sex by treatment interaction was entered in the model; the
explanatory effect of the mean difference between sexes for the effect of treatment is
actually offset by the large difference in response variance in men vs. women.
This finding also applies to the raw change scores in men and women for both the
treatment arms and the control, where the SD of the changes in women is larger for
advice only than for ED. This phenomenon is only fully observed when sex-by-
treatment group interaction is entered in the model. The mean difference (point
estimate) in the effect of the treatment in men vs. women is substantial and should
therefore show up as individual responses that would then have attenuated when a
sex-by-treatment interaction was entered into the analysis. If a linear mixed model
were run without this interaction, substantial individual response variance would be
evident. When the model has the interaction term added, this variance will disappear,
or reduce, based upon the extent to which sex explains that portion of variance.
It is usually the case that substantial interaction terms cannot be present without
observing a large inter-individual variation in response that is then at least partially
explained by the interaction term. However, in this case, it does not explain or
112
account for any of the 11.99 mmHg individual response variance. In practice, if there
are independent groups (such as sex), then separate analyses should be undertaken
early in the process, in order to identify the presence of such a phenomenon. This is
highlighted by the fact that the value of 11.99 mmHg, derived from the full model
for the individual response variance, does not accurately apply to either men or
women in this case, and therefore cannot be explained by any available moderators.
Practically, these observed SDIR are large, when compared to a minimal clinically
important difference (MCID) of 2-3 mmHg for reducing mortality (Turnbull et al.,
2003). When we double the SDIR, as is required to evaluate the individual variation
in response to a clinically anchored MCID, the magnitude of individual variation in
response is actually 3-4 times the size of the relevant MCIDs.
5.4.3 Diastolic Blood Pressure
Non-significant differences in DBP have been reported between both men and
women (Jaquet et al., 1998). In the present secondary analysis, a mean difference in
reduction of DBP of 2 mmHg was observed between men and women, with men
showing, on average, a greater mean change. However, a divergent trend was evident
in inter-individual variation; the observed SDIR was smaller in men in ED than
women, whilst conversely, women had smaller SDIR in E only, compared to men.
The observed inter-individual variation in DBP were of a magnitude of 0.75 to 1.9
times the MCID (2 mmHg), indicating that these variations in response may be of
clinical significance.
5.4.4 Weight Loss
Previous research has reported larger reductions in blood pressure with DASH or
DASH with weight management (calorie restriction of 500 kcal) than those reported
in the PREMIER Trial (Blumenthal et al., 2010). This may be as a result of the
weight manipulation through calorie restriction, the addition of supervised exercise,
or the comparatively small sample size (n=144) inflating the effect of the
intervention. In the PREMIER dataset, whilst similar mean responses were observed
for weight loss, the same phenomenon was observed as for SBP. The observed true
113
individual response variance in men was almost double that observed in women,
leading to substantially greater SD for individual responses in men. These were of a
much greater magnitude of those suggested in Chapter 4 (2.5 kg), at a conservative
estimate, to confer positive health benefits, indicating moderate inter-individual
variation in response. In addition, these data show that diet may confer more positive
benefits than exercise for weight loss, with a greater effect observed in this analysis,
compared to those previously reported (Williamson et al., 2018).
5.5 Conclusions
When analysing the original PREMIER trial dataset, there is ‘false’ observed overall
individual response variability for SBP and weight change, due to the presence of
zero/ negative individual response variance in women, but very large inter-individual
response variance in men. Whilst the effect in women is relatively consistent and in
men much more variable, the individual response variance for SBP (11.99 mmHg)
estimated from the whole sample does not apply well to either men or women,
underestimating men and overestimating women. This is why including the sex-by-
treatment interaction did not explain any of the overall SDIR, as virtually all of the
individual response variance is in men not women. Women appear to be more
consistent responders to the intervention than men, for some reason. The reason for
this is unknown, but could, speculatively, be due to be higher intervention fidelity in
women, whereby they listen to, and follow instructions, with greater accuracy than
men.
Therefore, putting a sex-by-treatment interaction in the model for this dataset does
not account for any of the ‘true’ inter-individual response variance for SBP or weight
change. This finding arises due to the ‘overall individual response variance being
false. The vast difference in individual response variance between men and women
completely overwhelms and offsets any reduction in the ‘pooled’ individual response
variance when the sex-by-treatment interaction is included in the model, making it
appear that sex is not a moderator of the individual response variance.
This issue should provide a cautionary tale and a recommendation to all researchers
doing these types of analyses, highlighting a crucial point that the analyses must – at
114
least initially – be stratified by sex, rather than deriving the overall sample individual
response variance, as it may be erroneous, as it is in this instance.
The use of a Prediction Interval for this analysis provides a novel approach to
providing a plausible range for the response of a new participant undergoing the
same intervention in a similar setting, versus what would have happened to this
participant had they not engaged in the intervention. This approach has not been
utilised in the secondary analysis of data and, as long as the SDIR and its associated
confidence intervals are relatively precise, can reliably predict the likelihood of a
positive change being conferred upon an individual in undertaking interventions in
future settings, with the caveat that it requires a precise estimate of SDIR.
This secondary analysis of the PREMIER trial data showed much larger inter-
individual variations in the response of weight loss and blood pressure control in
men to established treatment and established treatment plus DASH diet, when
compared to women, of a magnitude 3-4 times the MCID. The findings reinforce the
requirement for a suitable comparator sample, as discussed repeatedly in this thesis.
It is beyond the scope of this investigation, however, speculatively, these findings
may be the result of greater fidelity in women. Additionally, the findings create clear
areas for further investigation aimed at better-targeted interventions for subgroups,
including the response and reactivity of blood pressure in response to exercise.
115
Chapter 6: Inter-Individual Differences in Acute Blood Pressure
and Heart Rate Response to High Intensity Aerobic Exercise: A
Replicate Crossover Design
6.1 Preface
Given the findings of substantial ‘true’ inter-individual variation in response of
systolic blood pressure in response to chronic lifestyle interventions reported in
Chapter 5, it is important to identify whether these responses may be present acutely
following exercise challenges. Therefore, in this chapter, I aimed to quantify and
partition the many possible elements of variation of blood pressure and heart rate
response following bouts of high intensity ‘aerobic’ interval exercise, using a novel
replicate crossover trial. The key to this is the use of specific coding for the analysis
and partitioning of variance into ‘consistent’ and ‘one-time’ inter-individual
variation in response.
6.2 Introduction
Blood pressure is the product of cardiac output and total peripheral resistance
(Sabbahi et al., 2018). High blood pressure, or hypertension, affects approximately
25% of the population (Carpio-Rivera et al., 2015), and is the major risk factor for
cardiovascular disease (Boutcher & Boutcher, 2017). Chronic exercise is
consistently reported to reduce blood pressure (Fagard, 2005, Cardoso et al., 2010,
Pescatello et al., 2004a). However, it has been suggested that this finding may
disregard the last bout effect of acute exercise if the measurement is taken close to
the preceding exercise bout, which has been shown to reduce blood pressure (post
exercise hypotension (PEH)) (Carpio-Rivera et al., 2015) in the period 5-60 minutes
post-exercise.
6.2.1 Post Exercise Hypotension
The magnitude of hypotension in the post-exercise period is generally greater than
observed chronically and lasts from minutes (MacDonald 2002) to hours (Pescatello
116
et al., 2004b), and differs by time of day (Jones et al., 2008), intensity and duration,
but not by total work completed (Jones et al., 2007). Immediately post-acute
exercise, systolic blood pressure usually normalises rapidly, though can also be
subject to a large drop due to excessive venous pooling (Le et al., 2008), while a
decline in acute systolic blood pressure of >10 mm Hg below resting value is
associated with increased cardiovascular risk (Dubach et al., 1988). However, it is
possible that chronic reduction in blood pressure may be due to the contribution of
accumulated acute episodes of PEH (Thompson et al., 2001). Diastolic blood
pressure remains generally unchanged or slightly decreases in normotensive subjects
(Palatini, 1988).
6.2.2 Blood Pressure Reactivity
This PEH is preceded by an increase in post-exercise blood pressure – a
phenomenon called blood pressure reactivity. Submaximal exercise has been
reported to elicit similar cardiovascular responses as those observed via
psychological stressors (Lambiase et al., 2013). Whilst SBP normally rises during
dynamic exercise in response to increased cardiac output (Jae et al., 2015), an
exaggerated peak SBP reactivity (defined as an increase during exercise testing to
≥210 mmHg (Jae et al., 2006)) is an indication to stop any cardiopulmonary testing
(Pescatello et al., 2014) and is associated with risk of developing hypertension
(Matthew et al., 1998).
6.2.3 The Mechanisms of Blood Pressure Response
Higher fitness levels appear to elicit a smaller magnitude of heart rate reactivity
response (Boutcher & Nugent, 1993), though the mechanisms for this are, as yet,
unknown (Lambiase et al., 2013). It has been suggested that as exercise elicits
norepinephrine release in a curvilinear manner in response to increased workload
and in combination with epinephrine (Kaufman & Forster, 1996), these chemical
responses may be responsible for the magnitude of the rise in exercise heart rate and
blood pressure.
117
6.2.4 Gender Differences in Response
There are reports that males and females, whilst utilising the same pathways for
stress response, appear to differ in response (Huang et al., 2013). Males present
larger diastolic blood pressure responses to acute exercise, which may suggest that
male responses are ‘vascular’ while female responses are ‘cardiac’ (Allen et al.,
1993).
6.2.5 Inter-Individual Differences in Response
Interest in the individual response to a treatment intervention has gathered
momentum over the last three decades (Prud’Homme et al., 1984, Lortie et al., 1984,
Hamel et al., 1986, Rose & Parfitt, 2007, Senn et al., 2011, Bouchard et al., 2012,
Mann et al., 2014, Snyder et al., 1997, Barbeau et al., 1999, King et al., 2008,
Barwell et al., 2009, Caudwell et al., 2009, Caudwell et al., 2013), developing
interest in the concept of precision medicine – incorporating ‘made-to-measure’
therapies based on the individual response of a patient (Senn et al., 2011). It has been
suggested that personalized medicine may revolutionize healthcare through
utilization of individual genetic information, thereby improving drug safety and
efficacy (Katsanis et al., 2008). However, previously reported associations been
between genotype and phenotype are often too small to provide sufficient evidence
for response or phenotype prediction (Khoury & Galea, 2016).
Most researchers have presented mean data, with inter-individual variation in
response often being overlooked (King et al., 2012). This focus on mean effects may
hide important observations that a fixed dose of exercise may have varying effects
upon individuals (Bouchard, 1983, Bouchard & Rankinen, 2001, King et al., 2008).
It has been suggested that belief in inter-individual variation as the cause of observed
variation in treatment response outcomes may be due to lack of rigorous study
design (Senn et al., 2011).
118
6.2.6 Partitioning Variance Through the Replicate Crossover
It has previously been described how attempts to quantify the inter-individual
variation response to chronic exercise are hampered by a lack of a control sample
(Atkinson & Batterham, 2015, Williamson et al., 2017). Recent insights have
suggested a new approach in order to partition and quantify variance in trials of acute
responses: the replicate crossover (Senn, 2016). This method is suggested to allow
for the isolation of components of variation corresponding to patient-by-treatment
interaction (Senn et al., 2011), as replication of both an intervention and a control
period allows for an interaction to be determined.
Given the lack of previous investigation into this subject, and in the knowledge that
blood pressure reactivity varies with circadian rhythm (Jones et al., 2006), it is of
interest to investigate the presence of any inter-individual variation in this reactivity.
Whilst the replicate crossover method for attempting to partition variance was
recently utilised (Goltz et al., 2018), no previously published studies have
investigated the acute inter-individual variation in blood pressure reactivity to
exercise. Additionally, the study by Goltz et al. (2017) compared three analysis
methods, all of which were different from that proposed by Senn et al., (2011).
Therefore, in the first replicate crossover design study to quantify inter-individual
variability of blood pressure reactivity in response to exercise, the aim of this study
was to identify the presence of any ‘true’ inter-individual variation in post-exercise
blood pressure reactivity, measured by systolic and diastolic pressure, and any ‘true’
inter-individual variation in heart rate response, following repeated acute bouts of
high-intensity aerobic intermittent exercise. Within the programme of work for this
PhD thesis, this trial serves as a proof-of-concept study, which provided data with
which to develop and refine analysis models and code to properly partition the
variance and isolate the true individual response variability in acute exercise vs.
control. It also serves as pilot testing of the methods, procedures and analysis for
future, larger-scale investigations.
119
6.3 Methods
6.3.1 Participants
As there were six possible exercise sequences, ideal recruitment sample sizes were in
multiples of six. The target sample size was 12, representing an adequate sample size
for a pilot/ proof-of-concept study using a replicate crossover design. Twelve
normotensive, physically active people (4 women, 8 men, age: 29.7 5.2 y, height:
173.9 9.4 cm, body mass: 72.5 11.0 kg, peak oxygen uptake (V̇O2peak) 39.4
8.6 mL.kg-1.min-1) volunteered and were recruited, by showing interest following
internal emails and advertisements, to take part in this replicated period crossover
design trial. Participants were randomised in blocks of two to one of six possible
sequences of 2 control and 2 exercise replicates over four periods. Allocation was
concealed from those assessing eligibility and recruiting participants using a
statistical advisor. This approach was undertaken to allow the identification of the
subject-by-treatment interaction and thus to quantify the heterogeneity in the
response to acute exercise. One participant was unable to attend all sessions with the
required 72 h separation between trials and was therefore excluded from the
experimental protocol, whilst one volunteer was excluded due to medical reasons.
Therefore, eleven of the participants completed the study.
Following a full information brief (Appendix 1), participants attended the laboratory
on five separate occasions, each separated by >72 h. The first visit was for
habituation purposes, completion of informed consent, and measurement of peak
oxygen uptake (V̇O2peak). During this session, stature (m) was determined using a
stadiometer (Seca, Hamburg, Germany), body mass (kg) was measured using an
electronic measuring station (Seca, Hamburg, Germany), resting heart rate (HR) was
measured using a wrist worn monitor (Polar FT1, Polar Electro Oy, Finland), paired
with a chest-worn strap (Polar T31 coded strap, Polar Electro Oy, Finland). Heart
rate was taken in standardised laboratory conditions, with all participants in an
upright, seated posture. Resting blood pressure (mmHg) was measured using an
automated blood pressure monitor and 22-32cm cuff (Omron M2, Omron, Kyoto,
Japan). Using this validated monitor (Topouchian et al., 2011, Takahashi et al.,
120
2015), following 5 minutes of complete rest in a supine position, resting blood
pressure was taken on the left arm, with the cuff approximately 2.5cm above the
elbow crease and the bladder centred over the brachial artery (Frese et al., 2011), and
was determined from the mean of three measurements.
The final four visits were for completion of the main experimental trials, with two
exposures each to the intervention and the control conditions (Senn, 2016). The
participants were randomised to one of six possible sequences of trial (C=control,
E=exercise), and were informed of the nature of each day’s place in that sequence
upon arrival:
1. C-E-C-E
2. C-E-E-C
3. C-C-E-E
4. E-C-E-C
5. E-C-C-E
6. E-E-C-C
All exercise was performed on an upright cycle ergometer. Exercise was performed
following abstinence from alcohol (24 h), caffeine (12 h) and vigorous exercise (24
h), and all participants were requested to consume a similar diet prior to each
attendance.
All participants had no history of major illness, cardiovascular disease, were not
taking any medications, and were engaged in habitual physical activity for general
health and wellbeing. The study conformed to the declaration of Helsinki and was
approved by the Institutional Ethics and Research Governance Committee. All
participants were fully informed of the study methods prior to giving written
informed consent (Appendix 5). Participant characteristics are presented in Table 6.
6.3.2 Measurement of Peak Oxygen Uptake
Peak oxygen uptake was measured by a ramp test on an electromechanically braked
cycle ergometer (Lode Excalibur, Groningen, Holland). The ramp test was selected
because exercise test protocols with large stage-to-stage increments in energy
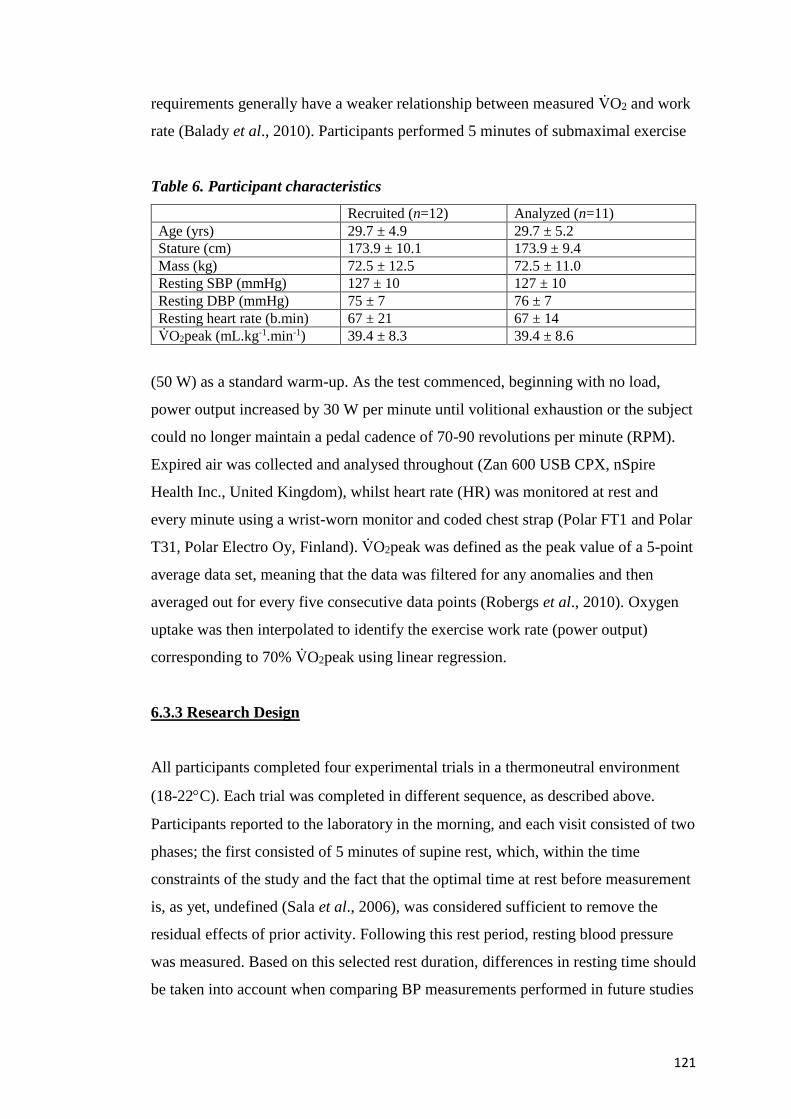
121
requirements generally have a weaker relationship between measured V̇O2 and work
rate (Balady et al., 2010). Participants performed 5 minutes of submaximal exercise
Table 6. Participant characteristics
Recruited (n=12) Analyzed (n=11)
Age (yrs) 29.7 ± 4.9 29.7 ± 5.2
Stature (cm) 173.9 ± 10.1 173.9 ± 9.4
Mass (kg) 72.5 ± 12.5 72.5 ± 11.0
Resting SBP (mmHg) 127 ± 10 127 ± 10
Resting DBP (mmHg) 75 ± 7 76 ± 7
Resting heart rate (b.min) 67 ± 21 67 ± 14
V̇O2peak (mL.kg-1.min-1) 39.4 ± 8.3 39.4 ± 8.6
(50 W) as a standard warm-up. As the test commenced, beginning with no load,
power output increased by 30 W per minute until volitional exhaustion or the subject
could no longer maintain a pedal cadence of 70-90 revolutions per minute (RPM).
Expired air was collected and analysed throughout (Zan 600 USB CPX, nSpire
Health Inc., United Kingdom), whilst heart rate (HR) was monitored at rest and
every minute using a wrist-worn monitor and coded chest strap (Polar FT1 and Polar
T31, Polar Electro Oy, Finland). V̇O2peak was defined as the peak value of a 5-point
average data set, meaning that the data was filtered for any anomalies and then
averaged out for every five consecutive data points (Robergs et al., 2010). Oxygen
uptake was then interpolated to identify the exercise work rate (power output)
corresponding to 70% V̇O2peak using linear regression.
6.3.3 Research Design
All participants completed four experimental trials in a thermoneutral environment
(18-22C). Each trial was completed in different sequence, as described above.
Participants reported to the laboratory in the morning, and each visit consisted of two
phases; the first consisted of 5 minutes of supine rest, which, within the time
constraints of the study and the fact that the optimal time at rest before measurement
is, as yet, undefined (Sala et al., 2006), was considered sufficient to remove the
residual effects of prior activity. Following this rest period, resting blood pressure
was measured. Based on this selected rest duration, differences in resting time should
be taken into account when comparing BP measurements performed in future studies
122
and in different settings (Sala et al., 2006). The second phase was the experimental
protocol.
6.3.4 Experimental Protocol
Participants reported to the laboratory in the morning (0830-1130), as changes in
post-exercise blood pressure have previously been reported for both continuous
(Jones et al., 2008) and intermittent exercise (Jones et al., 2009), with less marked
diurnal differences observed between am and pm exercise following intermittent
exercise than in continuous exercise (Jones et al., 2009). The experimental protocol
consisted of two conditions. The exercise condition (EX) comprised of two 10-min
intervals of upright cycling, at the individual’s estimated power output at 70% of
V̇O2peak, separated by a 5-min recovery period. To ensure that participants’ work
rate was at the correct intensity, the resistance (Watts) were constant during each
exercise bout. A control sample, involving collection of the same data during a
period of no exercise, was the second condition. This rest (CON) condition consisted
of the same time periods, sat at rest on the upright cycle ergometer.
6.3.5 Blood Pressure Measurements
The blood pressure monitor was fitted to the upper arm in accordance with practical
guidelines previously established (O’Brien et al., 2005). The mean of three
measurements was obtained as the baseline measure. The blood pressure monitor
was removed following baseline measurements and participants moved to the cycle
ergometer, where they completed EX or CON conditions. Blood pressure was
measured during each rest period in EX, and at the same time points during the
protocol in CON. These measurements were repeated immediately on cessation of
exercise following both 10-minute periods, and at the corresponding time point
during the control condition, with the second post-exercise measurement taken as the
final measure.
123
6.3.6 Components of Blood Pressure
Blood pressure has also been reported to consist of pulsatile and steady components
(Safar, 1989, Darne et al., 1989, O’Rourke, 1982). The pulsatile component,
estimated by pulse pressure (PP) represents blood pressure variation and is affected
by heart rate (Franklin et al., 1997), left ventricular ejection fraction and large-artery
stiffness. In contract, the steady component, which is estimated by mean arterial
pressure (MAP), is a function of left ventricular contractility, heart rate, and vascular
resistance (Safar, 1989, Benetos et al., 1997a). Mean arterial pressure has also been
suggested as an alternative measurement in patients for hypotension detection
(Henry et al., 2002).
Pulse pressure is defined as SBP minus DBP (Lloyd-Jones & Levy, 2007), and can
be used reliably as a prognostic marker in clinical practice (Yildiran et al., 2010). It
has been suggested that pulse pressure may become a more important blood pressure
measurement that is associated with cardiovascular disease in older adults (Franklin
et al., 1999). Average SBP, DBP, and MAP have been suggested to strongly predict
CVD risk in younger men, whereas average PP is purported to be associated with the
risk of CVD in both younger and older men. (Sesso et al., 2000). This corresponds
with earlier suggestions that a wide pulse pressure is a significant independent
predictor of all-cause, cardiovascular and coronary mortality (Benetos et al., 1997b).
It has previously been claimed that individuals with lower systolic blood pressure
response during exercise testing are at increased risk of adverse cardiovascular events
(O’Neal et al., 2015). This risk is highest for those with exercise-induced hypotension.
It has also been reported that males and females, whilst utilising the same pathways
for stress response, appear to do so with a variation in results (Huang et al., 2013),
with males showing increased diastolic pressure and total peripheral resistance, whilst
females respond by greater changes in heart rate.
6.3.7 Heart Rate Monitoring
Heart rate straps were fitted around each participants’ chest (Polar T31 coded strap),
connected to a wrist-worn monitor (Polar FT1, Polar Electro Oy, Finland). Heart rate
124
was measured immediately at the end of each 10-minute bout of exercise, and at the
corresponding time point during the control condition. Peak heart rate was determined
as the highest visual reading recorded at the completion of each bout.
6.3.7 Statistical Analysis
Data (n=11 due to one withdrawal post-randomisation) were analysed using SAS (v.
9.4, SAS Institute Inc, Cary, NC, USA). Subsequent to blood pressure and heart rate,
mean arterial pressure (calculated as (SBP+2*DBP)/3), pulse pressure change (the
change in the difference between systolic and diastolic blood pressure) and rate
pressure product (the product of heart rate multiplied by blood pressure, Gobel et al.,
1978) were also calculated and analysed. Additionally, residual error, or measurement
error, was calculated, with its associated 90% confidence intervals. A linear mixed
model, allowing for sex differences in the mean effect of acute exercise and
differential period effects between conditions (by sex) was developed, elaborating
substantially upon the following ‘possible’ code previously suggested (Senn et al.,
2011):
proc mixed data=updrs
class period treat subject;
me=model score=period treat/ddfm=kr solution CL;
random subject subject*treat/solution;
lsmeans treat/pdiff cl;
ods output solution=randomsolutionf=fixed lsmeans=means;
run;
However, this ‘possible’ code does not adequately partition the variance and allow
isolation of the true individual differences in response to acute exercise versus control.
Therefore, I rewrote this code by including random effects for the participant x
treatment interaction (by period) to partition the variance and derive the ‘true’ SD for
individual responses. This approach allowed for portioning by period (visit 1,2,3,4,
whether that be application of intervention or control condition), sex (male, female),
treatment (EX, CON), and subject (2-12). In parallel with the method applied to the
analysis of parallel group randomised controlled trials, dummy variables are required
125
to allow extra variance whenever a subject experiences a control trial (xVarC) or a
treatment (exercise) trial (xVarT). The following code was developed and applied
(SBP used as example analysed variable):
proc mixed data=mydata covtest cl alpha=0.1
nobound;
class period treatment subject sex;
model SBP_change=period treatment sex treatment*sex treatment*period
treatment*sex*period/ddfm=satterthwaite outp=pred cl alpha=0.1;
random Subject Subject*xVarC Subject*xVarT
Subject*xVarT*Period;
lsmeans Treatment treatment*sex period treatment*period/diff cl
alpha=0.1;
lsmestimate treatment*sex "exercise-control" 1 -1 -1 1/ cl
alpha=0.1;
run;
In the above code SBP change is the change in blood pressure from rest to the end of
exercise, or the end of the equivalent control period. The fixed effects provide the
overall mean effect of acute exercise versus control, and the differences between
men and women in this exercise effect, allowing for period effects, differential
period effects between conditions, and differences between sexes in any differential
period effects by treatment. Differential period effects between conditions might be
due, for example, to a different habituation effect for acute exercise compared with
just sitting still.
The sum of the xVarC*subject and xVarT*subject random effects provide the
‘consistent’ individual differences in response to acute exercise. In addition, ‘one-
time-only’ individual response variance quantifies the different individual responses
every time a subject experiences an exercise replicate. To explain, if, within-subject,
each subject had the same value on each administration of exercise (but different
values between subjects), then there would be consistent individual response
variance but zero one-time-only individual response variance. What we see typically
in replicate crossovers, however, is that each subject has a different value on repeat.
126
So, for example, for SBP, Subject 2 has a change score of +59 mmHg on the first
exercise occasion and +88 mmHg on the second. So, there will be ‘consistent’
between-subject differences in response plus ‘one-time-only’ individual response
variance each time a subject experiences an exercise replicate. The total individual
response variance in a replicate crossover is therefore the sum of these two
variances. The square root of this total individual response variance provides the
variability expressed as a SD. The confidence interval for the total individual
response variance was derived by squaring the standard errors from each of these
variances, adding them together, taking the square root, and then using the normal
distribution. This ‘total’ SDIR is interpreted as the typical difference between subjects
in the mean change between a control trial and an exercise trial. The model also, of
course, gives the mean difference in the change in outcome between exercise and
control, with its confidence interval.
6.4 Results
6.4.1 Mean Effects
The mean effect of acute exercise (versus control) on systolic blood pressure are
presented in Table 7. The mean difference between females and males was +35
(90%CI 9 – 62) mmHg (67 mmHg in women vs. 32 mmHg in men).
The mean effect on diastolic blood pressure was -6 (-1 to 14) mmHg. The average
difference between females and males was 13 (-3 to 28) mmHg. Mean arterial
pressure increased by 21 mmHg (13-28), with average sex differences of 21 (6-36),
whilst pulse pressure difference was 45 (34 to 55) mmHg, with a difference of 25 (4
to 46) mmHg between females and males. The mean effect on rate pressure product
was an increase of 12045 (9058 to 15032). The average difference between males
and females was 6006 (21 to 11980), whilst the mean effect on heart rate was an
increase of 58 (39 to 78) b.min. The average difference between males and females
was 5 (-34 to 45) mmHg.
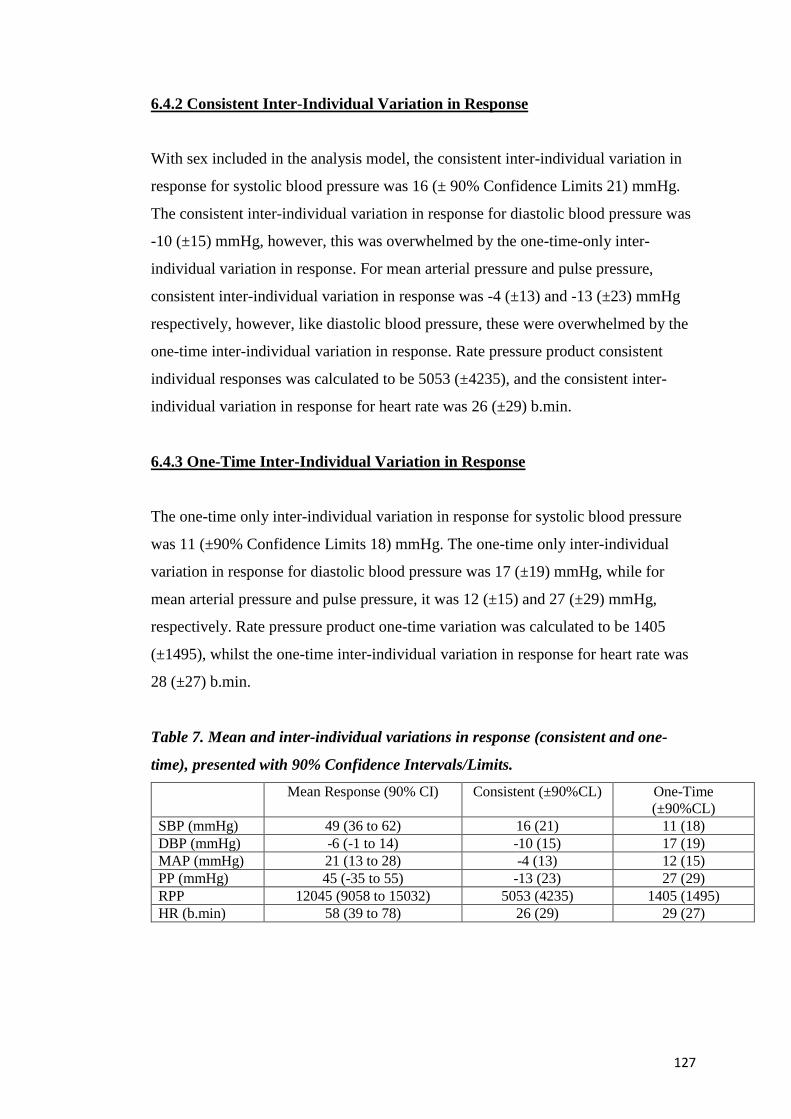
127
6.4.2 Consistent Inter-Individual Variation in Response
With sex included in the analysis model, the consistent inter-individual variation in
response for systolic blood pressure was 16 (± 90% Confidence Limits 21) mmHg.
The consistent inter-individual variation in response for diastolic blood pressure was
-10 (±15) mmHg, however, this was overwhelmed by the one-time-only inter-
individual variation in response. For mean arterial pressure and pulse pressure,
consistent inter-individual variation in response was -4 (±13) and -13 (±23) mmHg
respectively, however, like diastolic blood pressure, these were overwhelmed by the
one-time inter-individual variation in response. Rate pressure product consistent
individual responses was calculated to be 5053 (±4235), and the consistent inter-
individual variation in response for heart rate was 26 (±29) b.min.
6.4.3 One-Time Inter-Individual Variation in Response
The one-time only inter-individual variation in response for systolic blood pressure
was 11 (±90% Confidence Limits 18) mmHg. The one-time only inter-individual
variation in response for diastolic blood pressure was 17 (±19) mmHg, while for
mean arterial pressure and pulse pressure, it was 12 (±15) and 27 (±29) mmHg,
respectively. Rate pressure product one-time variation was calculated to be 1405
(±1495), whilst the one-time inter-individual variation in response for heart rate was
28 (±27) b.min.
Table 7. Mean and inter-individual variations in response (consistent and one-
time), presented with 90% Confidence Intervals/Limits.
Mean Response (90% CI) Consistent (±90%CL) One-Time
(±90%CL)
SBP (mmHg) 49 (36 to 62) 16 (21) 11 (18)
DBP (mmHg) -6 (-1 to 14) -10 (15) 17 (19)
MAP (mmHg) 21 (13 to 28) -4 (13) 12 (15)
PP (mmHg) 45 (-35 to 55) -13 (23) 27 (29)
RPP 12045 (9058 to 15032) 5053 (4235) 1405 (1495)
HR (b.min) 58 (39 to 78) 26 (29) 29 (27)
128
6.4.4 Residual Error
The residual (measurement) errors for systolic and diastolic blood pressure, mean
arterial pressure and pulse pressure were 13 (90%CI 9-23), 11 (8-19), 10 (7-18) and
9 (6-21) mmHg, respectively. Residual error for rate pressure product (b.min-1.
mmHg) was 480 (324-990), and measurement error for heart rate was 6 (4-14) b.min-
1.
6.5 Discussion
6.5.1 Key Findings
This is the first study of its kind aimed at quantifying the ‘true’ inter-individual
variation in response to acute exercise using this modified code to properly partition
the variance in a linear mixed model. The key findings suggest the presence of ‘true’
inter-individual variation in response to acute exercise. There was a greater mean
blood pressure and heart rate response in females compared to males, larger than
might be expected mechanistically, yet different from those reported in Chapter 5.
Given the small number of participants, the analysis cannot be stratified by sex, but it
appears that there may be substantial sex differences in the acute response to
exercise. This should be further investigated by the employment of a large,
definitive, trial. Without sex in the analysis model, the total SDIR is 25 mmHg, made
up of a consistent SDIR of 23 mmHg and a one-time-only SDIR of 11 mmHg. When
sex and sex*treatment and sex*period*treatment are included in the model, the total
SDIR goes down to 19 mmHg. This indicates that differential acute responses by sex
explain 42% of the total individual response variance. These findings are also
different from those presented in Chapter 5, as the same phenomenon is clearly not
responsible for the results. Whilst sex does explain some of the observed individual
response variance, a substantial amount remains even after accounting for sex.
Therefore, these results imply substantial individual response variance in both men
and women.
129
6.5.2 Cardiovascular Reactivity
The association between either systolic (SBP) or diastolic blood pressure (DBP) and
the risk of cardiovascular disease (CVD) is well established (JNC, 1997). ‘Normal’
responses of a rise of 8-12 (ACSM, 2012), 10 (Fletcher et al., 2013) or 20 mmHg (Le
et al., 2008) in SBP per metabolic equivalent have been suggested. Research claims
that an exaggerated SBP response, where an increase to more than 180 mmHg is
observed, or DBP of more than 95 mmHg during moderate submaximal exercise has
been suggested to be the best predictor of new-onset hypertension at 20-year follow
up (Yzaguirre et al., 2017). However, given that most investigations examining blood
pressure response are derived from middle-aged, white males, it is questionable how
generalisable these predictors may be. It has been suggested that excessive blood
pressure increase during the early stages of graded exercise may actually be more
relevant (Currie et al., 2018). These authors also suggest the modulating effects of age,
sex, fitness, health status and medications should be considered as the observed
response may be influenced by any combination of these.
Conversely, reduced cardiovascular reactivity has also been reported to place
individuals at increased risk of diseases such as obesity (Carroll et al., 2008). In this
study, mean changes of 49 mmHg were observed, with the highest observed values of
SBP and DBP being 195 and 120 mmHg, respectively. This mean change falls 2
mmHg short of the most accurate discriminator reported for relative maximal exercise
induced changes in SBP during exercise to predict incident hypertension (Jae et al.,
2015), indicating that the highest observed change in this study did not meet thresholds
for increased future risk. However, considerable variation between males and females
was observed, with females, on average, 35 and 13 mmHg higher, for SBP and DBP,
respectively. Whilst mean values were observed to be greater than those previously
reported as predictors of cardiovascular-related health, consistent inter-individual
variation in systolic blood pressure response of 16 mmHg and heart rate of 26 b.min-1
is large in comparison to the mean change. Consistent inter-individual variation in
diastolic blood pressure (-10 mmHg), mean arterial pressure (-4 mmHg) and pulse
pressure (-13 mmHg) was overwhelmed by the one-time inter-individual variation in
response. One-time inter-individual variation in response was also substantial in all
variables. However, it is the total individual responses SD that is key. For example,
130
the overall effect for SBP was 49 ±19 mmHg; this means that a randomly selected
subject in this study would be expected to increase SBP by 49 ±19 mmHg in response
to a bout of acute exercise of this duration and intensity.
6.5.3 Mechanisms of Response
These data highlight ‘true’ inter-individual response that is substantial when
compared to the mean, greater than might be expected mechanistically. Whilst it is
beyond the scope of this chapter to identify the causes, a number of suggestions may
shed light on these data. Whilst it is possible that baseline fitness may have been
responsible for the observed phenomenon, as a range of fitness levels (22.6-48.2
mL.kg-1.min-1) were observed at baseline, it is unlikely that this explains all of the
observed variation. There is, however, a clear trend that sex has an impact upon
these data, as all variables show greater mean changes in females than males. Whilst
baseline testing allowed for estimation of a workload equivalent to 70% of that
elicited at V̇O2peak, this workload may have actually been relatively more difficult
for females than males. For some individuals, this may have fallen above maximal
lactate steady state (MLSS), whilst for others, it may have been below this intensity.
Similar findings have been reported with different markers of exercise stress at the
same relative workload between trained and untrained individuals (Baldwin et al.,
2000). Alternatively, these results may be due to the fact that males and females,
whilst utilising the same pathways for stress response, appear to differ in response
(Huang et al., 2013), whereby males often present larger diastolic blood pressure
responses to acute exercise. This may uphold the suggestion that male responses are
‘vascular’ while female responses are ‘cardiac’ (Allen et al., 1993). It is not yet
possible to confirm whether the apparent sex difference in intervention effect is due
to sex, per se, or to differences in baseline fitness. Very large samples would be
required to define multiple intervention interactions with adequate precision.
Given the detrimental role of different causes of stressors, a variety of interventions
for the management of stress have been proposed (Hamer et al., 2006). Chronic
exercise is at the forefront of this approach, as it is proposed to reduce the
sympathetic stress response (Crews & Landers, 1987). It can likely attenuate
cardiovascular responses to stress, control physiological stress reactivity (Hamer et
131
al., 2006) and may facilitate reduction in cardiovascular disease, stroke and
myocardial infarction risk factors (Huang et al., 2013). It has been proposed that,
whilst little research has been carried out on the acute effects on blood pressure
reactivity, acute exercise attenuates stress related blood pressure responses, and
repeated exposure to acute bouts may have a positive cumulative effect on
cardiovascular responses (Hamer et al., 2006). Additionally, each standard deviation
reduction in stress-related BP reactivity is associated with a reduction of carotid
artery thickness, which may confer positive benefits on acute myocardial infarction
risk (Salonen & Salonen, 1993).
6.5.4 Statistical Model for Analysis of Replicate Crossover Data
As previously described, the parallel group RCT is best for evaluating treatment
heterogeneity in chronic adaptations. By successfully partitioning the ‘consistent’
and ‘one-time’ inter-individual variation in response to exercise, this study has
confirmed that the replicate crossover is ideally suited to quantifying the inter-
individual variation in acute responses that wash out fully between conditions.
The model used for analysis of these data provides ‘consistent’ individual responses
(from the xVarC*subject and xVarT*subject) and ‘one-time-only’ individual
responses (xVarT*subject*period), which are both random effects. One-time-only
individual response variance quantifies the different individual responses each time a
subject experiences an EX replicate.
The aforementioned one-time-only individual response variance represents extra
physiological variability plus technical error of measurement in the exercise
condition at that location. In noisy settings (e.g. difficult data collection) the one-
time-only response variance can swamp the consistent individual responses such that
the latter cannot be estimated robustly. In this study, as expected, there was more
noise in the exercise condition, because of variability of the subject from one bout of
exercise to the next and/or because there is more error in the exercise condition – a
combination of biological variability and technical error. This is highlighted in the
measures (diastolic blood pressure, mean arterial pressure and pulse pressure) where
consistent inter-individual variation in response were overwhelmed by the one-time
132
when using the statistical model, due to the inherent measurement error in relation to
the observed change when collecting blood pressure data in exercise studies. This is
likely due to the relatively small observed changes in these measures, but future
studies may look to replicate this with different blood pressure monitoring
techniques, such as continuous blood pressure monitoring.
Whilst SAS analysis code has previously been forwarded to try to partition variance,
the elaboration of ‘possible’ code suggested by Senn et al., (2015) presented in this
chapter provides a robust, accurate model for the partitioning of variance and the
quantification of ‘true’ inter-individual variation in response to acute exercise
interventions.
6.5.5 Limitations
A number of strengths and limitations are evident upon completion of this study.
Limitations could be identified through the measurement method for blood pressure
within this study. Blood pressure is a notoriously noisy measure, and the blood
pressure monitor used was prone to produce occasional error readings. Whilst this was
piloted prior to the study, technical issues may still have contributed to the observed
variation presented within these data. Most variables had wide confidence
intervals/limits due to small participant numbers. However, as a proof of concept, by
partitioning the ‘consistent’ and ‘one-time’ individual variation, these data show the
code produced for the statistical modelling is robust and holds great promise for the
future application in larger scale replicate crossovers. In addition to overall N being
small (just 11 analysed), the sample contained both men and women, with very few
women. Therefore, sex by treatment interactions are purely exploratory and
confidence are wide. Wider recruitment for future studies aimed at developing these
results would better enable replication efforts and generalisation of the physiological
aspect of these data to the wider population. Whilst this study was limited by a small
sample, given the observed variability in responses, it is likely that the intensity was
sufficient to elicit a range of responses, but as previously stated, may have been
relatively more difficult for some than others. Therefore, identification of an exercise
intensity that ensured that all participants underwent the same relative intensity may
be more appropriate. Quantifying the SD for individual responses with adequate
133
precision requires large sample sizes, often many time larger than those required for
defining mean effects precisely.
6.6 Conclusions
This is the first study of its kind aimed at using this modified code to properly partition
the variance in order to quantify the ‘true’ inter-individual variation in response to
acute exercise. While the parallel group RCT is best for evaluating treatment
heterogeneity in chronic adaptations, the replicate crossover is ideally suited to acute
responses that wash out fully between conditions. The key findings suggest the
presence of substantial inter-individual variation in response. The results also
highlight the success of the approach in partitioning the different components of
variation. Whilst we cannot stratify the analysis by sex, because the numbers are too
small, it appears that there may be substantial sex differences in the effect of the acute
exercise. To confirm this, a subsequent large definitive trial should be employed,
recruited from a wider population, with a focus on blood pressure outcomes utilizing
the same analysis procedures.
134
Chapter 7: Discussion
7.1 Introduction
The main aim of this PhD has been to investigate the appropriate quantification of
inter-individual differences in the response to exercise interventions, as well as the
exploration of putative moderators and mediators of both the mean intervention
effect and the individual response, where appropriate.
7.2 Brief Overview of Literature
The current research sits within the context of repeated reports of marked
heterogeneity in the effects of regular exercise training (Hecksteden et al., 2018),
with inter-individual variability in various phenotypes, such as less than expected
weight loss for some individuals, or ranges of V̇O2max response of no change to
40% improvement (Lortie et al., 1984, Bouchard & Rankinen, 2001). Nevertheless,
recently concerns were raised in regard to the methodological approach of much of
the previous body of research (Hopkins, 2015, Atkinson & Batterham, 2015,
Williamson et al., 2017). The bulk of the literature reports these findings in the
absence of a true control sample, often comparing within-group data, or comparing
to a spurious statistic such as technical error (TE). The description of variability in
response to chronic exercise interventions should only come following comparison
with a suitable comparator sample, preferably within a randomised trial design, and
comparison of the standard deviation of the change score (SDchange) for each group.
Further investigation of possible moderators and/or mediators that may be
responsible for ‘true’ inter-individual response variance should come only after these
inter-individual differences in response have been quantified properly (Atkinson &
Batterham, 2015, Williamson et al., 2017); an approach that has been lacking in the
majority of the literature.
135
7.3 Primary Findings
The primary findings from this programme of work are that, when quantified
appropriately, chronic exercise interventions appear to elicit limited ‘true’ inter-
individual variation in response in peak oxygen uptake and weight loss. However,
there appear to substantial inter-individual variations in blood pressure and heart rate
responses to acute, high intensity ‘aerobic’ bouts of exercise. Additionally, there
appear to be substantial individual responses for chronic blood pressure adaptation in
men. Furthermore, substantial individual responses for weight loss with
multifactorial interventions in both men and women have been identified. It is
particularly important to highlight these findings, as they are vastly differing
findings to those presented in Chapter 4, where there is a relative lack of individual
response variance for weight loss in response to exercise training alone.
7.4 Thesis Objectives
7.4.1 Thesis Objective 1
The first objective was to critically review the literature on inter-individual variation
in maximal aerobic capacity response to exercise. Whilst there have long been
claims of inter-individual response to exercise (Prud’homme et al., 1984, Despres et
al., 1984, Lortie et al., 1984, Savard et al., 1985, Hamel et al., 1986, Simoneau et
al., 1986), it was found that the vast majority of previous investigations of inter-
individual differences in V̇O2max response to exercise training has been conducted
almost exclusively without a control group or comparator arm. However, it is the
case that the observed variation must be appropriately quantified prior to deeper
investigation. This evaluation requires a number of approaches, including the
determination of a threshold for meaningful magnitude of change, to establish the
presence of clinically important differences in response (Buford et al., 2013). In
order to quantify the inter-individual response to an exercise intervention, studies
should contain the presence of a comparator arm, preferably as an RCT design. This
methodological approach is vital, in order to understand the counterfactual, giving
our best ‘best guess’ as to what would have happened to the intervention subjects,
had they been, ‘contrary to the fact’, in the control condition. Furthermore, the
136
correct statistical analysis and modelling must be used in order to identify the
presence of true, clinically relevant, individual response, as unless true inter-
individual response exists, it is futile looking for treatment interactions (Senn, 2004).
Only when these effects have been properly quantified, using the following
equation: 𝑆𝐷𝐼𝑅 = √𝑆𝐷𝐼2 − 𝑆𝐷𝐶
2 , where IR = individual responses, I = intervention
or treatment group, and C = control or comparator group (Hopkins, 2015) can the
design of experiments to further elucidate the mechanisms responsible for the
individual response be confirmed. Indeed, when this approach is taken with data
from published research claiming inter-individual variability in response
(Prud’homme et al., 1984), it was actually observed that there was greater variability
in the control sample vs the intervention sample (control ± 5.6 mL.kg-1.min-1,
intervention ± 3.7 mL.kg-1.min-1).
It may also be prudent to measure a number of variables and health outcomes. It may
be the case that some participants may improve across some but not all physiological
measures, but this approach should be tied to robust hypotheses.
7.4.2 Thesis Objective 2
The second objective of this thesis was to undertake a systematic review and meta-
analysis of the weight change literature, with a focus upon quantifying the inter-
individual variation in weight loss in response to exercise training. This was the first
systematic review and meta-analysis designed and published to address individual
variation in response.
The primary findings indicate that evidence is limited for clinically relevant ‘true’
inter-individual variation in weight change in response to an exercise intervention,
once the random variability in weight over time in the control group is accounted for.
When the pooled inter-individual response variability (0.8 kg) is doubled (1.6 kg), as
we must for comparison of individual responses, is compared to the pooled mean
change in weight (1.4 kg), it is evident that effect sizes are trivial, indicating that
there are minimal ‘true’ inter-individual variation in response to exercise.
137
A novel concept in meta-analyses is the use of the prediction interval, to quantify the
expected range of true effects in future studies in similar settings. The prediction
interval for the mean change in weight revealed that, were investigators to undertake
a future trial, the 95% plausible range for mean weight change vs. control would be -
5.0 to 2.1 kg ('possibly' clinically important; probability 26%). For the individual
response variability, the prediction interval ranged from small negative (more
response variability in control group) to small positive (more variability in the
exercise arm), revealing that the true individual response variability in a future study
in similar settings is unlikely to be clinically important (23% chance).
To date, in a manner consistent with the bulk of the literature investigating peak
oxygen uptake, much of the research reporting substantial inter-individual
differences in response to an exercise intervention has been conducted in the absence
of a suitable comparator sample (King et al., 2008, Cauldwell et al., 2009, Cauldwell
et al., 2013). As discussed, in order to quantify the true inter-individual response to
an exercise intervention, studies should include a comparator arm, preferably in a
randomised controlled trial.
7.4.3 Thesis Objective 3
The third objective of the thesis was to conduct a rigorous and detailed secondary
data analysis of previously published data set from the PREMIER trial. This analysis
showed much larger inter-individual variations in the response of weight loss and
blood pressure control (to established treatment and established treatment plus
DASH diet) in men, when compared to women, of a magnitude of 3-4 times the
MCID. Stratified analyses by sex were undertaken further to the observation of a
specious individual response variance for SBP and weight loss from the full model,
which was not even partially accounted for by including a sex-by-treatment
interaction term in the model. An attenuation of the individual response variance was
expected, given the possibly substantial differences in mean treatment effect in men
vs. women revealed by the full model. The fact that no such attenuation was
observed is a warning sign that the model is mis specified. The paradoxical finding
was due to the marked sex differences in individual response variance. The observed
138
effect in women is relatively consistent, whilst in men it is much more variable. This
finding leads to the conclusion that the initially calculated individual response
variance for SBP (11.99 mmHg) estimated from the whole sample applies poorly to
both men and women, as it underestimates in men and overestimates in women.
The above paradoxical finding reinforces the critical importance of thorough
exploratory data analysis before undertaking the primary analysis. I propose that
separate analyses by sex should be conducted routinely, to reveal such phenomena.
In the PREMIER data set, the large differences in response variance between sexes
both overwhelms and offsets any reduction in the observed ‘pooled’ individual
response variance when the sex-by-treatment interaction is included in the model.
This finding gives the false impression that sex is not a moderator of individual
response variance.
To reiterate, given these observations, researchers and practitioners should therefore
be aware that when conducting this type of analysis, care must be taken to
investigate and present ‘true’ inter-individual variation in response by sex, rather
than pooling the overall sample, due to the possibility that this phenomenon may be
applicable to further datasets.
7.4.4 Thesis Objective 4
The fourth, and final, objective of the thesis was to design and undertake a pilot/
‘proof-of-concept’ investigation to investigate the acute inter-individual variation of
blood pressure and heart rate variables in response to high-intensity aerobic interval
training, using a replicate crossover design. This was the first study of its kind aimed
at quantifying the ‘true’ inter-individual variation in response to acute exercise. This
objective was achieved by properly partitioning components of variance using a
linear mixed model. The key findings suggest the presence of substantial ‘true’ inter-
individual variation in response. Although there were large sex differences in mean
response, with greater blood pressure and heart rate response variables in females in
comparison to males, stratified analyses of individual responses by sex were not
possible, due to the small number of each in this proof-of-concept trial. In a replicate
crossover trial, the total individual response variability is composed of consistent and
139
one-time-only individual responses. For diastolic blood pressure, mean arterial
pressure, and pulse pressure the consistent individual response variance was
overwhelmed by the one-time inter-individual variation in response. One-time inter-
individual variation in response was also substantial in all variables and consistent
inter-individual variation in systolic blood response and heart rate response was large
when compared to the mean change. Caution must be used during trial design, as this
approach should only be utilised when measuring continuous outcome variables
The large difference in mean response between men and women may indicate that
whilst baseline testing allowed for identification of a workload equivalent to 70% of
that elicited at V̇O2peak, this workload may have actually been relatively more
difficult for females than males. Speculatively, these data may uphold the suggestion
that male responses are ‘vascular’ while female responses are ‘cardiac’ (Allen et al.,
1993).
7.5 Methodology in Relation to Current Research
The findings of this programme of work clearly suggested that many of the
inferences drawn from previous research might be suspect. Reporting the presence of
inter-individual variation in response from an intervention-only trial – or ignoring
the control data - clearly lacks the comparator sample with which to compare
SDchange. This vital component allows us to assess the presence of ‘true’ inter-
individual variation in response.
Whilst it has been argued recently that repeat testing of outcome measures
throughout the duration of the intervention can help account for within-subject
variability by comparing segmental slopes of change scores for shorter durations
across the treatment period (Hecksteden et al., 2018), this approach is also limited.
Primarily, the close temporal proximity of the measures may lead to high amounts of
autocorrelation and a violation of the assumption of random errors. Additionally, it is
not clear if training adaptions are linear over the course of an intervention. Also,
repeated measures may be both expensive and impractical for some interventions.
140
Whilst “possible” analysis code for SAS® software has previously been forwarded to
try to partition variance in a replicate crossover trial (Senn et al., 2015), it must be
acknowledged that this code does not properly partition the response variance in
intervention and control conditions, and therefore does not quantify individual
response variance appropriately.
The analysis code developed and presented in this thesis now permits the proper
partitioning of response variance to isolate ‘true’ inter-individual variation in response
to acute interventions, and also has the flexibility to account for sex and period effects.
The model separates ‘consistent’ individual responses and ‘one-time-only’ individual
responses, which quantifies the different individual responses each time a subject
experience a treatment (exercise) replicate. This one-time-only individual response
variance represents extra physiological variability plus technical error of measurement
in the exercise condition at that location. In noisy settings (e.g. difficult data
collection) the one-time-only response variance can swamp the consistent individual
responses to such an extent that consistent individual responses cannot be robustly
quantified. To reiterate, the total individual response variance in a replicate crossover
is the sum of these two variances, and the square root is then taken to get the response
variability as an SD, as has been previously described (Atkinson & Batterham, 2015).
7.6 Findings in Relation to Literature
The key findings from this thesis indicate that in response to chronic exercise,
evidence is limited for the presence of substantial ‘true’ inter-individual variation in
response for peak oxygen uptake and weight loss. This observation is due to the fact
that natural random variability over time is similar for intervention and comparator
samples, and that little or no extra variance is observed in intervention groups. As
previously described, this finding highlights the requirement for a comparator
(counterfactual) sample, in order to make firm inferences.
Although it has been suggested that training studies consistently report a high
variability in the effects of regular exercise training (Hecksteden et al., 2018), and
large inter-individual differences in the trainability of the cardiorespiratory system
have been claimed for over 30 years (Lortie et al., 1984, Bouchard, 1995, Feitosa et
141
al., 2002), re-analysis of the data upon which the majority of these inference are
made reveal no clinically important differences in the SD of the change scores
between the groups (control ± 5.6 mL.kg-1.min-1, intervention ± 3.7 mL.kg-1.min-1),
(Williamson et al.,. 2017). This observation indicates that there are no substantial
inter-individual differences in response to the intervention. In fact, these SDs
indicate more than double the response variance in the control group versus the
intervention group. Such a phenomenon can result when an intervention has a
harmonising effect on the outcome variable in question.
Despite claims of inter-individual variation in fat loss and weight loss in response to
exercise that were previously reported (Snyder et al., 1997, Byrne et al., 2006, King
et al., 2008, Caudwell et al., 2009, Church et al., 2009, Barwell et al., 2009), which
result in a prevailing opinion that exercise often results in less than expected weight
loss (Donnelly & Smith, 2005), the findings of this PhD study indicate that this is not
the case. Mean weight loss of 1.4 (95% CI -0.3 to -2.5) kg, and ‘true’ inter-individual
variation in response of 0.8 (-0.9 to 1.4) kg indicate that any observed inter-
individual variation in response does not even meet a conservative minimally
important difference threshold.
7.7 Recommendations to Policy Makers and Practitioners
Precision medicine might improve population health, given that we may require both
individual and public health approaches to improve health. Population health
planning requires directing efficient use of resources toward those most at risk. Past
successes of genomics and precision medicine indicate that they can yield population
health benefit.
However, precision interventions may not improve population health due to the
nature and complexity of disease pathogenesis, particularly for common chronic
diseases. Therefore, the promise of precision medicine to identify predictors of
disease that can help guide personalized interventions may not be easily fulfilled.
Additionally, the precision medicine agenda could shift resources from other areas,
and its appeal may lead to hype and premature expectations that may cause long-
term disillusionment and erosion of public confidence in health sciences.
142
A major challenge ahead is figuring out how to best use the available large-scale data
ranging from genomic to environmental information sources. These data should only
be utilised if they will help us better understand determinants of population health
and interventions that will improve health outcomes in subpopulations. Given the
findings presented here, it is highly likely that for many phenotypes, interventions
that work ‘on average’, targeted to whole populations (i.e. the mean response) will
suffice until further evidence accumulates (Harrell, 2018), as the evidence for
substantial chronic inter-individual response variation is limited.
Whilst wide scale DNA collection and analysis has been proposed for identifying
inter-individual variations, even the large scale and well-funded All of Us
programme in the United States has struggled. Despite $1.5bn in funding over ten
years, in its first three years, not a single set of DNA has been sequenced. This
further highlights the problem surrounding this approach. Due to its complexity, is
this funding the best use of resources? Should the funding instead go to research
conducting truly applied and innovative science?
Therefore, for the vast majority of outcomes, the idea that a personalised approach is
necessary seems questionable. It also seems unlikely that, given the complexity of
the biological and social contributors to weight loss, increased physical activity etc.,
that small lifestyle tweaks based upon information regarding very small numbers of
genes will provide a benefit over and above those elicited from following general
lifestyle guidance. There is also little evidence that the provision of information
regarding inter-individual variation in response, or genetic risk information, will
actually motivate the individual to undertake behaviour change. Given these facts, it
may be more prudent to use alternative approaches, such as risk magnification,
which has been described as providing the largest absolute risk reduction (Harrell,
2018) This approach uses statistical tools and standard clinical variables to improve
medical and public health decision making, therefore cutting costs in comparison to
precision medicine.
Genetics-informed approaches and precision medicine have gained a toehold in the
consciousness of exercise professionals, medical researchers, and large-scale funders
143
in recent years, built upon the principle of health care revolution. This increase in
awareness has been necessary for scientists and research institutions to obtain
research funding from public and private organisations but, as yet, there is little
beyond unproven hype. Whilst continuing research may be worthwhile, focus should
be directed upon evidence-based basic scientific principles of mechanistic
adaptation, rather than genetic testing for risk profiling, athlete development, and
predictions of response by body type.
Ultimately, precision interventions to target those who may display inter-individual
variations in response are just a small tool in the box. Whilst with further research it
may facilitate better outcomes, without the correct quantification methods to inform
research and practice, ultimately it may cause more harm than benefit. Therefore, for
chronic exercise interventions, practitioners should utilise the RCT approach, in
combination with the analysis of SDchange of the intervention sample vs. the control.
Alternatively, to identify the presence of inter-individual variation in response to
acute bouts of exercise, the replicate crossover approach, using the code and analysis
presented herein to fully partition the observed variance. It is also vital that
practitioners ensure selection of valid, reliable measurement tools and high levels of
inter- and intra-rater reliability in order to minimise measurement error in exercise
trials.
There have yet to be any examples of true precision interventions with successful
outcomes. Population-wide approaches focusing on physical and social
environments should also be considered. Clearly, policy makers and practitioners
should understand the value of high-quality research, and inferences drawn from
such; care should be taken when practical recommendations are suggested from
research not utilising the methodology and statistical analysis recently suggested
(Hopkins, 2015, Atkinson & Batterham, 2015, Williamson et al., 2017, Williamson
et al., 2018).
7.8 Strengths of the Thesis
A number of strengths are clear in this current body of research. In Chapter 4, I
presented the first systematic review and meta-analysis of individual response
144
variance. In order to make inferences from the data extracted and analysed in this
meta-analysis, I adopted a threshold for the minimum clinically important weight
loss of 2.5 kg – the smallest threshold of absolute weight loss for clinical benefit
previously reported (Jensen et al., 2014). This was a very conservative estimate of an
MCID, and if a less conservative MCID were to be used, the argument against the
observation of ‘true’ inter-individual variation in weight loss would be further
strengthened.
The subject matter for the meta-analysis, and the inclusion of the prediction interval,
for an indication of what may happen in any future similar trial, are both novel.
Additionally, the primary data collection presented in Chapter 6 is a novel approach.
This was the first study of its kind designed specifically to investigate the inter-
individual variation in response to acute exercise.
Finally, the statistical model used to analyse the data collected in the acute replicate
crossover trial was proved to be a robust model, due to its ability to accurately
partition variance, and identify both the consistent and the one-time only inter-
individual variation in response.
7.9 Limitations of the Thesis
A number of limitations are also evident upon completion of this programme of
work. In regard to the meta-analysis presented in Chapter 4, the energy expenditure
induced by the exercise interventions undertaken in the included studies – and
whether this would be sufficient, in theory, to induce weight loss above the minimal
clinically important difference – is unknown. It is therefore unknown what effects
exercise protocols with larger energy expenditures would elicit. The literature search
was restricted to RCTs incorporating exercise-only interventions; included studies
that differed by exercise mode, intensity, frequency and duration, and length of
intervention. This intervention heterogeneity may have influenced mean effects and/
or individual response variance. However, there were too few studies to compare the
effects in different intervention types.
145
In relation to the acute exercise trial, most effects had wide confidence intervals/limits
due to small participant numbers. However, as a proof of concept, these data show the
code produced for the statistical modelling is robust and holds great promise for the
future application in larger-scale replicate crossovers.
Additionally, whilst using the model suggested, a differential period effect between
control and exercise conditions was observed, due to a different habituation effect for
acute exercise compared with sitting still. This effect is evaluated by adding a
treatment x period fixed effect to the model and getting the least-squares means for
the interaction.
7.10 Original Contributions to Knowledge
In this thesis I have undertaken a meta-analysis of 1500 participants in exercise
intervention studies. The key original contribution to knowledge is that, across 12
studies, while mean weight change was -1.4 kg, the individual response variability
(SD) was only 0.8 kg, highlighting very limited evidence for the notion of individual
variation of weight change in response to an exercise intervention. This novel
analysis utilised, for the first time in this field, a prediction interval for inter-
individual variation, which identified that the likelihood of ‘true’ inter-individual
variation in response to an exercise intervention is limited, with only a 23% chance
that in a future study in similar settings any observed response variation would be
clinically relevant.
These findings have already been published in the high-quality, peer reviewed
journal Obesity Reviews (Williamson et al., 2018). This research has thus provided
an original, robust protocol that has provided an important insight into how to
quantify inter-individual variation in response to exercise and to implement a
prediction interval for future studies in similar settings.
In addition, a further original contribution to knowledge comes through the
development of a model with which to partition individual variation in response for
acute effects in replicate crossover designs. Using the model with interactions to
identify ‘consistent’ individual responses (xVarT*subject) and ‘one-time-only’
146
individual responses (xVarT*subject*period), provides a robust, accurate model for
the partitioning of variance and the quantification of ‘true’ inter-individual variation
in response to acute interventions when measuring continuous outcome variables.
7.11 Future Research Considerations
Whilst it is well documented that long-term systematic resistance training causes
increased skeletal muscle size and strength in both men and women of different ages,
resistance training-induced gains in muscle size and strength are often claimed to be
variable between individuals. Large variability in both muscle size and strength gains
in response to resistance training between individuals has been previously reported
(McGlory & Phillips, 2015). In a large study, men and women were reported to
exhibit wide ranges of strength gain (1 RM: 0 to +250%) and skeletal muscle
hypertrophy (cross-sectional area: -2 to +59%) in response to 12 weeks of resistance
training (Hubal et al., 2005), indicating individual training responses may vary
widely dependent on factors such as genetic heritage. Whilst approximately 6%
showed practically no gains in muscle size, no control group was utilised in this
study, so it is difficult to interpret the results presented without the availability of a
suitable comparator.
Other resistance training studies have reported that, in some subjects, muscle size
gains are either minimal or non-existent following a training intervention (Bamman
et al., 2007, Davidsen et al., 2011, Raue et al., 2012, Mitchell et al., 2013, Phillips et
al., 2013). Similarly to muscle size responses, gains in muscle strength during
resistance training are also highly individual (Hubal et al., 2005; Erskine et al.,
2010). However, the range of individual responses to resistance training in people of
different ages has not yet been elucidated. This question is particularly relevant
considering how people respond to a resistance-training programme based on
physical activity recommendations for health. In each of these studies, the recurring
theme of no comparator group is evident. These are interesting findings and
highlight that further study is warranted in this domain.
Given the findings of the proof-of-concept study reported in Chapter 6, in order to
replicate these findings, it is of prime importance to develop this methodology, and
undertake a similar trial on a larger scale, focusing on blood pressure outcomes and
147
utilizing the same analysis procedures. These findings, if replicated through a large-
scale research study, may have important implications on practice and policy for
clarification of inter-individual variation of blood pressure reactivity in response to
an acute bout of exercise. Furthermore, if these findings are replicated, detailed
investigation of possible moderators and mediators for the reported findings will be
warranted. Therefore, further research should be focused upon the elucidation of
these contributing factors to any observed inter-individual variation.
Future work should employ the research designs suggested in this thesis,
incorporating sound statistical quantification of the response variance in each arm,
combined with a threshold for the minimal clinically important difference, to
determine the presence of clinically important individual variation in response.
Whether these future studies observe the presence of ‘true’ inter-individual variation
in response or not, this should be disseminated through peer-reviewed publications,
in order to add to the body of literature pertaining to this current hot topic.
7.12 Summary of Evidence
In summary, the studies undertaken in this research project have highlighted the
consistent lack of a comparator sample within previous research purporting to show
inter-individual variation in response. When re-analysis of rare control sample data
presented by these authors is undertaken, more variation is observed in the control
group in comparison with the intervention group. The systematic review and meta-
analysis revealed that when studies containing a comparator sample within an RCT
design are meta-analysed, there is limited evidence for substantial inter-individual
variation in weight loss response to exercise training. Furthermore, when previous
data from a large-scale lifestyle change trial is re-analysed, whilst individual
response is apparent, further scrutiny of the initial findings reveal that the observed
individual response is inaccurate for both men and women. Further analyses
stratified by sex are required, revealing substantial inter-individual variation in blood
pressure response in men, compared to women.
148
Finally, in response to acute exercise, a newly-designed analysis model for replicate
crossover studies with continuous outcome variables allows for the accurate
partitioning of ‘one-time’ and ‘consistent’ inter-individual variation in response. This
analysis reveals the presence of ‘true’ inter-individual variation in response.

149
Appendices
150
Appendix 1 – Participant Information Sheet
Participant Information Sheet
Research title: Individual differences in the acute physiological responses to
intermittent exercise: A replicated crossover study
I, Phil Williamson, am a PhD student in the School of Health and Social Care. I would
like to invite you to take part in our research study. Prior to deciding to participate,
please read the following information and discuss it with others if you wish. Please
ask me if you have any questions.
What is the purpose of the study?
The study aims to quantify clinically-relevant inter-individual differences in blood
pressure responses to sub-maximal intermittent exercise.
Who is responsible for the study?
The researchers are Philip Williamson (PhD student, HSCI), Prof Alan Batterham
(Supervisor, HSCI) and Prof Greg Atkinson (Supervisor, HSCI).
Why have I been invited to take part?
You have been invited because you are a student at Teesside University, and I
wondered if you may be interested in taking part. To participate in the present study,
you must be healthy and aged 18 or older. Importantly, you are not eligible if you:
have any diagnosis or symptoms of cardiovascular or metabolic diseases (e.g.
heart disease, diabetes)
present an injury requiring alterations of the established exercise protocol
are physically unable to complete the intervention
have been advised by a health professional to avoid physical exercise or
activity
are taking any medication
are pregnant or
do not have a satisfactory score on the attached PARQ+. Please read through
this yourself to see if you are eligible and your score will be re-checked at
your first attendance if you want to take part
151
Please, feel free to show a copy of this invitation to anyone else who may wish to take
part. Anyone who meets the eligibility criteria is most welcome to express an interest
in participating.
Do I have to take part?
No. It is your personal choice whether or not you decide to participate. You are also
free to withdraw the study at any time if you want to up to the point of completing
your final data collection session in the laboratory. If at any point you wish to
withdraw from the study, we ask that you contact Prof Alan Batterham, the Director
of Studies, in the first instance ([email protected]). As data will be
anonymised, it is requested that you keep your individual participant information sheet
upon enrolment, as this will be used to retrieve and remove any coded data pertaining
to your involvement, should you wish to withdraw at any time.
What will happen to me if I take part?
You will be invited to attend laboratory sessions on five occasions taking place in the
Exercise Physiology Laboratory in the Olympia Building/Constantine Building at
Teesside University. To avoid alcohol (24h) and caffeine (12h) consumption, and
strenuous exercise (24h) prior each visit is required. At the first session, we will check
your responses on the attached PARQ+ to ensure that you may take part.
At the first session, you will be given a physical activity questionnaire to complete.
Once it has been confirmed that there are no medical conditions precluding your
participation in the research project, an informed consent form to be completed. On
the same occasion, you’ll be asked to complete a familiarisation session, and
demographic information involving your height, weight, gender, age, and resting
blood pressure will be recorded. Peak oxygen uptake shall then be assessed on a cycle
ergometer. Subsequently, you’ll be assigned to each of the two experimental
conditions of sub-maximal and no exercise to be completed in a random order. Each
visit is characterised by two phases. Firstly, your blood pressure will be measured
during a 30-min supine resting. Secondly, in the exercise condition, you’ll perform
three 10-min cycling at 70% of your peak oxygen uptake interspersed with 5-min
recovery periods. Measurements of your blood pressure will be repeated during each
resting interval. Similarly, we’ll adopt the same procedures regarding blood pressure
152
measurements when you are assigned to the control condition, but you’ll remain sat
on the cycle ergometer without undertaking any physical exercise. As mentioned
previously, each condition will be repeated twice. Overall, each experimental session
should take approximately 90 minutes.
What are the possible disadvantages or advantages of taking part?
There are certain risks to participating, such as discomfort or injury from
undertaking intermittent exercise. There are no direct benefits from participating,
although V̇O2peak is an established method for appraising cardiorespiratory fitness
which may be of interest.
Confidentiality
All the collected information during the study will be kept strictly confidential. None
of the measurements will be in the public domain as the data is anonymised. All
electronic data will be stored on a password protected Teesside University server.
Your non-identifiable data will be kept confidential and stored for up to 20 years at
Teesside University and could be used in future studies having obtained the required
ethical approval from a designated Research Governance and Ethics Committee.
How will the data be used?
The results of this study will be included in our PhD theses and future scientific articles
submitted for publication in peer-reviewed journals and conference presentations.
Collected data and results will be anonymous and no identifiable information will be
revealed.
What happens if there are any problems?
The methods used in this study have been safely adopted in previous clinical
investigations, although the present study is covered by University’s insurance
policies. If you felt you had been harmed in anyway by taking part in this study you
should contact the Associate Dean for Research and Innovation in the School, Prof
John Dixon ([email protected]) in the first instance if you should have any
complaints about the study.
Who approved the study?

153
This project has been reviewed and approved by the School of Health & Social Care
Research Governance and Ethics Committee at Teesside University. The Chair of this
committee is Dr. Alasdair Macsween.
Who can I contact for more information?
If you have any queries or you would like to receive more information please contact:
Philip Williamson at [email protected].
Additionally, you can contact Professor Greg Atkinson via e-mail
([email protected]) albeit not directly involved in booking appointments for
data collection.
Thank you for reading this information sheet and for your consideration on
taking part in the study.
154
Appendix 2 – Initial Contact Email
Hello,
My name is Philip Williamson and I am a PhD research student at Teesside. I am
writing to ask if you would consider taking part in my research project. I want to
investigate the acute inter-individual responses of blood pressure to intermittent
exercise and the acute changes in ankle brachial index. The title is, Individual
differences in the acute physiological responses to intermittent exercise: A
replicated crossover study.
I have attached a participant information sheet which explains the study and if you
are interested please do read it. Please don't be put off by the words intermittent
exercise; you won't be expected to suffer! I have also attached an initial PARQ to
enable me to assess your medical eligibility for inclusion in the study.
I will be sending out two reminder emails about the study - one in two weeks and
then again two weeks later. Doing this has been shown to greatly improve
recruitment to studies. Please accept my apologies in advance if you have already
decided you don't want to take part when you receive those.
If you have any questions and/or would like to express an interest in taking part, then
please contact myself on [email protected]. You can also contact my
supervisor Alan Batterham and Greg Atkinson on [email protected] or
155
Appendix 3 – Initial Course Lead Contact
Hello,
My name is Philip Williamson and I am a PhD research student at Teesside. I am
writing to ask if you would please help me by forwarding the invitation e-mail and
Participant Information Sheet (attached) to all your students? I want to investigate
the acute inter-individual responses of blood pressure to intermittent exercise and the
acute changes in ankle-brachial index. The title is, Individual differences in the
acute physiological responses to intermittent exercise: A replicated crossover
study.
I will be sending out two reminder emails about the study - one in two weeks and
then again two weeks later. Doing this has been shown to greatly improve
recruitment to studies. If you will not forward our email on to your students and you
don't want to receive any reminders, please let me know and I won't send them to
you.
Thank you for considering helping us to recruit.
Please don’t hesitate to contact me if you have any questions on
[email protected]. You can also contact my supervisor Alan Batterham and
Greg Atkinson on [email protected] or
156
Appendix 4 – Initial Invite via Subject Lead
Hello,
My name is Philip Williamson and I am a PhD research student at Teesside. Your
Subject Lead obtained your contact details from their database and has sent you this
on our behalf. I do not know who they have contacted, no information about you, nor
your contact details have been given or shown to me. I would like to ask you if you
would please consider taking part in my research project? I want to investigate the
acute inter-individual responses of blood pressure to intermittent exercise and the
acute changes in ankle-brachial index. The title is: Individual differences in the
acute physiological responses to intermittent exercise: A replicated crossover
study.
I have attached a participant information sheet which explains the study and if you
are interested please do read it. Please don't be put off by the words intermittent
exercise; you won't be expected to suffer! I have also attached an initial PARQ to
enable me to assess your medical eligibility for inclusion in the study.
I have asked your Subject Lead to send out two reminder emails about the study -
one in two weeks and then again two weeks later. Doing this has been shown to
greatly improve recruitment to studies. Please accept our apologies in advance if
you have already decided you don't want to take part when you receive those.
If you have any questions and/or would like to express an interest in taking part then
please contact me if you have any questions on [email protected]. You can
also contact our supervisor Alan Batterham and Greg Atkinson on

157
Appendix 5 – Informed Consent
Individual differences in the acute physiological responses to intermittent
exercise: A replicated crossover study
Researcher: Phil Williamson
Supervisor: Professor Alan Batterham
Please put your initials in the boxes to indicate your agreement with the
corresponding statements.
I have read and understood the information sheet for the above study and
have had the opportunity to ask questions.
I meet the inclusion criteria for participation in the study.
I know that I have the right to withdraw any data collected from
me up until the final (third) data collection session is complete.
I agree to my data being stored on a password protected server
I agree to take part in this study
---------------------------- -------------------- --------------------
Name of Participant Date
Signature
---------------------------- -------------------- --------------------
Name of Witness Date Signature

158
Appendix 6 – Adverse Event
CONFIDENTIAL
ADVERSE EVENTS FORM
Subject
ID:
Subject
Initials: D.O.B
Age:
Gender: M / F
Were there any Adverse
Events?
(Please check appropriate box)
Visit 1 Visit 2 Visit 3 Visit 4 Visit 5
yes
no
yes
no
yes
no
yes
no
yes
no
If no Adverse Events (AE) were reported, no signature from the PI is required. Any
adverse event will be reported to and reviewed by Prof Alan Batterham (Director of
Studies) as soon as possible. Where relationship to experimental procedures is scored
2-5, the event will be reported to Marion Grieves and Alasdair MacSween as soon as
possible.
Severity
1 = Mild
2 = Moderate
3 = Severe
Relationship to experimental procedures
1 = Definitely not related
2 = Probably not related
3 = Possibly related
4 = Probably related
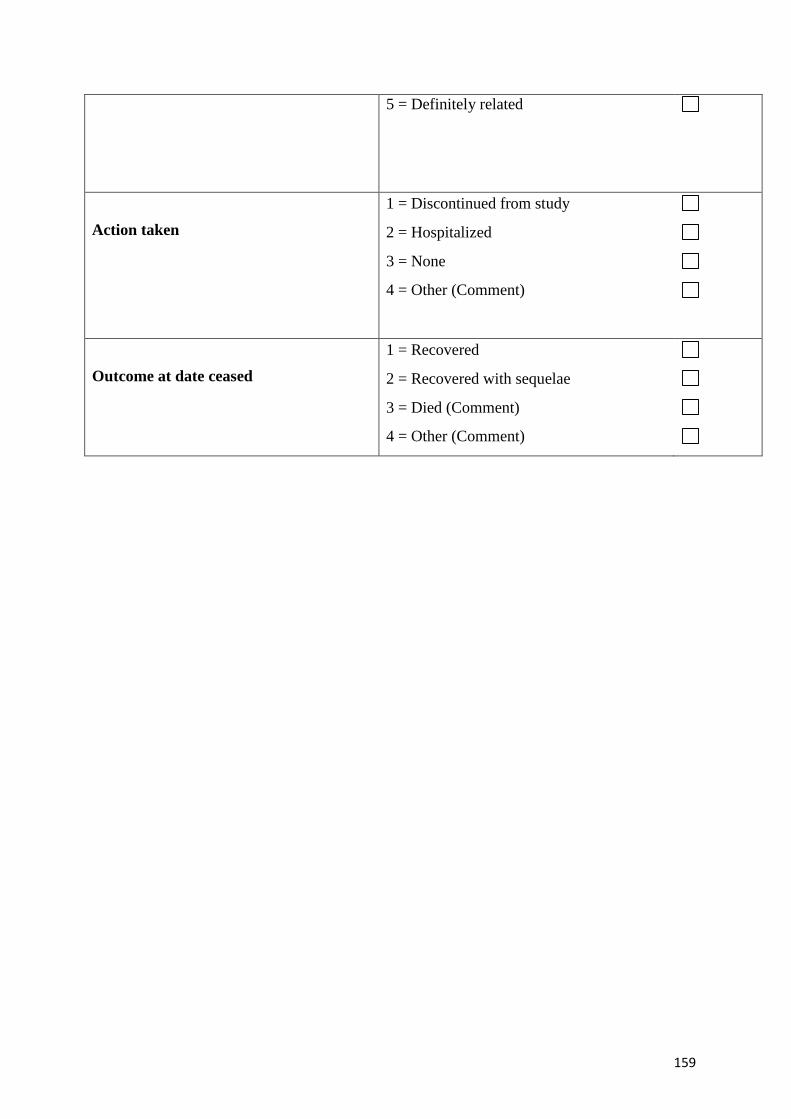
159
5 = Definitely related
Action taken
1 = Discontinued from study
2 = Hospitalized
3 = None
4 = Other (Comment)
Outcome at date ceased
1 = Recovered
2 = Recovered with sequelae
3 = Died (Comment)
4 = Other (Comment)

160
ADVERSE EVENTS FORM
Adverse Event Date of Onset
dd/mm/20
Date Ceased
dd/mm/20
Severity Action taken Outcome
/ /
/ /
/ /
/ /
Signature:
Examiner:
_____________________________________________________________
Date:_
PI:
_________________________________________________________
____ Date:_
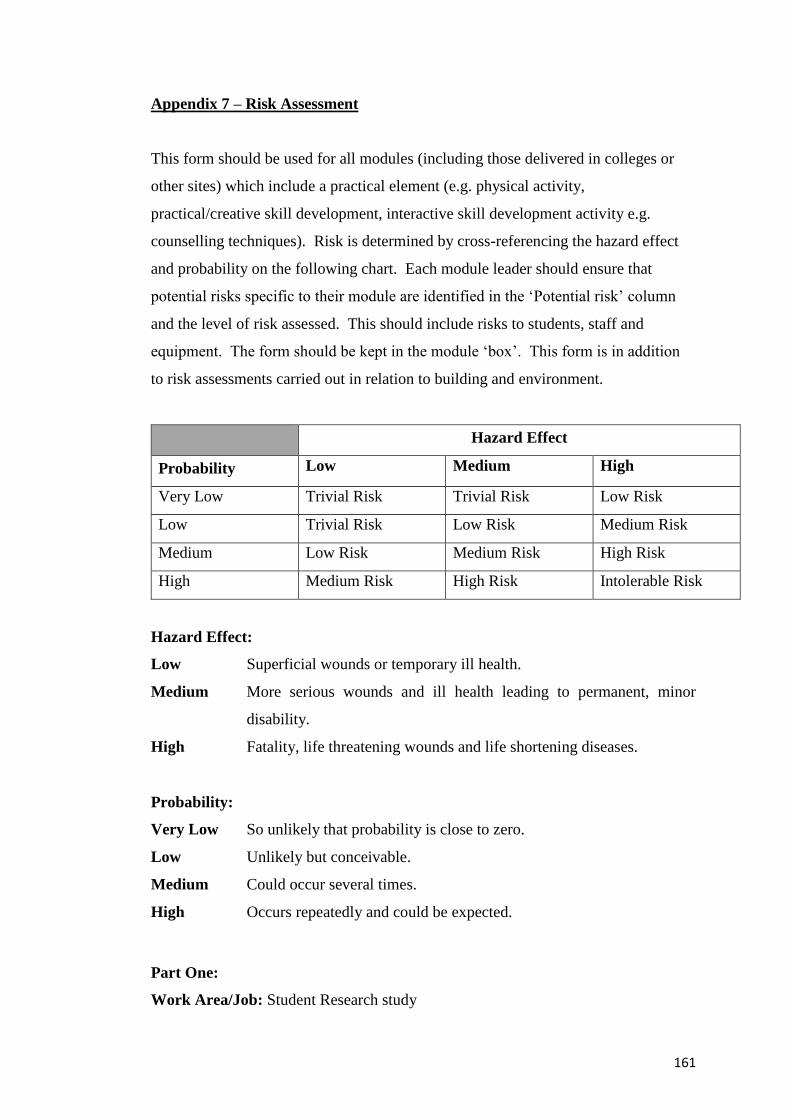
161
Appendix 7 – Risk Assessment
This form should be used for all modules (including those delivered in colleges or
other sites) which include a practical element (e.g. physical activity,
practical/creative skill development, interactive skill development activity e.g.
counselling techniques). Risk is determined by cross-referencing the hazard effect
and probability on the following chart. Each module leader should ensure that
potential risks specific to their module are identified in the ‘Potential risk’ column
and the level of risk assessed. This should include risks to students, staff and
equipment. The form should be kept in the module ‘box’. This form is in addition
to risk assessments carried out in relation to building and environment.
Hazard Effect
Probability Low Medium High
Very Low Trivial Risk Trivial Risk Low Risk
Low Trivial Risk Low Risk Medium Risk
Medium Low Risk Medium Risk High Risk
High Medium Risk High Risk Intolerable Risk
Hazard Effect:
Low Superficial wounds or temporary ill health.
Medium More serious wounds and ill health leading to permanent, minor
disability.
High Fatality, life threatening wounds and life shortening diseases.
Probability:
Very Low So unlikely that probability is close to zero.
Low Unlikely but conceivable.
Medium Could occur several times.
High Occurs repeatedly and could be expected.
Part One:
Work Area/Job: Student Research study
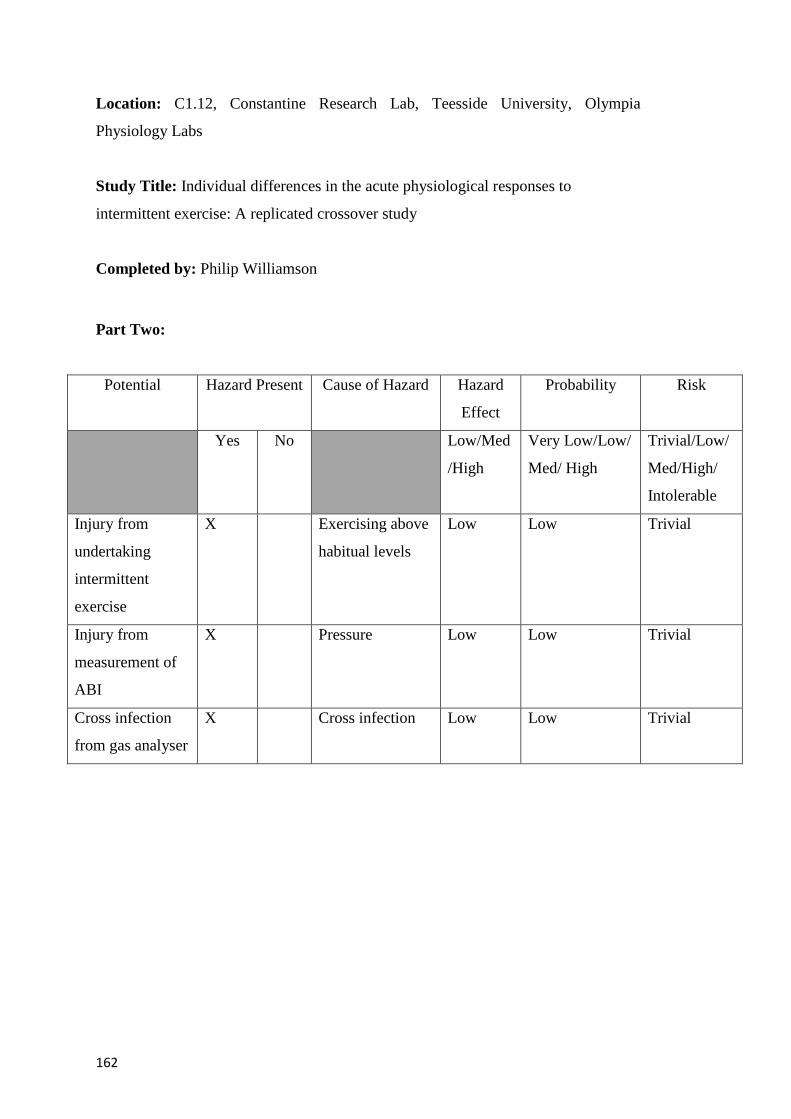
162
Location: C1.12, Constantine Research Lab, Teesside University, Olympia
Physiology Labs
Study Title: Individual differences in the acute physiological responses to
intermittent exercise: A replicated crossover study
Completed by: Philip Williamson
Part Two:
Potential Hazard Present Cause of Hazard Hazard
Effect
Probability Risk
Yes No Low/Med
/High
Very Low/Low/
Med/ High
Trivial/Low/
Med/High/
Intolerable
Injury from
undertaking
intermittent
exercise
X Exercising above
habitual levels
Low Low Trivial
Injury from
measurement of
ABI
X Pressure Low Low Trivial
Cross infection
from gas analyser
X Cross infection Low Low Trivial
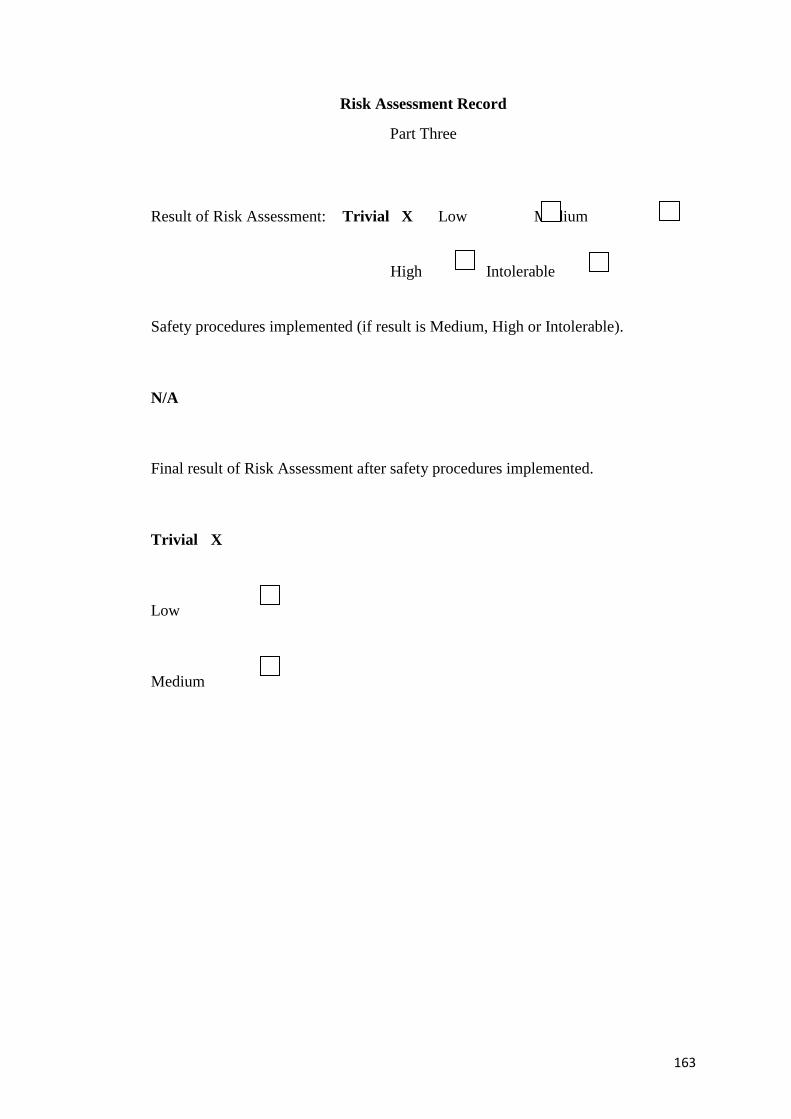
163
Risk Assessment Record
Part Three
Result of Risk Assessment: Trivial X Low Medium
High Intolerable
Safety procedures implemented (if result is Medium, High or Intolerable).
N/A
Final result of Risk Assessment after safety procedures implemented.
Trivial X
Low
Medium
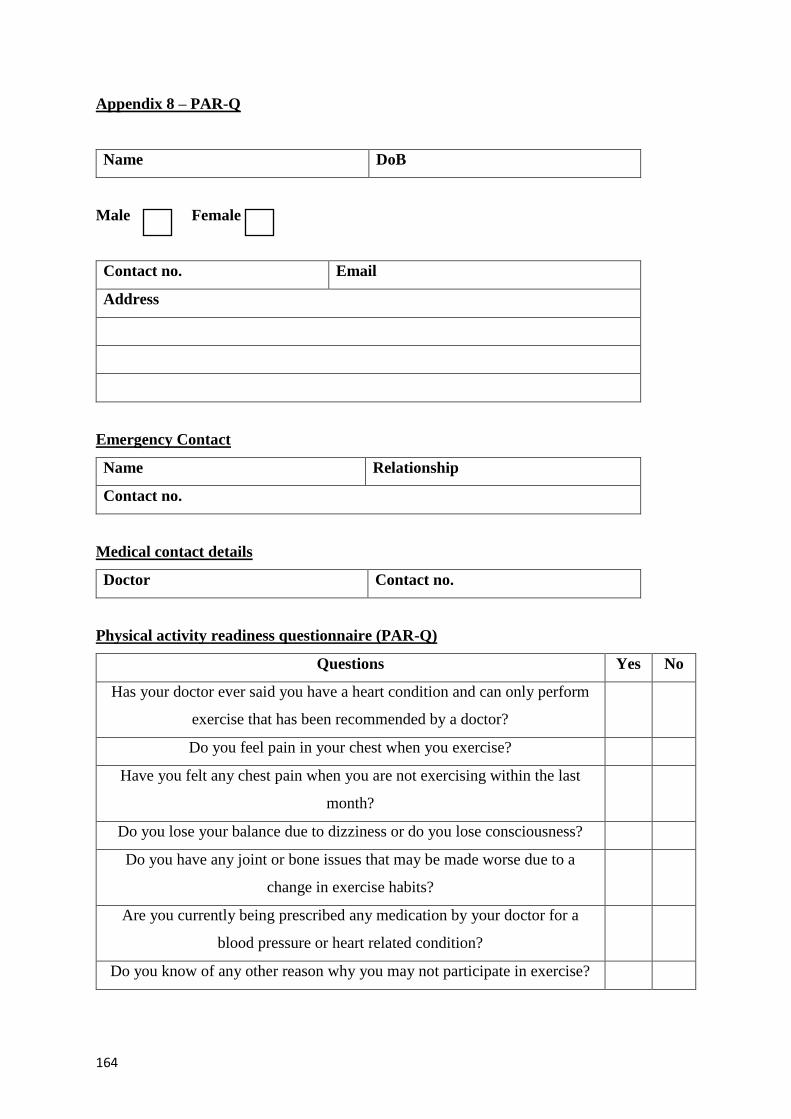
164
Appendix 8 – PAR-Q
Name DoB
Male Female
Contact no. Email
Address
Emergency Contact
Name Relationship
Contact no.
Medical contact details
Doctor Contact no.
Physical activity readiness questionnaire (PAR-Q)
Questions Yes No
Has your doctor ever said you have a heart condition and can only perform
exercise that has been recommended by a doctor?
Do you feel pain in your chest when you exercise?
Have you felt any chest pain when you are not exercising within the last
month?
Do you lose your balance due to dizziness or do you lose consciousness?
Do you have any joint or bone issues that may be made worse due to a
change in exercise habits?
Are you currently being prescribed any medication by your doctor for a
blood pressure or heart related condition?
Do you know of any other reason why you may not participate in exercise?
165
Outcome
Medical clearance not necessary
Medical clearance recommended
Medical clearance required
I confirm that I have read the questions fully and answered each question
honestly. If there are any changes in my health I will inform the investigators
immediately.
Signature Date
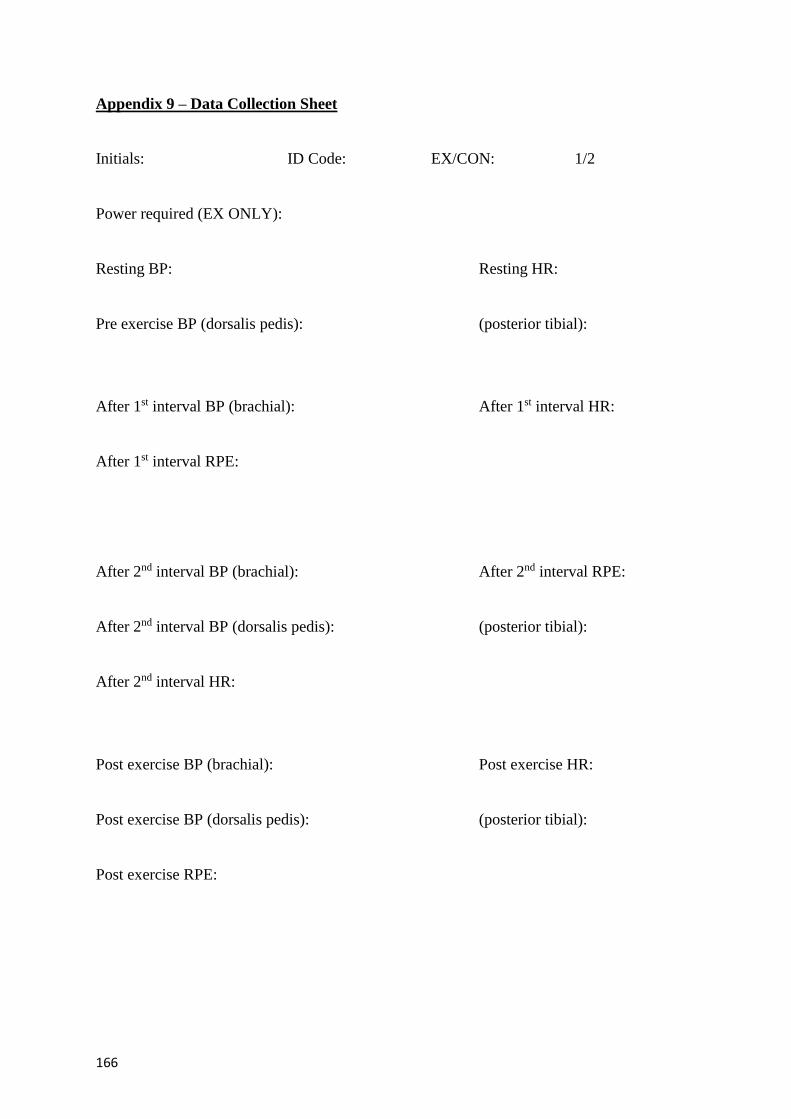
166
Appendix 9 – Data Collection Sheet
Initials: ID Code: EX/CON: 1/2
Power required (EX ONLY):
Resting BP: Resting HR:
Pre exercise BP (dorsalis pedis): (posterior tibial):
After 1st interval BP (brachial): After 1st interval HR:
After 1st interval RPE:
After 2nd interval BP (brachial): After 2nd interval RPE:
After 2nd interval BP (dorsalis pedis): (posterior tibial):
After 2nd interval HR:
Post exercise BP (brachial): Post exercise HR:
Post exercise BP (dorsalis pedis): (posterior tibial):
Post exercise RPE:
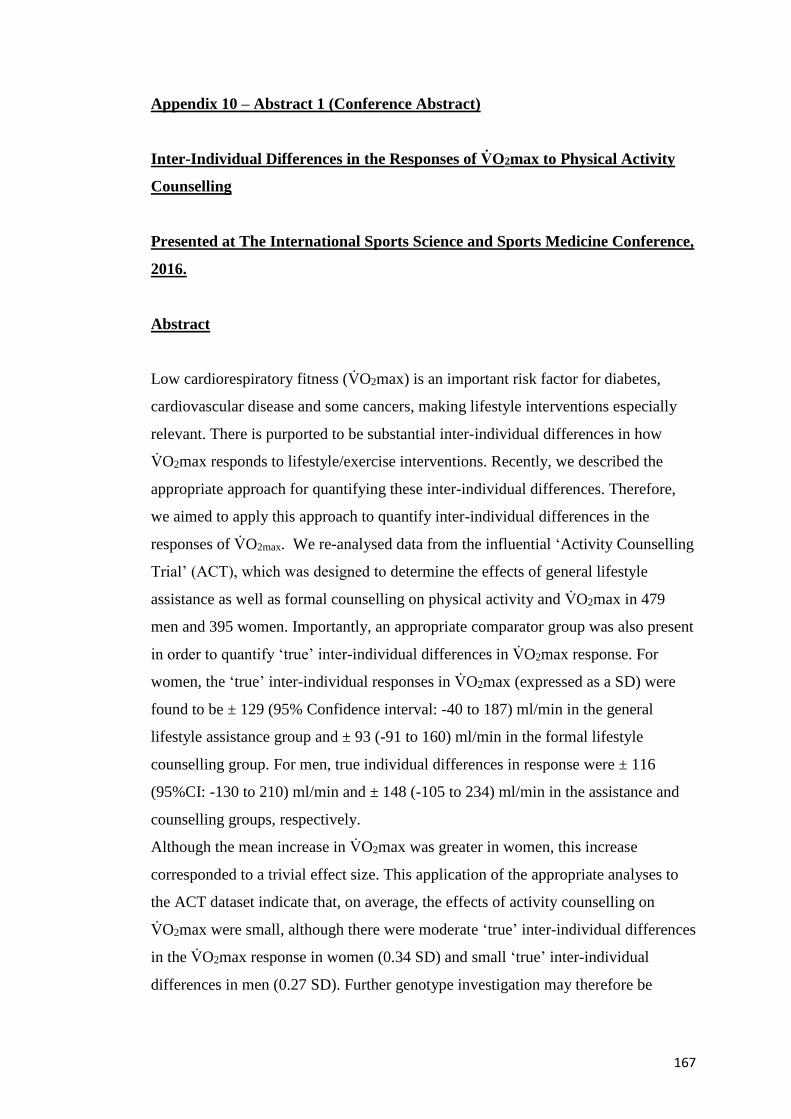
167
Appendix 10 – Abstract 1 (Conference Abstract)
Inter-Individual Differences in the Responses of V̇O2max to Physical Activity
Counselling
Presented at The International Sports Science and Sports Medicine Conference,
2016.
Abstract
Low cardiorespiratory fitness (V̇O2max) is an important risk factor for diabetes,
cardiovascular disease and some cancers, making lifestyle interventions especially
relevant. There is purported to be substantial inter-individual differences in how
V̇O2max responds to lifestyle/exercise interventions. Recently, we described the
appropriate approach for quantifying these inter-individual differences. Therefore,
we aimed to apply this approach to quantify inter-individual differences in the
responses of V̇O2max. We re-analysed data from the influential ‘Activity Counselling
Trial’ (ACT), which was designed to determine the effects of general lifestyle
assistance as well as formal counselling on physical activity and V̇O2max in 479
men and 395 women. Importantly, an appropriate comparator group was also present
in order to quantify ‘true’ inter-individual differences in V̇O2max response. For
women, the ‘true’ inter-individual responses in V̇O2max (expressed as a SD) were
found to be ± 129 (95% Confidence interval: -40 to 187) ml/min in the general
lifestyle assistance group and ± 93 (-91 to 160) ml/min in the formal lifestyle
counselling group. For men, true individual differences in response were ± 116
(95%CI: -130 to 210) ml/min and ± 148 (-105 to 234) ml/min in the assistance and
counselling groups, respectively.
Although the mean increase in V̇O2max was greater in women, this increase
corresponded to a trivial effect size. This application of the appropriate analyses to
the ACT dataset indicate that, on average, the effects of activity counselling on
V̇O2max were small, although there were moderate ‘true’ inter-individual differences
in the V̇O2max response in women (0.34 SD) and small ‘true’ inter-individual
differences in men (0.27 SD). Further genotype investigation may therefore be
168
warranted in order to determine the mediators of this observed heterogeneity in
response.
Appendix 11 - Abstract 2 (Conference Abstract)
Inter-Individual Responses of Maximal Oxygen Uptake to Exercise Training: A
Critical Review
Also published in Sports Medicine. 2017;47:1501-13.
Abstract
It has recently been reported how to quantify inter-individual differences in the
response to an exercise intervention using the standard deviation of the change
scores, as well as how to appraise these differences for clinical relevance. In a
parallel-group randomised controlled trial, the key trigger for further investigation
into inter-individual responses is when the standard deviation of change in the
intervention sample is substantially larger than the same standard deviation derived
from a suitable comparator sample. ‘True’ and clinically relevant inter-individual
differences in response can then be plausibly expected, and potential moderators and
mediators of the inter-individual differences can be explored. We now aim to
critically review the research on the inter-individual differences in response to
exercise training, focusing on maximal oxygen uptake (V̇O2max). A literature search
through the relevant bibliographic databases resulted in the identification of six
relevant studies that were published prior to the influential HEalth, RIsk factors,
exercise Training And Genetics (HERITAGE) Family Study. Only one of these
studies was found to include a comparator arm. Re-analysis of the data from this
study, accounting for random within subjects variation, revealed an absence of
clinically important inter-individual differences in the response of V̇O2max to
exercise training. The standard deviation of change was, in fact, larger (±5.6 mL.kg-
1.min-1) for the comparator than the intervention group (±3.7 mL.kg-1.min-1). We
located over 180 publications that resulted from the HERITAGE Family Study, but
we could not find a comparator arm in any of these studies. Some authors did not
explain this absence, while others reasoned that only inter-individual differences in
exercise response were of interest, thus the intervention sample was investigated
169
solely. We also found this absence of a comparator sample in on-going studies. A
perceived high test–retest reliability is offered as a justification for the absence of a
comparator arm, but the test–retest reliability analysis for the HERITAGE Family
Study was over a much shorter term than the length of the actual
raining period between baseline and follow-up measurements of V̇O2max. We also
scrutinised the studies in which twins have been investigated, resulting in concerns
about how genetic influences on the magnitude of general within-subjects variability
has been partitioned out (again in the absence of a comparator no-training group), as
well as with the intra-class correlation coefficient approach to data analysis. Twin
pairs were found to be sometimes heterogeneous for the obviously influential factors
of sex, age and fitness, thereby inflating an unadjusted coefficient. We conclude that
most studies on inter-individual differences in V̇O2max response to exercise training
have no comparator sample. Therefore, true inter-individual differences in response
cannot be quantified, let alone appraised for clinical relevance. For those studies
with a comparator sample, we found that the inter-individual differences in training
response were not larger than random within-subjects variation in V̇O2max over the
same time period as the training intervention.
170
Appendix 12 - Abstract 3
Inter-Individual Differences in Weight Change Following Exercise
Interventions: A Systematic Review and Meta-analysis of Randomised
Controlled Trials
Published in Obesity Reviews. 2018;19:960-75.
Abstract
Previous reports of substantial inter-individual differences in weight change
following an exercise intervention are often based solely on the observed responses
in the intervention group. Therefore, we aimed to quantify the magnitude of inter-
individual differences in exercise-mediated weight change. We synthesized
randomised controlled trials (RCT) of structured, supervised exercise interventions.
Fourteen electronic databases were searched for relevant studies published up to
March 2017. Search terms focused on structured training, RCTs and body weight.
We then sifted these results for those RCTs (n=12, 1500 participants) that included
relevant comparator group data. Standard deviations (SD) of weight change were
extracted, thereby allowing the SD for true inter-individual differences in weight-
loss to be calculated for each study. Using a random effects meta-analysis, the
pooled SD (95% CI) for true individual responses was 0.8 (-0.9 to 1.4) kg. The 95%
prediction interval (based on 2SDs) for true inter-individual responses was -2.8 to
3.6 kg. The probability (% chance) that the true individual response variability would
be clinically meaningful (>2.5 kg) in a future study in similar settings was 23%
(‘unlikely’). Therefore, we conclude that evidence is limited for the notion that there
are clinically important individual differences in exercise-mediated weight change.
171
Appendix 13 - Abstract 4 (Conference Abstract)
Inter-Individual Differences in Acute Blood Pressure Response to High
Intensity Exercise: A Replicate Crossover Design
Presented at The European College of Sport Science Congress, 2018.
Introduction
Acute blood pressure responses to physical activity predict hypertension and other
cardiovascular-related comorbidities (Atkinson et al., 2013). Robust quantification
of individual differences in this blood pressure reactivity requires a controlled
replicate crossover design to isolate the participant x condition response variance
(Senn, 2016; Goltz et al., 2017). Our aim was to conduct the first appropriately
designed experiment on individual differences in acute blood pressure reactivity to
exercise.
Methods
After baseline assessment of peak oxygen uptake, twelve normotensive adults (4
women) with mean (SD) age: 29.7 (4.9) y, height: 173.9 (10.1) cm, body mass: 72.5
(12.5) kg were randomized in blocks of 2 to one of 6 possible sequences of 2 control
and 2 exercise replicates over 4 periods. The exercise comprised two 10-min bouts of
cycling at 70% of the power output exhibited at peak oxygen uptake, separated by a
5-min recovery period. In the control condition, participants rested on the cycle
ergometer for the equivalent time. Blood pressure was measured at rest and
immediately after the last exercise bout (or at the end of the control period). Data
(n=11 due to one withdrawal post-randomization) were analysed using a linear
mixed model, allowing for sex differences in the mean effect of acute exercise and
differential period effects between conditions (by sex). We included random effects
for the participant x treatment interaction (by period) to partition the variance and
derive the true SD for individual responses.
Results
The mean effect of acute exercise (versus control) on systolic blood pressure was an
increase of 49 (90% CI, 36 to 62) mmHg (67 mmHg in women vs. 32 mmHg in
172
men). The consistent SD for individual responses – the typical inter-individual
difference between participants in the mean change between a control trial and an
exercise trial - was 16 (±90% Confidence Limits - 21) mmHg. The one-time inter-
individual variation in response was 11 (±18) mmHg.
Discussion
In the first replicate crossover study quantifying inter-individual variability in
response to exercise, we have shown a very large typical difference between
participants in the mean effect of acute exercise on systolic blood pressure. We
emphasize that although individual response variance was substantial, such a finding
does not imply, necessarily, that there are ‘responders’ and ‘non-responders’ – in the
current study all participants were responders to acute exercise. This model can be
applied to future replicate crossover trials to quantify the presence of inter-individual
variation in response to acute exercise.
References
Atkinson G, Batterham AM, Kario K, et al. Eur J Appl Physiol. et al. 2014;114:521-
9.
Goltz FR, Thackray AE, King JA, et al. Med Sci Sports Exerc. 2018. Ahead of
Press. DOI: 10.1249/MSS.0000000000001504
Senn S. Stat Med. 2016;35:966
173
Appendix 14 – Peer-Reviewed Paper – Inter Individual Responses of Maximal
Oxygen Uptake to Exercise Training; A Critical Review

174
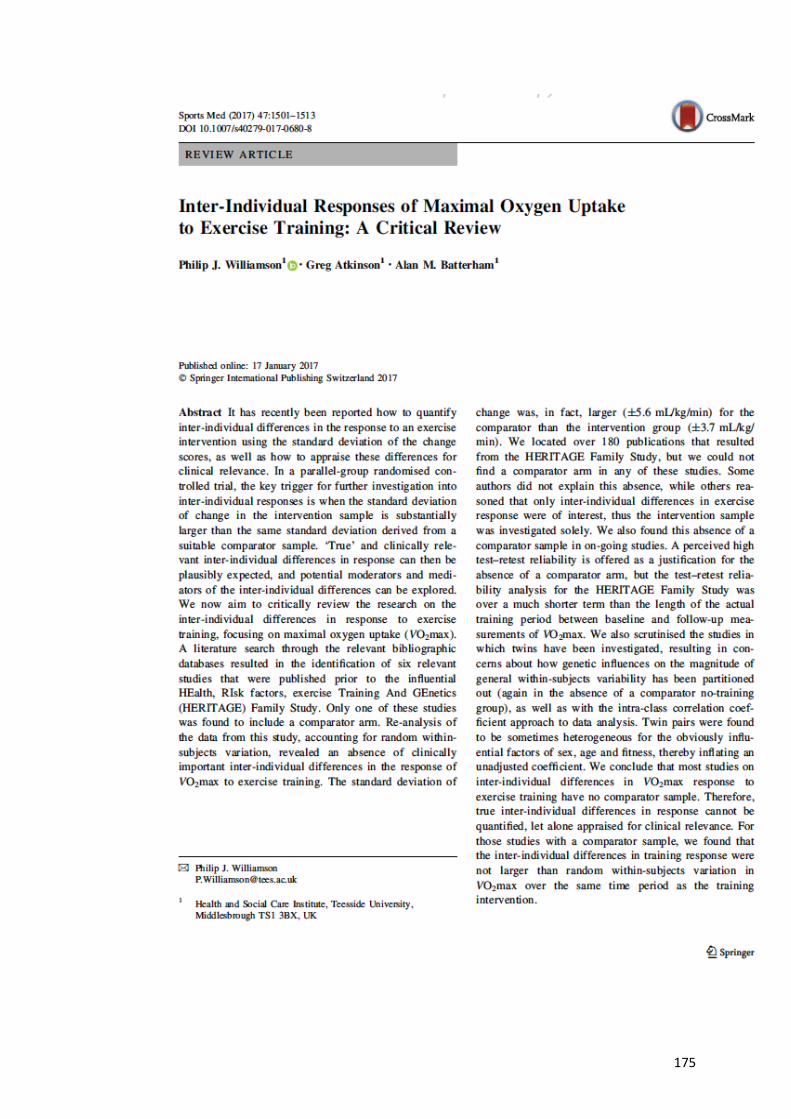
175
176
177
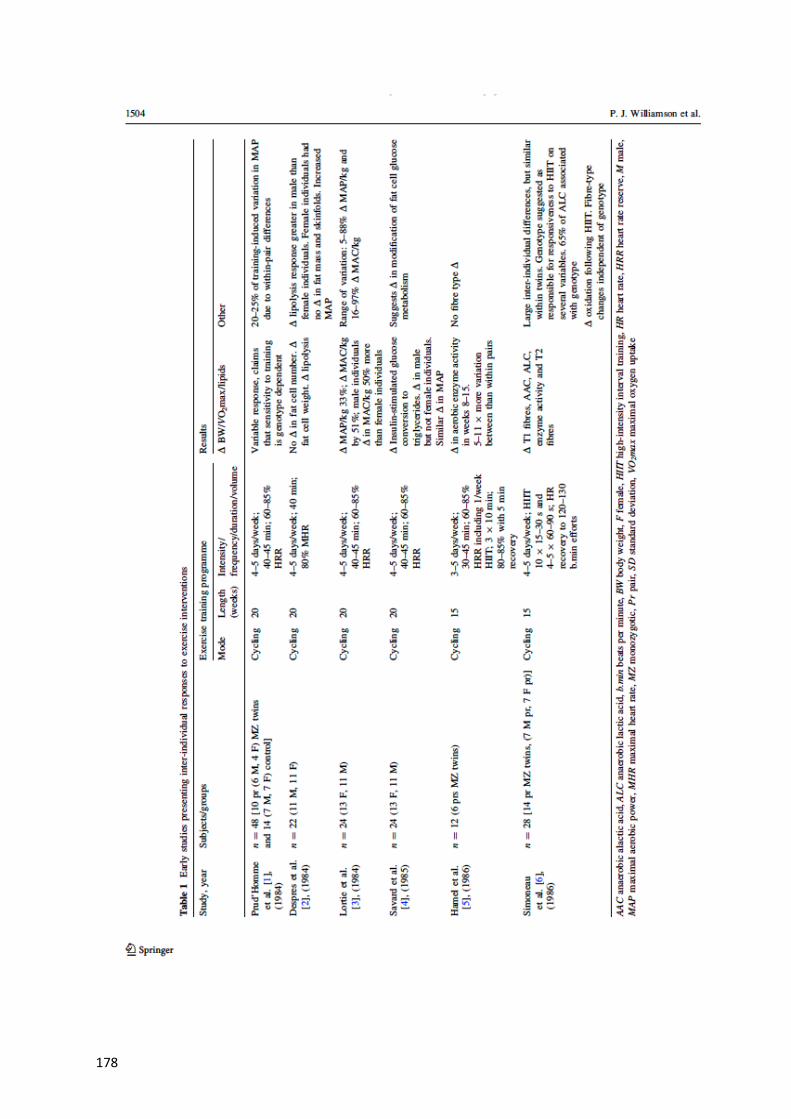
178
179
180
181
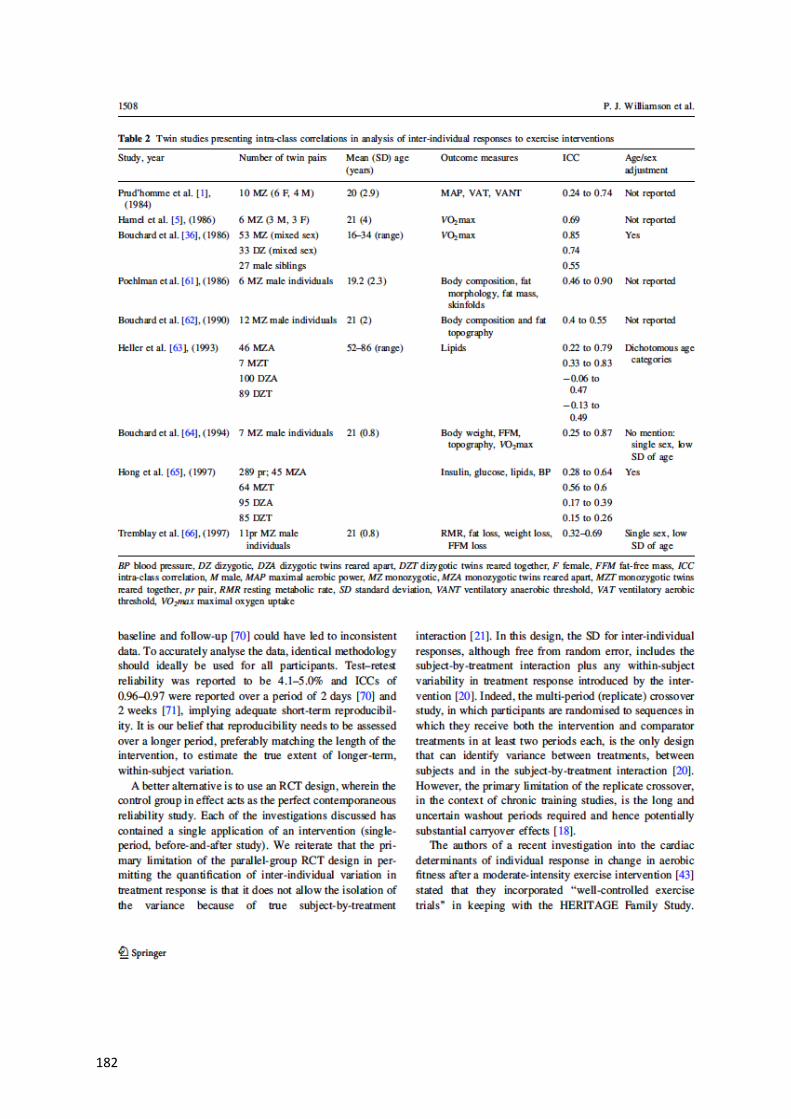
182
183
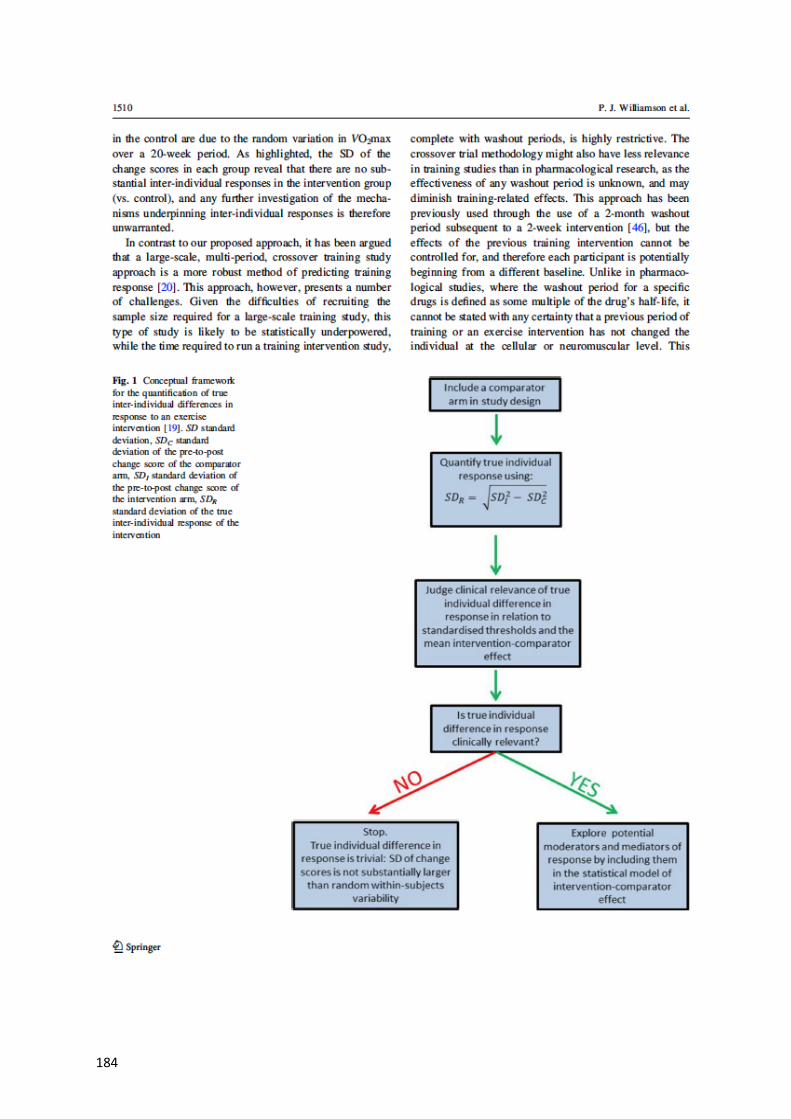
184
185
186
187
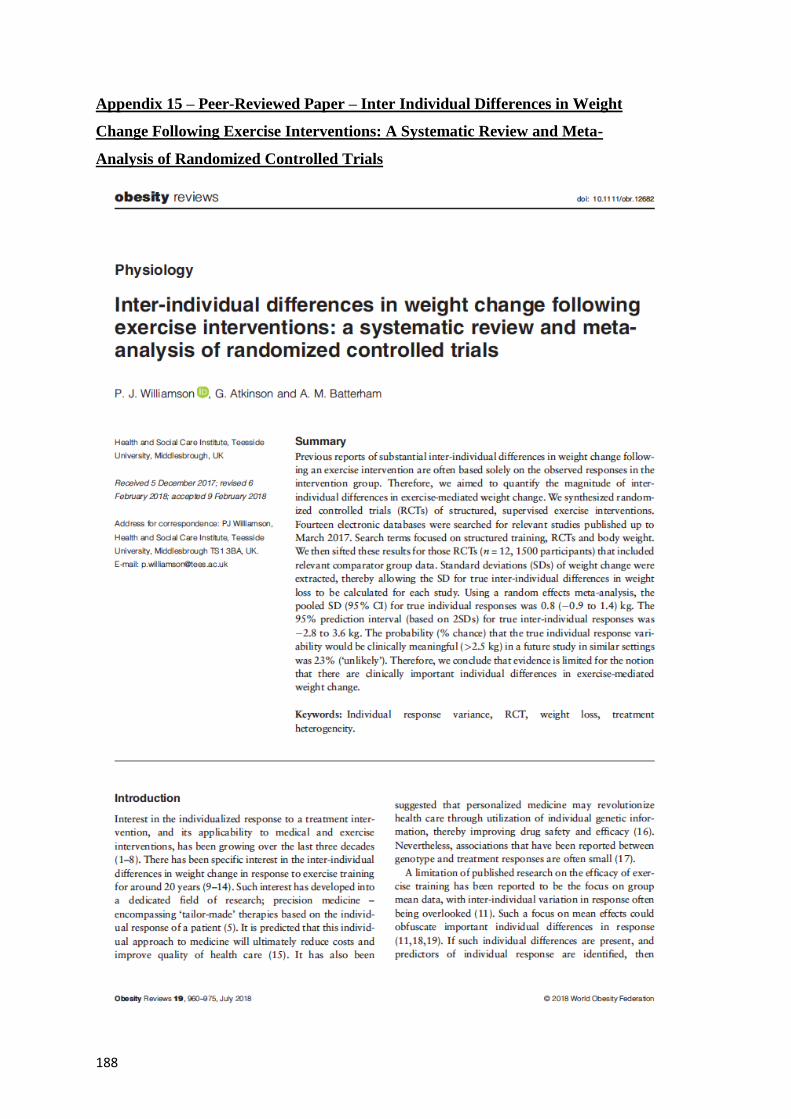
188
Appendix 15 – Peer-Reviewed Paper – Inter Individual Differences in Weight
Change Following Exercise Interventions: A Systematic Review and Meta-
Analysis of Randomized Controlled Trials
189
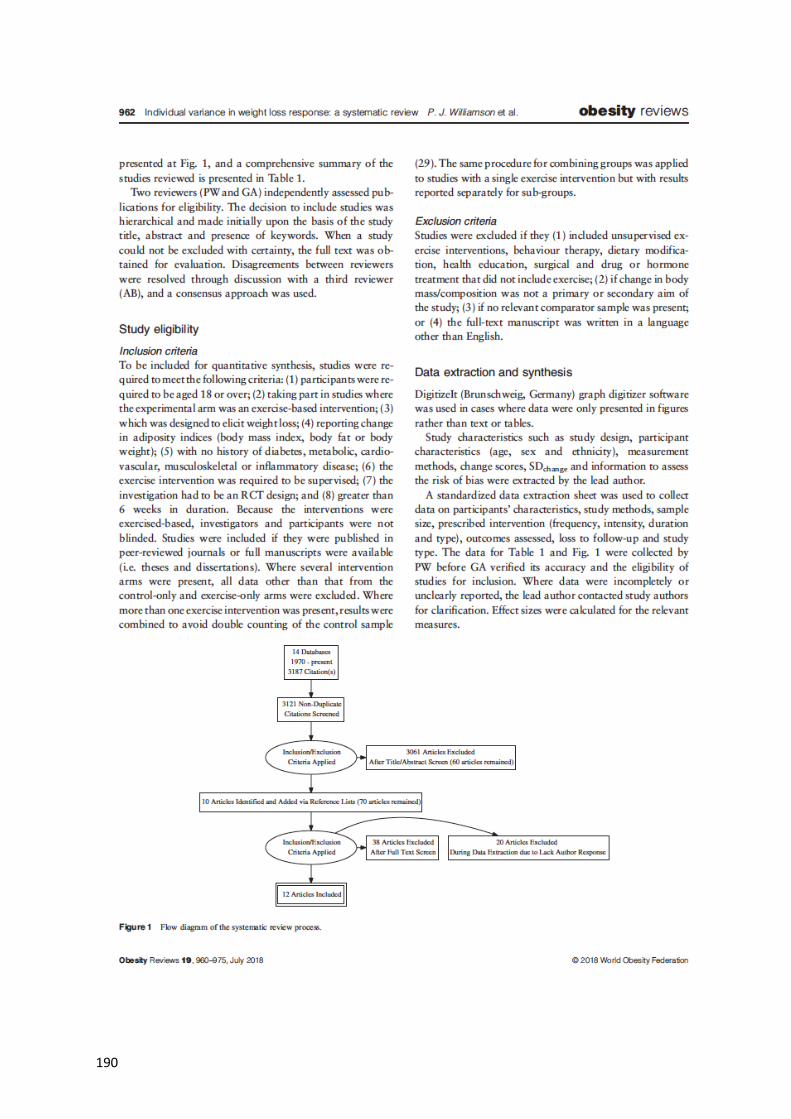
190
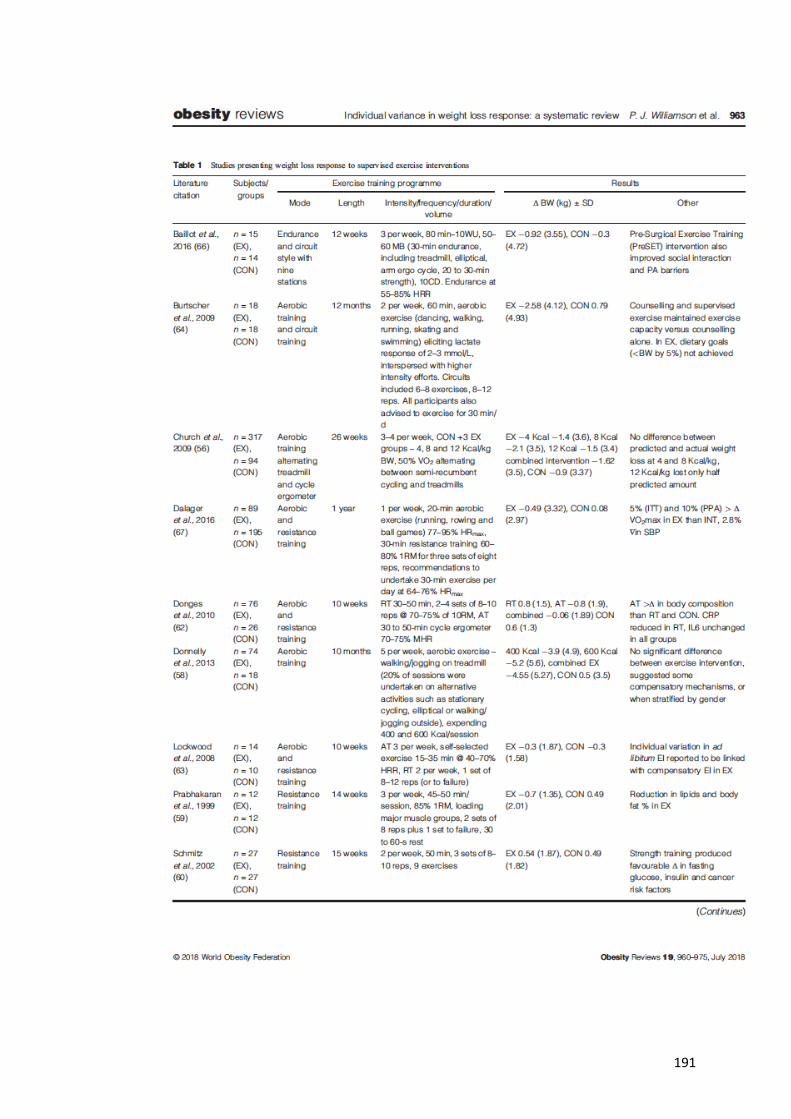
191
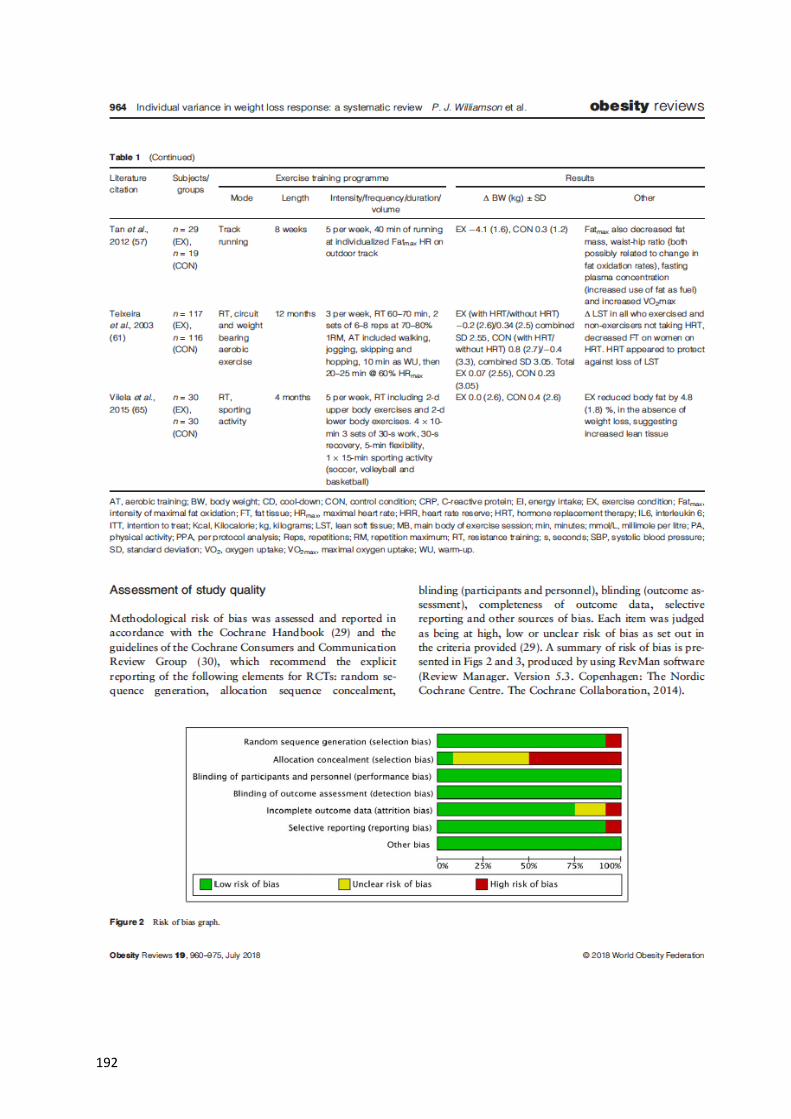
192
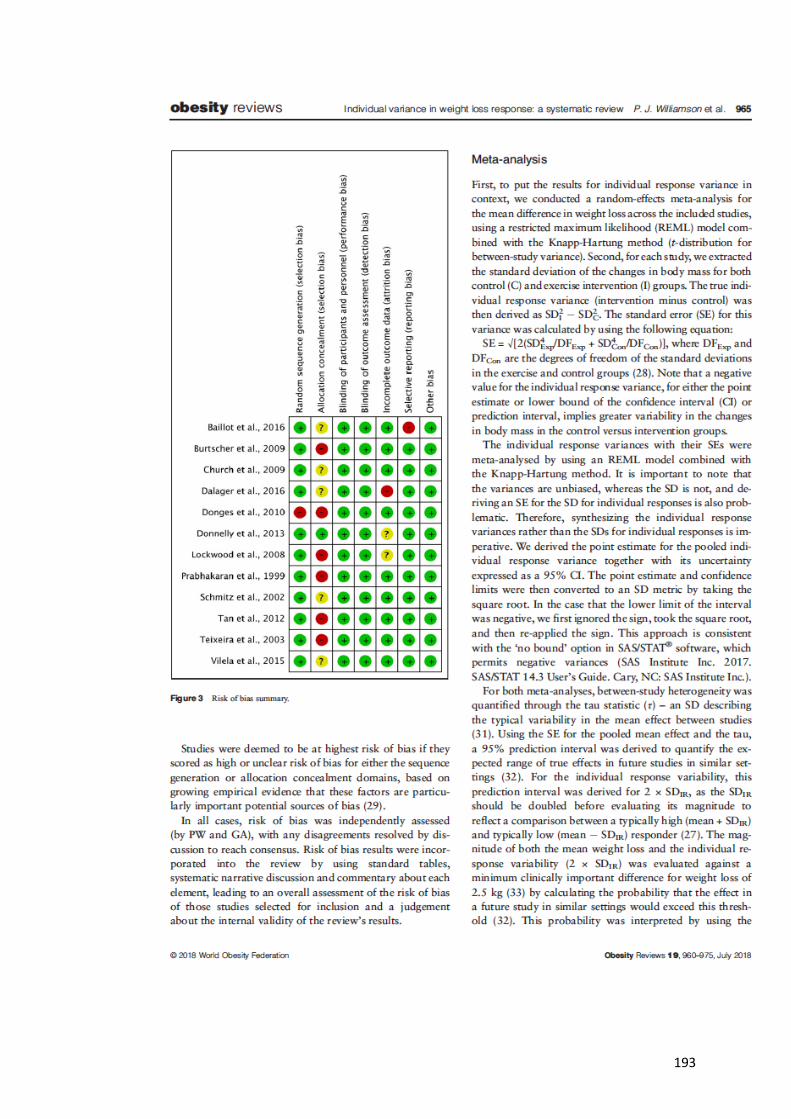
193
194
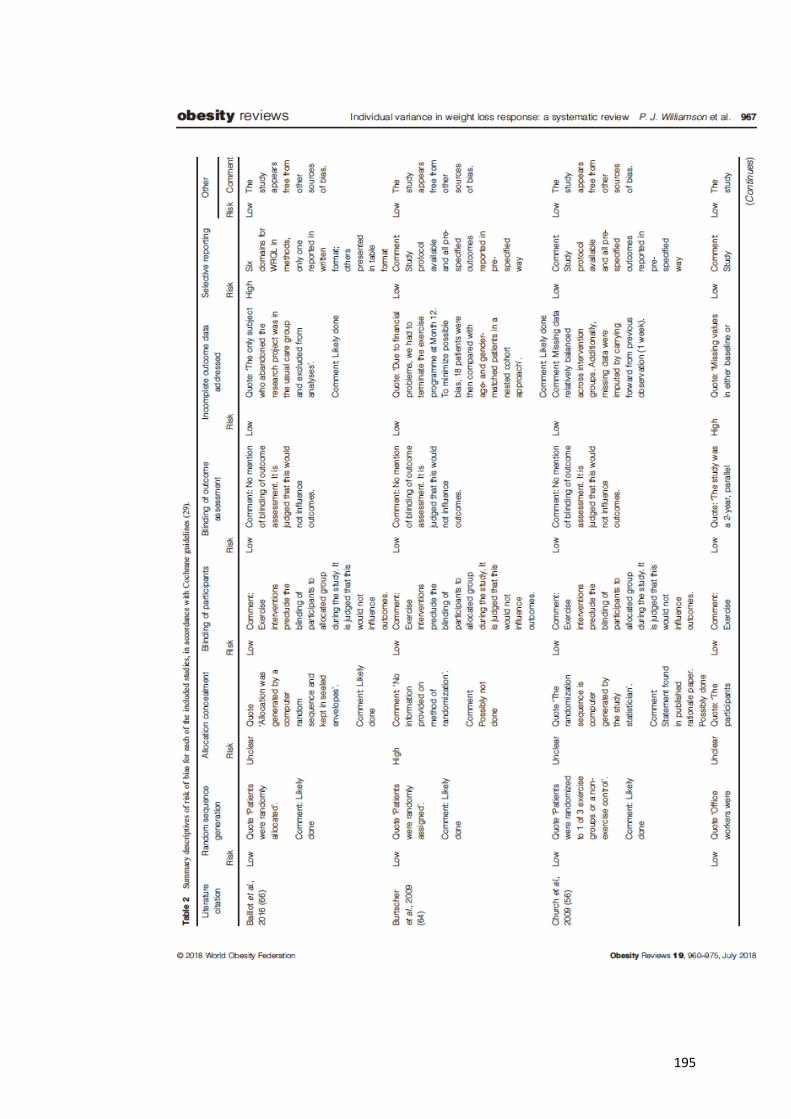
195
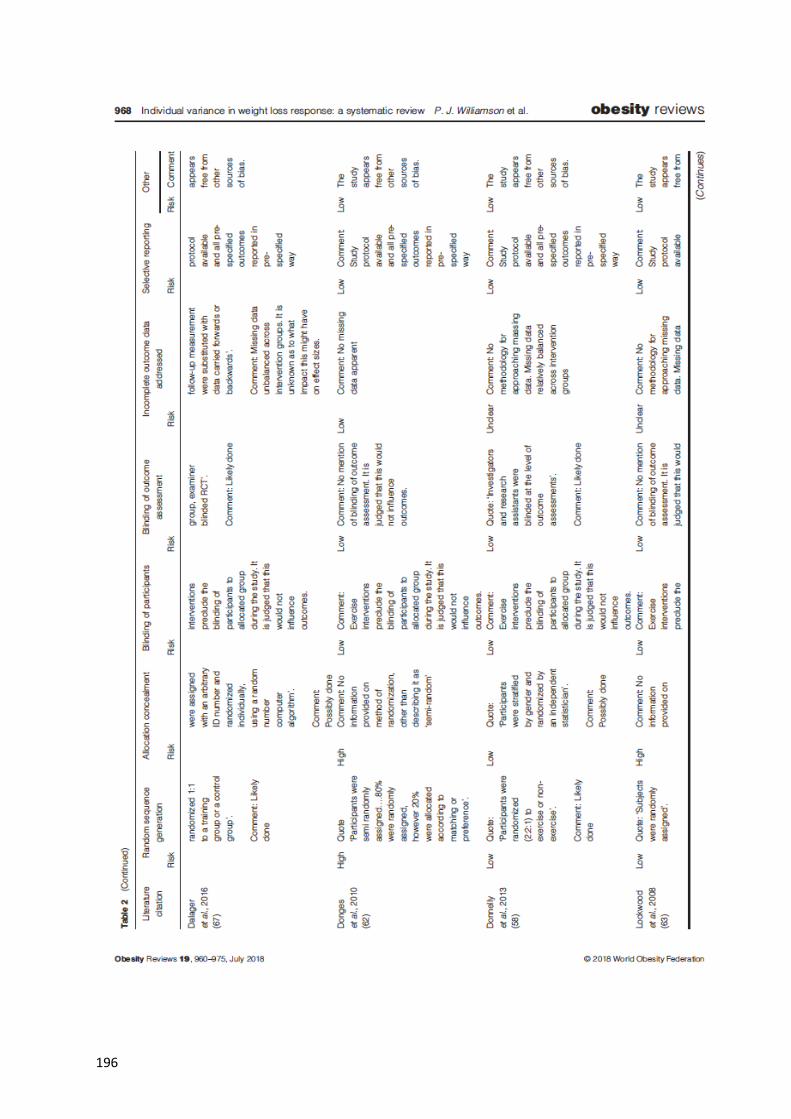
196
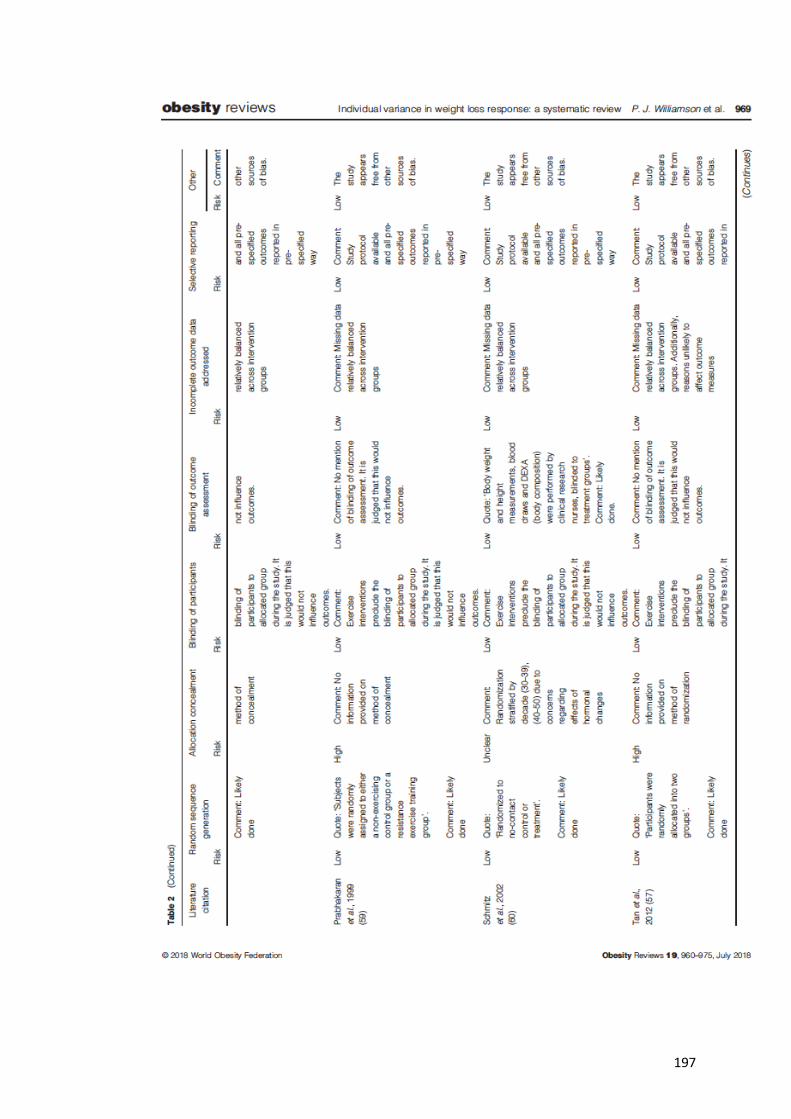
197
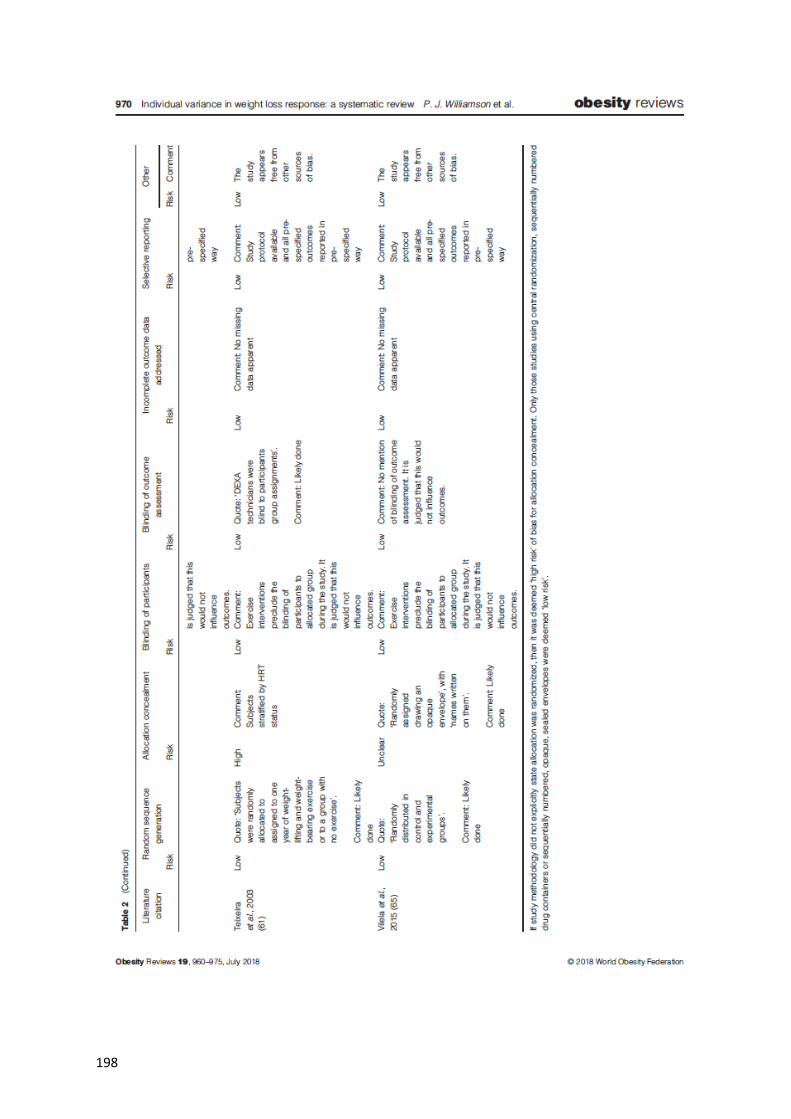
198
199
200
201
202
203
204
References
Agurs-Collins T, Khoury MJ, Simon-Morton D, Olster DH, Harris JR, Milner JA
(2008) Public health genomics: Translating obesity genomics research into
population benefits. Obesity 16 (S3) S85-94.
Alberti KG, Zimmet P, Shaw J (2007) International diabetes federation: a consensus
on type 2 diabetes prevention. Diabetic Medicine 24 451-63.
Allen MT, Stoney CM, Owens JF Matthews KA (1993) Hemodynamic adjustments
to laboratory stress: the influence of gender and personality. Psychosomatic
Medicine 55 505-17.
Alvarez C, Ramirez-Campillo R, Ramirez-Velez R, Izquierdo M (2017) Effects and
prevalence of non-responders after 12 weeks of high-intensity interval or resistance
training in adult women with insulin resistance: A randomized trial. Journal of
Applied Physiology 122 985-96.
American College of Sports Medicine (2012) ACSM’s resource manual for
guidelines for exercise testing and prescription. 7th edition. Philadelphia: Lippincott,
Williams & Williams.
Anastos K, Charney P, Charon RA, Cohen E, Jones CY, Marte C, Swiderski DM,
Wheat ME, Williams S (1991) Hypertension in women: what is really known? The
women’s caucus, working group on women’s health of the society of general internal
medicine. Annals of Internal Medicine 115 287-93.
An Overview of The Human Gene Project. https://www.genome.gov/12011238/an-
overview-of-the-human-genome-project/. Accessed 15th September 2017.
Appel LJ, Champagne CM, Harsha DW, Cooper LS, Obarzanek E, Elmer PJ,
Stevens VJ, Vollmer WM, Lin PH, Svetkey LP & Young DR (2003) Effects of
comprehensive lifestyle modification on blood pressure control. Main results of the
PREMIER clinical trial. JAMA 289 2083-93.
Arnason V (2012) The personal is political: ethics and personalized medicine.
Ethical Perspectives 19 103-22.
Astorino TA, Schubert MM (2014) Individual responses to completion of short-term
and chronic interval training: A retrospective study. PLoS One 9 e97638.
205
Atashak S, Peeri M, Jafari A, Ali Azarbayjani M (2011) Effects of ginger
supplementation and resistance training on lipid profiles and body composition in
obese men. Journal of Medicinal Plants Research 5 3827-32.
Atkinson G, Batterham A (2015) True and false interindividual differences in the
physiological response to an intervention. Experimental Physiology 100 577-88.
Atkinson G. Loenneke JP, Fahs CA, Abe T, Rossow LM (2015) Individual
differences in the exercise-mediated blood pressure response: Regression to the
mean in disguise? Clinical Physiology and Functional Imaging 35 490-2.
Atkinson G, Taylor C (2011) Normalization effect of sports training on blood
pressure in hypertensive individuals: Regression to the mean? Journal of Sports
Sciences 29 643-4.
Atlantis E, Chow CM, Kirby A, Fiatarone Singh MA (2006) Worksite intervention
effects on physical health: a randomised controlled trial. Health Promotion
International 21 191-200.
Baillot A, Mampuya WM, Dionne IJ, Corneau E, Mexiat-Burdin A, Langlois MF
(2016) Impacts of supervised exercise training in addition to interdisciplinary
lifestyle management in subjects awaiting bariatric surgery: a randomized controlled
study. Obesity Surgery 26 2602-10.
Bakker EA, Snoek JA, Meindersma EP, Hopman MTE, Bellersen L, Verbeek ALM,
Thijssen DHJ, Eijsvogels TMH (2018) Absence of fitness improvement is associated
with outcomes in heart failure patients. Medicine and Science in Sports and Exercise
50 196-203.
Balady GJ, Arena R, Sietsema K, Myers J, Coke L, Fletcher GF, Forman D, Franklin
B, Guazzi M, Gulati M, Keteyian SJ, Lavie CJ, Macko R, Mancini D, Milani RV
(2010) Clinician’s guide to cardiopulmonary exercise testing in adults. Circulation
122 191-225.
Baldwin J, Snow RJ, Febbraio MA (2000) Effect of training status and relative
exercise intensity on physiological responses in men. Medicine and Science in Sports
and Exercise 32 1648-54.
Ballor DL, Keesey RE (1991) A meta-analysis of the factors affecting exercise-
induced changes in body mass, fat mass and fat-free mass in males and females.
International Journal of Obesity 15 717-26.
Bammam MM, Hill VJ, Adams GR, Haddad F, Wetzstein CJ, Gower BA, Ahmed A,
Hunter GR (2003) Gender differences in resistance training-induced myofiber
206
hypertrophy among older adults. Journal of Gerontology: Biological Sciences 58
108-16.
Barbeau P, Gutin B, Litaker M, Owens S, Riggs S, Okuyama T (1999) Correlates of
individual differences in body-composition changes resulting from physical training
in obese children. American Journal of Clinical Nutrition 69 705-11.
Barker RJ, Schofield MR (2008) Classifying individuals as physiological responders
using hierarchical modelling. Journal of Applied Physiology 105 555–60.
Barsh GS, Farooqi IS, O'Rahilly S (2000) Genetics of body-weight regulation.
Nature 404 644-51.
Barwell ND, Malkova D, Leggate M, Gill JM (2009) Individual responsiveness to
exercise-induced fat loss is associated with change in resting substrate utilization.
Metabolism 58 1320-8.
Batterham AM, Hopkins WG (2006) Making meaningful inferences about
magnitudes. International Journal of Physiology and Performance 1 50-7.
Baumert P, Lake MJ, Stewart CE, Drust B, Erskine RM (2016) Genetic variation and
exercise-induced muscle damage: Implications for athletic performance, injury and
ageing. European Journal of Applied Physiology 116 1595-625.
Bell KJL, Irwig L, Craig JC, Macaskill P (2008) Use of randomized trials to decide
when to monitor response for a new treatment. BMJ 336 361-5.
Benetos A, Laurent S, Asmar RG, Lacolley P (1997a) Large artery stiffness in
hypertension. Journal of Hypertension 15 S89 –97.
Benetos A, Safar M, Rudnichi A, Smulyan H, Richard JL, Ducimetieere P, Guize L
(1997b) Pulse pressure: A predictor of long-term cardiovascular mortality in a
French male population. Hypertension 30 1410-5.
Bennette C, Vickers A (2012) Against quartiles: Catergorization of continuous
variables in epidemiologic research, and its discounts. BMC 12 21.
Binder EF, Yarasheski KE, Steger-May K, Sinacore DR, Brown M, Schechtman KB,
Holloszy JO (2005) Effects of resistance training on body composition in frail older
adults: results of a randomized, controlled trial. Journal of Gerentology 60 1425-31.
Bittari ST, Maeda SS, Marone MM, Santili (2016) Physical exercises with free
weights and elastic bands can improve body composition parameters in
postmenopausal women: WEB protocol with a randomized controlled
trial. Menopause 23 383-9.
207
Blaus A, Madabushi R, Pacanowski M, Rose M, Schuck RN, Stockbridge N, Temple
R, Unger EF (2015) Personalized cardiovascular medicine today. A food and drug
administration/center for drug evaluation and research perspective. Circulation 132
1425-32.
Blomqvist N, Svardsudd K (1978) A new method for investigating the relation
between change and initial value in longitudinal blood pressure data. II. comparison
with other methods. Scandinavian Journal of Social Medicine 6 125-9.
Blumenthal JA, Babyak MA, Hinderliter A, Watkins LL, Craighead L, Lin PH,
Caccia C, Johnson J, Waugh R, Sherwood A (2010) Effects of the DASH diet alone
and in combination with exercise and weight loss on blood pressure and
cardiovascular markers in men and women with high blood pressure: the ENCORE
Study. Archives of Internal Medicine 170 126-35.
Blundell JE, Stubbs RJ, Hughes DA, Whybrow S, King NA (2003) Cross talk
between physical activity and appetite control: does physical activity stimulate
appetite? Proceedings of the Nutrition Society 62 651-61.
Bonafiglia JT, Rotundo MP, Whitall JP, Scribbans TD, Graham RB, Gurd BJ (2016)
Inter-individual variability in the adaptive responses to endurance and sprint interval
training: A randomized crossover study. PLoS One 11 e0167790.
Bouchard C (1983) Human adaptability may have a genetic basis. In: Landry F, (ed).
Health and risk estimation, risk reduction and health promotion. Proceedings of the
18th annual meeting of the society of prospective medicine. Canadian Public Health
Association: Ottawa, pp.463-76.
Bouchard C (1995) Individual differences in the response to regular exercise.
International Journal of Obesity Related Metabolic Disorders 19 S4:S5-S8.
Bouchard C (2012a) Genomic predictors of trainability. Experimental Physiology 97
347-52.
Bouchard C, An P, Rice T, Skinner JS, Wilmore JH, Gagnon J, Perusse L, Leon AS,
Rao DC (1999) Familial aggregation of V̇O2max response to exercise training:
results from the HERITAGE study. Journal of Applied Physiology (1985) 7 1003-8.
Bouchard C, Antunbes-Correa LM, Ashley EA, Franklin N, Hwang PM, Mattsson
CM, Negaro CE, Phillips SA, Sarzynski MA, Wang PY, Wheeler MT (2015)
Personalised preventive medicine: genetics and the response to regular exercise in
preventive interventions. Progress in Cardiovascular Diseases 57 337-46.
208
Bouchard C, Blair CN, Church TS, Earnest CP, Hagberg JM, Hakkinen K, Jenkins
TJ, Karavirta L, Kraus WE, Leon AS, Rao DC, Sarzynski MA, Skinner JS, Slentz
CA, Rankinen T (2012b) Adverse response to regular exercise: is it a rare or
common occurrence? Plos One 7.
Bouchard C, Daw E, Rice T, Perusse L, Gagnon J, Province MA, Leon AS, Rao DC,
Skinner JS, Wilmore JH (1998) Familial resemblance for V̇O2max in the sedentary
state: the HERITAGE family study. Medicine and Science in Sports and Exercise 30
252-8.
Bouchard C, Leon AS, Rao DC, Skinner JS, Wilmore JH, Gagnon J (1995) The
HERITAGE family study: aims, design and measurement protocol. Medicine and
Science in Sports and Exercise 27 721-9.
Bouchard C, Lesange R, Lortie G, Simoneau JA, Hamel P, Boulay MR, Perusse L,
Theriault G, Leblanc C (1986) Aerobic performance in brothers, dizygotic and
monozygotic twins. Medicine and Science in Sports and Exercise 18 639-45.
Bouchard C, Rankinen T (2001) Individual differences in response to regular
physical activity. Medicine and Science in Sports and Exercise 33 S6 S452-3.
Bouchard C, Rankinen T, Chagnon YC, Rice T, Perusse L, Gagnon J, Borecki I, An
P, Leon AS, Skinner JS, Wilmore JH, Province M, Rao DC (2000) Genomic scan for
maximal oxygen uptake and its response to training in the HERITAGE family study.
Journal of Applied Physiology 88 551-9.
Bouchard C, Sarzynski MA, Rice TK, Kraus WE, Church TS, Sung YJ, Rao DC,
Rankinen T (2011) Genomic predictors of the maximal O2 uptake response to
standardized exercise training programs. Journal of Applied Physiology 110 1160-
70.
Bouchard C, Savard R, Després JP, Tremblay A, LeBlanc C (1985) Body
composition in adopted and biological siblings. Human Biology 57 61-75.
Bouchard C, Tremblay A, Despres JP, Nadeau A, Lupien PJ, Theriault G, Dussault
J, Moorjani S, Pinault S, Fournier G (1990) The response to long-term overfeeding
in identical twins. New England Journal of Medicine 322 1477-82.
Bouchard C, Tremblay A, Despres JP, Theriault G, Nadeau A, Lupien PJ, Moorjani
S, Prud’homme D, Fournier G (1994) The response to exercise with constant energy
intake in identical twins. Obesity Research 2 400-10.
Bouchard C, Wolfarth B, Rivera MA, Gagnin J, Simoneau JA (2000) Genetic
determinants of endurance performance. In: Shephard RJ, Astrand PO, editors.
209
Endurance in sport: encyclopaedia of sports medicine. Oxford: Blackwell Scientific.
pp.223-42.
Boutcher S (2011) High-intensity intermittent exercise and fat loss. Journal of
Obesity doi:10.1155/2011/868305.
Boutcher SH, Dunn SL (2009) Factors that may impede the weight loss response to
exercise-based interventions. Obesity Reviews 10 671-80.
Boutcher SH, Nugent FW (1993) Cardiac responses to trained and untrained males
to a repeated psychological stressor. Behavioural Medicine 19 21-9.
Boutcher YN, Boutcher SH (2017) Exercise intensity and hypertension: What’s
new? Journal of Human Hypertension 31 157-64.
Bruce D, Laurance I, McGuiness M, Ridley M, Goldswain P (2003) Nutritional
supplements after hip fracture: poor compliance limits effectiveness. Clinical
Nutrition 22 497-500.
Bryk AS, Raudenbush SW (1998) Heterogeneity of variance in experimental studies:
A challenge to conventional interpretations. Psychological Bulletin 104 396-404.
Byrne NM, Meerkin JD, Laukkanen R, Ross R, Fogelholm M, Hills AP (2006)
Weight loss strategies for obese adults: personalized weight management program
vs. standard care. Obesity 14 1777-88.
Buford TW, Roberts MD, Church TS (2013) Toward exercise as personalised
medicine. Sports Medicine 43 157-65.
Burl VL, Whelton P, Roccella EJ, Brown C, Cutler JA, Higgins M, Horan MJ,
Labarthe D (1995) Prevalence of hypertension in the US adult population: results
from the Third National Health and Nutrition Examination Survey. Hypertension 25
305-15.
Burtscher M, Gatterer H, Kunczicky H, Brandstatter E, Ulmer H (2009) Supervised
exercise in patients with impaiured fasting glucose: impact on exercise capacity.
Clinical Journal of Sports Medicine 19 394-8.
Cardon LR, Carmelli D, Fabsitz RR, Reed T (1994) Genetic and environmental
correlations between obesity and body fat distribution in adult male twins. Human
Biology 66 465-79.
Cardoso Jr CG, Gomides RS, Queiroz ACC, Pinto LG, da Silveira Lobo F, Tinucci
T, Mion D Jr, de Moraes Forjaz CL (2010) Acute and chronic effects of aerobic and
resistance exercise on ambulatory blood pressure. Clinics 65 317-25.
210
Carpio-Rivera E, Moncada-Jiménez J, Salazar-Rojas W, Solera-Hererra A (2016)
Acute Effects of Exercise on Blood Pressure: A Meta-Analytic
Investigation. Arquivos Brasileiros de Cardiologia 106 422–33.
Carroll D, Phillips AC, Der G (2008) Body mass index, abdominal adiposity,
obesity, and cardiovascular reactions to psychological stress in a large community
sample. Psychosomatic Medicine 70 653-60.
Carroll D, Phillips AC, Der G, Hunt K, Benzeval M (2011). Blood pressure reaction
to acute mental stress and blood pressure status: data from the 2-year follow-up of
the West of Scotland study. Psychosomatic Medicine 73 737-42.
Casperson CJ, Powell KE, Christenson GM (1985) Physical activity and physical
fitness: Definitions and distinctions for health-related research. Public Health
Reports 100 126-31.
Caudwell P, Hopkins M, King NA, Stubbs RJ, Blundell JE (2009) Exercise alone is
not enough: weight loss also needs a healthy (Mediterranean) diet? Public Health
Nutrition 12 1663-6.
Caudwell P, Gibbons C, Finlayson G, Naslund E, Blundell J (2014) Exercise and
weight loss: No sex differences in body weight response to exercise. Exercise and
Sport Sciences Reviews 42 92-101.
Caudwell P, Gibbons C, Hopkins M, King N, Finlayson G, Blundell JE (2013) No
sex difference in body fat in response to supervised and measured exercise. Medicine
and Science in Sports and Exercise 45 351-8.
Cauldfield T (2015) The obesity gene and the (misplaced) search for a personalized
approach to our weight gain problems. Wake Forest Journal 5 125-46.
Chan IS, Ginsburg GS (2011) Personalized medicine: progress and promise. Annual
Review of Genomics and Human Genetics 12 217-44.
Chen YL, Liu YF, Huang CY, Lee SD, Chan YS, Chen CC, Harris B, Kuo CH
(2010) Normalization effect of sports training on blood pressure in hypertensives.
Journal of Sports Science 28 361-7.
Chiolero A, Paradis G, Rich B, Hanley JA (2013) Assessing the relationship between
the baseline value of a continuous variable and subsequent change over time.
Frontiers in Public Health 1 1-8.
Church TS, Blair SN, Cocreham S, Johannsen N, Johnson W, Kramer K, Mikus CR,
Myers V, Nauta M, Rodarte RQ, Sparks L, Thompson A, Earnest CP (2010) Effects
211
of aerobic and resistance training on haemoglobin A1c levels in patients with type 2
diabetes: a randomized control trial. JAMA 304 2253-62.
Church TS, Earnest CP, Skinner JS, Blair SN (2007) Effects of different doses of
activity on cardiorespiratory fitness among sedentary, overweight or obese
postmenopausal women with elevated blood pressure: a randomized control trial.
JAMA 297 2081-91.
Church TS, Martin CK, Thompson AM, Earnest CP, Mikus CR, Blair SN (2009)
Changes in weight, waist circumference and compensatory responses with different
doses of exercise amongst sedentary, overweight postmenopausal women. PLos One
4 e4515. doi: 10.1371/journal.pone.0004515.
Coker RH, Williams RH, Yeo SE, Kortebein PM, Bodenner DL, Kern PA, Evans
WJ (2009) The impact of exercise training compared to caloric restriction on hepatic
and peripheral insulin resistance in obesity. Journal of Clinical Endocrinology and
Metabolism 94 4258-66.
Collins FS, McKusick VA (2001) Implications of the Human Genome Project for
medical science. JAMA 285 540-4.
Collins FS, Varmus H (2015) A new initiative on precision medicine. New England
Journal of Medicine 372 793-5.
Craft LL, Perna FM (2004) The benefits of exercise for the clinically depressed.
Primary Care Companion Journal of Clinical Psychiatry 6 104-11.
Currie KD, Floras JS, La Gerche A, Goodman JM (2018) Exercise blood pressure
guidelines: time to re-evaluate what is normal and exaggerated? Sports Medicine
doi:10.1007/s40279-018-0900-x.
Dalager T, Justesen JB, Murray M, Boyle E, Siogaard GI (2016) Implementing
intelligent physical exercise training at the workplace: health effects among office
workers – a randomized controlled trial. European Journal of Applied Physiology
116 1433-42.
Darne B, Girerd X, Safar M, Cambien F, Guize L (1989) Pulsatile versus steady
component of blood pressure: a cross-sectional analysis and a prospective analysis
on cardiovascular mortality. Hypertension 13 392– 400.
Davidsen PK, Gallagher IJ, Hartman JW, Tarnopolsky MA, Dela F, Helge JW,
Timmons JA, Phillips SM (2011) High responders to resistance training exercise
training demonstrate differential regulation of skeletal muscle mRNA expression.
Journal of Applied Physiology 110 309-17.
212
Deighton K, King JA, Stensel DJ Jones B (2017) Expanding the investigation of
meaningful effects in physiology research. Future Science Open Access 3 FS2018.
de Lorgeril M, Salen P, Martin JL, Monjaud I, Delaye J, Mamelle N (1999)
Mediterranean diet, traditional risk factors, and the rate of cardiovascular
complications after myocardial infarction: final report of the Lyon Diet Heart Study.
Circulation 99 779–85.
Deram S, Vilares SM (2009) Genetic variants influencing effectiveness of weight
loss strategies. Arquivos Brasileiros de Endocrinologia & Metabologia 53 129-38.
Despres JP, Bouchard C, Savard R, Tremblay A, Marcotte M, Theriault G (1984)
The effect of a 20-week endurance training program on adipose-tissue morphology
and lipolysis in men and women. Metabolism 33 235-9.
Despres JP, Lemieux I, Bergeron J, Pibarot P, Mathieu P, Larose E, Rodes-Cabau J,
Bertrand OF, Poirier P (2008) Abdominal obesity and the metabolic syndrome:
contribution to global cardio metabolic risk. Arteriosclerosis, Thrombosis and
Vascular Biology 28 1039-49.
Diamandis EP, Li M (2016) The side effects of translational omics: overtesting,
overdiagnosis, overtreatment. Clinical Chemistry and Laboratory Medicine 54 389-
96.
Dokken BB, Tsao TS (2007) The physiology of body weight regulation: Are we too
efficient for our own good? Diabetes Spectrum 20 166-70.
Dolzeal BA, Potteiger JA (1998) Concurrent resistance training and endurance
training influence basal metabolic rate in nondieting individuals. Journal of Applied
Physiology (1985) 85 695-700.
Donato K, Pi-Sunyer F, Becker D, NHLBI Obesity Education Initiative Expert Panel
on the Identification, Evaluation, and Treatment of Obesity in Adults (1998)
Executive summary of the clinical guidelines on the identification, evaluation and
treatment of overweight and obesity in adults. Archives of Internal Medicine 158
1855-67.
Donges CE, Duffield R (2012) Effects of resistance or aerobic exercise training on
total and regional body composition in sedentary overweight middle-aged
adults. Applied Physiology, Nutrition and Metabolism 37 499-509.
Donges CE, Duffield R, Drinkwater EJ (2010) Effects of resistance training or
aerobic training on interleukin-6, c-reactive protein, and body composition. Medicine
and Science in Sports and Exercise 42 304-13.
213
Donnelly JE, Hill JO, Jacobsen DJ, Potteiger J, Sullivan DK, Johnson SL, Heelan K,
Hise M, Fennessey PV, Sonko B, Sharp T, Jakicic JM, Blair SN, Tran ZV, Mayo M,
Gibson C, Washburn RA (2003) Effects of a 16-month randomized controlled
exercise trial on body weight and composition in young, overweight men and
women: the Midwest Exercise Trial. Archives of Internal Medicine 163 1343-50.
Donnelly JE, Honas JJ, Smith BK, Mayo MS, Gibson CA, Sullivan DK, Lee J,
Herrmann SD, Lambourne K, Washburn RA (2013) Aerobic exercise alone results in
clinically significant weight loss for men and women: Midwest Exercise Trial 2.
Obesity 21 E219-28.
Donnelly JE, Smith BK (2005) Is exercise effective for weight loss with ad libitum
diet? Energy balance, compensation, and gender differences. Exercise and Sport
Science Reviews 33 169-74.
Doucet E, Imbeault P, Alméras N, Tremblay A (1999) Physical Activity and low‐fat
diet: Is it enough to maintain weight stability in the reduced‐obese individual
following weight loss by drug therapy and energy restriction? Obesity Research 7
323-33.
Douglas JA, Deighton K, Atkinson JM, Sar-Sarraf V, Stensel DJ, Atkinson G (2016)
Acute exercise and appetite-regulating hormones in overweight and obese
individuals: A meta-analysis. Journal of Obesity 2643625
doi:10.1155/2016/2643625.
Drapeau V, King N, Hetherington M, Doucet E, Blundell J, Tremblay A (2007)
Appetite sensations and satiety quotient: predictors of energy intake and weight loss.
Appetite 48 159-66.
Dubach P, Froelicher VF, Klein J, Oakes D, Grover-McKay M, Friis R (1988)
Exercise-induced hypertension in a male population. Criteria, causes and prognosis.
Circulation 78 1380-7.
Egbewale BE (2015) Statistical issues in randomised controlled trials: a narrative
synthesis. Asian Pacific Journal of Tropical Biomedicine 5 354-9.
Ells LJ, Demaio A, Farpour-Lambert N (2018) Diet, genes, and obesity. BMJ 260
k7. doi:10.1136/bmj.k7.
Erskine RM, Jones DA, Williams AG, Stewart CE, Degens H (2010) Inter-individual
variability in the adaptation of human muscle specific tension to progressive
resistance training. European Journal of Applied Physiology 110 1117-25.
214
Fagard RH. Physical activity, physical fitness and the incidence of hypertension
(2005). Journal of Hypertension 23 265-7.
Feero WG (2017) Introducing “genomics and precision health’. JAMA 317 1842-3.
Feitosa MF, Gaskill SE, Rice T, Rankinen T, Bouchard C, Rao DC, Wilmore JH,
Skinner JS, Leon AS (2002) Major gene effects on exercise ventilatory threshold: the
HERITAGE family study. Journal of Applied Physiology (1985) 93 1000-6.
Finlayson G, Bryant E, Blundell JE, King NA (2009) Acute compensatory eating
following exercise is associated with implicit hedonic wanting for food. Physiology
and Behaviour 97 62-7.
Fisher DJ, Carpenter R, Morris TP, Freeman SC, Tierney JF (2017) Meta-analytical
methods to identify who benefits most from treatments: daft, deluded or deft
approach? BMJ 356 j573.
Fiuza-Luces C, Garatachea N, Berger NA, Lucia A (2013) Exercise is the real
polypill. Physiology 28 330-58.
Fletcher GF, Ades PA, Kligfield P, Arena R, Balady GJ, Bittner VA, Coke LA, Fleg
JL, Forman DE, Gerber TC, Gulati M, Madan K, Rhodes J, Thompson PD, Williams
MA (2012) Exercise standards for testing and training: a scientific statement from
the American Heart Association. Circulation 128 873-934.
Flores M, Glusman G, Brogaard K, Price ND, Hood L (2013) P4 medicine: how
systems medicine will transform the healthcare sector and society. Personalized
Medicine 10 565-76.
Franklin SS, Gustin W IV, Wong ND, Larson MG, Weber MA, Kannel WB, Levy D
(1997) Hemodynamic patterns of age-related changes in blood pressure: the
Framingham Heart Study. Circulation 96 308-15.
Franklin SS, Khan SA, Wong ND, Larson MG, Levy D (1999) Is pulse pressure
useful in predicting risk for coronary heart disease? The Framingham Heart Study.
Circulation 100 354 –60.
Frese EM, Fick A, Sadowsky HS (2011) Blood pressure measurement guidelines for
physical therapists. Cardiopulmonary Physical Therapy Journal 22 5-12.
Gagnon J, Province MA, Bouchard C, Leon AS, Skinner JS, Wilmore JH, Rao DC
(1996) The HERITAGE family study: quality assurance and quality control. Annals
of Epidemiology 6 520-9.
215
Gaskill SE, Rice T, Bouchard C, Gagnon J, Rao DC, Skinner JS, Wilmore JH, Leon
AS (2001) Familial resemblance in ventilatory threshold: the HERITAGE family
study. Medicine and Science in Sports and Exercise 233 1832-40.
Gayagay G, Yu B, Hambly B, Boston T, Hahn A, Celermajer DS, Trent RJ (1998)
Elite endurance athletes and the ACE I allele-the role of genes in athletic
performance. Human Genetics 103 48-50.
Ghosh S, Vivar JC, Sarzynski MA, Sung YJ, Timmons JA, Bouchard C, Rankinen T
(2013) Integrative pathway analysis of a genome-wide association study of V̇O2max
response to exercise training. Journal of Applied Physiology (1985) 115 1343-59.
Glowacki SP, Martin SE, Maurer A, Baek W, Green JS, Crouse SF (2004) Effects of
resistance, endurance, and concurrent exercise on training outcomes in men.
Medicine and Science in Sports and Exercise 36 2119-27.
Gobel FL, Nordstrom LA, Nelson RR, Jorgensen CR, Wang Y (1978) The rate-
pressure product as an index of myocardial oxygen consumption during exercise in
patients with angina pectoris. Circulation 57 549-56.
Goltz FR, Thackray AE, King JA, Dorling JL, Atkinson G, Stensel DJ (2018)
Interindividual responses of appetite to acute exercise: a replicated crossover study.
Medicine and Science in Sports and Exercise 50 758-68.
Goran MI, Poehlman ET (1992) Endurance training does not enhance total energy
expenditure in healthy elderly persons. American Journal of Physiology-
Endocrinology and Metabolism 263 E950-7.
Gurd BJ, Giles MD, Bonafiglia JT, Raleigh JP, Boyd JC, Ma JK, Zelt JG, Scibbans
TD (2016) Incidence of nonresponse and individual patterns of response following
sprint interval training. Journal of Applied Nutrition and Metabolism 41 229-34.
Guyatt GH, Heyting A, Jaeschke R, Keller J, Adachi JD, Roberts RS (1990) N–of-1
randomized trials for investigating new drugs. Controlled Clinical Trials 11 88-100.
Hagberg JM, Ferrell RE, Dengel DR, Wilund KR (1999) Exercise training-induced
blood pressure and plasma lipid improvements in hypertensives may be genotype
dependent. Hypertension 34 18-23.
Hagobian TA, Braun B. Physical activity and hormonal regulation of appetite: Sex
differences and weight control. Exercise and Sport Sciences Reviews 38 25-30.
Hagobian TA, Sharoff CG, Stephens BR, Wade GN, Silva JE, Chipkin SR, Braun B
(2009) Effects of exercise on energy-regulating hormones and appetite in men and
216
women. American Journal of Physiology – Regulatory, Integrative and Comparative
Physiology 296 R233-42.
Hall KD, Sacks G, Chandramohan D, Chow CC, Wang YC, Gortmaker SL,
Swinburn BA (2011) Quantification of the effect of energy imbalance on
bodyweight. The Lancet 378 826-37.
Hamburg MA, Collins GS (2010) The path to personalized medicine. New England
Journal of Medicine 353 301-4.
Hamel P, Simoneau J, Lortie G, Boulay MR, Bouchard C (1986) Heredity and
muscle adaptation to endurance training. Medicine and Science in Sports and
Exercise 18 690-6.
Hamer M, Taylor A, Steptoe A (2006) The effect of acute aerobic exercise on stress
related blood pressure responses: a systematic review and meta-analysis. Biological
Psychology 71 183-90.
Harrell F (2018) Viewpoints on heterogeneity of treatment effect and precision
medicine. http://www.fharrell.com/post/hteview/#fn:Under-the-best-o. Accessed 7th
June 2018.
Hautala AJ, Makikallio TH, Kiviniemi A, Laukkanen RT, Nissila S, Huikuir HV,
Tulppo MP (2003) Cardiovascular autonomic function correlates with the response
to aerobic training in healthy subjects. American Journal of Physiology. Heart and
Circulatory Physiology 285 1747-52.
Hautala AJ, Kiviniemi AM, Makikallio TH, Kinnunen H, Nissila S, Huikuri HV,
Tulppo MP (2006) Individual differences in the responses to endurance and
resistance training. European Journal of Applied Physiology 96 535-42.
Hecksteden A, Krauscher J, Scharhag - Rosenberger F, Theisen D, Senn S, Meyer T
(2015) Individual response to exercise training – a statistical perspective. Journal of
Applied Physiology (1985) 118 1450-9.
Hecksteden A, Pitsch W, Rosenberger F, Meyer T (2018) Repeated testing for the
assessment of individual response to exercise training. Journal of Applied
Physiology 124 1567-79.
Heini AF, Kirk KA, Lara‐Castro C, Weinsier RL (1998) Relationship between
hunger‐satiety feelings and various metabolic parameters in women with obesity
during controlled weight loss. Obesity Research 6 225-30.
217
Heller DA, De Faire U, Pederson NL, Dahlen G, McLearn GE (1993) Genetic and
environmental influences on serum lipid levels in twins. New England Journal of
Medicine 328 1150-6.
Henry JB, Miller MC, Kelly KC, Champney D (2002) Mean arterial pressure
(MAP): an alternative and preferable measurement to systolic blood pressure (SBP)
in patients for hypotension detection during hemapheresis. Journal of Clinical
Apheresis 17 55-64.
Herring LY, Wagstaff C, Scott A (2014) The efficacy of 12 weeks supervised
exercise in obesity management. Clinical Obesity 4 220-7.
Higgins JPT (2008) Commentary: heterogeneity in meta-analysis should be expected
and appropriately quantified. International Journal of Epidemiology 37 1158-60.
Higgins JPT, Green S (eds) (2011) Cochrane Handbook for Systematic Reviews of
Interventions Version 5.1.0 [updated March 2011]. The Cochrane Collaboration.
Available from http://handbook.cochrane.org.
Higgins JPT, Thompson SG, Spiegelhalter DJ (2009) A re-evaluation of random-
effects meta-analysis. Journal of the Royal Statistical Society. Series A (Statistics in
Society) 172 137–59.
Hill JO, Melanson EL (1999) Overview of the determinants of overweight and
obesity: Current evidence and research issues. Medicine and Science in Sports and
Exercise 311 S515-21.
Hinney A, Vogel CI, Hebebrand J (2010) From monogenic to polygenic obesity:
recent advances. European Child and Adolescent Psychiatry 19 297-310.
Hoffman J, Rataess N, Kang J, Mangine G, Faigenbaum A, Stout J (2006) Effects of
creatine and B-alanine supplementation on performance and endocrine responses in
strength/power athletes. International Journal of Sport Nutrition and Exercise
Metabolism 16 430-46.
Hong Y, Pederson NL, Brismar K, de Faire U (1997) Genetic and environmental
architecture of the features of the insulin-resistance syndrome. American Journal of
Human Genetics 60 143-52.
Hood L, Lovejoy JC, Price ND (2015) Integrating big data and actionable health
coaching to optimize wellness. BMC Medical 13 4.
Hopkins M, Blundell J, Halford J, King N, Finlayson G (2016) The regulation of
food intake in humans. In: De Groot LJ, Chrousos G, Dungan K, et al., editors.
218
Endotext [Internet]. South Dartmouth (MA): MDText.com, Inc.; 2000-. Available
from: https://www.ncbi.nlm.nih.gov/books/NBK278931/
Hopkins M, Blundell J, King NA (2014) Individual variability in compensatory
eating following acute exercise in overweight and obese women. British Journal of
Sports Medicine 48 1472-6.
Hopkins W (2000) Precision of the estimate of a subject’s true value (Excel
spreadsheet). In: A new view of statistics.
Hopkins W (2004) How to interpret changes in an athletic performance test.
Sportsci.org 8 1-7.
Hopkins W (2015) Individual responses made easy. Journal of Applied Physiology
(1985) 118 1444-6.
Hopkins W, Batterham AM (2018) The vindication of magnitude-based inference.
22 Sportsci.org 19-29.
Hopkins WG, Marshall SW, Batterham AM, Hanin J (2009) Progressive statistics
for studies in sports medicine and exercise science. Medicine and Science in Sports
and Exercise 41 3-12.
Huang CJ, Webb HE, Zourdos MC, Acevedo EO (2013) Cardiovascular reactivity,
stress and physical activity. Frontiers in Physiology 4:314.
Huang Z, Willett WC, Manson JE, Rosner B, Stampfer MJ, Speizer FE, Colditz GA
(1998) Body weight, weight change, and risk for hypertension in women. Annals of
Internal Medicine 128 81-8.
Hubal MJ, Gordish-Dressman H, Thompson PD, Price TB, Hoffman EP,
Angelopoulous TJ, Gordon PM, Moyna NM, Pescatello LS, Visch PS, Zoeller RF,
Seip RL, Clarkson PM (2005) Variability in muscle size and strength gain after
unilateral resistance training. Medicine and Science in Sports and Exercise 37 964-
72.
Imboden MT, Harber MP, Whaley MH, Finch WH, Bishop DL, Kaminslky LA
(2018) Cardiorespiratory fitness and mortality in healthy men and women. Journal
of the American College of Cardiology 72 2283-92.
IntHout J, Ioannidis JP, Rovers MM, Goeman JJ (2016) Plea for routinely presenting
prediction intervals in meta-analysis. BMJ Open 6 e010247.
Jae SY, Fernhall B, Heffernan KS, Kang M, Lee MK, Choi YH, Hong KP, Ahn ES,
Park WH (2006) Exaggerated blood pressure response to exercise is associated with
carotid atherosclerosis in apparently healthy men. Journal of Hypertension 24 881-7.
219
Jae SY, Franklin BA, Choo J, Choi YH, Fernhall B (2015) Exaggerated exercise
blood pressure response during treadmill testing as a predictor of future hypertension
in men: a longitudinal study. American Journal of Hypertension 28 1362-7.
Jameson JL, Longo DL (2015) Precision medicine – personalized, problematic, and
promising. New England Journal of Medicine 70 612-4.
Janssens ACJW, Gwinn M, Bradley LA, Oostra BA, van Dujin CM, Khoury MJ
(2008) A critical appraisal of the scientific basis of commercial genomic profiles.
American Journal of Human Genetics 82 593-9.
Jaquet F, Goldstein IB, Shapiro D (1998) Effects of age and gender on ambulatory
blood pressure and heart rate. Journal of Human Hypertension 12 253-7.
Jensen MD, Ryan DH, Apovian CM, Ard JD, Commuzie AG, Donato KA, Hu FB,
Hubbard VS, Jakicic JM, Kushner RF, Loria CM, Millen BE, Nonas CA, Pi-Sunyer
FX, Stevens J, Stevens VJ, Wadden TA, Wolfe BM, Yanovski SZ, Jordan HS,
Kendall KA, Lux LJ, Mentor-Marcel R, Morgan LC, Trisolini MG, Wnek J,
Anderson JL, Halperin JL, Albert NM, Bozkurt B, Brindis RG, Curtis LH, DeMets
D, Hochman JS, Kovacs RJ, Ohman EM, Pressler SJ, Selke FW, Shen WK, Smith
SC Jr, Tomaselli GF (2014) 2013 AHA/ACC/TOS guideline for the management of
overweight and obesity in adults. A report of the American Cardiology/American
Heart Association task force on practice guidelines and the Obesity Society.
Circulation 129 S2 S102-38.
Jette M, Sidney K, Blumchen G (1990) Metabolic equivalents (METS) in exercise
testing, exercise prescription, and evaluation of functional capacity. Clinical
Cardiology 13 555-65.
Jequier E, Teppy L (1999) Regulation of body weight in humans. Physiology
Reviews 79 451-80.
Joint National Committee on the Detection, Evaluation, and Treatment of High
Blood Pressure (1997) The sixth report of the Joint National Committee on
prevention, detection, evaluation, and treatment of high blood pressure. Archives of
Internal Medicine 157 2413–46.
Jones H, Atkinson G, Leary A, George K, Murphy M, Waterhouse J (2006)
Reactivity of ambulatory blood pressure to physical activity varies with time of day.
Hypertension 47:778-84.
220
Jones H, George K, Edwards B, Atkinson G (2007) Is the magnitude of acute post-
exercise hypotension mediated by exercise intensity or total work done? European
Journal of Applied Physiology 102 33-40.
Jones H, Pritchard C, George K, Edwards B, Atkinson G (2008) The acute post-
exercise response of blood pressure varies with time of day. European Journal of
Applied Physiology 104 481-9.
Jones H, Taylor CE, Lewis NC, George K, Atkinson G (2009) Post-exercise blood
pressure reduction is greater following intermittent than continuous exercise and is
influenced less by diurnal variation. Chronobiology International 26 293-306.
Joyner MJ (2016) Precision medicine, cardiovascular disease and hunting elephants.
Progress in Cardiovascular Disease 6 651-60.
Joyner MJ, Paneth N (2015) Seven questions for personalized medicine. JAMA 314
999-1000.
Kainulainen H (2009) Run more, perform better – old truth revisited. Journal of
Applied Physiology (1985) 106 1477-8.
Karanja NM, Obarzanek E, Lin PH, McCullough ML, Phillips KM, Swain JF,
Champagne CM, Hoben MP (1999) Descriptive characteristics of the dietary
patterns used in the Dietary Approaches to Stop Hypertension trial. Journal of the
American Dietetic Association 99 S19-27.
Karavirta L, Hakkinen K, Kauhanen A, Arija-Blazquez A, Sillanpaa E, Rinkinen N,
Hakkinen A (2011) Individual responses to combined endurance and strength
training in older adults. Medicine and Science in Sports and Exercise 43 484-90.
Katsanis SH, Javitt G, Hudson K (2008) A case study of personalized medicine.
Science 320: 53-54.
Kaufman MP, Forster HV (1996) In: Handbook of Physiology. Exercise: Regulation
and Integration of Multiple Systems. Eds Rowell Shepherd.
Keating SE, Johnson NA, Mielke GI, Coombes JS (2017) A systematic review and
meta-analysis of interval training versus moderate-intensity continuous training on
body adiposity. Obeitys Reviews 18 943-64.
Kelley GA, Kelley KS (2008) Efficacy of aerobic exercise on coronary heart disease
risk factors. Preventative Cardiology 11 71-5.
Keogh B (2012) Era of personalized medicine may herald end of soaring cancer
costs. Journal of the National Cancer Institute 104 12-17.
221
Kerksick CM, Wismann-Bunn J, Fogt D, Thomas AR, Taylor L, Campbell BI,
Wolborn CD, Harvey T, Toberts MD, La Bounty P, Galbreath M, Marcello B,
Rasmussen CJ, Kreider RB (2010) Changes in weight loss, body composition and
cardiovascular disease risk after altering macronutrient distributions during a regular
exercise program in obese women. Nutrition Journal 9 59.
Khoury MJ, Galea S (2016) Will precision medicine improve population health?
JAMA 316 1357-8.
Kim YS, Nam JS, Yeo DW, Kim KR, Suh SH, Ahn CW (2015) The effects of
aerobic exercise training on serum osteocalcin, adipocytokines and insulin resistance
on obese young males. Clinical Endocrinology 82 686-94.
King N, Byrne NM, Hunt A, Hills A (2010) Comparing exercise prescribed with
exercise completed: Effects of gender and mode of exercise. Journal of Sports
Sciences 28 633-40.
King NA, Caudwell P, Hopkins M, Byrne NM, Colley R, Hills AP, Stubbs JR,
Blundell JE (2007a) Metabolic and behavioural compensatory responses to exercise
interventions: barriers to weight loss. Obesity 15 1373-83.
King NA, Hester J, Gately PJ (2007b) The effect of a medium-term activity-and diet-
induced energy deficit on subjective appetite sensations in obese children.
International Journal of Obesity 31 334-9.
King NA, Hopkins M, Caudwell P, Stubbs RJ, Blundell JE (2008) Individual
variability following 12 weeks of supervised exercise: identification and
characterization of compensation for exercise-induced weight loss. International
Journal of Obesity 32 177-84.
King NA, Hopkins M, Caudwell P, Stubbs RJ, Blundell JE (2009) Beneficial effects
of exercise: shifting the focus from body weight to other markers of health. British
Journal of Sports Medicine 43 924-7.
King NA, Horner K, Hills AP, Byrne NM, Wood RE, Bryant E, Caudwell P,
Finlayson G, Gibbons C, Hopkins M, Martins C, Blundell JE (2012) Exercise,
appetite and weight management: understanding the compensatory responses in
eating behaviour and how the contribute to variability in exercise-induced weight
loss. British Journal of Sports Medicine 46 315-22.
Kittles R (2012) Genes and environments: moving towards personalized medicine in
the context of health disparities. Ethnicity and Disease 22 (3S1):S1 43-6.
222
Kodama S, Saito K, Tanaka S, Maki M, Yachi Y, Asumi M, Sugawara A, Totsuka
K, Shimano H, Ohashi Y, Yamada N, Sone H (2009) Cardiorespiratory fitness as a
quantitative predictor of all-cause mortality and cardiovascular events in healthy men
and women: A meta-analysis. JAMA 301 2024-35.
Kohrt WM, Malley MT, Coggan AR, Spina RJ, Ogawa T, Ehsani AA, Bourey RE,
Martin WH, Holloszy JO (1991) Effects of gender, age, and fitness level on response
of V̇O2max to training in 60-71 yr-olds. Journal of Applied Physiology (1985) 71
2004-11.
Kovolou GD, Kovolou V, Papadopoulou A, Watts GF (2016) MTP gene variants
and response to lomitapide in patients with homozygous familial
hypercholesterolemia. Journal of Atherosclerosis and Thrombosis 23 878-83.
Lambiase MJ, Dorn J, Roemmich JN (2013) Systolic blood pressure reactivity
during submaximal exercise and acute psychological stress in youth. American
Journal of Hypertension 26 409-15.
Laukkanen JA, Kurl S, Salonen R, Rauramaa R, Salonen JT (2004) The predictive
value of cardiorespiratory fitness for cardiovascular events in men with various risk
profiles: a prospective, population-based cohort study. European Heart Journal 5
1428-37.
Laukkanen JA, Zaccardi F, Khan H, Kurl S, Jae YJ, Rauramaa R (2016) Long-term
change in cardiorespiratory fitness and all-cause mortality: a population-based study.
Mayo Clinic Proceedings 91 1183-8.
Le VV, Mitiku T, Sungar G, Myers J, Froelicher V (2008) The blood pressure
response to dynamic exercise testing. Progress in Cardiovascular Diseases 51 135-
60.
Leifer ES, Church TS, Earnest CP, Fleg JL, Hakkinen K, Karavirta L, Kraus WE,
Mikus CR, Resnick B (2015) Adverse cardiovascular response to aerobic exercise
training: is this a concern? Medicine and Science in Sports and Exercise 48 20-5.
Lesage RJA, Simoneau J, Jobin J, Leblanc J, Bouchard C (1985) Familial
resemblance in maximal heart rate, blood lactate and aerobic power. Human
Heredity 35 182-9.
Libardi CA, De Souza GV, Cavaglieri CR, Madruga VA, Chacon-Mikahil MP
(2012) Effect of resistance, endurance, and concurrent training on TNF-a, IL-6, and
CRP. Medicine and Science in Sport and Exercise 44 50-6.
223
Liberati A, Altman DG, Tetzlaff J, Mulrow C, Gotzsche PC, Ioannidis JPA, Clarke
M, Devereaux PJ, Kleijnen J, Moher D (2009) The PRISMA statement for reporting
systematic reviews and meta-analyses of studies that evaluate healthcare
interventions: explanation and elaboration. BMJ 339: b2700.
Lillie EO, Patay B, Diamant J, Issell B, Topol EJ, Schork NJ (2011) The n-of-1
clinical trial: the ultimate strategy for individualizing medicine? Personalized
Medicine 8 161-73.
Lim SS, Vos T, Flaxman AD, Danaei G, Shibuya K, Adair-Rohani H, Al Mozroa
MA, Amann M, Anderson HR, Andrews KG, Aryee M, Atkinson C, Bacchus LJ,
Bahalim AN, Balakrishnan K, Balmes J, Barker-Collo S, Baxter A (2012) A
Comparative Risk Assessment of Burden of Disease and Injury Attributable to 67
Risk Factors and Risk Factor Clusters in 21 Regions, 1990-2010: A Systematic
Analysis for the Global Burden of Disease Study 2010. Lancet 380 2224-60.
Lima AH, Miranda AS, Correia MA, Soares AH, Cucato GG, Sobral Filho DC,
Gomes SL, Ritti-Dias RM (2015) Individual blood pressure responses to walking
and resistance exercise in peripheral artery disease patients: Are the mean values
describing what is happening? Journal of Vascular Nurs 33 150-6.
Lloyd Jones DM, Levy D (2007) In: Epidemiology of Hypertension. Hypertension –
A Companion to Braunwald’s Heart Disease. Eds Black Elliott.
Loenneke JP, Fahs CA, Abe T, Roscow LM, Ozaki H, Pujol TJ, Bemben MG (2014)
Hypertension risk: exercise is medicine* for most but not all. Clinical Physiology
and Functional Imaging 34 77-81.
Lockwood CM, Moon JR, Tobkin SE, Walter AA, Smith AE, Dalbo VJ, Cramer JT,
Stout JR (2008) Minimal nutrition intervention with high-protein/low-carbohydrate
and low fat, nutrient-dense food supplement improves body composition and
exercise benefits in overweight adults: a randomized controlled trial. Nutrition and
Metabolism 5 doi: 10.1186/1743-7075-5-11.
Loos RJ (2012) Genetic determinants of common obesity and their value in
prediction. Best Practice and Research Clinical Endocrinology and Metabolism 26
211-26.
Lortie G, Simoneau JA, Hamel P, Boulay MR, Landry F, Bouchard C (1984)
Responses of maximal aerobic power and capacity to aerobic training. International
Journal of Sports Medicine 5 232-6.
224
Lucia A, Gomez-Gallego F, Barroso I, Rabadan M, Bandres F, San Juan AF,
Chicharro JL, Ekelund U, Brage S, Earnest CP, Wareham NJ, Franks PW (2005)
PPARGC1A genotype (Gly482Ser) predicts exceptional endurance capacity in
European men. Journal of Applied Physiology 99 344-8.
Macdiarmid JI, Cade JE, Blundell JE (1996). High and low-fat consumers, their
macronutrient intake and body mass index: further analysis of the National Diet and
Nutrition Survey of British Adults. European Journal of Clinical Nutrition 50 505-
12.
MacDonald JR (2002) Potential causes, mechanisms, and implications of post
exercise hypotension. Journal of Human Hypertension 16 225-36.
Maes HHM, Neale MC, Eaves LJ (1997) Genetic and environmental factors in
relative body weight and human adiposity. Behaviour Genetics 27 325-51.
Maiorana A, O'Driscoll G. Dembo L, Goodman C, Taylor R, Green D (2001)
Exercise training, vascular function, and functional capacity in middle-aged
subjects. Medicine and Science in Sports and Exercise 33 2022-8.
Mann TN, Lamberts RP, Lambert MI (2014) High responders and low responders:
factors associated with individual variation in response to standardized training.
Sports Medicine 44 1113-24.
Manninen V, Elo MO, Frick MH, Haapa K, Heinonen OP, Heinsalmi P, Helo P,
Huttunen JK, Kaitaniemi P, Koskinen P, Maenpaa H, Malkonen M, Manttari M,
Norola S, Pasterneck A, Pikkarainen J, Romo M, Sjoblom T, Nikkila EA (1988)
Lipid alterations and decline in the incidence of coronary heart disease in the
Helsinki Heart Study. JAMA 260 641-51.
Manrai AK, Patel CJ, Ioannidis JP (2018) In the era of precision medicine and big
data, who is normal? JAMA 319 1981-2.
Marcon AR, Bieber M, Caulfield T (2018) Representing a “revolution”: how the
popular press has portrayed personalized medicine. Genetics in Medicine
doi:10.1038/gim.2017.217
Marti A, Moreno-Aliaga MJ, Hebebrand J, et al (2004) Genes, lifestyles and obesity.
International Journal of Obesity 28 S29-S36.
Martinez JA (2000) Body weight regulation: Causes of obesity. Proceedings of the
Nutrition Society 59 337-45.
Martinez JA, Frühbeck G (1996) Regulation of energy balance and adiposity: a
model with new approaches. Revista Espanola de Fisiologia 52 255-58.
225
Matthew CE, Pate RR, Jackson KL, Ward DS, Macera CA, Kohl HW, Blair SN
(1998) Exaggerated blood pressure response to dynamic exercise and risk of future
hypertension. Journal of Clinical Epidemiology 51 29-35.
Mauri L, Kereikakes DJ, Yeh RW, Driscoll-Shempp P, Cutlip DE, Steg PG,
Normand SLT, Braunwald E, Wiviott SD, Cohen DJ, Holmes DR Jr, Krukoff MW,
Hermiller J, Dauerman HL, Simon DI, Kandzari DE, Garratt KN, Lee DP, Pow TK,
Ver Lee P, Rinaldi MJ, Massaro JM (2014) Twelve or 30 months of dual antiplatelet
therapy after drug-eluting stents. New England Journal of Medicine 371 2155-66.
McCartney M (2017) Are we too captivated by precision medicine? BMJ 356 j1168.
doi: 10.1136/bmj.j1168.
McGuire HL, SvetkeyLP, Harsha DW, Elmer PJ, Appel LJ, Ard JD (2004)
Comprehensive lifestyle modification and blood pressure control: A review of the
PREMIER trial. Journal of Clinical Hypertension 6 383-90.
McGlory C, Phillips SM (2015) Exercise and the regulation of skeletal muscle
hypertrophy. Progress in Molecular Biology and Translational Science 135 153-73.
McTiernan A, Sorensen B, Irwin ML, Morgan A, Yasui Y, Rudoplh RE, Surawicz
C, Lampe PD, Ayub K, Potter JD (2007) Exercise effect on weight and body fat in
men and women. Obesity 15: 1496-512.
Melanson EL, Keadle SK, Donnelly JE, Braun B, King NA (2013) Resistance to
exercise-induced weight loss: compensatory behavioural adaptations. Medicine and
Science in Sports and Exercise 45 1600-9.
Mitchell CJ, Churchward-Venne TA, Bellamy L, Parise G, Baker SK, Phillips SM
(2013) Muscular and systemic correlates of resistance training-induced muscle
hypertrophy. 2013. PLos One 8;e78636.
Miyamoto-Mikami E, Zempo H, Fuku N Kikuchi M, Murakami H (2018)
Heritability estimates of endurance related phenotypes: A systematic review and
meta-analysis. Scandinavian Journal of Medicine in Science and Sports 28 834-45.
Mokdad AH, Ford ES, Bowman BA (2003) Prevalence of obesity, diabetes and
obesity-related health risk factors, 2001. JAMA 289 76-9.
Montalvo AM, Tse-Dinh YC, Liu Y, Swartzon M, Hechtman KS, Myer G (2017)
Precision sports medicine: The future of advancing health and performance in youth
and beyond. Strength and Conditioning Journal 39 48-58.
226
Montero D, Ludby C (2017) Refuting the myth of non-response to exercise training:
‘non-responders’ do respond to higher dose of training. Journal of Physiology 595
3377-87.
Montoye HJ, Gayle R (1978) Familial relationships in maximal oxygen uptake.
Human Biology 50 241-9.
Mori M, Higuchi K, Sakurai A, Tabara Y, Miki T, Nose H (2009) Genetic basis of
inter-individual variability in the effects of exercise on the alleviation of lifestyle-
related diseases. Journal of Physiology 587 5577-84.
Myers CA, Johnson WD, Earnest CP, Rood JC, Tudoir-Locke C, Johannsen NM,
Harris M, Church TS, Martin CK (2014) Examination of mechanisms (E-
MECHANIC) of exercise-induced weight compensation: study protocol for a
randomized control trial. Trials 15 212.
Myers J, Prakash M, Froelicher V, Do D, Partington S, Atwood JE (2002) Exercise
capacity and mortality among men referred for exercise testing. New England
Journal of Medicine 346 793-801.
Nalbant Ö, Toktas N, Toraman NF, Öğüs C, Aydin H, Kacar C, Ozkaya YG (2009)
Vitamin E and aerobic exercise: effects on physical performance in older
adults. Aging Clinical and Experimental Research 21 111-21.
National Health England. Precision medicine: What is it and how will it be
achieved? (2015) www.genomicseducation.hee.nhs.uk/news/item/138-precision-
medicine-what-is-it-and-how-will-it-be-achieved. Accessed 29th September 2017.
National Institute of Health. All of Us Research Program (2015)
https://www.nih.gov/research-training/allofus-research-program. Accessed 20th
September 2017.
National Research Council (US) Committee on A Framework for Developing a New
Taxonomy of Disease. Toward Precision Medicine: Building a Knowledge Network
for Biomedical Research and a New Taxonomy of Disease. Washington (DC):
National Academies Press (US); 2011. Appendix E, Glossary.
Norbury A, Seymour B (2018) Response heterogeneity: Challenges for personalized
medicine and big data approaches in psychiatry and chronic pain. F1000 Research 7
55.
Obarzanek E, Stacks FM, Vollmer WM, Bray GA, Miller EM, Lin PH, Karanja NM,
Most-Windhauser MM, Moore TJ, Swain JF, Bales CW, Proschan MA (2001)
227
Effects on blood lipids of a blood-pressure lowering diet: The Dietary Approaches to
Stop Hypertension (DASH) trial. American Journal of Clinical Nutrition 74 80-9.
O’Brien E, Asmar R, Beilin L, Imai Y, Mancia G, Mengden T, Myers M, Padfield P,
Palatini P, Parati G, Pickering T, Redon J, Staessen J, Stergiou G, Verdecchia P
(2005) Practical guidelines for the European Society of hypertension for clinic,
ambulatory and self-blood pressure measurement. Journal of Hypertension 23 697-
701.
O’Neal WT, Qureshi WT, Blaha MJ, Keteyian SJ, Brawner CA, Al-Mallah MH
(2015) Systolic blood pressure response during exercise stress testing: The Henry
Ford Exercise Testing (FIT) Project. JAHA 7 pii: e002050. doi:
10.1161/JAHA.115.002050.
O’Rourke MF (1982) Arterial Function in Health and Disease. Edinburgh, UK:
Churchill-Livingstone.
Palatini P (1988) Blood pressure behavior during physical activity. Sports Medicine
5 353-74.
Pandey A, Ayers C, Blair SN, Swift DL, Earnest CP, Kitzman DW, Khera A,
Church TS, Berry JD (2015) Cardiac determinants of heterogeneity in fitness change
in response to moderate intensity aerobic exercise training. Journal of the American
College of Cardiology 65 1057-8.
Partlett C, Riley RD (2017) Random effects meta-analysis: Coverage performance of
95% confidence and prediction intervals following REML estimation. Statistics in
Medicine 36 301-17.
Pencina MJ, Peterson ED (2016) Moving from clinical trials to precision medicine.
The role of predictive modelling. JAMA 315 1713-4.
Perusse L, Gagnon J, Province MA, Rao DC, Wilmore HG, Leon AS, Bouchard C,
Skinner JS (2001) Familial aggregation of submaximal aerobic performance in the
HERITAGE family study. Medicine and Science in Sports and Exercise 33 597-604.
Pescatello LS, Guidry MA, Blanchard BE, Kerr A, Taylor AL, Johnson AN, Maresh
CM, Rodriquez N, Thompson PD (2004a) Exercise intensity alters postexercise
hypotension. Journal of Hypertension 22 1881-8.
Pescatello LS, Franklin BA, Fagard R, Farquhar WB, Kelley GA, Ray CA (2004b)
Exercise and hypertension. Medicine & Science in Sports & Exercise 36 533-53.
228
Pescatello LS (2014) American College of Sports Medicine. Guidelines for Exercise
Testing and Prescription. 9th edn. Philadelphia, PA: Wouters Kluwer/Lippincott
Williamson & Wilkins Health.
Peterson JA (2007) Get moving! Physical activity counseling in primary care.
Journal of the American Academy of Nurse Practitioners 19 349-57.
Petkova E, Tarpey T, Huang L, Deng L (2013) Interpreting meta-regression:
application to recent controversies in antidepressants’ efficacy. Statistics in Medicine
32 2875-92.
Phillips BE, Kelly BM, Lilja M, Ponce-Gonzalez JG, Brogan RJ, Morris DL,
Gustafsson T, Kraus WE, Atherton PJ, Vollaard NBJ, Rooyackers O, Timmons JA
(2017) A practical and time-efficient high-intensity interval training program
modifies cardio-metabolic risk factors in adults with risk factors for type II diabetes.
Frontiers in Endocrinology 8 doi:10.83389/fendo.2017.00229.
Phillips BE, Williams JP, Gustafsson T, Bouchard C, Rankinen T, Knudsen S, Smith
K, Timmons JA, Atherton PJ (2013) Molecular networks of human muscle
adaptation to exercise and age. PLos Genetics e1003389.
Pickering C, Kiely J (2017) Can the ability to adapt to exercise be considered a talent
– and if so, can we test for it? Sports Medicine Open 3 43.
Pletcher MJ, McCulloch CE (2017) The challenges of generating evidence to support
precision medicine. JAMA 177 561-2.
Plowman SA, Smith DL (2007) Exercise Physiology for Health, Fitness and
Performance. Lipincott, Williams & Williams.
Poehlman ET, Tremblay A, Despres JP, Fontaine E, Perusse L, Theriault G,
Bouchard C (1986) Genotype-controlled changes in body composition and fat
morphology following overfeeding in twins. American Journal of Clinical Nutrition
43 723-31.
Poirier P, Giles TD, Bray GA, Hong Y, Stern JS, Pi-Sunyer FX, Eckel RH (2006)
Obesity and cardiovascular disease: pathophysiology, evaluation, and effect of
weight loss. Circulation 113 898-918.
Potteiger JA, Jacobsen DJ, Donnelly JE, Hill JO (2003) Glucose and insulin
responses following 16 months of exercise training in overweight adults: the
Midwest Exercise Trial. Metabolism 52 1175-81.
229
Prabhakaran B, Dowling EA, Branch JD, Swain DP, Leuthotz BC (1999) Effect of
14 weeks of resistance training on lipid profile and body fat percentage in
premenopausal women. British Journal of Sports Medicine 33 190-5.
Prasad V (2016) Perspective: the precision-oncology illusion. Nature 537 S63.
Precision Medicine Initiative Working Group. Report to the advisory committee to
the director: the precision medicine initiative cohort program-building a research
foundation for 21st century medicine. Washington DC. National Institutes of Health,
2015.
Prud’Homme D, Bouchard C, LeBlanc C, Landry F, Fontaine E (1984) Sensitivity of
maximal aerobic power to training is genotype-dependent. Medicine and Science in
Sports and Exercise 16 89-93.
Ramirez J, van Duijvenboden S, Ntalla I, Mifsud B, Warren HR, Tzanis E, Orini M,
Tinker A, Lambiase PD, Munroe PB (2018) Thirty loci identified for heart rate
response to exercise and recovery implicate autonomic nervous system. Nature 9
1947.
Rankinen T, Argyropoulos G, Rice T, Rao DC, Bouchard C (2010) CREB1 is a
strong genetic predictor of the variation in exercise heart rate response to regular
exercise: the HERITAGE family study. Circulation. Cardiovascular Genetics 3 294-
9.
Rasool M, Malik A, Naseer MI, Manan A, Ahmed Ansari S, Begum I, Qazi MH,
Pushparaj PN, Abuzenadah AM, Al-Qahtani MH, Kamal MA, Pushparaj PN, Gan
SH (2015) The role of epigenetics in personalized medicine: challenges and
opportunities. BMC Medical Genomics 8 (S1) S5.
Raue U, Trappe Ta, Estrem ST, Qian HR, Helvering LM, Smith RC, Trappe S
(2012) Transcriptome signature of resistance exercise adaptations: mixed muscle and
fiber type specific profiles in young and old adults. Journal of Applied Physiology
(1985) 112 1625-36.
Reckelhoff J (2001) Gender differences in the regulation of blood pressure.
Hypertension 37 1199-1208.
Resende CM, Durso DF, Borges KB, Pereira RM, Rodrirues GKD, Silva JLP,
Rodrigues EC, Franco GR, Alvarez-Leite JI (2018) The polymorphism rs17782313
near MC4R gene is related with anthropometric changes in women submitted to
bariatric surgery over 60 months. Clinical Nutrition 37 1286-92.
230
Robergs RA, Dwyer D, Astorino, T (2010) Recommendations for improved data
processing from expired gas analysis indirect calorimetry. Sports Medicine 40 95-
111.
Rose EA, Partfitt G (2007) A quantitative and qualitative explanation of the
individual differences in affective responses to prescribed and self-selected exercise
intensities. Journal of Sport and Exercise Psychology 29 281-309.
Rosenkilde M, Auerbach P, Reichkendler MH, Ploug T, Stallknecht BM, Sjodin A
(2012) Body fat loss and compensatory mechanisms in response to different doses of
aerobic exercise-a randomized controlled trial in overweight sedentary males.
American Journal of Physiology – Regulatory, Integrative and Comparative
Physiology 303 R571-9.
Ross R, Dagnone D, Jones PJ, Smith H, Paddags A, Hudson R, Janssen I (2000)
Reduction in obesity and related comorbid conditions after diet-induced weight loss
or exercise-induced weight loss in men: A randomized, controlled trial. Annals of
Internal Medicine 133 92-103.
Ross R, de Lannoy L, Stotz PJ (2015) Separate effects of intensity and amount of
exercise on interindividual cardiorespiratory fitness response. Mayo Clinic
Proceedings 90 1506-14.
Rowell LB, Shepherd JT. Handbook of Physiology: Exercise, regulation and
integration of multiple systems. 1996. New York.
Ryan R. Cochrane Consumers and Communication Review Group. Cochrane
Consumers and Communication Review Group reviews: how to consider equity
issues. http://cccrg.cochrane.org, February 2013 (accessed 15th April 2017).
Sabbahi A, Arena R, Kaminsky LA, Myers J, Phillips SA (2018) Peak blood
pressure responses during maximum cardiopulmonary exercise testing novelty and
significance. Hypertension 71 229-36.
Safar ME (1989) Pulse pressure in essential hypertension: clinical and therapeutical
implications. Journal of Hypertension 7 769 –76.
Sainani KL (2018) The problem with “magnitude-based inference”. Medicine and
Science in Sport and Exercise 50 2166-76.
Sala C, Santin E, Rescaldani M, Magrini F (2006) How long shall the patient rest
before clinic blood pressure measurement? American Journal of Hypertension 7 713-
7.
231
Salonen JY, Salonen R (1993) Ultrasound B-mode imaging in observational studies
of atherosclerotic progression. Circulation 87 S3 II56-65.
Sarzynski MA, Ghosh S, Bouchard C (2017) Genomic and transcriptomic predictors
of response levels to endurance training. Journal of Physiology 595 2931-9.
Savard R, Despres JP, Marcotte M, Bouchard C (1985) Endurance training and
glucose conversion into triglycerides in human fat cells. Journal of Applied
Physiology (1985) 58 230-5.
Scharhag-Rosenberger F, Walitzek S, Kindermann W, Meyer T (2012) Differences
in adaptations to 1 year of aerobic endurance training: individual patterns of
nonresponse. Scandinavian Journal of Medicine and Science in Sports 22 113-8.
Schmitz KH, Ahmed RL, Yee D (2002) Effects of a 9-month strength training
intervention on insulin, insulin-like growth factor (IGF)-I, IGF-binding protein
(IGFPB)-1, and IGFBP-3 in 30-50-year old women. Cancer Epidemiology
Biomarkers Prevention 11 1597-1604.
Schmitz KH, Jensen MD, Kugler KC, Jeffrey RW, Leon AS (2003) Strength training
for obesity prevention in midlife women. International Journal of Obesity 27 326-
33.
Schubert MM, Sabapathy S, Leveritt M, Desbrow B (2014) Acute exercise and
hormones related to appetite regulation: a meta-analysis. Sports Medicine 44 387-403.
Schuit AJ, Schouten EG, Miles TP, Evans WJ, Saris WH, Kok FJ (1998) The effect
of six months training on weight, body fatness and serum lipids in apparently healthy
elderly Dutch men and women. International Journal of Obesity 22 847-53.
Segal NL, Allison DB (2002) Twins and virtual twins: bases of relative body weight
revisited. International Journal of Obesity and Related Metabolic Disorders 26 437-
41.
Senior AM, Gosby AK, Lu J, Simpson SJ, Raubenheimer D (2016) Meta-analysis of
variance: an illustration comparing the effects of two dietary interventions on
variability in weight. Evolution Medicine and Public Health 1 244-55.
Senn S (1993) Suspended judgement of n-of-1 trials. Controlled Clinical Trials 14 1-
5.
Senn S (2001) Individual therapy: new dawn or false dawn? Drug Information
Journal 35 1479-94.
Senn S (2004) Individual response to treatment: is it a valid assumption? BMJ 329
966-8.
232
Senn S (2016) Mastering variation: variance components and personalised medicine.
35 Statistics in Medicine 966–77.
Senn S, Rolfe K, Julious SA (2011) Investigating variability in patient response to
treatment – a case study from a replicate cross-over study. Statistical Methods in
Medical Research 20 657-66.
Sesso HD, Stampfer MJ, Rosner B, Hennekens CH, Gaziano JM, Manson JE, Glynn
RJ (2000) Systolic and diastolic blood pressure, pulse pressure, and mean arterial
pressure as predictors of cardiovascular disease risk in men. Hypertension 36 801-
17.
Shaw K, Gennat HC, O’Rourke P, Del Mar C (2006) Exercise for overweight or
obesity. Cochrane Database of Systematic Reviews 4 112-7.
Sheikholeslami Vatani D, Ahmadi S, Ahmadi Dehrashid K, Gharibi F (2011)
Changes in cardiovascular risk factors and inflammatory markers of young, healthy,
men after six weeks of moderate or high intensity resistance training. Journal of
Sports Medicine and Physical Fitness 51 696-700.
Shephard RJ, Rankinen T, Bouchard C (2004) Test-retest errors and the apparent
heterogeneity of training responses. European Journal of Applied Physiology 91
199-203.
Shojaee-Moradie F, Baynes KCR, Pentecost C, Bell JD, Thomas EL, Jackson NC,
Stolinski M, Whyte M, Lovell D, Bowes SB, Gibney J, Jones RH, Umpleby AM
(2007) Exercise training reduces fatty acid availability and improves the insulin
sensitivity of glucose metabolism. Diabetologia 50 404-13.
Simoneau JA, Lortie G, Boulay MR, Marcotte M, Thibault MC, Bouchard C (1986)
Inheritance of human skeletal muscle and anaerobic capacity adaptation to high-
intensity intermittent training. International Journal of Sports Medicine 7 167-71.
Sisson SB, Katzmaryk PT, Earnest CP, Bouchard C, Blair SN, Church TS (2009)
Volume of exercise and fitness non-response in sedentary post-menopausal women.
Medicine and Science in Sports and Exercise 41 539-45.
Skinner JS, Jaskolski A, Jaskolska A, Krasnoff J, Gagnon J, Leon AS, Rao DC,
Wilmore JH, Bouchard C (2001) Age, sex, race, initial fitness and response to
training: the HERITAGE family study. Journal of Applied Physiology (1985) 90
1770-6
Skinner JS, Wilmore KM, Jaskolska A, Jaskolski A, Daw EW, Rice T, Gagnon J,
Leon AS, Wilmore JH, Rao DC, Bouchard C (1999) Reproducibility of maximal
233
exercise test data in the HERITAGE family study. Medicine and Science in Sports
and Exercise 31 1623-8.
Snyder KA, Donnelly JE, Jabobsen DJ, Hertner G, Jakicic JM (1997) The effects of
long-term, moderate intensity, intermittent exercise on aerobic capacity, body
composition, blood lipids, insulin and glucose in overweight females. International
Journal of Obesity 21 1180-9.
Songsorn P, Lambeth-Mansell A, Mair JL, Haggett M, Fitzpatrick BL, Ruffino J,
Holliday A, Metcalfe RS, Vollaard NB (2016) Exercise training comprising of single
20-s cycle sprints does not provide a sufficient stimulus for improving maximal
aerobic capacity in sedentary individuals. European Journal of Applied Physiology
116 1511-7.
Sparks LM (2017) Exercise training response heterogeneity: physiological and
molecular insights. Diabetologia 60 2329-36.
Spear BB, Heath-Chiozzi M, Huff J (2001) Clinical applications of
pharmacogenetics. Trends in Molecular Medicine 7 201-4.
Stacks FM, Svetkey LP, Vollmer WM, Appel LJ, Bray GA, Harsha D, Obarzanek E,
Conlin PR, Milled ED, Simons-Morton DG, Karanja N, Lin PH (2001a) Effects on
blood pressure of reduced dietary sodium and the dietary approaches to stop
hypertension (DASH) diet. New England Journal of Medicine 344 3-10.
Stacks FM, Svetkey LP, Vollmer WM, Appel LJ, Bray GA, Harsha D, Obarzanek E,
Conlin PR, Miller ER, Simons-Morton DG, Karanja N, Lin PH (2001b) A clinical
trial of the effects of reduced dietary sodium and the DASH dietary pattern (The
DASH-Sodium Trial). New England Journal of Medicine 135 1019-28.
Stefan N, Thamer C, Staiger H, Machicao F, Machann J, Schick F, Venter C, Niess
A, Laakso M, Fritsche A, Haring HU (2007) Genetic variations in PPARD and
PPARGC1A determine mitochondrial function and change in aerobic physical
fitness and insulin sensitivity during lifestyle intervention. Journal of Clinical
Endocrinology Metabolism 92 1827-33.
Stubbs RJ, Hughes DA, Johnstone AM, Whybrow S, Horgan GW, King N, Blundell
Jl (2004) Rate and extent of compensatory changes in energy intake and expenditure
in response to altered exercise and diet composition in humans. American Journal of
Physiology-Regulatory, Integrative and Comparative Physiology 286 R350-R358.
234
Stubbs RJ, Sepp A, Hughes DA, Johnstone AM, King N, Horgan G, Blundell JE
(2002a) The effect of graded levels of exercise on energy intake and balance in free-
living women. International Journal of Obesity 26 866-9.
Stubbs RJ, Sepp A, Hughes DA, Johnstone AM, Horgan GW, King N, Blundell J
(2002b) The effect of graded levels of exercise on energy intake and balance in free-
living men, consuming their normal diet. European Journal of Clinical Nutrition 56
129-40.
Stunkard AJ, Foch TT, Hrubec Z (1986a. A twin study of human obesity. JAMA 256
51-54.
Stunkard AJ, Sørensen TI, Hanis C, Teasdale TW, Chakraborty R, Schull WJ,
Schulsinger F (1986b) An adoption study of human obesity. New England Journal of
Medicine 314 193-198.
Sui X, LaMonte MJ, Blair SN (2007) Cardiorespiratory fitness as a quantitative
predictor of non-fatal cardiovascular events in asymptomatic men and women.
American Journal of Epidemiology 165 413-23.
Svetkey LP, Harsha DW, Vollmner WM, Stevens VJ, Obarzanek E, Elmer PJ, Lin
PH, Champagne C, Simons-Mortin DG, Aickin M, Proschan MA, Appel LJ (2003)
PREMIER: a clinical trial of comprehensive lifestyle modification for blood pressure
control: rationale, design and baseline characteristics. Annals of Epidemiology 13
462-71.
Svetkey LP, Erlinger TP, Vollmner WM, Feldstein A, Cooper LS, Appel LJ, Ard JD,
Elmer PJ, Harsha DW, Stevens VJ (2005) Effect of lifestyle modifications on blood
pressure by race, sex, hypertension status and age. Journal of Human Hypertension
19 21-31.
Takahashi H, Yoshika M, Yokoi T (2015) Validation of three automatic devices for
the self-measurement of blood pressure according to the European Society of
Hypertension International Protocol revision 2010: The Omron HEM-7130, HEM-
7320F and HEM 7500F. Blood Pressure Monitoring 20 92-7.
Takeshima N, Rogers ME, Islam MM, Yarmauchi T, Watanabe E, Okada A (2004)
Effect of concurrent aerobic and resistance circuit exercise training on fitness in
older adults. European Journal of Applied Physiology 93 173-82.
Tan LJ, Zhu H, He H, Wu KH, Li J, Chen XD, Zhang JG, Shen H, Tian Q, Krousel-
Wood M, Papasian CJ, Bouchard C, Perusse L, Deng HW (2014) Replication of 6
235
obesity genes in a meta-analysis of genome-wide association studies with diverse
ancestries. PLos One 30 e96149.
Tan S, Wang X, Wang J (2012) Effects of supervised exercise training at the
intensity of maximal fat oxidation in overweight young women. Journal of Exercise
Science and Fitness 10 64-9.
Tan S, Wang J, Cao L, Guo Z, Wang Y (2016) Positive effect of exercise training at
maximal fat oxidation intensity on body composition and lipid metabolism in
overweight middle‐aged women. Clinical Physiology and Functional Imaging 36
225-30.
Tandy-Connor S, Guiltinan J, Kremely K, LaDuca H, Reineke P, Gutierrez S, Gray
P, Tippin Davis B (2018) False-positive results released by direct-to-consumer
genetic tests highlights the importance of clinical confirmation testing for
appropriate patient care. Genetics in Medicine doi:10/1038/gim.2018.38
Tedstone AE (2016) Obesity treatment – are personalized approaches missing the
point? BMJ 354 i4890.
Teixeira PJ, Going SB, Houtkooper LB, Metcalfe LL, Blew RM, Flint-Wagner HG,
Cussler EC, Sardinha LB, Lohman TG (2003) Resistance training in postmenopausal
women with and without hormone therapy. Medicine and Science in Sports and
Exercise 35 555-62.
The 100,000 Genome Project. https://www.genomicsengland.co.uk/the-100000-
genomes-project/. Accessed 8th March 2018.
Thompson PD, Crouse SF, Goodpaster B, Kelley D, Moyna N, Pescatello L (2001)
The acute versus the chronic response to exercise. Medicine and Science in Sports
and Exercise 33 (6 Suppl) S438-45.
Timmons JA, Knudsen S, Rankinen T, Koch LG, Sarzynski M, Jensen T, Keller P,
Scheele C, Vollaard NB, Nielsen S, Akerstrom T, MacDougald OA, Jansson E,
Greenhaff PL, Tarnopolsky MA, van Loon LJ, Pederson BK, Sundberg CJ,
Wahlstedt C, Britton SL, Bouchard C (2010) Using molecular classification to
predict gains in maximal aerobic capacity following endurance exercise training in
humans. Journal of Applied Physiology (1985) 108 1487-96.
Topouchian J, Agnoletti D, Blacher J, Youssef A, Ibanez I, Khabouth J, Khawaja S,
Beaino L, Asmar R (2011) Validation of four automatic devices for self-
measurement of blood pressure according to the international protocol of the
236
European Society of Hypertension. Vascular Health and Risk Management 7 709-
17.
Tremblay A, Poehlman ET, Despres JP, Theriault G, Danforth E, Bouchard C (1997)
Endurance training with constant energy intake in identical twins: changes over time
in energy expenditure and related hormones. Metabolism 46 499-503.
Toraman NF, Erman A, Agyar E (2004) Effects of multicomponent training on
functional fitness in older adults. Journal of Aging and Physical Activity 12 538-53.
Tracy BL, Hart CE (2013) Bikram yoga training and physical fitness in healthy
young adults. Journal of Strength and Conditioning Research 27 822-30.
Turnbull F, Neal B, Algert C, Chalmers J, Woodward M, MacMahon S (2003)
Effects of different blood-pressure-lowering regimens on major cardiovascular
events: results of prospectively-designed overviews of randomised trials. Lancet 362
1527-35.
Unick J, Otto A, Goodpastor B, Helsel DL, Pellegrini CA, Jakicic JM (2010) Acute
effect of walking on energy intake in overweight/obese women. Appetite 55 413-9.
Vasan RS, Beiser A, Seshadri S, Larson MG, Kannel WB, D’Agostino RB, Levy D
(2002) Residual life-time risk for developing hypertension in middle-aged men and
women: the Framingham Study. JAMA 297 1003-10.
Vasan RS, Larson MG, Leip EP Evans JC, O’Donnell CJ, Kannel WB, Levy D
(2001) Impact of high-normal blood pressure on the risk of cardiovascular disease.
New England Journal of Medicine 345 1291-97.
Vellers HL, Kleeberger SR, Lightfoot JT (2018) Inter-individual variation in
adaptations to endurance and resistance exercise training: genetic approaches
towards understanding a complex phenotype. Mammalian Genome 29 48-62.
Vilela BL, Silva AABS, de Lira CAB, Andrade Mdos S (2015) Workplace exercise
and educational program for improving fitness outcomes related to health in
workers: a randomized controlled trial. Journal of Occupational and Environmental
Medicine 57 235-40.
Vollaard NBJ, Constantin-Teodosiu D, Fredriksson K, Rooyackers O, Jansson E,
Greenhaff PL, Timmons JA, Sundberg CJ (2009) Systematic analysis of adaptations
in aerobic capacity and submaximal energy metabolism provides a unique insight
into determinants of human aerobic performance. Journal of Applied Physiology
(1985) 106 1479-86.
237
Warburton DE, Whitney Nichol C, Bredin SS (2006) Health benefits of physical
activity: The evidence. Canadian Medical Association Journal 174 801-9.
Washburn RA, Szabo AN, Lambourn K, Willis EA, Ptomey LT, Honas JJ,
Herrmann SD, Donnelly JE (2014) Does the method of weight loss effect long-term
changes in weight, body composition or chronic disease risk factors in overweight or
obese adults? A systematic review. Plos One 9 e109849. doi:
10.1371/journal.pone.0109849
Webborn N, Williams A, McNamee M, Bouchard C, Pitsiladis Y, Ahmetov I,
Ashley E, Byrne N, Camporesi S, Collins M, Dijkstra P, Enyon N, Fuku N, Garton
FC, Hoppe N, Holm S, Kaye J, Klissouras V, Lucia A, Maase K, Morna C, North
KN, Pigozi F, Wang G (2015) Direct-to-consumer genetic testing for predicting
sports performance and talent identification: consensus statement. British Journal of
Sports Medicine 49 1486-91.
Whalley AJ, Asher JE, Froguel P (2009) The genetic contribution to non-syndromic
human obesity. Nature Reviews Genetics 10 431-2.
Whelton PK, He J, Appel LJ, Cutler JA, Havas S, Kotchen TA, Roccella EJ, Stout R,
Vallbona C, Winston MC, Karimbakas J (2002) Primary prevention of hypertension.
Clinical and public health advisory from the National High Blood Pressure
Education Program. JAMA 288 1882-88.
Whybrow S, Hughes DA, Ritz P, Johnstone AM, Horgan GW, King N, Blundell JE,
Stubbs RJ (2008) The effect of incremental increase in exercise on appetite, eating
behavior and energy balance in lean men and women feeding ad libitum. British
Journal of Nutrition 100 1109-15.
Williams CJ, Williams MG, Eynon N, Ashton KJ, Little JP, Wisloff U, Coombes JS
(2017) Genes to predict V̇O2max trainability: a systematic review. BMC Genomics
18 831.
Williamson PJ, Atkinson G, Batterham AM (2017) Inter-individual responses of
maximal oxygen uptake to exercise training: A critical review. Sports Medicine 47
1501-13.
Williamson PJ, Atkinson G, Batterham AM (2018) Inter-individual differences in
weight change following exercise interventions: A systematic review and meta-
analysis of randomised controlled trials. Obesity Reviews 19 960-5.
238
Wilmore JF, Despres JP, Stanforth PR (1999) Alterations in body weight and
composition consequent to 20 wk of endurance training: the HERITAGE Family
Study. American Journal of Clinical Nutrition 70 245-52.
Wilmore JH, Stanforth PR, Gagnon J, Rice T, Mandel S, Leon AS, Rao DC, Skinner
JS, Bouchard C (2001) Heart rate and blood pressure changes with endurance
training: the HERITAGE family study. Medicine and Science in Sports and Exercise
33 107-16.
Wishnofsky M (1958) Caloric equivalents of gained or lost weight. American
Journal of Clinical Nutrition 6 542-6.
Wolz M, Cutler J, Roccella EJ, Rohde F, Thom T, Burt V (2000) Statement from the
National High Blood Pressure Education Program: Prevalence of hypertension.
American Journal of Hypertension 13 103-4.
World Health Organization (2016) Global report on diabetes.
http://apps.who.int/iris/bitstream/handle/10665/204871/9789241565257_eng.pdf;jses
sionid=13204DC8140DC842CC8A6E6A58FA9099?sequence=1&TSPD_101_R0=e
613876c4e5cea83ea28ddcbeeb9713fh2T00000000000000027839ed96ffff000000000
00000000000000000005ba396af0058493fbb
Yildiran T, Koc M, Bozkurt A, Sahin DY, Unal I, Acarturk E (2010) Low pulse
pressure as a predictor of death in patients with mild to advanced heart failure. Texas
Heart Institute Journal 37 284-90.
Yzaguirre I, Grazoli G, Domenech M, Vinuesa A, Pi R, Gutierrez J, Coca A,
Brugada J, Sitges M (2017) Exaggerated blood pressure response to exercise and
late-onset hypertension in young adults. Blood Press Monitoring 22 339-44.
Zadro JR, Shirley D, Andrabe TB, Scurrah KJ Bauman A, Ferreira PH (2017) The
beneficial effects of physical activity: Is it down to your genes? A systematic review
and meta-analysis of twin and family studies. Sports Medicine-Open 3:4.
Zucker DR, Ruthazer R, Schmid CH (2010) Individual (n-of-1) trials can be
combined to give population comparative treatment effect estimates: methodologic
considerations. Journal of Clinical Epidemiology. 63 1312-23.e.
Related Documents