Quantifying the impact of SGS models in actuator-line based LES of wind turbine wakes Hamid Sarlak 1 & R. Mikkelsen 1 J. N. Sørensen 1 & C. Meneveau 2 1 The Technical University of Denmark, [email protected] 2 The Johns Hopkins University, USA Flow center meeting June 4th. 2013, DTU Wind Energy, Roskilde H Sarlak et al. (DTU-JHU) SGS impact on wind turbine wakes 1 / 29

Welcome message from author
This document is posted to help you gain knowledge. Please leave a comment to let me know what you think about it! Share it to your friends and learn new things together.
Transcript

Quantifying the impact of SGS models inactuator-line based LES of wind turbine wakes
Hamid Sarlak1 & R. Mikkelsen1
J. N. Sørensen1 & C. Meneveau2
1 The Technical University of Denmark, [email protected] The Johns Hopkins University, USA
Flow center meetingJune 4th. 2013, DTU Wind Energy, Roskilde
H Sarlak et al. (DTU-JHU) SGS impact on wind turbine wakes 1 / 29

Outline
1 Ellipsys3D solver, governing equations and ACL modeling
2 Case 1: Blind test 2 Expr.
3 Case 2: One rotor in laminar and turbulent inflowLaminar inflow simulation resultsTurbulent inflow simulation resultsLaminar-turbulent inflow inter-comparisons
4 Conclusions
H Sarlak et al. (DTU-JHU) SGS impact on wind turbine wakes 2 / 29

Ellipsys3D solver, governing equations and ACLmodeling
CFD Platform, Ellipsys3D
FV discretization on non-staggered grid, written in generalcurvilinear coordinates
Block structured grids, MPI-parallelized, Multigrid accelerated
Coupled with Flex5: control, structural and aeroelastic analysesincluded for ACL.
H Sarlak et al. (DTU-JHU) SGS impact on wind turbine wakes 3 / 29
Ellipsys3D solver, governing equations and ACLmodeling
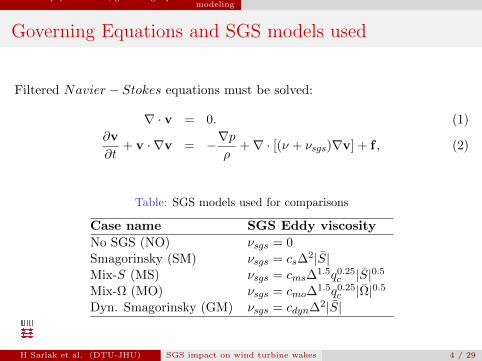
Governing Equations and SGS models used
Filtered Navier − Stokes equations must be solved:
∇ · v = 0. (1)
∂v
∂t+ v · ∇v = −∇p
ρ+∇ · [(ν + νsgs)∇v] + f , (2)
Table: SGS models used for comparisons
Case name SGS Eddy viscosity
No SGS (NO) νsgs = 0Smagorinsky (SM) νsgs = cs∆
2|S|Mix-S (MS) νsgs = cms∆
1.5q0.25c |S|0.5Mix-Ω (MO) νsgs = cmo∆
1.5q0.25c |Ω|0.5Dyn. Smagorinsky (GM) νsgs = cdyn∆2|S|
H Sarlak et al. (DTU-JHU) SGS impact on wind turbine wakes 4 / 29

Ellipsys3D solver, governing equations and ACLmodeling
Wind Turbine Modeling: Actuator Line Concept (Sørensen
and Shen 2002)
H Sarlak et al. (DTU-JHU) SGS impact on wind turbine wakes 5 / 29

Case 1: Blind test 2 Expr.
Results, Case 1:
Blind test 2: Ellipsys3D versus measurements
H Sarlak et al. (DTU-JHU) SGS impact on wind turbine wakes 6 / 29

Case 1: Blind test 2 Expr.
Blind test 2
(d) (e)
(f)
H Sarlak et al. (DTU-JHU) SGS impact on wind turbine wakes 7 / 29

Case 1: Blind test 2 Expr.
Simulation set up for the ”BT2”
Tunnel (L,W,H)= (12.7, 2.7, 2)m. Dr = 894mm, Ui = 10m/s.
NREL’s s826 airfoil is used. The aerodynamic coefficients forEllipsys simulations found based on 2D airfoil measurements inDTU wind tunnel.
Spatial discretization: Blend of CDS and QUICK
Dimensionless time step: dt∗ = dt.u∞/R = 0.004
Fixed rotational speed of Omega = 127rad/s according to theexperiments. Rer = 50, 000 (U∞ = 1, R = 1) in Ellipsys3D.
TI = 0.3% on top of laminar inflow
The numerical tunnel is resolved using ca. 8.4 million cells and therotors are represented by 35 points along each blade
H Sarlak et al. (DTU-JHU) SGS impact on wind turbine wakes 8 / 29

Case 1: Blind test 2 Expr.
Time averaged streamwise velocity
H Sarlak et al. (DTU-JHU) SGS impact on wind turbine wakes 9 / 29

Case 1: Blind test 2 Expr.
Time averaged turbulent stress component u′u′
(g)H Sarlak et al. (DTU-JHU) SGS impact on wind turbine wakes 10 / 29

Case 1: Blind test 2 Expr.
Instantaneous vorticity contours
H Sarlak et al. (DTU-JHU) SGS impact on wind turbine wakes 11 / 29

Case 1: Blind test 2 Expr.
Time averaged velocity contours
H Sarlak et al. (DTU-JHU) SGS impact on wind turbine wakes 12 / 29

Case 1: Blind test 2 Expr.
Time averaged normal stress contours
H Sarlak et al. (DTU-JHU) SGS impact on wind turbine wakes 13 / 29

Case 1: Blind test 2 Expr.
Power and thrust coefficient
0 2 4 6 8−0.1
0
0.1
0.2
0.3
0.4
0.5
0.6
λ
Cp, C
t
0 2 4 6 8 10 12−0.2
0
0.2
0.4
0.6
0.8
1
1.2
λ
Cp, C
t
Ct
exp
nomosmgmdmCp
exp
nomosmgmdm
Ctexp
nomosmgmdmCp
exp
nomosmgmdm
H Sarlak et al. (DTU-JHU) SGS impact on wind turbine wakes 14 / 29

Case 1: Blind test 2 Expr.
Conclusions so far
Simulations mimic the measurements fairly well using all SGSmodels
Power and thrust coefficients are under-estimated except the Cp
for the upstream turbine
Power and thrust predictions are identical for all models
Questions:
Is the simulation set-up accurate enough?
How accurate is the solver in terms of numerical dissipation?
Are the SGS models effective at all?
H Sarlak et al. (DTU-JHU) SGS impact on wind turbine wakes 15 / 29

Case 1: Blind test 2 Expr.
Time averaged normalized eddy viscosity
νsgs
/ν
0 2 4 6−2
−1.5
−1
−0.5
0
0.5
1
1.5
2
12R
y [R
]
0 2 413R
0 2 415R
SMGMMO
H Sarlak et al. (DTU-JHU) SGS impact on wind turbine wakes 16 / 29

Case 2: One rotor in laminar and turbulent inflow
Results, Case 2:
One rotor in laminar and turbulent inflow
H Sarlak et al. (DTU-JHU) SGS impact on wind turbine wakes 17 / 29

Case 2: One rotor in laminar and turbulent inflow
Numerical set up
(h) (i)
Figure: (a) 3D view of the grid used for the simulations (b) white circle showing the location of theactuator line (7R downstream). The grid consists of 144 × 144 × 576 (12 M) cells
H Sarlak et al. (DTU-JHU) SGS impact on wind turbine wakes 18 / 29

Case 2: One rotor in laminar and turbulent inflow
Numerical set up
Spatial discretization: A hybrid scheme consisting of 4th ordercentral differencing and 3rd QUICK for the convective terms and2nd order central differencing for the rest of the terms. 2nd orderbackward Euler for the time integration
Dimensionless time step: dt∗ = dt.u∞/R = 0.005
Fixed rotational speed of 1.8rad/s i.e, in 1 sec. 200 iterations and100o rotation. Rer = 50, 000 (U∞ = 1, R = 1).
Actuator line with Gaussian smearing factor ε = 2.2∆ used
Two cases are run, one with laminar inflow and the other with 7%ambient turbulence applied on the upstream rotor
H Sarlak et al. (DTU-JHU) SGS impact on wind turbine wakes 19 / 29

Case 2: One rotor in laminar and turbulent inflow Laminar inflow simulation results
Laminar inflow: Time averaged Streamwise velocity
Figure: Streamwise mean velocity contours in laminar inflow
H Sarlak et al. (DTU-JHU) SGS impact on wind turbine wakes 20 / 29

Case 2: One rotor in laminar and turbulent inflow Laminar inflow simulation results
Laminar inflow: Time averaged Eddy viscosity
The Mix-O predicts the lowest time averaged eddy viscosity (otherthan NO SGS case of course!).
(a)
Figure: Normalized eddy viscosity contours in turbulent flow
H Sarlak et al. (DTU-JHU) SGS impact on wind turbine wakes 21 / 29

Case 2: One rotor in laminar and turbulent inflow Turbulent inflow simulation results
Turbulent inflow: Time averaged Streamwise velocity
Figure: Streamwise mean velocity contours in turbulent flow
H Sarlak et al. (DTU-JHU) SGS impact on wind turbine wakes 22 / 29

Case 2: One rotor in laminar and turbulent inflow Turbulent inflow simulation results
Turbulent inflow: Time averaged Eddy viscosity
The Mix-S predicts the lowest time averaged eddy viscosity (other thanNO SGS case of course!).
(a)
Figure: Normalized eddy viscosity contours in turbulent flow
H Sarlak et al. (DTU-JHU) SGS impact on wind turbine wakes 23 / 29

Case 2: One rotor in laminar and turbulent inflow Laminar-turbulent inflow inter-comparisons
Laminar vs Turbulent inflow:Time averaged Wakedeficit
u [m/s]
0.5 1 1.57
8
9
10
11
12
13
0R
y [R
]
0.5 1 1.51R
0 1 23R
0 1 210R
0 1 220R
0 1 230R
0.5 1 1.540R
NO
SM
MS
MO
(a)
u [m/s]
0.5 1 1.57
8
9
10
11
12
13
0R
y [R
]
0.5 1 1.51R
0.5 1 1.53R
0.7 0.8 0.910R
0.8 0.9 120R
0.9 0.95 130R
0.9 0.95 140R
NO
SM
MS
MO
(b)
Figure: Wake development in (a) laminar and (b) turbulent inflow
H Sarlak et al. (DTU-JHU) SGS impact on wind turbine wakes 24 / 29

Case 2: One rotor in laminar and turbulent inflow Laminar-turbulent inflow inter-comparisons
Laminar vs Turbulent inflow: < u′u′ >
<u’u’> [m2/s2]
0 0.02 0.047
8
9
10
11
12
13
0R
y [R
]
0 2 4
x 10−31R0 0.005 0.01
3R0 0.01 0.02
10R0 0.05 0.1
20R0 0.1 0.2
30R0 0.1 0.2
40R
NO
SM
MS
MO
(a)
<u’u’> [m2/s2]
0.1 0.15 0.27
8
9
10
11
12
13
0R
y [R
]
0 0.2 0.41R
0 0.2 0.43R
0.1 0.15 0.210R
0.08 0.1 0.1220R
0.05 0.130R
0.04 0.06 0.0840R
NO
SM
MS
MO
(b)
Figure: Comparison of stress tensor component < u′u′ > for (a) laminar and (b) turbulent inflow
H Sarlak et al. (DTU-JHU) SGS impact on wind turbine wakes 25 / 29

Case 2: One rotor in laminar and turbulent inflow Laminar-turbulent inflow inter-comparisons
Laminar vs Turbulent inflow: Time averaged Eddyviscosity
νsgs
/ν
0 5 108
8.5
9
9.5
10
10.5
11
11.5
12
12.5
0R
y [R
]
0 5 101R
0 5 103R
0 5 1010R
0 10 2020R
0 5 1030R
0 5 1040R
SMMSMO
(a)
νsgs
/ν
0 5 108
8.5
9
9.5
10
10.5
11
11.5
12
12.5
0R
y [R
]
0 5 101R
0 10 203R
0 10 2010R
0 5 1020R
0 5 1030R
0 5 1040R
SMMSMO
(b)
Figure: Comparison of the normalized eddy viscosity for (a) laminar asnd (b) turbulent inflow
H Sarlak et al. (DTU-JHU) SGS impact on wind turbine wakes 26 / 29

Conclusions
ConclusionsWake structure behind actuator lines were simulated for two different cases upto 40 R downstream:
The wake region in laminar inflow case grows less rapidly and extendsfurther downstream in a more concentrate fashion, as compared to theturbulent inflow case, in which the wake grows (recovers) much faster
Results show that the sub-grid scale models have a strong impact on theeddy viscosities
Results show very little dependence of mean velocity profiles withrespect to SGS models for both laminar and turbulent inflows, althoughin the very far wake, effects begin to be visible.
Results show strong dependence of Reynolds stress profiles with respectto SGS models for the case of laminar inflow.
H Sarlak et al. (DTU-JHU) SGS impact on wind turbine wakes 27 / 29
Related Documents