Review Quantifying submarine groundwater discharge in the coastal zone via multiple methods W.C. Burnett a, ⁎ , P.K. Aggarwal b , A. Aureli c , H. Bokuniewicz d , J.E. Cable e , M.A. Charette f , E. Kontar g , S. Krupa h , K.M. Kulkarni b , A. Loveless i , W.S. Moore j , J.A. Oberdorfer k , J. Oliveira l , N. Ozyurt m , P. Povinec n,1 , A.M.G. Privitera o , R. Rajar p , R.T. Ramessur q , J. Scholten n , T. Stieglitz r,s , M. Taniguchi t , J.V. Turner u a Department of Oceanography, Florida State University, Tallahassee, FL 32306, USA b Isotope Hydrology Section, International Atomic Energy Agency, Austria c Department Water Resources Management, University of Palermo, Catania, Italy d Marine Science Research Center, Stony Brook University, USA e Department Oceanography, Louisiana State University, USA f Department Marine Chemistry, Woods Hole Oceanographic Institution, USA g Shirshov Institute of Oceanology, Russia h South Florida Water Management District, USA i University of Western Australia, Australia j Department Geological Sciences, University of South Carolina, USA k Department Geology, San Jose State University, USA l Instituto de Pesquisas Energéticas e Nucleares, Brazil m Department Geological Engineering, Hacettepe, Turkey n Marine Environment Laboratory, International Atomic Energy Agency, Monaco o U.O. 4.17 of the G.N.D.C.I., National Research Council, Italy p Faculty of Civil and Geodetic Engineering, University of Ljubljana, Slovenia q Department Chemistry, University of Mauritius, Mauritius r Mathematical and Physical Sciences, James Cook University, Australia s Australian Institute of Marine Sciences, Townsville, Australia t Research Institute for Humanity and Nature, Japan u CSIRO, Land and Water, Perth, Australia Received 3 February 2006; received in revised form 1 May 2006; accepted 4 May 2006 Abstract Submarine groundwater discharge (SGD) is now recognized as an important pathway between land and sea. As such, this flow may contribute to the biogeochemical and other marine budgets of near-shore waters. These discharges typically display significant spatial and temporal variability making assessments difficult. Groundwater seepage is patchy, diffuse, temporally variable, and may involve multiple aquifers. Thus, the measurement of its magnitude and associated chemical fluxes is a challenging enterprise. Science of the Total Environment xx (2006) xxx – xxx + MODEL STOTEN-09437; No of Pages 46 www.elsevier.com/locate/scitotenv ⁎ Corresponding author. Tel.: +1 850 644 6703; fax: +1 850 644 2581. E-mail address: [email protected] (W.C. Burnett). 1 Present address: Comenius University, Bratislava, Slovakia. 0048-9697/$ - see front matter © 2006 Elsevier B.V. All rights reserved. doi:10.1016/j.scitotenv.2006.05.009 ARTICLE IN PRESS

Welcome message from author
This document is posted to help you gain knowledge. Please leave a comment to let me know what you think about it! Share it to your friends and learn new things together.
Transcript
Science of the Total Environment xx (2006) xxx–xxx
+ MODEL
www.elsevier.com/locate/scitotenv
ARTICLE IN PRESS
Review
Quantifying submarine groundwater dischargein the coastal zone via multiple methods
W.C. Burnett a,⁎, P.K. Aggarwal b, A. Aureli c, H. Bokuniewicz d, J.E. Cable e,M.A. Charette f, E. Kontar g, S. Krupa h, K.M. Kulkarni b, A. Loveless i, W.S. Moore j,J.A. Oberdorfer k, J. Oliveira l, N. Ozyurt m, P. Povinec n,1, A.M.G. Privitera o, R. Rajar p,
R.T. Ramessur q, J. Scholten n, T. Stieglitz r,s, M. Taniguchi t, J.V. Turner u
a Department of Oceanography, Florida State University, Tallahassee, FL 32306, USAb Isotope Hydrology Section, International Atomic Energy Agency, Austria
c Department Water Resources Management, University of Palermo, Catania, Italyd Marine Science Research Center, Stony Brook University, USAe Department Oceanography, Louisiana State University, USA
f Department Marine Chemistry, Woods Hole Oceanographic Institution, USAg Shirshov Institute of Oceanology, Russia
h South Florida Water Management District, USAi University of Western Australia, Australia
j Department Geological Sciences, University of South Carolina, USAk Department Geology, San Jose State University, USAl Instituto de Pesquisas Energéticas e Nucleares, Brazil
m Department Geological Engineering, Hacettepe, Turkeyn Marine Environment Laboratory, International Atomic Energy Agency, Monaco
o U.O. 4.17 of the G.N.D.C.I., National Research Council, Italyp Faculty of Civil and Geodetic Engineering, University of Ljubljana, Slovenia
q Department Chemistry, University of Mauritius, Mauritiusr Mathematical and Physical Sciences, James Cook University, Australia
s Australian Institute of Marine Sciences, Townsville, Australiat Research Institute for Humanity and Nature, Japan
u CSIRO, Land and Water, Perth, Australia
Received 3 February 2006; received in revised form 1 May 2006; accepted 4 May 2006
Abstract
Submarine groundwater discharge (SGD) is now recognized as an important pathway between land and sea. As such, thisflow may contribute to the biogeochemical and other marine budgets of near-shore waters. These discharges typically displaysignificant spatial and temporal variability making assessments difficult. Groundwater seepage is patchy, diffuse, temporallyvariable, and may involve multiple aquifers. Thus, the measurement of its magnitude and associated chemical fluxes is achallenging enterprise.
STOTEN-09437; No of Pages 46
⁎ Corresponding author. Tel.: +1 850 644 6703; fax: +1 850 644 2581.E-mail address: [email protected] (W.C. Burnett).
1 Present address: Comenius University, Bratislava, Slovakia.
0048-9697/$ - see front matter © 2006 Elsevier B.V. All rights reserved.doi:10.1016/j.scitotenv.2006.05.009
2 W.C. Burnett et al. / Science of the Total Environment xx (2006) xxx–xxx
ARTICLE IN PRESS
A joint project of UNESCO and the International Atomic Energy Agency (IAEA) has examined several methods of SGDassessment and carried out a series of five intercomparison experiments in different hydrogeologic environments (coastal plain,karst, glacial till, fractured crystalline rock, and volcanic terrains). This report reviews the scientific and managementsignificance of SGD, measurement approaches, and the results of the intercomparison experiments. We conclude that while theprocess is essentially ubiquitous in coastal areas, the assessment of its magnitude at any one location is subject to enoughvariability that measurements should be made by a variety of techniques and over large enough spatial and temporal scales tocapture the majority of these changing conditions.
We feel that all the measurement techniques described here are valid although they each have their own advantages anddisadvantages. It is recommended that multiple approaches be applied whenever possible. In addition, a continuing effort isrequired in order to capture long-period tidal fluctuations, storm effects, and seasonal variations.© 2006 Elsevier B.V. All rights reserved.
Keywords: Submarine groundwater discharge; Coastal zone management; Seepage meters; Radon; Radium isotopes; Tracers
Contents
1. Introduction . . . . . . . . . . . . . . . . . . . . . . . . . . . . . . . . . . . . . . . . . . . . . . . . . . . . . . . . 01.1. Background . . . . . . . . . . . . . . . . . . . . . . . . . . . . . . . . . . . . . . . . . . . . . . . . . . . . 01.2. Significance of SGD . . . . . . . . . . . . . . . . . . . . . . . . . . . . . . . . . . . . . . . . . . . . . . . . 01.3. Definition of submarine groundwater discharge . . . . . . . . . . . . . . . . . . . . . . . . . . . . . . . . . . 01.4. Drivers of SGD . . . . . . . . . . . . . . . . . . . . . . . . . . . . . . . . . . . . . . . . . . . . . . . . . . 0
2. A short history of SGD research . . . . . . . . . . . . . . . . . . . . . . . . . . . . . . . . . . . . . . . . . . . . . 02.1. Overview. . . . . . . . . . . . . . . . . . . . . . . . . . . . . . . . . . . . . . . . . . . . . . . . . . . . . . 02.2. Worldwide studies . . . . . . . . . . . . . . . . . . . . . . . . . . . . . . . . . . . . . . . . . . . . . . . . . 02.3. The IAEA/UNESCO SGD initiative . . . . . . . . . . . . . . . . . . . . . . . . . . . . . . . . . . . . . . . . 0
3. Methods used to measure SGD . . . . . . . . . . . . . . . . . . . . . . . . . . . . . . . . . . . . . . . . . . . . . . 03.1. Seepage meters . . . . . . . . . . . . . . . . . . . . . . . . . . . . . . . . . . . . . . . . . . . . . . . . . . 03.2. Piezometers . . . . . . . . . . . . . . . . . . . . . . . . . . . . . . . . . . . . . . . . . . . . . . . . . . . . 03.3. Natural tracers . . . . . . . . . . . . . . . . . . . . . . . . . . . . . . . . . . . . . . . . . . . . . . . . . . . 03.4. Water balance approaches . . . . . . . . . . . . . . . . . . . . . . . . . . . . . . . . . . . . . . . . . . . . . 03.5. Hydrograph separation techniques . . . . . . . . . . . . . . . . . . . . . . . . . . . . . . . . . . . . . . . . . 03.6. Theoretical analysis and numerical simulations . . . . . . . . . . . . . . . . . . . . . . . . . . . . . . . . . . 0
4. Coastal zone management implications of SGD . . . . . . . . . . . . . . . . . . . . . . . . . . . . . . . . . . . . . 05. The UNESCO/IAEA joint SGD intercomparison activities . . . . . . . . . . . . . . . . . . . . . . . . . . . . . . . . 0
5.1. Cockburn Sound, Australia . . . . . . . . . . . . . . . . . . . . . . . . . . . . . . . . . . . . . . . . . . . . 05.1.1. Introduction . . . . . . . . . . . . . . . . . . . . . . . . . . . . . . . . . . . . . . . . . . . . . . . . 05.1.2. Seepage meters . . . . . . . . . . . . . . . . . . . . . . . . . . . . . . . . . . . . . . . . . . . . . . 05.1.3. Radium isotopes . . . . . . . . . . . . . . . . . . . . . . . . . . . . . . . . . . . . . . . . . . . . . 05.1.4. Radon. . . . . . . . . . . . . . . . . . . . . . . . . . . . . . . . . . . . . . . . . . . . . . . . . . . 05.1.5. Summary . . . . . . . . . . . . . . . . . . . . . . . . . . . . . . . . . . . . . . . . . . . . . . . . . 0
5.2. Donnalucata, Sicily . . . . . . . . . . . . . . . . . . . . . . . . . . . . . . . . . . . . . . . . . . . . . . . . 05.2.1. Introduction . . . . . . . . . . . . . . . . . . . . . . . . . . . . . . . . . . . . . . . . . . . . . . . . 05.2.2. Study area and geophysical characterization . . . . . . . . . . . . . . . . . . . . . . . . . . . . . . . 05.2.3. Isotopic analyses . . . . . . . . . . . . . . . . . . . . . . . . . . . . . . . . . . . . . . . . . . . . . 05.2.4. SGD evaluations . . . . . . . . . . . . . . . . . . . . . . . . . . . . . . . . . . . . . . . . . . . . . 0
5.3. Shelter Island, New York . . . . . . . . . . . . . . . . . . . . . . . . . . . . . . . . . . . . . . . . . . . . . 05.3.1. Introduction . . . . . . . . . . . . . . . . . . . . . . . . . . . . . . . . . . . . . . . . . . . . . . . . 05.3.2. Seepage meters . . . . . . . . . . . . . . . . . . . . . . . . . . . . . . . . . . . . . . . . . . . . . . 05.3.3. Radon and radium isotopes . . . . . . . . . . . . . . . . . . . . . . . . . . . . . . . . . . . . . . . . 05.3.4. Geophysical studies. . . . . . . . . . . . . . . . . . . . . . . . . . . . . . . . . . . . . . . . . . . . 05.3.5. Summary . . . . . . . . . . . . . . . . . . . . . . . . . . . . . . . . . . . . . . . . . . . . . . . . . 0
5.4. Ubatuba, Brazil . . . . . . . . . . . . . . . . . . . . . . . . . . . . . . . . . . . . . . . . . . . . . . . . . . 05.4.1. Introduction . . . . . . . . . . . . . . . . . . . . . . . . . . . . . . . . . . . . . . . . . . . . . . . . 05.4.2. Geophysical studies. . . . . . . . . . . . . . . . . . . . . . . . . . . . . . . . . . . . . . . . . . . . 05.4.3. Seepage meters . . . . . . . . . . . . . . . . . . . . . . . . . . . . . . . . . . . . . . . . . . . . . . 0
3W.C. Burnett et al. / Science of the Total Environment xx (2006) xxx–xxx
ARTICLE IN PRESS
5.4.4. Artificial tracer approach. . . . . . . . . . . . . . . . . . . . . . . . . . . . . . . . . . . . . . . . . 05.4.5. Radon and radium isotopes . . . . . . . . . . . . . . . . . . . . . . . . . . . . . . . . . . . . . . . 05.4.6. Summary. . . . . . . . . . . . . . . . . . . . . . . . . . . . . . . . . . . . . . . . . . . . . . . . . 0
5.5. Mauritius . . . . . . . . . . . . . . . . . . . . . . . . . . . . . . . . . . . . . . . . . . . . . . . . . . . . . 05.5.1. Introduction . . . . . . . . . . . . . . . . . . . . . . . . . . . . . . . . . . . . . . . . . . . . . . . 05.5.2. Water balance estimate. . . . . . . . . . . . . . . . . . . . . . . . . . . . . . . . . . . . . . . . . . 05.5.3. Seepage meters. . . . . . . . . . . . . . . . . . . . . . . . . . . . . . . . . . . . . . . . . . . . . . 05.5.4. Radon . . . . . . . . . . . . . . . . . . . . . . . . . . . . . . . . . . . . . . . . . . . . . . . . . . 05.5.5. Summary. . . . . . . . . . . . . . . . . . . . . . . . . . . . . . . . . . . . . . . . . . . . . . . . . 0
6. Overall findings and recommendations. . . . . . . . . . . . . . . . . . . . . . . . . . . . . . . . . . . . . . . . . . 0Acknowledgments . . . . . . . . . . . . . . . . . . . . . . . . . . . . . . . . . . . . . . . . . . . . . . . . . . . . . . . 0References . . . . . . . . . . . . . . . . . . . . . . . . . . . . . . . . . . . . . . . . . . . . . . . . . . . . . . . . . . . 0
1. Introduction
1.1. Background
Submarine groundwater discharge (SGD) has beenrecognized as an important pathway for materialtransport to the marine environment. It is important forthe marine geochemical cycles of elements and can leadto environmental deterioration of coastal zones. Whileinputs from major rivers are gauged and well analyzed,thus allowing relatively precise estimates of freshwaterand contaminant inputs to the ocean, assessing ground-water fluxes and their impacts on the near-shore marineenvironment is much more difficult, as there is nosimple means to gauge these fluxes to the sea. Inaddition, there are cultural and disciplinary differencesbetween hydrogeologists and coastal oceanographerswhich have inhibited interactions.
Thedirectdischargeofgroundwater intothenear-shoremarine environment may have significant environmentalconsequences because groundwater in many areas hasbecome contaminated with a variety of substances likenutrients, heavy metals, radionuclides and organic com-pounds. As almost all coastal zones are subject to flow ofgroundwater either as submarine springs or disseminatedseepage,coastalareasarelikelytoexperienceenvironmentaldegradation. Transport of nutrients to coastal waters maytrigger algae blooms, including harmful algae blooms,having negative impacts on the economy of coastal zones(LaRocheetal.,1997).
We present here a review of the subject and theresults of a recently completed project initiated as aconcerted effort to improve the measurement situationby development of an expert group to: (1) assess theimportance of SGD in different environments; and (2)to organize a series of “intercomparison experiments”involving both hydrological and oceanographic person-nel and techniques.
1.2. Significance of SGD
It is now recognized that subterranean non-pointpathways of material transport may be very important insome coastal areas (Moore, 1999; Charette and Sholk-ovitz, 2002). Because the slow, yet persistent seepage ofgroundwater through sediments will occur anywherethat an aquifer with a positive head relative to sea levelis hydraulically connected to a surface water body,almost all coastal zones are subject to such flow(Johannes, 1980; Fanning et al., 1981; Church, 1996;Moore, 1996; Li et al., 1999; Hussain et al., 1999;Taniguchi and Iwakawa, 2001; Kim and Hwang, 2002).Groundwater seepage is patchy, diffuse, temporallyvariable, and may involve multiple aquifers. Reliablemethods to measure these fluxes need to be refined andthe relative importance of the processes driving the flowneeds clarification and quantification.
Specific examples of the ecological impact ofgroundwater flow into coastal zones have been givenby Valiela et al. (1978, 1992, 2002), who showed thatgroundwater inputs of nitrogen are critical to the overallnutrient economy of salt marshes. Corbett et al. (1999,2000) estimated that groundwater nutrient inputs areapproximately equal to nutrient inputs via surfacefreshwater runoff in eastern Florida Bay. Krest et al.(2000) estimated that SGD to salt marshes on the SouthCarolina coast supplies a higher flux of nutrients thanthat derived from all South Carolina rivers. Bokunie-wicz (1980) and Bokuniewicz and Pavlik (1990)showed that subsurface discharge accounts for greaterthan 20% of the freshwater input into the Great SouthBay, New York. Follow-up studies by Capone andBautista (1985) and Capone and Slater (1990) showedthat groundwater is a significant source (∼50%) ofnitrate to the bay. Lapointe et al. (1990) foundsignificant groundwater inputs of nitrogen and dissolvedorganic phosphorus to canals and surface waters in the
3 Whose law is it anyway? Darcy's? D'Arcy's? d'Arcy's?D'Arcys'? Darcys'? DArcys? Darcys? Or even, Darcies? You willfind them all in the literature or on the WEB. The correct version is“Darcy's” (Brown et al., 2000). Although the man was born d'Arcy,his Jacobin tutor compelled him to change it to Darcy at an early age,
4 W.C. Burnett et al. / Science of the Total Environment xx (2006) xxx–xxx
ARTICLE IN PRESS
Florida Keys and suggested this may be a key factor forinitiating the phytoplankton blooms observed in thatarea. Nitrogen-rich groundwater is also suspected ofnourishing Cladophora algal mats in Harrington Sound,Bermuda (Lapointe and O'Connell, 1989). One possiblehypothesis for the triggering mechanism of HarmfulAlgal Blooms (HABs) is increased nutrient supply viaSGD (LaRoche et al., 1997; Hwang et al., 2005). Inmany of the cases cited above, shallow groundwaterswere enriched in nitrogen because of contaminationfrom septic systems. In a more pristine environment,submarine springs were shown to cause measurabledilution of salinity and enrichment of nitrogen inDiscovery Bay, Jamaica (D'Elia et al., 1981). Ground-water was also shown to be a significant component ofterrestrial nutrient and freshwater loading to TomalesBay, California (Oberdorfer et al., 1990). Johannes(1980), investigating coastal waters in Western Aus-tralia, stated that “it is … clear that submarinegroundwater discharge is widespread and, in someareas, of greater ecological significance than surfacerunoff.”
1.3. Definition of submarine groundwater discharge
We have noted confusion in the literature concerninguse of the term “groundwater discharge” (e.g., seecomment to Moore, 1996 by Younger, 1996 andsubsequent reply on whether groundwater2 is meteori-cally derived or “any water in the ground”). The mostgeneral and frequently cited definition of groundwater iswater within the saturated zone of geologic material(e.g., Freeze and Cherry, 1979; Jackson, 1977); in otherwords, water in the pores of submerged sediments(“pore water”) is synonymous with “groundwater.” Wethus consider “submarine groundwater discharge” to beany flow of water out across the sea floor. We defineSGD without regard to its composition (e.g., salinity),its origin, or the mechanism(s) driving the flow (Burnettet al., 2003a). Although our broad definition of SGDwould technically allow inclusion of such processes asdeep-sea hydrothermal circulation, fluid expulsion atconvergent margins, and density-driven cold seeps on
2 The modern convention is to write “groundwater” as one word.The early practice was to write it as two words and hyphenated (orcompounded) when used as an adjective. This usage is becomingmore rare, although it is still the convention of the U.S. GeologicalSurvey and the journal Ground Water. Writing it as one word may bedone to emphasize “the fact that it is a technical term with a particularmeaning” (Todd, 1980).
continental slopes, we restrict the term here (and thusfocus our attention) to fluid circulation throughcontinental shelf sediments with emphasis on the coastalzone (Fig. 1).
Traditional hydrology, however, has been concernedwith terrestrial freshwater. As a result, some definitionsidentify groundwater as rainwater that has infiltrated andpercolated to the water table, or put on some similarqualifications, consistent with the applications tofreshwater, terrestrial systems (e.g., Considine, 1995;Stiegeler, 1977). Such qualifications on the definition ofgroundwater are too restrictive and lead to conceptualproblems when dealing with submarine discharges. Inour view, SGD does not have to be terrestrially derived,although it can be and is in many important situations. Itmay be legitimate to require water classified as“groundwater” to move, when it does move, accordingto Darcy's Law,3 but even that is too restrictive in somehighly channelized (e.g. karst) situations. At least onedefinition of groundwater specifically excludes under-ground streams (Wyatt, 1986) while another specificallyincludes underground streams (Bates and Jackson,1984; Jackson, 1977). Since karst is such an importantsetting for SGD, we think it best to include “under-ground streams.”
So we have a system of terminology as follows. Theflow of water across the sea floor can be divided intoSGD, a discharging flow out across the sea floor, orsubmarine groundwater recharge (SGR), a rechargingflow in across the sea floor. The two terms do not haveto balance, however, because SGD can, and often will,include a component of terrestrially recharged water.Alternatively, some or all of the SGR can penetrate thesubaerial aquifer, raising the water table or dischargingas terrestrial surface waters (e.g., saline springs) rather
a convention he permanently adopted (Darcy, 1957 as cited in Brownet al., 2000). “Darcy” is the name on his tombstone, although we haveit on good authority that Elvis Presley's name is misspelled on histombstone so perhaps the grave marker is not necessarily definitive.(But, then again, maybe Elvis's not really dead either). We areindebted to Glenn Brown for his scholarship in sorting this all out.There might be a slim case made for “Darcys” based on theconvention in geography to drop the possessive apostrophe (e.g.“Gardiners Island” not “Gardiner's Island”). However, this is not theconvention in physics and chemistry (e.g. Newton's Laws or Henry'sLaw). You, and Henry Darcy, apparently can possess a law.
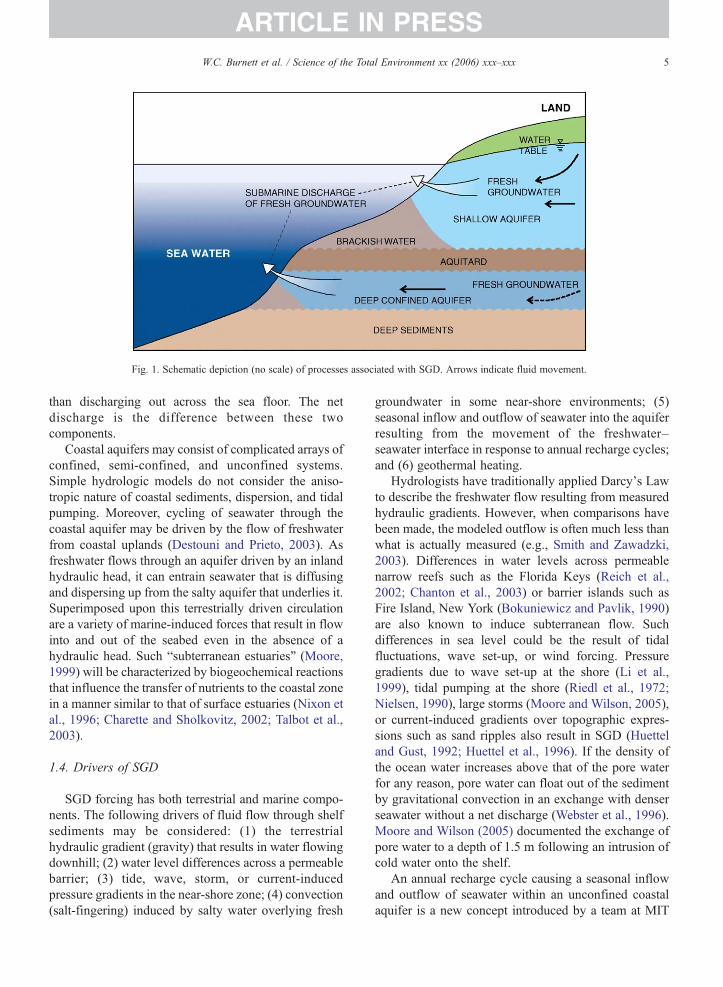
Fig. 1. Schematic depiction (no scale) of processes associated with SGD. Arrows indicate fluid movement.
5W.C. Burnett et al. / Science of the Total Environment xx (2006) xxx–xxx
ARTICLE IN PRESS
than discharging out across the sea floor. The netdischarge is the difference between these twocomponents.
Coastal aquifers may consist of complicated arrays ofconfined, semi-confined, and unconfined systems.Simple hydrologic models do not consider the aniso-tropic nature of coastal sediments, dispersion, and tidalpumping. Moreover, cycling of seawater through thecoastal aquifer may be driven by the flow of freshwaterfrom coastal uplands (Destouni and Prieto, 2003). Asfreshwater flows through an aquifer driven by an inlandhydraulic head, it can entrain seawater that is diffusingand dispersing up from the salty aquifer that underlies it.Superimposed upon this terrestrially driven circulationare a variety of marine-induced forces that result in flowinto and out of the seabed even in the absence of ahydraulic head. Such “subterranean estuaries” (Moore,1999) will be characterized by biogeochemical reactionsthat influence the transfer of nutrients to the coastal zonein a manner similar to that of surface estuaries (Nixon etal., 1996; Charette and Sholkovitz, 2002; Talbot et al.,2003).
1.4. Drivers of SGD
SGD forcing has both terrestrial and marine compo-nents. The following drivers of fluid flow through shelfsediments may be considered: (1) the terrestrialhydraulic gradient (gravity) that results in water flowingdownhill; (2) water level differences across a permeablebarrier; (3) tide, wave, storm, or current-inducedpressure gradients in the near-shore zone; (4) convection(salt-fingering) induced by salty water overlying fresh
groundwater in some near-shore environments; (5)seasonal inflow and outflow of seawater into the aquiferresulting from the movement of the freshwater–seawater interface in response to annual recharge cycles;and (6) geothermal heating.
Hydrologists have traditionally applied Darcy's Lawto describe the freshwater flow resulting from measuredhydraulic gradients. However, when comparisons havebeen made, the modeled outflow is often much less thanwhat is actually measured (e.g., Smith and Zawadzki,2003). Differences in water levels across permeablenarrow reefs such as the Florida Keys (Reich et al.,2002; Chanton et al., 2003) or barrier islands such asFire Island, New York (Bokuniewicz and Pavlik, 1990)are also known to induce subterranean flow. Suchdifferences in sea level could be the result of tidalfluctuations, wave set-up, or wind forcing. Pressuregradients due to wave set-up at the shore (Li et al.,1999), tidal pumping at the shore (Riedl et al., 1972;Nielsen, 1990), large storms (Moore and Wilson, 2005),or current-induced gradients over topographic expres-sions such as sand ripples also result in SGD (Huetteland Gust, 1992; Huettel et al., 1996). If the density ofthe ocean water increases above that of the pore waterfor any reason, pore water can float out of the sedimentby gravitational convection in an exchange with denserseawater without a net discharge (Webster et al., 1996).Moore and Wilson (2005) documented the exchange ofpore water to a depth of 1.5 m following an intrusion ofcold water onto the shelf.
An annual recharge cycle causing a seasonal inflowand outflow of seawater within an unconfined coastalaquifer is a new concept introduced by a team at MIT
6 W.C. Burnett et al. / Science of the Total Environment xx (2006) xxx–xxx
ARTICLE IN PRESS
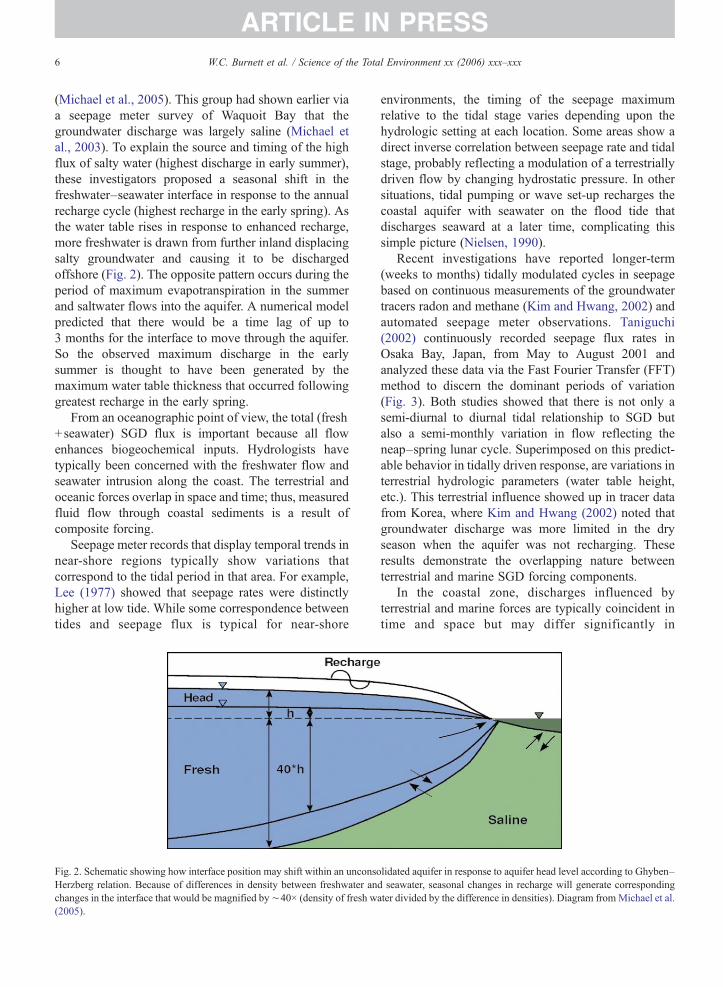
(Michael et al., 2005). This group had shown earlier viaa seepage meter survey of Waquoit Bay that thegroundwater discharge was largely saline (Michael etal., 2003). To explain the source and timing of the highflux of salty water (highest discharge in early summer),these investigators proposed a seasonal shift in thefreshwater–seawater interface in response to the annualrecharge cycle (highest recharge in the early spring). Asthe water table rises in response to enhanced recharge,more freshwater is drawn from further inland displacingsalty groundwater and causing it to be dischargedoffshore (Fig. 2). The opposite pattern occurs during theperiod of maximum evapotranspiration in the summerand saltwater flows into the aquifer. A numerical modelpredicted that there would be a time lag of up to3 months for the interface to move through the aquifer.So the observed maximum discharge in the earlysummer is thought to have been generated by themaximum water table thickness that occurred followinggreatest recharge in the early spring.
From an oceanographic point of view, the total (fresh+seawater) SGD flux is important because all flowenhances biogeochemical inputs. Hydrologists havetypically been concerned with the freshwater flow andseawater intrusion along the coast. The terrestrial andoceanic forces overlap in space and time; thus, measuredfluid flow through coastal sediments is a result ofcomposite forcing.
Seepage meter records that display temporal trends innear-shore regions typically show variations thatcorrespond to the tidal period in that area. For example,Lee (1977) showed that seepage rates were distinctlyhigher at low tide. While some correspondence betweentides and seepage flux is typical for near-shore
Fig. 2. Schematic showing how interface position may shift within an unconsoHerzberg relation. Because of differences in density between freshwater anchanges in the interface that would be magnified by ∼40× (density of fresh w(2005).
environments, the timing of the seepage maximumrelative to the tidal stage varies depending upon thehydrologic setting at each location. Some areas show adirect inverse correlation between seepage rate and tidalstage, probably reflecting a modulation of a terrestriallydriven flow by changing hydrostatic pressure. In othersituations, tidal pumping or wave set-up recharges thecoastal aquifer with seawater on the flood tide thatdischarges seaward at a later time, complicating thissimple picture (Nielsen, 1990).
Recent investigations have reported longer-term(weeks to months) tidally modulated cycles in seepagebased on continuous measurements of the groundwatertracers radon and methane (Kim and Hwang, 2002) andautomated seepage meter observations. Taniguchi(2002) continuously recorded seepage flux rates inOsaka Bay, Japan, from May to August 2001 andanalyzed these data via the Fast Fourier Transfer (FFT)method to discern the dominant periods of variation(Fig. 3). Both studies showed that there is not only asemi-diurnal to diurnal tidal relationship to SGD butalso a semi-monthly variation in flow reflecting theneap–spring lunar cycle. Superimposed on this predict-able behavior in tidally driven response, are variations interrestrial hydrologic parameters (water table height,etc.). This terrestrial influence showed up in tracer datafrom Korea, where Kim and Hwang (2002) noted thatgroundwater discharge was more limited in the dryseason when the aquifer was not recharging. Theseresults demonstrate the overlapping nature betweenterrestrial and marine SGD forcing components.
In the coastal zone, discharges influenced byterrestrial and marine forces are typically coincident intime and space but may differ significantly in
lidated aquifer in response to aquifer head level according to Ghyben–d seawater, seasonal changes in recharge will generate correspondingater divided by the difference in densities). Diagram fromMichael et al.
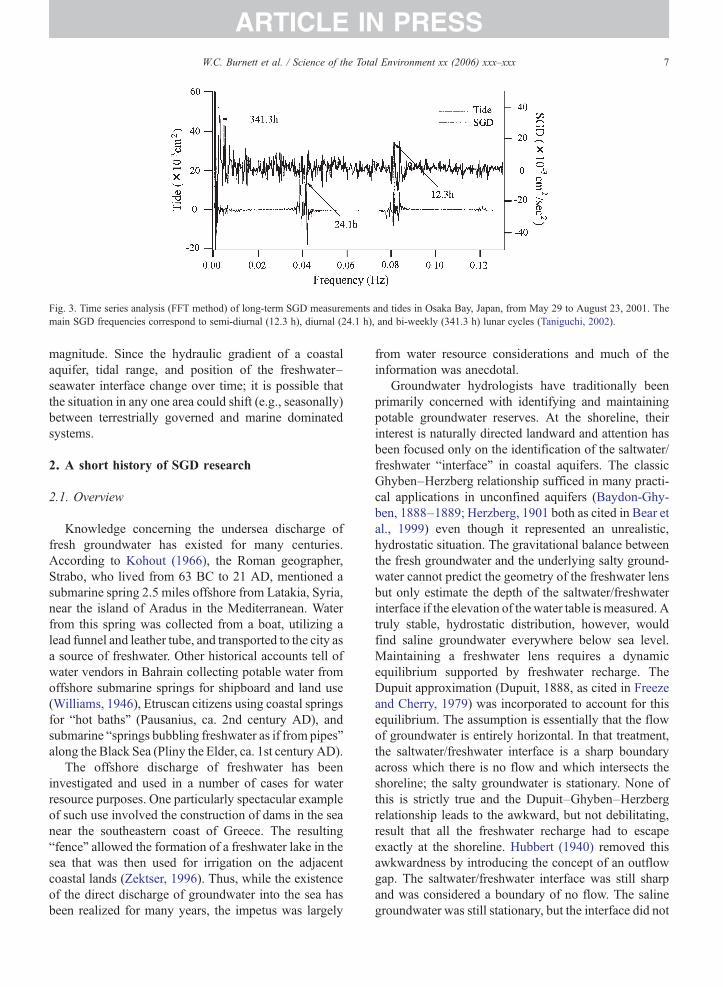
Fig. 3. Time series analysis (FFT method) of long-term SGD measurements and tides in Osaka Bay, Japan, from May 29 to August 23, 2001. Themain SGD frequencies correspond to semi-diurnal (12.3 h), diurnal (24.1 h), and bi-weekly (341.3 h) lunar cycles (Taniguchi, 2002).
7W.C. Burnett et al. / Science of the Total Environment xx (2006) xxx–xxx
ARTICLE IN PRESS
magnitude. Since the hydraulic gradient of a coastalaquifer, tidal range, and position of the freshwater–seawater interface change over time; it is possible thatthe situation in any one area could shift (e.g., seasonally)between terrestrially governed and marine dominatedsystems.
2. A short history of SGD research
2.1. Overview
Knowledge concerning the undersea discharge offresh groundwater has existed for many centuries.According to Kohout (1966), the Roman geographer,Strabo, who lived from 63 BC to 21 AD, mentioned asubmarine spring 2.5 miles offshore from Latakia, Syria,near the island of Aradus in the Mediterranean. Waterfrom this spring was collected from a boat, utilizing alead funnel and leather tube, and transported to the city asa source of freshwater. Other historical accounts tell ofwater vendors in Bahrain collecting potable water fromoffshore submarine springs for shipboard and land use(Williams, 1946), Etruscan citizens using coastal springsfor “hot baths” (Pausanius, ca. 2nd century AD), andsubmarine “springs bubbling freshwater as if from pipes”along the Black Sea (Pliny the Elder, ca. 1st century AD).
The offshore discharge of freshwater has beeninvestigated and used in a number of cases for waterresource purposes. One particularly spectacular exampleof such use involved the construction of dams in the seanear the southeastern coast of Greece. The resulting“fence” allowed the formation of a freshwater lake in thesea that was then used for irrigation on the adjacentcoastal lands (Zektser, 1996). Thus, while the existenceof the direct discharge of groundwater into the sea hasbeen realized for many years, the impetus was largely
from water resource considerations and much of theinformation was anecdotal.
Groundwater hydrologists have traditionally beenprimarily concerned with identifying and maintainingpotable groundwater reserves. At the shoreline, theirinterest is naturally directed landward and attention hasbeen focused only on the identification of the saltwater/freshwater “interface” in coastal aquifers. The classicGhyben–Herzberg relationship sufficed in many practi-cal applications in unconfined aquifers (Baydon-Ghy-ben, 1888–1889; Herzberg, 1901 both as cited in Bear etal., 1999) even though it represented an unrealistic,hydrostatic situation. The gravitational balance betweenthe fresh groundwater and the underlying salty ground-water cannot predict the geometry of the freshwater lensbut only estimate the depth of the saltwater/freshwaterinterface if the elevation of the water table is measured. Atruly stable, hydrostatic distribution, however, wouldfind saline groundwater everywhere below sea level.Maintaining a freshwater lens requires a dynamicequilibrium supported by freshwater recharge. TheDupuit approximation (Dupuit, 1888, as cited in Freezeand Cherry, 1979) was incorporated to account for thisequilibrium. The assumption is essentially that the flowof groundwater is entirely horizontal. In that treatment,the saltwater/freshwater interface is a sharp boundaryacross which there is no flow and which intersects theshoreline; the salty groundwater is stationary. None ofthis is strictly true and the Dupuit–Ghyben–Herzbergrelationship leads to the awkward, but not debilitating,result that all the freshwater recharge had to escapeexactly at the shoreline. Hubbert (1940) removed thisawkwardness by introducing the concept of an outflowgap. The saltwater/freshwater interface was still sharpand was considered a boundary of no flow. The salinegroundwater was still stationary, but the interface did not
8 W.C. Burnett et al. / Science of the Total Environment xx (2006) xxx–xxx
ARTICLE IN PRESS
intersect the shoreline. Rather it intersected the sea floorat some distance from shore leaving, a band or gapthrough which the fresh groundwater could escape intothe sea. If the depth of the saltwater/freshwater interfaceat the shoreline is measured, the Dupuit–Ghyben–Herzberg methodology can be used, with this as aboundary condition, to calculate the width of the outflowgap (Vacher, 1988). Potential theory (Henry, 1964) andthe Glover solution (Glover, 1964) provided indepen-dent means to calculate the size of this gap and theposition of the saltwater/freshwater interface. Theserepresentations, simplified for calculational necessity,unfortunately could lead one to the mistaken impressionthat SGD is entirely freshwater derived from land.Hubbert (1940) had also pointed out that the interfacewas not necessarily sharp and that the cyclic flow of saltygroundwater needed to maintain a transition zone mustbe driven by the presence of hydraulic gradients in thesaline groundwater. It thus became recognized that thesaline groundwater is not necessarily stationary.
With the development of numerical models, itbecame possible to calculate more realistic hydrody-namics. One early numerical model calculated thegroundwater seepage into lakes (McBride and Pfann-kuch, 1975). While this lacustrine seepage had nothingto do with the saltwater/freshwater interface, it isnoteworthy because it was the first use of the notionof an exponential decrease to approximate the distribu-tion of seepage rates offshore.
The next generations of models allowed the salinegroundwater to circulate in response to hydraulicgradients but still prohibited flow across the “interface”although the interface itself might move. Modern, two-phase models recognize that water can cross isohalinesand can track both salt and water in the continuum, andthey allow density driven circulation as well as flowsdriven by other hydraulic gradients onshore. Bear et al.(1999) provide a review of the complex array of modernmodels. There is, however, a serious lack of data tocalibrate and verify such models. In addition, dispersionis usually incorporated in a single parameter although itis recognized that numerous processes can cause saltdispersion on a wide range of time and space scales.
It is important to recognize that the Ghyben–Herzbergrelationship cannot be used to estimate the width of thefresh–salt interface for semi-confined artesian aquifers.Such aquifers can leak freshwater or salt–freshwatermixtures for considerable distances from shore.
SGD was neglected scientifically for many yearsbecause of the difficulty in assessment and the per-ception that the process was unimportant. This percep-tion is changing. Within the last several years there has
emerged recognition that in some cases, groundwaterdischarge into the sea may be both volumetrically andchemically important (Johannes, 1980). A decade afterJohannes' benchmark paper, Valiela and D'Elia (1990)published a compilation on the subject and stated, “Weare very much in the exploratory stage of this field.” Theexploration has continued and there is now growingagreement that groundwater inputs can be chemicallyand ecologically important to coastal waters.
As a result of this increased interest, the ScientificCommittee on Oceanic Research (SCOR) formed twoworking groups (WG) to examine this emerging fieldmore closely. SCOR WG-112 (“Magnitude of Subma-rine Groundwater Discharge and its Influence onCoastal Oceanographic Processes”) was established in1997 to “define more accurately and completely howsubmarine groundwater discharge influences chemicaland biological processes in the coastal ocean” (Burnett,1999). This group published a special issue ofBiogeochemistry on SGD in 2003 as their final product(Burnett et al., 2003b). WG-114 (“Transport andReaction in Permeable Marine Sediments”) was estab-lished in 1999 to investigate the importance of fluid flowthrough permeable sediments to local and globalbiogeochemical cycling and its influence on surround-ing environments (Boudreau et al., 2001). That groupcompleted its work in 2003 with the introduction of acontinuing conference on the subject, the “GordonResearch Conference on Permeable Sediments”.
2.2. Worldwide studies
Taniguchi et al. (2002) presented a review of all avai-lable studies that have attempted to estimate the magni-tude of SGD or indicated that SGD in the area studied wassignificant. This compilation was limited to literaturecitations of discharge estimates using seepage meters,piezometers, and/or geochemical/geophysical tracers.
Locations of specific SGD estimates showed thatmany independent studies have been performed on theeast coast of the United States, Europe, Japan, andOceania (Fig. 4). Fewer studies have been done on thewest coast of the US, South America, and Hawaii. Theywere unable to find any quantitative data from Africa,India, or China, though indications of groundwaterdischarge have been reported for Bangladesh (Moore,1997) and Kenya (Kitheka, 1988).
2.3. The IAEA/UNESCO SGD initiative
An initiative on SGD was developed by theInternational Atomic Energy Agency (IAEA) and
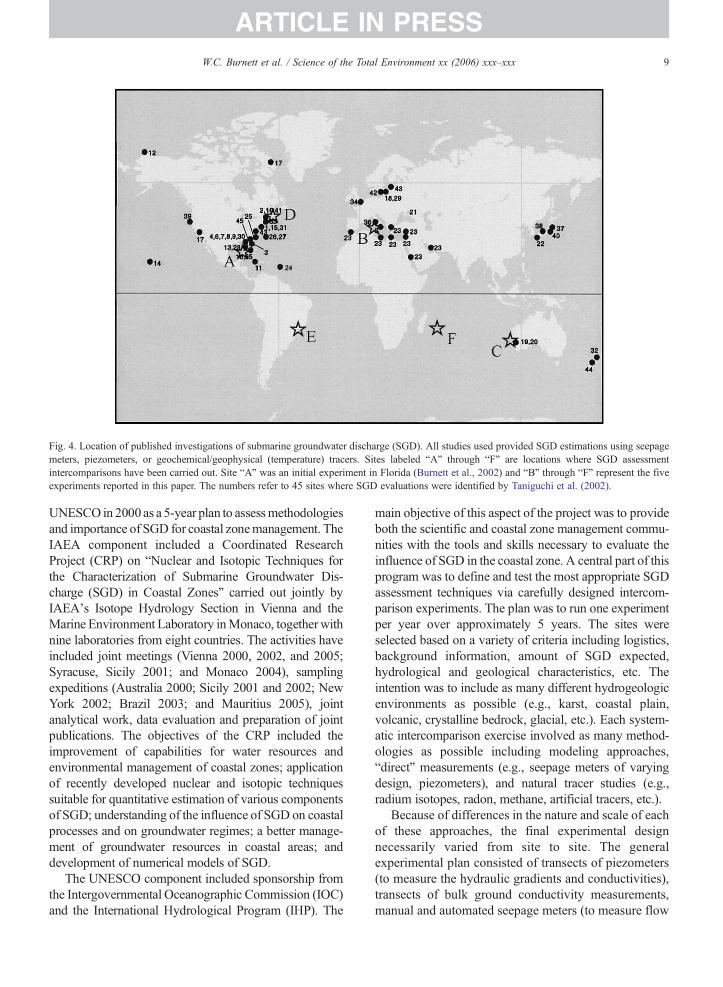
Fig. 4. Location of published investigations of submarine groundwater discharge (SGD). All studies used provided SGD estimations using seepagemeters, piezometers, or geochemical/geophysical (temperature) tracers. Sites labeled “A” through “F” are locations where SGD assessmentintercomparisons have been carried out. Site “A” was an initial experiment in Florida (Burnett et al., 2002) and “B” through “F” represent the fiveexperiments reported in this paper. The numbers refer to 45 sites where SGD evaluations were identified by Taniguchi et al. (2002).
9W.C. Burnett et al. / Science of the Total Environment xx (2006) xxx–xxx
ARTICLE IN PRESS
UNESCO in 2000 as a 5-year plan to assessmethodologiesand importance of SGD for coastal zonemanagement. TheIAEA component included a Coordinated ResearchProject (CRP) on “Nuclear and Isotopic Techniques forthe Characterization of Submarine Groundwater Dis-charge (SGD) in Coastal Zones” carried out jointly byIAEA's Isotope Hydrology Section in Vienna and theMarine Environment Laboratory inMonaco, togetherwithnine laboratories from eight countries. The activities haveincluded joint meetings (Vienna 2000, 2002, and 2005;Syracuse, Sicily 2001; and Monaco 2004), samplingexpeditions (Australia 2000; Sicily 2001 and 2002; NewYork 2002; Brazil 2003; and Mauritius 2005), jointanalytical work, data evaluation and preparation of jointpublications. The objectives of the CRP included theimprovement of capabilities for water resources andenvironmental management of coastal zones; applicationof recently developed nuclear and isotopic techniquessuitable for quantitative estimation of various componentsof SGD; understanding of the influence of SGD on coastalprocesses and on groundwater regimes; a better manage-ment of groundwater resources in coastal areas; anddevelopment of numerical models of SGD.
The UNESCO component included sponsorship fromthe Intergovernmental Oceanographic Commission (IOC)and the International Hydrological Program (IHP). The
main objective of this aspect of the project was to provideboth the scientific and coastal zone management commu-nities with the tools and skills necessary to evaluate theinfluence of SGD in the coastal zone. A central part of thisprogram was to define and test the most appropriate SGDassessment techniques via carefully designed intercom-parison experiments. The plan was to run one experimentper year over approximately 5 years. The sites wereselected based on a variety of criteria including logistics,background information, amount of SGD expected,hydrological and geological characteristics, etc. Theintention was to include as many different hydrogeologicenvironments as possible (e.g., karst, coastal plain,volcanic, crystalline bedrock, glacial, etc.). Each system-atic intercomparison exercise involved as many method-ologies as possible including modeling approaches,“direct” measurements (e.g., seepage meters of varyingdesign, piezometers), and natural tracer studies (e.g.,radium isotopes, radon, methane, artificial tracers, etc.).
Because of differences in the nature and scale of eachof these approaches, the final experimental designnecessarily varied from site to site. The generalexperimental plan consisted of transects of piezometers(to measure the hydraulic gradients and conductivities),transects of bulk ground conductivity measurements,manual and automated seepage meters (to measure flow
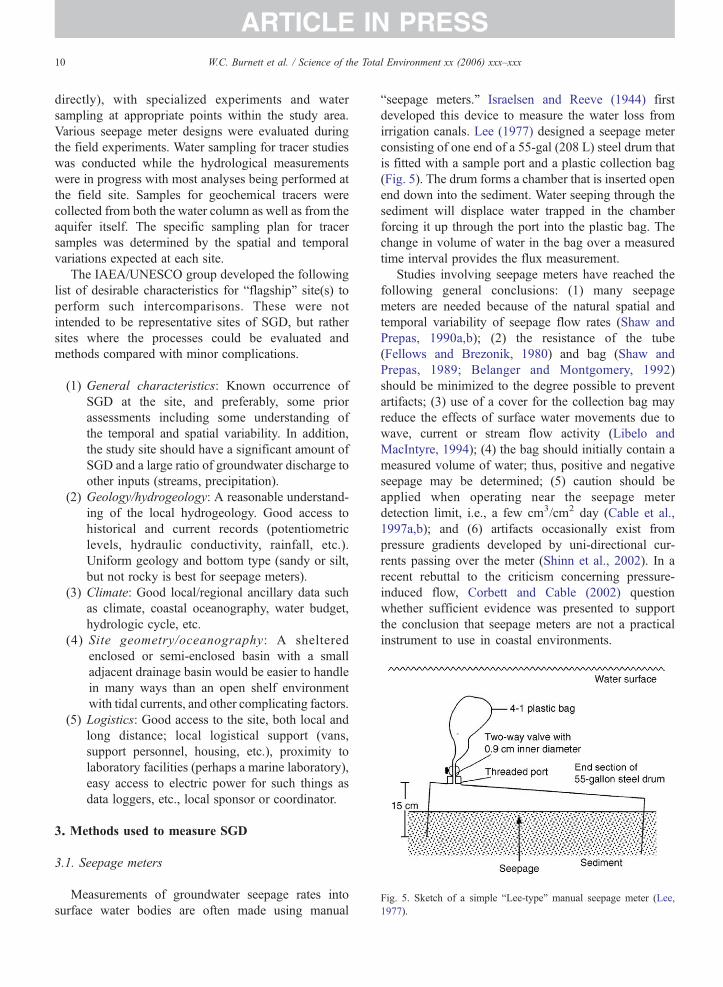
Fig. 5. Sketch of a simple “Lee-type” manual seepage meter (Lee,1977).
10 W.C. Burnett et al. / Science of the Total Environment xx (2006) xxx–xxx
ARTICLE IN PRESS
directly), with specialized experiments and watersampling at appropriate points within the study area.Various seepage meter designs were evaluated duringthe field experiments. Water sampling for tracer studieswas conducted while the hydrological measurementswere in progress with most analyses being performed atthe field site. Samples for geochemical tracers werecollected from both the water column as well as from theaquifer itself. The specific sampling plan for tracersamples was determined by the spatial and temporalvariations expected at each site.
The IAEA/UNESCO group developed the followinglist of desirable characteristics for “flagship” site(s) toperform such intercomparisons. These were notintended to be representative sites of SGD, but rathersites where the processes could be evaluated andmethods compared with minor complications.
(1) General characteristics: Known occurrence ofSGD at the site, and preferably, some priorassessments including some understanding ofthe temporal and spatial variability. In addition,the study site should have a significant amount ofSGD and a large ratio of groundwater discharge toother inputs (streams, precipitation).
(2) Geology/hydrogeology: A reasonable understand-ing of the local hydrogeology. Good access tohistorical and current records (potentiometriclevels, hydraulic conductivity, rainfall, etc.).Uniform geology and bottom type (sandy or silt,but not rocky is best for seepage meters).
(3) Climate: Good local/regional ancillary data suchas climate, coastal oceanography, water budget,hydrologic cycle, etc.
(4) Site geometry/oceanography: A shelteredenclosed or semi-enclosed basin with a smalladjacent drainage basin would be easier to handlein many ways than an open shelf environmentwith tidal currents, and other complicating factors.
(5) Logistics: Good access to the site, both local andlong distance; local logistical support (vans,support personnel, housing, etc.), proximity tolaboratory facilities (perhaps a marine laboratory),easy access to electric power for such things asdata loggers, etc., local sponsor or coordinator.
3. Methods used to measure SGD
3.1. Seepage meters
Measurements of groundwater seepage rates intosurface water bodies are often made using manual
“seepage meters.” Israelsen and Reeve (1944) firstdeveloped this device to measure the water loss fromirrigation canals. Lee (1977) designed a seepage meterconsisting of one end of a 55-gal (208 L) steel drum thatis fitted with a sample port and a plastic collection bag(Fig. 5). The drum forms a chamber that is inserted openend down into the sediment. Water seeping through thesediment will displace water trapped in the chamberforcing it up through the port into the plastic bag. Thechange in volume of water in the bag over a measuredtime interval provides the flux measurement.
Studies involving seepage meters have reached thefollowing general conclusions: (1) many seepagemeters are needed because of the natural spatial andtemporal variability of seepage flow rates (Shaw andPrepas, 1990a,b); (2) the resistance of the tube(Fellows and Brezonik, 1980) and bag (Shaw andPrepas, 1989; Belanger and Montgomery, 1992)should be minimized to the degree possible to preventartifacts; (3) use of a cover for the collection bag mayreduce the effects of surface water movements due towave, current or stream flow activity (Libelo andMacIntyre, 1994); (4) the bag should initially contain ameasured volume of water; thus, positive and negativeseepage may be determined; (5) caution should beapplied when operating near the seepage meterdetection limit, i.e., a few cm3/cm2 day (Cable et al.,1997a,b); and (6) artifacts occasionally exist frompressure gradients developed by uni-directional cur-rents passing over the meter (Shinn et al., 2002). In arecent rebuttal to the criticism concerning pressure-induced flow, Corbett and Cable (2002) questionwhether sufficient evidence was presented to supportthe conclusion that seepage meters are not a practicalinstrument to use in coastal environments.
11W.C. Burnett et al. / Science of the Total Environment xx (2006) xxx–xxx
ARTICLE IN PRESS
Perhaps the most serious disadvantage for coastalzone studies is that manual seepage meters are verylabor intensive. In order to obtain the groundwaterdischarge rate automatically and continuously, varioustypes of automated seepage meters have been devel-oped. Fukuo (1986), Cherkauer and McBride (1988),and Boyle (1994) describe remote installations ofseepage meters from the surface of various waterbodies. Sayles and Dickinson (1990) constructed aseepage meter that was a benthic chamber for thesampling and analysis of seepage through sedimentsassociated with hydrothermal vents. Another example ofan automated approach for measurement of SGDseepage is the heat-pulse device described by Taniguchiand Fukuo (1993) and a similar meter constructed byKrupa et al. (1998).
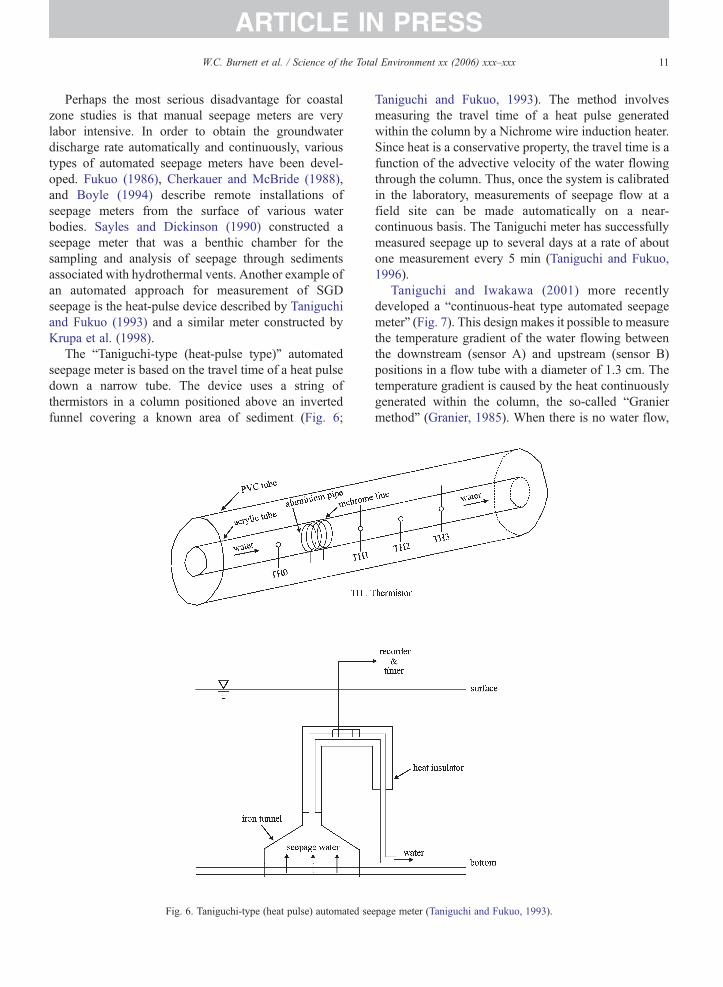
The “Taniguchi-type (heat-pulse type)” automatedseepage meter is based on the travel time of a heat pulsedown a narrow tube. The device uses a string ofthermistors in a column positioned above an invertedfunnel covering a known area of sediment (Fig. 6;
Fig. 6. Taniguchi-type (heat pulse) automated se
Taniguchi and Fukuo, 1993). The method involvesmeasuring the travel time of a heat pulse generatedwithin the column by a Nichrome wire induction heater.Since heat is a conservative property, the travel time is afunction of the advective velocity of the water flowingthrough the column. Thus, once the system is calibratedin the laboratory, measurements of seepage flow at afield site can be made automatically on a near-continuous basis. The Taniguchi meter has successfullymeasured seepage up to several days at a rate of aboutone measurement every 5 min (Taniguchi and Fukuo,1996).
Taniguchi and Iwakawa (2001) more recentlydeveloped a “continuous-heat type automated seepagemeter” (Fig. 7). This design makes it possible to measurethe temperature gradient of the water flowing betweenthe downstream (sensor A) and upstream (sensor B)positions in a flow tube with a diameter of 1.3 cm. Thetemperature gradient is caused by the heat continuouslygenerated within the column, the so-called “Graniermethod” (Granier, 1985). When there is no water flow,
epage meter (Taniguchi and Fukuo, 1993).
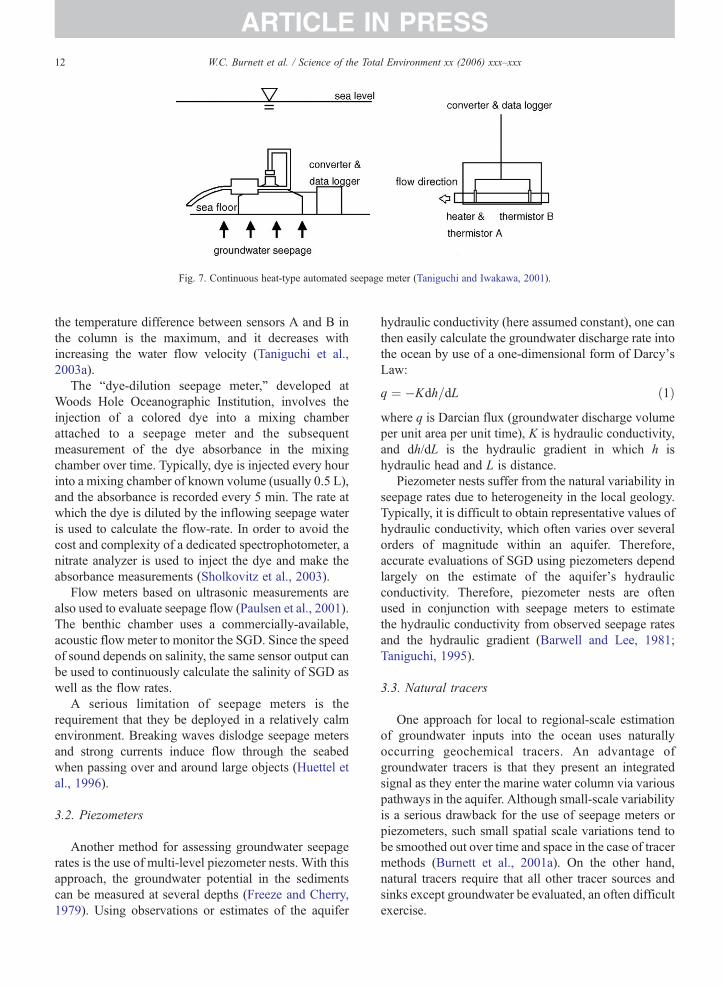
Fig. 7. Continuous heat-type automated seepage meter (Taniguchi and Iwakawa, 2001).
12 W.C. Burnett et al. / Science of the Total Environment xx (2006) xxx–xxx
ARTICLE IN PRESS
the temperature difference between sensors A and B inthe column is the maximum, and it decreases withincreasing the water flow velocity (Taniguchi et al.,2003a).
The “dye-dilution seepage meter,” developed atWoods Hole Oceanographic Institution, involves theinjection of a colored dye into a mixing chamberattached to a seepage meter and the subsequentmeasurement of the dye absorbance in the mixingchamber over time. Typically, dye is injected every hourinto a mixing chamber of known volume (usually 0.5 L),and the absorbance is recorded every 5 min. The rate atwhich the dye is diluted by the inflowing seepage wateris used to calculate the flow-rate. In order to avoid thecost and complexity of a dedicated spectrophotometer, anitrate analyzer is used to inject the dye and make theabsorbance measurements (Sholkovitz et al., 2003).
Flow meters based on ultrasonic measurements arealso used to evaluate seepage flow (Paulsen et al., 2001).The benthic chamber uses a commercially-available,acoustic flow meter to monitor the SGD. Since the speedof sound depends on salinity, the same sensor output canbe used to continuously calculate the salinity of SGD aswell as the flow rates.
A serious limitation of seepage meters is therequirement that they be deployed in a relatively calmenvironment. Breaking waves dislodge seepage metersand strong currents induce flow through the seabedwhen passing over and around large objects (Huettel etal., 1996).
3.2. Piezometers
Another method for assessing groundwater seepagerates is the use of multi-level piezometer nests. With thisapproach, the groundwater potential in the sedimentscan be measured at several depths (Freeze and Cherry,1979). Using observations or estimates of the aquifer
hydraulic conductivity (here assumed constant), one canthen easily calculate the groundwater discharge rate intothe ocean by use of a one-dimensional form of Darcy'sLaw:
q ¼ �Kdh=dL ð1Þwhere q is Darcian flux (groundwater discharge volumeper unit area per unit time), K is hydraulic conductivity,and dh/dL is the hydraulic gradient in which h ishydraulic head and L is distance.
Piezometer nests suffer from the natural variability inseepage rates due to heterogeneity in the local geology.Typically, it is difficult to obtain representative values ofhydraulic conductivity, which often varies over severalorders of magnitude within an aquifer. Therefore,accurate evaluations of SGD using piezometers dependlargely on the estimate of the aquifer's hydraulicconductivity. Therefore, piezometer nests are oftenused in conjunction with seepage meters to estimatethe hydraulic conductivity from observed seepage ratesand the hydraulic gradient (Barwell and Lee, 1981;Taniguchi, 1995).
3.3. Natural tracers
One approach for local to regional-scale estimationof groundwater inputs into the ocean uses naturallyoccurring geochemical tracers. An advantage ofgroundwater tracers is that they present an integratedsignal as they enter the marine water column via variouspathways in the aquifer. Although small-scale variabilityis a serious drawback for the use of seepage meters orpiezometers, such small spatial scale variations tend tobe smoothed out over time and space in the case of tracermethods (Burnett et al., 2001a). On the other hand,natural tracers require that all other tracer sources andsinks except groundwater be evaluated, an often difficultexercise.
13W.C. Burnett et al. / Science of the Total Environment xx (2006) xxx–xxx
ARTICLE IN PRESS
Natural geochemical tracers have been applied in twoways to evaluate groundwater discharge rates into theocean. First is the use of enriched geochemical tracers inthe groundwater relative to the seawater. In other words,the concentration of a solute in the receiving water bodyis attributed to inputs of that component derived onlyfrom groundwater (Moore, 1996; Cable et al., 1996a,b;Porcelli and Swarzenski, 2003). A second approach isthe use of vertical profiles of the geochemical composi-tions in sediment pore waters under the assumption thatits distribution can be described by a vertical, one-dimensional advection–diffusion model (e.g., Cornett etal., 1989; Vanek, 1993). However, this is usually limitedto the case of homogeneous media.
Over the past few years, several studies used naturalradium isotopes and 222Rn to assess groundwaterdischarge into the ocean (Burnett et al., 1990, 1996;Ellins et al., 1990; Moore, 1996; Rama and Moore,1996; Cable et al., 1996a,b, 2004; Moore and Shaw,1998; Corbett et al., 1999; Hussain et al., 1999; Corbettet al., 2000; Moore, 2000; Krest et al., 2000; Charette etal., 2001; Kelly and Moran, 2002; Kim and Hwang,2002; Burnett et al., 2002; Burnett and Dulaiova, 2003;Garrison et al., 2003; Krest and Harvey, 2003; Crotwelland Moore, 2003; Moore and Wilson, 2005). Ideally, inorder to provide a detectable signal, a groundwatertracer should be greatly enriched in the discharginggroundwater relative to coastal marine waters, conser-vative, and easy to measure. Radium isotopes and radonhave been shown to meet these criteria fairly well andother natural tracer possibilities exist which may beexploited for groundwater discharge studies. In applyinggeochemical tracing techniques, several criteria must beassessed or defined, including boundary conditions (i.e.,area, volume), water and constituent sources and sinks,residence times of the surface water body, andconcentrations of the tracer. Sources may includeocean water, river water, groundwater, precipitation, insitu production, horizontal water column transport,sediment resuspension, or sediment diffusion. Sinks
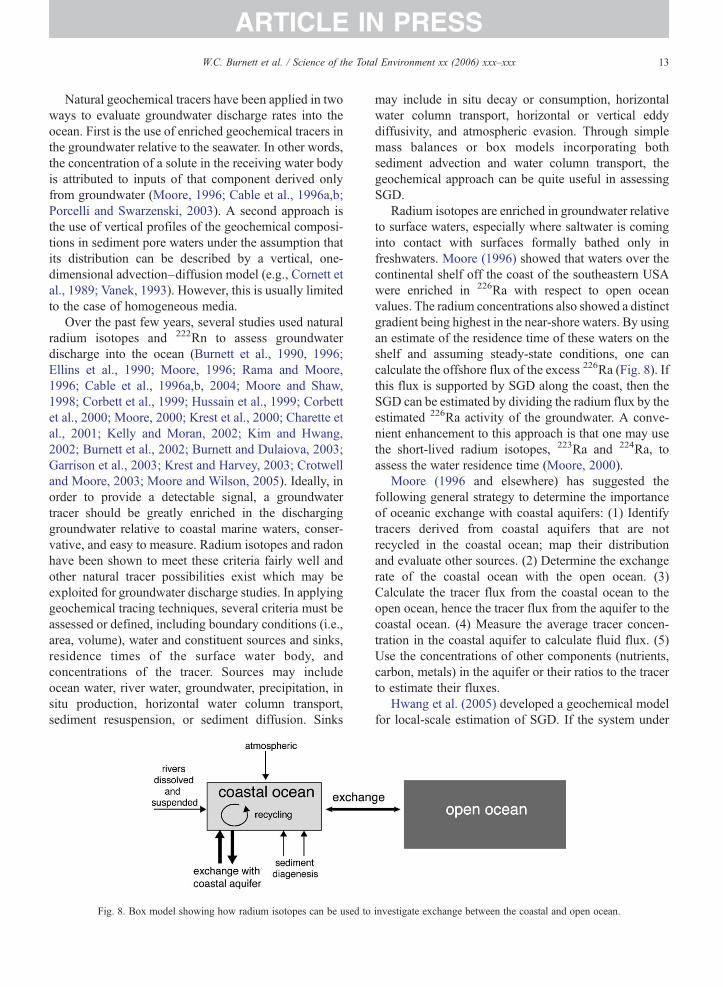
Fig. 8. Box model showing how radium isotopes can be used to
may include in situ decay or consumption, horizontalwater column transport, horizontal or vertical eddydiffusivity, and atmospheric evasion. Through simplemass balances or box models incorporating bothsediment advection and water column transport, thegeochemical approach can be quite useful in assessingSGD.
Radium isotopes are enriched in groundwater relativeto surface waters, especially where saltwater is cominginto contact with surfaces formally bathed only infreshwaters. Moore (1996) showed that waters over thecontinental shelf off the coast of the southeastern USAwere enriched in 226Ra with respect to open oceanvalues. The radium concentrations also showed a distinctgradient being highest in the near-shore waters. By usingan estimate of the residence time of these waters on theshelf and assuming steady-state conditions, one cancalculate the offshore flux of the excess 226Ra (Fig. 8). Ifthis flux is supported by SGD along the coast, then theSGD can be estimated by dividing the radium flux by theestimated 226Ra activity of the groundwater. A conve-nient enhancement to this approach is that one may usethe short-lived radium isotopes, 223Ra and 224Ra, toassess the water residence time (Moore, 2000).
Moore (1996 and elsewhere) has suggested thefollowing general strategy to determine the importanceof oceanic exchange with coastal aquifers: (1) Identifytracers derived from coastal aquifers that are notrecycled in the coastal ocean; map their distributionand evaluate other sources. (2) Determine the exchangerate of the coastal ocean with the open ocean. (3)Calculate the tracer flux from the coastal ocean to theopen ocean, hence the tracer flux from the aquifer to thecoastal ocean. (4) Measure the average tracer concen-tration in the coastal aquifer to calculate fluid flux. (5)Use the concentrations of other components (nutrients,carbon, metals) in the aquifer or their ratios to the tracerto estimate their fluxes.
Hwang et al. (2005) developed a geochemical modelfor local-scale estimation of SGD. If the system under
investigate exchange between the coastal and open ocean.
14 W.C. Burnett et al. / Science of the Total Environment xx (2006) xxx–xxx
ARTICLE IN PRESS
study is steady state, than radium additions are balancedby losses. Additions include radium fluxes fromsediment, river, and groundwater; losses are due tomixing and, in the case of 223Ra and 224Ra, radioactivedecay. Using a mass balance approach on a larger scalewith the long-lived isotopes 226Ra and 228Ra, Kim et al.(2005) determined that SGD-derived silicate fluxes tothe Yellow Sea were on the same order of magnitude asthe Si flux from the Yangtze River, the fifth largest riverin the world.
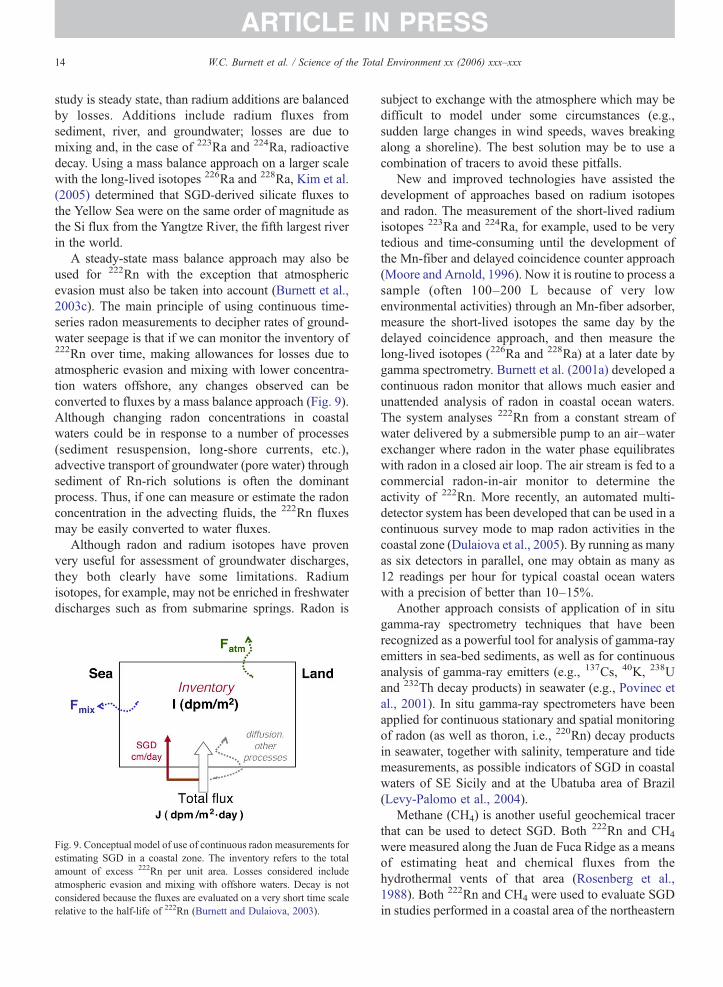
A steady-state mass balance approach may also beused for 222Rn with the exception that atmosphericevasion must also be taken into account (Burnett et al.,2003c). The main principle of using continuous time-series radon measurements to decipher rates of ground-water seepage is that if we can monitor the inventory of222Rn over time, making allowances for losses due toatmospheric evasion and mixing with lower concentra-tion waters offshore, any changes observed can beconverted to fluxes by a mass balance approach (Fig. 9).Although changing radon concentrations in coastalwaters could be in response to a number of processes(sediment resuspension, long-shore currents, etc.),advective transport of groundwater (pore water) throughsediment of Rn-rich solutions is often the dominantprocess. Thus, if one can measure or estimate the radonconcentration in the advecting fluids, the 222Rn fluxesmay be easily converted to water fluxes.
Although radon and radium isotopes have provenvery useful for assessment of groundwater discharges,they both clearly have some limitations. Radiumisotopes, for example, may not be enriched in freshwaterdischarges such as from submarine springs. Radon is
Fig. 9. Conceptual model of use of continuous radon measurements forestimating SGD in a coastal zone. The inventory refers to the totalamount of excess 222Rn per unit area. Losses considered includeatmospheric evasion and mixing with offshore waters. Decay is notconsidered because the fluxes are evaluated on a very short time scalerelative to the half-life of 222Rn (Burnett and Dulaiova, 2003).
subject to exchange with the atmosphere which may bedifficult to model under some circumstances (e.g.,sudden large changes in wind speeds, waves breakingalong a shoreline). The best solution may be to use acombination of tracers to avoid these pitfalls.
New and improved technologies have assisted thedevelopment of approaches based on radium isotopesand radon. The measurement of the short-lived radiumisotopes 223Ra and 224Ra, for example, used to be verytedious and time-consuming until the development ofthe Mn-fiber and delayed coincidence counter approach(Moore and Arnold, 1996). Now it is routine to process asample (often 100–200 L because of very lowenvironmental activities) through an Mn-fiber adsorber,measure the short-lived isotopes the same day by thedelayed coincidence approach, and then measure thelong-lived isotopes (226Ra and 228Ra) at a later date bygamma spectrometry. Burnett et al. (2001a) developed acontinuous radon monitor that allows much easier andunattended analysis of radon in coastal ocean waters.The system analyses 222Rn from a constant stream ofwater delivered by a submersible pump to an air–waterexchanger where radon in the water phase equilibrateswith radon in a closed air loop. The air stream is fed to acommercial radon-in-air monitor to determine theactivity of 222Rn. More recently, an automated multi-detector system has been developed that can be used in acontinuous survey mode to map radon activities in thecoastal zone (Dulaiova et al., 2005). By running as manyas six detectors in parallel, one may obtain as many as12 readings per hour for typical coastal ocean waterswith a precision of better than 10–15%.
Another approach consists of application of in situgamma-ray spectrometry techniques that have beenrecognized as a powerful tool for analysis of gamma-rayemitters in sea-bed sediments, as well as for continuousanalysis of gamma-ray emitters (e.g., 137Cs, 40K, 238Uand 232Th decay products) in seawater (e.g., Povinec etal., 2001). In situ gamma-ray spectrometers have beenapplied for continuous stationary and spatial monitoringof radon (as well as thoron, i.e., 220Rn) decay productsin seawater, together with salinity, temperature and tidemeasurements, as possible indicators of SGD in coastalwaters of SE Sicily and at the Ubatuba area of Brazil(Levy-Palomo et al., 2004).
Methane (CH4) is another useful geochemical tracerthat can be used to detect SGD. Both 222Rn and CH4
were measured along the Juan de Fuca Ridge as a meansof estimating heat and chemical fluxes from thehydrothermal vents of that area (Rosenberg et al.,1988). Both 222Rn and CH4 were used to evaluate SGDin studies performed in a coastal area of the northeastern
15W.C. Burnett et al. / Science of the Total Environment xx (2006) xxx–xxx
ARTICLE IN PRESS
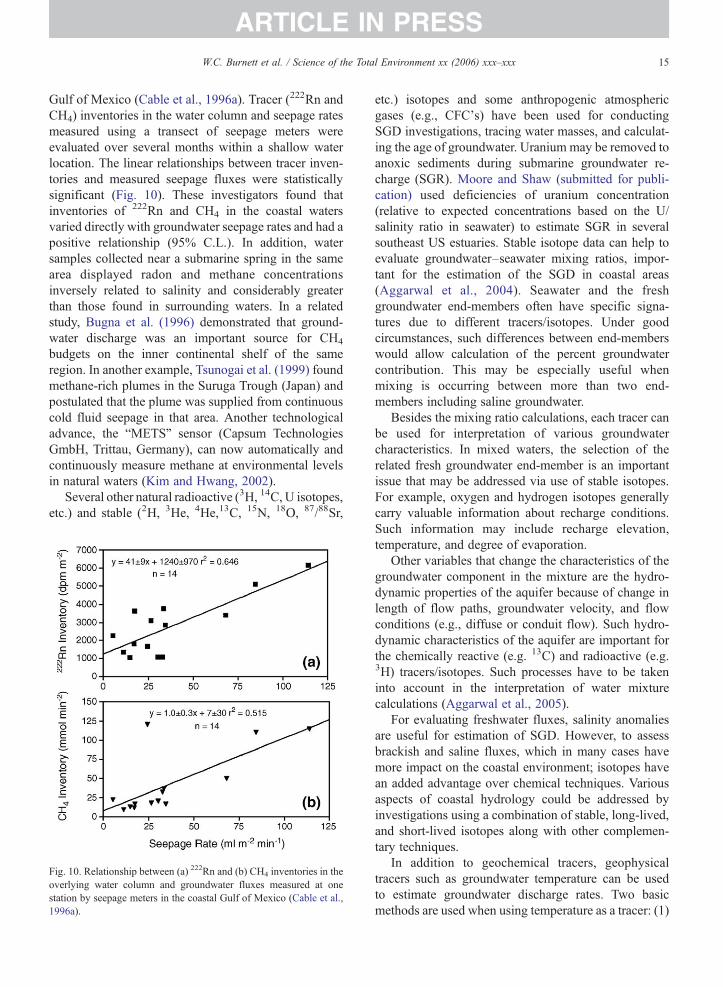
Gulf of Mexico (Cable et al., 1996a). Tracer (222Rn andCH4) inventories in the water column and seepage ratesmeasured using a transect of seepage meters wereevaluated over several months within a shallow waterlocation. The linear relationships between tracer inven-tories and measured seepage fluxes were statisticallysignificant (Fig. 10). These investigators found thatinventories of 222Rn and CH4 in the coastal watersvaried directly with groundwater seepage rates and had apositive relationship (95% C.L.). In addition, watersamples collected near a submarine spring in the samearea displayed radon and methane concentrationsinversely related to salinity and considerably greaterthan those found in surrounding waters. In a relatedstudy, Bugna et al. (1996) demonstrated that ground-water discharge was an important source for CH4
budgets on the inner continental shelf of the sameregion. In another example, Tsunogai et al. (1999) foundmethane-rich plumes in the Suruga Trough (Japan) andpostulated that the plume was supplied from continuouscold fluid seepage in that area. Another technologicaladvance, the “METS” sensor (Capsum TechnologiesGmbH, Trittau, Germany), can now automatically andcontinuously measure methane at environmental levelsin natural waters (Kim and Hwang, 2002).
Several other natural radioactive (3H, 14C, U isotopes,etc.) and stable (2H, 3He, 4He,13C, 15N, 18O, 87/88Sr,
Fig. 10. Relationship between (a) 222Rn and (b) CH4 inventories in theoverlying water column and groundwater fluxes measured at onestation by seepage meters in the coastal Gulf of Mexico (Cable et al.,1996a).
etc.) isotopes and some anthropogenic atmosphericgases (e.g., CFC's) have been used for conductingSGD investigations, tracing water masses, and calculat-ing the age of groundwater. Uranium may be removed toanoxic sediments during submarine groundwater re-charge (SGR). Moore and Shaw (submitted for publi-cation) used deficiencies of uranium concentration(relative to expected concentrations based on the U/salinity ratio in seawater) to estimate SGR in severalsoutheast US estuaries. Stable isotope data can help toevaluate groundwater–seawater mixing ratios, impor-tant for the estimation of the SGD in coastal areas(Aggarwal et al., 2004). Seawater and the freshgroundwater end-members often have specific signa-tures due to different tracers/isotopes. Under goodcircumstances, such differences between end-memberswould allow calculation of the percent groundwatercontribution. This may be especially useful whenmixing is occurring between more than two end-members including saline groundwater.
Besides the mixing ratio calculations, each tracer canbe used for interpretation of various groundwatercharacteristics. In mixed waters, the selection of therelated fresh groundwater end-member is an importantissue that may be addressed via use of stable isotopes.For example, oxygen and hydrogen isotopes generallycarry valuable information about recharge conditions.Such information may include recharge elevation,temperature, and degree of evaporation.
Other variables that change the characteristics of thegroundwater component in the mixture are the hydro-dynamic properties of the aquifer because of change inlength of flow paths, groundwater velocity, and flowconditions (e.g., diffuse or conduit flow). Such hydro-dynamic characteristics of the aquifer are important forthe chemically reactive (e.g. 13C) and radioactive (e.g.3H) tracers/isotopes. Such processes have to be takeninto account in the interpretation of water mixturecalculations (Aggarwal et al., 2005).
For evaluating freshwater fluxes, salinity anomaliesare useful for estimation of SGD. However, to assessbrackish and saline fluxes, which in many cases havemore impact on the coastal environment; isotopes havean added advantage over chemical techniques. Variousaspects of coastal hydrology could be addressed byinvestigations using a combination of stable, long-lived,and short-lived isotopes along with other complemen-tary techniques.
In addition to geochemical tracers, geophysicaltracers such as groundwater temperature can be usedto estimate groundwater discharge rates. Two basicmethods are used when using temperature as a tracer: (1)
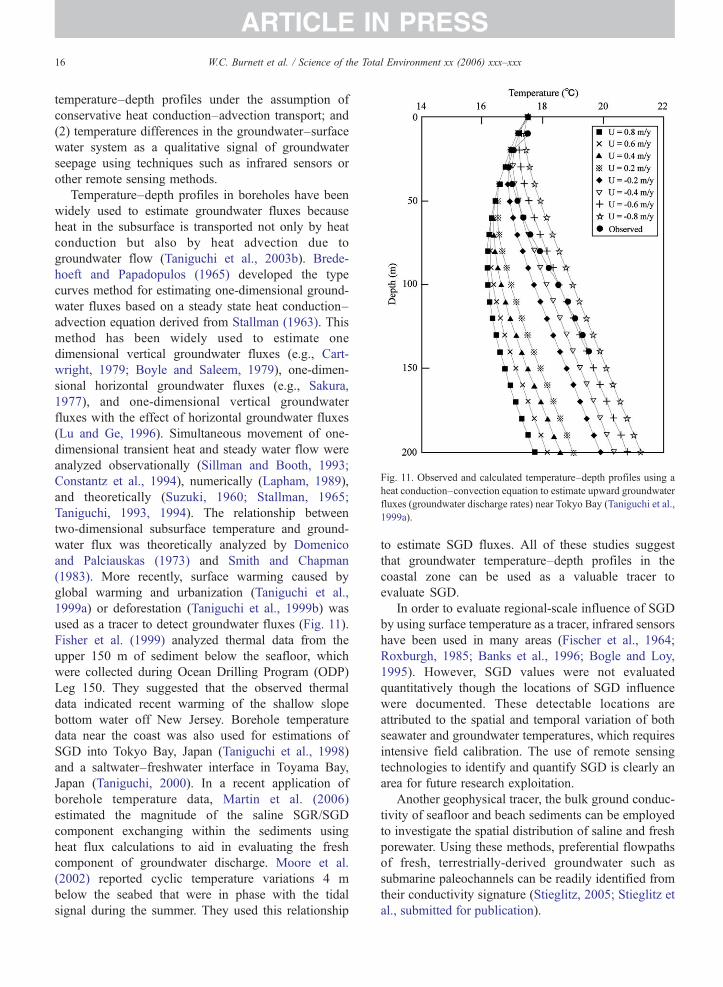
Fig. 11. Observed and calculated temperature–depth profiles using aheat conduction–convection equation to estimate upward groundwaterfluxes (groundwater discharge rates) near Tokyo Bay (Taniguchi et al.,1999a).
16 W.C. Burnett et al. / Science of the Total Environment xx (2006) xxx–xxx
ARTICLE IN PRESS
temperature–depth profiles under the assumption ofconservative heat conduction–advection transport; and(2) temperature differences in the groundwater–surfacewater system as a qualitative signal of groundwaterseepage using techniques such as infrared sensors orother remote sensing methods.
Temperature–depth profiles in boreholes have beenwidely used to estimate groundwater fluxes becauseheat in the subsurface is transported not only by heatconduction but also by heat advection due togroundwater flow (Taniguchi et al., 2003b). Brede-hoeft and Papadopulos (1965) developed the typecurves method for estimating one-dimensional ground-water fluxes based on a steady state heat conduction–advection equation derived from Stallman (1963). Thismethod has been widely used to estimate onedimensional vertical groundwater fluxes (e.g., Cart-wright, 1979; Boyle and Saleem, 1979), one-dimen-sional horizontal groundwater fluxes (e.g., Sakura,1977), and one-dimensional vertical groundwaterfluxes with the effect of horizontal groundwater fluxes(Lu and Ge, 1996). Simultaneous movement of one-dimensional transient heat and steady water flow wereanalyzed observationally (Sillman and Booth, 1993;Constantz et al., 1994), numerically (Lapham, 1989),and theoretically (Suzuki, 1960; Stallman, 1965;Taniguchi, 1993, 1994). The relationship betweentwo-dimensional subsurface temperature and ground-water flux was theoretically analyzed by Domenicoand Palciauskas (1973) and Smith and Chapman(1983). More recently, surface warming caused byglobal warming and urbanization (Taniguchi et al.,1999a) or deforestation (Taniguchi et al., 1999b) wasused as a tracer to detect groundwater fluxes (Fig. 11).Fisher et al. (1999) analyzed thermal data from theupper 150 m of sediment below the seafloor, whichwere collected during Ocean Drilling Program (ODP)Leg 150. They suggested that the observed thermaldata indicated recent warming of the shallow slopebottom water off New Jersey. Borehole temperaturedata near the coast was also used for estimations ofSGD into Tokyo Bay, Japan (Taniguchi et al., 1998)and a saltwater–freshwater interface in Toyama Bay,Japan (Taniguchi, 2000). In a recent application ofborehole temperature data, Martin et al. (2006)estimated the magnitude of the saline SGR/SGDcomponent exchanging within the sediments usingheat flux calculations to aid in evaluating the freshcomponent of groundwater discharge. Moore et al.(2002) reported cyclic temperature variations 4 mbelow the seabed that were in phase with the tidalsignal during the summer. They used this relationship
to estimate SGD fluxes. All of these studies suggestthat groundwater temperature–depth profiles in thecoastal zone can be used as a valuable tracer toevaluate SGD.
In order to evaluate regional-scale influence of SGDby using surface temperature as a tracer, infrared sensorshave been used in many areas (Fischer et al., 1964;Roxburgh, 1985; Banks et al., 1996; Bogle and Loy,1995). However, SGD values were not evaluatedquantitatively though the locations of SGD influencewere documented. These detectable locations areattributed to the spatial and temporal variation of bothseawater and groundwater temperatures, which requiresintensive field calibration. The use of remote sensingtechnologies to identify and quantify SGD is clearly anarea for future research exploitation.
Another geophysical tracer, the bulk ground conduc-tivity of seafloor and beach sediments can be employedto investigate the spatial distribution of saline and freshporewater. Using these methods, preferential flowpathsof fresh, terrestrially-derived groundwater such assubmarine paleochannels can be readily identified fromtheir conductivity signature (Stieglitz, 2005; Stieglitz etal., submitted for publication).
17W.C. Burnett et al. / Science of the Total Environment xx (2006) xxx–xxx
ARTICLE IN PRESS
3.4. Water balance approaches
The water balance equation for a basin has also beenused to estimate fresh SGD and may be described asfollows:
P ¼ ET þ DS þ DG þ dS ð2Þwhere P is precipitation, ET is evapotranspiration, DS issurface discharge, DG is fresh groundwater discharge,and dS is the change in water storage. Over extendedperiods (i.e., years), dS is usually assumed to benegligible. Therefore, one needs to know precisely theprecipitation, evapotranspiration and surface runoff foran accurate estimation of DG by this approach.
Basin-scale estimations of fresh SGD via a waterbalance method have been performed in many places,e.g., Perth, Australia (1.0×10⁸ m3/year; Allen, 1976),Santa Barbara (1.2×10⁵ m3/year; Muir, 1968), LongIsland, New York (2.5× 10⁷ m3/year; Pluhowskiand Kantrowitz, 1964), and in the Adriatic Sea(1.7×10¹¹ m3/year; Sekulic and Vertacnik, 1996).When both the area and volume of SGD are known,one can calculate the fresh SGD flux. For example in thecase of the Adriatic Sea (Sekulic and Vertacnik, 1996),the mean fresh SGD flux of 0.68 m/year is calculatedfrom the estimated fresh SGD volume and the dischargearea. More typically, the area over which SGD occurs isunknown. Therefore, the SGD volume or sometimes“volume of SGD per unit length of shoreline”(Robinson, 1996; Sellinger, 1995) is used for waterbalance studies, making it difficult to compare with theobserved (local) SGD estimates shown as Darcy's flux(e.g., cm3/cm2 s, cm/s, m/year).
Water budget calculations, while relatively simple,are typically imprecise for fresh groundwater dischargeestimations because uncertainties associated with valuesused in the calculations are often of the same magnitudeas the discharge being evaluated. For instance in theglobal water budget constructed by Garrels andMacKenzie (1971), the estimated fresh SGD is about6% of estimated evaporation from the land, which isabout the same order as the uncertainty of theevaporation rate. Moreover, these estimates do notinclude the saltwater that mixes into the aquifer andoften comprises a significant fraction of total SGD.
In a study designed to test the effects of climatechange on groundwater discharge, Oberdorfer (1996)concluded that use of a water budget is an adequate firstapproach for assessing expected changes in simplegroundwater basins. On the other hand, numericalmodeling provides a better quantitative estimate ofclimate change perturbations when dealing with basins
characterized by multiple sources and sinks. Anotherwater balance approach using a budget based on thechange in soil moisture has been performed for TomalesBay, California (Oberdorfer et al., 1990). Their resultwas comparable to the result obtained by moretraditional water balance estimations.
3.5. Hydrograph separation techniques
The hydrograph separation technique is based on theassumption that the amount of fresh groundwaterentering streams can be obtained via a hydrograph sepa-ration and this estimate may be extrapolated to thecoastal zone. This technique was used by Zektser andDzhamalov (1981) for the Pacific Ocean rim, byBoldovski (1996) in eastern Russia, by Williams andPinder (1990) in the local coastal plain stream in SouthCarolina, and by Zektzer et al. (1973) for global-scaleestimation of fresh SGD. Two approaches were used toseparate the hydrograph for estimating the freshgroundwater flow component. The first method is simplyto assign a base flow due to the shape of the hydrograph.This technique can be performed several ways includingthe unit graph method (Bouwer, 1978; Zektzer et al.,1973). However, a problem with this simple approach isevaluating baseline conditions; often the baselinechanges depending on time, space, and prevailing hydro-logical conditions. The hydrograph separation techniquefor large-scale SGD estimates applies only to coastalareas with well-developed stream networks and to zonesof relatively shallow, mainly freshwater aquifers.
As with the water balance method, the uncertaintiesin the hydrograph separation terms are often on the sameorder of magnitude as the discharge being evaluated. Forinstance, the estimation of groundwater discharge incentral and eastern European countries showed theaverage of estimated fresh groundwater discharge (6%of total water flow) is about 12% of the estimatedevaporation (Zektser and Loaiciga, 1993). This estimateis close to the uncertainty usually assigned to evapora-tion estimates.
The second method of hydrograph separation is theuse of geochemical end-member concentrations. Usual-ly, water and geochemical mass balances in a river areshown as follows:
DT ¼ DS þ DG ð3Þ
CTDT ¼ CSDS þ CGDG ð4Þwhere D and C are the discharge rate and geochemicalconcentrations, respectively, and subscripts T, S and Grepresent the total, surface water and groundwater
18 W.C. Burnett et al. / Science of the Total Environment xx (2006) xxx–xxx
ARTICLE IN PRESS
components. From those two equations, measured DT,CT, CS, and CG, we can solve for the two unknownvalues, DS and DG.
Recently, not only surface water–groundwater sep-aration (Fritz et al., 1976), but also the separation ofthree water components, namely groundwater, surfacewater and soil water, has been studied by using threedifferent compositions of these end-members (Tanakaand Ono, 1998). This method may also be applicable forseparation of SGD into the fresh, mixing, and seawatercomponents of SGD if one can identify tracers withsufficient sensitivity and resolution.
Another problem of the hydrograph separation forestimating direct groundwater discharge into the oceanis that gauging stations for measuring the discharge ratein rivers are always located some finite distanceupstream from the coast to avoid tidal effects. Therefore,the groundwater discharge downstream of the gaugingstation is excluded (Buddemeier, 1996).
3.6. Theoretical analysis and numerical simulations
Offshore seepage rates were described by anexponentially decreasing function, as explained byMcBride and Pfannkuch (1975), who investigated thedistribution of groundwater seepage rate throughlakebeds using numerical models. Bokuniewicz (1992)questioned the use of such an exponentially decreasingfunction and developed an analytical solution for SGDas follows:
q ¼ ðKi=pkÞln½cothðpxk=4lÞ� ð5Þwhere q is vertical groundwater seepage flux, K isvertical hydraulic conductivity (assumed constant), i ishydraulic gradient, k is the square root of the ratio of thevertical to the horizontal hydraulic conductivity, l isaquifer thickness and x is the distance from theshoreline. The author concluded that a single exponen-tial function underestimated the analytical solution ofSGD both near-shore and far from shore, and over-estimated the SGD at intermediate distances. Furtherdetails concerning the derivation and use of thisequation may be found in Bokuniewicz (1992). Thisrelationship between an exponential approximation andanalytical solution is similar to the contrast between anexponential representation and the numerical examplescalculated by McBride and Pfannkuch (1975).
Fukuo and Kaihotsu (1988) made a theoreticalanalysis of groundwater seepage rates for areas with agentle slope into surface water bodies by use ofconformal mapping techniques. They used the x-axisalong with the slope (the x-axis in Bokuniewicz, 1992 is
horizontal), and found that in an unconfined aquifermost of the groundwater flows through a near-shoreinterface between surface water and groundwater.Equipotential and streamlines in the near-shore vicinityof the aquifer and the distribution of specific dischargethrough the sediment with different slopes demonstratethis point (Fig. 12a; Fukuo and Kaihotsu, 1988).Analytical solutions indicate that SGD decreasesexponentially with distance from the coast and that therate of decrease is greater when a gentler slope is present(Fig. 12b). Interactions between surface waters andgroundwaters also have been studied numerically byWinter (1983, 1986, 1996), Anderson and Chen (1993)and Nield et al. (1994). Linderfelt and Turner (2001)numerically evaluated the net advected groundwaterdischarge to a saline estuary while Smith and Turner(2001) numerically evaluated the role of the density-driven re-circulation component in the overall ground-water discharge to the same saline estuary.
Although modeling approaches using packages suchas MODFLOW (McDonald and Harbaugh, 1984) arewidely used for the analysis of basin-scale groundwaterhydrology, all of these techniques have certain limita-tions. For example, aquifer systems are usuallyheterogeneous, and it is difficult to obtain sufficientrepresentative values such as hydraulic conductivity andporosity to adequately characterize this heterogeneity.Hydraulic conductivity often varies over several ordersof magnitude within short distances. Spatial andtemporal variations for boundary conditions are alsorequired for hydrological modeling, but this informationis often hampered by our ability to acquire adequatefield data within the time frame of a typical study.
When estimating nutrient transport by groundwater,it is important to evaluate the groundwater capture zoneat near-shore zones. Taniguchi et al. (1999c) analyzedthe groundwater seepage rate into Lake Biwa, Japan, toevaluate the capture zone of groundwater entering asurface water body. Transient numerical simulationswere made using a two-dimensional (2-D) unsaturated–saturated model with three-layered sediments. Theyconcluded that calculated values agreed well withobserved groundwater seepage rates when the thicknessof the aquifer was estimated to be 110 m. This modelalso agreed with the capture zone results estimated bystable isotope data (δ18O and deuterium). It is clear thataquifer thickness and hydraulic conductivity values arethe most important factors for reliable estimates ofgroundwater seepage rates by theoretical and numericalanalysis.
All the above described numerical models simulategroundwater flow. A complementary numerical
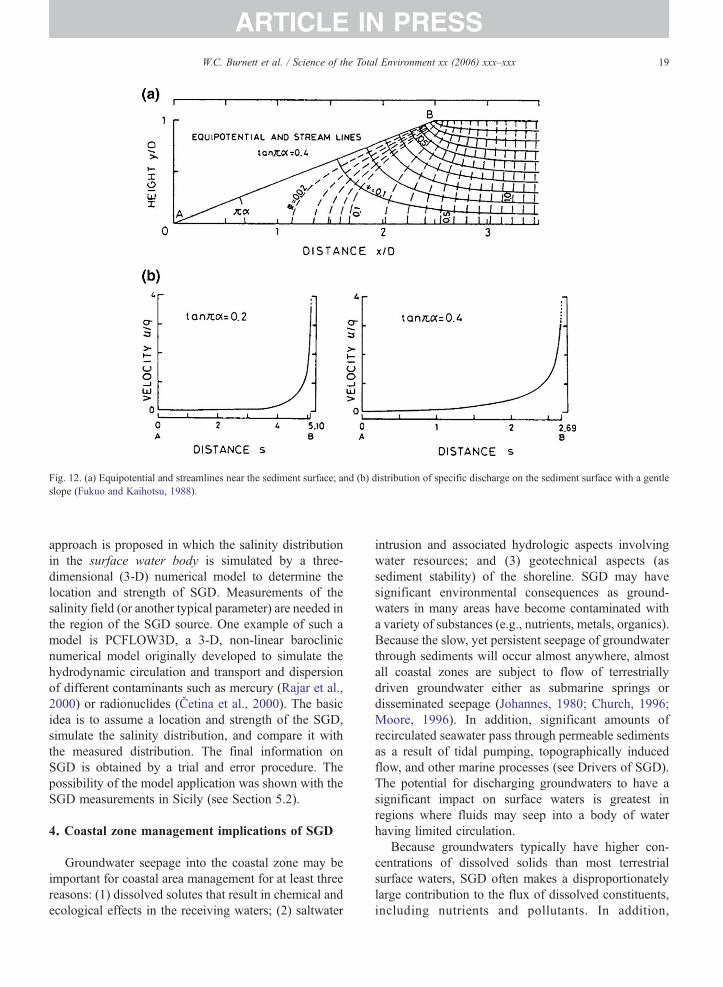
Fig. 12. (a) Equipotential and streamlines near the sediment surface; and (b) distribution of specific discharge on the sediment surface with a gentleslope (Fukuo and Kaihotsu, 1988).
19W.C. Burnett et al. / Science of the Total Environment xx (2006) xxx–xxx
ARTICLE IN PRESS
approach is proposed in which the salinity distributionin the surface water body is simulated by a three-dimensional (3-D) numerical model to determine thelocation and strength of SGD. Measurements of thesalinity field (or another typical parameter) are needed inthe region of the SGD source. One example of such amodel is PCFLOW3D, a 3-D, non-linear baroclinicnumerical model originally developed to simulate thehydrodynamic circulation and transport and dispersionof different contaminants such as mercury (Rajar et al.,2000) or radionuclides (Četina et al., 2000). The basicidea is to assume a location and strength of the SGD,simulate the salinity distribution, and compare it withthe measured distribution. The final information onSGD is obtained by a trial and error procedure. Thepossibility of the model application was shown with theSGD measurements in Sicily (see Section 5.2).
4. Coastal zone management implications of SGD
Groundwater seepage into the coastal zone may beimportant for coastal area management for at least threereasons: (1) dissolved solutes that result in chemical andecological effects in the receiving waters; (2) saltwater
intrusion and associated hydrologic aspects involvingwater resources; and (3) geotechnical aspects (assediment stability) of the shoreline. SGD may havesignificant environmental consequences as ground-waters in many areas have become contaminated witha variety of substances (e.g., nutrients, metals, organics).Because the slow, yet persistent seepage of groundwaterthrough sediments will occur almost anywhere, almostall coastal zones are subject to flow of terrestriallydriven groundwater either as submarine springs ordisseminated seepage (Johannes, 1980; Church, 1996;Moore, 1996). In addition, significant amounts ofrecirculated seawater pass through permeable sedimentsas a result of tidal pumping, topographically inducedflow, and other marine processes (see Drivers of SGD).The potential for discharging groundwaters to have asignificant impact on surface waters is greatest inregions where fluids may seep into a body of waterhaving limited circulation.
Because groundwaters typically have higher con-centrations of dissolved solids than most terrestrialsurface waters, SGD often makes a disproportionatelylarge contribution to the flux of dissolved constituents,including nutrients and pollutants. In addition,
20 W.C. Burnett et al. / Science of the Total Environment xx (2006) xxx–xxx
ARTICLE IN PRESS
discharging groundwater interacts with and influencesthe recirculation of seawater, which can affect coastalwater quality and nutrient supplies to near-shore benthichabitats, coastal wetlands, breeding and nestinggrounds. Thus, one of the more important implicationsfor coastal zone managers concerns nutrient (or othersolute) loading to near-shore waters. Impacts in thecoastal zone from these inputs could be the basis forland-use planning and may place limits on development.
Hwang et al. (2005) estimated SGD using a varietyof tracers including 222Rn and radium isotopes intoBangdu Bay, a semi-enclosed embayment on theKorean volcanic island, Jeju. Their estimated SGDinputs of 120–180 m3 m−2 year−1 are much higherthan those reported from typical continental margins.The nutrient fluxes from SGD were about 90%, 20%,and 80% of the total input (excluding inputs from openocean water) for dissolved inorganic nitrogen, phos-phorus, and silica, respectively. The authors concludedthat these excess nutrient inputs from SGD are themajor sources of ‘‘new nutrients’’ to this bay and couldcontribute to eutrophication.
From a management standpoint, a key issue will bethe determination of whether SGD is of actual orprobable importance in an area of interest. Furthermore,managers must consider the relative importance of SGDamong the multiple factors considered in managementactivities. In this respect, coastal managers face thefollowing problems: (1) they may not be aware of thegrowing realization of the importance of SGD; (2) ifthey are aware, they may not know how to decidewhether or not SGD is relevant to their situation; and (3)if they do decide this is important, they may not knowhow to quantify it.
Since SGD is essentially “invisible,” the problem thatarises, from both a management and scientific stand-point, is determining how to avoid the error of ignoringan important process on the one hand, and wastingvaluable resources on an unimportant issue on the other.Where terrestrially driven SGD is a significant factor inmaintaining or altering coastal ecosystems, coastal zonemanagers will need to consider management of waterlevels and fluxes through controls on withdrawal oralterations in recharge patterns, as well as groundwaterquality management (e.g., through controls on land use,waste disposal, etc.). Such major interventions in thecoastal zone management system require a soundscientific justification and technical understanding thatdoes not currently exist.
How can a manager tell if SGDmay be important in aparticular area? Several potential, indirect indicators offreshwater submarine discharge have been suggested
but not yet widely applied. Its color, temperature,salinity, or some other geochemical fingerprint mightdistinguish the water itself. Escaping groundwater, forexample, might be stained red by the oxidation of iron orcolored by tiny gas bubbles. Because groundwater tendsto exist at the average annual temperature, cold-wateranomalies in the open water during the summer andwarm water anomalies during the winter, as might bedetected by infrared aerial photography, or a personwalking barefoot on the beach, can be an indicator ofSGD. Salinity anomalies have also long been used toidentify subsea freshwater seeps, and can also be used ata variety of scales from regional water budgets tovertical profiles at specific locations.
Particular site conditions may also provide clues tothe occurrence of SGD. The presence of coastal pondsor unconsolidated coastal bluffs, which may maintain ahigh hydraulic head near shore, may be otherindicators. Growths of freshwater coastal vegetationmay indicate regions of high SGD offshore. It has alsobeen suggested that the presence of barite, oxidizedshells, or beach rock may indicate the occurrence ofgroundwater discharges. In Great South Bay (NewYork, USA), there occurs a phenomenon known as“anchor ice,” in which the bay floor freezes while thesaline open waters of the bay are still ice-free. This isattributed to the presence of freshwater in the sedimentsmaintained by SGD. It is also reported to occur in theBaltic. Alternatively, in coastal areas that are coveredwith ice in the water, like the Schlei estuary in northernGermany, ice-free spots, called “wind-spots,” are foundabove the SGD of relatively warm freshwater. InEckernforde Bay (southeast Baltic Sea) pockmarks inthe fine-grained sediments of the sea floor have beenidentified as bathymetric expressions of groundwaterseeps (Schluter et al., 2000). If the SGD is greatenough, the water itself can be domed and “boiling”such at Crescent Beach Spring off Florida (Swarzenskiet al., 2002).
Managers must consider the relative relationshipsand priorities of SGD among the multiple factorsconsidered in management activities. This presents atleast two ways that current approaches to the study ofgroundwater discharge will need to be modified forsuch studies to be useful to managers: (1) The scale ofemphasis would be that of management areas —probably tens to hundreds of kilometers. By contrast,scientists are typically performing investigations at thelower end of this scale (although some tracerinvestigations work at scales of 10–100 km). (2)Scientists may study one area for years, oftenreflecting the typical 2–3 year grant cycle. Managers,
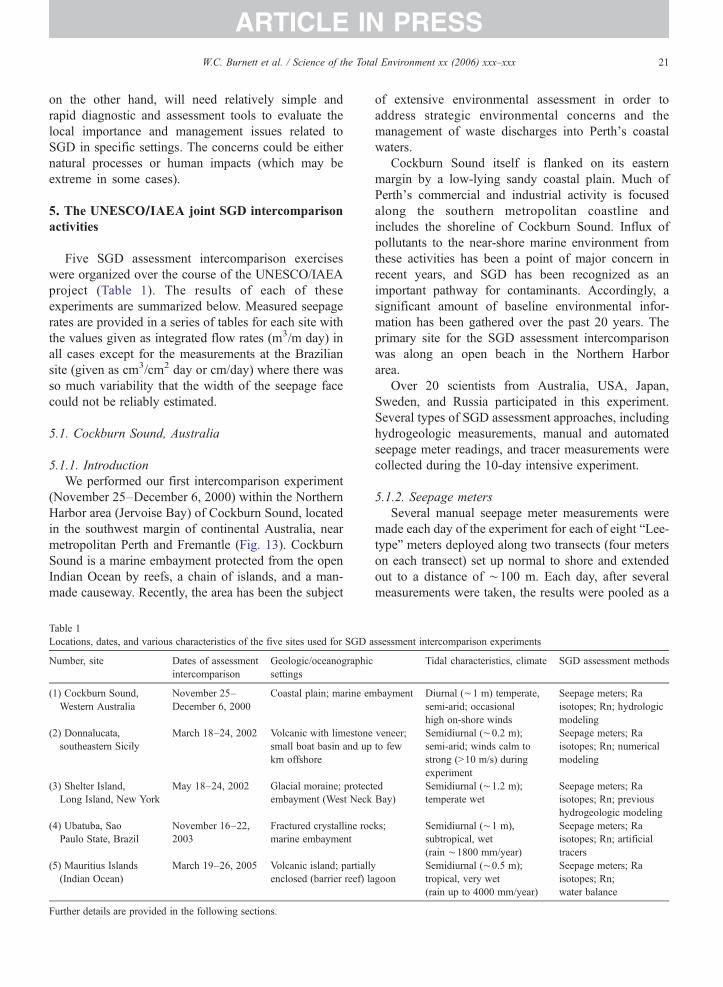
21W.C. Burnett et al. / Science of the Total Environment xx (2006) xxx–xxx
ARTICLE IN PRESS
on the other hand, will need relatively simple andrapid diagnostic and assessment tools to evaluate thelocal importance and management issues related toSGD in specific settings. The concerns could be eithernatural processes or human impacts (which may beextreme in some cases).
5. The UNESCO/IAEA joint SGD intercomparisonactivities
Five SGD assessment intercomparison exerciseswere organized over the course of the UNESCO/IAEAproject (Table 1). The results of each of theseexperiments are summarized below. Measured seepagerates are provided in a series of tables for each site withthe values given as integrated flow rates (m3/m day) inall cases except for the measurements at the Braziliansite (given as cm3/cm2 day or cm/day) where there wasso much variability that the width of the seepage facecould not be reliably estimated.
5.1. Cockburn Sound, Australia
5.1.1. IntroductionWe performed our first intercomparison experiment
(November 25–December 6, 2000) within the NorthernHarbor area (Jervoise Bay) of Cockburn Sound, locatedin the southwest margin of continental Australia, nearmetropolitan Perth and Fremantle (Fig. 13). CockburnSound is a marine embayment protected from the openIndian Ocean by reefs, a chain of islands, and a man-made causeway. Recently, the area has been the subject
Table 1Locations, dates, and various characteristics of the five sites used for SGD a
Number, site Dates of assessmentintercomparison
Geologic/oceanographicsettings
(1) Cockburn Sound,Western Australia
November 25–December 6, 2000
Coastal plain; marine em
(2) Donnalucata,southeastern Sicily
March 18–24, 2002 Volcanic with limestonesmall boat basin and upkm offshore
(3) Shelter Island,Long Island, New York
May 18–24, 2002 Glacial moraine; protectembayment (West Neck
(4) Ubatuba, SaoPaulo State, Brazil
November 16–22,2003
Fractured crystalline rocmarine embayment
(5) Mauritius Islands(Indian Ocean)
March 19–26, 2005 Volcanic island; partiallyenclosed (barrier reef) la
Further details are provided in the following sections.
of extensive environmental assessment in order toaddress strategic environmental concerns and themanagement of waste discharges into Perth's coastalwaters.
Cockburn Sound itself is flanked on its easternmargin by a low-lying sandy coastal plain. Much ofPerth's commercial and industrial activity is focusedalong the southern metropolitan coastline andincludes the shoreline of Cockburn Sound. Influx ofpollutants to the near-shore marine environment fromthese activities has been a point of major concern inrecent years, and SGD has been recognized as animportant pathway for contaminants. Accordingly, asignificant amount of baseline environmental infor-mation has been gathered over the past 20 years. Theprimary site for the SGD assessment intercomparisonwas along an open beach in the Northern Harborarea.
Over 20 scientists from Australia, USA, Japan,Sweden, and Russia participated in this experiment.Several types of SGD assessment approaches, includinghydrogeologic measurements, manual and automatedseepage meter readings, and tracer measurements werecollected during the 10-day intensive experiment.
5.1.2. Seepage metersSeveral manual seepage meter measurements were
made each day of the experiment for each of eight “Lee-type” meters deployed along two transects (four meterson each transect) set up normal to shore and extendedout to a distance of ∼100 m. Each day, after severalmeasurements were taken, the results were pooled as a
ssessment intercomparison experiments
Tidal characteristics, climate SGD assessment methods
bayment Diurnal (∼1 m) temperate,semi-arid; occasionalhigh on-shore winds
Seepage meters; Raisotopes; Rn; hydrologicmodeling
veneer;to few
Semidiurnal (∼0.2 m);semi-arid; winds calm tostrong (>10 m/s) duringexperiment
Seepage meters; Raisotopes; Rn; numericalmodeling
edBay)
Semidiurnal (∼1.2 m);temperate wet
Seepage meters; Raisotopes; Rn; previoushydrogeologic modeling
ks; Semidiurnal (∼1 m),subtropical, wet(rain ∼1800 mm/year)
Seepage meters; Raisotopes; Rn; artificialtracers
goonSemidiurnal (∼0.5 m);tropical, very wet(rain up to 4000 mm/year)
Seepage meters; Raisotopes; Rn;water balance
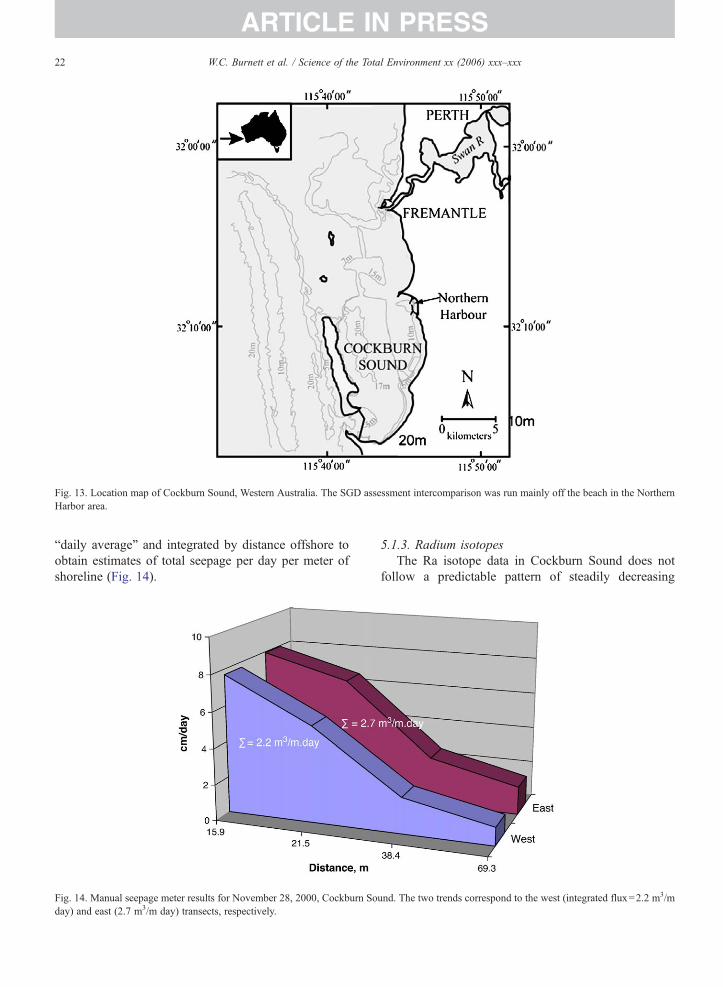
Fig. 13. Location map of Cockburn Sound, Western Australia. The SGD assessment intercomparison was run mainly off the beach in the NorthernHarbor area.
22 W.C. Burnett et al. / Science of the Total Environment xx (2006) xxx–xxx
ARTICLE IN PRESS
“daily average” and integrated by distance offshore toobtain estimates of total seepage per day per meter ofshoreline (Fig. 14).
Fig. 14. Manual seepage meter results for November 28, 2000, Cockburn Soday) and east (2.7 m3/m day) transects, respectively.
5.1.3. Radium isotopesThe Ra isotope data in Cockburn Sound does not
follow a predictable pattern of steadily decreasing
und. The two trends correspond to the west (integrated flux=2.2 m3/m
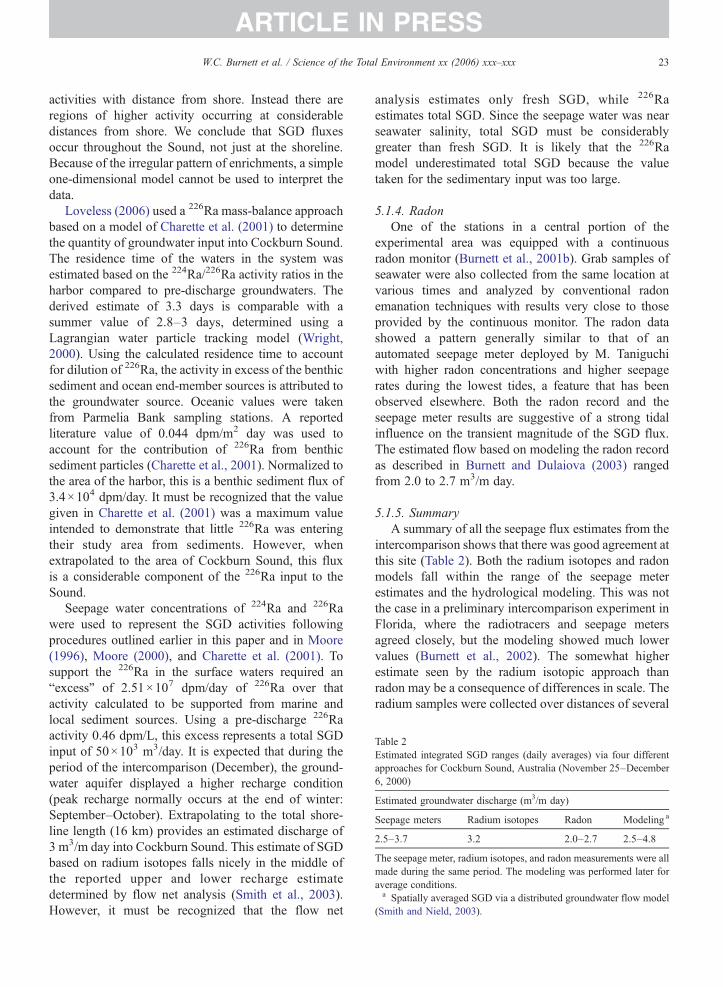
Table 2Estimated integrated SGD ranges (daily averages) via four differentapproaches for Cockburn Sound, Australia (November 25–December6, 2000)
Estimated groundwater discharge (m3/m day)
Seepage meters Radium isotopes Radon Modeling a
2.5–3.7 3.2 2.0–2.7 2.5–4.8
The seepage meter, radium isotopes, and radon measurements were allmade during the same period. The modeling was performed later foraverage conditions.a Spatially averaged SGD via a distributed groundwater flow model
(Smith and Nield, 2003).
23W.C. Burnett et al. / Science of the Total Environment xx (2006) xxx–xxx
ARTICLE IN PRESS
activities with distance from shore. Instead there areregions of higher activity occurring at considerabledistances from shore. We conclude that SGD fluxesoccur throughout the Sound, not just at the shoreline.Because of the irregular pattern of enrichments, a simpleone-dimensional model cannot be used to interpret thedata.
Loveless (2006) used a 226Ra mass-balance approachbased on a model of Charette et al. (2001) to determinethe quantity of groundwater input into Cockburn Sound.The residence time of the waters in the system wasestimated based on the 224Ra/226Ra activity ratios in theharbor compared to pre-discharge groundwaters. Thederived estimate of 3.3 days is comparable with asummer value of 2.8–3 days, determined using aLagrangian water particle tracking model (Wright,2000). Using the calculated residence time to accountfor dilution of 226Ra, the activity in excess of the benthicsediment and ocean end-member sources is attributed tothe groundwater source. Oceanic values were takenfrom Parmelia Bank sampling stations. A reportedliterature value of 0.044 dpm/m2 day was used toaccount for the contribution of 226Ra from benthicsediment particles (Charette et al., 2001). Normalized tothe area of the harbor, this is a benthic sediment flux of3.4×104 dpm/day. It must be recognized that the valuegiven in Charette et al. (2001) was a maximum valueintended to demonstrate that little 226Ra was enteringtheir study area from sediments. However, whenextrapolated to the area of Cockburn Sound, this fluxis a considerable component of the 226Ra input to theSound.
Seepage water concentrations of 224Ra and 226Rawere used to represent the SGD activities followingprocedures outlined earlier in this paper and in Moore(1996), Moore (2000), and Charette et al. (2001). Tosupport the 226Ra in the surface waters required an“excess” of 2.51×10⁷ dpm/day of 226Ra over thatactivity calculated to be supported from marine andlocal sediment sources. Using a pre-discharge 226Raactivity 0.46 dpm/L, this excess represents a total SGDinput of 50×103 m3/day. It is expected that during theperiod of the intercomparison (December), the ground-water aquifer displayed a higher recharge condition(peak recharge normally occurs at the end of winter:September–October). Extrapolating to the total shore-line length (16 km) provides an estimated discharge of3 m3/m day into Cockburn Sound. This estimate of SGDbased on radium isotopes falls nicely in the middle ofthe reported upper and lower recharge estimatedetermined by flow net analysis (Smith et al., 2003).However, it must be recognized that the flow net
analysis estimates only fresh SGD, while 226Raestimates total SGD. Since the seepage water was nearseawater salinity, total SGD must be considerablygreater than fresh SGD. It is likely that the 226Ramodel underestimated total SGD because the valuetaken for the sedimentary input was too large.
5.1.4. RadonOne of the stations in a central portion of the
experimental area was equipped with a continuousradon monitor (Burnett et al., 2001b). Grab samples ofseawater were also collected from the same location atvarious times and analyzed by conventional radonemanation techniques with results very close to thoseprovided by the continuous monitor. The radon datashowed a pattern generally similar to that of anautomated seepage meter deployed by M. Taniguchiwith higher radon concentrations and higher seepagerates during the lowest tides, a feature that has beenobserved elsewhere. Both the radon record and theseepage meter results are suggestive of a strong tidalinfluence on the transient magnitude of the SGD flux.The estimated flow based on modeling the radon recordas described in Burnett and Dulaiova (2003) rangedfrom 2.0 to 2.7 m3/m day.
5.1.5. SummaryA summary of all the seepage flux estimates from the
intercomparison shows that there was good agreement atthis site (Table 2). Both the radium isotopes and radonmodels fall within the range of the seepage meterestimates and the hydrological modeling. This was notthe case in a preliminary intercomparison experiment inFlorida, where the radiotracers and seepage metersagreed closely, but the modeling showed much lowervalues (Burnett et al., 2002). The somewhat higherestimate seen by the radium isotopic approach thanradon may be a consequence of differences in scale. Theradium samples were collected over distances of several
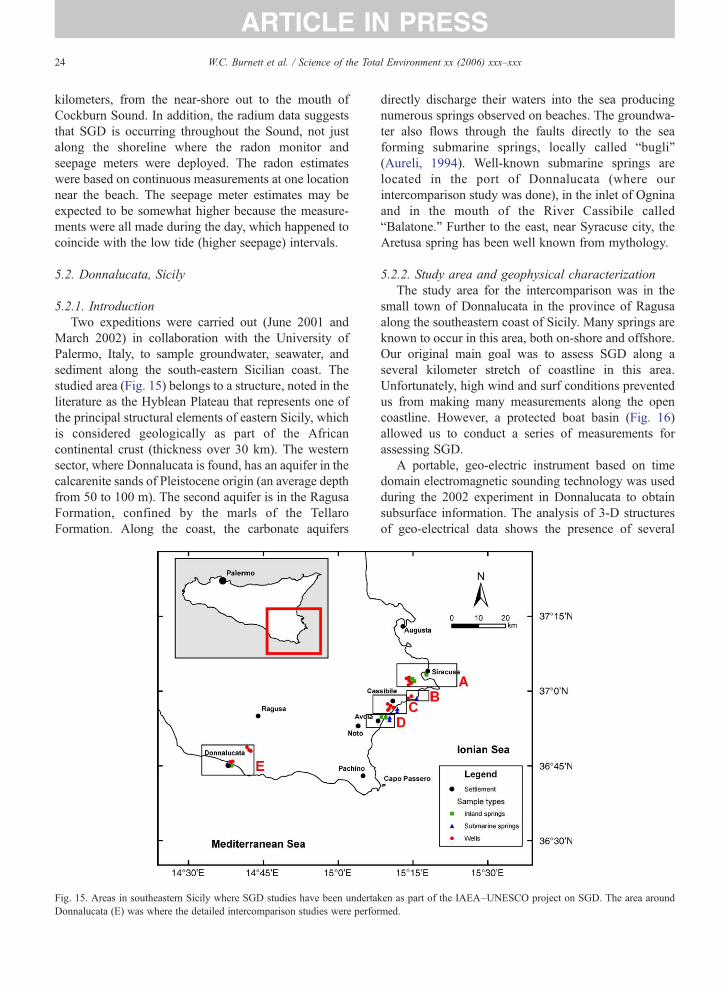
24 W.C. Burnett et al. / Science of the Total Environment xx (2006) xxx–xxx
ARTICLE IN PRESS
kilometers, from the near-shore out to the mouth ofCockburn Sound. In addition, the radium data suggeststhat SGD is occurring throughout the Sound, not justalong the shoreline where the radon monitor andseepage meters were deployed. The radon estimateswere based on continuous measurements at one locationnear the beach. The seepage meter estimates may beexpected to be somewhat higher because the measure-ments were all made during the day, which happened tocoincide with the low tide (higher seepage) intervals.
5.2. Donnalucata, Sicily
5.2.1. IntroductionTwo expeditions were carried out (June 2001 and
March 2002) in collaboration with the University ofPalermo, Italy, to sample groundwater, seawater, andsediment along the south-eastern Sicilian coast. Thestudied area (Fig. 15) belongs to a structure, noted in theliterature as the Hyblean Plateau that represents one ofthe principal structural elements of eastern Sicily, whichis considered geologically as part of the Africancontinental crust (thickness over 30 km). The westernsector, where Donnalucata is found, has an aquifer in thecalcarenite sands of Pleistocene origin (an average depthfrom 50 to 100 m). The second aquifer is in the RagusaFormation, confined by the marls of the TellaroFormation. Along the coast, the carbonate aquifers
Fig. 15. Areas in southeastern Sicily where SGD studies have been undertaDonnalucata (E) was where the detailed intercomparison studies were perfo
directly discharge their waters into the sea producingnumerous springs observed on beaches. The groundwa-ter also flows through the faults directly to the seaforming submarine springs, locally called “bugli”(Aureli, 1994). Well-known submarine springs arelocated in the port of Donnalucata (where ourintercomparison study was done), in the inlet of Ogninaand in the mouth of the River Cassibile called“Balatone.” Further to the east, near Syracuse city, theAretusa spring has been well known from mythology.
5.2.2. Study area and geophysical characterizationThe study area for the intercomparison was in the
small town of Donnalucata in the province of Ragusaalong the southeastern coast of Sicily. Many springs areknown to occur in this area, both on-shore and offshore.Our original main goal was to assess SGD along aseveral kilometer stretch of coastline in this area.Unfortunately, high wind and surf conditions preventedus from making many measurements along the opencoastline. However, a protected boat basin (Fig. 16)allowed us to conduct a series of measurements forassessing SGD.
A portable, geo-electric instrument based on timedomain electromagnetic sounding technology was usedduring the 2002 experiment in Donnalucata to obtainsubsurface information. The analysis of 3-D structuresof geo-electrical data shows the presence of several
ken as part of the IAEA–UNESCO project on SGD. The area aroundrmed.
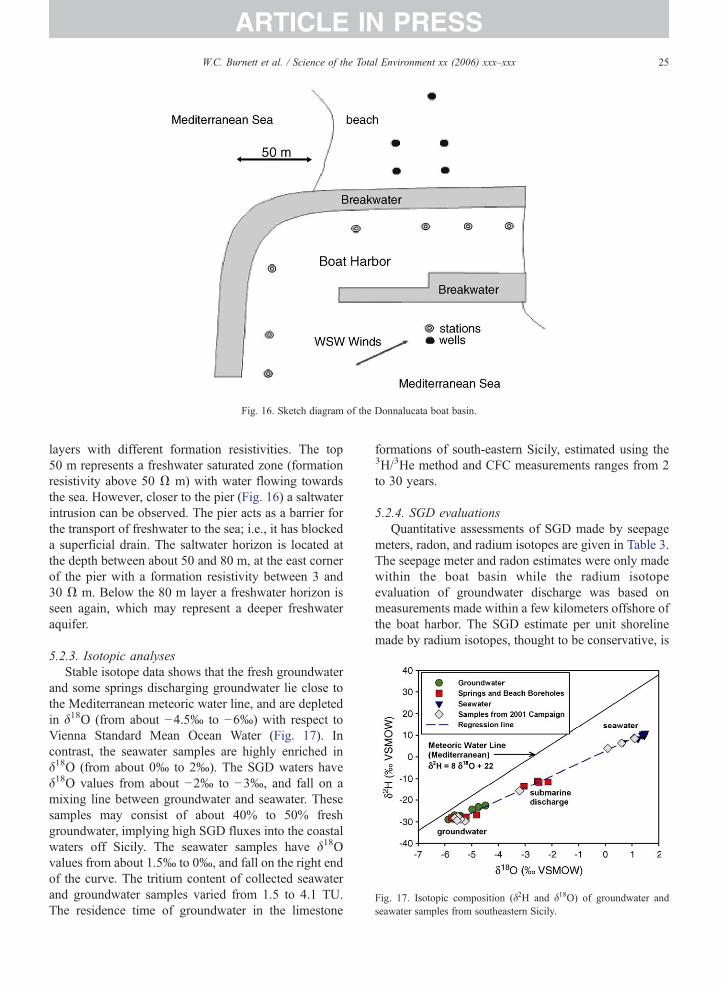
Fig. 16. Sketch diagram of the Donnalucata boat basin.
Fig. 17. Isotopic composition (δ2H and δ18O) of groundwater andseawater samples from southeastern Sicily.
25W.C. Burnett et al. / Science of the Total Environment xx (2006) xxx–xxx
ARTICLE IN PRESS
layers with different formation resistivities. The top50 m represents a freshwater saturated zone (formationresistivity above 50 Ω m) with water flowing towardsthe sea. However, closer to the pier (Fig. 16) a saltwaterintrusion can be observed. The pier acts as a barrier forthe transport of freshwater to the sea; i.e., it has blockeda superficial drain. The saltwater horizon is located atthe depth between about 50 and 80 m, at the east cornerof the pier with a formation resistivity between 3 and30 Ω m. Below the 80 m layer a freshwater horizon isseen again, which may represent a deeper freshwateraquifer.
5.2.3. Isotopic analysesStable isotope data shows that the fresh groundwater
and some springs discharging groundwater lie close tothe Mediterranean meteoric water line, and are depletedin δ18O (from about −4.5‰ to −6‰) with respect toVienna Standard Mean Ocean Water (Fig. 17). Incontrast, the seawater samples are highly enriched inδ18O (from about 0‰ to 2‰). The SGD waters haveδ18O values from about −2‰ to −3‰, and fall on amixing line between groundwater and seawater. Thesesamples may consist of about 40% to 50% freshgroundwater, implying high SGD fluxes into the coastalwaters off Sicily. The seawater samples have δ18Ovalues from about 1.5‰ to 0‰, and fall on the right endof the curve. The tritium content of collected seawaterand groundwater samples varied from 1.5 to 4.1 TU.The residence time of groundwater in the limestone
formations of south-eastern Sicily, estimated using the3H/3He method and CFC measurements ranges from 2to 30 years.
5.2.4. SGD evaluationsQuantitative assessments of SGD made by seepage
meters, radon, and radium isotopes are given in Table 3.The seepage meter and radon estimates were only madewithin the boat basin while the radium isotopeevaluation of groundwater discharge was based onmeasurements made within a few kilometers offshore ofthe boat harbor. The SGD estimate per unit shorelinemade by radium isotopes, thought to be conservative, is
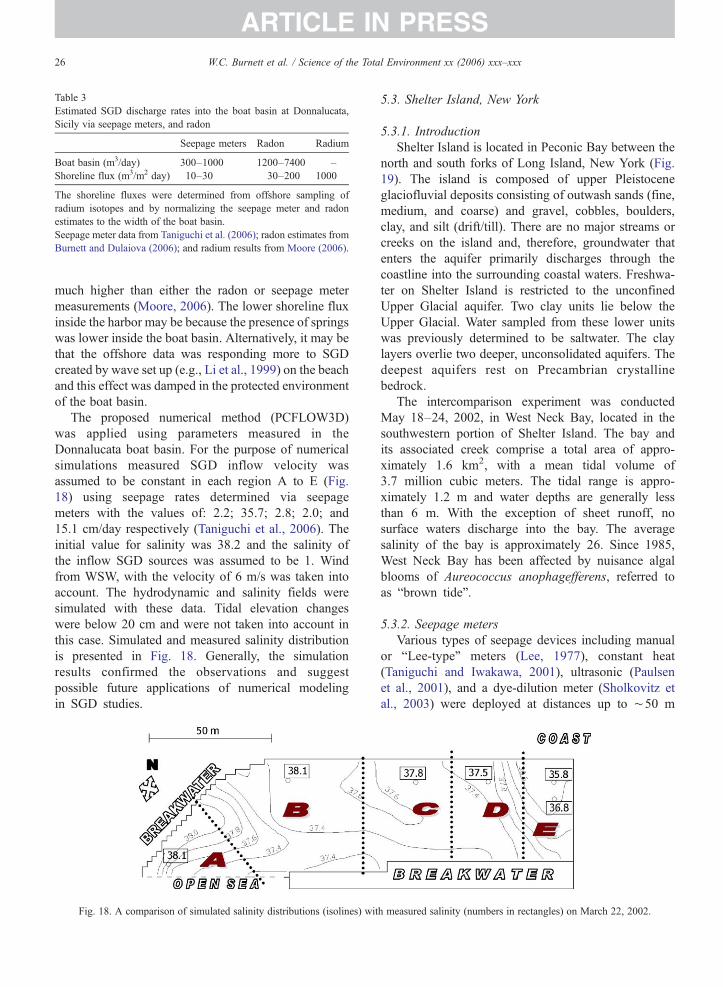
Table 3Estimated SGD discharge rates into the boat basin at Donnalucata,Sicily via seepage meters, and radon
Seepage meters Radon Radium
Boat basin (m3/day) 300–1000 1200–7400 –Shoreline flux (m3/m2 day) 10–30 30–200 1000
The shoreline fluxes were determined from offshore sampling ofradium isotopes and by normalizing the seepage meter and radonestimates to the width of the boat basin.Seepage meter data from Taniguchi et al. (2006); radon estimates fromBurnett and Dulaiova (2006); and radium results from Moore (2006).
26 W.C. Burnett et al. / Science of the Total Environment xx (2006) xxx–xxx
ARTICLE IN PRESS
much higher than either the radon or seepage metermeasurements (Moore, 2006). The lower shoreline fluxinside the harbor may be because the presence of springswas lower inside the boat basin. Alternatively, it may bethat the offshore data was responding more to SGDcreated by wave set up (e.g., Li et al., 1999) on the beachand this effect was damped in the protected environmentof the boat basin.
The proposed numerical method (PCFLOW3D)was applied using parameters measured in theDonnalucata boat basin. For the purpose of numericalsimulations measured SGD inflow velocity wasassumed to be constant in each region A to E (Fig.18) using seepage rates determined via seepagemeters with the values of: 2.2; 35.7; 2.8; 2.0; and15.1 cm/day respectively (Taniguchi et al., 2006). Theinitial value for salinity was 38.2 and the salinity ofthe inflow SGD sources was assumed to be 1. Windfrom WSW, with the velocity of 6 m/s was taken intoaccount. The hydrodynamic and salinity fields weresimulated with these data. Tidal elevation changeswere below 20 cm and were not taken into account inthis case. Simulated and measured salinity distributionis presented in Fig. 18. Generally, the simulationresults confirmed the observations and suggestpossible future applications of numerical modelingin SGD studies.
Fig. 18. A comparison of simulated salinity distributions (isolines) wit
5.3. Shelter Island, New York
5.3.1. IntroductionShelter Island is located in Peconic Bay between the
north and south forks of Long Island, New York (Fig.19). The island is composed of upper Pleistoceneglaciofluvial deposits consisting of outwash sands (fine,medium, and coarse) and gravel, cobbles, boulders,clay, and silt (drift/till). There are no major streams orcreeks on the island and, therefore, groundwater thatenters the aquifer primarily discharges through thecoastline into the surrounding coastal waters. Freshwa-ter on Shelter Island is restricted to the unconfinedUpper Glacial aquifer. Two clay units lie below theUpper Glacial. Water sampled from these lower unitswas previously determined to be saltwater. The claylayers overlie two deeper, unconsolidated aquifers. Thedeepest aquifers rest on Precambrian crystallinebedrock.
The intercomparison experiment was conductedMay 18–24, 2002, in West Neck Bay, located in thesouthwestern portion of Shelter Island. The bay andits associated creek comprise a total area of appro-ximately 1.6 km2, with a mean tidal volume of3.7 million cubic meters. The tidal range is appro-ximately 1.2 m and water depths are generally lessthan 6 m. With the exception of sheet runoff, nosurface waters discharge into the bay. The averagesalinity of the bay is approximately 26. Since 1985,West Neck Bay has been affected by nuisance algalblooms of Aureococcus anophagefferens, referred toas “brown tide”.
5.3.2. Seepage metersVarious types of seepage devices including manual
or “Lee-type” meters (Lee, 1977), constant heat(Taniguchi and Iwakawa, 2001), ultrasonic (Paulsenet al., 2001), and a dye-dilution meter (Sholkovitz etal., 2003) were deployed at distances up to ∼50 m
h measured salinity (numbers in rectangles) on March 22, 2002.
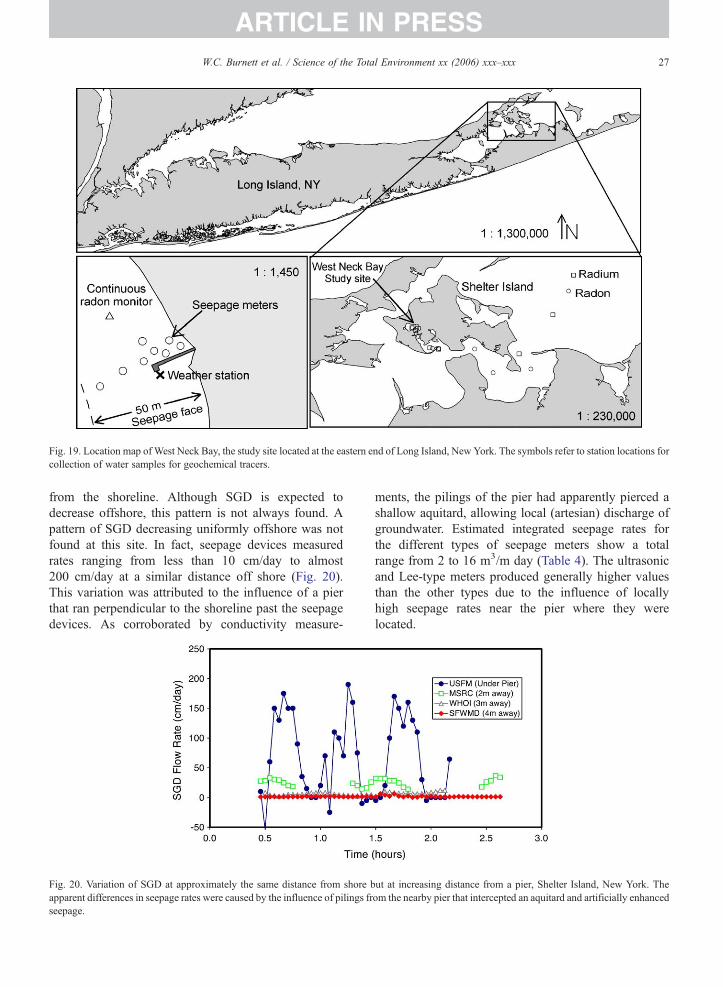
Fig. 19. Location map of West Neck Bay, the study site located at the eastern end of Long Island, New York. The symbols refer to station locations forcollection of water samples for geochemical tracers.
27W.C. Burnett et al. / Science of the Total Environment xx (2006) xxx–xxx
ARTICLE IN PRESS
from the shoreline. Although SGD is expected todecrease offshore, this pattern is not always found. Apattern of SGD decreasing uniformly offshore was notfound at this site. In fact, seepage devices measuredrates ranging from less than 10 cm/day to almost200 cm/day at a similar distance off shore (Fig. 20).This variation was attributed to the influence of a pierthat ran perpendicular to the shoreline past the seepagedevices. As corroborated by conductivity measure-
Fig. 20. Variation of SGD at approximately the same distance from shore bapparent differences in seepage rates were caused by the influence of pilings frseepage.
ments, the pilings of the pier had apparently pierced ashallow aquitard, allowing local (artesian) discharge ofgroundwater. Estimated integrated seepage rates forthe different types of seepage meters show a totalrange from 2 to 16 m3/m day (Table 4). The ultrasonicand Lee-type meters produced generally higher valuesthan the other types due to the influence of locallyhigh seepage rates near the pier where they werelocated.
ut at increasing distance from a pier, Shelter Island, New York. Theom the nearby pier that intercepted an aquitard and artificially enhanced

Table 5Estimated integrated SGD ranges (daily averages) via four differentapproaches for the Shelter Island intercomparison
Estimated groundwater discharge (m3/m day)
Seepage meters(all types)
Radon Radium isotopes Modeling
0.4–17.5 8–16 a 16–26 0.23–1.4 b
18–20 c 0.5 d
10 e
The seepage meter and isotopic measurements were made during thesame period. The modeling was performed by other investigators foraverage and extreme conditions.a Mixing losses of Rn based on inspection of calculated Rn fluxes.b Based on estimate of mean fresh water discharge into West Neck
Harbor (DiLorenzo and Ram, 1991).c Mixing losses of Rn based on short-lived radium isotopes.d Based on a water budget estimate of Shelter Island (Schubert,
1998).e Based on a MODFLOW model of West Neck Bay (O'Rourke,
2000).
Table 4Estimated integrated SGD (daily averages when ranges are shown) viaseveral different types of seepage meters deployed at the Shelter Islandintercomparison (May 18–24, 2002)
Seepage meters estimated groundwater discharge (m3/m day)
Manual(Lee-type)
Heat pulse(KrupaSeep)
Continuousheat(Taniguchi)
Dye-dilution(WHOI)
Ultrasonic(Paulsen)
11.5 a 0.4–0.8 2.5 3.4 17.5n=3 b n=2 n=1 n=2 n=6a Using an average flux of 23.2 cm/day.b The n in the last row refers to the number of positions each type of
meter occupied during the intercomparison.
28 W.C. Burnett et al. / Science of the Total Environment xx (2006) xxx–xxx
ARTICLE IN PRESS
5.3.3. Radon and radium isotopesThe radiotracers produced results (Table 5) that were
overlapping but generally higher than the seepage meterresults. The radon model shows two ranges based onhow the mixing term is evaluated. One way involvesinspecting the calculated radon fluxes after correctionsfor atmospheric evasion and tidal changes. We assumedthat the maximum negative fluxes, representing a loss ofradon from the system, would be a lower estimate of themixing loss because greater losses could be masked byconcurrently higher inputs. A second approach involvesestimating the mixing via inspection of both short-livedradium isotopes and 222Rn along a transect away fromthe study site. Multiplying the derived horizontal mixingcoefficient (Kh; Moore, 2000) by the linear gradient ofthe 222Rn and the average depth produces an offshoreflux. This result can then be converted to a seabed fluxthat is equivalent to how the fluxes are expressed in theradon model. The two mixing loss estimates agreed verywell at 670 dpm/m2 h and 730 dpm/m2 h via inspectionof the Rn fluxes and use of radium isotopes,respectively. The integrated seepage rate based solelyon radium isotopes overlaps the radon model and theresults from the ultrasonic seepage meter.
The integrated discharge calculated from the geo-chemical techniques was near the upper range of themeasurements made with the seepage devices. Onepossible reason that the radiotracer estimates may tendto be higher than the seepage meter results is that thetracers, measured in the water column, integrate a largerarea than the seepage meters. For example, the gradientfor 223Ra, which was used to calculate the mixing andthe residence time in West Neck Bay, was based on atransect from the study site in the interior of the bay outto the bay's mouth, over 4 km from the seepage metersite. In addition, results from the WHOI dye-dilutionseepage meter, which continuously records the salinityof the seepage fluid, and resistivity profiling both
indicate that a significant portion of the near-shore SGDwas as freshwater. Therefore, because of the limitedscale of the seepage meter study, the seepage metersmay have missed a key component of the total SGD fluxat this site; i.e., the seepage meters were respondingmostly to near-shore freshwater flow while the radio-tracers reflected total (fresh+saline) flow. This suggeststhat, regionally, there are other areas of high seepage (inaddition to the high seepage under the pier) that were notsampled by the meters, but contributed to the SGDmeasured with geochemical tracers.
There were no modeling estimates made of SGDduring the Shelter Island intercomparison. However, aconsultant's report concerning the flushing time of WestNeck Harbor (DiLorenzo and Ram, 1991) included anestimate of “freshwater inflow” that we assume wouldbe all via groundwater discharges. That report estimatedthe long-term mean inflow at 1.07 cfs (0.03 m3/s) andthe maximum inflow at 6.56 cfs (0.19 m3/s). Weestimated the shoreline length of the bay at 11.3 km.That results in an estimated mean freshwater seepagerate of only 0.23 m3/m day and 1.4 m3/m day as amaximum inflow. A later USGS study (Schubert, 1998)estimated freshwater inflow into West Neck Bay at198,000 cfd (0.065 m3/s) via a water balance approach.Again normalizing to our estimated shoreline length of11.3 km, we derive an integrated seepage rate of 0.5 m3/m day. All these estimates are lower than the directmeasurement approaches. These differences may beattributed to one or more of the following: (1) themodels underestimate the groundwater discharge; (2)the seepage meters and tracers are recording higher
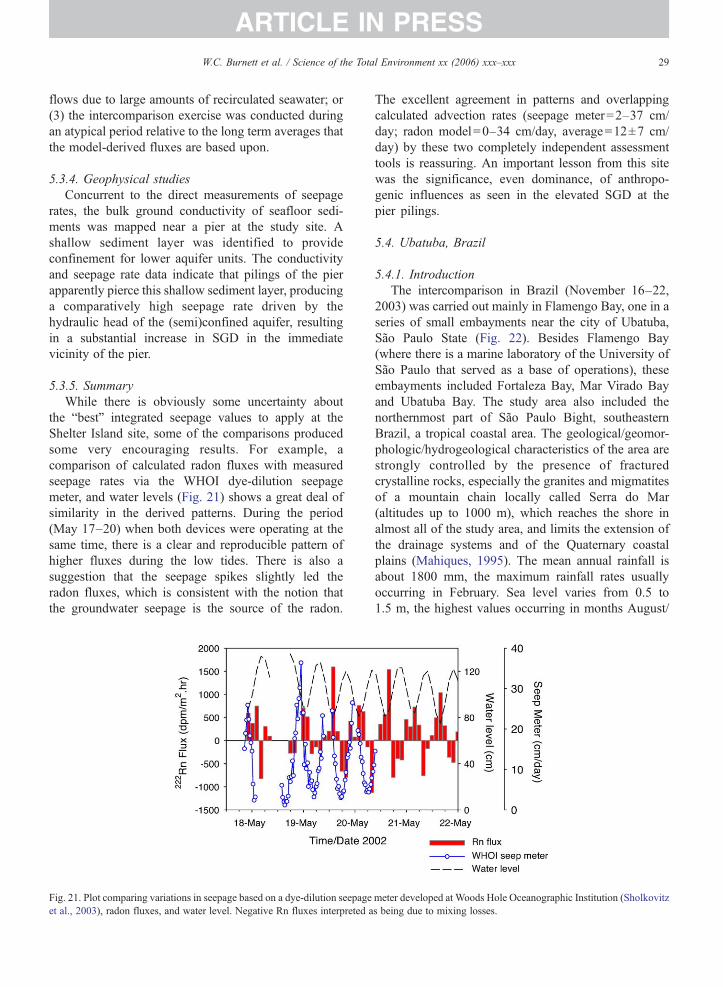
29W.C. Burnett et al. / Science of the Total Environment xx (2006) xxx–xxx
ARTICLE IN PRESS
flows due to large amounts of recirculated seawater; or(3) the intercomparison exercise was conducted duringan atypical period relative to the long term averages thatthe model-derived fluxes are based upon.
5.3.4. Geophysical studiesConcurrent to the direct measurements of seepage
rates, the bulk ground conductivity of seafloor sedi-ments was mapped near a pier at the study site. Ashallow sediment layer was identified to provideconfinement for lower aquifer units. The conductivityand seepage rate data indicate that pilings of the pierapparently pierce this shallow sediment layer, producinga comparatively high seepage rate driven by thehydraulic head of the (semi)confined aquifer, resultingin a substantial increase in SGD in the immediatevicinity of the pier.
5.3.5. SummaryWhile there is obviously some uncertainty about
the “best” integrated seepage values to apply at theShelter Island site, some of the comparisons producedsome very encouraging results. For example, acomparison of calculated radon fluxes with measuredseepage rates via the WHOI dye-dilution seepagemeter, and water levels (Fig. 21) shows a great deal ofsimilarity in the derived patterns. During the period(May 17–20) when both devices were operating at thesame time, there is a clear and reproducible pattern ofhigher fluxes during the low tides. There is also asuggestion that the seepage spikes slightly led theradon fluxes, which is consistent with the notion thatthe groundwater seepage is the source of the radon.
Fig. 21. Plot comparing variations in seepage based on a dye-dilution seepageet al., 2003), radon fluxes, and water level. Negative Rn fluxes interpreted a
The excellent agreement in patterns and overlappingcalculated advection rates (seepage meter=2–37 cm/day; radon model=0–34 cm/day, average=12±7 cm/day) by these two completely independent assessmenttools is reassuring. An important lesson from this sitewas the significance, even dominance, of anthropo-genic influences as seen in the elevated SGD at thepier pilings.
5.4. Ubatuba, Brazil
5.4.1. IntroductionThe intercomparison in Brazil (November 16–22,
2003) was carried out mainly in Flamengo Bay, one in aseries of small embayments near the city of Ubatuba,São Paulo State (Fig. 22). Besides Flamengo Bay(where there is a marine laboratory of the University ofSão Paulo that served as a base of operations), theseembayments included Fortaleza Bay, Mar Virado Bayand Ubatuba Bay. The study area also included thenorthernmost part of São Paulo Bight, southeasternBrazil, a tropical coastal area. The geological/geomor-phologic/hydrogeological characteristics of the area arestrongly controlled by the presence of fracturedcrystalline rocks, especially the granites and migmatitesof a mountain chain locally called Serra do Mar(altitudes up to 1000 m), which reaches the shore inalmost all of the study area, and limits the extension ofthe drainage systems and of the Quaternary coastalplains (Mahiques, 1995). The mean annual rainfall isabout 1800 mm, the maximum rainfall rates usuallyoccurring in February. Sea level varies from 0.5 to1.5 m, the highest values occurring in months August/
meter developed at Woods Hole Oceanographic Institution (Sholkovitzs being due to mixing losses.
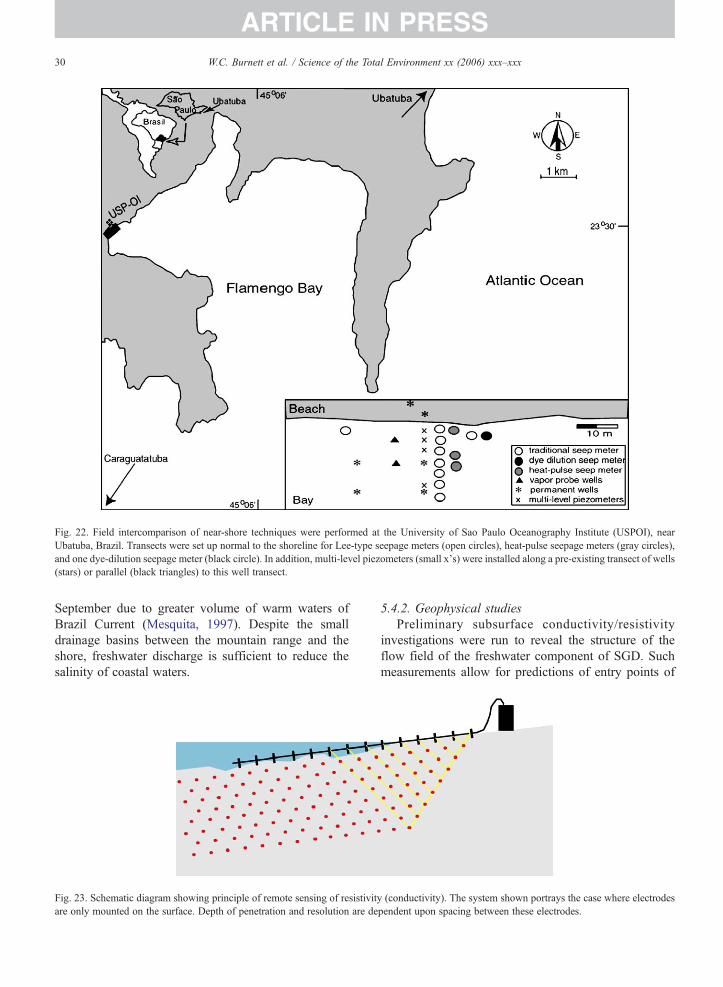
Fig. 22. Field intercomparison of near-shore techniques were performed at the University of Sao Paulo Oceanography Institute (USPOI), nearUbatuba, Brazil. Transects were set up normal to the shoreline for Lee-type seepage meters (open circles), heat-pulse seepage meters (gray circles),and one dye-dilution seepage meter (black circle). In addition, multi-level piezometers (small x's) were installed along a pre-existing transect of wells(stars) or parallel (black triangles) to this well transect.
30 W.C. Burnett et al. / Science of the Total Environment xx (2006) xxx–xxx
ARTICLE IN PRESS
September due to greater volume of warm waters ofBrazil Current (Mesquita, 1997). Despite the smalldrainage basins between the mountain range and theshore, freshwater discharge is sufficient to reduce thesalinity of coastal waters.
Fig. 23. Schematic diagram showing principle of remote sensing of resistivitare only mounted on the surface. Depth of penetration and resolution are de
5.4.2. Geophysical studiesPreliminary subsurface conductivity/resistivity
investigations were run to reveal the structure of theflow field of the freshwater component of SGD. Suchmeasurements allow for predictions of entry points of
y (conductivity). The system shown portrays the case where electrodespendent upon spacing between these electrodes.
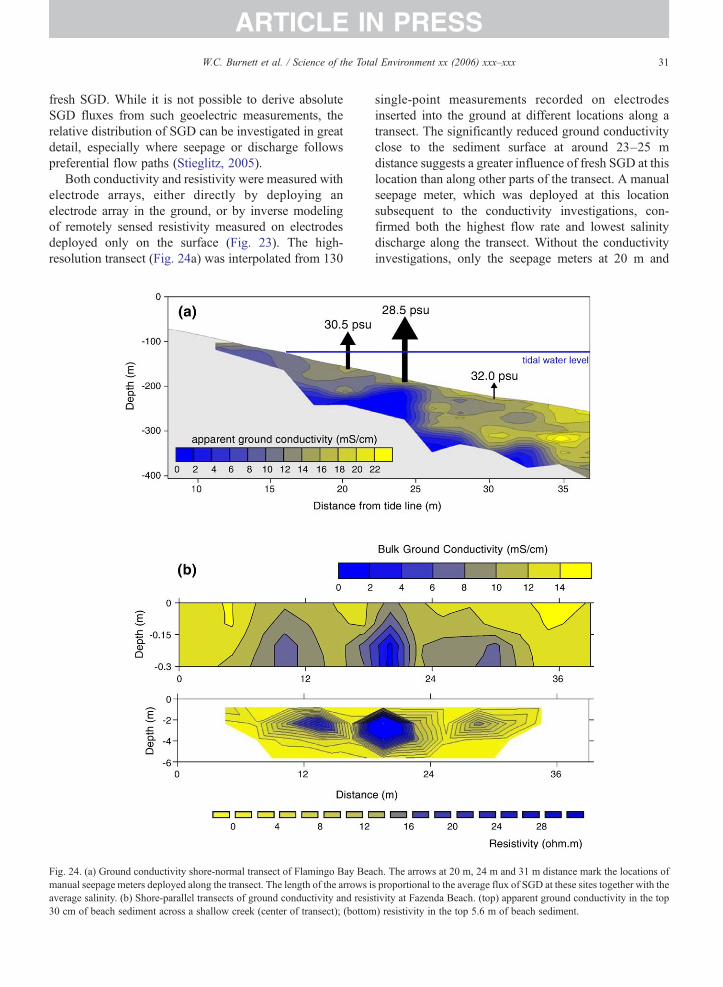
31W.C. Burnett et al. / Science of the Total Environment xx (2006) xxx–xxx
ARTICLE IN PRESS
fresh SGD. While it is not possible to derive absoluteSGD fluxes from such geoelectric measurements, therelative distribution of SGD can be investigated in greatdetail, especially where seepage or discharge followspreferential flow paths (Stieglitz, 2005).
Both conductivity and resistivity were measured withelectrode arrays, either directly by deploying anelectrode array in the ground, or by inverse modelingof remotely sensed resistivity measured on electrodesdeployed only on the surface (Fig. 23). The high-resolution transect (Fig. 24a) was interpolated from 130
Fig. 24. (a) Ground conductivity shore-normal transect of Flamingo Bay Beamanual seepage meters deployed along the transect. The length of the arrows iaverage salinity. (b) Shore-parallel transects of ground conductivity and resis30 cm of beach sediment across a shallow creek (center of transect); (bottom
single-point measurements recorded on electrodesinserted into the ground at different locations along atransect. The significantly reduced ground conductivityclose to the sediment surface at around 23–25 mdistance suggests a greater influence of fresh SGD at thislocation than along other parts of the transect. A manualseepage meter, which was deployed at this locationsubsequent to the conductivity investigations, con-firmed both the highest flow rate and lowest salinitydischarge along the transect. Without the conductivityinvestigations, only the seepage meters at 20 m and
ch. The arrows at 20 m, 24 m and 31 m distance mark the locations ofs proportional to the average flux of SGD at these sites together with thetivity at Fazenda Beach. (top) apparent ground conductivity in the top) resistivity in the top 5.6 m of beach sediment.
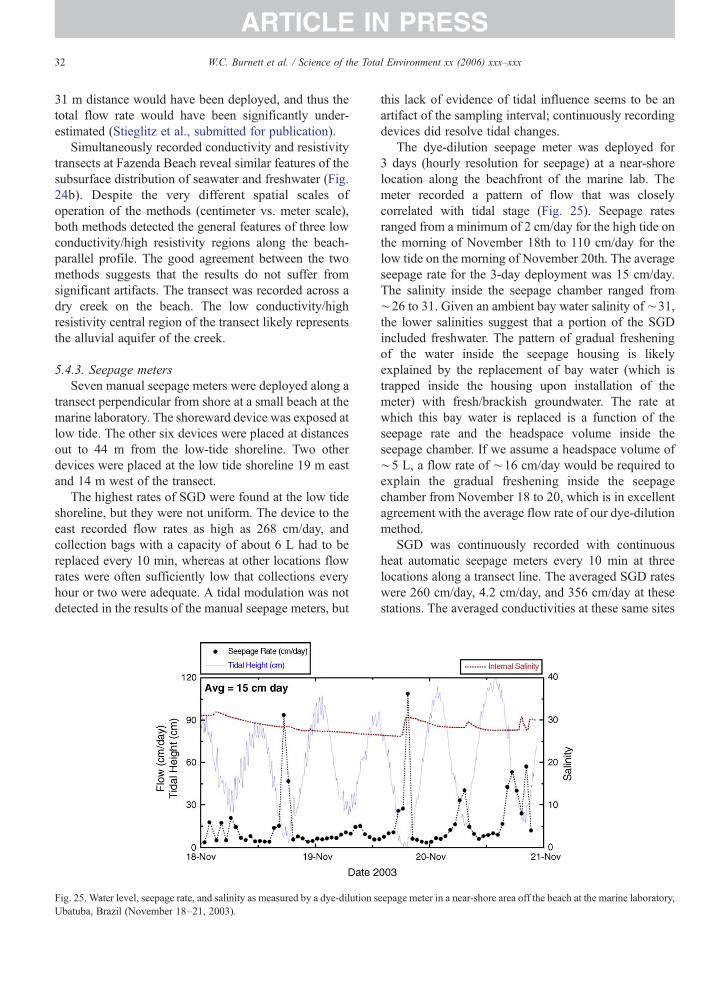
32 W.C. Burnett et al. / Science of the Total Environment xx (2006) xxx–xxx
ARTICLE IN PRESS
31 m distance would have been deployed, and thus thetotal flow rate would have been significantly under-estimated (Stieglitz et al., submitted for publication).
Simultaneously recorded conductivity and resistivitytransects at Fazenda Beach reveal similar features of thesubsurface distribution of seawater and freshwater (Fig.24b). Despite the very different spatial scales ofoperation of the methods (centimeter vs. meter scale),both methods detected the general features of three lowconductivity/high resistivity regions along the beach-parallel profile. The good agreement between the twomethods suggests that the results do not suffer fromsignificant artifacts. The transect was recorded across adry creek on the beach. The low conductivity/highresistivity central region of the transect likely representsthe alluvial aquifer of the creek.
5.4.3. Seepage metersSeven manual seepage meters were deployed along a
transect perpendicular from shore at a small beach at themarine laboratory. The shoreward device was exposed atlow tide. The other six devices were placed at distancesout to 44 m from the low-tide shoreline. Two otherdevices were placed at the low tide shoreline 19 m eastand 14 m west of the transect.
The highest rates of SGD were found at the low tideshoreline, but they were not uniform. The device to theeast recorded flow rates as high as 268 cm/day, andcollection bags with a capacity of about 6 L had to bereplaced every 10 min, whereas at other locations flowrates were often sufficiently low that collections everyhour or two were adequate. A tidal modulation was notdetected in the results of the manual seepage meters, but
Fig. 25. Water level, seepage rate, and salinity as measured by a dye-dilution sUbatuba, Brazil (November 18–21, 2003).
this lack of evidence of tidal influence seems to be anartifact of the sampling interval; continuously recordingdevices did resolve tidal changes.
The dye-dilution seepage meter was deployed for3 days (hourly resolution for seepage) at a near-shorelocation along the beachfront of the marine lab. Themeter recorded a pattern of flow that was closelycorrelated with tidal stage (Fig. 25). Seepage ratesranged from a minimum of 2 cm/day for the high tide onthe morning of November 18th to 110 cm/day for thelow tide on the morning of November 20th. The averageseepage rate for the 3-day deployment was 15 cm/day.The salinity inside the seepage chamber ranged from∼26 to 31. Given an ambient bay water salinity of ∼31,the lower salinities suggest that a portion of the SGDincluded freshwater. The pattern of gradual fresheningof the water inside the seepage housing is likelyexplained by the replacement of bay water (which istrapped inside the housing upon installation of themeter) with fresh/brackish groundwater. The rate atwhich this bay water is replaced is a function of theseepage rate and the headspace volume inside theseepage chamber. If we assume a headspace volume of∼5 L, a flow rate of ∼16 cm/day would be required toexplain the gradual freshening inside the seepagechamber from November 18 to 20, which is in excellentagreement with the average flow rate of our dye-dilutionmethod.
SGD was continuously recorded with continuousheat automatic seepage meters every 10 min at threelocations along a transect line. The averaged SGD rateswere 260 cm/day, 4.2 cm/day, and 356 cm/day at thesestations. The averaged conductivities at these same sites
eepage meter in a near-shore area off the beach at the marine laboratory,
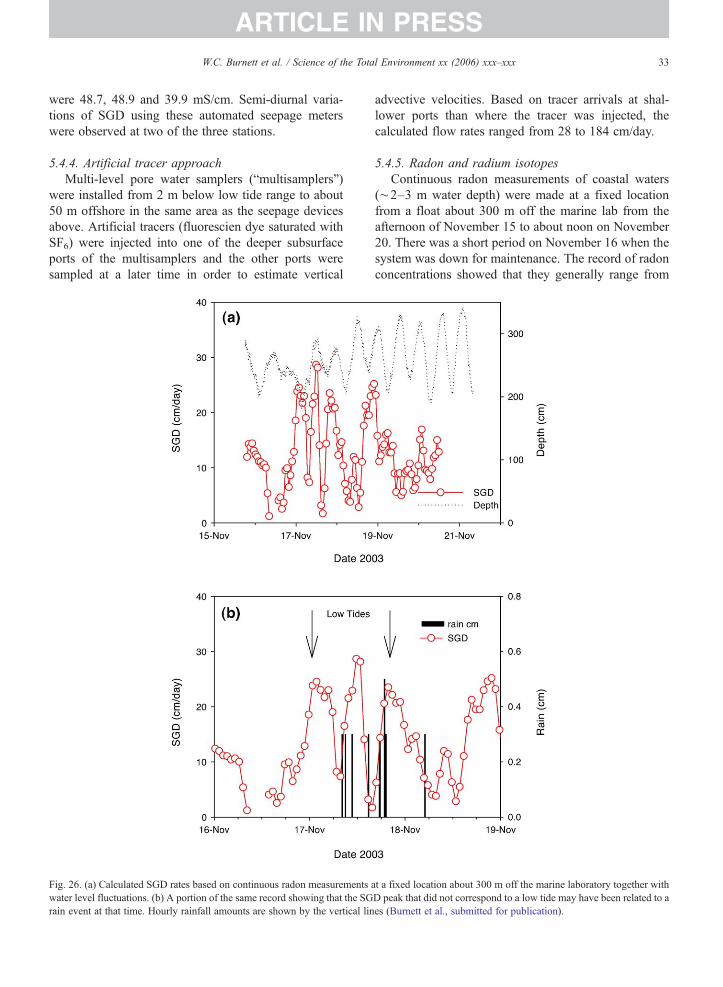
33W.C. Burnett et al. / Science of the Total Environment xx (2006) xxx–xxx
ARTICLE IN PRESS
were 48.7, 48.9 and 39.9 mS/cm. Semi-diurnal varia-tions of SGD using these automated seepage meterswere observed at two of the three stations.
5.4.4. Artificial tracer approachMulti-level pore water samplers (“multisamplers”)
were installed from 2 m below low tide range to about50 m offshore in the same area as the seepage devicesabove. Artificial tracers (fluorescien dye saturated withSF6) were injected into one of the deeper subsurfaceports of the multisamplers and the other ports weresampled at a later time in order to estimate vertical
Fig. 26. (a) Calculated SGD rates based on continuous radon measurements awater level fluctuations. (b) A portion of the same record showing that the SGrain event at that time. Hourly rainfall amounts are shown by the vertical lin
advective velocities. Based on tracer arrivals at shal-lower ports than where the tracer was injected, thecalculated flow rates ranged from 28 to 184 cm/day.
5.4.5. Radon and radium isotopesContinuous radon measurements of coastal waters
(∼2–3 m water depth) were made at a fixed locationfrom a float about 300 m off the marine lab from theafternoon of November 15 to about noon on November20. There was a short period on November 16 when thesystem was down for maintenance. The record of radonconcentrations showed that they generally range from
t a fixed location about 300 m off the marine laboratory together withD peak that did not correspond to a low tide may have been related to aes (Burnett et al., submitted for publication).

34 W.C. Burnett et al. / Science of the Total Environment xx (2006) xxx–xxx
ARTICLE IN PRESS
about 2 to 6 dpm/L and showed the highest activities atthe lowest tidal stages. Furthermore, the radon maximatend to have a period of 24-h corresponding to thelowest low tide each day in this semidiurnal, mixed tidalenvironment. There is one exception to this observationin the early morning of November 17, when an “extra”peak occurred at about the highest tide that day.
We estimated SGD rates from the continuous 222Rnmeasurements as described in detail in Burnett andDulaiova (2003). These rates (Fig. 26a) had a somewhatsimilar pattern as seen by some of the manual andautomated seepage meters deployed at the same time.Over a 109-h period, the estimated SGD based on theradon measurements ranged from 1 to 29 cm/day withan average of 13±6 cm/day. The average seepage rate isvery close to the average calculated from the dye-dilution seepage meter of 15 cm/day although thatdevice indicated a much broader range — from about 2up to over 100 cm/day for short periods during thelowest tides. Most of the seepage spikes that wereobserved occurred during the lowest tides, with theexception of that one peak around noon on November17th. Inspection of the rainfall record shows that thiswas also a period when there was a significant amountof rain (Fig. 26b).
A direct comparison of continuous 222Rn measure-ments and advection rates measured by the dye-dilutionseepage meter shows some interesting patterns (Fig. 27).It is important to note that these observations showedthat the tidal modulation of SGD can be strongly non-linear. While the two instruments only overlapped about2.5 days during the weeklong experiment, there are clearindications that both measurements were responding to
Fig. 27. Combined data sets from the dye-dilution seepage meter (triangles), rwere running. The water level record (dots) is also shown.
either tidally induced or modulated forcing. The mainpeaks in both data sets have a 24-h period andcorrespond to the lowest low tide each day. The seepagepeaks led the peaks in the radon by an hour or two aswas also seen in the data from Shelter Island. There arealso indications in both records of secondary peaksoccurring at the higher low tide. This is more obvious inthe seepage meter record, but the radon does show aclear shoulder during the evening low tide on November19th. It is encouraging that these two completelyindependent tools respond in such a similar manner tothe same process. The seepage meter measured flowdirectly from a small portion of seabed close to shorewhile the radon was measured in the overlying water afew hundred meters away and presumably with a muchlarger sphere of influence.
The Ra isotope studies at Ubatuba revealed inputs ofradium occurring in Flamengo Bay at considerabledistances from shore. Moore and de Oliveira (submittedfor publication) calculated apparent ages of water withinFlamengo Bay and used an age vs. distance plot toestimate a water residence time of the order of 10 days.They then developed a mass balance of 228Ra based onmeasured values in then seepage bags, Flamengo Baywaters, and offshore waters. They concluded that near-shore SGD as measured by seepage meters can supportonly 10% of the total SGD to these coastal waters. Mostof the SGD must be originating from fracture systemsthat discharge offshore.
5.4.6. SummaryA summary of the shoreline groundwater discharge
estimates, expressed as specific discharge, is given in
adon concentration (circles), for the time period when both instruments
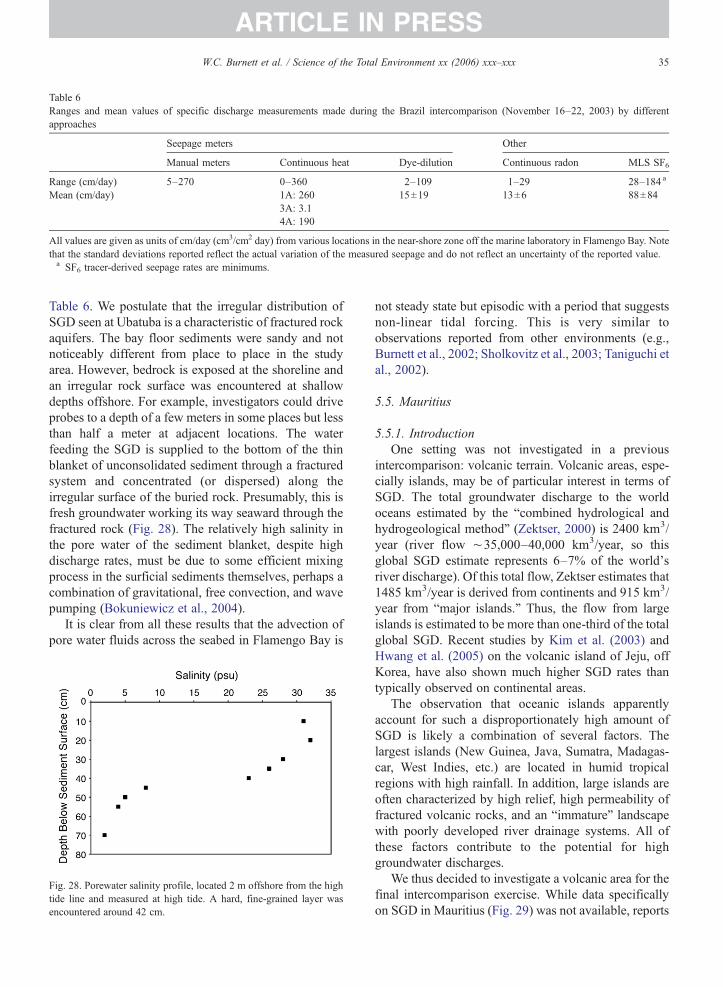
Table 6Ranges and mean values of specific discharge measurements made during the Brazil intercomparison (November 16–22, 2003) by differentapproaches
Seepage meters Other
Manual meters Continuous heat Dye-dilution Continuous radon MLS SF6
Range (cm/day) 5–270 0–360 2–109 1–29 28–184 a
Mean (cm/day) 1A: 260 15±19 13±6 88±843A: 3.14A: 190
All values are given as units of cm/day (cm3/cm2 day) from various locations in the near-shore zone off the marine laboratory in Flamengo Bay. Notethat the standard deviations reported reflect the actual variation of the measured seepage and do not reflect an uncertainty of the reported value.a SF6 tracer-derived seepage rates are minimums.
35W.C. Burnett et al. / Science of the Total Environment xx (2006) xxx–xxx
ARTICLE IN PRESS
Table 6. We postulate that the irregular distribution ofSGD seen at Ubatuba is a characteristic of fractured rockaquifers. The bay floor sediments were sandy and notnoticeably different from place to place in the studyarea. However, bedrock is exposed at the shoreline andan irregular rock surface was encountered at shallowdepths offshore. For example, investigators could driveprobes to a depth of a few meters in some places but lessthan half a meter at adjacent locations. The waterfeeding the SGD is supplied to the bottom of the thinblanket of unconsolidated sediment through a fracturedsystem and concentrated (or dispersed) along theirregular surface of the buried rock. Presumably, this isfresh groundwater working its way seaward through thefractured rock (Fig. 28). The relatively high salinity inthe pore water of the sediment blanket, despite highdischarge rates, must be due to some efficient mixingprocess in the surficial sediments themselves, perhaps acombination of gravitational, free convection, and wavepumping (Bokuniewicz et al., 2004).
It is clear from all these results that the advection ofpore water fluids across the seabed in Flamengo Bay is
Fig. 28. Porewater salinity profile, located 2 m offshore from the hightide line and measured at high tide. A hard, fine-grained layer wasencountered around 42 cm.
not steady state but episodic with a period that suggestsnon-linear tidal forcing. This is very similar toobservations reported from other environments (e.g.,Burnett et al., 2002; Sholkovitz et al., 2003; Taniguchi etal., 2002).
5.5. Mauritius
5.5.1. IntroductionOne setting was not investigated in a previous
intercomparison: volcanic terrain. Volcanic areas, espe-cially islands, may be of particular interest in terms ofSGD. The total groundwater discharge to the worldoceans estimated by the “combined hydrological andhydrogeological method” (Zektser, 2000) is 2400 km3/year (river flow ∼35,000–40,000 km3/year, so thisglobal SGD estimate represents 6–7% of the world'sriver discharge). Of this total flow, Zektser estimates that1485 km3/year is derived from continents and 915 km3/year from “major islands.” Thus, the flow from largeislands is estimated to be more than one-third of the totalglobal SGD. Recent studies by Kim et al. (2003) andHwang et al. (2005) on the volcanic island of Jeju, offKorea, have also shown much higher SGD rates thantypically observed on continental areas.
The observation that oceanic islands apparentlyaccount for such a disproportionately high amount ofSGD is likely a combination of several factors. Thelargest islands (New Guinea, Java, Sumatra, Madagas-car, West Indies, etc.) are located in humid tropicalregions with high rainfall. In addition, large islands areoften characterized by high relief, high permeability offractured volcanic rocks, and an “immature” landscapewith poorly developed river drainage systems. All ofthese factors contribute to the potential for highgroundwater discharges.
We thus decided to investigate a volcanic area for thefinal intercomparison exercise. While data specificallyon SGD in Mauritius (Fig. 29) was not available, reports
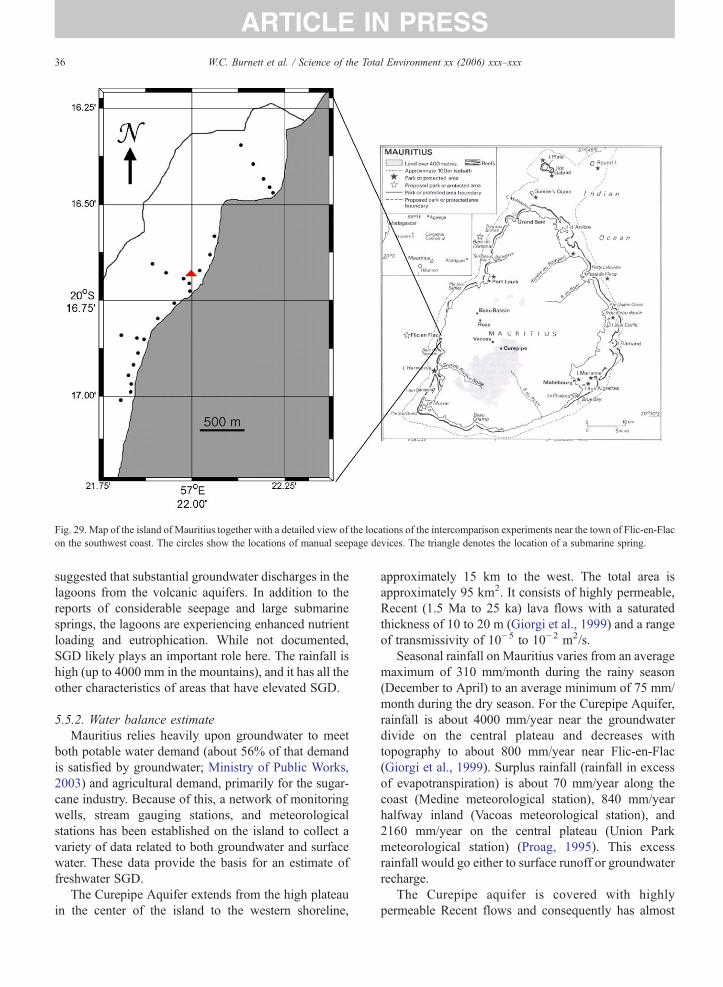
Fig. 29. Map of the island of Mauritius together with a detailed view of the locations of the intercomparison experiments near the town of Flic-en-Flacon the southwest coast. The circles show the locations of manual seepage devices. The triangle denotes the location of a submarine spring.
36 W.C. Burnett et al. / Science of the Total Environment xx (2006) xxx–xxx
ARTICLE IN PRESS
suggested that substantial groundwater discharges in thelagoons from the volcanic aquifers. In addition to thereports of considerable seepage and large submarinesprings, the lagoons are experiencing enhanced nutrientloading and eutrophication. While not documented,SGD likely plays an important role here. The rainfall ishigh (up to 4000 mm in the mountains), and it has all theother characteristics of areas that have elevated SGD.
5.5.2. Water balance estimateMauritius relies heavily upon groundwater to meet
both potable water demand (about 56% of that demandis satisfied by groundwater; Ministry of Public Works,2003) and agricultural demand, primarily for the sugar-cane industry. Because of this, a network of monitoringwells, stream gauging stations, and meteorologicalstations has been established on the island to collect avariety of data related to both groundwater and surfacewater. These data provide the basis for an estimate offreshwater SGD.
The Curepipe Aquifer extends from the high plateauin the center of the island to the western shoreline,
approximately 15 km to the west. The total area isapproximately 95 km2. It consists of highly permeable,Recent (1.5 Ma to 25 ka) lava flows with a saturatedthickness of 10 to 20 m (Giorgi et al., 1999) and a rangeof transmissivity of 10−5 to 10−2 m2/s.
Seasonal rainfall on Mauritius varies from an averagemaximum of 310 mm/month during the rainy season(December to April) to an average minimum of 75 mm/month during the dry season. For the Curepipe Aquifer,rainfall is about 4000 mm/year near the groundwaterdivide on the central plateau and decreases withtopography to about 800 mm/year near Flic-en-Flac(Giorgi et al., 1999). Surplus rainfall (rainfall in excessof evapotranspiration) is about 70 mm/year along thecoast (Medine meteorological station), 840 mm/yearhalfway inland (Vacoas meteorological station), and2160 mm/year on the central plateau (Union Parkmeteorological station) (Proag, 1995). This excessrainfall would go either to surface runoff or groundwaterrecharge.
The Curepipe aquifer is covered with highlypermeable Recent flows and consequently has almost
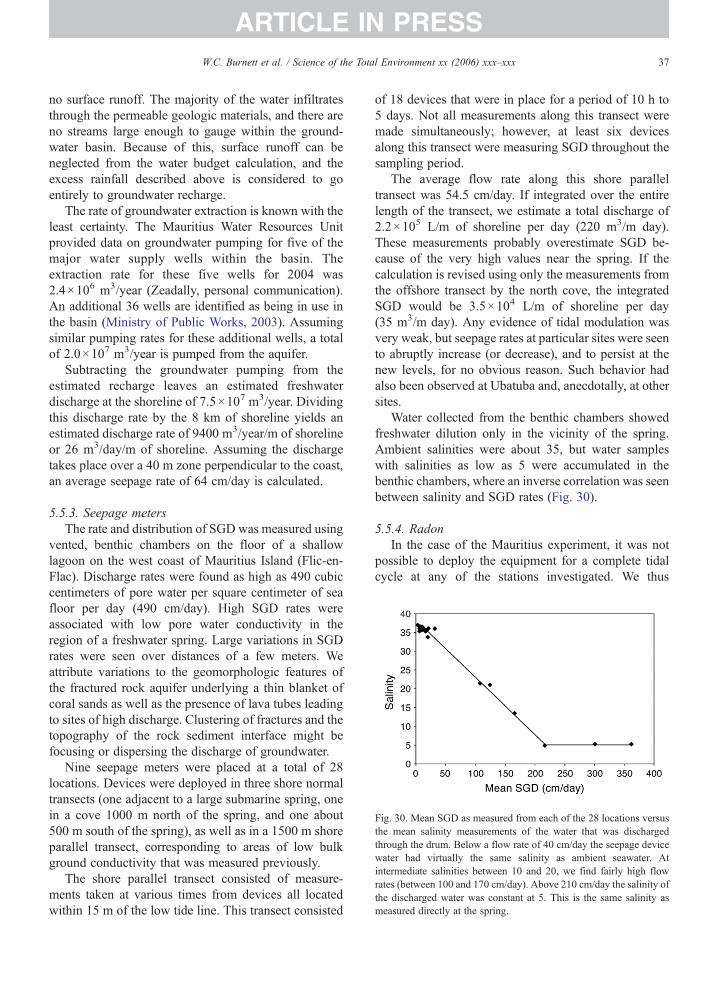
Fig. 30. Mean SGD as measured from each of the 28 locations versusthe mean salinity measurements of the water that was dischargedthrough the drum. Below a flow rate of 40 cm/day the seepage devicewater had virtually the same salinity as ambient seawater. Atintermediate salinities between 10 and 20, we find fairly high flowrates (between 100 and 170 cm/day). Above 210 cm/day the salinity ofthe discharged water was constant at 5. This is the same salinity asmeasured directly at the spring.
37W.C. Burnett et al. / Science of the Total Environment xx (2006) xxx–xxx
ARTICLE IN PRESS
no surface runoff. The majority of the water infiltratesthrough the permeable geologic materials, and there areno streams large enough to gauge within the ground-water basin. Because of this, surface runoff can beneglected from the water budget calculation, and theexcess rainfall described above is considered to goentirely to groundwater recharge.
The rate of groundwater extraction is known with theleast certainty. The Mauritius Water Resources Unitprovided data on groundwater pumping for five of themajor water supply wells within the basin. Theextraction rate for these five wells for 2004 was2.4×106 m3/year (Zeadally, personal communication).An additional 36 wells are identified as being in use inthe basin (Ministry of Public Works, 2003). Assumingsimilar pumping rates for these additional wells, a totalof 2.0×10⁷ m3/year is pumped from the aquifer.
Subtracting the groundwater pumping from theestimated recharge leaves an estimated freshwaterdischarge at the shoreline of 7.5×10⁷ m3/year. Dividingthis discharge rate by the 8 km of shoreline yields anestimated discharge rate of 9400 m3/year/m of shorelineor 26 m3/day/m of shoreline. Assuming the dischargetakes place over a 40 m zone perpendicular to the coast,an average seepage rate of 64 cm/day is calculated.
5.5.3. Seepage metersThe rate and distribution of SGD was measured using
vented, benthic chambers on the floor of a shallowlagoon on the west coast of Mauritius Island (Flic-en-Flac). Discharge rates were found as high as 490 cubiccentimeters of pore water per square centimeter of seafloor per day (490 cm/day). High SGD rates wereassociated with low pore water conductivity in theregion of a freshwater spring. Large variations in SGDrates were seen over distances of a few meters. Weattribute variations to the geomorphologic features ofthe fractured rock aquifer underlying a thin blanket ofcoral sands as well as the presence of lava tubes leadingto sites of high discharge. Clustering of fractures and thetopography of the rock sediment interface might befocusing or dispersing the discharge of groundwater.
Nine seepage meters were placed at a total of 28locations. Devices were deployed in three shore normaltransects (one adjacent to a large submarine spring, onein a cove 1000 m north of the spring, and one about500 m south of the spring), as well as in a 1500 m shoreparallel transect, corresponding to areas of low bulkground conductivity that was measured previously.
The shore parallel transect consisted of measure-ments taken at various times from devices all locatedwithin 15 m of the low tide line. This transect consisted
of 18 devices that were in place for a period of 10 h to5 days. Not all measurements along this transect weremade simultaneously; however, at least six devicesalong this transect were measuring SGD throughout thesampling period.
The average flow rate along this shore paralleltransect was 54.5 cm/day. If integrated over the entirelength of the transect, we estimate a total discharge of2.2×105 L/m of shoreline per day (220 m3/m day).These measurements probably overestimate SGD be-cause of the very high values near the spring. If thecalculation is revised using only the measurements fromthe offshore transect by the north cove, the integratedSGD would be 3.5×10⁴ L/m of shoreline per day(35 m3/m day). Any evidence of tidal modulation wasvery weak, but seepage rates at particular sites were seento abruptly increase (or decrease), and to persist at thenew levels, for no obvious reason. Such behavior hadalso been observed at Ubatuba and, anecdotally, at othersites.
Water collected from the benthic chambers showedfreshwater dilution only in the vicinity of the spring.Ambient salinities were about 35, but water sampleswith salinities as low as 5 were accumulated in thebenthic chambers, where an inverse correlation was seenbetween salinity and SGD rates (Fig. 30).
5.5.4. RadonIn the case of the Mauritius experiment, it was not
possible to deploy the equipment for a complete tidalcycle at any of the stations investigated. We thus
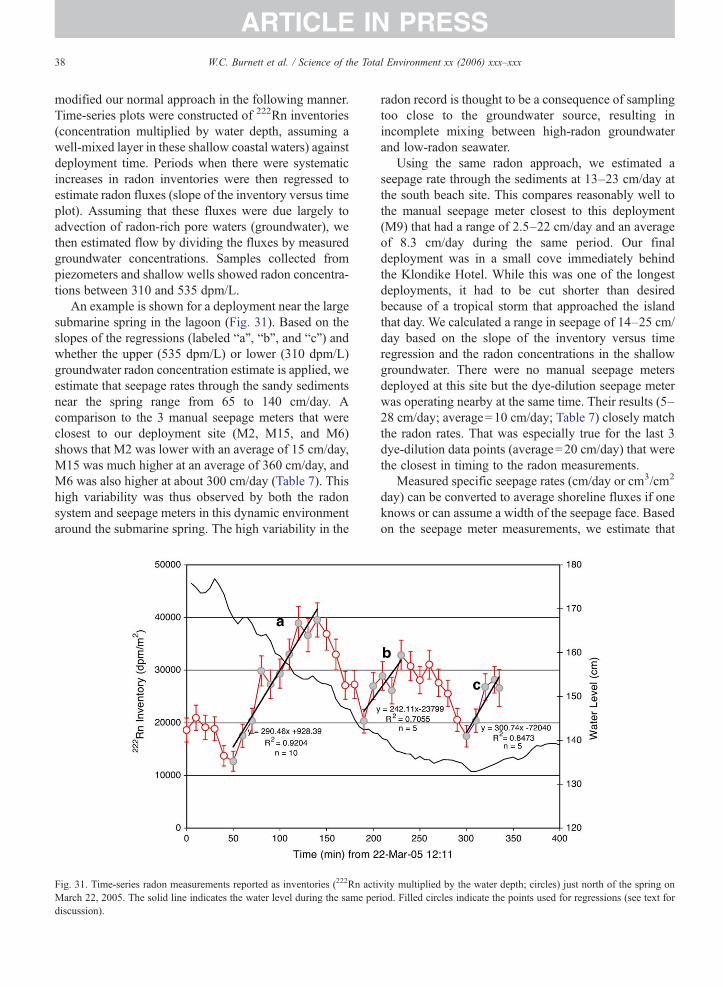
38 W.C. Burnett et al. / Science of the Total Environment xx (2006) xxx–xxx
ARTICLE IN PRESS
modified our normal approach in the following manner.Time-series plots were constructed of 222Rn inventories(concentration multiplied by water depth, assuming awell-mixed layer in these shallow coastal waters) againstdeployment time. Periods when there were systematicincreases in radon inventories were then regressed toestimate radon fluxes (slope of the inventory versus timeplot). Assuming that these fluxes were due largely toadvection of radon-rich pore waters (groundwater), wethen estimated flow by dividing the fluxes by measuredgroundwater concentrations. Samples collected frompiezometers and shallow wells showed radon concentra-tions between 310 and 535 dpm/L.
An example is shown for a deployment near the largesubmarine spring in the lagoon (Fig. 31). Based on theslopes of the regressions (labeled “a”, “b”, and “c”) andwhether the upper (535 dpm/L) or lower (310 dpm/L)groundwater radon concentration estimate is applied, weestimate that seepage rates through the sandy sedimentsnear the spring range from 65 to 140 cm/day. Acomparison to the 3 manual seepage meters that wereclosest to our deployment site (M2, M15, and M6)shows that M2 was lower with an average of 15 cm/day,M15 was much higher at an average of 360 cm/day, andM6 was also higher at about 300 cm/day (Table 7). Thishigh variability was thus observed by both the radonsystem and seepage meters in this dynamic environmentaround the submarine spring. The high variability in the
Fig. 31. Time-series radon measurements reported as inventories (222Rn actiMarch 22, 2005. The solid line indicates the water level during the same perdiscussion).
radon record is thought to be a consequence of samplingtoo close to the groundwater source, resulting inincomplete mixing between high-radon groundwaterand low-radon seawater.
Using the same radon approach, we estimated aseepage rate through the sediments at 13–23 cm/day atthe south beach site. This compares reasonably well tothe manual seepage meter closest to this deployment(M9) that had a range of 2.5–22 cm/day and an averageof 8.3 cm/day during the same period. Our finaldeployment was in a small cove immediately behindthe Klondike Hotel. While this was one of the longestdeployments, it had to be cut shorter than desiredbecause of a tropical storm that approached the islandthat day. We calculated a range in seepage of 14–25 cm/day based on the slope of the inventory versus timeregression and the radon concentrations in the shallowgroundwater. There were no manual seepage metersdeployed at this site but the dye-dilution seepage meterwas operating nearby at the same time. Their results (5–28 cm/day; average=10 cm/day; Table 7) closely matchthe radon rates. That was especially true for the last 3dye-dilution data points (average=20 cm/day) that werethe closest in timing to the radon measurements.
Measured specific seepage rates (cm/day or cm3/cm2
day) can be converted to average shoreline fluxes if oneknows or can assume a width of the seepage face. Basedon the seepage meter measurements, we estimate that
vity multiplied by the water depth; circles) just north of the spring oniod. Filled circles indicate the points used for regressions (see text for
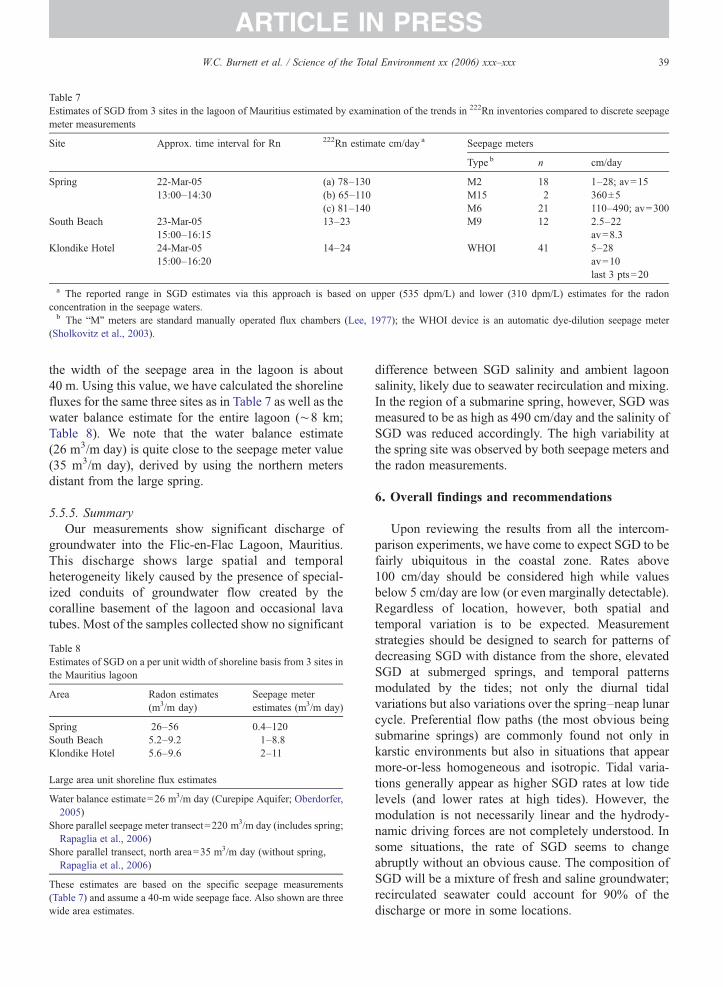
Table 7Estimates of SGD from 3 sites in the lagoon of Mauritius estimated by examination of the trends in 222Rn inventories compared to discrete seepagemeter measurements
Site Approx. time interval for Rn 222Rn estimate cm/day a Seepage meters
Type b n cm/day
Spring 22-Mar-05 (a) 78–130 M2 18 1–28; av=1513:00–14:30 (b) 65–110 M15 2 360±5
(c) 81–140 M6 21 110–490; av=300South Beach 23-Mar-05 13–23 M9 12 2.5–22
15:00–16:15 av=8.3Klondike Hotel 24-Mar-05 14–24 WHOI 41 5–28
15:00–16:20 av=10last 3 pts=20
a The reported range in SGD estimates via this approach is based on upper (535 dpm/L) and lower (310 dpm/L) estimates for the radonconcentration in the seepage waters.b The “M” meters are standard manually operated flux chambers (Lee, 1977); the WHOI device is an automatic dye-dilution seepage meter
(Sholkovitz et al., 2003).
39W.C. Burnett et al. / Science of the Total Environment xx (2006) xxx–xxx
ARTICLE IN PRESS
the width of the seepage area in the lagoon is about40 m. Using this value, we have calculated the shorelinefluxes for the same three sites as in Table 7 as well as thewater balance estimate for the entire lagoon (∼8 km;Table 8). We note that the water balance estimate(26 m3/m day) is quite close to the seepage meter value(35 m3/m day), derived by using the northern metersdistant from the large spring.
5.5.5. SummaryOur measurements show significant discharge of
groundwater into the Flic-en-Flac Lagoon, Mauritius.This discharge shows large spatial and temporalheterogeneity likely caused by the presence of special-ized conduits of groundwater flow created by thecoralline basement of the lagoon and occasional lavatubes. Most of the samples collected show no significant
Table 8Estimates of SGD on a per unit width of shoreline basis from 3 sites inthe Mauritius lagoon
Area Radon estimates(m3/m day)
Seepage meterestimates (m3/m day)
Spring 26–56 0.4–120South Beach 5.2–9.2 1–8.8Klondike Hotel 5.6–9.6 2–11
Large area unit shoreline flux estimates
Water balance estimate=26 m3/m day (Curepipe Aquifer; Oberdorfer,2005)
Shore parallel seepage meter transect=220 m3/m day (includes spring;Rapaglia et al., 2006)
Shore parallel transect, north area=35 m3/m day (without spring,Rapaglia et al., 2006)
These estimates are based on the specific seepage measurements(Table 7) and assume a 40-m wide seepage face. Also shown are threewide area estimates.
difference between SGD salinity and ambient lagoonsalinity, likely due to seawater recirculation and mixing.In the region of a submarine spring, however, SGD wasmeasured to be as high as 490 cm/day and the salinity ofSGD was reduced accordingly. The high variability atthe spring site was observed by both seepage meters andthe radon measurements.
6. Overall findings and recommendations
Upon reviewing the results from all the intercom-parison experiments, we have come to expect SGD to befairly ubiquitous in the coastal zone. Rates above100 cm/day should be considered high while valuesbelow 5 cm/day are low (or even marginally detectable).Regardless of location, however, both spatial andtemporal variation is to be expected. Measurementstrategies should be designed to search for patterns ofdecreasing SGD with distance from the shore, elevatedSGD at submerged springs, and temporal patternsmodulated by the tides; not only the diurnal tidalvariations but also variations over the spring–neap lunarcycle. Preferential flow paths (the most obvious beingsubmarine springs) are commonly found not only inkarstic environments but also in situations that appearmore-or-less homogeneous and isotropic. Tidal varia-tions generally appear as higher SGD rates at low tidelevels (and lower rates at high tides). However, themodulation is not necessarily linear and the hydrody-namic driving forces are not completely understood. Insome situations, the rate of SGD seems to changeabruptly without an obvious cause. The composition ofSGD will be a mixture of fresh and saline groundwater;recirculated seawater could account for 90% of thedischarge or more in some locations.
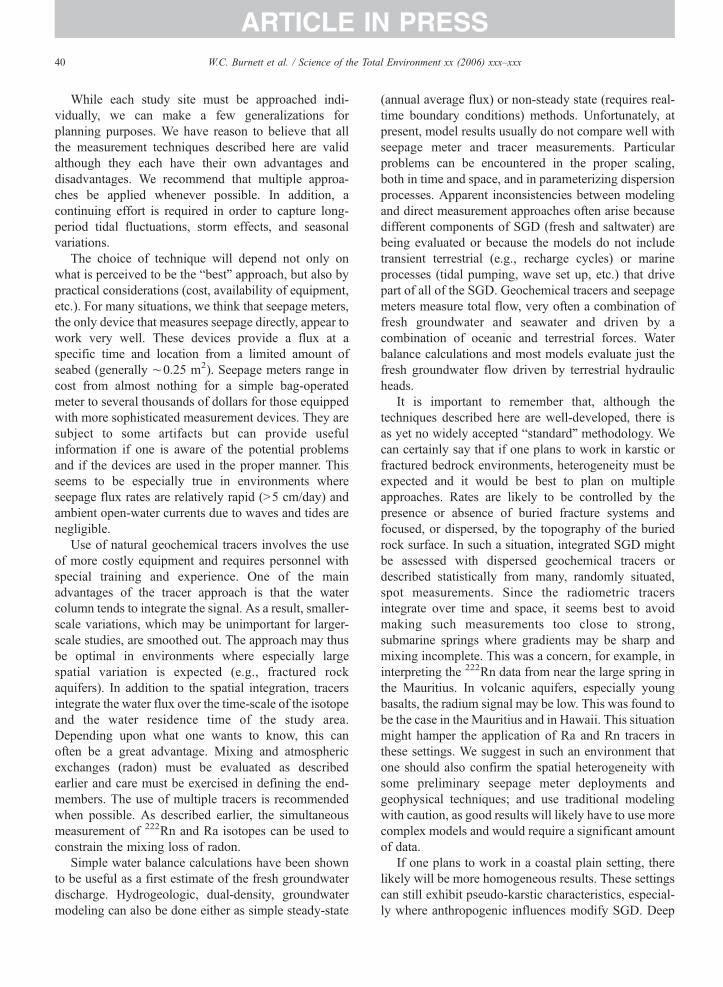
40 W.C. Burnett et al. / Science of the Total Environment xx (2006) xxx–xxx
ARTICLE IN PRESS
While each study site must be approached indi-vidually, we can make a few generalizations forplanning purposes. We have reason to believe that allthe measurement techniques described here are validalthough they each have their own advantages anddisadvantages. We recommend that multiple approa-ches be applied whenever possible. In addition, acontinuing effort is required in order to capture long-period tidal fluctuations, storm effects, and seasonalvariations.
The choice of technique will depend not only onwhat is perceived to be the “best” approach, but also bypractical considerations (cost, availability of equipment,etc.). For many situations, we think that seepage meters,the only device that measures seepage directly, appear towork very well. These devices provide a flux at aspecific time and location from a limited amount ofseabed (generally ∼0.25 m2). Seepage meters range incost from almost nothing for a simple bag-operatedmeter to several thousands of dollars for those equippedwith more sophisticated measurement devices. They aresubject to some artifacts but can provide usefulinformation if one is aware of the potential problemsand if the devices are used in the proper manner. Thisseems to be especially true in environments whereseepage flux rates are relatively rapid (>5 cm/day) andambient open-water currents due to waves and tides arenegligible.
Use of natural geochemical tracers involves the useof more costly equipment and requires personnel withspecial training and experience. One of the mainadvantages of the tracer approach is that the watercolumn tends to integrate the signal. As a result, smaller-scale variations, which may be unimportant for larger-scale studies, are smoothed out. The approach may thusbe optimal in environments where especially largespatial variation is expected (e.g., fractured rockaquifers). In addition to the spatial integration, tracersintegrate the water flux over the time-scale of the isotopeand the water residence time of the study area.Depending upon what one wants to know, this canoften be a great advantage. Mixing and atmosphericexchanges (radon) must be evaluated as describedearlier and care must be exercised in defining the end-members. The use of multiple tracers is recommendedwhen possible. As described earlier, the simultaneousmeasurement of 222Rn and Ra isotopes can be used toconstrain the mixing loss of radon.
Simple water balance calculations have been shownto be useful as a first estimate of the fresh groundwaterdischarge. Hydrogeologic, dual-density, groundwatermodeling can also be done either as simple steady-state
(annual average flux) or non-steady state (requires real-time boundary conditions) methods. Unfortunately, atpresent, model results usually do not compare well withseepage meter and tracer measurements. Particularproblems can be encountered in the proper scaling,both in time and space, and in parameterizing dispersionprocesses. Apparent inconsistencies between modelingand direct measurement approaches often arise becausedifferent components of SGD (fresh and saltwater) arebeing evaluated or because the models do not includetransient terrestrial (e.g., recharge cycles) or marineprocesses (tidal pumping, wave set up, etc.) that drivepart of all of the SGD. Geochemical tracers and seepagemeters measure total flow, very often a combination offresh groundwater and seawater and driven by acombination of oceanic and terrestrial forces. Waterbalance calculations and most models evaluate just thefresh groundwater flow driven by terrestrial hydraulicheads.
It is important to remember that, although thetechniques described here are well-developed, there isas yet no widely accepted “standard” methodology. Wecan certainly say that if one plans to work in karstic orfractured bedrock environments, heterogeneity must beexpected and it would be best to plan on multipleapproaches. Rates are likely to be controlled by thepresence or absence of buried fracture systems andfocused, or dispersed, by the topography of the buriedrock surface. In such a situation, integrated SGD mightbe assessed with dispersed geochemical tracers ordescribed statistically from many, randomly situated,spot measurements. Since the radiometric tracersintegrate over time and space, it seems best to avoidmaking such measurements too close to strong,submarine springs where gradients may be sharp andmixing incomplete. This was a concern, for example, ininterpreting the 222Rn data from near the large spring inthe Mauritius. In volcanic aquifers, especially youngbasalts, the radium signal may be low. This was found tobe the case in the Mauritius and in Hawaii. This situationmight hamper the application of Ra and Rn tracers inthese settings. We suggest in such an environment thatone should also confirm the spatial heterogeneity withsome preliminary seepage meter deployments andgeophysical techniques; and use traditional modelingwith caution, as good results will likely have to use morecomplex models and would require a significant amountof data.
If one plans to work in a coastal plain setting, therelikely will be more homogeneous results. These settingscan still exhibit pseudo-karstic characteristics, especial-ly where anthropogenic influences modify SGD. Deep
41W.C. Burnett et al. / Science of the Total Environment xx (2006) xxx–xxx
ARTICLE IN PRESS
pilings at the Shelter Island site artificially createdenhanced SGD. Bulk-headed shorelines, dredged chan-nels that intercept shallow confined aquifers orchannelized drainage done to roads or other infrastruc-ture can also introduce karst-like characteristics tootherwise homogeneous aquifers. Seepage metersoften work well in such environments and can providegood estimates, especially when there is a distinctivepattern in the results. Such a pattern might, for example,consist of a systematic drop in seepage rates as afunction of distance offshore and a correlation betweentidal stage and flow. Simple modeling approaches (e.g.,hydraulic gradients, tidal propagation, thermal gradi-ents) can often be valuable in this type of environment.Tracers also will work very well in coastal plainenvironments.
In summary, we make the following suggestions toimprove the performance of future SGD assessments:
1. Some geophysical surveying (e.g., resistivity profil-ing) should be performed prior to the actualassessments so areas prone to high and low SGDcan be mapped out in advance.
2. Point discharge measurements are best recorded inunits of cm/day. It is often most useful to designmeasurements to allow for integrated assessments ofgroundwater flow per unit width of shoreline (e.g.,m3/m day), the best way to make comparisons and toextrapolate results. For example, seepage metertransects normal to the shoreline that cover the entireseepage face (which can be mapped with theresistivity probes) would fit this requirement.
3. The experimental design should put on a spatial andtemporal scale that is appropriate for the methodol-ogies being used.
4. Coordination among groups would ensure thatmethod-to-method intercomparisons could be made.For example, we occasionally had data sets fromdifferent devices that only overlap for short periods.Extending these overlapping periods would benefitthe evaluation process.
5. Because of the expected complexity and importanceof SGD, a continuing effort is strongly recommen-ded; that is, one that can provide measurements ofSGD over time periods encompassing the semidiur-nal tidal period to seasonal climatic variations.
Acknowledgments
The authors of this report are grateful for theassistance received from UNESCO's IntergovernmentalOceanographic Commission (IOC) and the International
Hydrologic Program (IHP), through their project“Assessment and Management Implications of Subma-rine Groundwater Discharge into the Coastal Zone.”Wealso acknowledge support from the International AtomicEnergy Agency (IAEA), which financed this activitythrough their Cooperative Research Project (CRP)entitled “Nuclear and Isotopic Techniques for theCharacterization of Submarine Groundwater Discharge(SGD) in Coastal Zones.” The IAEA is grateful to thegovernment of the Principality of Monaco for thesupport provided to the Marine Environment Laboratoryin Monaco. Lastly, we wish to thank the many localorganizers of the various intercomparison experimentsin Australia, Sicily, New York, Brazil, and Mauritius forall their hard work and patience. Without theircooperation, these experiments could not have beenconducted.
References
Aggarwal PP, Kulkarni KM, Povinec PP, Han L-F, Groening M.Environmental isotope investigation of submarine groundwaterdischarge in Sicily, Italy. Book of extended synopses. Vienna:IAEA; 2004. p. 222–3.
Aggarwal PP, Gat JR, Froehlich KFO. Isotopes in the water cycle: past,present and future of a developing science. Dordrecht: Springer;2005. 381 pp.
Aureli A. Esperienze e programmidi intervento in materia di ricaricadelle falde, per contrastare l'intrusione marina in un acquiferocarbonatico sovrasfruttato. IV Congr. di Geoingegneria”Difesa evalorizzazione del suolo e degli acquiferi”, vol. 3. Torino: Ass.Mineraria Subalpina; 1994. p. 813–8.
Allen AD. Outline of the hydrogeology of the superficial formations ofthe Swan Coastal Plain. Western Australia Geol Surv Ann Rep1976:31–42.
Anderson MP, Chen X. Long and short term transience in agroundwater/lake system in Wisconsin, U.S.A. J Hydrol 1993;145:1–18.
Banks W, Paylor R, Hughes W. Using thermal infrared imagery todelineate groundwater discharge. Groundwater 1996;34:434–44.
Barwell VK, Lee DR. Determination of horizontal-to-verticalhydraulic conductivity ratios from seepage measurements onlake beds. Water Resour Res 1981;17:565–70.
Bates RL, Jackson JA. Dictionary of geological terms. NY: AmericanGeological Institute; 1984.
Baydon-Ghyben W. Nota in verband met de voorgenomen putboringnabij Amsterdam. Koninklyk Instituut Ingenieurs Tijdschrift (TheHague) 1888–1889:8–22.
Bear JA, Cheng HD, Sorek S, Ouuzar D, Herrera I, editors. Seawaterintrusion in coastal aquifers — concepts, methods and practices.Dordrecht, the Netherlands: Kluwer Academic Publishers; 1999.625 pp.
Belanger TV, Montgomery ME. Seepage meter errors. LimnolOceanogr 1992;37:1787–95.
Bogle FR, Loy K. The application of thermal infrared thermographyin the identification of submerged spring in ChickamauraReservoir, Hamilton County, Tennessee. Karst Geohzards.Proceedings of the fifth multidisciplinary conference on
42 W.C. Burnett et al. / Science of the Total Environment xx (2006) xxx–xxx
ARTICLE IN PRESS
sinkholes and the engineering and environmental impacts ofKarst; 1995. p. 415–24. 581pp.
Bokuniewicz H. Groundwater seepage into Great South Bay, NewYork. Estuar Coast Mar Sci 1980;10:437–44.
Bokuniewicz HJ. Analytical descriptions of subaqueous groundwaterseepage. Estuaries 1992;15:458–64.
Bokuniewicz H, Pavlik B. Groundwater seepage along a barrier island.Biogeochemistry 1990;10:257–76.
Bokuniewicz H, Pollock M, Blum J, Wilson R. Submarine groundwater discharge and salt penetration across the sea floor. GroundWater-Oceans Special Issue 2004;42:983–9.
Boldovski NV. Groundwater flow in the coastal zone of the eastSikhote-Alin' volcanogenic belt. Proc. of Int. Symp. onGroundwater Discharge in the Coastal Zone, Land–OceanInteractions in the Coastal Zone (LOICZ), Moscow, July 6–10;1996. p. 8–15.
Boudreau BP, Huettel M, Froster S, Jahnke RA, McLachlan A,Middelburg JJ, et al. Permeable marine sediments: overturning anold paradigm. EOS 2001;82:133–6.
Bouwer H. Groundwater hydrology. New York: McGraw-Hill; 1978.480 pp.
Boyle DR. Design of a seepage meter for measuring groundwaterfluxes in the nonlittoral zones of lakes — evaluation in a borealforest lake. Limnol Oceanogr 1994;39:670–81.
Boyle JM, Saleem ZA. Determination of recharge rate usingtemperature depth profiles in wells. Water Resour Res 1979;15:1616–22.
Bredehoeft JD, Papadopulos IS. Rates of vertical groundwatermovement estimated from the Earth's thermal profile. WaterResour Res 1965;1:325–8.
Brown G, Rogers J, Garbrecht J. Task committee planning: Darcymemorial symposium on the history of hydraulics. J Hydraul Eng2000;126:799–801.
Buddemeier RW, editor. Groundwater discharge in the coastal zone:proceedings of an international symposium, Texel, The Nether-lands; 1996. LOICZ/R and S/96-8, iv+179 pp. LOICZ.
Bugna GC, Chanton JP, Young JE, Burnett WC, Cable PH. Theimportance of groundwater discharge to the methane budget ofnearshore and continental shelf waters of the NE Gulf of Mexico.Geochim Cosmochim Acta 1996;60:4735–46.
Burnett WC. Offshore springs and seeps are focus of working group.EOS 1999;80:13–5.
Burnett WC, Dulaiova H. Estimating the dynamics of groundwaterinput into the coastal zone via continuous radon-222 measure-ments. J Environ Radioact 2003;69:21–35.
Burnett WC, Dulaiova H. Radon as a tracer of submarine groundwaterdischarge into a boat basin in Donnalucata, Sicily. Cont Shelf Res2006;26:862–73.
Burnett WC, Cowart JB, Deetae S. Radium in the Suwannee River andestuary: spring and river input to the Gulf of Mexico.Biogeochemistry 1990;10:237–55.
Burnett WC, Cable JE, Corbett DR, Chanton JP. Tracing groundwaterflow into surface waters using natural 222Rn. Proc. of Int. Symp. onGroundwater Discharge in the Coastal Zone. Land–OceanInteractions in the Coastal Zone (LOICZ), July 6–10, Moscow;1996. p. 22–8.
Burnett WC, Taniguchi M, Oberdorfer J. Measurement and signifi-cance of the direct discharge of groundwater into the coastal zone.J Sea Res 2001a;46/2:109–16.
Burnett WC, Kim G, Lane-Smith D. A continuous radon monitor forassessment of radon in coastal ocean waters. J Radioanal NuclChem 2001b;249:167–72.
Burnett WC, Chanton J, Christoff J, Kontar E, Krupa S, Lambert M, etal. Assessing methodologies for measuring groundwater dischargeto the ocean. EOS 2002;83:117–23.
Burnett WC, Bokuniewicz H, Huettel M, Moore WS, Taniguchi M.Groundwater and porewater inputs to the coastal zone. Biogeo-chemistry 2003a;66:3–33.
Burnett WC, Chanton JP, Kontar E, editors. Submarine groundwaterdischarge, vol. 66(1–2). Spec Issue, Biogeochemistry; 2003b.202 pp.
Burnett WC, Cable JE, Corbett DR. Radon tracing of submarinegroundwater discharge in coastal environments. In: Taniguchi M,Wang K, Gamo T, editors. Land and marine hydrogeology.Amsterdam: Elsevier; 2003c. p. 25–43.
Burnett WC, Peterson R, Moore WS, de Oliveira, J. Radon and radiumisotopes as tracers of submarine groundwater discharge — resultsfrom the Ubatuba, Brazil SGD assessment intercomparison. EstuarCoast Shelf Sci submitted for publication.
Cable J, Bugna G, Burnett W, Chanton J. Application of 222Rn andCH4 for assessment of groundwater discharge to the coastal ocean.Limnol Oceanogr 1996a;41:1347–53.
Cable JE, Burnett WC, Chanton JP, Weatherly GL. Estimatinggroundwater discharge into the northeastern Gulf of Mexicousing radon-222. Earth Planet Sci Lett 1996b;144:591–604.
Cable JE, Burnett WC, Chanton JP, Corbett DR, Cable PH. Fieldevaluation of seepage meters in the coastal marine environment.Estuar Coast Shelf Sci 1997a;45:367–75.
Cable JE, Burnett WC, Chanton JP. Magnitudes and variations ofgroundwater seepage into shallow waters of the Gulf of Mexico.Biogeochemistry 1997b;38:189–205.
Cable JE, Martin J, Swarzenski P, Lindenburg M, Steward J.Advection within shallow pore waters of a coastal lagoon. GroundWater 2004;42:1011–20.
Capone DG, Bautista MF. A groundwater source of nitrate innearshore marine sediments. Nature 1985;313:214–6.
Capone DG, Slater JM. Interannual patterns of water table height andgroundwater derived nitrate in nearshore sediments. Biogeochem-istry 1990;10:277–88.
Cartwright K. Measurement of fluid velocity using temperatureprofiles: experimental verification. J Hydrol 1979;43:185–94.
Četina M, Rajar R, Povinec P. Modelling of circulation and dispersionof radioactive pollutants in the Japan Sea. Oceanol Acta2000;23:819–36.
Chanton JP, Burnett WC, Taniguchi M, Dulaiova H, Corbett DR.Seepage rate variability derived by Atlantic tidal height.Biogeochemistry 2003;66:187–202.
Charette MA, Sholkovitz ER. Oxidative precipitation of groundwater-derived ferrous iron in the subterranean estuary of a coastal bay.Geophys Res Lett 2002;29:1444.
Charette MA, Buesseler KO, Andrews JE. Utility of radium isotopes forevaluating the input and transport of groundwater-derived nitrogen toa Cape Cod estuary. Limnol Oceanogr 2001; 46:465–70.
Cherkauer DS, McBride JM. A remotely operated seepage meter foruse in large lakes and rivers. Ground Water 1988;26:165–71.
Church TM. An underground route for the water cycle. Nature1996;380:579–80.
Considine DM, editor. Van Nostrand's scientific encyc. 8th ed.Reinhold: NY Van Nostrand; 1995.
Constantz J, Thomas CL, Zellweger G. Influence of diurnal variationsin stream temperature on streamflow loss and groundwaterrecharge. Water Resour Res 1994;30:3253–64.
Corbett DR, Cable JE. Seepage meters and advective transport incoastal environments: comments on “Seepage Meters and
43W.C. Burnett et al. / Science of the Total Environment xx (2006) xxx–xxx
ARTICLE IN PRESS
Bernoulli's Revenge” by E.A. Shinn, C.D. Reich, and T.D. Hickey.Estuaries 2002;25:126–32. Estuaries 2002;26:1383–9.
Corbett DR, Chanton J, Burnett W, Dillon K, Rutkowski C,Fourqurean J. Patterns of groundwater discharge into FloridaBay. Limnol Oceanogr 1999;44:1045–55.
Corbett DR, Dillon K, Burnett W, Chanton J. Estimating thegroundwater contribution into Florida Bay via natural tracers222Rn and CH4. Limnol Oceanogr 2000;45:1546–57.
Cornett RJ, Risto BA, Lee DR. Measuring groundwater transportthrough lake sediments by advection and diffusion. Water ResourRes 1989;25:1815–23.
Crotwell AM, Moore WS. Nutrient and radium fluxes from submarinegroundwater discharge to Port Royal Sound, South Carolina.Aquat Geochem 2003;9:191–208.
D'Elia CF, Webb DKL, Porter JW. Nitrate-rich groundwater inputs toDiscovery Bay, Jamaica: a significant source of N to local coralreefs? Bull Mar Sci 1981;31:903–10.
Destouni G, Prieto C. On the possibility for generic modeling of subma-rine groundwater discharge. Biogeochemistry 2003;66:171–86.
DiLorenzo, JL, Ram RV. Flushing-time estimates for West NeckHarbor: a small tidal embayment of the Peconic Bays, New York.Report— Najarian Associates, L.P. Eatontown, New Jersey, 1991.44 pp.
Domenico PA, Palciauskas VV. Theoretical analysis of forcedconvective heat transfer in regional ground-water flow. Geol SocAmer Bull 1973;84:3803–13.
Dulaiova H, Peterson R, Burnett WC. A multi-detector continuousmonitor for assessment of 222Rn in the coastal ocean. J RadioanalNucl Chem 2005;263(2):361–5.
Ellins KK, Roman-Mas A, Lee R. Using Rn-222 to examine groundwater/surface discharge interaction in the Rio Grande de Manati,Puerto Rico. J Hydrol 1990;115:319–41.
Fanning KA, Byrne RH, Breland JA, Betzer PR, Moore WS, ElsingerRJ, et al. Geothermal springs of the west Florida continental shelf.Evidence for dolomitization and radionuclide enrichment. EarthPlanet Sci Lett 1981;52:345–54.
Fellows CR, Brezonik PL. Seepage flow into Florida lakes. WaterResour Bull 1980;16:635–41.
Fischer WA, Moxham RM, Polcyn F, Landis GH. Infrared surveys ofHawaiian volcanoes. Science 1964;146:733–42.
Fisher AT, Von Herzen RP, Blum P, Hoppie B, Wang K. Evidence mayindicate recent warming of shallow slope bottom water off NewJersey shore. EOS 1999;80:171–3.
Freeze RA, Cherry JA. Groundwater. Englewood Cliffs, NJ: Prentice-Hall Inc.; 1979. 604 pp.
Fritz P, Cherry JA, Weyer KU, Sklash M. Storm runoff analyses usingenvironmental isotopes and major ions. Interpretation of environ-mental isotope and hydrochemical data in groundwater hydrology.Vienna: IAEA; 1976. p. 111–30.
Fukuo Y. Studies on groundwater seepage in the bottom of Lake Biwa.Report for Environmental Sciences by the Ministry of Education,Science and Culture, Japan, 1986, B289-R-12-2, 1–23.
Fukuo Y, Kaihotsu I. A theoretical analysis of seepage flow of theconfined groundwater into the lake bottom with a gentle slope.Water Resour Res 1988;4:1949–53.
Garrels RM, MacKenzie FT. Evolution of sedimentary rocks. NewYork: Norton and Co.; 1971. 397 pp.
Garrison GH, Glenn CR, McMurtry GM. Measurement of submarinegroundwater discharge in Kahana Bay, Oahu, Hawaii. LimnolOceanogr 2003;48:920–8.
Giorgi L, Borcheillini S, Delucchi L. Ile Maurice, Carte Geologique au1:50 000, Schema hydrogeologique, Geolab, July 1999.
Glover, R.E. The patterns of fresh-water flow in a coastal aquifer. In:Cooper Jr. HH, Kohout FA, Henry HR, Glover RE, editors. Seawater in coastal aquifers (pp. C32–C35). U.S. Geological SurveyWater Supply Paper; 1964, p. 1613-C.
Granier A. Une nouvelle methode pour la measure du flux de sevebrute dans tronc desarbres. Ann Sci For 1985;42:81–8.
Henry HR. Interface between salt water and fresh water in a coastalaquifer. In: Cooper Jr. HH, Kohout FA, Henry HR, Glover RE,editors. Sea water in coastal aquifers (pp C35–C70). U.S.Geological Survey Water Supply Paper; 1964, p. 1613-C.
Herzberg A. Die wasserversorgung einiger Nordseebader. JournalGasbeleuchtung und Wasserversorgung (Munich) 1901; 44: 815–819, 842–844.
Hubbert MK. The theory of ground-water motion. J Geol 1940;48:785–944.
Huettel M, Gust G. Solute release mechanisms from confined sedimentcores in stirred benthic chambers and flume flows. Mar Ecol, ProgSer 1992;82:187–97.
Hussain N, Church TM, Kim G. Use of 222Rn and 226Ra to tracesubmarine groundwater discharge into the Chesapeake Bay. MarChem 1999;65:127–34.
Huettel M, Ziebis W, Forester S. Flow-induced uptake of parti-culate matter in permeable sediments. Limnol Oceanogr 1996;41:309–22.
Hwang DW, Kim G, Lee Y-W, Yang H-S. Estimating submarine inputsof groundwater and nutrients to a coastal bay using radiumisotopes. Mar Chem 2005;96:61–71.
Israelsen OW, Reeve RC. Canal lining experiments in the delta area,Utah. Utah Agr Exp Sta Tech Bull 1944;313 52pp.
Jackson JA, editor. Glossary of geology. 4th ed. VA: AmericanGeological Institute Alexandria; 1977.
Johannes RE. The ecological significance of the submarine dischargeof groundwater. Mar Ecol, Prog Ser 1980;3:365–73.
Kelly RP, Moran SB. Seasonal changes in groundwater input to awell-mixed estuary estimated using radium isotopes and implica-tions for coastal nutrient budgets. Limnol Oceanogr 2002;47:1796–807.
Kim G, Hwang DW. Tidal pumping of groundwater into the coastalocean revealed from submarine Rn-222 and CH4 monitoring.Geophys Res Lett 2002;29. doi:10.1029/2002GL015093.
Kim G, Lee KK, Park KS, Hwang DW, Yang HS. Large submarinegroundwater discharge (SGD) from a volcanic island. GeophysRes Lett 2003;30. doi:10.1029/2003GL018378.
Kim G, Ryu JW, Yang HS, Yun ST. Submarine groundwater discharge(SGD) into the Yellow Sea revealed by Ra-228 and Ra-226isotopes: implications for global silicate fluxes. Earth Planet SciLett 2005;237(1–2):156–66.
Kitheka JU. Groundwater outflow and its linkage to coastal circulationin a Mangrove-fringed Creek in Kenya. Estuar Coast Shelf Sci1988;47:63–75.
Kohout FA. Submarine springs: a neglected phenomenon of coastalhydrology. Hydrology 1966;26:391–413.
Krest JM, Harvey JW. Using natural distributions of short-livedradium isotopes to quantify groundwater discharge and recharge.Limnol Oceanogr 2003;48:290–8.
Krest JM, Moore WS, Gardner LR. Marsh nutrient export supplied bygroundwater discharge: evidence from radium measurements.Glob Biogeochem Cycles 2000;14:167–76.
Krupa SL, Belanger TV, Heck HH, Brok JT, Jones BJ. Krupaseep —the next generation seepage meter. J Coast Res 1998;25:210–3.
Lapham WW. Use of temperature profiles beneath streams todetermine rates of vertical ground-water flow and vertical
44 W.C. Burnett et al. / Science of the Total Environment xx (2006) xxx–xxx
ARTICLE IN PRESS
hydraulic conductivity. U S Geol Surv Water Supply Pap 1989;2337. 35 pp.
Lapointe BE, O'Connell J. Nutrient-enhanced growth of Cladophoraprolifera in Harrington Sound, Bermuda: eutrophication of aconfined, phosphorus-limited marine ecosystem. Estuar CoastShelf Sci 1989;28:347–60.
Lapointe B, O'Connell JD, Garrett GS. Nutrient coupling betweenon-site sewage disposal systems, groundwaters, and nearshoresurface waters of the Florida Keys. Biogeochemistry1990;10:289–307.
LaRoche J, Nuzzi R, Waters R, Wyman K, Falkowski PG, WallaceDWR. Brown tide blooms in Long Island's coastal waters linked tointerannual variability in groundwater flow. Glob Change Biol1997;3:397–410.
Lee DR. A device for measuring seepage flux in lakes and estuaries.Limnol Oceanogr 1977;22:140–7.
Levy-Palomo I, Comanducci JF, Povinec PP. Investigation ofsubmarine groundwater discharge in Sicilian and Brazilian coastalwaters using underwater gamma spectrometer. Book of extendedsynopses. Vienna: IAEA; 2004. p. 228–9.
Li L, Barry DA, Stagnitti F, Parlange JU. Submarine groundwaterdischarge and associated chemical input into a coastal sea. WaterResour Res 1999;35:3253–9.
Libelo EL, MacIntyre WG. Effects of surface-water movement onseepage-meter measurements of flow through the sediment–waterinterface. Hydrogeol J 1994;2:49–54.
Linderfelt WR, Turner JV. Interaction between shallow groundwa-ter, saline surface water and nutrient discharge in a seasonalestuary: the Swan-Canning River and estuary system, WesternAustralia. Hydrological processes special issue: integratingresearch and management for an urban estuarine system: theSwan-Canning Estuary, Western Australia. Hydrol Process2001;15:2631–53.
Loveless AM. Biogeochemical, spatial and temporal dynamics ofsubmarine groundwater discharge in an oligotrophic semi-enclosed coastal embayment. PhD thesis 2006, University ofWestern Australia, Perth, Australia.
Lu N, Ge S. Effect of horizontal heat and fluid flow on the verticaltemperature distribution in a semiconfining layer. Water ResourRes 1996;32:1449–53.
Mahiques MM. Sedimentary dynamics of the bays off Ubatuba,State of São Paulo. Bol Inst Oceanogr, São Paulo 1995;43(2):111–22.
Martin JB, Cable JE, Jaeger J, Hartl K, Smith CG. Thermal andchemical evidence for rapid water exchange in the Indian RiverLagoon, Florida. Limnol Oceanogr 2006;51:1332–41.
McBride MS, Pfannkuch HO. The distribution of seepage withinlakebed. J Res US Geol Surv 1975;3:505–12.
McDonald MG, Harbaugh AW. A modular three-dimensional finite-difference groundwater flow model. US Geol Surv Open-FileReport 1984;83–875. 528p.
Mesquita AR. Marés, circulação e nível do mar na Costa Sudeste doBrasil. São Paulo: Relatório Fundespa; 1997.
Michael HA, Lubetsky JS, Harvey CF. Characterizing submarinegroundwater discharge: a seepage meter study in Waquoit Bay,Massachusetts. Geophys Res Lett 2003;30(6). doi:10.1029/GL016000.
Michael HA, Mulligan AE, Harvey CF. Seasonal oscillations in waterexchange between aquifers and the coastal ocean. Nature2005;436:1145–8.
Ministry of Public Works. Hydrology data book (1995–1999).Mauritius: Water Resources Unit; 2003.
Moore WS. Large groundwater inputs to coastal waters revealed by226Ra enrichments. Nature 1996;380:612–4.
Moore WS. High fluxes of radium and barium from the mouth of theGanges-Brahmaputra River during low river discharge suggest alarge groundwater source. Earth Planet Sci Lett 1997; 150:141–50.
Moore WS. The subterranean estuary: a reaction zone of ground waterand sea water. Mar Chem 1999;65:111–25.
Moore WS. Determining coastal mixing rates using radium isotopes.Cont Shelf Res 2000;20:1995–2007.
Moore WS. Radium isotopes as tracers of submarine groundwaterdischarge in Sicily. Cont Shelf Res 2006;26:852–61.
Moore WS, Arnold R. Measurement of 223Ra and 224Ra in coastalwaters using a delayed coincidence counter. J Geophys Res 1996;101:1321–9.
Moore WS, Shaw TJ. Chemical signals from submarine fluidadvection onto the continental shelf. J Geophys Res - Oceans1998;103:21543–52.
MooreWS, Wilson AM. Advective flow through the upper continentalshelf driven by storms, buoyancy, and submarine groundwaterdischarge. Earth Planet Sci Lett 2005;235:564–76.
Moore WS, de Oliveira J. Determination of residence time and mixingprocesses of the Ubatuba, Brazil, inner shelf waters using naturalRa isotopes. Estuar Coast Shelf Sci submitted for publication.
Moore WS, Shaw TJ. Fluxes and behavior of radium isotopes, barium,and uranium in seven Southeastern US rivers and estuaries. MarChem submitted for publication.
Moore WS, Krest J, Taylor G, Roggenstein E, Joye S, Lee R. Thermalevidence of water exchange through a coastal aquifer: implicationsfor nutrient fluxes. Geophys Res Lett 2002;29. doi:10.1029/2002GL014923.
Muir, K.S. Groundwater reconnaissance of the Santa Barbara —Montecito Area, Santa Barbara County, California. U. S. Geol.Surv. Water Supply Pap 1968; 1859-A, 28 pp.
Nield SP, Townley LR, Barr AD. A framework for quantitativeanalysis of surface water–groundwater interaction: flow geometryin a vertical section. Water Resour Res 1994;30:2461–75.
Nielsen P. Tidal dynamics in the water table in a beach. Water ResourRes 1990;26:2127–34.
Nixon SW, Ammerman JW, Atkinson LP, Berounsky VM, Billen G,Boicourt WC, et al. The fate of nitrogen and phosphorus at theland–sea margin of the North Atlantic Ocean. Biogeochemistry1996;35:141–80.
Oberdorfer, J.A. Numerical modeling of coastal discharge: predictingthe effects of climate change, Groundwater discharge in thecoastal zone, in LOICZ IGBP, 69–75, edited by R.W. Budde-meier, pp. 179, LOICZ, Texel, Netherlands, Russian Academy ofSciences, Moscow, 1996.
Oberdorfer, J. Fresh groundwater discharge to the coastline of theCurepipe Aquifer, Mauritius. Submarine Groundwater DischargeAssessment Intercomparison Experiment, Mauritius; Report toUNESCO, 2005.
Oberdorfer JA, Valentino MA, Smith SV. Groundwater contribution tothe nutrient budget of Tomales Bay, California. Biogeochemistry1990;10:199–216.
O'Rourke, D. Quantifying specific discharge into West Neck Bay,Shelter Island, New York using a three-dimensional finite-difference groundwater flow model and continuous measure-ments with an ultrasonic seepage meter. Master's Thesis, StateUniversity of New York at Stony Brook, 2000.
Paulsen RJ, Smith CF, O'Rourke D, Wong T. Development andevaluation of an ultrasonic ground water seepage meter. GroundWater 2001;39:904–11.
45W.C. Burnett et al. / Science of the Total Environment xx (2006) xxx–xxx
ARTICLE IN PRESS
Pluhowski EJ, Kantrowitz IH. Hydrology of the Babylon–Islip Area,Suffolk County, Long Island, New York. US Geol Surv WaterSupply Pap 1964; 1768. 128 pp.
Porcelli D, Swarzenski PW. The behaviour of U- and Th seriesnuclides in groundwater and the tracing of groundwater. RevMineral Geochem 2003;52:317–61.
Povinec PP, La Rosa J, Lee S-H, Mulsow S, Osvath I, Wyse E. Recentdevelopments in radiometric and mass spectrometry methods formarine radioactivity measurements. J Radioanal Nucl Chem2001;248:713–8.
Proag V. The geology and water resource of Mauritius. Mauritius:Mahatma Gandhi Institute; 1995.
Rajar R, agar D, Širca A, Horvat M. Three-dimensional modeling ofmercury cycling in the Gulf of Trieste. Sci Total Environ 2000;260:109–23.
Rama, Moore WS. Using the radium quartet for evaluatinggroundwater input and water exchange in salt marshes. GeochimCosmochim Acta 1996;60:4245–52.
Rapaglia, J., Beck, A., Stieglitz, T., Bokuniewicz, H., Kontar, E.Submarine groundwater discharge patterns through volcanic frac-tured rock. Submarine Groundwater Discharge Assessment Inter-comparison Experiment, Mauritius; Report to UNESCO; 2006.
Reich CD, Shinn EA, Hickey TD, Tihansky AB. Tidal andmeteorological influences on shallow marine groundwater flowin the upper Florida Keys. In: Porter JW, Porter KG, editors. TheEverglades, Florida Bay, and coral reefs of the Florida Keys. BocaRaton: CRC Press; 2002. p. 659–76.
Riedl R, Huang N, Machan R. The subtidal pump: a mechanismof interstitial water exchange by wave action. Mar Biol 1972;13:210–21.
Robinson MA. A finite element model of submarine ground waterdischarge to tidal estuarine waters. PhD dissertation, VirginiaPolytechnic Institute; 1996.
Rosenberg ND, Lupton JE, Kadko D, Collier R, Lilly MD, Pak H.Estimation of heat and chemical fluxes from a seafloorhydrothermal vent field using radon measurements. Nature1988;334:604–8.
Roxburgh IS. Thermal infrared detection of submarine spring associa-ted with the Plymouth Limestone. Hydrol Sci J 1985;30:185–96.
Sakura Y. The method for estimations of the groundwater velocityfrom temperature distributions: on the groundwater aroundSapporo, Japan. Stud Water Temp 1977;21:2–14.
Sayles FL, Dickinson WH. The seep meter: a benthic chamber for thesampling and analysis of low velocity hydrothermal vents. Deep-Sea Res 1990;88:1–13.
Schubert CE. Areas contributing ground water to the Peconic estuary,and ground-water budgets for the North and South forks andShelter Island, Eastern Suffolk County, New York. U.S. GeologicalSurvey, Water Resources Investigations Report 97-4136, 1998.
Schluter M, Suess E, Linke P, Sauter E. SUBGATE — coordination:submarine groundwater fluxes and transport processes frommethane-rich coastal environments. In: Suess E, editor. GEOMARreport, vol. 97. Germany: Kiel; 2000. p. 119–20.
Sekulic B, Vertacnik A. Balance of average annual fresh water inflowinto the Adriatic Sea. Water Resour Dev 1996;12:89–97.
Sellinger. Groundwater flux into a portion of eastern Lake Michigan. JGreat Lakes Res 1995;21:53–63.
Shaw RD, Prepas EE. Anomalous, short-term influx of water intoseepage meters. Limnol Oceanogr 1989;34:1343–51.
Shaw RD, Prepas EE. Groundwater–lake interactions: I. Accuracy ofseepage meter estimations of lake seepage. J Hydrol 1990a;119:105–20.
Shaw RD, Prepas EE. Groundwater–lake interactions: II. Nearshoreseepage patterns and the contribution of ground water to lakes incentral Alberta. J Hydrol 1990b;119:121–36.
Shinn EA, Reich CD, Hickey TD. Seepage meters and Bernoulli'srevenge. Estuaries 2002;25:126–32.
Sholkovitz ER, Herbold C, Charette MA. An automated dye-dilutionbased seepage meter for the time-series measurement ofsubmarine groundwater discharge. Limnol Oceanogr Methods2003;1:17–29.
Sillman SE, Booth DF. Analysis of time-series measurements ofsediment temperature for identification of gaining vs. losingportions of Juday Creek, Indiana. J. Hydrol 1993;146:131–48.
Smith L, Chapman DS. On the thermal effects of groundwater flow: 1.Regional scale system. J Geophys Res 1983;88:593–608.
Smith AJ, Nield SP. Groundwater discharge from the superficialaquifer into Cockburn Sound Western Australia: estimation byinshore water balance. Biogeochemistry 2003;66:125–44.
Smith, A.J., Turner, J.V. Density-dependent surface water–groundwa-ter interaction and nutrient discharge: The Swan-Canning Riverand estuary system, Western Australia. Hydrological ProcessesSpecial Issue: Integrating Research and Management for an UrbanEstuarine System: The Swan-Canning Estuary, Western Australia.Hydrological Processes, 15, 2595–2616, 2001.
Smith L, Zawadzki W. A hydrogeologic model of submarinegroundwater discharge: Florida intercomparison experiment.Biogeochemistry 2003;66:95–110.
Smith AJ, Turner JV, Herne DE, Hick WP. Quantifying submarinegroundwater discharge and nutrient discharge into CockburnSound Western Australia. CSIRO Land and Water. Perth; 2003.p. 185.
Stallman RW. Computation of groundwater velocity from temperaturedata. US Geol Surv Water Supply Pap 1963;1544-H:36–46.
Stallman RW. Steady one-dimensional fluid flow in a semi-infiniteporous medium with sinusoidal surface temperature. J GeophysRes 1965;70:2821–7.
Stiegeler SE. A dictionary of earth science. NY: PICA Press; 1977.Stieglitz T. Submarine groundwater discharge into the near-shore zone
of the Great Barrier Reef, Australia. Mar Pollut Bull 2005;51:51–9.
Stieglitz T, Taniguchi M, Neylon S. Spatial variability of submarinegroundwater discharge, Ubatuba, Brazil. Est Coast Shelf Scisubmitted for publication.
Suzuki S. Percolation measurements based on heat flow through soilwith special reference to paddy fields. J Geophys Res1960;65:2883–5.
Swarzenski PW, Reich CD, Spechler RM, Moore WS. Using multiplegeochemical tracers to characterize the hydrogeology of thesubmarine spring off Crescent Beach, Florida. Chem Geol2002;179:187–202.
Talbot JM, Kroeger KD, Rago A, Allen MC, Charette MA. Nitrogenflux and speciation through the subterranean estuary of WaquoitBay, Massachusetts. Biol Bull 2003;205:244–5.
Tanaka T, Ono T. Contribution of soil water and its flow path tostormflow generation in a forested headwater catchment in centralJapan. IAHS Publ 1998;248:181–8.
Taniguchi M. Evaluation of vertical groundwater fluxes and thermalproperties of aquifers based on transient temperature–depthprofiles. Water Resour Res 1993;29:2021–6.
Taniguchi M. Estimated recharge rates from groundwater temperaturesin Nara basin, Japan. Appl Hydrogeol 1994;2:7–13.
Taniguchi M. Change in groundwater seepage rate into Lake Biwa,Japan. Jpn J Limnol 1995;56:261–7.
46 W.C. Burnett et al. / Science of the Total Environment xx (2006) xxx–xxx
ARTICLE IN PRESS
Taniguchi M. Evaluation of the saltwater–groundwater interface fromborehole temperature in a coastal region. Geophys Res Lett 2000;27:713–6.
Taniguchi M. Tidal effects on submarine groundwater discharge into theocean. Geophys Res Lett 2002;29. doi:10.1029/2002GL014987.
Taniguchi M, Fukuo Y. Continuous measurements of ground-waterseepage using an automatic seepage meter. Ground Water 1993;31:675–9.
Taniguchi M, Fukuo Y. An effect of seiche on groundwater seepagerate into Lake Biwa, Japan. Water Resour Res 1996;32:333–8.
Taniguchi M, Iwakawa H. Measurements of submarine groundwaterdischarge rates by a continuous heat-type automated seepage meterin Osaka Bay, Japan. J Groundw Hydrol 2001;43:271–7.
Taniguchi M, Sakura Y, Ishii T. Estimations of saltwater–fresh waterinterfaces and groundwater discharge rates in coastal zones fromborehole temperature data. Proceeding of Japanese Association ofGroundwater Hydrology Meeting, Tokyo, October; 1998. p. 86–9.
Taniguchi M, Shimada J, Tanaka T, Kayane I, Sakura Y, Shimano Y, etal. Disturbances of temperature–depth profiles due to surfaceclimate change and subsurface water flow: 1. An effect of linearincrease in surface temperature caused by global warming andurbanization in the Tokyo metropolitan area, Japan. Water ResourRes 1999a;35:1507–17.
Taniguchi M, Williamson DR, Peck AJ. Disturbances of temperature–depth profiles due to surface climate change and subsurface waterflow: 2. An effect of step increase in surface temperature caused byforest clearing in southwest Western Australia. Water Resour Res1999b;35:1519–29.
Taniguchi M, Inouchi K, Tase N, Shimada J. Combination of tracerand numerical simulations to evaluate the groundwater capturezone. IAHS Publ 1999c;258:207–13.
Taniguchi M, Burnett WC, Cable JE, Turner JV. Investigations ofsubmarine groundwater discharge. Hydrol Process 2002;16:2115–29.
Taniguchi M, Turner JV, Smith A. Evaluations of groundwaterdischarge rates from subsurface temperature in Cockburn Sound,Western Australia. Biogeochemistry 2003a;66:111–24.
Taniguchi M, Burnett WC, Smith CF, Paulsen RJ, O'Rourke D, KrupaS, et al. Spatial and temporal distributions of submarinegroundwater discharge rates obtained from various types ofseepage meters at a site in the northeastern Gulf of Mexico.Biogeochemistry 2003b;66:35–53.
Taniguchi M, Burnett WC, Dulaiova H, Kontar EA, Povinic PP, MooreWS. Submarine groundwater discharge measured by seepagemeters in Sicilian coastal waters. Cont Shelf Res 2006;26:835–42.
Todd DK. Groundwater hydrology. 2nd edition. NY: John Wiley andSons; 1980. 535 pp.
Tsunogai U, Ishibashi J, Wakita H, Gamo T. Methane-rich plumes inthe Suruga Trough (Japan) and their carbon isotopic characteriza-tion. Earth Planet Sci Lett 1999;160:97–105.
Vacher HL. Dupuit–Ghyben–Herzberg analysis of strip-island lenses.Geol Soc Amer Bull 1988;100:580–91.
Valiela I, D'Elia C. Groundwater inputs to coastal waters. Special IssueBiogeochemistry 1990;10 [328 pp.].
Valiela I, Teal JM, Volkman S, Shafer D, Carpenter EJ. Nutrient andparticulate fluxes in a salt marsh ecosystem: tidal exchanges andinputs by precipitation and groundwater. Limnol Oceanogr 1978;23:798–812.
Valiela I, Foreman K, LaMontagne M, Hersh D, Costa J, Peckol P, etal. Couplings of watersheds and coastal waters: sources andconsequences of nutrient enrichment in Waquoit Bay, Massachu-setts. Estuaries 1992;15:443–57.
Valiela I, Bowen JL, Kroeger KD. Assessment of models forestimation of land-derived nitrogen loads to shallow estuaries.Appl Geochem 2002;17:935–53.
Vanek V. Groundwater regime of a tidally influenced coastal pond.J Hydrol 1993;151:317–42.
Webster IT, Norquay SJ, Ross FC, Wooding RA. Solute exchange byconvection within estuarine sediments. Estuar Coast Shelf Sci1996;42:171–83.
Williams MO. Bahrain: port of pearls and petroleum. Natl Geogr1946;89:194–210.
Williams JB, PinderIII JE. Ground water flow and runoff in a coastalplain stream. Water Resour Bull 1990;26:343–52.
Winter TC. The interaction of lakes with variably saturated porousmedia. Water Resour Res 1983;19:1203–18.
Winter TC. Effect of ground-water recharge on configuration of thewater table beneath sand dunes and on seepage in lakes in the sandhills of Nebraska, U.S.A. J Hydrol 1986;86:221–37.
Winter TC. Numerical simulation analysis of the interaction of lakesand groundwater. US Geol Survey Prof Paper 1996;1001 [45 pp.].
Wright, M.D. The flushing and circulation patterns of Jervoise Bay,Northern Harbour. BEng Honours Thesis, University of WesternAustralia, Perth, 2000.
Wyatt A. Challinor's dictionary of geology. 6th ed. Cardiff: Universityof Wales Press; 1986. 374 pp.
Younger PL. Submarine groundwater discharge. Nature 1996;382:121–2.
Zektser, I.S. Groundwater discharge into the seas and oceans: state ofthe art. In: Buddemeier RW, editor. Groundwater discharge in thecoastal zone (pp. 122–123). LOICZ IGBP, LOICZ, Texel, Nether-lands, Russian Academy of Sciences, Moscow, 1996, 179 pp.
Zektser IS. Groundwater and the environment: applications for theglobal community. Boca Raton: Lewis Publishers; 2000. 175 pp.
Zektser IS, Dzhamalov RG. Groundwater discharge to the PacificOcean. Hydrol Sci Bull 1981;26:271–9.
Zektser IS, Loaiciga HA. Groundwater fluxes in the global hydrologiccycle: past, present and future. J Hydrol 1993;144:405–27.
Zektzer IS, Ivanov VA, Meskheteli AV. The problem of directgroundwater discharge to the seas. J Hydrol 1973;20:1–36.
Related Documents