QUANTIFYING HISTOLOGICAL CHANGES IN ARCHAEOLOGICAL BONES USING BSE-SEM IMAGE ANALYSIS G. TURNER-WALKER Ancient Biomolecules Group, Fossil Fuels and Environmental Geochemistry, Drummond Building, University of Newcastle, Newcastle upon Tyne NE1 7RU, UK and U. SYVERSEN Faculty of Medicine, Department of Intra-abdominal Diseases, Norwegian University of Science and Technology, (NTNU), N-7489 Trondheim, Norway KEYWORDS: BONE DIAGENESIS, HISTOLOGICAL DESTRUCTION, BSE- SEM, BIOEROSION INDEX, WHARRAM PERCY , CALCIUM:PHOSPHATE RATIO INTRODUCTION The processes affecting bone and other hard tissues in the burial environment are extremely complex, but major advances have been made over the past decade in understanding the interplay of chemical factors (Collins et al. 1995; Nielsen-Marsh and Hedges 1997; Collins et al. 1998, 2000; Nielsen-Marsh et al. 2000) and biological factors (Antoine et al. 1997; Child 1995a,b) leading to bone preservation or decay. Post-mortem degradation of bone is dominated by loss of structural collagen which can proceed by either biological or chemical pathways, i.e. the protein may be attacked by collagenolytic enzymes or it may undergo hydrolysis to soluble peptide fragments. Because of the intimate association between collagen and bone mineral however, the protein component is shielded from bacterial attack because spaces between bone apatite crystallites are too small to allow collagenolytic enzymes access to the collagen fibres. In order to utilise the collagen in buried bone, soil bacteria must therefore first remove the barrier represented by bone mineral using extracellular organic acids. It is the solubilization and reprecipitation of bone mineral, and porosity increases resulting from bacterial attack that are responsible for observed changes in the histological appearance of archaeological bones compared to fresh bone samples. © University of Oxford 2002 Archaeometry 44, 3 (2002) 461-468. Printed in Great Britain Recent years have seen rapid developments in the understanding of diagenetic changes to archaeological bones. In particular, the degradation or preservation of proteins and other biomolecules has been explored using an increasingly sophisticated battery of analytical techniques. Problems remain however in correlating these parameters with physical changes to bone that may be observed microscopically. This is due, in part, to the problems in reproducibly quantifying histological changes to archaeological bone. This paper introduces a novel method for the accurate quatification of these changes employing image analysis of SEM images. Self-consistency of results was tested using measurements of total calcium content at different magnifications. The term bioerosion index is suggested for the measured parameter.

Welcome message from author
This document is posted to help you gain knowledge. Please leave a comment to let me know what you think about it! Share it to your friends and learn new things together.
Transcript

QUANTIFYING HISTOLOGICAL CHANGES IN ARCHAEOLOGICAL BONES USING BSE-SEM IMAGE ANALYSIS
G. TURNER-WALKER
Ancient Biomolecules Group, Fossil Fuels and Environmental Geochemistry, Drummond Building, University of Newcastle, Newcastle upon Tyne NE1 7RU, UK
and U. SYVERSEN
Faculty of Medicine, Department of Intra-abdominal Diseases, Norwegian University of Science and Technology, (NTNU), N-7489 Trondheim, Norway
KEYWORDS: BONE DIAGENESIS, HISTOLOGICAL DESTRUCTION, BSE-SEM, BIOEROSION INDEX, WHARRAM PERCY, CALCIUM:PHOSPHATE RATIO
INTRODUCTION
The processes affecting bone and other hard tissues in the burial environment are extremely complex, but major advances have been made over the past decade in understanding the interplay of chemical factors (Collins et al. 1995; Nielsen-Marsh and Hedges 1997; Collins et al. 1998, 2000; Nielsen-Marsh et al. 2000) and biological factors (Antoine et al. 1997; Child 1995a,b) leading to bone preservation or decay. Post-mortem degradation of bone is dominated by loss of structural collagen which can proceed by either biological or chemical pathways, i.e. the protein may be attacked by collagenolytic enzymes or it may undergo hydrolysis to soluble peptide fragments. Because of the intimate association between collagen and bone mineral however, the protein component is shielded from bacterial attack because spaces between bone apatite crystallites are too small to allow collagenolytic enzymes access to the collagen fibres. In order to utilise the collagen in buried bone, soil bacteria must therefore first remove the barrier represented by bone mineral using extracellular organic acids. It is the solubilization and reprecipitation of bone mineral, and porosity increases resulting from bacterial attack that are responsible for observed changes in the histological appearance of archaeological bones compared to fresh bone samples.
© University of Oxford 2002
Archaeometry 44, 3 (2002) 461-468. Printed in Great Britain
Recent years have seen rapid developments in the understanding of diagenetic changes to archaeological bones. In particular, the degradation or preservation of proteins and other biomolecules has been explored using an increasingly sophisticated battery of analytical techniques. Problems remain however in correlating these parameters with physical changes to bone that may be observed microscopically. This is due, in part, to the problems in reproducibly quantifying histological changes to archaeological bone. This paper introduces a novel method for the accurate quatification of these changes employing image analysis of SEM images. Self-consistency of results was tested using measurements of total calcium content at different magnifications. The term bioerosion index is suggested for the measured parameter.

G. Turner-Walker and U. Syversen Histological changes in archaeological bones
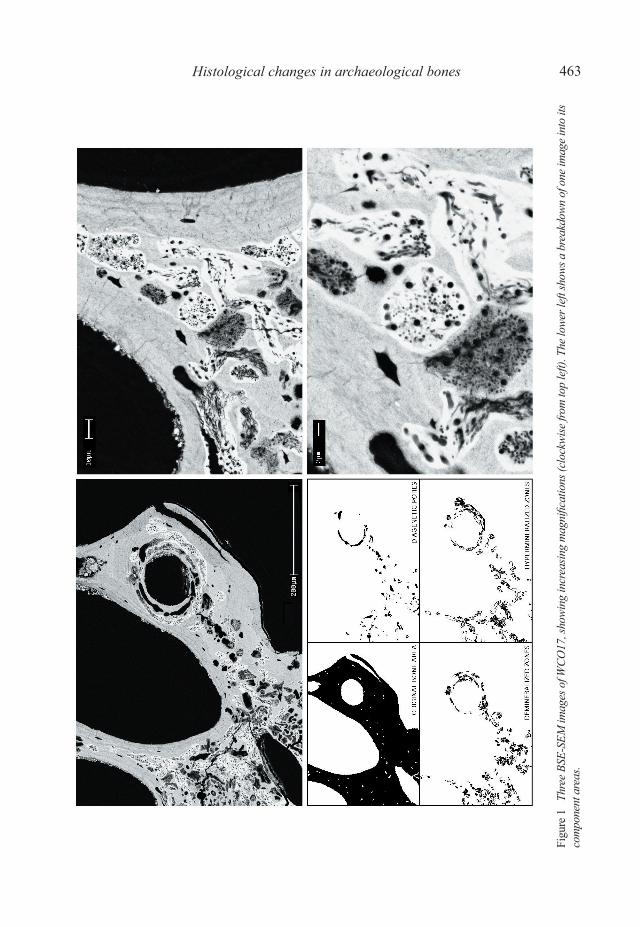
Backscattered electron microscopy (BSE-SEM) has been employed in the past to examine diagenetic alterations to bone and teeth (Bell 1990; Bell et al. 1996, 1991). The most commonly observed types of archaeological bone deterioration are regions of altered bone tissue which in BSE-SEM) are revealed as a network of small pores 0.1 – 1.0 µm in diameter. This increase in porosity, attributed to bacterial action, has also been identified using mercury intrusion porosimetry (Nielsen-Marsh and Hedges 1999) and appears to be the dominant diagenetic alteration to bone tissues in aerated soils (Kars and Kars 2001; Jans et al. 2002). The timescale over which this deterioration takes palce is as yet unclear, but the evidence from electronmicroscopy of tem individuals from Wharram Percy suggests that it is progressive, with older specimens exhibiting more extensive alteration. The distribution and degree of alteration also appears to be independent of approximate age at death and sex. In BSE-SEM images, these are pores seen to be confined to discrete zones, each 10-40 µm across, imparting a spongiform appearance to the affected bone. The zones are often surrounded by an electron dense region, which either delineates the extent of the destruction or completely fills the intervening area. Alternatively, the pores may lie within a zone exhibiting lower electron density than the surrounding bone. At lower magnifications these structures impart a ”patchwork” appearance to histological sections viewed in BSE-SEM, made up of discrete areas of higher mineral content - hypermineralized zones and lower mineral content – demineralized zones (Fig. 1). Development of sub-micron pore networks is also responsible for changes in the optical properties of bone when viewed in thin section. The fine, threadlike voids created by bacteria disrupt the optical properties of bone tissue, reducing its transparency in affected regions and causing them to appear opaque when viewed in polarized light. Staining from the soil solution frequently leaves these areas black in thin section. The present study examines a small number of typical specimens of compact bone from medieval cemeteries. It addresses the question of whether image analysis of BSE-SEM images can be used accurately to quantify histological changes in archaeological bones, and whether this in turn can be used as a supplemental measure of bone preservation. The new term ‘bioerosion index’ is suggested as a measure of the areal percentage of bone tissue destroyed by diagenetic processes.
MATERIALS AND METHODS
The study employed a LEO Stereoscan 440i utilizing a four quadrant backscattered electron (BSE) detector and fitted with an energy dispersive X-ray (EDX) spectrometer for elemental analysis. The principal specimen examined was taken from the femoral mid-shaft of skeleton WCO17 which was excavated from the cemetery of the deserted medieval village of Wharram Percy, England (Beresford and Hurst 1990). This cemetery lies on chalk geology and despite low collagen yields, macroscopic preservation of all the skeletons was good. The skeleton has been radiocarbon dated to 1225 ± 350 AD. The half section was cut from the diaphysis at a point two-thirds from the proximal joint, then vacuum-dried and embedded in low-viscosity epoxy resin under vacuum. The section was hand-ground and polished to an optically flat surface, and carbon coated for SEM examination. The entire area of the half-section from WCO17 was mapped at low magnification (X72). Further images of typical areas were collected at increasing magnifications; of 534X, 2,220X and 5,000X. Two additional samples of femoral mid-shaft were examined – one from Wharram Percy and another from the medieval cemetery at Ipswich. All images were stored as TIFF files for further processing and analysis. In addition to the collection of backscatter images, 127 EDX analyses for Ca, P, S and O were taken on areas of
462
G. Turner-Walker and U. Syversen Histological changes in archaeological bones
Figu
re 1
Th
ree B
SE-S
EM im
ages
of W
CO17
, sho
wing
incr
easin
g m
agni
ficat
ions
(clo
ckwi
se fr
om to
p le
ft). T
he lo
wer l
eft s
hows
a b
reak
down
of o
ne im
age i
nto
its
com
pone
nt a
reas
.
463

G. Turner-Walker and U. Syversen Histological changes in archaeological bones
the bone section that exhibited different tonal values. In BSE-SEM images, different tonal values represent different backscatter intensities, which in turn reflect various atomic weight densities within the specimen. For simplicity, in the following analyses only the Ca and P values were used in calculations. To quantify the degree of histological destruction in each image, the ‘magic wand’ tool provided in Paint Shop Pro 5.01 (JASC Software) was used to select areas corresponding to demineralized zones and these were copied and transferred, together with the appropriate scale bar, into an individual TIFF file. This procedure was then repeated for hypermineralized zones and diagenetic pores at the three selected magnifications. Each of these images was then loaded into the image-processing package Scion Image (Beta 3b; Scion Corporation, Frederick, MD). After calibration using the scale bars, the total areas (in square microns) of demineralized zones, hypermineralized zones and diagenetic pores for each of the images could then be measured using the ‘analyse particles’ function. A bioerosion index (BI) for each image could then be calculated according to the following formula:
where d is the total area of demineralized zones, h the total area of hypermineralized zones, p is the total area of diagenetic porosity and a is the area of the original bone visible in the image. The bioerosion index therefore gives a measure of the percentage of original bone tissue destroyed by bacterial attack. This procedure was repeated at the three different magnifications. To explore the influence of microbial destruction on the total calcium and phosphorus contents of altered bone the quantitative analyses of the histological destruction was combined with the EDX results. By inserting the mean calcium concentrations for the demineralized and hypermineralized zones, and unaltered bone into the areal measurements, the total calcium concentration in each image was calculated and compared to what would be expected had the bone not undergone any bacterial degradation.
RESULTS
Figure 1 shows three images of WCO17 at increasing magnifications together with a composite view showing the breakdown of one image into its component areas. Table 1 shows the total areas of the diagenetically altered bone and corresponding bioerosion index at each of the three magnifications. Figure 1 also gives the equivalent total calcium contents attributed to the demineralized, hypermineralized and unaltered bone at each magnification. The units in the final column (Total Ca) are arbitrary and derive from a simple multiplication of the area in square microns by the average calcium content in percent. The discrepancy between expected and calculated calcium content decreases with increasing magnification, reflecting the improvement in accuracy in selecting the different phases. The measured bioerosion index increases with increasing magnification – a reflection that as one zooms in upon detail, the images become less representative of the sample.The average calcium and phosphorus contents for demineralized and hypermineralized zones and unaltered bone from the EDX analyses are shown in Table 2. There is considerably more variation in the compositions of the demineralized zones than other features, and this is reflected in the wider tonal range seen in SEM-BSE images. The analyses for the unaltered bone and the hypermineralized ─ that is, re-precipitated bone ─ are in close agreement to the theoretical composition of bone apatite; in other words a hydroxyapatite containing
BI = x 100d + h + p
a
464

G. Turner-Walker and U. Syversen Histological changes in archaeological bones
Magnification Features selected Total area (μm2) Mean Ca (%) Total Ca
534X Original bone 164604.59 23.17 3813888Diagenetic pores 7904.08 0.00 ZeroDemineralized 18498.47 17.69 327238Hypermineralized 17986.74 31.40 564783Unaltered bone 120215.31 23.17 2785389
Net Ca loss 3.58%Bioerosion index 27%
2,220X Original bone 14890.35 23.17 345009Diagenetic pores 444.93 0.00 ZeroDemineralized 1631.00 17.69 28869Hypermineralized 3107.96 31.40 97590Unaltered bone 9705.54 23.17 224877
Net Ca loss -1,83Bioerosion index 35%
5,000X Original bone 4018.89 23.17 93118Diagenetic pores 227.58 Zero ZeroDemineralized 620.59 17.69 10978Hypermineralized 1050.10 31.40 32973Unaltered bone 2120.62 23.17 49135
Net Ca loss 0.03%Bioerosion index 47%
Feature analysed N Mean Ca % (SD) Mean P % (SD) Ca:P molar ratio (SD)
Unaltered bone 21 23.17 (0.68) 10.39 (0.34) 1.72 (0.03)Demineralized 50 17.69 (3.34) 7.18 (1.40) 1.91 (0.08)Hypermineralized 56 31.40 (1.10) 13.59 (0.52) 1.79 (0.04)
Table 1 Bioerosion indices and total calcium loss/gain calculated from BSE-SEM images
2-3 wt% carbonate (Nielsen-Marsh et al. 2000). However, the demineralized areas are relatively depleted in phosphorus. This has implications for the bulk chemical analysis of ancient bones, where both calcium phosphate ratios and carbonate content have been used as indicators of diagenetic alteration of bone apatite.
DISCUSSION
Currently, histological changes to ancient bones are assessed using the method described by Hedges et al. (1995) for the calculation of the histological index, using reflection optical microscopy of embedded thick sections. Although the method is simple and allows for the rapid evaluation of many samples, it is nevertheless subjective and prone to inter-observer error in the middle ranges of the scale. The method described above using BSE-SEM, although considerably more complex and time consuming, provides a fully quantitative
Table 2 The mean Ca and P contents of the unaltered and diagenetically altered bone
465

G. Turner-Walker and U. Syversen Histological changes in archaeological bones
measure of histological destruction of archaeological bones. The additional time and expense is rewarded with increased reproducibility and accuracy, although this is effectively traded for a reduction in the area of the section studied and consequently a reduction of the representativeness of the measured index. Examination of the total calcium contents in Table 1 indicates that even in bones where there has been considerable destruction of histology, the net calcium content remains largely unaffected. Despite obvious dissolution and re-precipitation of bone mineral, the integrity of the bone mineral content appears to be preserved. Furthermore, movement of mineral must be a very local phenomenon. If there was appreciable transport of dissolved calcium and phosphate ions before re-precipitation then the discrepancy between the expected and calculated calcium contents might be expected to increase with increasing magnification, as some mineral may have been carried away and re-deposited elsewhere. In fact, the opposite is seen to be the case, and in the images examined, resolution proved to be the limiting factor in the calculation of calcium contents. If this is true the difference between measured and anticipated total calcium content for any image may be used to check the accuracy of the areal measurements used to calculate the bioerosion index. To explore any possible relationships between magnification, bioerosion index and accuracy of areal measurements, images from two further bone specimens were analysed in the same way. The results of all analyses are shown in Table 3 and Figure 2. Measurement error, taken as the discrepancy between expected and calculated calcium contents in each image, is dependent upon image magnification rather than degree of histological destruction. This provides strong evidence that the discrepancy between expected and calculated calcium content does arise from measurement error rather than movement of calcium within the bone. The R2 value for the fitted polynomial in Figure 2 is 0.9975 and the curve predicts that the measurement error will not exceed 4% even at magnifications below 500X. The ‘error’ column in Table 3 would also suggest that this is an absolute error and is not linked to the degree of histological destruction.
CONCLUSIONS
This work demonstrates a novel tool for the quantification of diagenetic changes to archaeo-logical bone, the bioerosion index, to add to the growing arsenal of analytical techniques brought to bear on diagenesis studies. Although only a small number of bones were examined in this way, the diagenetic features measured are common to many archaeological bones and the suggestion that the method proposed be adopted as an indicator of bone preservation/destruction is valid. Subsequent work on specimens of extremely degraded bone has demonstrated that in
Site Specimen Magnification BI (%) ‘Error’ (%)
Wharram Percy WCO17 534x 27 3.58Wharram Percy WCO17 2,220x 35 1.83Wharram Percy WCO17 5,000x 47 0.03Wharram Percy SA34 500x 60 3.50Ipswich IP0950 2,340x 59 1.90
Table 3 Magnification, bioerosion index and error for the three bone samples examined
466

G. Turner-Walker and U. Syversen Histological changes in archaeological bones
these circumstances it is easier to measure the total area of unaltered bone in the image than to highlight zones of diagenetic destruction. One key advantage of the methodology described is that bioerosion index is directly related to a visual image of the specimen analysed, and therefore provides information about how physical changes to bone tissues influence chemical changes or biochemical survival. When combined with elemental microanalysis (EDX) the BSE-SEM images used can also afford insights into the distribution of and gross chemical changes to bone mineral during diagenesis. A similar method of highlighting and quantifying areas of interest in BSE-SEM images also has applications in the measurement of physiological porosity in modern and ancient bone, and thus may afford insights into metabolic diseases and osteoporosis in past populations.
ACKNOWLEDGEMENTS
This work would not have been possible without the co-operation of Drs Simon Mays and David Dungworth (both with English Heritage) who kindly provided specimens from Wharram Percy and access to the Ancient Monuments Laboratory’s SEM respectively. Thanks are also expressed to Dr Elizabeth Peacock of the Institute of Archaeology and Cultural History, NTNU.
REFERENCES
Antoine, S. E., Child, A. M., Nicholson, R. A. and Pollard, A. M., 1992, The biochemistry and microbiology of buried human bone in relation to dietary reconstruction, Circaea, 9, 65-79.
Bell, L. S., 1990, Palaeopathology and diagenesis: an SEM evaluation of structural changes using backscattered electron imaging. Journal of Archaeological Science, 17, 85-102.
Bell, L. S. Boyde, A., and Jones, S. J., 1991 Diagenetic alteration to teeth in situ illustrated by backscattered electron imaging, Scanning, 13, 173-183.
Figure 2 A plot of magnification versus measurement error (expressed as the discrepancy between measured and anticipated total calcium content for each image).
467

G. Turner-Walker and U. Syversen
Bell, L. S., Skinner, M. F. and Jones, S. J. 1996 The speed of post mortem change to the human skeleton and its taphonomic significance, Forensic Science International, 82, 129-140.
Beresford, M. W., and Hurst, J. G., 1990, Wharram percy: deserted medieval village, English Heritage, London.Child, A. M., 1995a Towards an understanding of the decomposition of bone in the archaeological
environment, Journal of Archaeological Science, 22, 165-174.Child, A. M., 1995b Microbial taphonomy of archaeological bone, Studies in Conservation, 40, 19-30.Collins, M. J., Child, A. M., van Duin, A. T. C., and Vermeer, C., 1998, Ancient osteocalcin: the most stable
bone protein? Ancient Biomolecules, 2, 223-33.Collins, M. J. Riley, M. Child, A. M. and Turner-Walker. G. (1995) A basic mathematical simulation of the chemical
degradation of ancient collagen, Journal of Archaeological Science, 22, 175-183.Collins, M. J., Gernaey, A. M., Nielsen-Marsh, C. M., Vermeer, C., and Westbroek, P., 2000 Osteocalcin in fossil
bones: evidence for very slow rates of decomposition from laboratory studies, Geology, 28, 1139-42.Hedges, R. E. M., Millard, A. R., and Pike, A. W. G., 1995 Measurements and relationships of diagenetic alteration
of bone from three archaeological sites, Journal of Archaeological Science, 22, 201-9.Jans, M. M. E., Kars, H., Nielsen-Marsh, C. M., Smith, C.I., Nord, A. G., Arthur, P., and Earl, N., 2002, In situ
preservation of archaeological bone. A histological study within a multidisciplinary approach, Asrchaeometry, 44, 343-52.
Kars, H., and Kars, E. A. K., (eds), 2001, The degradation of bone as an indicator in the deterioration of the European archaeological property, Final report, Project ENV4-CT98-0712 (DG Research and Development), European Commission, Brussels.
Nielsen-Marsh, C. M. and Hedges, R. E. M. 1997 Dissolution experiments on modern and diagenetically altered bone and the effect on the infra-red splitting factor, Bulletin de la Société Géologique de France, 168, 485-90.
Nielsen-Marsh, C. M. and Hedges, R. E. M. 1999 Bone porosity and the use of mercury intrusion porosimetry in bone diagenesis studies, Archaeometry, 41, 165-74.
Nielsen-Marsh, C. M., Gernaey, A. M., Turner-Walker. G., Hedges, R. E. M., Pike, A. W. G., and Collins, M. J., 2000, The chemical degradation of bone, in Human osteology in archaeology and forensic science (eds M. Cox and S. Mays), 439-54, Greenwich Medical Media, London
468
Related Documents